Attached files
Table of Contents
UNITED STATES
SECURITIES AND EXCHANGE COMMISSION
Washington, D.C. 20549
FORM 10-K
ANNUAL REPORT PURSUANT TO SECTION 13 OR 15(d) OF
THE SECURITIES EXCHANGE ACT OF 1934
For the fiscal year ended December 31, 2010
Commission file number: 001-33610
REX ENERGY CORPORATION
(Exact name of registrant as specified in its charter)
| Delaware | 20-8814402 | |
| (State or other Jurisdiction of Incorporation or Organization) |
(I.R.S. employer identification number) |
476 Rolling Ridge Drive, Suite 300
State College, Pennsylvania 16801
(Address of Principal Executive Offices)
(Zip Code)
(814) 278-7267
(Registrant’s telephone number, including area code)
Securities registered pursuant to Section 12(b) of the Act:
| Title of each class |
Name of each exchange on which registered | |
| Common Stock, $.001 par value per share | The NASDAQ Global Market |
Securities registered pursuant to Section 12(g) of the Act:
None
Indicate by check mark if the registrant is a well-known seasoned issuer, as defined in Rule 405 of the Securities Act. Yes ¨ No x
Indicate by check mark if the registrant is not required to file reports pursuant to Section 13 or Section 15(d) of the Act. Yes ¨ No x
Indicate by check mark whether the registrant (1) has filed all reports required to be filed by Section 13 or 15(d) of the Securities Exchange Act of 1934 during the preceding 12 months (or for such shorter period that the registrant was required to file such reports), and (2) has been subject to such filing requirements for the past 90 days. Yes x No ¨
Indicate by check mark whether the registrant has submitted electronically and posted on its corporate Web site, if any, every Interactive Data File required to be submitted and posted pursuant to Rule 405 of Regulation S-T (§232.405 of this chapter) during the preceding 12 months (or for such shorter period that the registrant was required to submit and post such files. Yes ¨ No ¨
Indicate by check mark if disclosure of delinquent filers pursuant to Item 405 of Regulation S-K (§229.405) is not contained herein, and will not be contained, to the best of registrant’s knowledge, in definitive proxy or information statements incorporated by reference in Part III of this Form 10-K or any amendment to this Form 10-K. x
Indicate by check mark whether the registrant is a large accelerated filer, an accelerated filer, a non-accelerated filer, or a smaller reporting company. See definitions of “large accelerated filer,” “accelerated filer” and “smaller reporting company” in Rule 12b-2 of the Exchange Act. (check one):
Large Accelerated filer ¨ Accelerated filer x Non-accelerated filer ¨ Smaller reporting company ¨
Indicate by check mark whether the registrant is a shell company (as defined in Rule 12b-2 of the Exchange Act). Yes ¨ No x
The aggregate market value of the voting and non-voting common equity held by non-affiliates as of June 30, 2010 was $326,636,815. This amount is based on the closing price of the registrant’s common stock on the NASDAQ Global Market on that date. Shares of common stock beneficially held by executive officers and directors of the registrant are not included in the computation. This determination of affiliate status is not necessarily a conclusive determination for other purposes.
44,312,714 common shares, $.001 par value, were outstanding on March 2, 2011.
DOCUMENTS INCORPORATED BY REFERENCE
Portions of the registrant’s definitive proxy statement for its 2011 Annual Meeting of Stockholders to be held on May 12, 2011, are incorporated by reference herein in Items 10, 11, 12, 13 and 14 of Part III of this report.
Table of Contents
FORM 10-K
FOR THE YEAR ENDED DECEMBER 31, 2010
TABLE OF CONTENTS
| 5 | ||||||
| Item 1. |
Business | 5 | ||||
| Item 1A. |
Risk Factors | 17 | ||||
| Item 1B. |
Unresolved Staff Comments | 30 | ||||
| Item 2. |
Properties | 30 | ||||
| Item 3. |
Legal Proceedings | 39 | ||||
| Item 4. |
Reserved | 39 | ||||
| 40 | ||||||
| Item 5. |
40 | |||||
| Item 6. |
42 | |||||
| Item 7. |
Management’s Discussion and Analysis of Financial Condition and Results of Operations |
48 | ||||
| Item 7A. |
64 | |||||
| Item 8. |
66 | |||||
| Item 9. |
Changes in and Disagreements with Accountants on Accounting and Financial Disclosure |
117 | ||||
| Item 9A. |
117 | |||||
| Item 9B. |
118 | |||||
| 119 | ||||||
| Item 10. |
119 | |||||
| Item 11. |
119 | |||||
| Item 12. |
Security Ownership of Certain Beneficial Owners and Management and Related Stockholder Matters |
119 | ||||
| Item 13. |
Certain Relationships and Related Transactions and Director Independence |
119 | ||||
| Item 14. |
119 | |||||
| 120 | ||||||
| Item 15. |
Exhibits and Financial Statement Schedules | 120 | ||||
| 126 | ||||||
| 130 | ||||||
2
Table of Contents
CAUTIONARY STATEMENTS REGARDING FORWARD-LOOKING STATEMENTS
Some of the information, including all of the estimates and assumptions, in this report contain forward-looking statements within the meaning of Sections 27A of the Securities Act of 1933, as amended, and 21E of the Securities Exchange Act of 1934, as amended. All statements other than statements of historical fact included in this report, including, but not limited to, statements regarding our future financial position, business strategy, budgets, projected costs, savings and plans, objectives of management for future operations, legal strategies, and legal proceedings, are forward-looking statements. Forward-looking statements generally can be identified by the use of forward-looking terminology such as “may”, “will”, “expect”, “intend”, “estimate”, “anticipate”, “believe”, or “continue” or the negative thereof or variations thereon or similar terminology.
These forward-looking statements are subject to numerous assumptions, risks, and uncertainties. Factors that may cause our actual results, performance, or achievements to be materially different from those anticipated in forward-looking statements include, among others, the following:
| • | adverse economic conditions in the United States and globally; |
| • | difficult and adverse conditions in the domestic and global capital and credit markets; |
| • | domestic and global demand for oil and natural gas; |
| • | sustained declines in the prices we receive for oil and natural gas; |
| • | the effects of government regulation, permitting, and other legal requirements; |
| • | the geologic quality of our properties with regard to, among other things, the existence of hydrocarbons in economic quantities; |
| • | uncertainties about the estimates of our oil and natural gas reserves; |
| • | our ability to increase our production and oil and natural gas income through exploration and development; |
| • | our ability to successfully apply horizontal drilling techniques and tertiary recovery methods; |
| • | the number of well locations to be drilled, the cost to drill, and the time frame within which they will be drilled; |
| • | the effects of adverse weather on operations; |
| • | drilling and operating risks; |
| • | the availability of equipment, such as drilling rigs and transportation pipelines; |
| • | changes in our drilling plans and related budgets; |
| • | the adequacy of our capital resources and liquidity including, but not limited to, access to additional borrowing capacity; |
| • | uncertainties associated with our legal proceedings and their outcome; and |
| • | other factors discussed under “Risk Factors” in Item 1A of this report. |
Because forward-looking statements are subject to risks and uncertainties, actual results may differ materially from those expressed or implied by such statements. You are cautioned not to place undue reliance on forward-looking statements, which speak only as of the date of the respective document. Other unknown or unpredictable factors may cause actual results to differ materially from those projected by the forward-looking statements. Most of these factors are difficult to anticipate and may be beyond our control. Unless otherwise required by law, we undertake no obligation to publicly update or revise any forward-looking statements, whether as a result of new information, future events, or otherwise.
All forward-looking statements attributable to us are expressly qualified in their entirety by these cautionary statements.
3
Table of Contents
SPECIAL NOTE REGARDING THE REGISTRANT
In this report, we refer to certain companies—Douglas Oil & Gas Limited Partnership, Douglas Westmoreland Limited Partnership, Midland Exploration Limited Partnership, New Albany—Indiana, LLC, PennTex Resources, L.P., PennTex Resources Illinois, Inc., Rex Energy Limited Partnership, Rex Energy II Limited Partnership, Rex Energy III LLC, Rex Energy IV, LLC, Rex Energy II Alpha Limited Partnership, Rex Energy Operating Corp. and Rex Energy Royalties Limited Partnership—collectively as the “Predecessor Companies.” Simultaneously with the consummation of our initial public offering of common stock, through a series of mergers and reorganization transactions, which we refer to as the “Reorganization Transactions,” Rex Energy Corporation acquired all of the outstanding equity interests of the Predecessor Companies. Unless otherwise indicated, all references to “Rex Energy Corporation,” “the Company”, “our,” “we,” “us” and similar terms refer to Rex Energy Corporation and its subsidiaries together with the Predecessor Companies, after giving effect to the Reorganization Transactions.
Beginning on page 126 of this report, we have included a glossary of oil and natural gas terms used throughout this report.
4
Table of Contents
| ITEM 1. | BUSINESS |
General
We are an independent oil and gas company operating in the Appalachian Basin, Illinois Basin and Denver-Julesburg (“DJ”) Basin. In the Appalachian Basin, we are focused on our Marcellus Shale drilling projects. In the Illinois Basin, we are focused on the implementation of enhanced oil recovery on our properties as well as conventional oil production. Our focus in the DJ Basin has been on acquiring and developing acreage that we believe to be prospective for horizontal oil well drilling in the Niobrara formation. We pursue a balanced growth strategy of exploiting our sizable inventory of high potential exploration drilling prospects and actively seek to acquire complementary oil and natural gas properties.
We were incorporated in the state of Delaware on March 8, 2007. Our common stock currently trades on the NASDAQ Global Market under the symbol “REXX”. The information set forth in this report is exclusive of our discontinued operations related to the Southwest Region properties, unless otherwise noted, which are classified as Discontinued Operations on our Consolidated Statements of Operations and Assets Held for Sale on our Consolidated Balance Sheets.
At December 31, 2010, our proved reserves had the following characteristics:
| • | 201.7 Bcfe; |
| • | 63.3% natural gas and 36.7% crude oil and natural gas liquids (“NGLs”); |
| • | 42.3% proved developed; and |
| • | a reserve life index of approximately 28 years (based upon 2010 production). |
At December 31, 2010, we operated approximately 2,110 wells, which include approximately 491 disposal and injection wells. For the quarter ended December 31, 2010, we produced an average of 22.8 net MMcfe per day, composed of approximately 53.2% oil and NGLs and approximately 46.8% natural gas.
We are one of the largest oil producers in the Illinois Basin, with an average net daily production of 1,895 barrels of oil per day in 2010. In addition to our developmental shallow oil drilling in the Illinois Basin, we are in the process of implementing an enhanced oil recovery project, or EOR project, in the Lawrence Field in Lawrence County, Illinois, which we refer to as our Lawrence Field ASP Flood Project.
In the Appalachian Basin during 2010, we averaged net production of approximately 8.9 MMcfe per day of natural gas and NGLs. In 2010, we grew our reserves and production in the region through Marcellus Shale drilling projects. As of December 31, 2010, we controlled approximately 112,000 gross (56,000 net) acres in areas of Pennsylvania that we believe are prospective for Marcellus Shale exploration.
As of December 31, 2010, we controlled approximately 65,000 gross (45,000 net) acres in areas of Wyoming and Colorado in the DJ Basin that we believe are prospective for Niobrara exploration. In late 2010, we were in various stages of drilling and completion on four (three of which are horizontal) test wells in the DJ Basin, for which final results are expected to be evaluated during the first quarter of 2011.
Our total operating revenue for the year ended December 31, 2010 was $68.8 million. Revenue was derived from $67.2 million in oil, natural gas and NGL sales and $1.5 million in other revenue.
For the year ended December 31, 2010, we drilled 70.0 gross (54.4 net) wells, which includes 24.0 gross (24.0 net) wells drilled in connection with our Lawrence Field ASP Flood Project. Excluding those wells drilled in connection with our ASP project, the wells drilled in 2010 include 23.0 gross (15.6 net) wells that were
5
Table of Contents
productive, one gross (one net) dry hole and 22.0 gross (13.8 net) wells that are awaiting completion and are expected to be productive during the first quarter of 2011. The larger inventory of wells awaiting completion is attributable to a shift in focus to pad drilling in our Marcellus Shale operations where multiple wells are completed simultaneously.
The following table sets forth selected data concerning our continuing operations, and our production, proved reserves and undeveloped acreage in our three operating regions for the periods indicated:
| Basin/Region |
Annual 2010 Average Daily Mcfe1 |
Total Proved Bcfe (as of December 31, 2010) |
Percent of Total Proved Bcfe |
PV-10 (as
of December 31, 2010) (in millions)2 |
Total Net Undeveloped Acres (as of December 31, 2010)3 |
|||||||||||||||
| Illinois Basin |
11,367 | 48.9 | 24.2 | % | $ | 161.9 | 1,001 | |||||||||||||
| Appalachian Basin |
8,883 | 152.8 | 75.8 | % | 107.5 | 47,929 | ||||||||||||||
| DJ Basin |
— | — | — | — | 44,998 | |||||||||||||||
| Total |
20,250 | 201.7 | 100.0 | % | $ | 269.4 | 93,928 | |||||||||||||
| 1 | Oil and natural gas liquids are converted at the rate of one BOE to six Mcfe. |
| 2 | Represents the present value, discounted at 10% per annum (PV-10), of estimated future net cash flows before income tax of our estimated proved reserves. PV-10 is a non-GAAP financial measure because it excludes the effects of income taxes and asset retirement obligations. PV-10 should not be considered as an alternative to the standardized measure of discounted future net cash flows as defined under GAAP. At December 31, 2010, our standardized measure was $188.1 million. For an explanation of why we show PV-10 and a reconciliation of PV-10 to the standardized measure of discounted future net cash flows, please read “Selected Financial and Operating Data—Non-GAAP Financial Measures.” Please also read “Risk Factors—Our estimated reserves are based on many assumptions that may turn out to be inaccurate. Any significant inaccuracies in these reserve estimates or underlying assumptions may materially affect the quantities and present value of our reserves.” |
| 3 | Undeveloped acreage is lease acreage on which wells have not been drilled or completed to a point that would permit the production of commercial quantities of oil and natural gas regardless of whether such acreage includes proved reserves. |
Our Competitive Strengths
We believe the combination of the following strengths will help us successfully execute our strategy:
Significant Production Growth Opportunities: We have several projects and properties that we believe are capable of significant proved reserves and production growth. These include:
| • | our Lawrence Field ASP Flood Project in Illinois (please see “Item 2. Properties—Illinois Basin—Lawrence Field ASP Flood Project”); |
| • | our large acreage position in Pennsylvania prospective for Marcellus unconventional shale exploration (please see “Item 2. Properties—Appalachian Basin—Marcellus Shale”). |
| • | our large acreage position in the DJ Basin prospective for Niobrara unconventional exploration (please see “Item 2. Properties—DJ Basin—Niobrara”). |
Market Leader in the Illinois Basin: We are one of the largest oil producers and a market leader in the Illinois Basin. This enables us to realize a current premium over the basin-posted prices on our oil production with a competitive cost structure due to economies of scale. This scale also provides us with a unique local knowledge of the basin. We believe these advantages may enhance our ability to continue making strategic acquisitions in the basin.
Experienced Management Team with a Proven Track Record: We believe we have significant technical and managerial experience in our core operating areas. Our senior technical team of geologists and
6
Table of Contents
engineers has an average of over 20 years of experience, primarily in the Illinois, Appalachian and DJ Basins. This experience and the capabilities of our management team have enabled us to build a high quality asset base of proved reserves and growth projects, both organically and through selective acquisitions.
Financial Flexibility: As of December 31, 2010, we had approximately $11.0 million of cash on hand. Our senior credit facility had a borrowing capacity of $125.0 million as of December 31, 2010, of which $115.0 million was available for working capital purposes or to fund new acquisitions. In addition, we believe our oil and gas financial derivative activities enable us to achieve more predictable cash flows and reduce our exposure to short-term fluctuations in oil and natural gas prices while we continue to develop our properties. For a more detailed discussion of our derivative activities, see the information set forth in “Item 7. Management’s Discussion and Analysis of Financial Condition and Results of Operations” and “Item 7A. Quantitative and Qualitative Disclosures About Market Risk.”
On September 30, 2010, we entered into a joint venture agreement with Summit Discovery Resources II, LLC and Sumitomo Corporation, which we collectively refer to herein as Sumitomo. Pursuant to the agreement, Sumitomo agreed to fund 80% of our net drilling and completion expenses up to approximately $58.8 million. As of December 31, 2010, we had approximately $28.8 million remaining of available expenditures under this drilling carry arrangement. For a more detailed discussion of our transaction with Sumitomo, see the information set forth in “Item 2. Properties—Appalachian Basin—Marcellus Shale.”
Incentivized Management Ownership: We believe our performance is enhanced when our employees and directors think and act like owners. To achieve this, we believe in rewarding and encouraging our employees and directors through equity ownership in our company. As of March 2, 2011, our directors and officers beneficially owned approximately 22% of our outstanding common stock. We grant long-term incentives to our executives in the form of restricted stock, the vesting of which is based half on meeting three-year production targets and half on meeting discretionary cash flow per share targets. In addition, our Compensation Committee of our Board of Directors recently adopted equity ownership guidelines for our directors and officers. We believe that the interests of our directors and executive officers are closely aligned with those of our stockholders.
Business Strategy
Our strategy is to increase stockholder value by profitably increasing our reserves, production, cash flow and earnings. The following are key elements of our strategy:
Employ Technological Expertise: Our strategy is to utilize and expand the technological expertise that has enabled us to achieve a drilling success rate of approximately 98% over the last three years and has helped us improve operations and enhance field recoveries. We intend to continue to apply this expertise to our proved reserve base and our development projects.
Develop Our Existing Properties: Our focus is to develop our asset base in all of our operating basins, including:
| • | our Lawrence Field ASP Flood Project in Illinois; |
| • | our Marcellus Shale natural gas play with approximately 112,000 gross (56,000 net) acres; and |
| • | our Niobrara oil and natural gas play with approximately 65,000 gross (45,000 net) acres. |
Pursue Strategic Acquisitions and Joint Ventures: We plan to continue to acquire and lease additional oil and natural gas properties in our core areas of operation. We believe that our strong history of acquisitions, leading position in the Illinois Basin, success in the Marcellus Shale and technical expertise situate us well to attract joint venture partners and pursue strategic acquisitions.
Focus on Operations: We intend to focus our future acquisition and leasing activities on properties where we have a significant working interest and can operate the property to control and implement the planned exploration and development activity.
7
Table of Contents
Reduce Per Unit Operating Costs Through Economies of Scale and Efficient Operations: As we continue to increase our oil and natural gas production and develop our existing properties, we believe that our per unit production costs can benefit from increased production in lower cost operations and through better use of our existing infrastructure over a larger number of wells.
Maintain Flexibility: Because of the volatility of commodity prices and the risks involved in our industry, we believe in remaining flexible in our capital budgeting process. When appropriate, we may defer capital projects to seize an attractive acquisition opportunity or reallocate capital towards projects where we believe we can generate higher than anticipated returns. We also believe in maintaining a strong balance sheet and using commodity hedging. This allows us to be more opportunistic in lower price environments as well as providing more consistent financial results.
Significant Accomplishments in 2010
During 2010, our significant accomplishments included:
| • | Exploration agreement with Sumitomo in the Marcellus Shale: We entered into an exploration agreement with Sumitomo to pursue the development of the Marcellus Shale. Under the terms of the agreement, Sumitomo can acquire a 20% interest in our Marcellus Shale assets in Westmoreland, Clearfield and Centre Counties in Pennsylvania, a 30% interest in our Marcellus Shale assets in Butler and Beaver Counties, Pennsylvania and a 50% interest in our assets in Fayette County, Pennsylvania. At closing, we received approximately $99.5 million in cash from Sumitomo in addition to a drilling carry obligation of approximately $58.8 million. As of December 31, 2010, there was approximately $28.8 million remaining on the drilling carry obligation. |
| • | Horizontal drilling success: We successfully drilled, completed and placed into service 10.0 gross (5.2 net) Marcellus Shale wells during 2010. As of December 31, 2010, we had 17.0 gross (9.8 net) Marcellus Shale wells awaiting completion. |
| • | Decrease in lease operating expenses: We have decreased our lease operating expenses, on a per unit of production basis, for two consecutive years, from $4.66 per Mcfe in 2008 to $3.77 per Mcfe in 2009 to $3.34 per Mcfe in 2010. |
| • | Drilled four test wells in the DJ Basin: As of December 31, 2010, we were in various stages of drilling and completion on four (three of which are horizontal) test oil wells in the DJ Basin to the Niobrara formation. |
| • | Production growth: Due to our Marcellus Shale drilling program, we increased our natural gas production by 104% over 2009. |
| • | Reserves growth: Our proved reserves in the Appalachian Basin, which consist of 100% natural gas and NGLs, increased approximately 140% from 2009 year-end estimates. |
| • | Commissioning of the Sarsen cryogenic gas processing plant: During the fourth quarter of 2010, our midstream joint venture, Keystone Midstream Services, LLC (“Keystone Midstream”), commissioned a cryogenic gas processing plant, which we believe will ultimately be capable of processing up to 40 Mmcfe per day of natural gas, in our Butler County, Pennsylvania project area. We own a 28% interest in Keystone Midstream. |
| • | Balance Sheet strength: As of December 31, 2010, we had $11.0 million in cash, $115.0 million of availability under our senior credit facility and approximately $28.8 million remaining on the drilling carry obligation with Sumitomo. |
| • | Continued Expansion of Drilling Inventory: To continue to grow, the size of our prospect inventory must remain large. As of December 31, 2010, we controlled approximately 112,000 gross (56,000 net) acres in the Marcellus Shale play in Pennsylvania. In addition, at December 31, 2010, we controlled approximately 65,000 gross (45,000 net) acres in the DJ Basin, which we believe to be prospective for Niobrara horizontal oil well drilling. |
8
Table of Contents
Plans for 2011
Our budgeted capital spending for 2011 is approximately $148.7 million. Our 2011 capital budget contemplates the drilling of approximately 25 gross (16 net) horizontal Marcellus Shale wells in Butler County, Pennsylvania and an additional 20 gross (eight net) horizontal wells in the joint venture project areas with Williams Production Company, LLC and Williams Production Appalachia, LLC, which we collectively refer to as “Williams”. In our DJ Basin, we anticipate drilling five gross (five net) horizontal oil wells.
Other operational plans for 2011 and beyond include midstream and gas processing services. Our gas processing services will be principally focused on building, operating and owning a second cryogenic gas processing plant in Butler County, Pennsylvania. Budgeted capital expenditures for gas processing services in 2011 total approximately $9.0 million.
The following table summarizes our actual 2010 and our budgeted 2011 capital expenditures. The estimated capital expenditures are dependent on a number of factors, including industry conditions and our drilling success, and are subject to change. We do not attempt to budget for future acquisitions of proved oil and gas properties.
| For the Years
Ended December 31, ($ in thousands) |
||||||||
| 2010 (Actual) |
2011 (Estimated) |
|||||||
| Capital Expenditures |
||||||||
| Illinois Basin Drilling & Facility |
$ | 20,835 | $ | 9,277 | ||||
| Illinois Basin Leasing |
160 | — | ||||||
| Illinois Basin Other |
51 | 1,900 | ||||||
| Appalachian Basin Drilling & Facility |
36,085 | 81,440 | ||||||
| Appalachian Basin Midstream1 |
16,331 | 18,000 | ||||||
| Appalachian Basin Leasing |
44,765 | 10,000 | ||||||
| Appalachian Basin Other |
775 | 830 | ||||||
| DJ Basin Drilling & Facility |
18,151 | 21,500 | ||||||
| DJ Basin Leasing |
27,460 | 5,000 | ||||||
| DJ Basin Other |
1,006 | 450 | ||||||
| Other Corporate Expenditures |
1,110 | 350 | ||||||
| Total Capital Expenditures2 |
$ | 166,729 | $ | 148,747 | ||||
| 1 | Includes contributions to equity method investments and consolidated variable interest entities. |
| 2 | For 2011 estimated, represents net spending after carry obligation from Sumitomo. |
9
Table of Contents
Production, Revenues and Price History
The following table sets forth information regarding oil and gas production and revenues for continuing operations for the last three years:
| Production and Revenue by Region For the Years Ended December 31, ($ in thousands) |
||||||||||||
| 2010 | 2009 | 2008 | ||||||||||
| Appalachian Region: |
||||||||||||
| Revenue |
$ | 14,652 | $ | 6,671 | $ | 9,783 | ||||||
| Oil Production (Bbls) |
108 | 358 | — | |||||||||
| Natural Gas Production (Mcf) |
3,088,598 | 1,510,500 | 1,036,891 | |||||||||
| NGL Production (Bbls) |
25,559 | 7,750 | — | |||||||||
| Total Production (Mcfe)1 |
3,242,600 | 1,559,148 | 1,036,891 | |||||||||
| Oil Average Sales Price |
$ | 41.63 | $ | 50.28 | $ | — | ||||||
| Natural Gas Average Sales Price |
$ | 4.46 | $ | 4.28 | $ | 9.43 | ||||||
| NGL Average Sales Price |
$ | 33.60 | $ | 24.90 | $ | — | ||||||
| Average Production Cost per Mcfe3 |
$ | 1.13 | $ | 1.33 | $ | 1.42 | ||||||
| Illinois Region: |
||||||||||||
| Revenue |
$ | 52,572 | $ | 41,863 | $ | 74,230 | ||||||
| Oil Production (Bbls) |
691,466 | 719,652 | 776,185 | |||||||||
| Natural Gas Production (Mcf) |
— | — | — | |||||||||
| NGL Production (Bbls) |
— | — | — | |||||||||
| Total Production (Bbls) |
691,466 | 719,652 | 776,185 | |||||||||
| Oil Average Sales Price |
$ | 76.03 | $ | 58.17 | $ | 95.63 | ||||||
| Natural Gas Average Sales Price |
$ | — | $ | — | $ | — | ||||||
| NGL Average Sales Price |
$ | — | $ | — | $ | — | ||||||
| Average Production Cost per Bbl3 |
$ | 29.68 | $ | 27.02 | $ | 31.52 | ||||||
| Total Company2 |
||||||||||||
| Revenue |
$ | 67,224 | $ | 48,534 | $ | 84,013 | ||||||
| Oil Production (Bbls) |
691,574 | 720,010 | 776,185 | |||||||||
| Natural Gas Production (Mcf) |
3,088,598 | 1,510,500 | 1,036,891 | |||||||||
| NGL Production (Bbls) |
25,559 | 7,750 | — | |||||||||
| Total Production (Mcfe)1 |
7,391,396 | 5,877,060 | 5,694,001 | |||||||||
| Oil Average Sales Price |
$ | 76.03 | $ | 58.17 | $ | 95.63 | ||||||
| Natural Gas Average Sales Price |
$ | 4.46 | $ | 4.28 | $ | 9.43 | ||||||
| NGL Average Sales Price |
$ | 33.60 | $ | 24.90 | $ | — | ||||||
| Average Production Cost per Mcfe3 |
$ | 3.25 | $ | 3.66 | $ | 4.56 | ||||||
| 1 | Oil and NGLs are converted at the rate of one BOE to six Mcfe. |
| 2 | There were no revenues or production from our DJ Basin operations during 2010. |
| 3 | Excludes ad valorem and severance taxes. |
Competition
The oil and gas industry is intensely competitive, particularly with respect to the acquisition of prospective oil and natural gas properties and reserves. Our ability to effectively compete is dependent on our geological, geophysical and engineering expertise and our financial resources. We must compete against a substantial number of major and independent oil and natural gas companies that have larger technical staffs and greater financial and operational resources than we do. Many of these companies not only engage in the acquisition,
10
Table of Contents
exploration, development and production of oil and natural gas reserves, but also have refining operations, market refined products and generate electricity. We also compete with other oil and natural gas companies to secure drilling rigs and other equipment and services necessary for drilling and completion of wells. Consequently, equipment and services may be in short supply from time to time. Additionally, it is difficult to attract and retain employees, particularly those with expertise in high demand areas.
Employees
As of December 31, 2010, we had 191 full-time employees, 107 of whom were field personnel. No employees are covered by a labor union or other collective bargaining arrangement. We believe that our relations with our employees are good. We regularly utilize independent consultants and contractors to perform various professional services, particularly in the areas of drilling, completion, field services, oil and gas leasing and on-site production operation services.
Marketing and Customers
We market nearly all of our oil production from the properties that we operate in the Illinois Basin for both our interest and that of the other working interest owners and royalty owners. For properties that we operate in the Appalachian Basin, our natural gas production is marketed by Williams Gas Marketing, Inc., for both our interest and that of the other working interest owners and royalty owners.
In the Illinois Basin, the majority of our oil is stored at well site tanks and sold to CountryMark Cooperative, LLP (“CountryMark”), a local refinery, currently at a premium to the basin-posted prices. We receive this premium due to our significant size in the basin relative to other local producers. Purchasers, including CountryMark, purchase our oil at our tank facilities and truck the oil to their refinery facilities. The revenue that we derived from our sales to CountryMark constituted approximately 77% of our oil and natural gas revenue from continuing operations for 2010. As such, we are currently significantly dependent on the creditworthiness of CountryMark. We have taken steps to monitor the creditworthiness of CountryMark, including obtaining a letter of credit corresponding to a significant portion of projected monthly revenue. For additional information, see “Risk Factors—We depend on a relatively small number of customers for a substantial portion of our revenue. The inability of one or more of our purchasers to meet their obligations or the loss of our market with CountryMark Cooperative, LLP, in particular, may adversely affect our financial results ,” in Item 1A of this report.
On December 30, 2009, we entered into a Master Crude Purchase Agreement (the “Master Crude Purchase Agreement”) with CountryMark. The agreement was effective as of January 1, 2010. Under the terms of the agreement, we agreed to sell, supply and deliver to CountryMark, and CountryMark agreed to receive and purchase from us, crude oil pursuant to purchase and sale order confirmations that we and CountryMark may enter into from time to time. Under the agreement, until we enter into a confirmation with CountryMark, neither party is under an obligation to purchase or sell any crude oil. The term of the Master Crude Purchase Agreement provides that the term will automatically be extended for additional one-year terms unless, prior to October 1 of each year, either party gives written notice to the other. We have entered into a confirmation with CountryMark, whereby CountryMark has agreed to purchase substantially all of the crude oil that we produce in 2011 in the Illinois Basin. However, as of December 31, 2010, we were not committed to any delivery levels with CountryMark or any other party. We also have an offload facility at a nearby crude oil pipeline that Marathon Oil Corp operates that has enabled us to diversify our purchasers in the Illinois Basin.
In the Appalachian Basin, our natural gas producing properties are located near existing pipeline systems and processing infrastructure. We transport the majority of our production over our own, or jointly owned, gathering lines to local distribution companies. For additional information, see “Risk Factors—We depend on pipelines owned by others to transport and sell our natural gas production. Disruption of, capacity constraints in, or proximity to pipeline systems could limit sales of our natural gas,” in Item 1A of this report.
11
Table of Contents
Through our joint venture with Keystone Midstream, we have constructed a high pressure gathering system and a cryogenic gas processing plant in Butler County, Pennsylvania. The cryogenic gas processing plant services our wells and third-party wells in areas that produce natural gas with a high BTU content. The cryogenic gas processing plant decreases the BTU level of the gas to appropriate levels for distribution through a standard sales line. The by-products of the cryogenic gas processing plant are natural gas liquids which are marketed separately. We are currently in the planning stage for a second cryogenic gas processing plant in and around our Butler County, Pennsylvania operations. For further information on our midstream services, see Note 1, Basis of Presentation and Principles of Consolidation, to our Consolidated Financial Statements.
Prices for oil and natural gas fluctuate widely based on, among other things, supply and demand. Supply and demand are influenced by a number of factors, including weather, foreign policy, industry practices and the U.S. and worldwide economic climate. Oil and natural gas markets have historically been cyclical and volatile in nature as a result of many factors that are beyond our control. There can be no assurance of what price we will be able to sell our oil and natural gas. Prices may be low when our wells are most productive, thereby reducing overall returns.
We enter into derivative transactions with unaffiliated third parties to achieve more predictable cash flows and to reduce our exposure to short-term fluctuations in oil and gas prices. For a more detailed discussion, see the information set forth in “Item 7. Management’s Discussion and Analysis of Financial Condition and Results of Operations” and “Item 7A. Quantitative and Qualitative Disclosures about Market Risk.”
Governmental Regulations
Our oil and natural gas exploration, production, and related operations are subject to extensive statutory and regulatory oversight by federal, state, tribal and local authorities. We must, for example, obtain drilling permits, post bonds for drilling, operating, and reclamation, and submit various reports. The following activities are also subject to regulation: the location of wells, the method of drilling and casing wells, the surface development, use and restoration of properties upon which wells are drilled, the plugging and abandoning of wells, temporary storage tank operations, air emissions from flaring, compression and access roads, the impoundment of water, the manner and extent of earth disturbances, air emissions, sour gas management, the disposal of fluids used in connection with operations, and the calculation and distribution of royalty payments and production taxes. We must also comply with statutes and regulations addressing conservation matters, including the unitization or pooling of oil and natural gas properties and the establishment of maximum rates of production. Failure to comply with any of these requirements can result in substantial monetary penalties or lease cancellation. Finally, in the past tribal and local authorities have imposed moratoria or other restrictions on exploration and production activities that must be addressed before those activities can proceed.
The increasing regulatory burden on the oil and natural gas industry will most likely increase our cost of doing business and may affect our production rates. Although we believe we are currently in substantial compliance with all applicable laws and regulations, because such rules and regulations are frequently amended or reinterpreted, we are unable to predict the future cost or impact of complying with such laws. We may be required to make significant expenditures to comply with governmental laws and regulations, which could have a material adverse effect on our business, financial condition and results of operations.
Historically, the transportation and sale for resale of natural gas in interstate commerce has been regulated pursuant to the Natural Gas Act of 1938, the Natural Gas Policy Act of 1978 (“NGPA”), and the regulations promulgated thereunder by the Federal Energy Regulatory Commission (“FERC”). In the past, the federal government has regulated the prices at which oil and gas could be sold. Deregulation of wellhead sales in the natural gas industry began with the enactment of the NGPA. In 1989, the Natural Gas Wellhead Decontrol Act was enacted, removing both price and non-price controls from natural gas sold in “first sales” no later than January 1, 1993. While sales by producers of natural gas, and all sales of crude oil, condensate and natural gas liquids currently can be made at uncontrolled market prices, Congress could reenact price controls in the future.
12
Table of Contents
The FERC regulates interstate natural gas transportation rates and service conditions. Its regulations affect the marketing of natural gas produced by us, as well as the revenues that may be received by us for sales of such production. Since the mid-1980s, FERC has issued a series of orders, collectively, Order 636, that have significantly altered the marketing and transportation of natural gas. Order 636 mandated a fundamental restructuring of interstate pipeline sales and transportation service, including the unbundling by interstate pipelines of the sale, transportation, storage and other services such pipelines previously performed. One of FERC’s purposes in issuing Order 636 was to increase competition within the natural gas industry. Generally, Order 636 has eliminated or substantially reduced the interstate pipelines’ traditional role as wholesalers of natural gas in favor of providing only storage and transportation service, and has substantially increased competition and volatility in natural gas markets.
The price we receive from the sale of oil and natural gas liquids will be affected by the cost of transporting products to markets. Effective January 1, 1995, FERC implemented regulations establishing an indexing system for transportation rates for oil pipelines, which, generally, index such rates to inflation, subject to certain conditions and limitations. We are unable to predict the effect, if any, of these regulations on our intended operations. The regulations may, however, increase transportation costs or reduce well head prices for oil and natural gas liquids.
Environmental Matters
Our operations and properties are subject to extensive and changing federal, state and local laws and regulations relating to environmental protection and the discharge of materials into the environment. These laws and regulations:
| • | require the acquisition of permits or other authorizations before construction, drilling and certain other of our activities; |
| • | limit or prohibit construction, drilling and other activities on specified lands within wilderness and other protected areas; and |
| • | impose substantial liabilities for pollution that may result from our operations. |
The permits required for our operations may be subject to revocation, modification and renewal by issuing authorities. Governmental authorities have the power to enforce environmental laws and regulations, and violations may result in fines, injunctions or even criminal penalties. Some states continue to adopt new regulations and permit requirements, which may impede or delay our operations or increase our costs. We believe that we are in substantial compliance with current applicable environmental laws and regulations, and, except for those matters described in “Item 3. Legal Proceedings,” have no material commitments for capital expenditures to comply with existing environmental requirements. Nevertheless, the trend in environmental legislation and regulation generally is toward stricter standards, and we expect that this trend will continue. Changes in existing environmental laws and regulations or in interpretations of these laws and regulations could have a significant impact on us, as well as the oil and natural gas industry as a whole.
The following is a summary of the existing laws and regulations that could have a material impact on our business operations.
The Resource Conservation and Recovery Act, as amended, or RCRA, and comparable state statutes regulate the generation, transportation, treatment, storage, disposal and cleanup of hazardous and non-hazardous wastes. Under the auspices of the federal Environmental Protection Agency, or EPA, the individual states administer some or all of the provisions of RCRA, sometimes in conjunction with their own, more stringent requirements. Drilling fluids, produced waters and most of the other wastes associated with the exploration and production of crude oil or natural gas are currently regulated under RCRA’s non-hazardous waste provisions. However, it is possible that certain oil and natural gas exploration and production wastes now classified as
13
Table of Contents
non-hazardous could be classified as hazardous wastes in the future. Any such change could result in an increase in our costs to manage and dispose of wastes, which could have a material adverse effect on our results of operations and financial condition.
The Comprehensive Environmental, Response, Compensation, and Liability Act, as amended, or CERCLA, and comparable state statutes impose strict liability on owners and operators of sites and on persons who disposed of or arranged for the disposal of “hazardous substances” found at these sites. This liability may be joint and several and include liability for the costs of cleaning up the hazardous substances that have been released into the environment, for damages to natural resources and for the costs of certain health studies. In addition, it is not uncommon for neighboring landowners and other third parties to file claims for personal injury and property damage allegedly caused by the release of hazardous substances or other pollutants into the environment.
We currently own, lease, or operate numerous properties that have been used for oil and natural gas exploration and production, and produced water disposal operations for many years. Although we believe that we have utilized operating and waste disposal practices that were standard in the industry at the time, hazardous substances, wastes, or hydrocarbons may have been disposed of or released on or under the properties that we own or lease, or on or under other locations, including off-site locations, where these substances have been taken for disposal. In addition, some of our properties have been operated by third parties or by previous owners or operators whose treatment and disposal of hazardous substances, wastes, or hydrocarbons was not under our control. These properties and the substances disposed or released on them may be subject to CERCLA, RCRA, and analogous state laws. Under these laws, we could be required to remove or remediate previously disposed wastes or property contamination, or to perform remedial activities to prevent future contamination.
The Federal Water Pollution Control Act, or the Clean Water Act, and analogous state laws, impose restrictions and strict controls with respect to the discharge of pollutants, including spills and leaks of oil and other substances, into waters of the United States. The discharge of pollutants into regulated waters is prohibited, except in accordance with the terms of a permit issued by the EPA or an analogous state agency. Federal and state regulatory agencies can impose administrative, civil and criminal penalties for non-compliance with discharge permits or other requirements of the Clean Water Act and analogous state laws and regulations.
Our oil and natural gas exploration and production operations generate produced water as a waste material, which is subject to the disposal requirements of the Clean Water Act, the Safe Drinking Water Act, or SDWA, or an equivalent state regulatory program. This produced water is disposed of by re-injection into the subsurface through disposal wells, treatment and discharge to the surface or in evaporation ponds. Whichever disposal method is used, produced water must be disposed of in compliance with permits issued by regulatory agencies, and in compliance with applicable environmental regulations. This water can sometimes be disposed of by discharging it under discharge permits issued pursuant to the Clean Water Act or an equivalent state program. Another common method of produced water disposal is subsurface injection in disposal wells. Such disposal wells are permitted under the SDWA, or an equivalent state regulatory program. To date, we believe that all necessary surface discharge or disposal well permits have been obtained and that the produced water has been discharged into the produced water disposal wells in substantial compliance with such obtained permits and applicable laws and regulations.
The Federal Clean Air Act, and comparable state laws, regulate emissions of various air pollutants through air emissions permitting programs and the imposition of other requirements. In addition, the EPA has developed, and continues to develop, stringent regulations governing emissions of toxic air pollutants at specified sources. Federal and state regulatory agencies can impose administrative, civil and criminal penalties for non-compliance with air permits or other requirements of the Federal Clean Air Act and associated state laws and regulations.
Changes in environmental laws and regulations occur frequently, and any changes that result in more stringent and costly reporting, waste handling, storage, transport, disposal, or cleanup requirements could materially adversely affect our operations and financial position, as well as those of the oil and gas industry in
14
Table of Contents
general. For example, recent scientific studies have suggested that emissions of certain gases, commonly referred to as “greenhouse gases” and including carbon dioxide and methane, may be contributing to warming of the Earth’s atmosphere. In response to such studies, the U.S. Congress is actively considering climate change-related legislation to restrict greenhouse gas emissions. The ultimate outcome of this legislative initiative remains uncertain. At least 17 states have passed laws, adopted regulations or undertaken regulatory initiatives to reduce the emission of greenhouse gases, primarily through the planned development of greenhouse gas emission inventories and/or regional greenhouse gas cap and trade programs. Although it is not possible at this time to predict whether or when the U.S. Congress may act on climate change legislation or how federal legislation may be reconciled with state and regional requirements, any future federal laws or implementing regulations that may be adopted to address greenhouse gas emissions could require us to incur increased operating costs and could adversely affect demand for the oil, natural gas and NGLs that we produce.
On June 26, 2009, the U.S. House of Representatives passed the American Clean Energy and Security Act of 2009, or ACESA, which would establish an economy-wide cap-and-trade program to reduce emissions of greenhouse gases in the United States, including carbon dioxide and methane. The U.S. Senate has begun work on its own legislation for controlling and reducing greenhouse gas emissions in the United States. Although it is not possible at this time to predict whether or when the Senate may act on climate change legislation, how any bill passed by the Senate would be reconciled with ACESA, or how federal legislation may be reconciled with state and regional requirements, any future federal laws or implementing regulations that may be adopted to address greenhouse gas emissions could require us to incur increased operating costs and could adversely affect demand for the oil, natural gas and NGLs that we produce.
In 2007, the U.S. Supreme Court held in Massachusetts, et al. v. EPA that greenhouse gas emissions may be regulated as an “air pollutant” under the federal Clean Air Act. On December 15, 2009, the EPA officially published its findings that emissions of carbon dioxide, methane and other “greenhouse gases” present an endangerment to human health and the environment because emissions of such gases are, according to the EPA, contributing to warming of the earth’s atmosphere and other climatic changes. These findings by the EPA allowed the agency to proceed with the adoption and implementation of regulations that would restrict emissions of greenhouse gases under existing provisions of the federal Clean Air Act. Since 2009, the EPA has issued regulations that, among other things, require a reduction in emissions of greenhouse gases from motor vehicles and that impose greenhouse gas emission limitations in Clean Air Act permits for certain stationary sources. In addition, on September 22, 2009, the EPA issued a final rule requiring the reporting of greenhouse gas emissions from specified large greenhouse gas emission sources in the United States beginning in 2011 for emissions occurring in 2010. On November 9, 2010 the EPA expanded its greenhouse reporting rule to include onshore petroleum and natural gas production, processing, transmission, storage, and distribution facilities. Under these rules, reporting of greenhouse gas emissions from such facilities is required on an annual basis, with reporting beginning in 2012 for emissions occurring in 2011.
Although it is not possible at this time to predict whether proposed legislation or regulations will be adopted as initially written, if at all, or how legislation or new regulations that may be adopted to address greenhouse gas emissions would impact our business, any such future laws and regulations could result in increased compliance costs or additional operating restrictions. Any additional costs or operating restrictions associated with legislation or regulations regarding greenhouse gas emissions could have a material adverse effect on our business, financial condition and results of operation. In addition, these developments could curtail the demand for fossil fuels such as oil and gas in areas of the world where our customers operate and thus adversely affect demand for our products and services, which may in turn adversely affect our future results of operations.
Available Information
We maintain an internet website under the name “www.rexenergy.com.” We make available, free of charge, on our website, our annual report on Form 10-K, quarterly reports on Form 10-Q, current reports on Form 8-K and amendments to those reports, as soon as reasonably practicable after providing such reports to the Securities
15
Table of Contents
and Exchange Commission (“SEC”). Our Corporate Governance Policy, the charters of the Audit Committee, the Compensation Committee and the Nominating and Governance Committee, and the Code of Ethics for directors, officers, employees and financial officers are also available on our website and in print to any stockholder who provides a written request to the Corporate Secretary at 476 Rolling Ridge Drive, Suite 300, State College, PA 16801.
We file annual reports on Form 10-K, quarterly reports on Form 10-Q, current reports on Form 8-K, proxy statements and other documents with the SEC under the Securities Exchange Act of 1934, as amended. The public may read and copy any materials that we file with the SEC at the SEC’s Public Reference Room at 100 F Street, N.E., Washington, D.C. 20549. The public may obtain information on the operation of the Public Reference Room by calling the SEC at 1-800-SEC-0330. Also, the SEC maintains an internet website that contains reports, proxy and information statements, and other information regarding issuers, including Rex Energy Corporation, that file electronically with the SEC. The public can obtain any document we file with the SEC at www.sec.gov. Information contained on or connected to our website is not incorporated by reference into this Form 10-K and should not be considered part of this report or any other filing that we make with the SEC.
16
Table of Contents
| ITEM 1A. | RISK FACTORS |
In evaluating our company, the factors described below should be considered carefully. The occurrence of one or more of these events could significantly and adversely affect our business, prospects, financial condition, results of operations and cash flows.
Risks Related to Our Company
Future economic conditions in the U.S. and global markets may have a material adverse impact on our business and financial condition that we currently cannot predict.
The U.S. and other world economies are still recovering from a recession which began in 2008 and extended into 2009. While economic growth has resumed, the timing and extent of an economic recovery are uncertain. There are likely to be significant long-term effects resulting from the recession and credit market crisis, including a future global economic growth rate that is slower than what was experienced in previous years. Unemployment rates remain high and businesses and consumer confidence levels have not yet fully recovered to pre-recession levels. In addition, more volatility may occur before a sustainable, yet lower, growth rate is achieved. Global economic growth drives demand for energy from all sources, including for oil and natural gas. A lower future economic growth rate will result in decreased demand growth for our crude oil and natural gas production as well as lower commodity prices, which will reduce our cash flows from operations and our profitability.
Volatility in oil and natural gas prices may adversely affect our business, financial condition or results of operations and our ability to meet our capital expenditure obligations and financial commitments.
The prices we receive for our oil and natural gas production heavily influence our revenue, profitability, access to capital and future rate of growth. Oil and natural gas are commodities, and therefore their prices are subject to wide fluctuations in response to relatively minor changes in supply and demand. Historically, the markets for oil and natural gas have been volatile. These markets will likely continue to be volatile in the future. The prices we receive for our production, and the levels of our production, depend on numerous factors beyond our control. These factors include, but are not limited to, the following:
| • | the current uncertainty in the global economy; |
| • | changes in global supply and demand for oil and natural gas; |
| • | the condition of the U.S. and global economy; |
| • | the actions of certain foreign states; |
| • | the price and quantity of imports of foreign oil and natural gas; |
| • | political conditions, including embargoes, in or affecting other oil producing activities; |
| • | the level of global oil and natural gas exploration and production activity; |
| • | the level of global oil and natural gas inventories; |
| • | production or pricing decisions made by the Organization of Petroleum Exporting Countries (“OPEC”); |
| • | weather conditions; |
| • | availability of limited refining facilities in the Illinois Basin reducing competition and resulting in lower regional oil prices than in other U.S. oil producing regions; |
| • | technological advances affecting energy consumption; and |
| • | the price and availability of alternative fuels. |
Lower oil and natural gas prices may not only decrease our revenues on a per unit basis, but also may reduce the amount of oil and natural gas that we can produce economically. The higher operating costs associated with
17
Table of Contents
many of our oil fields will make our profitability more sensitive to oil price declines. A sustained decline in oil or natural gas prices may materially and adversely affect our future business, financial condition, results of operations, liquidity or ability to finance planned capital expenditures.
Enhanced Oil Recovery, or EOR, techniques that we may use, such as our Alkali-Surfactant-Polymer flooding in the Lawrence Field, involve more risk than traditional waterflooding.
An EOR technique such as alkali-surfactant-polymer, or ASP, chemical injection involves significant capital investment and an extended period of time, generally a year or longer, from the initial phase of a pilot program until increased production occurs. The results of any successful pilot program may not be indicative of actual results achieved in a broader EOR project in the same field or area. Generally, surfactant polymer, including ASP, injection is regarded as involving more risk than traditional waterflood operations. The potential reserves associated with our ASP project in the Lawrence Field are not considered proved. Our ability to achieve commercial production and recognize proved reserves from our EOR projects is greatly contingent upon many inherent uncertainties associated with EOR technology, including ASP technology, geological uncertainties, chemical and equipment availability, rig availability and many other factors.
If our access to markets is restricted, it could negatively impact our production, our income and ultimately our ability to retain our leases. Our ability to sell natural gas and/or receive market prices for our natural gas may be adversely affected by pipeline and gathering system capacity constraints.
Market conditions or the unavailability of satisfactory oil and natural gas transportation arrangements may hinder our access to oil and natural gas markets or delay our production. The availability of a ready market for our oil and natural gas production depends on a number of factors, including the demand for and supply of oil and natural gas and the proximity of reserves to pipelines and terminal facilities. Our ability to market our production depends in substantial part on the availability and capacity of gathering systems, pipelines and processing facilities owned and operated by third parties. Our failure to obtain such services on acceptable terms could materially harm our business. Our productive properties may be located in areas with limited or no access to pipelines, thereby necessitating delivery by other means, such as trucking, or requiring compression facilities. Such restrictions on our ability to sell our oil or natural gas may have several adverse effects, including higher transportation costs, fewer potential purchasers (thereby potentially resulting in a lower selling price) or, in the event we were unable to market and sustain production from a particular lease for an extended time, possibly causing us to lose a lease due to lack of production.
If drilling in the Marcellus Shale areas continues to be successful, the amount of natural gas being produced by us and others could exceed the capacity of the various gathering and intrastate or interstate transportation pipelines currently available in these areas. If this occurs, it will be necessary for new pipelines and gathering systems to be built. Because of the current economic climate, certain pipeline projects that are planned for the Marcellus Shale area may not occur for lack of financing. In addition, capital constraints could limit our ability to build intrastate gathering systems necessary to transport our gas to interstate pipelines. In such event, we might have to shut in our wells awaiting a pipeline connection or capacity and/or sell natural gas production at significantly lower prices than those quoted on NYMEX or than we currently project, which would adversely affect our results of operations.
A portion of our natural gas and oil production in any region may be interrupted, or shut in, from time to time for numerous reasons, including as a result of weather conditions, accidents, loss of pipeline or gathering system access, field labor issues or strikes, or we might voluntarily curtail production in response to market conditions. If a substantial amount of our production is interrupted at the same time, it could temporarily adversely affect our cash flow.
18
Table of Contents
If we are unable to acquire adequate supplies of water for our Marcellus Shale drilling operations or are unable to dispose of the water we use at a reasonable cost and within applicable environmental rules, our ability to produce gas commercially and in commercial quantities could be impaired.
We use between three and four million gallons of water per well in our Marcellus Shale well completion operations. Our inability to locate sufficient amounts of water, or dispose of water after drilling, could adversely impact our operations. Moreover, the adoption and implementation of new environmental regulations could include restrictions on our ability to conduct certain operations such as hydraulic fracturing or disposal of waste, including, but not limited to, produced water, drilling fluids and other wastes associated with the exploration, development or production of natural gas. Furthermore, new environmental regulations and permit requirements governing the withdrawal, storage and use of surface water or groundwater necessary for hydraulic fracturing of wells may also increase operating costs and cause delays, interruptions or termination of operations, the extent of which cannot be predicted, all of which could adversely affect our financial condition and results of operations.
Certain federal income tax deductions currently available with respect to oil and natural gas exploration and development may be eliminated as a result of future legislation.
Changes contained in President Obama’s 2012 budget proposal include the elimination of certain key U.S. federal income tax preferences currently available to oil and gas exploration and production companies. Such changes include, but are not limited to, (i) the repeal of the percentage depletion allowance for oil and gas properties; (ii) the elimination of current deductions for intangible drilling and development costs; (iii) the elimination of the deduction for certain U.S. production activities; and (iv) an extension of the amortization period for certain geological and geophysical expenditures. It is unclear, however, whether any such changes will be enacted or how soon such changes could be effective.
The passage of any legislation as a result of the budget proposal, or any other similar change in U.S. federal income tax law could eliminate certain tax deductions that are currently available with respect to oil and gas exploration and development, and any such change could negatively affect our financial condition and results of operations.
Enactment of a Pennsylvania severance tax on natural gas could adversely impact our results of existing operations and the economic viability of exploiting new gas drilling and production opportunities in Pennsylvania.
As a result of a funding gap in the Pennsylvania state budget due to significant declines in anticipated revenue, a bill has been introduced in the Pennsylvania House of Representatives to adopt a severance tax on the production of natural gas in Pennsylvania. The amount of the proposed tax is five percent of the value of the natural gas at the wellhead, plus 4.6 cents per thousand cubic feet of natural gas severed. All of our Marcellus Shale acreage is located in the Commonwealth of Pennsylvania. If Pennsylvania adopts such a severance tax, it could adversely impact our results of existing operations and the economic viability of exploiting new gas drilling and production opportunities in Pennsylvania.
All of the value of our production and reserves is concentrated in the Illinois Basin and Appalachian Basin. Because of this concentration, any production problems or changes in assumptions affecting our proved reserve estimates related to these areas could have a material adverse impact our business.
For the year ended December 31, 2010, 56.1% of our net daily production came from the Illinois Basin area and 43.9% came from the Appalachian Basin. As of December 31, 2010, approximately 24.2% of our proved reserves were located in the fields that comprise the Illinois Basin and 75.8% of our proved reserves were a result of our Appalachian Basin operations. If mechanical problems, weather conditions or other events were to curtail a substantial portion of the production in one or both of these regions, our cash flow would be adversely affected. If ultimate production associated with these properties is less than our estimated reserves, or changes in pricing, cost or recovery assumptions in the area results in a downward revision of any estimated reserves in these properties, our business, financial condition and results of operations could be adversely affected.
19
Table of Contents
We depend on a relatively small number of purchasers for a substantial portion of our revenue. The inability of one or more of our purchasers to meet their obligations or the loss of our market with CountryMark Cooperative, LLP, in particular, may adversely affect our financial results.
We derive a significant amount of our revenue from a relatively small number of purchasers. While a portion of our oil in the Illinois Basin is sold through an offload facility, a majority of the oil is sold to one refinery, CountryMark Cooperative, LLP. The revenue we received from sales of our oil to CountryMark Cooperative, LLP for the year ended December 31, 2010, constituted approximately 77% of our total oil and natural gas sales revenue from continuing operations for such period. Our inability to continue to provide services to key customers, if not offset by additional sales to our other customers, could adversely affect our financial condition and results of operations. These companies may not provide the same level of our revenue in the future for a variety of reasons, including their lack of funding, a strategic shift on their part in moving to different geographic areas in which we do not operate or our failure to meet their performance criteria. The loss of all or a significant part of this revenue would adversely affect our financial condition and results of operations.
Our results of operations and cash flow may be adversely affected by risks associated with our oil and gas financial derivative activities, and our oil and gas financial derivative activities may limit potential gains.
We have entered into, and we expect to enter into in the future, oil and gas financial derivative arrangements corresponding to a significant portion of our oil and natural gas production. Many derivative instruments that we employ require us to make cash payments to the extent the applicable index exceeds a predetermined price, thereby limiting our ability to realize the benefit of increases in oil and natural gas prices. During the twelve months ended December 31, 2010, we incurred realized gains of $0.8 million from our financial derivatives. Please read “Item 7. Management’s Discussion and Analysis of Financial Condition and Results of Operations.”
If our actual production and sales for any period are less than the corresponding volume of derivative contracts for that period (including reductions in production due to operational delays), or if we are unable to perform our activities as planned, we might be forced to satisfy all or a portion of our derivative obligations without the benefit of the cash flow from our sale of the underlying physical commodity, resulting in a substantial diminution of our liquidity. In addition, our oil and gas financial derivative activities can result in substantial losses. Such losses could occur under various circumstances, including any circumstance in which a counterparty does not perform its obligations under the applicable derivative arrangement, the arrangement is imperfect or our derivative policies and procedures are not followed or do not work as planned. Under the terms of our senior credit facility with KeyBank National Association, the percentage of our total production volumes with respect to which we will be allowed to enter into derivative contracts is limited, and we therefore retain the risk of a price decrease for our remaining production volume.
If oil and natural gas prices decline, we may be required to take additional write-downs of the carrying values of our oil and natural gas properties, potentially triggering earlier-than-anticipated repayments of any outstanding debt obligations and negatively impacting the trading value of our securities.
There is a risk that we will be required to write down the carrying value of our oil and gas properties, which would reduce our earnings and stockholders’ equity. We account for our natural gas and crude oil exploration and development activities using the successful efforts method of accounting. Under this method, costs of productive exploratory wells, developmental dry holes and productive wells and undeveloped leases are capitalized. Oil and gas lease acquisition costs are also capitalized. Exploration costs, including personnel costs, certain geological and geophysical expenses and delay rentals for oil and gas leases are charged to expense as incurred. Exploratory drilling costs are initially capitalized, but charged to expense if and when the well is determined not to have found reserves in commercial quantities. The capitalized costs of our oil and gas properties may not exceed the estimated future net cash flows from our properties. If capitalized costs exceed future cash flows, we write down the costs of the properties to our estimate of fair market value. Any such charge will not affect our cash flow from operating activities, but will reduce our earnings and stockholders’ equity.
20
Table of Contents
Additional write downs could occur if oil and gas prices decline or if we have substantial downward adjustments to our estimated proved reserves, increases in our estimates of development costs or deterioration in our drilling results. Because our properties currently serve, and will likely continue to serve, as collateral for advances under our existing and future credit facilities, a write-down in the carrying values of our properties could require us to repay debt earlier than we would otherwise be required. It is likely that the cumulative effect of a write-down could also negatively impact the value of our securities, including our common stock.
The application of the successful efforts method of accounting requires managerial judgment to determine the proper classification of wells designated as developmental or exploratory, which will ultimately determine the proper accounting treatment of the costs incurred. The results from a drilling operation can take considerable time to analyze and the determination that commercial reserves have been discovered requires both judgment and industry experience. Wells may be completed that are assumed to be productive but may actually deliver oil and gas in quantities insufficient to be economic, which may result in the abandonment of the wells at a later date. Wells are drilled that have targeted geologic structures that are both developmental and exploratory in nature, and an allocation of costs is required to properly account for the results. The evaluation of oil and gas leasehold acquisition costs requires judgment to estimate the fair value of these costs with reference to drilling activity in a given area.
We review our oil and gas properties for impairment annually or whenever events and circumstances indicate a decline in the recoverability of their carrying value. Once incurred, a write down of oil and gas properties is not reversible at a later date even if gas or oil prices increase. Given the complexities associated with oil and gas reserve estimates and the history of price volatility in the oil and gas markets, events may arise that would require us to record an impairment of the book values associated with oil and gas properties.
Drilling for and producing oil and natural gas are high risk activities with many uncertainties that could adversely affect our business, financial condition and results of operations.
Our future success will depend on the success of our exploitation, exploration, development and production activities. Our oil and natural gas exploration and production activities are subject to numerous risks beyond our control, including the risk that drilling will not result in commercially viable oil or natural gas production. Our decisions to purchase, explore, develop or otherwise exploit prospects or properties will depend in part on the evaluation of data obtained through geophysical and geological analyses, production data and engineering studies, the results of which are often inconclusive or subject to varying interpretations. Please read “Item 1A. Our estimated reserves are based on many assumptions that may turn out to be inaccurate. Any significant inaccuracies in these reserve estimates or underlying assumptions may materially affect the quantities and present value of our reserves” below for a discussion of the uncertainties involved in these processes. Our costs of drilling, completing and operating wells are often uncertain before drilling commences. Overruns in budgeted expenditures are common risks that can make a particular project uneconomical. Further, our future business, financial condition, results of operations, liquidity or ability to finance planned capital expenditures could be materially and adversely affected by any factor that may curtail, delay or cancel drilling, including the following:
| • | delays imposed by or resulting from compliance with regulatory requirements; |
| • | unusual or unexpected geological formations; |
| • | pressure or irregularities in geological formations; |
| • | shortages of or delays in obtaining equipment and qualified personnel; |
| • | equipment malfunctions, failures or accidents; |
| • | unexpected operational events and drilling conditions; |
| • | pipe or cement failures; |
| • | casing collapses; |
21
Table of Contents
| • | lost or damaged oilfield drilling and service tools; |
| • | loss of drilling fluid circulation; |
| • | uncontrollable flows of oil, natural gas and fluids; |
| • | fires and natural disasters; |
| • | environmental hazards, such as natural gas leaks, oil spills, pipeline ruptures and discharges of toxic gases; |
| • | adverse weather conditions; |
| • | reductions in oil and natural gas prices; |
| • | oil and natural gas property title problems; and |
| • | market limitations for oil and natural gas. |
If any of these factors were to occur with respect to a particular field, we could lose all or a part of our investment in the field, or we could fail to realize the expected benefits from the field, either of which could materially and adversely affect our revenue and profitability.
Our estimated reserves are based on many assumptions that may turn out to be inaccurate. Any significant inaccuracies in these reserve estimates or underlying assumptions may materially affect the quantities and present value of our reserves.
Estimates of oil and natural gas reserves are inherently imprecise. The process of estimating oil and natural gas reserves is complex. It requires interpretations of available technical data and many assumptions, including assumptions relating to economic factors. Any significant inaccuracies in these interpretations or assumptions could materially affect the estimated quantities and present value of reserves. To prepare our estimates, we must project production rates and the timing of development expenditures. We must also analyze available geological, geophysical, production and engineering data. The extent, quality and reliability of this data can vary. The process also requires economic assumptions about matters such as oil and natural gas prices, drilling and operating expenses, capital expenditures, taxes and availability of funds.
Actual future production, oil and natural gas prices, revenues, taxes, development expenditures, operating expenses and quantities of recoverable oil and natural gas reserves most likely will vary from our estimates. Any significant variance could materially affect the estimated quantities and present value of reserves shown in this report. In addition, we may adjust estimates of proved reserves to reflect production history, results of exploration and development, prevailing oil and natural gas prices and other factors, many of which are beyond our control.
The present value of future net cash flows from our proved reserves is not necessarily the same as the current market value of our estimated oil and natural gas reserves. We base the estimated discounted future net cash flows from our proved reserves on prices and costs in effect on the day of estimate. However, actual future net cash flows from our oil and natural gas properties also will be affected by factors such as:
| • | actual prices we receive for oil and natural gas; |
| • | actual cost of development and production expenditures; |
| • | the amount and timing of actual production; |
| • | supply of and demand for oil and natural gas; and |
| • | changes in governmental regulations or taxation. |
22
Table of Contents
The timing of both our production and our incurrence of expenses in connection with the development and production of oil and natural gas properties will affect the timing of actual future net cash flows from proved reserves, and thus their actual present value. In addition, the 10% discount factor we use when calculating discounted future net cash flows may not be the most appropriate discount factor based on interest rates in effect from time to time and risks associated with us or the oil and natural gas industry in general.
Prospects that we decide to drill may not yield oil or natural gas in commercially viable quantities.
Our prospects are in various stages of evaluation. There is no way to predict with certainty in advance of drilling and testing whether any particular prospect will yield oil or natural gas in sufficient quantities to recover drilling or completion costs or to be economically viable, particularly in light of the current economic environment. The use of seismic data and other technologies, and the study of producing fields in the same area, will not enable us to know conclusively before drilling whether oil or natural gas will be present or, if present, whether oil or natural gas will be present in commercially viable quantities. Moreover, the analogies we draw from available data from other wells, more fully explored prospects or producing fields may not be applicable to our drilling prospects.
We cannot control activities on properties that we do not operate and are unable to control their proper operation and profitability.
We do not operate all of the properties in which we own an interest. As a result, we have limited ability to exercise influence over, and control the risks associated with, the operations of these properties. The failure of an operator of our wells to adequately perform operations, an operator’s breach of the applicable agreements or an operator’s failure to act in ways that are in our best interests could reduce our production and revenues. The success and timing of our drilling and development activities on properties operated by others therefore depend upon a number of factors outside of our control, including the operator’s:
| • | nature and timing of drilling and operational activities; |
| • | timing and amount of capital expenditures; |
| • | expertise and financial resources; |
| • | the approval of other participants in drilling wells; and |
| • | selection of suitable technology. |
Unless we replace our oil and natural gas reserves, our reserves and production will decline, which would adversely affect our business, financial condition and results of operations.
Producing oil and natural gas reservoirs generally are characterized by declining production rates that vary depending on reservoir characteristics and other factors. Our future oil and natural gas reserves and production, and therefore our cash flow and income, are highly dependent on our success in efficiently developing and exploiting our current reserves and economically finding or acquiring additional recoverable reserves. We may not be able to develop, find or acquire additional reserves to replace our current and future production at acceptable costs, which would adversely affect our business, financial condition and results of operations.
Our future acquisitions may yield revenue or production that varies significantly from our projections.
In acquiring producing properties, we will assess the recoverable reserves, future natural gas and oil prices, operating costs, potential liabilities and other factors relating to the properties. Our assessments are necessarily inexact, and their accuracy is inherently uncertain. Our review of a subject property in connection with our acquisition assessment will not reveal all existing or potential problems or permit us to become sufficiently familiar with the property to assess fully its deficiencies and capabilities. We may not inspect every well, and we may not be able to observe structural and environmental problems even when we do inspect a well. If problems
23
Table of Contents
are identified, the seller may be unwilling or unable to provide effective contractual protection against all or part of those problems. Any acquisition of property interests may not be economically successful, and unsuccessful acquisitions may have a material adverse effect on our financial condition and future results of operations.
Our development and exploration operations require substantial capital, and we may be unable to obtain needed capital or financing on satisfactory terms, which could lead to a loss of properties and a decline in our oil and natural gas reserves.
The oil and natural gas industry is capital intensive. We make and expect to continue to make substantial capital expenditures in our business and operations for the exploration for, and development, production and acquisition of, oil and natural gas reserves. To date, we have financed capital expenditures primarily with proceeds from bank borrowings, cash generated by operations, public stock offerings, sales of non-core assets and joint venture agreements. We intend to finance our capital expenditures with proceeds from bank borrowings, the sale of debt or equity securities, asset sales, cash flow from operations and current and new financing arrangements, such as joint ventures. Our cash flow from operations and access to capital is subject to a number of variables, including:
| • | our proved reserves; |
| • | the level of oil and natural gas we are able to produce from existing wells; |
| • | the prices at which oil and natural gas are sold; and |
| • | our ability to acquire, locate and produce new reserves. |
If our revenues decrease as a result of lower oil and natural gas prices, operating difficulties, declines in reserves or for any other reason, we may have limited ability to obtain the capital necessary to sustain our operations at current levels. We may need to seek additional financing in the future. In addition, we may not be able to obtain debt or equity financing on terms favorable to us, or at all. The failure to obtain additional financing could result in a curtailment of our operations relating to exploration and development of our prospects, which in turn could lead to a possible loss of properties and a decline in our oil and natural gas reserves. Also, our credit facility contains covenants that restrict our ability to, among other things, materially change our business, approve and distribute dividends, enter into transactions with affiliates, create or acquire additional subsidiaries, incur indebtedness, sell assets, make loans to others, make investments, enter into mergers, incur liens, and enter into agreements regarding swap and other derivative transactions.
The unavailability or high cost of drilling rigs, equipment, supplies, personnel and services could adversely affect our ability to execute on a timely basis our exploration and development plans within our budget.
We may, from time to time, encounter difficulty in obtaining, or an increase in the cost of securing, drilling rigs, equipment, services and supplies. In addition, larger producers may be more likely to secure access to such equipment and services by offering more lucrative terms. If we are unable to acquire access to such resources, or can obtain access only at higher prices, our ability to convert our reserves into cash flow could be delayed and the cost of producing those reserves could increase significantly, which would adversely affect our financial condition and results of operations.
We depend on pipelines owned by others to transport and sell our natural gas production. Disruption of, capacity constraints in, or proximity to pipeline systems could limit sales of our natural gas.
In many instances, we transport our natural gas to market by utilizing pipelines owned by others. If pipelines do not exist near our producing wells, if pipeline capacity is limited or if pipeline capacity is unexpectedly curtailed or disrupted, we may have to reduce sales of our production of gas because we do not have facilities to store excess inventory. If this occurs, our revenues will be reduced, and our unit costs will also increase. In addition, if pipeline gas quality requirements change for a pipeline, we might be required to install additional processing equipment, which could increase our costs. If this should occur, the pipeline could curtail our gas flows until the gas delivered to their pipeline is in compliance.
24
Table of Contents
New technologies may cause our current exploration and drilling methods to become obsolete.
The oil and gas industry is subject to rapid and significant advancements in technology, including the introduction of new products and services using new technologies. As competitors use or develop new technologies, we may be placed at a competitive disadvantage, and competitive pressures may force us to implement new technologies at a substantial cost. In addition, competitors may have greater financial, technical and personnel resources that allow them to enjoy technological advantages and may in the future allow them to implement new technologies before we can. One or more of the technologies that we currently use or that we may implement in the future may become obsolete. We cannot be certain that we will be able to implement technologies on a timely basis or at a cost that is acceptable to us. If we are unable to maintain technological advancements consistent with industry standards, our operations and financial condition may be adversely affected.
We may incur substantial losses and be subject to substantial liability claims as a result of our oil and natural gas operations, and we may not have enough insurance to cover all of the risks that we face.
We maintain insurance coverage against some, but not all, potential losses to protect against the risks we face. We do not carry business interruption insurance. We may elect not to carry insurance if our management believes that the cost of available insurance is excessive relative to the risks presented. In addition, it is not possible to insure fully against pollution and environmental risks.
We are not insured against all risks. Losses and liabilities arising from uninsured and underinsured events could materially and adversely affect our business, financial condition and results of operations. Our oil and natural gas exploration and production activities are subject to all of the operating risks associated with drilling for and producing oil and natural gas, including the possibility of:
| • | environmental hazards, such as uncontrollable flows of oil, natural gas, brine, well fluids, toxic gas or other pollution into the environment, including groundwater and shoreline contamination; |
| • | abnormally pressured formations; |
| • | mechanical difficulties, such as stuck oil field drilling and service tools and casing collapses; |
| • | fires and explosions; |
| • | personal injuries and death; and |
| • | natural disasters. |
Any of these risks could adversely affect our ability to conduct operations or result in substantial losses to us. If a significant accident or other event occurs and is not fully covered by insurance, then that accident or other event could adversely affect our financial condition, results of operations and cash flows.
Our business may suffer if we lose key personnel.
Our operations depend on the continuing efforts of our executive officers and senior management. Our business or prospects could be adversely affected if any of these persons does not continue in their management role with us and we are unable to attract and retain qualified replacements. Additionally, we do not carry key person insurance for any of our executive officers or senior management.
25
Table of Contents
We are subject to complex laws and regulations that can adversely affect the cost, manner or feasibility of doing business.
The exploration, development, production and sale of oil and natural gas are subject to extensive federal, state, and local laws and regulations. Such regulation includes requirements for permits to drill and to conduct other operations and for provision of financial assurances (such as bonds) covering drilling and well operations. Other activities subject to regulation are:
| • | the location and spacing of wells; |
| • | the unitization and pooling of properties; |
| • | the method of drilling and completing wells; |
| • | the surface use and restoration of properties upon which wells are drilled; |
| • | the plugging and abandoning of wells; |
| • | the disposal of fluids used or other wastes generated in connection with our drilling operations; |
| • | the marketing, transportation and reporting of production; and |
| • | the valuation and payment of royalties. |
Under these laws, we could be subject to claims for personal injury or property damages, including natural resource damages, which may result from the impacts of our operations. Failure to comply with these laws also may result in the suspension or termination of our operations and subject us to administrative, civil and criminal penalties. Moreover, these laws could change in ways that substantially increase our costs of compliance. Any such liabilities, penalties, suspensions, terminations or regulatory changes could have a material adverse effect on our financial condition and results of operations.
We must obtain governmental permits and approvals for our drilling and mid-stream operations, which can be a costly and time consuming process, which may result in delays and restrictions on our operations.
Regulatory authorities exercise considerable discretion in the timing and scope of permit issuance. Requirements imposed by these authorities may be costly and time consuming and may result in delays in the commencement or continuation of our exploration or production operations. For example, we are often required to prepare and present to federal, state or local authorities data pertaining to the effect or impact that proposed exploration for or production of natural gas or oil may have on the environment. Further, the public may comment on and otherwise engage in the permitting process, including through intervention in the courts. Accordingly, the permits we need may not be issued, or if issued, may not be issued in a timely fashion, or may involve requirements that restrict our ability to conduct our operations or to do so profitably.
Our operations expose us to substantial costs and liabilities with respect to environmental matters.
Our oil and natural gas operations are subject to stringent federal, state and local laws and regulations governing the release of materials into the environment or otherwise relating to environmental protection. These laws and regulations may require the acquisition of a permit before drilling commences, restrict the types, quantities and concentration of substances that can be released into the environment in connection with our drilling and production activities, limit or prohibit drilling activities on certain lands lying within wilderness, wetlands and other protected areas, and impose substantial liabilities for pollution that may result from our operations. Failure to comply with these laws and regulations may result in the assessment of administrative, civil and criminal penalties, the imposition of investigatory or remedial obligations or injunctive relief. Under existing environmental laws and regulations, we could be held strictly liable for the removal or remediation of previously released materials or property contamination regardless of whether the release resulted from our operations, or our operations were in compliance with all applicable laws at the time they were performed.
26
Table of Contents
Changes in environmental laws and regulations occur frequently, and any changes that result in more stringent or costly waste handling, storage, transport, disposal or cleanup requirements could require us to make significant expenditures to maintain compliance, and may otherwise have a material adverse effect on our competitive position, financial condition and results of operations.
Federal and state legislation and regulatory initiatives relating to hydraulic fracturing could result in increased costs and additional operating restrictions or delays.
Congress is currently considering legislation to amend the federal Safe Drinking Water Act (“SDWA”) to require the disclosure of chemicals used by the oil and natural gas industry in the hydraulic fracturing process. Hydraulic fracturing is an important and commonly used process in the completion of unconventional natural gas wells in shale formations. This process involves the injection of water, sand and chemicals under pressure into rock formations to stimulate oil and natural gas production. Sponsors of two companion bills, which are currently pending in the House Energy and Commerce Committee and the Senate Committee on Environment and Public Works have asserted that chemicals used in the fracturing process could adversely affect drinking water supplies. The proposed legislation would require the reporting and public disclosure of chemicals used in the fracturing process, which could make it easier for third parties opposing the hydraulic fracturing process to initiate legal proceedings based on allegations that specific chemicals used in the fracturing process could adversely affect groundwater or cause other damage. In addition, this legislation, if adopted, could establish an additional level of regulation at the federal level that could lead to operational delays or increased operating costs and could result in additional regulatory burdens. The adoption of any future federal or state laws or implementing regulations imposing reporting obligations on, or otherwise limiting, the hydraulic fracturing process could make it more difficult and more expensive to complete natural gas wells in shale formations and increase our costs of compliance and doing business. Additionally, in March 2010, the EPA announced its intention to conduct a comprehensive research study on the potential adverse impacts that hydraulic fracturing may have on water quality and public health. The initial study results are expected to be available in late 2012. Thus, even if the pending bills are not adopted, the EPA study, depending on its results, could spur further initiatives to regulate hydraulic fracturing under the SDWA.
Climate change legislation or regulations restricting emissions of “greenhouse gases” could result in increased operating costs and reduced demand for the oil, natural gas and NGLs that we produce.
A variety of regulatory developments, proposals or requirements and legislative initiatives have been introduced in the United States that are focused on restricting the emission of carbon dioxide, methane and other greenhouse gases. For example, the U.S. Congress is actively considering climate change-related legislation to restrict greenhouse gas emissions. The ultimate outcome of this legislative initiative remains uncertain. At least 17 states have passed laws, adopted regulations or undertaken regulatory initiatives to reduce the emission of greenhouse gases, primarily through the planned development of greenhouse gas emission inventories and/or regional greenhouse gas cap and trade programs. Although it is not possible at this time to predict whether or when the U.S. Congress may act on climate change legislation or how federal legislation may be reconciled with state and regional requirements, any future federal laws or implementing regulations that may be adopted to address greenhouse gas emissions could require us to incur increased operating costs and could adversely affect demand for the oil, natural gas and NGLs that we produce. In 2007, the U.S. Supreme Court held in Massachusetts, et al. v. EPA that greenhouse gas emissions may be regulated as an “air pollutant” under the federal Clean Air Act. On December 15, 2009, the U.S. Environmental Protection Agency, or EPA, officially published its findings that emissions of carbon dioxide, methane and other “greenhouse gases” present an endangerment to human health and the environment because emissions of such gases are, according to the EPA, contributing to warming of the earth’s atmosphere and other climatic changes. These findings by the EPA allowed the agency to proceed with the adoption and implementation of regulations that would restrict emissions of greenhouse gases under existing provisions of the federal Clean Air Act. Since 2009, the EPA has issued regulations that, among other things, require a reduction in emissions of greenhouse gases from motor vehicles and that impose of greenhouse gas emission limitations in Clean Air Act permits for certain stationary sources. In
27
Table of Contents
addition, on September 22, 2009, the EPA issued a final rule requiring the reporting of greenhouse gas emissions from specified large greenhouse gas emission sources in the United States beginning in 2011 for emissions occurring in 2010. On November 9, 2010 the EPA expanded its greenhouse reporting rule to include onshore petroleum and natural gas production, processing, transmission, storage, and distribution facilities. Under these rules, reporting of greenhouse gas emissions from such facilities is required on an annual basis, with reporting beginning in 2012 for emissions occurring in 2011.
Although it is not possible at this time to predict whether proposed legislation or regulations will be adopted as initially written, if at all, or how legislation or new regulations that may be adopted to address greenhouse gas emissions would impact our business, any such future laws and regulations could result in increased compliance costs or additional operating restrictions. Any additional costs or operating restrictions associated with legislation or regulations regarding greenhouse gas emissions could have a material adverse effect on our business, financial condition and results of operation. In addition, these developments could curtail the demand for fossil fuels such as oil and gas in areas of the world where our customers operate and thus adversely affect demand for our products and services, which may in turn adversely affect our future results of operations.
The recent adoption of derivatives legislation by the United States Congress could have an adverse effect on our ability to use derivative instruments to reduce the effect of commodity price, interest rate and other risks associated with our business.
The United States Congress recently adopted the Dodd-Frank Wall Street Reform and Consumer Protection Act, which, among other provisions, establishes federal oversight and regulation of the over-the-counter derivatives market and entities that participate in that market. The new legislation was signed into law by the President on July 21, 2010 and requires the CFTC and the SEC to promulgate rules and regulations implementing the new legislation within 360 days from the date of enactment. The CFTC has also proposed regulations to set position limits for certain futures and option contracts in the major energy markets, although it is not possible at this time to predict whether or when the CFTC will adopt those rules or include comparable provisions in its rulemaking under the new legislation. The financial reform legislation may also require us to comply with registration, business conduct, reporting, capital margin requirements, and with certain clearing and trade-execution requirements in connection with our derivative activities, although the application of those provisions to us is uncertain at this time. The financial reform legislation may also require the counterparties to our derivative instruments to spin off some of their derivatives activities to a separate entity, which may not be as creditworthy as the current counterparty. The new legislation and any new regulations could significantly increase the cost of derivative contracts (including through requirements to post collateral, which could adversely affect our available liquidity), materially alter the terms of derivative contracts, reduce the availability of derivatives to protect against risks we encounter, reduce our ability to monetize or restructure existing derivative contracts, and increase our exposure to less creditworthy counterparties. If we reduce our use of derivatives as a result of the legislation and regulations, our results of operations may become more volatile and our cash flows may be less predictable.
Competition in the oil and natural gas industry is intense, which may adversely affect our ability to compete.
We operate in a highly competitive environment for acquiring properties, marketing oil and natural gas and securing trained personnel. Many of our competitors possess and employ financial, technical and personnel resources substantially greater than ours, which can be particularly important in the areas in which we operate. Those companies may be able to pay more for productive oil and natural gas properties and exploratory prospects and to evaluate, bid for and purchase a greater number of properties and prospects than our financial or personnel resources permit. Our ability to acquire additional prospects and to find and develop reserves in the future will depend on our ability to evaluate and select suitable properties and to consummate transactions in a highly competitive environment. We may not be able to compete successfully in the future in acquiring prospective reserves, developing reserves, marketing hydrocarbons, attracting and retaining quality personnel and raising additional capital.
28
Table of Contents
The outcome of litigation in which we have been named as a defendant is unpredictable and an adverse decision in any such matter could have a material adverse effect on our financial position or results of operations.
We are defendants in a number of litigation matters and are subject to various other claims, demands and investigations. These matters may divert financial and management resources that would otherwise be used to benefit our operations. No assurances can be given that the results of these matters will be favorable to us. An adverse resolution or outcome of any of these lawsuits, claims, demands or investigations could have a negative impact on our financial condition, results of operations and liquidity.
Risks Related to Our Common Stock
We may issue additional common stock in the future, which would dilute our existing stockholders.
In the future we may issue our previously authorized and unissued securities, including shares of our common stock or securities convertible into or exchangeable for our common stock, resulting in the dilution of the ownership interests of our stockholders. We are authorized under our amended and restated certificate of incorporation to issue 100,000,000 shares of common stock and 100,000 shares of preferred stock with such designations, preferences, and rights as may be determined by our board of directors. As of March 2, 2011, there were 44,312,714 shares of our common stock issued and outstanding and there were no shares of our preferred stock issued and outstanding.
We have an effective shelf registration statement from which additional shares of our common stock and other securities can be issued. In addition, we may also issue additional shares of our common stock or securities convertible into or exchangeable for our common stock in connection with the hiring of personnel, future acquisitions, future private placements of our securities for capital raising purposes or for other business purposes. Future issuances of our common stock, or the perception that such issuances could occur, could have a material adverse effect on the price of our common stock.
Our amended and restated certificate of incorporation, amended and restated bylaws, and Delaware law contain provisions that could make it more difficult for a third party to acquire us without the consent of our board of directors and our Chairman and other executive officers, who collectively beneficially own approximately 22% of the outstanding shares of our common stock as of March 2, 2011.
Provisions in our amended and restated certificate of incorporation and amended and restated bylaws could have the effect of delaying or preventing a change of control of us and changes in our management. These provisions include the following:
| • | the ability of our board of directors to issue shares of our common stock and preferred stock without stockholder approval; |
| • | the ability of our board of directors to make, alter, or repeal our bylaws without further stockholder approval; |
| • | the requirement for advance notice of director nominations to our board of directors and for proposing other matters to be acted upon at stockholder meetings; |
| • | requiring that special meetings of stockholders be called only by our Chairman, by a majority of our board of directors, by our Chief Executive Officer or by our President; and |
| • | allowing our directors, and not our stockholders, to fill vacancies on the board of directors, including vacancies resulting from removal or enlargement of the board of directors. |
In addition, we are subject to the provisions of Section 203 of the Delaware General Corporation Law. These provisions may prohibit large stockholders, in particular those owning 15% or more of our outstanding voting stock, from merging or combining with us.
29
Table of Contents
As of March 2, 2011, our board of directors, including Lance T. Shaner, our Chairman, and our other executive officers collectively own approximately 22% of the outstanding shares of our common stock. Although this is not a majority of our outstanding common stock, these stockholders, acting together, will have the ability to exert substantial influence over all matters requiring stockholder approval, including the election and removal of directors, any proposed merger, consolidation, or sale of all or substantially all of our assets and other corporate transactions.
The provisions in our amended and restated certificate of incorporation and amended and restated bylaws and under Delaware law, and the concentrated ownership of our common stock by our Chairman and other executive officers, could discourage potential takeover attempts and could reduce the price that investors might be willing to pay for shares of our common stock.
Because we have no plans to pay dividends on our common stock, stockholders must look solely to appreciation of our common stock to realize a gain on their investments.
We do not anticipate paying any dividends on our common stock in the foreseeable future. We currently intend to retain future earnings, if any, to finance the expansion of our business. Our future dividend policy is within the discretion of our board of directors and will depend upon various factors, including our business, financial condition, results of operations, capital requirements and investment opportunities. In addition, our senior credit facility limits the payment of dividends without the prior written consent of the lenders. Accordingly, stockholders must look solely to appreciation of our common stock to realize a gain on their investment. This appreciation may not occur.
We are able to issue shares of preferred stock with greater rights than our common stock.
Our amended and restated certificate of incorporation authorizes our board of directors to issue one or more series of preferred stock and set the terms of the preferred stock without seeking any further approval from our stockholders. Any preferred stock that is issued may rank ahead of our common stock in terms of dividends, liquidation rights, or voting rights. If we issue preferred stock, it may adversely affect the market price of our common stock.
| ITEM 1B. | UNRESOLVED STAFF COMMENTS |
As of the date of this filing, we have no unresolved comments from the staff of the SEC.
| ITEM 2. | PROPERTIES |
The table below summarizes certain data for our core operating areas for the year ended December 31, 2010 (as of December 31, 2010, there were no reserves or production from our DJ Basin operations):
| Division |
Average Daily Production (Mcfe per day) |
Total Production (Mcfe) |
Percentage of Total Production |
Total Proved Reserves (Mcfe) |
Percentage of Total Proved Reserves |
|||||||||||||||
| Illinois Basin |
11,367 | 4,148,796 | 56.1 | % | 48,856,674 | 24.2 | % | |||||||||||||
| Appalachian Basin |
8,883 | 3,242,600 | 43.9 | % | 152,822,129 | 75.8 | % | |||||||||||||
| Totals |
20,250 | 7,391,396 | 100.0 | % | 201,678,803 | 100.0 | % | |||||||||||||
Segment reporting is not applicable to us, as we have a single company-wide management team that administers all properties as a whole rather than by discrete operating segments. We track only basic operational data by area. We do not maintain complete separate financial statement information by area. We measure financial performance as a single enterprise and not on an area-by-area basis.
30
Table of Contents
Illinois Basin
In the Illinois Basin, we own an interest in 1,856 wells, which includes 491 disposal and injection wells. We have approximately 63,000 gross (35,000 net) acres owned and under lease. During the third quarter of 2008, we sold approximately 79,000 net undeveloped acres in Indiana and certain non-producing wells, which was a part of our New Albany Shale exploration projects, for approximately $8.4 million in proceeds.
Total proved reserves in the Illinois Basin decreased approximately 12.8 Bcfe, or 20.8%, to approximately 48.9 Bcfe at December 31, 2010 when compared to year-end 2009, which was primarily a result of the removal of conventional proved undeveloped locations that we do not intend to drill within the next five years. Proved developed reserves increased year-over-year by approximately 1.4% as a result of increased oil prices. Annual production decreased 3.9% from 2009. Capital expenditures in 2010 for drilling and facility improvements in the region were approximately $20.8 million, which funded the drilling of 15.0 gross (11.9 net) wells, of which one gross (0.5 net) was awaiting completion as of December 31, 2010. In addition, these expenditures covered the drilling of 24.0 gross (24.0 net) wells related to our Lawrence Field ASP Flood Project in Lawrence County, Illinois, 17.0 gross (17.0 net) which are in connection with our current 15-acre pilot. Capital expenditures for drilling and facilities development for the Lawrence Field ASP Flood Project totaled approximately $7.9 million.
As mentioned above, we removed our entire inventory of proved undeveloped locations due to the lack of intentions to drill these locations within the required time frame of five years, as set forth by the SEC. We have thus moved our focus to our Lawrence Field ASP Flood Project.
Lawrence Field ASP Flood Project
We are implementing an alkali-surfactant-polymer (“ASP”) flood project in the Cypress and Bridgeport Sandstone reservoirs of our Lawrence Field acreage. The Lawrence Field ASP Flood Project is considered an Enhanced Oil Recovery (“EOR”) project, which refers to recovery of oil that is not producible by primary or secondary recovery methods.
We currently own and operate 21.2 square miles (approximately 13,500 net acres) of the Lawrence Field. The Cypress (Mississippian) and the Bridgeport (Pennsylvanian) sandstones are the major producing horizons in the field. To date, approximately 40% of the estimated one billion barrels of original oil in place has been produced.
In the 1960s, 1970s and 1980s, a number of EOR projects using surfactant polymer floods were implemented in several fields in the Illinois Basin by Marathon Oil Corp. (“Marathon”), Texaco and Exxon in an attempt to recover a portion of the large percentage of the original oil in place that was being bypassed by the secondary recovery waterflood. These test projects reportedly were able to recover incremental oil reserves of 15% to 30% of the original oil in place. While we believe the results of these projects are pertinent, there can be no assurance that our Lawrence Field ASP Flood Project, which uses technology that was not developed at the time of the prior EOR projects, will achieve similar results. ASP technology, which uses mechanisms to mobilize bypassed residual oil similar to these previous surfactant polymer floods but at significantly lower costs, has been applied by other companies in several fields around the world resulting in significant incremental recoveries of the original oil in place. Chemicals used in the Lawrence Field ASP Flood Project are an alkali, a surfactant and a polymer. The alkali and surfactant combination acts like a soap and washes residual oil from the reservoir mainly by reducing interfacial tension between the oil and the water. The polymer is added to improve sweep displacement efficiency by pushing the “washed” molecules through the rock pores of the reservoir. ASP technology achieves its incremental recovery by reducing capillary forces that trap oil, improving aerial and vertical sweep efficiency and reducing mobility ratio.
The goal of our Lawrence Field ASP Flood Project is to duplicate the oil recovery performance of the surfactant polymer floods conducted in the field in the 1980s, but at a significantly lower cost. We expect this
31
Table of Contents
cost reduction to be accomplished by utilizing newer technologies to optimize the synergistic performance of the three chemicals used, and by using alkali in the formula, which would allow us to use a significantly lower concentration of the more costly surfactant.
In 2000, PennTex Resources Illinois, Inc., one of our Predecessor Companies, then known as Plains Illinois, Inc., and the U.S. Department of Energy conducted a study on the potential of an ASP project in the Lawrence Field, with consulting services provided by an independent engineering firm specializing in the design and implementation of chemical oil recovery systems. Based on the modeling of the reservoir characteristics and laboratory tests with cores taken in the Lawrence Field, the evaluation found oil recovery in the field could be increased significantly by installing an ASP flood. However, there can be no assurance that our Lawrence Field ASP Flood Project will achieve similar results.
During 2008 and 2009, we completed two four acre pilot tests, one each in the Bridgeport and Cypress sandstones. Both of the pilots demonstrated a response to the chemical injection, as indicated by an increase in both oil production and the oil cut ratio. Each pilot area had individual wells whose oil cut exceeded 10% after the initial response; whereas the oil cuts for both pilots at the time ASP injection was initiated were less than 1%. As of December 31, 2010, we had completed the ASP injection phase in our 15-acre Middagh Unit, with a final pore volume of 25% and are now in the process of completing the polymer push phase of the project. Initial results of this pilot unit are expected during the first or second quarters of 2011. Our Lawrence Field ASP Project is not a proved project nor are any of the potential reserves associated with this project considered proved at this time.
We have identified, thus far, 27 potential separate flood units (15 Bridgeport/12 Cypress). We are currently in the process of designing the first operationally sized ASP unit in the Bridgeport sandstone which will cover approximately 55 acres with chemical injection commencing during 2011. Assuming our Middagh Unit flood is successful; we would consider an ASP flood in this operationally sized unit. Depending on the size of each flood unit, it is anticipated that initial response time from the chemical injection date will be approximately 10 to 12 months and the time to peak response will be approximately 24 to 30 months.
Appalachian Basin
As of December 31, 2010, we owned an interest in approximately 461 producing natural gas wells in the Appalachian Basin, located predominantly in Pennsylvania. In addition to our producing wells in the basin, we own 59 Marcellus Shale proved undeveloped drilling locations with total reserves of 116.4 Bcfe, and four Marcellus Shale locations with proved developed non-producing reserves totaling 9.2 Bcfe. As with our properties in the Illinois Basin, we removed any proved undeveloped locations that were not expected to be drilled within the next five years. At December 31, 2010, we had approximately 139,000 gross (69,000 net) acres in the Appalachian Basin under lease, of which 86,000 gross (48,000 net) acres were undeveloped.
Reserves at December 31, 2010 increased 89.3 Bcfe, or 140%, from 2009 due primarily to our successful Marcellus Shale exploration activities. Annual production increased 108% over 2009.
Marcellus Shale
The Marcellus Shale is a black, organic rich shale formation located at depths between 5,000 and 8,500 feet and ranges in thickness from 50 to 220 feet on our acreage in southwestern and central Pennsylvania. As of December 31, 2010, we had interests in approximately 112,000 gross (56,000 net) Marcellus Shale prospective acres in these areas of Pennsylvania and we continue to expand our position.
In June of 2009, we entered into a Participation and Exploration Agreement (the “Williams PEA”) with Williams. Under the terms and conditions of the Williams PEA, Williams acquired, through a “drill-to-earn” structure, 50% of our working interest in certain oil and gas leases covering approximately 44,000 net acres in Centre, Clearfield and Westmoreland Counties, Pennsylvania (the “Project Area”). The Williams PEA effectively provided that, for Williams to earn its 50% interest in the Project Area, Williams had to bear 90% of all costs and
32
Table of Contents
expenses incurred in the drilling and completion of all wells jointly drilled in the Project Area until such time as Williams had invested approximately $74.0 million (approximately $33.0 million on behalf of us and $41.0 million for Williams’ 50% share of the wells). Once Williams completed its carry obligation and acquired 50% of our working interest in the leases within the Project Area, the parties share all costs of the joint venture operations with an area of mutual interest (including the Project Area) in accordance with their participating interests, which were expected to be on a 50/50 basis prior to our Sumitomo joint venture transaction. Williams met its drilling carry obligation during the fourth quarter of 2010.
On September 30, 2010, we entered into a joint venture transaction with Sumitomo. In Butler and Beaver Counties, Pennsylvania we sold a 15% non-operated interest in approximately 41,000 net acres for approximately $30.6 million in cash at closing and $30.6 million in the form of a drilling carry of 80% of our drilling and completion costs in the area. Pursuant to the Participation and Exploration Agreement (the “Sumitomo PEA”), Sumitomo agreed to pay all costs to lease approximately 9,000 acres in the Butler County Area of Mutual Interest (“AMI”) (the “Phase I Leasing”), and is to pay to us a leasing management fee of $1,000 per net acre during the Phase I Leasing. Under the Sumitomo PEA, upon the conclusion of Phase I Leasing, we are to cross assign interests in the leases with Sumitomo to provide uniformity of interest in each lease in the Butler County AMI. Assuming the full 9,000 net acres are leased, the final ownership percentages in the Butler County AMI would be approximately 70% to us and 30% to Sumitomo. In addition to the sale of undeveloped acreage, we also sold to Sumitomo 30% of our interests in 20 Marcellus Shale wells within the Butler County AMI and 30% of our interest in Keystone Midstream.
In our Marcellus Shale joint venture Project Area with Williams, which is discussed above, we sold to Sumitomo 20% of our interests in 22,000 net acres for approximately $19.0 million in cash at closing and $19.0 million in the form of a drilling carry of 80% of our drilling and completion costs in the Project Area. In addition, we sold 20% of our interests in 19 Marcellus Shale wells located in the Williams joint venture areas and 20% of our interest in RW Gathering, LLC. The resulting working interest ownership is 50% Williams, 40% Rex Energy and 10% Sumitomo.
In addition to the areas above, we sold to Sumitomo 50% of our interests in approximately 4,500 net acres in Fayette and Centre Counties, Pennsylvania for $9.2 million in cash at closing and $9.2 million in the form of a drilling carry of 80% of our drilling and completion costs. Pursuant to the Sumitomo PEA, the drilling carry for these areas may be applied, at our discretion, to drilling and completion costs attributable to either the Butler County or Williams Project Areas.
At closing, we received approximately $99.5 million in cash, which included a reimbursement for leasing expenses incurred subsequent to the effective date of September 1, 2010, in the amount of $7.6 million. Additionally, the cash payment included a reimbursement for drilling related expenses incurred subsequent to the effective date in the amount of approximately $7.5 million, which was applied against the drilling carry. As of December 31, 2010 the remaining drilling carry with Sumitomo was approximately $28.8 million.
Capital expenditures in 2010 for drilling and facility development totaled $36.1 million, which funded the drilling of 27.0 gross (15.0 net) wells, of which 10.0 gross (5.2 net) were completed and producing and 17.0 gross (9.8 net) were awaiting completion and are expected to be productive. Our plans for 2011 have allocated approximately $109.4 million in capital expenditures to our Marcellus Shale project areas.
DJ Basin
In the DJ Basin, we have approximately 65,000 gross (45,000 net) acres under lease. We believe that our acreage in the DJ Basin is prospective for Niobrara horizontal oil well drilling. Capital expenditures for 2010 for drilling and facility development totaled approximately $18.2 million, which funded the drilling of four gross (3.5 net) exploratory wells, which were in various stages of drilling and completion as of the end of the year. We expect to have initial results from these initial test wells during the first quarter of 2011. Our plans for 2011 have allocated approximately $27.0 million in capital expenditures to our Niobrara project areas.
33
Table of Contents
Proved Reserves
In December 2008, the SEC released its finalized rule for “Modernization of Oil and Gas Reporting,” which we adopted effective December 31, 2009, as required by the SEC. The most significant amendments to the requirements included the following:
| • | Commodity Prices: Economic producibility of reserves and discounted cash flows, by significant geographic area, are now based on a 12-month average commodity price unless contractual arrangements designate the price to be used, as opposed to the use of year-end prices as was practiced previously. |
| • | Disclosure of Unproved Reserves: Probable and possible reserves may be disclosed separately on a voluntary basis. |
| • | Proved Undeveloped Reserve Guidelines: Reserves may be classified as proved undeveloped if there is a high degree of confidence that the quantities will be recovered and they are scheduled to be drilled within the next five years, unless the specific circumstances justify a longer time. |
| • | Reserves Estimation Using New Technologies: Reserves may be estimated through the use of reliable technology in addition to flow tests and production history, contingent on demonstrated reliability in conclusions about reserve volumes. |
| • | Reserves Personnel and Estimation Process: Additional disclosure is required regarding the qualifications and independence of the chief technical person who oversees the reserves estimation process. We are also required to provide a general discussion of our internal controls used to assure the objectivity of the reserves estimate. |
| • | Non-Traditional Resources: The definition of oil and gas producing activities has expanded and focuses on the marketable product rather than the method of extraction. |
For proved reserves as of December 31, 2010, proved locations were identified, assessed and justified using the evaluation methods of performance analysis, volumetric analysis and analogy. In addition, reliable technologies were used to support a select number of undeveloped locations in the Marcellus Shale Region. Within the Marcellus Shale Region, we used both public and proprietary geologic data to establish continuity of the formation and its producing properties. This data included performance data, seismic data, micro-seismic analysis, open hole log information and petrophysical analysis of the log data, mud logs, log cross-sections, gas sample analysis, drill cutting samples, measurements of total organic content, thermal maturity and statistical analysis. In our development area, these data demonstrated consistent and continuous reservoir characteristics.
Application of the new reserve rules resulted in the use of lower prices at December 31, 2010 for oil and higher prices for natural gas than would have resulted under the previous rules. Use of new 12-month average pricing rules at December 31, 2010 resulted in proved reserves of approximately 201.7 Bcfe. Use of the old year-end prices rules would have resulted in proved reserves of approximately 205.0 Bcfe at December 31, 2010. Therefore, the total impact of the new price methodology rules resulted in negative reserves revisions of 3.3 Bcfe.
The following table sets forth our estimated proved reserves based on the new SEC rules as defined in Rule 4.10(a) of Regulation S-X and Item 1200 of Regulation S-K:
| Category |
Net Reserves | |||||||||||
| Oil (Barrels) |
NGL (Barrels) |
Gas (Mcf) |
||||||||||
| Proved Developed |
8,142,779 | 656,326 | 32,477,226 | |||||||||
| Proved Undeveloped |
— | 3,543,723 | 95,144,609 | |||||||||
| Total Proved |
8,142,779 | 4,200,049 | 127,621,835 | |||||||||
34
Table of Contents
All of our reserves are located within the continental United States. Reserve estimates are inherently imprecise and remain subject to revisions based on production history, results of additional exploration and development, prices of oil and natural gas and other factors. Please read “Item 1A—Risk Factors—Our estimated reserves are based on many assumptions that may turn out to be inaccurate. Any significant inaccuracies in these reserve estimates or underlying assumptions may materially affect the quantities and present value of our reserves.” You should also read the notes following the table below and our Consolidated Financial Statements for the year ended December 31, 2010 in conjunction with the following reserve estimates.
The following table sets forth our estimated proved reserves at the end of each of the past three years:
| 2010 | 2009 | 2008 | ||||||||||
| Description |
||||||||||||
| Proved Developed Reserves |
||||||||||||
| Oil (Bbls) |
8,142,779 | 8,526,279 | 5,157,518 | |||||||||
| Natural Gas (Mcf) |
32,477,226 | 16,161,494 | 11,695,092 | |||||||||
| NGLs (Bbls) |
656,326 | 97,151 | 28,974 | |||||||||
| Proved Undeveloped Reserves |
||||||||||||
| Oil (Bbls) |
— | 1,751,178 | 707,757 | |||||||||
| Natural Gas (Mcf) |
95,144,609 | 40,001,676 | 18,324,385 | |||||||||
| NGLs (Bbls) |
3,543,723 | 1,135,375 | 99,377 | |||||||||
| Total Proved Reserves (Mcfe)1, 2, 3 |
201,678,803 | 125,223,068 | 65,981,233 | |||||||||
| PV-10 Value (millions)2, 4 |
$ | 269.4 | $ | 190.5 | $ | 84.0 | ||||||
| Standardized Measure (millions)2 |
$ | 188.1 | $ | 144.4 | $ | 68.9 | ||||||
| 1 | The estimates of reserves in the table above conform to the guidelines of the SEC. Estimated recoverable proved reserves have been determined without regard to any economic impact that may result from our financial derivative activities. These calculations were prepared using standard geological and engineering methods generally accepted by the petroleum industry. The reserve information shown is estimated. The certainty of any reserve estimate is a function of the quality of available geological, geophysical, engineering and economic data, the precision of the engineering and geological interpretation and judgment. The estimates of reserves, future cash flows and present value are based on various assumptions, and are inherently imprecise. Although we believe these estimates are reasonable, actual future production, cash flows, taxes, development expenditures, operating expenses and quantities of recoverable oil and natural gas reserves may vary substantially from these estimates. |
| 2 | Totals of estimated proved reserves, PV-10 Value and Pro Forma Standardized Measure exclude values from our Southwest Region properties which are classified as Held for Sale on our Consolidated Balance Sheet at December 31, 2008. |
| 3 | We converted crude oil and NGLs to Mcf equivalent at a ratio of one barrel to six Mcfe. |
| 4 | Represents the present value, discounted at 10% annum (PV-10), of estimated future cash flows before income tax of our estimated proved reserves. The estimated future cash flows set forth above were determined by using reserve quantities of proved reserves and the periods in which they are expected to be developed and produced based on prevailing economic conditions. The estimated future production is priced based on the 12-month unweighted arithmetic average of the first-day-of-the-month price for the period January through December 2010, using $76.03 per barrel of oil, $31.71 per barrel of NGLs and $4.567 per MMBtu of natural gas, adjusted by lease for transportation fees and regional price differentials. Management believes that the presentation of the non-GAAP financial measure of PV-10 provides useful information to investors because it is widely used by professional analysts and sophisticated investors in evaluating oil and natural gas companies. For an explanation of why we show PV-10 and a reconciliation of PV-10 to the standardized measure of discounted future net cash flow, please read “Item 6. Selected Historical Financial and Operating Data—Non-GAAP Financial Measures.” Please also read “Item 1A. Risk Factors—Our estimated reserves are based on many assumptions that may turn out to be inaccurate. Any significant inaccuracies in these reserve estimates or underlying assumptions may materially affect the quantities and present value of our reserves.” |
35
Table of Contents
Proved Undeveloped Reserves (PUDs)
As of December 31, 2010, our proved undeveloped reserves totaled 3.5 MMBOE of NGLs and 95.1 Bcf of natural gas, for a total of 116.4 Bcfe. All of our PUDs at year-end 2010 were associated with the Appalachian Basin, and more specifically the Marcellus Shale. All of these projects will have PUDs convert from undeveloped to developed as these projects begin production and/or production facilities are expanded or upgraded. Changes in PUDs that occurred during the year were due to:
| • | conversion of approximately 22.8 Bcfe attributable to PUDs into proved developed reserves; |
| • | downward revisions of approximately 17.2 Bcfe in PUDs due to the removal of conventional oil PUDs in the Illinois Basin and conventional gas PUDs in the Appalachian Basin. We do not intend to drill these locations within the next five years due to a shift in focus to unconventional recovery methods; |
| • | decrease of approximately 11.8 Bcfe due to our joint venture transaction with Sumitomo; and |
| • | 114.0 Bcfe in PUDs due to extensions and discoveries, which are primarily related to the extension of proved acreage in areas that are prospective for the Marcellus Shale through our drilling activities. During 2010, we drilled approximately 13.0 gross (7.0 net) Marcellus Shale wells that were not considered proved in addition to 14.0 gross (8.0 net) Marcellus Shale wells that were classified as PUDs as of December 31, 2009. |
Costs incurred relating to the development of 14 PUDs to proved developed were approximately $25.8 million in 2010. Estimated future development costs relating to the development of our 59 PUDs are projected to be approximately $43.4 million in 2011, $44.5 million in 2012, $39.5 million in 2013, $25.6 million in 2014, and $0 in 2015.
All PUD drilling locations are scheduled to be drilled prior to the end of 2015, including approximately 30% of the total in 2011. Initial production from these PUDs is expected to begin between 2011 to 2016. We do not have PUDs associated with reserves that have been booked for longer than five years. Approximately 15.0 gross (8.3 net) PUDs were booked using reliable technology.
The following table summarizes the changes in our proved undeveloped reserves for the year ended December 31, 2010:
| Proved Undeveloped Reserves (Mcfe) |
For the Year Ended December 31, 2010 |
|||
| Beginning proved undeveloped reserves |
57,320,994 | |||
| Undeveloped reserves converted to developed |
(22,826,998 | ) | ||
| Revisions |
(20,249,679 | ) | ||
| Sales of minerals in place |
(11,837,370 | ) | ||
| Extensions and discoveries |
114,000,000 | |||
| Ending proved undeveloped reserves |
116,406,947 | |||
Reserve Estimation
Netherland, Sewell & Associates, Inc. (“NSAI”), an independent petroleum engineering firm, evaluated our reserves on a consolidated basis as of December 31, 2010. At December 31, 2010, these consultants collectively reviewed all of our proved reserves. A copy of the summary reserve report is included as Exhibit 99.1 to this Annual Report on Form 10-K. The technical persons responsible for preparing our proved reserves estimates meet the requirements with regards to qualifications, independence, objectivity and confidentiality set forth in the Standards Pertaining to the Estimating and Auditing of Oil and Gas Reserves Information promulgated by the Society of Petroleum Engineers. Our independent third-party engineers do not own an interest in any of our properties and are not employed by us on a contingent basis.
36
Table of Contents
We maintain an internal staff of petroleum engineers and geoscience professionals who work closely with NSAI to ensure the integrity, accuracy and timeliness of the data used to calculate our proved reserves. Our internal technical team members meet with NSAI periodically throughout the year to discuss the assumptions and methods used in the proved reserve estimation process. We provide historical information to NSAI for our properties such as ownership interest; oil and gas production; well test data; commodity prices and operating and development costs. The preparation of our proved reserve estimates are completed in accordance with our internal control procedures, which include documented process workflows, the verification of input data used by NSAI, as well as extensive management review and approval.
All of our reserve estimates are reviewed and approved by our Director, Reservoir Engineering and our Chief Operating Officer. Our Director, Reservoir Engineering holds a Bachelor of Science degree in Petroleum Engineering from the University of Texas at Austin with more than six years of experience in preparing reserve reports under the guidelines of the SEC with Cano Petroleum. Our Chief Operating Officer holds a Bachelor of Science degree in Petroleum Engineering from the University of Wyoming and an M.B.A. from Pepperdine University, with nearly 25 years of experience working for companies such as Cano Petroleum, Pioneer Natural Resources and Union Pacific Resources.
Acreage and Productive Wells Summary
The following table sets forth, for our continuing operations, our gross and net acreage of developed and undeveloped oil and natural gas leases and our gross and net productive oil and natural gas wells as of December 31, 2010:
| Undeveloped Acreage1 |
Developed Acreage2 |
Total Acreage | Producing Gas Wells |
Producing Oil Wells |
||||||||||||||||||||||||||||||||||||
| Gross | Net | Gross | Net | Gross | Net | Gross | Net | Gross | Net | |||||||||||||||||||||||||||||||
| Appalachian Basin |
||||||||||||||||||||||||||||||||||||||||
| Pennsylvania |
85,600 | 47,929 | 53,116 | 21,235 | 138,716 | 69,164 | 461 | 3 | 205 | 3 | — | — | ||||||||||||||||||||||||||||
| Illinois Basin |
||||||||||||||||||||||||||||||||||||||||
| Illinois |
454 | 384 | 47,811 | 23,436 | 48,265 | 23,820 | — | — | 1,154 | 4 | 1,145 | 4 | ||||||||||||||||||||||||||||
| Indiana |
763 | 617 | 11,643 | 10,223 | 12,406 | 10,840 | — | — | 211 | 206 | ||||||||||||||||||||||||||||||
| Kentucky |
— | — | 2,065 | 502 | 2,065 | 502 | — | — | — | — | ||||||||||||||||||||||||||||||
| Total Illinois Basin |
1,217 | 1,001 | 61,519 | 34,161 | 62,736 | 35,162 | — | — | 1,365 | 1,351 | ||||||||||||||||||||||||||||||
| DJ Basin |
||||||||||||||||||||||||||||||||||||||||
| Wyoming |
44,181 | 30,998 | — | — | 44,181 | 30,998 | — | — | — | — | ||||||||||||||||||||||||||||||
| Colorado |
21,245 | 14,000 | — | — | 21,245 | 14,000 | — | — | — | — | ||||||||||||||||||||||||||||||
| Total DJ Basin |
65,426 | 44,998 | — | — | 65,426 | 44,998 | — | — | — | — | ||||||||||||||||||||||||||||||
| Total |
152,243 | 93,928 | 114,635 | 55,396 | 266,878 | 149,324 | 461 | 205 | 1,365 | 1,351 | ||||||||||||||||||||||||||||||
| (1) | Undeveloped acreage is lease acreage on which wells have not been drilled or completed to a point that would permit the production of commercial quantities of oil and natural gas, regardless of whether such acreage includes proved reserves. |
| (2) | Developed acreage is the number of acres allocated or assignable to producing wells or wells capable of production. |
| (3) | In addition, we own royalty interests in approximately 135 natural gas wells in the Appalachian Basin. |
| (4) | In addition, we own royalty interests in approximately 111 oil wells in the Illinois Basin. |
Substantially all of the undeveloped leases summarized in the preceding table will expire at the end of their respective primary terms unless the existing lease is renewed, we have commenced the necessary operations
37
Table of Contents
required by the terms of the lease, or obtained actual production from acreage subject to the lease; in which event, the lease will remain in effect until the cessation of production.
The following table sets forth, for our continuing operations, the gross and net acres of undeveloped land subject to leases summarized in the preceding table that will expire during the periods indicated:
| Expiring Acreage | ||||||||
| Gross | Net | |||||||
| Year Ending December 31, |
||||||||
| 2011 |
11,794 | 3,780 | ||||||
| 2012 |
9,296 | 6,870 | ||||||
| 2013 |
44,377 | 21,064 | ||||||
| 2014 |
25,728 | 17,199 | ||||||
| Thereafter |
51,336 | 34,970 | ||||||
| Total |
142,531 | 83,883 | ||||||
Drilling Results
The following table summarizes our drilling activity for the past three years. Gross wells reflect the sum of all wells in which we own an interest. Net wells reflect the sum of our working interests in gross wells. All of our drilling activities are conducted on a contract basis by independent drilling contractors. We own four workover rigs which are used in our Illinois Basin operations. We do not own any drilling equipment.
| 2010 | 2009 | 2008 | ||||||||||||||||||||||
| Gross | Net | Gross | Net | Gross | Net | |||||||||||||||||||
| Development: |
||||||||||||||||||||||||
| Illinois Basin1 |
14.0 | 10.9 | 23.0 | 23.0 | 38.0 | 37.9 | ||||||||||||||||||
| Appalachian Basin |
14.0 | 8.0 | 1.0 | 1.0 | 18.0 | 16.2 | ||||||||||||||||||
| DJ Basin |
— | — | — | — | — | — | ||||||||||||||||||
| Non-Productive |
1.0 | 1.0 | — | — | — | — | ||||||||||||||||||
| Total Developmental Wells |
29.0 | 19.9 | 24.0 | 24.0 | 56.0 | 54.1 | ||||||||||||||||||
| Exploratory: |
||||||||||||||||||||||||
| Illinois Basin |
— | — | — | — | — | — | ||||||||||||||||||
| Appalachian Basin |
13.0 | 7.0 | 6.0 | 3.0 | 8.0 | 7.0 | ||||||||||||||||||
| DJ Basin |
4.0 | 3.5 | — | — | — | — | ||||||||||||||||||
| Non-Productive |
— | — | 1.0 | 1.0 | — | — | ||||||||||||||||||
| Total Exploratory Wells |
17.0 | 10.5 | 7.0 | 4.0 | 8.0 | 7.0 | ||||||||||||||||||
| Total Wells |
46.0 | 30.4 | 31.0 | 28.0 | 64.0 | 61.1 | ||||||||||||||||||
| Success Ratio2 |
96.0 | % | 94.2 | % | 96.8 | % | 96.4 | % | 100.0 | % | 100.0 | % | ||||||||||||
| 1 | Does not include wells drilled for our ASP project. |
| 2 | Success ratio is calculated by dividing the total successful wells drilled, less any wells awaiting completion as of December 31, 2010, divided by the total wells drilled, less any wells awaiting completion as of December 31, 2010. As of December 31, 2010, we had 21.0 gross (13.1 net) wells awaiting completion related to wells drilled in 2010. These wells primarily relate to active projects in the Appalachian and DJ Basin and are expected to be completed and producing in 2011. |
Title to Properties
We believe that we have satisfactory title to all of our producing properties in accordance with generally accepted industry standards. As is customary in the industry, in the case of undeveloped properties, often minimal investigation of record title is made at the time of lease acquisition. A more comprehensive mineral title
38
Table of Contents
opinion review, a topographic evaluation and infrastructure investigations are made before the consummation of an acquisition of producing properties and before commencement of drilling operations on undeveloped properties. Individual properties may be subject to burdens that we believe do not materially interfere with the use or affect the value of the properties. Burdens on properties may include:
| • | customary royalty interests; |
| • | liens incident to operating agreements and for current taxes; |
| • | obligations or duties under applicable laws; |
| • | development obligations under oil and gas leases; |
| • | net profit interests; |
| • | overriding royalty interests; |
| • | non-surface occupancy leases; and |
| • | lessor consents to placement of wells. |
| ITEM 3. | LEGAL PROCEEDINGS |
The information set forth in Note 23, Litigation, in the notes to our Consolidated Financial Statements included in Item 8 of Part II of this report is incorporated herein by reference.
| ITEM 4. | RESERVED |
39
Table of Contents
| ITEM 5. | MARKET FOR COMMON EQUITY, RELATED STOCKHOLDER MATTERS AND ISSUER PURCHASES OF EQUITY SECURITIES |
We completed the initial public offering of our common stock in July 2007. Since that time, our common stock has been quoted on the NASDAQ Global Market under the symbol “REXX”. Before then, there was no public market for our common stock. As of March 2, 2011, there were approximately 74 holders of record of our common stock.
The following table sets forth, for the periods indicated, the range of the daily high and low sale prices for our common stock as reported by NASDAQ.
| 2010 |
High | Low | ||||||
| First Quarter |
$ | 15.39 | $ | 10.77 | ||||
| Second Quarter |
14.08 | 9.00 | ||||||
| Third Quarter |
12.89 | 8.62 | ||||||
| Fourth Quarter |
14.14 | 10.79 | ||||||
| 2009 |
High | Low | ||||||
| First Quarter |
$ | 4.37 | $ | 0.99 | ||||
| Second Quarter |
7.66 | 2.49 | ||||||
| Third Quarter |
8.58 | 4.02 | ||||||
| Fourth Quarter |
13.48 | 7.38 | ||||||
The closing price of our common stock at March 2, 2011 was $12.03.
Dividends
We have not paid cash dividends on our common stock since our inception in March 2007. We do not anticipate paying any dividends on the shares of our common stock in the foreseeable future. We currently intend to reinvest our earnings to finance the expansion of our business. In addition, the terms of our senior credit facility generally prohibit the payment of cash dividends to holders of our common stock.
Issuer Purchases of Equity Securities
We do not have a stock repurchase program for our common stock.
40
Table of Contents
Performance Graph
The following graph presents a comparison of the yearly percentage change in the cumulative total return on our common stock over the period from July 25, 2007, the date our common stock was first publicly traded, to December 31, 2010, with the cumulative total return of the S&P 500 index and the Dow Jones U.S. Oil and Gas Exploration and Production Index over the same period. The graph assumes that $100 was invested on July 25, 2007 in our common stock at the closing market price at the beginning of this period and in each of the other two indices, and the reinvestment of all dividends, if any. This historic stock price performance is not necessarily indicative of future stock performance.
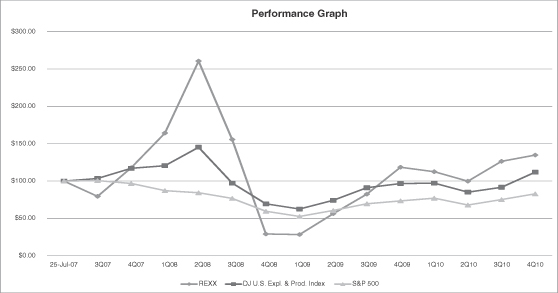
| S&P | DJ U.S. E&P Index |
Rex Energy | ||||||||||
| July 25, 2007 |
$ | 100 | $ | 100 | $ | 100 | ||||||
| December 31, 2007 |
$ | 97 | $ | 117 | $ | 118 | ||||||
| December 31, 2008 |
$ | 60 | $ | 69 | $ | 29 | ||||||
| December 31, 2009 |
$ | 73 | $ | 97 | $ | 118 | ||||||
| December 31, 2010 |
$ | 83 | $ | 112 | $ | 135 | ||||||
| * | The performance graph and the information contained in this section is not “soliciting material,” is being “furnished,” not “filed” with the SEC and is not to be incorporated by reference into any of our filings under the Securities Act or the Exchange Act, whether made before or after the date hereof, and irrespective of any general incorporation language contained in such filing. |
41
Table of Contents
| ITEM 6. | SELECTED FINANCIAL DATA |
Summary Financial Data
The following table shows selected consolidated and combined financial data of Rex Energy Corporation and the Predecessor Companies for each of the periods indicated. The historical consolidated financial data has been prepared for Rex Energy Corporation for the years ended December 31, 2010, 2009 and 2008. The historical combined financial data has been prepared for the Predecessor Companies for the years ended December 31, 2007 and 2006. The historical consolidated and combined financial statements for all years presented are derived from the historical audited financial data of Rex Energy Corporation and the Predecessor Companies. All material intercompany balances and transactions have been eliminated. Because each of the Predecessor Companies was taxed as a partnership for each of the periods indicated for federal and state income tax purposes, the following statements make no provision for income taxes for the year ended December 31, 2006 and the seven month period ended July 31, 2007. Provision for income tax is presented for the five month period ended December 31, 2007. This information should be read in conjunction with Item 7 of this report, “Management’s Discussion and Analysis of Financial Condition and Results of Operations,” and our Consolidated Financial Statements and related notes as of December 31, 2010 and 2009 and for each of the years ended December 31, 2010, 2009 and 2008, included elsewhere in this report. These selected combined historical financial results may not be indicative of our future financial or operating results.
42
Table of Contents
The following tables include the non-GAAP financial measure of EBITDAX. For a definition of EBITDAX and a reconciliation to its most directly comparable financial measure calculated and presented in accordance with GAAP, please see “Non-GAAP Financial Measures” below.
| Rex Energy Corporation Consolidated |
Rex Energy Corporation Consolidated |
Rex Energy Corporation Consolidated |
Rex Energy Corporation Consolidated & Combined Predecessor Companies |
Rex Energy Corporation Combined Predecessor Companies |
||||||||||||||||
| Year Ended December 31, ($ in Thousands, Except per Share Data) |
||||||||||||||||||||
| 2010 | 2009 | 2008 | 2007 | 2006 | ||||||||||||||||
| Statement of Operations Data: |
||||||||||||||||||||
| Operating Revenue: |
||||||||||||||||||||
| Oil and Natural Gas Sales |
$ | 67,224 | $ | 48,534 | $ | 84,013 | $ | 58,133 | $ | 38,800 | ||||||||||
| Other Revenue |
1,539 | 157 | 123 | 101 | 124 | |||||||||||||||
| Total Operating Revenue |
68,763 | 48,691 | 84,136 | 58,234 | 38,924 | |||||||||||||||
| Operating Expenses: |
||||||||||||||||||||
| Production and Lease Operating Expense |
24,656 | 22,157 | 26,511 | 22,361 | 14,084 | |||||||||||||||
| General and Administrative Expense |
17,923 | 15,858 | 15,185 | 7,793 | 5,594 | |||||||||||||||
| (Gain) Loss on Disposal of Assets |
(16,395 | ) | 427 | 6,468 | (12 | ) | (91 | ) | ||||||||||||
| Impairment Expense |
8,863 | 1,625 | 71,349 | — | — | |||||||||||||||
| Exploration Expense |
5,242 | 2,080 | 3,261 | 1,238 | — | |||||||||||||||
| Depreciation, Depletion, Amortization & Accretion |
21,806 | 25,205 | 37,904 | 17,804 | 8,871 | |||||||||||||||
| Other Operating Expense |
1,341 | — | — | — | — | |||||||||||||||
| Total Operating Expenses |
63,436 | 67,352 | 160,678 | 49,184 | 28,458 | |||||||||||||||
| Income (Loss) from Operations |
5,327 | (18,661 | ) | (76,542 | ) | 9,050 | 10,466 | |||||||||||||
| Other Income (Expense): |
||||||||||||||||||||
| Interest Income |
68 | 7 | 328 | 15 | 94 | |||||||||||||||
| Interest Expense |
(1,071 | ) | (833 | ) | (1,091 | ) | (5,665 | ) | (6,110 | ) | ||||||||||
| Gain (Loss) on Derivatives, Net |
6,055 | (7,913 | ) | 27,328 | (32,429 | ) | 607 | |||||||||||||
| Other Expense |
(321 | ) | (161 | ) | (114 | ) | (6 | ) | (132 | ) | ||||||||||
| Loss on Equity Method Investments |
(200 | ) | (9 | ) | (54 | ) | (12 | ) | — | |||||||||||
| Total Other Income (Expense) |
4,531 | (8,909 | ) | 26,397 | (38,097 | ) | (5,541 | ) | ||||||||||||
| Income (Loss) from Continuing Operations Before Income Tax |
9,858 | (27,570 | ) | (50,145 | ) | (29,047 | ) | 4,925 | ||||||||||||
| Income Tax Benefit (Expense) |
(4,075 | ) | 11,002 | 9,167 | 7,365 | — | ||||||||||||||
| Income (Loss) from Continuing Operations |
5,783 | (16,568 | ) | (40,978 | ) | (21,682 | ) | 4,925 | ||||||||||||
| Income (Loss) from Discontinued Operations, Net of Income Taxes |
— | 323 | (7,704 | ) | (681 | ) | 1,022 | |||||||||||||
| Net Income (Loss) |
5,783 | (16,245 | ) | (48,682 | ) | (22,363 | ) | 5,947 | ||||||||||||
| Net Income (Loss) Attributable to Noncontrolling Interests |
(253 | ) | (12 | ) | — | 6,152 | 2,133 | |||||||||||||
| Net Income (Loss) Attributable to Rex Energy |
$ | 6,036 | $ | (16,233 | ) | $ | (48,682 | ) | $ | (16,211 | ) | $ | 3,814 | |||||||
| Earnings per Common Share1 |
||||||||||||||||||||
| Basic—income (loss) from continuing operations attributable to Rex common shareholders |
$ | 0.14 | $ | (0.45 | ) | $ | (1.18 | ) | $ | (0.73 | ) | $ | — | |||||||
| Basic—income (loss) from discontinued operations attributable to Rex common shareholders |
— | 0.01 | (0.22 | ) | (0.02 | ) | — | |||||||||||||
| Basic—net income (loss) attributable to Rex common shareholders |
$ | 0.14 | $ | (0.44 | ) | $ | (1.40 | ) | $ | (0.75 | ) | $ | — | |||||||
| Basic—weighted average shares of common stock outstanding |
43,558 | 36,806 | 34,595 | 30,795 | — | |||||||||||||||
| Diluted—income (loss) from continuing operations attributable to Rex common shareholders |
$ | 0.14 | $ | (0.45 | ) | $ | (1.18 | ) | $ | (0.73 | ) | $ | — | |||||||
| Diluted—income (loss) from discontinued operations attributable to Rex common shareholders |
— | 0.01 | (0.22 | ) | (0.02 | ) | — | |||||||||||||
| Diluted—net income (loss) attributable to Rex common shareholders |
$ | 0.14 | $ | (0.44 | ) | $ | (1.40 | ) | $ | (0.75 | ) | $ | — | |||||||
| Diluted—weighted average shares of common stock outstanding |
43,670 | 36,806 | 34,595 | 30,795 | — | |||||||||||||||
43
Table of Contents
| 1 | Earnings per common share for 2007 represents a loss from continuing operations of $11,304 and a gain from discontinued operations of $664 for the 5 month period ended December 31, 2007. |
| Year Ended December 31, ($ in Thousands) |
||||||||||||||||||||
| 2010 | 2009 | 2008 | 2007 | 2006 | ||||||||||||||||
| Other Financial Data: |
||||||||||||||||||||
| EBITDAX from Continuing Operations |
$ | 26,294 | $ | 22,489 | $ | 29,095 | $ | 28,227 | $ | 12,545 | ||||||||||
| Cash Flow Data: |
||||||||||||||||||||
| Cash provided by operating activities |
17,315 | 20,774 | 32,428 | 17,555 | 12,920 | |||||||||||||||
| Cash used by investing activities |
(78,835 | ) | (30,061 | ) | (127,800 | ) | (40,102 | ) | (94,446 | ) | ||||||||||
| Cash provided by financing activities |
66,946 | 7,823 | 101,333 | 23,032 | 79,438 | |||||||||||||||
| Balance Sheet Data: |
||||||||||||||||||||
| Cash and Cash Equivalents |
11,008 | 5,582 | 7,046 | 1,085 | 600 | |||||||||||||||
| Property and Equipment (net of Accumulated Depreciation) |
323,796 | 275,261 | 249,858 | 191,171 | 117,309 | |||||||||||||||
| Total Assets |
407,085 | 304,950 | 302,006 | 268,264 | 144,611 | |||||||||||||||
| Current Liabilities, including current portion of Long-Term Debt |
63,337 | 32,411 | 17,353 | 20,612 | 53,684 | |||||||||||||||
| Long-Term Debt, net of current maturities |
10,120 | 23,049 | 15,000 | 27,207 | 45,442 | |||||||||||||||
| Total Liabilities |
102,409 | 84,753 | 70,158 | 103,827 | 108,639 | |||||||||||||||
| Noncontrolling Interests |
295 | 3,343 | — | — | 36,589 | |||||||||||||||
| Owners’ Equity |
304,676 | 220,197 | 231,848 | 164,437 | (617 | ) | ||||||||||||||
Summary Operating and Reserve Data
The following table summarizes our operating and reserve data as of and for each of the periods indicated for continuing operations. The table includes the non-GAAP financial measure of PV-10. For a definition of PV-10 and a reconciliation to the standardized measure of discounted future net cash flow, its most directly comparable financial measure calculated and presented in accordance with GAAP, please see “Non-GAAP Financial Measures” below.
| 2010 | 2009 | 2008 | ||||||||||
| Production |
||||||||||||
| Oil (Bbls) |
691,574 | 720,010 | 776,185 | |||||||||
| Natural gas (Mcf) |
3,088,598 | 1,510,500 | 1,036,891 | |||||||||
| NGLs (Bbls) |
25,559 | 7,750 | — | |||||||||
| Mcf equivalent (Mcfe) |
7,391,396 | 5,877,060 | 5,694,001 | |||||||||
| Oil and natural gas sales(a) |
||||||||||||
| Oil sales |
$ | 52,577 | $ | 41,881 | $ | 74,230 | ||||||
| Natural gas sales |
$ | 13,789 | $ | 6,460 | $ | 9,783 | ||||||
| NGLs sales |
$ | 858 | $ | 193 | $ | — | ||||||
| Total |
$ | 67,224 | $ | 48,534 | $ | 84,013 | ||||||
| Average sales price(a) |
||||||||||||
| Oil ($ per Bbl) |
$ | 76.03 | $ | 58.17 | $ | 95.63 | ||||||
| Natural gas ($ per Mcf) |
$ | 4.46 | $ | 4.28 | $ | 9.43 | ||||||
| NGLs ($ per Bbl) |
$ | 33.60 | $ | 24.90 | $ | — | ||||||
| Mcf equivalent ($ per Mcfe) |
$ | 9.10 | $ | 8.26 | $ | 14.75 | ||||||
| Average production cost |
||||||||||||
| Mcf equivalent ($ per Mcfe) |
$ | 3.34 | $ | 3.77 | $ | 4.66 | ||||||
| Estimated proved reserves(2) |
||||||||||||
| Bcf equivalent (Bcfe) |
201.7 | 125.2 | 66.0 | |||||||||
| % Oil |
24 | % | 49 | % | 53 | % | ||||||
| % Proved producing |
38 | % | 51 | % | 65 | % | ||||||
| PV-10 (millions) |
$ | 269.4 | $ | 190.5 | $ | 84.0 | ||||||
| Pro forma standardized measure (millions) |
$ | 188.1 | $ | 144.4 | $ | 68.9 | ||||||
44
Table of Contents
| (a) | Information excludes the impact of our financial derivative activities. |
| (b) | The estimates of reserves in the table above conform to the guidelines of the SEC. Estimated recoverable proved reserves have been determined without regard to any economic impact that may result from our financial derivative activities. These calculations were prepared using standard geological and engineering methods generally accepted by the petroleum industry. The estimated present value of proved reserves does not give effect to indirect expenses such as debt service and future income tax expense, asset retirement obligations, or to depletion, depreciation and amortization. The reserve information shown is estimated. The certainty of any reserve estimate is a function of the quality of available geological, geophysical, engineering and economic data, the precision of the engineering and geological interpretation, and judgment. The estimates of reserves, future cash flows and present value are based on various assumptions, and are inherently imprecise. Although we believe these estimates are reasonable, actual future production, cash flows, taxes, development expenditures, operating expenses and quantities of recoverable oil and natural gas reserves may vary substantially from these estimates. Also, the use of a 10% discount factor for reporting purposes may not necessarily represent the most appropriate discount factor, given actual interest rates and risks to which our business or the oil and natural gas industry in general are subject. |
Non-GAAP Financial Measures
We include in this report our calculations of EBITDAX and PV-10, which are non-GAAP financial measures. Below, we provide reconciliations of these non-GAAP financial measures to their most directly comparable financial measure as calculated and presented in accordance with GAAP.
EBITDAX
“EBITDAX” means, for any period, the sum of net income for such period plus the following expenses, charges or income to the extent deducted from or added to net income in such period: interest, income taxes, depreciation, depletion, amortization, unrealized losses from financial derivatives, exploration expenses and other non-cash charges, minus all non-cash income, including but not limited to, income from unrealized financial derivatives, added to net income. EBITDAX, as defined above, is used as a financial measure by our management team and by other users of our financial statements, such as our commercial bank lenders, to analyze such things as:
| • | Our operating performance and return on capital in comparison to those of other companies in our industry, without regard to financial or capital structure; |
| • | The financial performance of our assets and valuation of the entity without regard to financing methods, capital structure or historical cost basis; |
| • | Our ability to generate cash sufficient to pay interest costs, support our indebtedness and make cash distributions to our stockholders; and |
| • | The viability of acquisitions and capital expenditure projects and the overall rates of return on alternative investment opportunities. |
EBITDAX is not a calculation based on GAAP financial measures and should not be considered as an alternative to net income (loss) in measuring our performance, nor used as an exclusive measure of cash flow, because it does not consider the impact of working capital growth, capital expenditures, debt principal reductions, and other sources and uses of cash, which are disclosed in our statements of cash flows.
We have reported EBITDAX because it is a financial measure used by our existing commercial lenders, and we believe this measure is commonly reported and widely used by investors as an indicator of a company’s operating performance and ability to incur and service debt. You should carefully consider the specific items
45
Table of Contents
included in our computations of EBITDAX. While we have disclosed our EBITDAX to permit a more complete comparative analysis of our operating performance and debt servicing ability relative to other companies, you are cautioned that EBITDAX as reported by us may not be comparable in all instances to EBITDAX as reported by other companies. EBITDAX amounts may not be fully available for management’s discretionary use, due to requirements to conserve funds for capital expenditures, debt service and other commitments.
We believe EBITDAX assists our lenders and investors in comparing a company’s performance on a consistent basis without regard to certain expenses, which can vary significantly depending upon accounting methods. Because we may borrow money to finance our operations, interest expense is a necessary element of our costs and our ability to generate cash available for distribution. Because we use capital assets, depreciation and amortization are also necessary elements of our costs. Additionally, we are required to pay federal and state taxes, which are necessary elements of our costs. Therefore, any measures that exclude these elements have material limitations.
To compensate for these limitations, we believe it is important to consider both net income determined under GAAP and EBITDAX to evaluate our performance.
The following table presents a reconciliation of our net income to our EBITDAX for each of the periods presented:
| Year Ended December 31, (in thousands) |
||||||||||||||||||||
| 2010 | 2009 | 2008 | 2007 | 2006 | ||||||||||||||||
| Net Income (Loss) |
$ | 5,783 | $ | (16,568 | ) | $ | (40,978 | ) | $ | (21,682 | ) | $ | 4,925 | |||||||
| Add Back Depletion, Depreciation, Amortization and Accretion |
21,806 | 25,205 | 37,904 | 17,804 | 8,871 | |||||||||||||||
| Add Back Non-Cash Compensation Expense |
914 | 1,557 | 2,990 | 211 | — | |||||||||||||||
| Add Back Interest Expense1 |
1,781 | 1,602 | 1,342 | 5,646 | 6,110 | |||||||||||||||
| Add Back Exploration & Impairment Expense |
14,105 | 3,705 | 74,610 | 1,238 | — | |||||||||||||||
| Less Interest Income |
(68 | ) | (7 | ) | (328 | ) | (15 | ) | (94 | ) | ||||||||||
| Add Back (Gain) Loss on Disposal of Assets |
(16,395 | ) | 427 | 6,468 | (12 | ) | (91 | ) | ||||||||||||
| Add Back Unrealized (Gain) Loss on Financial Derivatives |
(5,960 | ) | 17,558 | (43,746 | ) | 26,250 | (5,043 | ) | ||||||||||||
| Add Back Noncontrolling Interest Share of Net Income (Loss) |
253 | 12 | — | 6,152 | (2,133 | ) | ||||||||||||||
| Add Back Income Tax Expense (Benefit) |
4,075 | (11,002 | ) | (9,167 | ) | (7,365 | ) | — | ||||||||||||
| EBITDAX from Continuing Operations |
26,294 | 22,489 | 29,095 | 28,227 | 12,545 | |||||||||||||||
| Add EBITDAX from Discontinued Operations |
— | 53 | 3,652 | 3,021 | 3,374 | |||||||||||||||
| EBITDAX |
$ | 26,294 | $ | 22,542 | $ | 32,747 | $ | 31,248 | $ | 15,919 | ||||||||||
| 1 | Includes realized settlements on interest rate swap. |
PV-10
The following table shows the reconciliation of PV-10 to our pro forma standardized measure of discounted future net cash flows, the most directly comparable measure calculated and presented in accordance with GAAP. PV-10 represents our estimate of the present value, discounted at 10% per annum, of estimated future cash flows before income tax of our estimated proved reserves. Our estimated future cash flows as of December 31, 2008, 2009 and 2010 were determined by using reserve quantities of proved reserves and the periods in which they are expected to be developed and produced based on the prevailing economic conditions. The estimated future production is priced at December 31, 2008, without escalation, using $41.00 per Bbl of oil and $5.71 per MMBtu
46
Table of Contents
of natural gas, as adjusted by lease for transportation fees and regional price differentials. The estimated future production for the years ended December 31, 2009 and 2010, was priced based on the 12-month unweighted arithmetic average of the first-day-of-the-month price for the period January through December, without escalation, using $57.65 per Bbl and $76.03 per Bbl of oil, respectively, and $3.866 per MMBtu and $ 4.567 per MMBtu of natural gas, respectively, as adjusted by lease for transportation fees and regional price differentials. NGLs were priced at $57.65 per Bbl and $31.71 per Bbl for the years ended December 31, 2009 and 2010, respectively. Management believes that PV-10 provides useful information to investors because it is widely used by professional analysts and sophisticated investors in evaluating oil and natural gas companies. Because there are many unique factors that can impact an individual company when estimating the amount of future income taxes to be paid, we believe the use of a pre-tax measure is valuable for evaluating our company. PV-10 should not be considered as an alternative to the standardized measure of discounted future net cash flows as computed under GAAP.
| 2010 | 2009 | 2008 | ||||||||||
| Reconciliation of PV-10 to pro forma standardized measure (millions)(a) |
||||||||||||
| Pro forma standardized measure of discounted future net cash flows |
$ | 188.1 | $ | 144.4 | $ | 68.9 | ||||||
| Add: Present value of future income tax discounted at 10%(b) |
64.1 | 30.0 | — | |||||||||
| Add: Present value of future asset retirement obligations discounted at 10% |
17.2 | 16.1 | 15.1 | |||||||||
| PV-10 |
$ | 269.4 | $ | 190.5 | $ | 84.0 | ||||||
| (a) | Does not include values of our Southwest Region properties which are classified as Assets Held for Sale on our balance sheet. |
| (b) | At December 31, 2008, the tax basis of our assets exceeded the future cash flows of our oil and gas properties, which indicates that no future income taxes will be paid. Impairment testing was performed on our oil and gas properties at year end based on escalating future oil and natural gas prices. The standardized measure of discounted future net cash flows at December 31, 2008 was based on the year end SEC commodity prices, which are held constant for the life of the properties. |
47
Table of Contents
| ITEM 7. | MANAGEMENT’S DISCUSSION AND ANALYSIS OF FINANCIAL CONDITION AND RESULTS OF OPERATIONS |
The following discussion and analysis should be read in conjunction with “Item 6. Selected Financial Data” and the Consolidated Financial Statements and related notes included elsewhere in this report. This discussion contains forward-looking statements reflecting our current expectations and estimates, and assumptions concerning events and financial trends that may affect our future operating results or financial position. Actual results and the timing of events may differ materially from those contained in these forward-looking statements due to a number of factors, including those discussed in the sections entitled “Cautionary Note Regarding Forward-Looking Statements” and “Item 1A. Risk Factors” appearing elsewhere in this report. All financial and operating data presented are the results of continuing operations unless otherwise noted.
Overview of Our Business
We are an independent oil and gas company operating in the Appalachian Basin, the Illinois Basin and the Denver-Julesburg (“DJ”) Basin. In the Appalachian Basin, we are focused on our Marcellus Shale drilling projects. In the Illinois Basin, in addition to our developmental conventional oil drilling, we are focused on the implementation of enhanced oil recovery on our properties. Our focus in the DJ Basin has been on acquiring acreage which we believe to be prospective for horizontal oil well drilling in the Niobrara formation. We pursue a balanced growth strategy of pursuing our higher potential exploration drilling prospects and actively seeking to acquire complementary oil and natural gas properties.
We are headquartered in State College, Pennsylvania, and have regional offices in Bridgeport, Illinois, Butler, Pennsylvania and Englewood, Colorado.
Our financial results depend upon many factors, particularly the price of oil and gas. Commodity prices are affected by changes in market demand, which is impacted by overall economic activity, weather, refinery or pipeline capacity constraints, inventory storage levels, basis differentials and other factors. As a result, we cannot accurately predict future oil and gas prices, and therefore, we cannot determine what effect increases or decreases will have on our capital program, production volumes and future revenues. In addition to production volumes and commodity prices, finding and developing sufficient amounts of oil and gas reserves at economical costs are critical to our long-term success.
On September 30, 2010, we entered into a joint venture agreement with Sumitomo. In accordance with the agreement, we sold a 15% non-operated interest in our Butler County, Pennsylvania project area. In accordance with the Sumitomo PEA, Sumitomo also agreed to lease an additional 9,000 acres in this project area. Upon conclusion of the leasing arrangement, the ownership percentages will be approximately 70% to us and 30% to Sumitomo. In addition to our Butler County, Pennsylvania project area, we also sold a 20% non-operated interest in our joint venture area with Williams (discussed below) and a 50% non-operated interest in undeveloped acreage in Fayette and Centre Counties, Pennsylvania. At closing, we received approximately $99.5 million in cash, which included a reimbursement for leasing expenses incurred subsequent to the effective date of September 1, 2010, in the amount of $7.6 million, and a reimbursement for drilling related expenses incurred subsequent to the effective date in the amount of approximately $7.5 million. As a part of the joint venture agreement, Sumitomo agreed to pay 80% of our net drilling and completion expenses up to approximately $58.8 million. For additional information on the transaction with Sumitomo, see Note 3, Business and Oil and Gas Property Acquisitions and Dispositions, to our Consolidated Financial Statements.
During the second quarter of 2009, we entered into a joint venture agreement with Williams. In accordance with the agreement, we sold a 50% working interest in certain oil and gas leases in Centre, Clearfield and Westmoreland Counties, Pennsylvania through a “drill-to-earn” structure. For Williams to earn its 50% interest they must bear 90% of all costs and expenses incurred in the drilling and completion of all wells jointly drilled until such time Williams has invested approximately $74.0 million (approximately $33.0 million on behalf of us and $41.0 million for Williams’ 50% share of the wells). As of December 31, 2010, Williams had completed its
48
Table of Contents
carry obligation and acquired their 50% working interest. Subsequent to the joint venture agreement with Sumitomo, the ownership percentages are approximately 50% to Williams, 40% to us and 10% to Sumitomo . For additional information on the transaction with Williams, see Note 3, Business and Oil and Gas Property Acquisitions and Dispositions, to our Consolidated Financial Statements.
In March 2009, we completed the sale of certain oil and gas leases, wells and related assets predominantly located in the Permian Basin in the states of Texas and New Mexico. We received net cash proceeds of approximately $17.3 million. We have reclassified these assets and associated liabilities as “held for sale” on our Consolidated Balance Sheets and have reported the results of operations under discontinued operations on our Consolidated Statements of Operations. Total revenues for these properties for the years ended December 31, 2008, 2009 and 2010 were $6.4 million, $0.2 million and $0, respectively. As of December 31, 2009 and 2010, we had no Assets Held for Sale or Liabilities Related to Assets Held for Sale on our Consolidated Balance Sheets.
Source of Our Revenue
We generate our revenue primarily from the sale of crude oil to refining companies and natural gas to local distribution and pipeline companies. Our operating revenue before the effects of financial derivatives from these operations, and their relative percentages of our total revenue, consisted of the following:
| 2010 | % of Total | 2009 | % of Total | 2008 | % of Total | |||||||||||||||||||
| Sources of Revenue ($ in thousands): |
||||||||||||||||||||||||
| Revenue from Oil Sales |
$ | 52,577 | 76.5 | % | $ | 41,881 | 86.0 | % | $ | 74,230 | 88.3 | % | ||||||||||||
| Revenue from Natural Gas Sales |
13,789 | 20.1 | % | 6,460 | 13.3 | % | 9,783 | 11.6 | % | |||||||||||||||
| Revenue from NGL Sales |
858 | 1.2 | % | 193 | 0.4 | % | — | 0.0 | % | |||||||||||||||
| Other |
1,539 | 2.2 | % | 157 | 0.3 | % | 123 | 0.1 | % | |||||||||||||||
| Total |
$ | 68,763 | 100.0 | % | $ | 48,691 | 100.0 | % | $ | 84,136 | 100.0 | % | ||||||||||||
We have identified the impact of generally volatile commodity prices in the last several years as an important trend that we expect to affect our business in the future. If commodity prices increase, we would expect not only an increase in revenue, but also the competitive environment for quality drilling prospects, qualified geological and technical personnel and oil field services, including rig availability. Increasing competition in these areas would likely result in higher costs in these areas, and could result in unavailability of drilling rigs, thus affecting the profitability of our future operations. We may not be able to compete successfully in the future with larger competitors in acquiring prospective reserves, developing reserves, marketing hydrocarbons, attracting and retaining quality personnel and raising additional capital. In the event of a declining commodity price environment, our revenues would decrease and we would anticipate that the cost of materials and services would decrease as well, although at a slower rate. Decreasing oil or natural gas prices may also make some of our prospects uneconomical to drill.
Principal Components of Our Cost Structure
Our operating and other expenses consist of the following:
| • | Production and Lease Operating Expenses. Day-to-day costs incurred to bring hydrocarbons out of the ground and to the market together with the daily costs incurred to maintain our producing properties. Such costs also include workovers, repairs to our oil and gas properties not covered by insurance, and various production taxes that are paid based upon rates set by federal, state, and local taxing authorities. |
| • | General and Administrative Expense. Overhead, including payroll and benefits for our corporate staff, costs of maintaining our headquarters and regional offices, costs of managing our production and development operations, audit and other professional fees, and legal compliance are included in general and administrative expense. General and administrative expense includes non-cash stock-based compensation expense as part of employee compensation. |
49
Table of Contents
| • | Exploration Expense. Geological and geophysical costs, seismic costs, delay rentals and the costs of unsuccessful exploratory wells, also known as dry holes. |
| • | Interest. We typically finance a portion of our working capital requirements and acquisitions with borrowings under our senior credit facility. As a result, we incur substantial interest expense that is affected by both fluctuations in interest rates and our financing decisions. We may continue to incur significant interest expense as we continue to grow. |
| • | Depreciation, Depletion, Amortization and Accretion. The systematic expensing of the capital costs incurred to acquire, explore and develop natural gas and oil. As a successful efforts company, we capitalize all costs associated with our acquisition and development efforts and all successful exploration efforts, and apportion these costs to each unit of production through depreciation, depletion and amortization expense. This also includes the systematic, monthly accretion of the future abandonment costs of tangible assets such as platforms, wells, service assets, pipelines, and other facilities. |
| • | Income Taxes. We are subject to state and federal income taxes but are currently not in a tax paying position for regular federal income taxes, primarily due to the current deductibility of intangible drilling costs (“IDC”). We do pay some state income taxes where our IDC deductions do not exceed our taxable income or where state income taxes are determined on another basis. Currently, all of our federal taxes are deferred; however, at some point, we believe we will use all of our net operating loss carryforwards and we believe we will recognize current income tax expense and continue to recognize current tax expense as long as we are generating taxable income. |
How We Evaluate Our Operations
Our management uses a variety of financial and operational measurements to analyze our performance. These measurements include EBITDAX (a non-GAAP measure), lease operating expenses per Mcf equivalent (“Mcfe”), growth in our proved reserve base, and general and administrative expenses per Mcfe. The following table presents these metrics for continuing operations for each of the three years ended December 31, 2010, 2009 and 2008.
| Performance Measurements | ||||||||||||
| Years Ended December 31, | ||||||||||||
| 2010 | 2009 | 2008 | ||||||||||
| EBITDAX ($ in thousands) |
$ | 25,294 | $ | 22,489 | $ | 29,095 | ||||||
| Production Cost per Mcfe |
$ | 3.34 | $ | 3.77 | $ | 4.66 | ||||||
| Total Proved Reserves (Bcfe) |
201.7 | 125.2 | 66.0 | |||||||||
| G&A per Mcfe |
$ | 2.42 | $ | 2.70 | $ | 2.67 | ||||||
EBITDAX
“EBITDAX,” a non-GAAP measure, means, for any period, the sum of net income for such period plus the following expenses, charges or income to the extent deducted from or added to net income in such period: interest, income taxes, depreciation, depletion, amortization, unrealized losses from financial derivatives, exploration expenses and other non-cash charges, minus all non-cash income, including but not limited to, income from unrealized financial derivatives, added to net income. EBITDAX, as defined above, is used as a financial measure by our management team and by other users of our financial statements, such as our commercial bank lenders, to analyze such things as:
| • | Our operating performance and return on capital in comparison to those of other companies in our industry, without regard to financial or capital structure; |
50
Table of Contents
| • | The financial performance of our assets and valuation of the entity, without regard to financing methods, capital structure or historical cost basis; |
| • | Our ability to generate cash sufficient to pay interest costs, support our indebtedness and make cash distributions to our stockholders; and |
| • | The viability of acquisitions and capital expenditure projects and the overall rates of return on alternative investment opportunities. |
Production Cost per Mcfe
Production costs are comprised of those expenses which are directly attributable to our producing oil and gas leases, including state and county production taxes, production related insurance, the cost of materials, maintenance, electricity, chemicals, fuel and the wages of our field personnel. Our production costs per Mcfe are higher than those of many of our peers primarily because of the nature of our oil properties, many of which are mature waterflood properties. Our production cost per Mcfe produced in 2010 was $3.34 as compared to $3.77 in 2009 and $4.66 in 2008. As we continue to develop our non-proved properties, such as the Marcellus Shale, we believe this metric will continue to decrease on a per unit basis.
Growth in our Proved Reserve Base
We measure our ability to grow our proved reserves over the amount of our total annual production. As we produce oil and gas attributable to our proved reserves, our proved reserves decrease each year by that amount of production. We attempt to replace these produced proved reserves each year through the addition of new proved reserves through our drilling and other property improvement projects and through acquisitions. Our proved reserves have fluctuated since 2008, from 66.0 Bcfe at year end 2008 to 125.2 Bcfe at year end 2009 to 201.7 Bcfe at year end 2010. Our reserve replacement ratio for year end 2008 was approximately 328% based on total production for the year of 5.7 Bcfe, purchases of reserves of 1.0 Bcfe, and extensions, discoveries and other additions of 17.7 Bcfe. Our reserve replacement ratio for year end 2009 was approximately 410% based on total production for the year of 5.9 Bcfe, and extensions, discoveries and other additions of 24.1 Bcfe. Our reserve replacement ratio for year end 2010 was approximately 1,559% based on total production for the year of 7.3 Bcfe, and extensions, discoveries and other additions of 98.2 Bcfe.
Our proved reserve base increased in 2010 when compared to 2009 predominately due to our successful drilling and exploration programs in the Marcellus Shale and the increase in oil prices used for the reserves determination. As of December 31, 2010, we removed all proved undeveloped locations related to our conventional drilling opportunities in the Illinois and Appalachian Basins from our proved reserve totals, which is in compliance with SEC rules requiring a high degree of confidence that the quantities related to proved undeveloped reserves will be recovered and they are scheduled to be drilled within the next five years. Our proved reserve base in the Marcellus Shale increased by approximately 169%, while our proved reserves in the Illinois Basin decreased by 21%.
General and Administrative Expenses per Mcfe
Our general and administrative expenses include fees for well operating services, marketing, non-field level employee compensation and related benefits, office and lease expenses, insurance costs and professional fees, as well as other costs and expenses not directly related to field operations. Our management continually evaluates the level of our general and administrative expenses in relation to our production because these expenses have a direct impact on our profitability. In 2010 our general and administrative expenses per Mcfe produced decreased to $2.42 from $2.70 in 2009 and from $2.67 in 2008. As we continue to develop our properties, we believe this metric will continue to decrease on a per unit basis.
51
Table of Contents
Results of Continuing Operations
General Overview
Operating revenue increased 41.2% for 2010 over 2009. This increase is primarily due to higher average sales prices per Mcfe throughout the year and an increase in natural gas production, partially offset by decreased oil production. For 2010, total production increased 25.8% to 7,391 MMcfe from 5,877 MMcfe in 2009 due to the continued success of our drilling programs, primarily in the Marcellus Shale.
Operating expenses decreased $3.9 million in 2010, or 5.8%, as compared to 2009. Operating expenses are primarily composed of production expenses, general and administrative expenses, gain (loss) on disposal of assets, exploration expenses, impairment of oil and gas properties and depreciation, depletion, amortization and accretion expenses (“DD&A”). These decreases were primarily due to a $16.0 million gain recognized on the sale of certain oil and gas properties and equipment in connection with our joint venture transaction with Sumitomo in addition to lower DD&A expenses, which is attributable to the increase in our proved reserves resulting in a deceleration of our units-of-production calculation. These decreases were partially offset by increases in impairment expense and exploration expenses. The impairment expense incurred during 2010 was primarily attributable to two gas properties which we determined that the carrying value was not recoverable and exceeded their fair value. The exploration expenses incurred are primarily attributable to seismic activities taking place within our Appalachian Basin and DJ Basin operations.
Comparison of the Year Ended December 31, 2010 to the Year Ended December 31, 2009
Oil and gas revenue for the years ended December 31, 2010 and 2009 is summarized in the following table:
| December 31, | ||||||||||||||||
| 2010 | 2009 | Change | % | |||||||||||||
| Oil and Gas Revenue ($ in thousands): |
||||||||||||||||
| Oil sales revenue |
$ | 52,577 | $ | 41,881 | $ | 10,696 | 25.5 | % | ||||||||
| Oil derivatives realized(a) |
(3,861 | ) | 2,626 | (6,487 | ) | (247.0 | %) | |||||||||
| Total oil revenue and derivatives realized |
$ | 48,716 | $ | 44,507 | $ | 4,209 | 9.5 | % | ||||||||
| Gas sales revenue |
$ | 13,789 | $ | 6,460 | $ | 7,329 | 113.5 | % | ||||||||
| Gas derivatives realized |
4,667 | 3,216 | 1,451 | 45.1 | % | |||||||||||
| Total gas revenue and derivatives realized |
$ | 18,456 | $ | 9,676 | $ | 8,780 | 90.7 | % | ||||||||
| Total NGL revenue |
$ | 858 | $ | 193 | $ | 665 | 344.6 | % | ||||||||
| Consolidated sales |
$ | 67,224 | $ | 48,534 | $ | 18,690 | 38.5 | % | ||||||||
| Consolidated derivatives realized |
806 | 5,842 | (5,036 | ) | (86.2 | %) | ||||||||||
| Total oil and gas revenue and derivatives realized |
$ | 68,030 | $ | 54,376 | $ | 13,654 | 25.1 | % | ||||||||
| Total Mcfe production |
7,391,396 | 5,877,060 | 1,514,336 | 25.8 | % | |||||||||||
| Average realized price per Mcfe, including the effects of derivatives |
$ | 9.20 | $ | 9.25 | $ | (0.05 | ) | (0.5 | %) | |||||||
| (a) | 2009 oil derivatives realized excludes approximately $4.6 million in proceeds that were received upon the early settlement of oil hedges relating to the 2011 calendar year. |
Average realized price received for oil and gas during 2010 was $9.20 per Mcfe, a decrease of 0.5%, or $0.05 per Mcfe, from the prior year. The average realized price for oil, including the effects of derivatives, in 2010 increased 14.0% or $8.63 per barrel, whereas the average realized price for natural gas, including the effects of derivatives, decreased 6.8%, or $0.43 per Mcf, from 2009. Our derivative activities effectively increased net realized prices by $0.11 per Mcfe in 2010 and $0.99 per Mcfe in 2009.
52
Table of Contents
Production volume for 2010 increased 25.8% from 2009 primarily due to the success of our Marcellus Shale horizontal drilling plan in the Appalachian Basin, where production increased approximately 108%, or 1.7 Bcfe. Our production for 2010 averaged approximately 20,250 Mcfe per day of which 56.1% was attributable to the Illinois Basin and 43.9% to the Appalachian Basin.
Other Revenue for 2010 of approximately $1.5 million increased $1.4 million, or 880%, from 2009. During 2010, we entered into a joint venture that specializes in the sourcing and transportation of water in the Marcellus Shale regions of the Appalachian Basin. Revenues earned by this joint venture, Water Solutions Holdings, LLC, of which we own 80%, have been classified as Other Revenue and did not exist prior to 2010.
Production and Lease Operating Expense increased approximately $2.5 million, or 11.3%, in 2010 from 2009. The increase in expense is primarily due to seasonal repair and maintenance work being performed in our Illinois Basin operations. These repair and maintenance activities were delayed during 2009 due, in part, to periods of depressed oil prices during the year. Also contributing to our higher production expenses during the year was the continued expansion of our Marcellus Shale operations, where we began to incur costs to transport and process our natural gas in our Butler County, Pennsylvania project area. Lease operating expense per Mcfe decreased approximately 11.4% from 2009 to $3.34 per Mcfe in 2010, which is the result of our increased production.
General and Administrative Expense of approximately $17.9 million for 2010 increased approximately $2.1 million, or 13.0%, from 2009. These expenses increased from 2009 to 2010 primarily due to expenses recognized with respect to Water Solutions Holdings, LLC, for which we fully consolidate the results of operations. This entity did not begin operations until December 2009. We have also incurred additional G&A expenses in connection with the operations of our Englewood, Colorado office, which opened during the first quarter 2010, legal expenses incurred in connection with the Sumitomo transaction, recruiting and relocation expenses associated with the hiring of certain executives and senior management, and an increase in our overall headcount.
(Gain) Loss on Disposal of Assets for 2010 was a gain of approximately $16.4 million as compared to a loss $0.4 million for 2009. We, from time to time, sell or otherwise dispose of certain fixed assets and wells that are no longer effectively used by us, and a gain or loss may be recognized when such an asset is sold. The gain in 2010 is primarily due to the Sumitomo joint venture transaction while the loss incurred during 2009 was a result of the disposal of our Southwest Region assets.
Impairment Expense increased to $8.9 million in 2010 from $1.6 million in 2009. We evaluate impairment of our properties when events occur that indicate that the carrying value of these properties may not be recoverable. During 2010, we determined that the carrying value of two of our test wells, which were in various stages of drilling and completion, in Clearfield County, Pennsylvania, were not recoverable due to a lack of a sales outlet and no current plans by us to complete the wells for commercial production. The capitalized costs associated with properties that are outside of our current scope of operations are periodically evaluated as to their recoverability based on changes brought about by economic factors and potential shifts in our business strategy. As economic and strategic conditions change and we continue to develop unproved properties, our estimates of impairment will likely change and we may increase or decrease expense.
Exploration Expense of oil and gas properties for 2010 increased approximately $3.2 million from $2.1 million in 2009. The increase during 2010 was predominantly due to seismic operations and geophysical evaluations and modeling being performed in the DJ Basin.
Depletion, Depreciation, Amortization and Accretion Expense of approximately $21.8 million for 2010 decreased approximately $3.4 million, or 13.5%, from 2009. This decrease can be primarily explained by the upward revision in the estimated lives of our proved reserves. We calculate our depletion on a units-of-production basis, which decelerated in relation to our higher proved reserves base.
53
Table of Contents
Other Operating Expense for 2010 totaled approximately $1.3 million. These costs are comprised of operating expenses incurred in connection with Water Solutions Holdings, LLC, a subsidiary of which we own 80% and fully consolidate the results of operations. These expenses are related to the operations of our water sourcing and water transportation business in the Marcellus Shale regions of the Appalachian Basin. This entity did not have operating expense prior to 2010.
Interest Expense, net of Interest Income, for 2010 was approximately $1.0 million as compared to $0.8 million for 2009. The increase in interest expense, net of interest income, was primarily due to our higher average outstanding balance on our Senior Credit Facility.
Gain (Loss) on Derivatives, net for 2010 was a gain of approximately $6.1 million as compared to a loss of $7.9 million for 2009. This change is attributed to the volatility of oil and gas commodity prices in the marketplace along with changes in our portfolio of outstanding collars and swap derivatives. Losses from derivative activities generally reflect higher oil and gas prices in the marketplace than were in effect at the time we entered into a derivative contract, while gains would suggest the opposite. Our derivative program is designed to provide us with greater reliability of future cash flows at expected levels of oil and gas production volumes given the highly volatile oil and gas commodities market.
Other Expense increased by $0.2 million to approximately $0.3 million in 2010. The increase in Other Expense is primarily attributable to expenses incurred in connection with ensuring the pipeline integrity of a gathering system contributed to our Keystone Midstream joint venture, of which we are the 28% owner. The expenditures are not expected to continue beyond 2010.
Net Income (Loss) Attributable to Rex Energy for 2010 was income of approximately $6.0 million, as compared to a net loss of approximately $16.2 million for 2009 as a result of the factors discussed above.
Comparison of the Year Ended December 31, 2009 to the Year Ended December 31, 2008
Oil and gas revenue for the years ended December 31, 2009 and 2008 is summarized in the following table:
| December 31, | ||||||||||||||||
| 2009 | 2008 | Change | % | |||||||||||||
| Oil and Gas Revenue ($ in thousands): |
||||||||||||||||
| Oil sales revenue |
$ | 41,881 | $ | 74,230 | (32,349 | ) | (43.6 | %) | ||||||||
| Oil derivatives realized(a) |
2,626 | (15,613 | ) | 18,239 | 116.8 | % | ||||||||||
| Total oil revenue and derivatives realized |
$ | 44,507 | $ | 58,617 | (14,110 | ) | (24.1 | %) | ||||||||
| Gas sales revenue |
$ | 6,460 | $ | 9,783 | (3,323 | ) | (34.0 | %) | ||||||||
| Gas derivatives realized |
3,216 | (554 | ) | 3,770 | 680.5 | % | ||||||||||
| Total gas revenue and derivatives realized |
$ | 9,676 | $ | 9,229 | 447 | 4.8 | % | |||||||||
| Total NGL revenue |
$ | 193 | $ | — | 193 | 100.0 | % | |||||||||
| Consolidated sales |
$ | 48,534 | $ | 84,013 | (35,479 | ) | (42.2 | %) | ||||||||
| Consolidated derivatives realized |
5,842 | (16,167 | ) | 22,009 | 136.1 | % | ||||||||||
| Total oil and gas revenue and derivatives realized |
$ | 54,376 | $ | 67,846 | (13,470 | ) | (19.9 | %) | ||||||||
| Total Mcfe production |
5,877,060 | 5,694,001 | 183,059 | 3.2 | % | |||||||||||
| Average realized price per Mcfe, including the effects of derivatives |
$ | 9.25 | $ | 11.92 | (2.67 | ) | (22.4 | %) | ||||||||
| (a) | 2009 oil derivatives realized excludes approximately $4.6 million in proceeds that were received upon the early settlement of oil hedges relating to the 2011 calendar year. |
Average realized price received for oil and gas during 2009 was $9.25 per Mcfe, a decrease of 22.4%, or $2.67 per Mcfe, from the prior year. The average realized price for oil, including the effects of derivatives, in
54
Table of Contents
2009 decreased 18.1% or $13.70 per barrel, whereas the average realized price for natural gas, including the effects of derivatives, decreased 28.0%, or $2.49 per Mcf, from 2008. Our derivative activities effectively increased net realized prices by $0.99 per Mcfe in 2009 and decreased net realized prices by $2.84 per Mcfe in 2008.
Production volume increased 3.2% from 2008 primarily due to continued success or our Marcellus Shale horizontal drilling plan in the Appalachian Basin where production increased approximately 50.4%, or 523 MMcfe. Our production for 2009 averaged approximately 16,102 Mcfe per day of which 73.5% was attributable to the Illinois Basin and 26.5% to the Appalachian Basin.
Other Revenue for 2009 of approximately $157,000 increased $34,000, or 27.6%, from 2008. These revenues were generated from various activities such as revenue from the transportation of natural gas and well tending.
Production and Lease Operating Expense decreased approximately $4.4 million, or 16.4%, in 2009 from 2008. The decrease in expense can be partially attributed to lower activity levels in our Illinois Basin operations throughout 2009. We also implemented several cost reduction measures in an effort to mitigate discretionary spending and to lower overall operating expenses.
General and Administrative Expense of approximately $15.9 million for 2009 increased approximately $0.7 million, or 4.4%, from 2008. The year-over-year increase is primarily attributable to legal expenses, which have increased due to accruals associated with the pending actions related to our Marcellus Shale leasing activities as well as the accruals associated with a Settlement Agreement and Release entered into in December 2009 to settle a class action lawsuit.
(Gain) Loss on Disposal of Assets for 2009 was approximately $0.4 million as compared to $6.5 million for 2008. We, from time to time, sell or otherwise dispose of certain fixed assets and wells that are no longer effectively used by us, and a gain or loss may be recognized when such an asset is sold. The loss incurred in 2008 is primarily due to the sale of our New Albany Shale acreage holdings in areas of the Illinois Basin.
Impairment Expense decreased to $1.6 million in 2009 from $71.3 million in 2008. We evaluate impairment of our properties when events occur that indicate that the carrying value of these properties may not be recoverable. During 2008, we determined that, due to the decrease in oil and natural gas prices, the carrying value of some of our properties was not recoverable and exceeded their fair value. During 2009, the recoverability of our properties improved as oil prices increased and we continued to drill successful horizontal wells in areas where the Marcellus Shale is prospective. We did, however, identify certain geographic regions that are outside the scope of our current plans, which has increased the probability of future lease expirations. The capitalized costs associated with these properties are periodically evaluated as to their recoverability based on changes brought about by economic factors and potential shifts in our business strategy. As economic and strategic conditions change and we continue to develop unproved properties, our estimates of impairment will likely change and we may increase or decrease expense.
Exploration Expense of oil and gas properties for 2009 decreased approximately $1.2 million from $3.3 million in 2008. During 2008, we incurred higher expenses due to geological modeling in our Lawrence Field ASP Project. Our expense associated with geophysical evaluation and modeling associated with our Marcellus Shale activities decreased in 2009 due, in part, to our joint venture with Williams as we shared the cost of these activities on an equal basis.
Depletion, Depreciation, Amortization and Accretion Expense of approximately $25.2 million for 2009 decreased approximately $12.7 million, or 33.5%, from 2008. This decrease can be primarily explained by the upward revision in the estimated lives of our proved reserves. We calculate our depletion on a units-of-production basis, which decelerated in relation to our higher proved reserves base.
55
Table of Contents
Interest Expense, net of interest income, for 2008 and 2009 was approximately $0.8. During 2009 there were slight variations in cash on hand, for which we receive interest income.
Gain (Loss) on Derivatives, net for 2009 was a loss of approximately $7.9 million as compared to a gain of $27.3 million for 2008. This change is attributed to the volatility of oil and gas commodity prices in the marketplace along with changes in our portfolio of outstanding collars and swap derivatives. Unrealized losses from derivative activities generally reflect higher oil and gas prices in the marketplace than were in effect at the time we entered into a derivative contract, while unrealized gains would suggest the opposite. Our derivative program is designed to provide us with greater reliability of future cash flows at expected levels of oil and gas production volumes given the highly volatile oil and gas commodities market.
Other Expense increased by $2,000 to approximately $170,000 in 2009. The change is primarily due to the recognition of gains and losses on the sale of scrap inventory.
Net Income (Loss) Attributable to Rex Energy for 2009 was approximately $16.2 million, as compared to a net loss of approximately $48.7 million for 2008 as a result of the factors discussed above.
Capital Resources and Liquidity
Our primary financial resource is our base of oil and gas reserves. We grant security interests in our producing oil and gas properties to a group of banks to secure our senior credit facility. The banks establish a borrowing base by making an estimate of the collateral value of our oil and gas properties. We borrow funds on our senior credit facility as needed to supplement our operating cash flow and as a financing source for our capital expenditure program. Our ability to fund our capital expenditure program is dependent upon the level of product prices and the success of our exploration program in replacing our existing oil and gas reserves. If product prices decrease, our operating cash flow may decrease and the banks may require additional collateral or reduce our borrowing base, thus reducing funds available to fund our capital expenditure program. The effects of product prices on cash flow can be mitigated through the use of commodity derivatives. If we are unable to replace our oil and gas reserves through our acquisitions, development or exploration programs, we may also suffer a reduction in our operating cash flow and access to funds under the senior credit facility. Under extreme circumstances, product price reductions or exploration drilling failures could allow the banks to seek to foreclose on our oil and gas properties, thereby threatening our financial viability.
Our cash flow from operations is driven by commodity prices and production volumes. Prices for oil and gas are driven by, among other things, seasonal influences of weather, national and international economic and political environments and, increasingly, from heightened demand for hydrocarbons from emerging nations. Our working capital is significantly influenced by changes in commodity prices, and significant declines in prices could decrease our exploration and development expenditures. Cash flows from operations and borrowings from our senior credit facility have been primarily used to fund exploration and development of our oil and gas interests. As of December 31, 2010, we had $115.0 million available for borrowing under our senior credit facility of $125.0 million.
In addition, we have utilized two joint venture agreements with Sumitomo and Williams to supplement our capital outlay to assist in sustaining our growth prospects. Through the Williams PEA, Williams agreed to fund approximately $33.0 million of drilling and completion expenses on behalf of us in our Westmoreland and Clearfield Counties, Pennsylvania project areas. Through the Sumitomo PEA, we received approximately $99.5 million in cash in addition to approximately $58.8 million in drilling expenses to be funded by Sumitomo in our Butler County, Pennsylvania project area, our Williams joint venture project areas and our Fayette and Centre Counties, Pennsylvania project areas.
56
Table of Contents
Financial Condition and Cash Flows for the Years Ended December 31, 2010, 2009 and 2008
The following table summarizes our sources and uses of funds for the periods noted:
| For the Years Ended
December 31, ($ in Thousands) |
||||||||||||
| 2010 | 2009 | 2008 | ||||||||||
| Cash flows provided by operating activities |
$ | 17,315 | $ | 20,774 | $ | 32,428 | ||||||
| Cash flows used in investing activities |
(78,835 | ) | (30,061 | ) | (127,800 | ) | ||||||
| Cash flows provided by financing activities |
66,946 | 7,823 | 101,333 | |||||||||
| Net increase (decrease) in cash and cash equivalents |
$ | 5,426 | $ | (1,464 | ) | $ | 5,961 | |||||
Net cash provided by operating activities decreased by approximately $3.5 million in 2010 when compared to 2009, to $17.3 million. In 2010, cash flows decreased primarily due to the receipt of approximately $4.6 million in 2009 related to the early settlement of certain oil derivatives that were originally scheduled to be settled in 2011. In addition, we experienced higher costs related to production and lease operating expenses and general and administrative expenses. Partially offsetting these declines in operating cash flows was higher natural gas production.
Net cash used in investing activities increased by approximately $48.8 million in 2010 when compared to 2009, to $78.8 million. During 2009, we took a conservative approach to our investing activities, whereby we decreased our normal development activities and put more focus on our more strategic projects, such as Marcellus Shale exploration. During 2010, our investment activity increased as we expanded our exploration of the Marcellus Shale and the Niobrara formation. Partially offsetting our expenditures in 2010 were proceeds received upon the closing of our joint venture with Sumitomo, where we received cash in exchange for a partial interest in wells, acreage and other equipment.
Net cash provided by financing activities increased by approximately $59.1 million in 2010 when compared to 2009, to $66.9 million. During 2010, we received net proceeds from the issuance of common stock of approximately $80.2 million. This increase in cash flow was partially offset by net repayments of long-term debt of approximately $13.0 million in 2010 as compared to net proceeds in 2009 of approximately $8.0 million.
Capital Requirements
Our primary needs for cash are for exploration, development and acquisition of oil and gas properties and repayment of principal and interest on outstanding debt. During 2010, $150.4 million of capital, which excludes our joint venture investments, was expended on drilling projects, facilities and related equipment and acquisitions to purchase unproved acreage. The capital program was funded by net cash flows from operations, proceeds from borrowings, proceeds of disposed assets and our public offering of common stock in January 2010. The 2011 capital budget of $148.7 million is expected to be funded primarily by cash flows from operations, joint ventures, non-core assets sales and proceeds from borrowings. To the extent capital requirements exceed internal cash flows, debt or equity may be issued to fund these requirements.
Despite the ongoing problems and uncertainties existing in the credit and capital markets, we currently believe we have sufficient liquidity and cash flow to meet our obligations for the next twelve months from existing cash balances, anticipated cash flow from operating activities and remaining borrowing capacity under our senior credit facility; however, a drop in oil and gas prices or a reduction in production or reserves could adversely affect our ability to fund capital expenditures and meet our financial obligations. Also, our obligations may change due to acquisitions, divestitures and continued growth. We may issue additional shares of stock, subordinated notes or other securities to fund capital expenditures, acquisitions, to extend maturities or to repay debt.
57
Table of Contents
Effects of Inflation and Changes in Price
Our results of operations and cash flows are affected by changing oil and natural gas prices. If the price of oil and natural gas increases or decreases, there could be a corresponding increase or decrease in our operating costs, as well as an increase or decrease in revenues. Inflation has had a minimal effect on us.
Critical Accounting Policies and Recent Accounting Pronouncements
The preparation of financial statements in conformity with United States generally accepted accounting principles (“GAAP”) requires management to make estimates and assumptions that affect the reported amounts of assets and liabilities and disclosures of contingencies at the date of the consolidated financial statements, and the reported amounts of revenues and expenses during the periods reported. Actual results could differ from these estimates.
Significant estimates include volumes of oil and natural gas reserves used in calculating depletion of proved oil and natural gas properties, future cash flows, asset retirement obligations, impairment (when applicable) of undeveloped properties, the collectability of outstanding accounts receivable, fair values of financial derivative instruments, contingencies and the results of current and future litigation. Oil and natural gas estimates, which are the basis for units-of-production depletion, have numerous inherent uncertainties. The certainty of any reserve estimates is a function of the quality of available data and of engineering and geological interpretation and judgment. Subsequent drilling results, testing and production may justify revision of such estimates. Accordingly, reserve estimates are often different from the quantities of oil and natural gas that are ultimately recovered. In addition, reserve estimates are vulnerable to changes in wellhead prices of crude oil and natural gas. These prices have been volatile in the past and can be expected to be volatile in the future.
The significant estimates are based on current assumptions that may be materially affected by changes in future economic conditions such as the market prices received for sales of oil and natural gas, interest rates, and our ability to generate future income. Future changes in these assumptions may materially affect these significant estimates in the near term.
Natural Gas and Oil Reserve Quantities
Our estimate of proved reserves is based on the quantities of oil and natural gas that engineering and geological analyses demonstrate, with reasonable certainty, to be recoverable from established reservoirs in the future under current operating and economic parameters. For the years ended December 31, 2010 and 2009, Netherland Sewell and Associates, Inc. (“NSAI”) prepared a consolidated reserve and economic evaluation of our proved oil and gas reserves. These engineers were selected for their geographic expertise and their historical experience in engineering certain properties. The technical persons responsible for preparing our proved reserves estimates meet the requirements with regards to qualifications, independence, objectivity and confidentiality set forth in the Standards Pertaining to the Estimating and Auditing of Oil and Gas Reserves Information promulgated by the Society of Petroleum Engineers. Our independent third-party engineers do not own an interest in any of our properties and are not employed by us on a contingent basis. The preparation of our proved reserve estimates are completed in accordance with our internal control procedures, which include the verification of input data used by NSAI, as well as intense management review and approval.
Reserves and their relation to estimated future net cash flows impact our depletion and impairment calculations. As a result, adjustments to depletion and impairment are made concurrently with changes to reserve estimates. Estimates of our crude oil and natural gas reserves, and the projected cash flows derived from these reserve estimates, are prepared by our engineers in accordance with guidelines established by the SEC, including the rule revisions designed to modernize the oil and gas company reserves reporting requirements and which we adopted effective December 31, 2009. Reservoir engineering is a subjective process of estimating underground accumulations of crude oil and natural gas. There are numerous uncertainties inherent in estimating quantities of proved crude oil and natural gas reserves. The certainty of our reserve estimates is a function of many factors,
58
Table of Contents
including the quality and quantity of available data, the interpretation of that data, the accuracy of various mandated economic assumptions, and the judgments of the individuals preparing the estimates. Any of the assumptions inherent in these factors could deviate significantly from actual results. As such, reserve estimates may materially vary from the ultimate quantities of natural gas and oil eventually recovered. The independent reserve engineer estimates reserves annually on December 31. This annual estimate results in a new DD&A rate, which we use for the preceding fourth quarter after adjusting for fourth quarter production.
Derivative Instruments
We use put and call options (collars), fixed rate swap contracts and put options to manage price risks in connection with the sale of oil and natural gas. We have also used interest rate swap agreements to manage interest rate risks associated with our variable rate credit facility. We have established the fair value of all derivative instruments using estimates determined by our counterparties and other third party providers. These values are based upon, among other things, future prices, volatility, time to maturity and credit risk. The values we report in our consolidated financial statements change as these estimates are revised to reflect actual results, changes in market conditions or other factors.
We report our derivative instruments at fair value and include them in the Consolidated Balance Sheets as assets or liabilities. The accounting for changes in fair value of a derivative instrument depends on the intended use of the derivative and the resulting designation, which is established at the inception of a derivative. We do not designate our derivatives as hedging instruments, therefore, any changes in fair value are recognized immediately in earnings.
Oil and Natural Gas Property, Depreciation and Depletion
We account for natural gas and oil exploration and production activities under the successful efforts method of accounting. Proved developed natural gas and oil property acquisition costs are capitalized when incurred. Unproved properties with individually significant acquisition costs are assessed periodically on a property-by-property basis and any impairment in value is recognized. If the unproved properties are determined to be productive, the appropriate related costs are transferred to proved natural gas and oil properties. Natural gas and oil exploration costs, other than the costs of drilling exploratory wells, are charged to expense as incurred. The costs of drilling exploratory wells are capitalized pending determination of whether they have discovered proved commercial reserves. If proved commercial reserves are not discovered, such drilling costs are expensed. Costs to develop proved reserves, including the costs of all development well and related equipment used in the production of natural gas and oil, are capitalized.
Depletion, depreciation and amortization are calculated using the units-of-production method on estimated proved developed producing oil and gas reserves at the unit, lease or well level. In arriving at rates under the units-of-production method, the quantities of recoverable oil and natural gas are established based on estimates made by our geologists and engineers and independent engineers. We periodically review our proved reserve estimates and make changes as needed to depletion, depreciation and amortization expenses to account for new wells drilled, acquisitions, divestitures and other events which may have caused significant changes in our estimated proved developed producing reserves. The costs of unproved properties are withheld from the depletion base until such time as they are either developed or abandoned. When proved reserves are assigned or the property is considered to be impaired, the cost of the property or the amount of the impairment is added to costs subject to depletion calculations. Non-producing properties consist of undeveloped leasehold cost and costs associated with the purchase of certain proved undeveloped reserves. Undeveloped leasehold cost is transferred to the associated producing properties. Individually significant non-producing properties are periodically assessed for impairment of value. Service properties, equipment and other assets are depreciated using the straight-line method over their estimated useful lives of three to 30 years.
When circumstances indicate that an asset may be impaired, we compare expected undiscounted future cash flows at a producing field to the unamortized capitalized cost of the asset. If the future undiscounted cash flows,
59
Table of Contents
based on our estimate of future natural gas and oil prices, operating costs, anticipated production from proved reserves and other relevant data, are lower than the unamortized capitalized cost, the capitalized cost is reduced to fair value. Fair value is calculated by discounting the future cash flows at an appropriate risk-adjusted discount rate. When evaluating our unproved oil and gas properties, we utilize active market prices for similar acreage to use as a comparison tool against the carrying value of our properties. If the active market prices for similar acreage do not support our carrying values we then utilize estimates of future value that will be created from the future development of these properties. If future estimated fair value of these properties is lower than the capitalized cost, the capitalized cost is reduced to the estimated future fair value. At December 31, 2010, we recognized approximately $8.9 million of impairment on certain oil and gas properties in the Appalachian Basin and Illinois Basin. We do not anticipate any violations of our debt covenants in the future, nor have we had any violations in the past.
Expenditures for repairs and maintenance to sustain or increase production from the existing producing reservoir are charged to expense as incurred. Expenditures to recomplete a current well are capitalized pending determination that economic reserves have been added. If the recompletion is not successful, the expenditures are charged to expense.
Significant tangible equipment added or replaced that extends the useful or productive life of the property is capitalized. Expenditures to construct facilities or increase the productive capacity from existing reservoirs are capitalized.
Upon the sale or retirement of a proved natural gas or oil property, or an entire interest in unproved leaseholds, the cost and related accumulated depreciation, depletion, and amortization are removed from the property accounts and the resulting gain or loss is recognized. For sales of a partial interest in unproved leaseholds for cash or cash equivalents, sales proceeds are first applied as a reduction of the original cost of the entire interest in the property, and any remaining proceeds are recognized as a gain.
Intangible Assets
At December 31, 2010, our intangible assets consisted of $1.4 million of sales agreements and loan costs that are amortized using the straight line method over their respective estimated useful lives, which is, on average, three to five years. We amortize any costs incurred to renew or extend the terms of existing intangible assets over the contract term or estimated useful life, as applicable, using the straight-line method. For the years ended December 31, 2010, 2009, and 2008, we recorded amortization expense of $0.5 million, $0.4 million and $0.4 million, respectively.
Future Abandonment Cost
Future abandonment costs are recognized as obligations associated with the retirement of tangible long-lived assets that result from the acquisition and development of the asset. We recognize the fair value of a liability for a retirement obligation in the period in which the liability is incurred. For natural gas and oil properties, this is the period in which the natural gas or oil well is acquired or drilled. The future abandonment cost is capitalized as part of the carrying amount of our natural gas and oil properties at its fair value. The liability is then accreted each period until the liability is settled or the natural gas or oil well is sold, at which time the liability is reversed. If the fair value of a recorded asset retirement obligation changes, a revision is recorded to both the asset retirement obligation and the asset retirement cost.
Deferred Taxes
We are subject to income and other taxes in all areas in which we operate. When recording income tax expense, certain estimates are required because income tax returns are generally filed several months after the close of a calendar year, tax returns are subject to audit which can take years to complete, and future events often
60
Table of Contents
impact the timing of when income tax expenses and benefits are recognized. We have deferred tax assets relating to tax operating loss carryforwards and other deductible differences. We routinely evaluate deferred tax assets to determine the likelihood of realization. A valuation allowance is recognized on deferred tax assets when we believe that certain of these assets are not likely to be realized.
We may be challenged by taxing authorities over the amount and/or timing of recognition of revenues and deductions in our various income tax returns. Although we believe that we have adequately provided for all taxes, gains or losses could occur in the future due to changes in estimates or resolution of outstanding tax matters.
Contingent Liabilities
A provision for legal, environmental and other contingent matters is charged to expense when the loss is probable and the cost or range of cost can be reasonably estimated. Judgment is often required to determine when expenses should be recorded for legal, environmental and contingent matters. In addition, we often must estimate the amount of such losses. In many cases, our judgment is based on the input of our legal advisors and on the interpretation of laws and regulations, which can be interpreted differently by regulators and/or the courts. We monitor known and potential legal, environmental and other contingent matters and make our best estimate of when to record losses for these matters based on available information. We have recognized an accrued liability of approximately $0.2 million at December 31, 2010 for the estimated cost of pending litigation matters.
Stock-based Compensation
We recognize in the Consolidated Financial Statements the cost of employee services received in exchange for awards of equity instruments based on the grant date fair value of those awards. We use a standard option pricing model (i.e. Black-Scholes) to measure the fair value of employee stock options and stock appreciation rights.
The benefits associated with the tax deductions in excess of recognized compensation cost are reported as a financing cash flow. This requirement reduces net operating cash flows and increases net financing cash flows. We recognize compensation costs related to awards with graded vesting on a straight-line basis over the requisite service period for each separately vesting portion of the award as if the award were, in-substance, multiple awards.
Recent Accounting Pronouncements
In December 2010, the Financial Accounting Standards Board (the “FASB”) issued Accounting Standards Update (“ASU”) 2010-29, Disclosure of Supplementary Pro Forma Information for Business Combinations (“ASU 2010-29”). The amendments to the codification clarify that if a public entity presents comparative financial statements, the entity should disclose revenue and earnings of the combined entity as though the business combination(s) that occurred during the current year had occurred as of the beginning of the comparable prior annual reporting period only. Additionally, the supplemental pro forma disclosures under Topic 805 have been expanded to include a description of the nature and amount of material, nonrecurring pro forma adjustments directly attributable to the business combination included in the reported pro forma revenue and earnings. The amendments in ASU 2010-29 are effective prospectively for business combinations for which the acquisition date is on or after the beginning of the first annual reporting period beginning on or after December 15, 2010. Although we have not entered into any significant business combinations in our recent history, we believe that ASU 2010-29 may have a material impact on future disclosures depending on the size and nature of any future business combinations that we may enter into. We adopted ASU 2010-29 on January 1, 2011.
In April 2009, the FASB issued Accounting Standards Codification (“ASC”) 805-20, which amends and clarifies ASC 805 to address application issues regarding initial recognition and measurement, subsequent measurement and accounting and disclosure of assets and liabilities arising from contingencies in a business
61
Table of Contents
combination. ASC 805-20 is effective for assets or liabilities arising from contingencies in business combinations for which the acquisition date is on or after the beginning of the first annual reporting period beginning on or after December 15, 2008. Although we did not enter into any significant business combinations during 2010, we believe ASC 805-20 may have a material impact on our future financial statements depending on the size and nature of any future business combinations that we may enter into. We adopted ASC 805-20 on January 1, 2010.
In June 2009, the FASB issued ASU 2009-17, Improvements to Financial Reporting by Enterprises Involved with Variable Interest Entities (“ASU 2009-17”), which was issued to improve financial reporting by enterprises involved with variable interest entities. This statement addresses the effects of certain provisions of FASB Interpretation No. 46(R) (“FIN 46(R)”) and constituent concerns about the application of certain key provisions of FIN 46(R), including those in which the accounting and disclosures do not always provide timely and useful information about an enterprise’s involvement in a variable interest entity. This statement takes effect as of the beginning of each reporting entity’s first annual reporting period that begins after November 15, 2009, for interim periods within that first annual reporting period and for interim reporting periods thereafter. We adopted ASU 2009-17 as of January 1, 2010. Adoption did not have a material effect on our financial position and results of operations.
In January 2010, the FASB issued ASU 2010-01, Equity: Accounting for Distributions to Shareholders with Components of Stock and Cash (“ASU 2010-01”). The amendments to the Codification in this ASU clarify that the stock portion of a distribution to shareholders that allows them to elect to receive cash or stock with a potential limitation on the total amount of cash that all shareholders can elect to receive in the aggregate is considered a share issuance that is reflected in earnings per share prospectively and is not a stock dividend. ASU 2010-01 is effective for interim and annual periods ending on or after December 15, 2009, and should be applied on a retrospective basis. We adopted ASU 2010-01 as of January 1, 2010. Adoption did not have a material effect on our financial position and results of operations.
In January 2010, the FASB issued ASU 2010-02, Consolidation—Accounting and Reporting for Decreases in Ownership of a Subsidiary—A Scope Clarification (“ASU 2010-02”). This ASU clarifies the scope of the decrease in ownership provisions of Subtopic 810-10 and expands the disclosure requirements about deconsolidation of a subsidiary or derecognition of a group of assets to include:
| • | The valuation techniques used to measure the fair value of any retained investment; |
| • | The nature of any continuing involvement with the subsidiary or entity acquiring the group of assets; and |
| • | Whether the transaction that resulted in the deconsolidation or derecognition was with a related party or whether the former subsidiary or entity acquiring the assets will become a related party after the transaction. |
ASU 2010-02 is effective beginning in the period that an entity adopts FASB Statement No. 160, Noncontrolling Interests in Consolidated Financial Statements—an amendment of ARB 51 (“SFAS 160”). If an entity has previously adopted SFAS 160, the amendments are effective beginning in the first interim or annual reporting period ending on or after December 15, 2009. The amendments in ASU 2010-02 should be applied retrospectively to the first period that an entity adopts SFAS 160. We adopted SFAS 160 on January 1, 2009, and subsequently adopted ASU 2010-02 on January 1, 2010. The adoption of this ASU did not have a material effect on our financial position and results of operations.
In January 2010, the FASB issued ASU 2010-06, Fair Value Measurements and Disclosures: Improving Disclosures about Fair Value Measurements (“ASU 2010-06”). This ASU requires additional disclosures and clarifies some existing disclosure requirements about fair value measurement as set forth in ASC 820-10 in order to increase the transparency in financial reporting.
ASU 2010-06 is effective for interim and annual reporting periods beginning after December 15, 2009, except for the disclosures about purchases, sales, issuances, and settlements in the roll forward of activity in
62
Table of Contents
Level 3 fair value measurements. Those disclosures are effective for fiscal years beginning after December 15, 2010, and for interim periods within those fiscal years. Early application is permitted. We adopted ASU 2010-06 on January 1, 2010, with no material effect on our financial position and results of operations.
In February 2010, the FASB issued ASU 2010-09, Subsequent Events: Amendments to Certain Recognition and Disclosure Requirements (“ASU 2010-09”). The amendments in this ASU define SEC filers as entities that are required to furnish its financial statements with the SEC or the appropriate agency under Section 12(i) of the Securities Exchange Act of 1934, as amended, and removes the requirement for such entities to disclose a date through which subsequent events have been evaluated in both issued and revised financial statements. Revised financial statements include financial statements revised as a result of either correction of an error or retrospective application of GAAP. The FASB also clarified that if the financial statements have been revised, then an entity that is not an SEC filer should disclose both the date that the financial statements were issued or available to be issued and the date the revised financial statements were issued or available to be issued. We adopted ASU 2010-09 on June 15, 2010, with no material effect on our financial position and results of operations.
Volatility of Oil and Natural Gas Prices
Our revenues, future rate of growth, results of operations, financial condition and ability to borrow funds or obtain additional capital, as well as the carrying value of our properties, are substantially dependent upon prevailing prices of oil and natural gas.
We account for our natural gas and oil exploration and production activities under the successful efforts method of accounting (for additional information, see Note 2, Summary of Significant Accounting Policies, of our Consolidated Financial Statements).
To mitigate some of our commodity price risk we engage periodically in certain other limited derivative activities, including price swaps and costless collars, to establish some price floor protection.
For the twelve-month period ended December 31, 2010, the net realized gain on oil and natural gas derivatives was approximately $0.8 million. For the twelve-month period ended December 31, 2009, the net realized gain on oil and natural gas derivatives was approximately $10.4 million, which includes a $4.6 million gain from the early settlement of oil hedges relating to the calendar year 2011. Gains and losses are reported as Gain (Loss) on Derivatives, net in the Consolidated Statements of Operations.
For the twelve month period ended December 31, 2010, the net unrealized gain on oil and natural gas derivatives was approximately $5.2 million, as compared to a net unrealized loss of approximately $18.0 million on oil and natural gas derivatives for 2009. The net unrealized gains and losses are reported as Gain (Loss) on Derivatives, net in the Consolidated Statements of Operations.
While the use of derivative arrangements limits the downside risk of adverse price movements, it may also limit our ability to benefit from increases in the prices of oil and natural gas. We enter into the majority of our derivative transactions with two counterparties and have a netting agreement in place with those counterparties. We do not obtain collateral to support the agreements, but we believe our credit risk is currently minimal on these transactions. Under these arrangements, payments are received or made based on the differential between a fixed and a variable commodity price. These agreements are settled in cash at expiration or exchanged for physical delivery contracts. In the event of nonperformance, we would be exposed again to price risk. We have additional risk of financial loss because the price received for the product at the actual physical delivery point may differ from the prevailing price at the delivery point required for settlement of the derivative transaction. Moreover, our derivative arrangements generally do not apply to all of our production, and thus provide only partial price protection against declines in commodity prices. We expect that the amount of our derivatives will vary from time to time.
63
Table of Contents
For a summary of our current oil and natural gas derivative positions at December 31, 2010, refer to Note 11, Fair Value of Financial Instruments and Derivative Instruments, of our Consolidated Financial Statements.
Contractual Obligations
In addition to our capital expenditure program, we are committed to making cash payments in the future on two types of contracts: note agreements and operating leases. As of December 31, 2010, we do not have any off-balance sheet debt or other such unrecorded obligations and we have not guaranteed the debt of any other party. The table below provides estimates of the timing of future payments that we are obligated to make based on agreements in place at December 31, 2010. In addition to the contractual obligations listed in the table below, our balance sheet at December 31, 2010 reflects accrued interest on our bank debt of $16,701 which was paid in January 2011.
The following summarizes our contractual financial obligations for continuing operations at December 31, 2010 and their future maturities. We expect to fund these contractual obligations with cash generated from operating activities.
| Payment due by period (in thousands) | ||||||||||||||||||||||||||||
| 2011 | 2012 | 2013 | 2014 | 2015 | Thereafter | Total | ||||||||||||||||||||||
| Bank Debt |
$ | — | $ | — | $ | 10,000 | $ | — | $ | — | $ | — | $ | 10,000 | ||||||||||||||
| Operating Leases |
480 | 459 | 463 | — | — | — | 1,402 | |||||||||||||||||||||
| Other Loans and Notes Payable |
829 | 120 | — | — | — | — | 949 | |||||||||||||||||||||
| Leasing Commitments |
1,707 | 3,710 | — | — | — | — | 5,417 | |||||||||||||||||||||
| Derivative Obligations(a) |
— | 67 | — | — | — | — | 67 | |||||||||||||||||||||
| Asset Retirement Obligations(b) |
599 | 622 | 577 | 496 | 533 | 14,395 | 17,222 | |||||||||||||||||||||
| Total Contractual Obligations |
$ | 3,615 | $ | 4,978 | $ | 11,040 | $ | 496 | $ | 533 | $ | 14,395 | $ | 35,057 | ||||||||||||||
| (a) | Derivative obligations represent net open derivative contracts valued as of December 31, 2010. |
| (b) | The ultimate settlement and timing cannot be precisely determined in advance. |
Interest Rates
At December 31, 2010, we had $10.0 million of debt outstanding. This bears interest at floating rates, which averaged 2.3% at December 31, 2010. The 30-day London Interbank Offered Rate (“LIBOR”) on December 31, 2010 was 0.3%.
Off-Balance Sheet Arrangements
We do not currently use any off-balance sheet arrangements to enhance our liquidity or capital resource position, or for any other purpose.
| ITEM 7A. | QUANTITATIVE AND QUALITATIVE DISCLOSURES ABOUT MARKET RISK |
We are exposed to various risks, including energy commodity price risk. We expect energy prices to remain volatile and unpredictable. If energy prices were to decrease for a substantial amount of time or decline significantly, revenues and cash flows would significantly decline, and our ability to borrow to finance our operations could be adversely impacted. Our financial condition, results of operations and capital resources are highly dependent upon the prevailing market prices of, and demand for, oil and natural gas. Conversely, increases in the market prices for oil and natural gas can have a favorable impact on our financial condition, results of operations and capital resources. Based on December 31, 2010 reserve estimates, we project that a 10% decline in the price per barrel of oil and the price per Mcf of gas from average 2010 prices would reduce our gross revenues, before the effects of derivatives, for the year ending December 31, 2011 by approximately $9.1 million.
64
Table of Contents
We have designed our hedging policy to reduce the risk of price volatility for our production in the natural gas and crude oil markets. Our risk management policy provides for the use of derivative instruments to manage these risks. The types of derivative instruments that we use include swaps and collars. The volume of derivative instruments that we may use are governed by the risk management policy and can vary from year to year, but under most circumstances will apply to only a portion of our current and anticipated production, and will provide only partial price protection against declines in oil and natural gas prices. We are exposed to market risk on our open contracts, to the extent of changes in market prices of oil and natural gas. However, the market risk exposure on these hedged contracts is generally offset by the gain or loss recognized upon the ultimate sale of the commodity that is hedged. Further, if our counterparties should default, this protection might be limited as we might not receive the benefits of the hedges.
At December 31, 2010, the following commodity derivative contracts were outstanding:
| Period(1) |
Volume | Put Option | Floor | Ceiling | Swap | Fair Market Value ($ in Thousands) |
||||||||||||||||||
| Oil |
||||||||||||||||||||||||
| 2011—Collar |
576,000 Bbls | $ | — | $ | 68.54 | $ | 104.69 | $ | — | $ | (1,850 | ) | ||||||||||||
| 2012—Collar |
540,000 Bbls | — | 67.10 | 112.03 | — | (1,365 | ) | |||||||||||||||||
| 1,116,000 Bbls | $ | (3,215 | ) | |||||||||||||||||||||
| Natural Gas |
||||||||||||||||||||||||
| 2011—Swap |
720,000 Mcf | $ | — | $ | — | $ | — | $ | 5.28 | $ | 519 | |||||||||||||
| 2011—Put Spread |
720,000 Mcf | 3.68 | 5.00 | — | — | 449 | ||||||||||||||||||
| 2011—Collar |
1,320,000 Mcf | — | 5.18 | 7.18 | — | 1,122 | ||||||||||||||||||
| 2011—Put |
720,000 Mcf | — | 8.00 | — | — | 2,464 | ||||||||||||||||||
| 2012—Swap |
1,320,000 Mcf | — | — | — | 5.58 | 663 | ||||||||||||||||||
| 2012—Collar |
1,320,000 Mcf | — | 5.09 | 7.07 | — | 635 | ||||||||||||||||||
| 6,120,000 Mcf | $ | 5,852 | ||||||||||||||||||||||
| (1) | Item 305(a) of Regulation S-K requires that tabular information relating to contract terms allow readers of the table to determine expected cash flows from the market risk sensitive instruments for each of the next five years. At December 31, 2010, we had commodity derivative contracts in place for the next two years, relating to production through 2012. |
We are also exposed to market risk related to adverse changes in interest rates. Our interest rate risk exposure results primarily from fluctuations in short-term rates, which are LIBOR and prime rate based, as determined by our lenders, and may result in reductions of earnings or cash flows due to increases in the interest rates we pay on our obligations. We have used, in the past, an interest rate swap agreement to manage risk associated with interest payments on amounts outstanding from variable rate borrowings under our senior credit facility. Under our interest rate swap agreement, we agreed to pay an amount equal to a specified rate of interest times a notional principal amount, and to receive in return, a specified variable rate of interest times the same notional principal amount. This swap expired in November 2010.
65
Table of Contents
| ITEM 8. | FINANCIAL STATEMENTS AND SUPPLEMENTARY DATA |
INDEX TO FINANCIAL STATEMENTS
66
Table of Contents
Report of Independent Registered Public Accounting Firm
To the Board of Directors and
Stockholders of
Rex Energy Corporation
State College, Pennsylvania
We have audited the accompanying consolidated balance sheets of Rex Energy Corporation as of December 31, 2010 and 2009, and the related consolidated statements of operations, owners’ equity and noncontrolling interests, and cash flows for each of the years in the three-year period ended December 31, 2010. We have also audited Rex Energy Corporation’s internal control over financial reporting as of December 31, 2010, based on criteria established in Internal Control—Integrated Framework issued by the Committee of Sponsoring Organizations of the Treadway Commission (COSO). Rex Energy Corporation’s management is responsible for these financial statements, for maintaining effective internal control over financial reporting, and for its assessment of the effectiveness of internal control over financial reporting, included in the accompanying Management’s Annual Report on Internal Control over Financial Reporting. Our responsibility is to express an opinion on these financial statements and an opinion on the company’s internal control over financial reporting based on our audits.
We conducted our audits in accordance with the standards of the Public Company Accounting Oversight Board (United States). Those standards require that we plan and perform the audits to obtain reasonable assurance about whether the financial statements are free of material misstatement and whether effective internal control over financial reporting was maintained in all material respects. Our audits of the financial statements included examining, on a test basis, evidence supporting the amounts and disclosures in the financial statements, assessing the accounting principles used and significant estimates made by management, and evaluating the overall financial statement presentation. Our audit of internal control over financial reporting included obtaining an understanding of internal control over financial reporting, assessing the risk that a material weakness exists, and testing and evaluating the design and operating effectiveness of internal control based on the assessed risk. Our audits also included performing such other procedures as we considered necessary in the circumstances. We believe that our audits provide a reasonable basis for our opinions.
A company’s internal control over financial reporting is a process designed to provide reasonable assurance regarding the reliability of financial reporting and the preparation of financial statements for external purposes in accordance with generally accepted accounting principles. A company’s internal control over financial reporting includes those policies and procedures that (1) pertain to the maintenance of records that, in reasonable detail, accurately and fairly reflect the transactions and dispositions of the assets of the company; (2) provide reasonable assurance that transactions are recorded as necessary to permit preparation of financial statements in accordance with generally accepted accounting principles, and that receipts and expenditures of the company are being made only in accordance with authorizations of management and directors of the company; and (3) provide reasonable assurance regarding prevention or timely detection of unauthorized acquisition, use, or disposition of the company’s assets that could have a material effect on the financial statements.
Because of its inherent limitations, internal control over financial reporting may not prevent or detect misstatements. Also, projections of any evaluation of effectiveness to future periods are subject to the risk that controls may become inadequate because of changes in conditions, or that the degree of compliance with the policies and procedures may deteriorate.
In our opinion, the financial statements referred to above present fairly, in all material respects, the consolidated financial position of Rex Energy Corporation as of December 31, 2010 and 2009, and the consolidated results of its operations and its cash flows for each of the years in the three-year period ended December 31, 2010 in conformity with accounting principles generally accepted in the United States of America. Also in our opinion, Rex Energy Corporation maintained, in all material respects, effective internal control over financial reporting as of December 31, 2010, based on criteria established in Internal Control—Integrated Framework issued by the Committee of Sponsoring Organizations of the Treadway Commission (COSO).
Malin, Bergquist & Company, LLP
Pittsburgh, Pennsylvania
March 3, 2011
67
Table of Contents
CONSOLIDATED BALANCE SHEETS
($ in Thousands, Except Per Share Data)
| December 31, 2010 | December 31, 2009 | |||||||
| ASSETS | ||||||||
| Current Assets |
||||||||
| Cash and Cash Equivalents |
$ | 11,008 | $ | 5,582 | ||||
| Accounts Receivable |
28,860 | 14,333 | ||||||
| Short-Term Derivative Instruments |
4,564 | 2,124 | ||||||
| Deferred Taxes |
— | 2,827 | ||||||
| Inventory, Prepaid Expenses and Other |
1,327 | 1,111 | ||||||
| Total Current Assets |
45,759 | 25,977 | ||||||
| Property and Equipment (Successful Efforts Method) |
||||||||
| Evaluated Oil and Gas Properties |
241,586 | 206,676 | ||||||
| Unevaluated Oil and Gas Properties |
91,574 | 80,218 | ||||||
| Other Property and Equipment |
42,226 | 25,082 | ||||||
| Wells and Facilities in Progress |
37,393 | 34,086 | ||||||
| Pipelines |
4,080 | 5,167 | ||||||
| Total Property and Equipment |
416,859 | 351,229 | ||||||
| Less: Accumulated Depreciation, Depletion and Amortization |
(93,063 | ) | (75,968 | ) | ||||
| Net Property and Equipment |
323,796 | 275,261 | ||||||
| Restricted Cash |
16,111 | 25 | ||||||
| Intangibles Assets and Other Assets—Net |
1,570 | 1,174 | ||||||
| Equity Method Investments |
18,399 | 840 | ||||||
| Long-Term Derivative Instruments |
1,450 | 1,673 | ||||||
| Total Assets |
$ | 407,085 | $ | 304,950 | ||||
| LIABILITIES AND EQUITY | ||||||||
| Current Liabilities |
||||||||
| Accounts Payable |
$ | 49,401 | $ | 16,386 | ||||
| Accrued Expenses |
10,168 | 9,333 | ||||||
| Short-Term Derivative Instruments |
1,860 | 6,692 | ||||||
| Current Deferred Tax Liability |
1,908 | — | ||||||
| Total Current Liabilities |
63,337 | 32,411 | ||||||
| Senior Secured Line of Credit and Long-Term Debt |
10,120 | 23,049 | ||||||
| Long-Term Derivative Instruments |
1,517 | 426 | ||||||
| Long-Term Deferred Tax Liability |
5,930 | 6,894 | ||||||
| Other Deposits and Liabilities |
4,283 | 5,830 | ||||||
| Future Abandonment Cost |
17,222 | 16,143 | ||||||
| Total Liabilities |
102,409 | 84,753 | ||||||
| Commitments and Contingencies (See Note 8) |
||||||||
| Owners’ Equity |
||||||||
| Common Stock, $.001 par value per share, 100,000,000 shares authorized and 44,306,677 shares issued and outstanding on December 31, 2010 and 36,817,812 shares issued and outstanding on December 31, 2009. |
44 | 37 | ||||||
| Additional Paid-In Capital |
373,856 | 292,372 | ||||||
| Accumulated Deficit |
(69,519 | ) | (75,555 | ) | ||||
| Rex Energy Owners’ Equity |
304,381 | 216,854 | ||||||
| Noncontrolling Interests |
295 | 3,343 | ||||||
| Total Owners’ Equity |
304,676 | 220,197 | ||||||
| Total Liabilities and Owners’ Equity |
$ | 407,085 | $ | 304,950 | ||||
See accompanying summary of accounting policies and notes to the financial statements
68
Table of Contents
CONSOLIDATED STATEMENTS OF OPERATIONS
($ and Shares in Thousands, Except Per Share Data)
| Rex Energy Corporation Consolidated |
Rex Energy Corporation Consolidated |
Rex Energy Corporation Consolidated |
||||||||||
| Year Ended December 31, | ||||||||||||
| 2010 | 2009 | 2008 | ||||||||||
| OPERATING REVENUE |
||||||||||||
| Oil and Natural Gas Sales |
$ | 67,224 | $ | 48,534 | $ | 84,013 | ||||||
| Other Revenue |
1,539 | 157 | 123 | |||||||||
| TOTAL OPERATING REVENUE |
68,763 | 48,691 | 84,136 | |||||||||
| OPERATING EXPENSES |
||||||||||||
| Production and Lease Operating Expense |
24,656 | 22,157 | 26,511 | |||||||||
| General and Administrative Expense |
17,923 | 15,858 | 15,185 | |||||||||
| (Gain) Loss on Disposal of Asset |
(16,395 | ) | 427 | 6,468 | ||||||||
| Impairment Expense |
8,863 | 1,625 | 71,349 | |||||||||
| Exploration Expense |
5,242 | 2,080 | 3,261 | |||||||||
| Depreciation, Depletion, Amortization and Accretion |
21,806 | 25,205 | 37,904 | |||||||||
| Other Operating Expense |
1,341 | — | — | |||||||||
| TOTAL OPERATING EXPENSES |
63,436 | 67,352 | 160,678 | |||||||||
| INCOME (LOSS) FROM OPERATIONS |
5,327 | (18,661 | ) | (76,542 | ) | |||||||
| OTHER INCOME (EXPENSE) |
||||||||||||
| Interest Income |
68 | 7 | 328 | |||||||||
| Interest Expense |
(1,071 | ) | (833 | ) | (1,091 | ) | ||||||
| Gain (Loss) on Derivatives, Net |
6,055 | (7,913 | ) | 27,328 | ||||||||
| Other Expense |
(321 | ) | (161 | ) | (114 | ) | ||||||
| Loss on Equity Method Investments |
(200 | ) | (9 | ) | (54 | ) | ||||||
| TOTAL OTHER INCOME (EXPENSE) |
4,531 | (8,909 | ) | 26,397 | ||||||||
| INCOME (LOSS) FROM CONTINUING OPERATIONS BEFORE INCOME TAX |
9,858 | (27,570 | ) | (50,145 | ) | |||||||
| Income Tax Benefit (Expense) |
(4,075 | ) | 11,002 | 9,167 | ||||||||
| INCOME (LOSS) FROM CONTINUING OPERATIONS |
5,783 | (16,568 | ) | (40,978 | ) | |||||||
| Income (Loss) From Discontinued Operations, Net of Income Taxes |
— | 323 | (7,704 | ) | ||||||||
| NET INCOME (LOSS) |
5,783 | (16,245 | ) | (48,682 | ) | |||||||
| Net Loss Attributable to Noncontrolling Interests |
(253 | ) | (12 | ) | — | |||||||
| NET INCOME (LOSS) ATTRIBUTABLE TO REX ENERGY |
$ | 6,036 | $ | (16,233 | ) | $ | (48,682 | ) | ||||
| Earnings Per Common Share: |
||||||||||||
| Basic—income (loss) from continuing operations attributable to Rex common shareholders |
$ | 0.14 | $ | (0.45 | ) | $ | (1.18 | ) | ||||
| Basic—income (loss) from discontinued operations attributable to Rex common shareholders |
— | 0.01 | (0.22 | ) | ||||||||
| Basic—net income (loss) attributable to Rex common shareholders |
$ | 0.14 | $ | (0.44 | ) | $ | (1.40 | ) | ||||
| Basic—weighted average shares of common stock outstanding |
43,558 | 36,806 | 34,595 | |||||||||
| Diluted—income (loss) from continuing operations attributable to Rex common shareholders |
$ | 0.14 | $ | (0.45 | ) | $ | (1.18 | ) | ||||
| Diluted—income (loss) from discontinued operations attributable to Rex common shareholders |
— | 0.01 | (0.22 | ) | ||||||||
| Diluted—net income (loss) attributable to Rex common shareholders |
$ | 0.14 | $ | (0.44 | ) | $ | (1.40 | ) | ||||
| Diluted—weighted average shares of common stock outstanding |
43,670 | 36,806 | 34,595 | |||||||||
See accompanying summary of accounting policies and notes to the financial statements
69
Table of Contents
CONSOLIDATED STATEMENTS OF CHANGES IN STOCKHOLDERS’ EQUITY (DEFICIT) AND NONCONTROLLING INTERESTS
(in Thousands)
| Common Stock | Additional Paid-In Capital |
Accumulated Deficit |
Other Comprehensive Income |
Total Owners’ Equity |
Noncontrolling Interests |
|||||||||||||||||||||||
| Shares | Par | |||||||||||||||||||||||||||
| Balance December 31, 2007 |
30,795 | $ | 31 | $ | 175,170 | $ | (10,640 | ) | $ | (124 | ) | $ | 164,437 | $ | — | |||||||||||||
| Issuance of 5,775,000 shares of common stock net of issuance costs of $6.8 million |
5,775 | 6 | 112,987 | — | — | 112,993 | — | |||||||||||||||||||||
| Reclassification into earnings of interest rate swap, net of tax of $84 |
— | — | — | — | 124 | 124 | — | |||||||||||||||||||||
| Non-cash compensation expense |
— | — | 2,976 | — | — | 2,976 | — | |||||||||||||||||||||
| Restricted stock, net |
20 | — | — | — | — | — | — | |||||||||||||||||||||
| Net Loss |
— | — | — | (48,682 | ) | — | (48,682 | ) | — | |||||||||||||||||||
| Balance December 31, 2008 |
36,590 | 37 | 291,133 | (59,322 | ) | — | 231,848 | — | ||||||||||||||||||||
| Non-cash compensation expense |
— | — | 1,239 | — | — | 1,239 | — | |||||||||||||||||||||
| Capital Contributions |
— | — | — | — | — | — | 3,355 | |||||||||||||||||||||
| Restricted stock, net |
228 | — | — | — | — | — | — | |||||||||||||||||||||
| Net Loss |
— | — | — | (16,233 | ) | — | (16,233 | ) | (12 | ) | ||||||||||||||||||
| Balance December 31, 2009 |
36,818 | 37 | 292,372 | (75,555 | ) | — | 216,854 | 3,343 | ||||||||||||||||||||
| Non-cash compensation expense |
— | — | 1,072 | — | — | 1,072 | — | |||||||||||||||||||||
| Issuance of 6,900,000 shares of common stock net of issuance costs of $0.3 million |
6,900 | 7 | 80,192 | — | — | 80,199 | — | |||||||||||||||||||||
| Capital contributions |
— | — | — | — | — | — | 287 | |||||||||||||||||||||
| Restricted stock, net |
567 | — | — | — | — | — | — | |||||||||||||||||||||
| Stock option exercises |
22 | — | 220 | — | — | 220 | — | |||||||||||||||||||||
| Deconsolidation of Keystone Midstream Services, LLC |
— | — | — | — | — | — | (3,082 | ) | ||||||||||||||||||||
| Net Income (Loss) |
— | — | — | 6,036 | — | 6,036 | (253 | ) | ||||||||||||||||||||
| Balance December 31, 2010 |
44,307 | $ | 44 | $ | 373,856 | $ | (69,519 | ) | $ | — | $ | 304,381 | $ | 295 | ||||||||||||||
See accompanying summary of accounting policies and notes to the financial statements
70
Table of Contents
CONSOLIDATED STATEMENTS OF CASH FLOWS
($ in Thousands)
| Rex Energy Corporation Consolidated |
Rex Energy Corporation Consolidated |
Rex Energy Corporation Consolidated |
||||||||||
| For the Years Ended December 31, | ||||||||||||
| 2010 | 2009 | 2008 | ||||||||||
| CASH FLOWS FROM OPERATING ACTIVITIES |
||||||||||||
| Net Income (Loss) |
$ | 6,036 | $ | (16,233 | ) | $ | (48,682 | ) | ||||
| Adjustments to Reconcile Net Income (Loss) to Net Cash Provided by Operating Activities |
||||||||||||
| Noncontrolling Interest Net Loss |
(253 | ) | (12 | ) | — | |||||||
| Loss from Equity Method Investments |
200 | 9 | 54 | |||||||||
| Non-cash Expenses |
1,251 | 1,897 | 3,196 | |||||||||
| Depreciation, Depletion, Amortization and Accretion |
21,806 | 25,205 | 39,469 | |||||||||
| Deferred Income Tax Expense (Benefit) |
3,771 | (10,713 | ) | (10,903 | ) | |||||||
| Unrealized (Gain) Loss on Derivatives |
(5,960 | ) | 17,002 | (43,188 | ) | |||||||
| Exploration Expense |
3 | 135 | 2,200 | |||||||||
| (Gain) Loss on Sale of Oil and Gas Properties |
(16,395 | ) | 427 | 6,508 | ||||||||
| Impairment of Oil and Gas Properties |
8,863 | 1,625 | 47,378 | |||||||||
| Impairment of Goodwill |
— | — | 32,700 | |||||||||
| Changes in operating assets and liabilities, net of effects from acquisitions |
||||||||||||
| Accounts Receivable |
(14,527 | ) | (7,995 | ) | 2,978 | |||||||
| Inventory, Prepaid Expenses and Other Assets |
(216 | ) | 344 | 9 | ||||||||
| Accounts Payable and Accrued Expenses |
32,323 | 8,801 | 1,425 | |||||||||
| Net Changes in Other Assets and Liabilities |
(19,587 | ) | 282 | (716 | ) | |||||||
| NET CASH PROVIDED BY OPERATING ACTIVITIES |
17,315 | 20,774 | 32,428 | |||||||||
| CASH FLOWS FROM INVESTING ACTIVITIES |
||||||||||||
| Proceeds from Phase I Leasing Initiative |
6,352 | — | — | |||||||||
| Proceeds from Joint Ventures |
— | 3,120 | — | |||||||||
| Investments in Joint Ventures |
(14,018 | ) | (309 | ) | — | |||||||
| Proceeds from the Sale of Oil and Gas Properties, Prospects and Other Assets |
79,229 | 17,998 | 8,826 | |||||||||
| Acquisitions of Undeveloped Acreage |
(72,385 | ) | (17,898 | ) | (54,914 | ) | ||||||
| Capital Expenditures for Development of Oil & Gas Properties and Equipment |
(78,013 | ) | (32,972 | ) | (81,712 | ) | ||||||
| NET CASH USED IN INVESTING ACTIVITIES |
(78,835 | ) | (30,061 | ) | (127,800 | ) | ||||||
| CASH FLOWS FROM FINANCING ACTIVITIES |
||||||||||||
| Proceeds from Long-Term Debt and Other Loans and Notes Payable |
85,000 | 27,000 | 29,000 | |||||||||
| Repayments of Long-Term Debt and Other Loans and Notes Payable |
(98,000 | ) | (19,000 | ) | (41,296 | ) | ||||||
| Repayments of Loans and Other Notes Payable |
(753 | ) | (177 | ) | — | |||||||
| Proceeds from the Issuance of Common Stock, Net of Issuance Costs |
80,192 | — | 112,993 | |||||||||
| Proceeds from Lease Incentives |
— | — | 636 | |||||||||
| Proceeds from the Exercise of Stock Options |
220 | — | — | |||||||||
| Capital Contributions by the Partners of Joint Ventures |
287 | — | — | |||||||||
| NET CASH PROVIDED BY FINANCING ACTIVITIES |
66,946 | 7,823 | 101,333 | |||||||||
| NET INCREASE (DECREASE) IN CASH |
5,426 | (1,464 | ) | 5,961 | ||||||||
| CASH—BEGINNING |
5,582 | 7,046 | 1,085 | |||||||||
| CASH—ENDING |
$ | 11,008 | $ | 5,582 | $ | 7,046 | ||||||
| SUPPLEMENTAL DISCLOSURES |
||||||||||||
| Interest Paid |
846 | 581 | 945 | |||||||||
| Taxes Paid |
299 | — | — | |||||||||
| NON-CASH ACTIVITIES |
||||||||||||
| Acquisition of Oil and Gas Properties |
— | — | 7,970 | |||||||||
| Equipment Financing |
1,336 | 542 | — | |||||||||
| Equipment Contributed by Consolidated Joint Ventures |
— | 3,355 | — | |||||||||
See accompanying summary of accounting policies and notes to the financial statements
71
Table of Contents
REX ENERGY CORPORATION AND PREDECESSOR COMPANIES
NOTES TO THE CONSOLIDATED FINANCIAL STATEMENTS
1. BASIS OF PRESENTATION AND PRINCIPLES OF CONSOLIDATION
Rex Energy Corporation, together with our subsidiaries (the “Company”), is an independent oil and gas company operating in the Appalachian Basin, Illinois Basin and the Denver-Julesburg (“DJ”) Basin. In the Appalachian Basin, we are focused on our Marcellus Shale drilling projects. In the Illinois Basin, in addition to our developmental oil drilling, we are focused on the implementation of enhanced oil recovery on our properties. Our focus in the DJ Basin has been on acquiring acreage which we believe to be prospective for horizontal oil well drilling in the Niobrara formation. We pursue a balanced growth strategy of pursuing our higher potential exploration drilling prospects and actively seeking to acquire complementary oil and natural gas properties.
The accompanying Consolidated Financial Statements have been prepared in accordance with accounting principles generally accepted in the United States of America (“GAAP”) and include the accounts of all of our wholly owned subsidiaries and variable interest entities for which we are the primary beneficiary. All material intercompany balances and transactions have been eliminated. Unless otherwise indicated, all references to “Rex Energy Corporation,” “our,” “we,” “us” and similar terms refer to Rex Energy Corporation and its subsidiaries together. In preparing the accompanying financial statements, management has made certain estimates and assumptions that affect reported amounts in the financial statements and disclosures of contingencies.
Certain prior year amounts have been reclassified to conform to the report classifications for the year ended December 31, 2010, with no effect on previously reported net income, net income per share, accumulated deficit or stockholders’ equity. Approximately $25,000 of restricted cash at December 31, 2009 was reclassified from Other Assets—Net on the Consolidated Balance Sheet to Restricted Cash. Approximately $0.8 million, previously classified as Investment in RW Gathering as of December 31, 2009, has been reclassified to Equity Method Investments on our Consolidated Balance Sheets. Approximately $9,000 and $54,000 of losses on equity method investments for the years ended December 31, 2009 and 2008, respectively, have been reclassified from Other Expense to Loss on Equity Method Investments on the Consolidated Statements of Operations.
On May 5, 2008, we completed a public offering of 9.8 million shares of common stock at an offering price of $20.75 per share. These shares included 5.8 million shares offered by us (which includes 1.3 million shares sold pursuant to the exercise of an overallotment option granted to the underwriters’ of the offering) and 4.0 million shares sold by certain selling stockholders. The net proceeds of the underwritten public offering to us, after underwriting discounts and offering expenses of approximately $6.8 million, were approximately $113.0 million.
On November 12, 2009, we entered into a limited liability agreement with Sand Hills Management, LLC (“Sand Hills”) to form Water Solutions Holdings, LLC (“Water Solutions Holdings”) for the purpose of acquiring, managing and operating water treatment, water disposal and water transportation facilities that are designed to treat, dispose or transport brine and other waste waters produced in oil and gas well development activities. The members of Water Solutions Holdings are Rex Energy Corporation, which owns an 80% membership interest, and Sand Hills, which owns a 20% membership interest and serves as the operator of the entity. We consolidate the results of operations of Water Solutions Holdings and report the Sand Hills ownership as a noncontrolling interest. For additional information on Water Solutions Holdings, see Note 5, Variable Interest Entities, to our Consolidated Financial Statements.
On December 21, 2009, we entered into a midstream joint venture with Stonehenge Energy Resources, L.P. (“Stonehenge”) to be operated as Keystone Midstream Services, LLC (“Keystone Midstream”). The venture is principally focused on building, operating and owning a high pressure gathering system and cryogenic gas processing plants in Butler County, Pennsylvania. The initial members of Keystone Midstream were our wholly owned subsidiary, R.E. Gas Development, LLC (“R.E. Gas”), with a 40% interest, and Stonehenge, with a 60%
72
Table of Contents
interest. At such time, we were considered the primary beneficiary of Keystone Midstream and were thus required to consolidate the operations of the entity, while reporting the ownership of Stonehenge as a noncontrolling interest. We sold 30% of our interest in Keystone Midstream on September 30, 2010, effective September 1, 2010, triggering a re-evaluation of our consolidation analysis. We determined that we were no longer the primary beneficiary of Keystone Midstream. Thus, as of September 1, 2010, we began accounting for our investment in Keystone Midstream under the equity method of accounting. For additional information, see Note 3, Business and Oil and Gas Property Acquisitions and Dispositions, Note 5, Variable Interest Entities, and Note 6, Equity Method Investments, to our Consolidated Financial Statements.
On January 21, 2010, we completed an underwritten public offering of 6.9 million shares of our common stock, which included 0.9 million shares of common stock issued upon the full exercise of the underwriters’ over-allotment option, at a public offering price of $12.25 per share. The net proceeds to us from the offering were approximately $80.2 million, after deducting underwriting discounts, commissions and estimated offering expenses. We used a portion of the proceeds of the offering to fully repay borrowings then outstanding and used the remaining net proceeds to fund a portion of our capital expenditure program for 2010 and for other general corporate purposes. See also Note 14, Capital Stock, to our Consolidated Financial Statements.
2. SUMMARY OF SIGNIFICANT ACCOUNTING POLICIES
Use of Estimates
The preparation of financial statements in conformity with GAAP requires management to make estimates and assumptions that affect the reported amounts of assets and liabilities and disclosures of contingencies at the date of the Consolidated Financial Statements and the reported amounts of revenues and expenses during the periods reported. Actual results could differ from these estimates.
Significant estimates made in preparing these Consolidated Financial Statements include, among other things, estimates of the proved oil and natural gas reserve volumes used in calculating Depletion, Depreciation and Amortization (“DD&A”) expense; the estimated future cash flows and fair value of properties used in determining the need for any impairment write-down; fair values of financial derivative instruments; volumes and prices for revenues accrued; estimates of the fair value of equity-based compensation awards; deferred tax valuation and the timing and amount of future abandonment costs used in calculating asset retirement obligations. Future changes in the assumptions used could have a significant impact on reported results in future periods. The significant estimates are based on current assumptions that may be materially affected by changes to future economic conditions such as the market prices received for sales of volumes of oil and natural gas, interest rates and our ability to generate future income.
Cash and Cash Equivalents
We consider all highly liquid investments with original maturity of three months or less when purchased to be cash equivalents. As of December 31, 2010 and 2009, we had approximately $16.1 million and $25,000, respectively, accounted for as Restricted Cash on the Consolidated Balance Sheets. These amounts are primarily related to funds prepaid to us from Sumitomo for the purpose of acquiring mineral leases in Butler County, Pennsylvania, described as Phase I leases in Note 3, Business and Oil and Gas Property Acquisitions and Dispositions, to our Consolidated Financial Statements.
Accounts Receivable
Our trade accounts receivable, which are primarily from oil and natural gas sales and joint interest billings, are recorded at the invoiced amount and include production receivables. The production receivable is valued at the invoiced amount and does not bear interest. Accounts receivable also include joint interest billing receivables which represent billings to the non-operators associated with the drilling and operation of wells and are based on those owners’ working interests in the wells. We have assessed the financial strength of our customers and joint owners and recorded bad debts as necessary.
73
Table of Contents
We use the allowance method to account for uncollectible accounts receivable. A reserve is recorded for amounts we expect will not be fully recovered. Actual balances are not applied against the reserve until substantially all collection efforts have been exhausted. A summary of our reserve for uncollectible accounts receivable is provided in the table below ($ in thousands):
| Description |
Balance at Beginning of Year |
Additions Charged to Expense |
Recoveries | Deductions | Balance at Year-End |
|||||||||||||||
| Year ended December 31, 2008 |
||||||||||||||||||||
| Allowance for doubtful accounts—A/R |
$ | 185 | $ | 115 | $ | — | $ | 163 | $ | 137 | ||||||||||
| Year ended December 31, 2009 |
||||||||||||||||||||
| Allowance for doubtful accounts—A/R |
$ | 137 | $ | 43 | $ | — | $ | 24 | $ | 156 | ||||||||||
| Year ended December 31, 2010 |
||||||||||||||||||||
| Allowance for doubtful accounts—A/R |
$ | 156 | $ | — | $ | — | $ | — | $ | 156 | ||||||||||
To the extent actual quantities and values of oil and natural gas are unavailable for a given reporting period because of timing or information not received from third parties, the expected sales volumes and price for those properties are estimated and recorded as Accounts Receivable in the accompanying Consolidated Balance Sheets.
At December 31, 2010, we carried approximately $8.1 million in production receivable, of which approximately $5.1 million were production receivables due from a single customer, CountryMark Cooperative LLP. At December 31, 2009, we carried approximately $6.3 million in production receivable, of which approximately $4.2 million were production receivables due from a single customer, CountryMark Cooperative LLP. In addition, we carried approximately $19.2 million in receivables from Sumitomo Corporation (see Note 3, Business and Oil and Gas Property Acquisition Dispositions, to our Consolidated Financial Statements) at December 31, 2010 that was in relation to our joint operations. We did not carry any receivables from Sumitomo Corporation as of December 31, 2009.
Inventory
Inventory is valued at the lower of cost or market value and consists of our ownership interest in oil and NGLs held in terminal tanks located in the field. Oil and NGL inventory is accounted for using the average cost method, with average cost defined as production and lease operating expenses net of DD&A. General and Administrative expenses are not allocated to the cost of inventory for the purpose of valuing inventory.
Oil and Natural Gas Property, Depreciation and Depletion
We account for natural gas and oil exploration and production activities under the successful efforts method of accounting. Proved developed natural gas and oil property acquisition costs are capitalized when incurred. Unproved properties with individually significant acquisition costs are assessed periodically on a property-by- property basis, and any impairment in value is recognized. If the unproved properties are determined to be productive, the appropriate related costs are transferred to proved natural gas and oil properties. Natural gas and oil exploration costs, other than the costs of drilling exploratory wells, are charged to expense as incurred. The costs of drilling exploratory wells are capitalized pending determination of whether they have discovered proved commercial reserves. If proved commercial reserves are not discovered, such drilling costs are expensed. Costs to develop proved reserves, including the costs of all development well and related equipment used in the production of natural gas and oil, are capitalized.
DD&A is calculated using the unit-of-production method on estimated proved oil and gas reserves at the lease, unit or well level. In arriving at rates under the unit-of-production method, the quantities of recoverable oil and natural gas are established based on estimates made by our geologists and engineers and independent
74
Table of Contents
engineers. We periodically review estimated proved reserve estimates and make changes as needed to DD&A expenses to account for new wells drilled, acquisitions, divestitures and other events which may have caused significant changes in our estimated proved developed producing reserves. The costs of unproved properties are withheld from the depletion base until such time as they are either developed or abandoned. When proved reserves are assigned, the cost of the property is added to costs subject to depletion calculations. Non-producing properties consist of undeveloped leasehold costs and costs associated with the purchase of certain proved undeveloped reserves. Undeveloped leasehold cost is allocated to the associated producing properties as the undeveloped acreage is developed. Individually significant non-producing properties are periodically assessed for impairment of value. Service properties, equipment and other assets are depreciated using the straight-line method over their estimated useful lives of three to 30 years.
When circumstances indicate that an asset may be impaired, we compare expected undiscounted future cash flows at a producing field to the unamortized capitalized cost of the asset. If the future undiscounted cash flows, based on our estimate of future natural gas and oil prices, operating costs, anticipated production from proved reserves and other relevant data, are lower than the unamortized capitalized cost, the capitalized cost is reduced to fair value. Fair value is calculated by discounting the future cash flows at an appropriate risk-adjusted discount rate. When evaluating our unproved oil and gas properties, we utilize active market prices for similar acreage to use as a comparison tool against the carrying value of our properties. If the active market prices for similar acreage do not support our carrying values we then utilize estimates of future value that will be created from the future development of these properties. If future estimated fair value of these properties is lower than the capitalized cost, the capitalized cost is reduced to the estimated future fair value. We recognized approximately $8.9 million, $1.6 million and $71.3 million of impairment on certain oil and gas properties for the years ending December 31, 2010, 2009 and 2008, respectively. We recorded these expenses as Impairment Expense on our Consolidated Statements of Operations.
Expenditures for repairs and maintenance to sustain production from the existing producing reservoir are charged to expense as incurred. Expenditures to recomplete a current well in a different unproved reservoir are capitalized pending determination that economic reserves have been added. If the recompletion is not successful, the expenditures are charged to expense.
Significant tangible equipment added or replaced that extends the useful or productive life of the property is capitalized. Expenditures to construct facilities or increase the productive capacity from existing reservoirs are capitalized.
Upon the sale or retirement of a proved natural gas or oil property, or an entire interest in unproved leaseholds, the cost and related accumulated DD&A are removed from the property accounts and the resulting gain or loss is recognized. For sales of a partial interest in unproved leaseholds for cash or cash equivalents, sales proceeds are first applied as a reduction of the original cost of the entire interest in the property and any remaining proceeds are recognized as a gain.
Natural Gas and Oil Reserve Quantities
Our estimate of proved reserves is based on the quantities of oil and natural gas that engineering and geological analyses demonstrate, with reasonable certainty, to be recoverable from established reservoirs in the future under current operating and economic parameters. For the years ended December 31, 2010 and 2009, Netherland Sewell and Associates, Inc. (“NSAI”) prepared a consolidated reserve and economic evaluation of our proved oil and gas reserves. The preparation of our proved reserve estimates are completed in accordance with our internal control procedures, which include the verification of input data used by NSAI, as well as intense management review and approval.
Reserves and their relation to estimated future net cash flows impact our depletion and impairment calculations. As a result, adjustments to depletion and impairment are made concurrently with changes to reserve estimates. Estimates of our crude oil and natural gas reserves, and the projected cash flows derived from these
75
Table of Contents
reserve estimates, are prepared by our engineers in accordance with guidelines established by the SEC, including the rule revisions designed to modernize the oil and gas company reserves reporting requirements and which we adopted effective December 31, 2009. The independent reserve engineer estimates reserves annually on December 31. This annual estimate results in a new DD&A rate, which we use for the preceding fourth quarter after adjusting for fourth quarter production.
Intangible Assets
At December 31, 2010, our intangible assets consisted of $1.4 million, which is primarily made up of sales agreements and loan costs that are amortized using the straight line method over their respective estimated lives, which is, on average, three to five years. We amortize any costs incurred to renew or extend the terms of existing intangible assets over the contract term or estimated useful life, as applicable, using the straight-line method. For the years ended December 31, 2010, 2009, and 2008, we recorded amortization expense of $0.5 million, $0.4 million and $0.4 million, respectively. The aggregate estimated annual amortization expense for each of the next five calendar years is as follows: 2011—$0.7 million; 2012—$0.5 million; 2013—$0.1 million; 2014—$0; and 2015—$0.
The following is a summary of intangible assets at the dates indicated:
| December 31, 2010 (in thousands) |
December 31, 2009 (in thousands) |
|||||||
| Intangible—Gross |
$ | 2,920 | $ | 2,107 | ||||
| Accumulated Amortization |
(1,526 | ) | (1,009 | ) | ||||
| Intangible Assets—Net |
$ | 1,394 | $ | 1,098 | ||||
Future Abandonment Cost
Future abandonment costs are recognized as obligations associated with the retirement of tangible long-lived assets that result from the acquisition and development of the asset. We recognize the fair value of a liability for a retirement obligation in the period in which the liability is incurred. For natural gas and oil properties, this is the period in which the natural gas or oil well is acquired or drilled. The future abandonment cost is capitalized as part of the carrying amount of our natural gas and oil properties at its discounted fair value. The liability is then accreted each period until the liability is settled or the natural gas or oil well is sold, at which time the liability is reversed. If the fair value of a recorded asset retirement obligation changes, a revision is recorded to both the asset retirement obligation and the asset retirement cost.
Accretion expense during the years ended December 31, 2010, 2009 and 2008 totaled approximately $1.7 million, $1.5 million and $0.9 million, respectively. These amounts are recorded as DD&A on our Consolidated Statements of Operations. In accordance with the terms of our Purchase and Exploration Agreements (“PEAs”) with Williams Production Company, LLC and Williams Production Appalachia, LLC (collectively, “Williams”) and Summit Discovery Resources II, LLC and Sumitomo Corporation (collectively, “Sumitomo”), we account for asset retirement obligations that relate to wells that are drilled jointly based on our interest in those wells. We describe the details of the PEAs with Williams and Sumitomo in Note 3, Business and Oil and Gas Property Acquisition Dispositions, to our Consolidated Financial Statements.
| December 31, 2010 ($ in Thousands) |
December 31, 2009 ($ in Thousands) |
|||||||
| Beginning Balance |
$ | 16,143 | $ | 16,284 | ||||
| Asset Retirement Obligation Incurred |
196 | 254 | ||||||
| Asset Retirement Obligation Settled |
(796 | ) | (618 | ) | ||||
| Asset Retirement Obligation Cancelled or Sold Well Properties |
(25 | ) | (1,230 | ) | ||||
| Asset Retirement Obligation Accretion Expense |
1,704 | 1,453 | ||||||
| Total Asset Retirement Obligation |
$ | 17,222 | $ | 16,143 | ||||
76
Table of Contents
Revenue Recognition
Oil and natural gas revenue is recognized when the oil or natural gas is delivered to or collected by the respective purchaser, a sales agreement exists, collection for amounts billed is reasonably assured and the sales price is fixed or determinable. Title to the produced quantities transfers to the purchaser at the time the purchaser collects or receives the quantities. In the case of oil and NGL sales, title is transferred to the purchaser when the oil or NGLs leaves our stock tanks and enters the purchaser’s trucks. In the case of gas production, title is transferred when the gas passes through the meter of the purchaser. It is the measurement of the purchaser that determines the amount of oil or gas purchased. Prices for such production are defined in sales contracts and are readily determinable based on certain publicly available indices. The purchasers of such production have historically made payment for oil and natural gas purchases within 30-60 days of the end of each production month. We periodically review the difference between the dates of production and the dates we collect payment for such production to ensure that receivables from those purchasers are collectible. The point of sale for our oil, NGL and natural gas production is at its applicable field gathering system. We do not currently participate in any gas-balancing arrangements. We do not recognize revenue for oil and NGL production held in stock tanks before delivery to the purchaser.
To the extent actual quantities and values of oil and natural gas are unavailable for a given reporting period because of timing or information not received from third parties, the expected sales volumes and price for those properties are estimated and recorded as Accounts Receivable in the Consolidated Balance Sheets.
Derivative Instruments
We use put and call options (collars) and fixed rate swap contracts to manage price risks in connection with the sale of oil and natural gas. We have also, in the past, used interest rate swap agreements to manage interest rate risks associated with our variable rate credit facility. We have established the fair value of all derivative instruments using estimates determined by our counterparties and other third-parties. These values are based upon, among other things, future prices, volatility, time to maturity and credit risk. The values we report in our Consolidated Financial Statements change as these estimates are revised to reflect actual results, changes in market conditions or other factors.
We report our derivative instruments at fair value and include them in the Consolidated Balance Sheets as assets or liabilities. The accounting for changes in fair value of a derivative instrument depends on the intended use of the derivative and the resulting designation, which is established at the inception of a derivative. For derivative instruments designated as cash flow hedges, changes in fair value, to the extent the hedge is effective, are recognized in other comprehensive income until the hedged item is recognized in earnings. Any changes in fair value resulting from ineffectiveness are recognized immediately in earnings. As of December 31, 2010, 2009 and 2008 we did not have any derivative instruments designated as cash flow hedges.
For derivative instruments designated as fair value hedges, changes in fair value, as well as the offsetting changes in the estimated fair value of the hedged item attributable to the hedged risk, are recognized currently in earnings. Derivative effectiveness is measured annually based on the relative changes in fair value between the derivative contract and the hedged item over time. For derivatives on oil and natural gas production activity, our evaluations are not documented, and as a result, we record changes on the derivative valuations through earnings. For additional information on our derivative instruments, see Note 11, Fair Value of Financial Instruments and Derivative Instruments, to our Consolidated Financial Statements.
Income Taxes
We are subject to income and other taxes in all areas in which we operate. When recording income tax expense, certain estimates are required because income tax returns are generally filed several months after the
77
Table of Contents
close of a calendar year, tax returns are subject to audit which can take years to complete, and future events often impact the timing of when income tax expenses and benefits are recognized. We have deferred tax assets relating to tax operating loss carryforwards and other deductible differences and deferred tax liabilities that relate to other temporary differences.
Deferred tax assets and liabilities are computed based on the difference between the financial statement and income tax bases of assets and liabilities using the enacted marginal tax rate. Net deferred tax assets are required to be reduced by a valuation allowance if, based on the weight of available evidence, it is more likely than not that some portion or all of the net deferred tax asset will not be realized.
This process requires our management to make assessments regarding the timing and probability of the ultimate tax impact. We record valuation allowances on deferred tax assets if we determine it is more likely than not that the asset will not be realized. Additionally, we establish reserves for uncertain tax positions based upon our judgment regarding potential future challenges to those positions. Actual income taxes could vary from these estimates due to future changes in income tax law, significant changes in the jurisdictions in which we operate, our inability to generate sufficient future taxable income, or unpredicted results from the final determination of each year’s liability by taxing authorities. These changes could have a significant impact on our financial position.
The accounting estimate related to the tax valuation allowance requires us to make assumptions regarding the timing of future events, including the probability of expected future taxable income and available tax planning opportunities. These assumptions require significant judgment because actual performance has fluctuated in the past and may do so in the future. The impact that changes in actual performance versus these estimates could have on the realization of tax benefits as reported in our results of operations could be material. We continuously evaluate facts and circumstances representing positive and negative evidence in the determination of our ability to realize the deferred tax assets.
The accounting estimates related to the liability for uncertain tax positions require us to make judgments regarding the sustainability of each uncertain tax position based on its technical merits. If we determine it is more likely than not a tax position will be sustained based on its technical merits, we record the impact of the position in our Consolidated Financial Statements at the largest amount that is greater than fifty percent likely of being realized upon ultimate settlement. These estimates are updated at each reporting date based on the facts, circumstances and information available. We are also required to assess at each reporting date whether it is reasonably possible that any significant increases or decreases to the unrecognized tax benefits will occur during the next twelve months (for additional information, see Note 12, Income Taxes, to our Consolidated Financial Statements).
Advertising Expense
Advertising costs are expensed as incurred and were approximately $43,000, $20,000 and $81,000 for the years ended December 31, 2010, 2009, and 2008, respectively.
Loan Costs
Loan costs consisted of gross debt issuance costs of approximately $1.4 million, $0.7 million and $0.8 million for the years ended December 31, 2010, 2009 and 2008, respectively, which are presented net of accumulated amortization of $0.6 million, $0.4 million and $0.2 million, respectively. Loan costs at December 31, 2010 are included in Intangible Assets—Net on the Consolidated Balance Sheets and are amortized over the remaining life of the credit facility, which is approximately three years.
Stock-based Compensation
We recognize in the Consolidated Financial Statements the cost of employee services received in exchange for awards of equity instruments based on the grant date fair value of those awards. We use a standard option
78
Table of Contents
pricing model (i.e. Black-Scholes) to measure the fair value of employee stock options and stock appreciation rights. The fair value of restricted stock awards is determined based on the fair market value of our common stock on the date of the grant.
The benefits associated with the tax deductions in excess of recognized compensation cost are reported as a financing cash flow. This requirement reduces net operating cash flows and increases net financing cash flows. We recognize compensation costs related to awards with graded vesting on a straight-line basis over the requisite service period for each separately vesting portion of the award as if the award were, in-substance, multiple awards (for additional information, see Note 16, Employee Benefit Plans and Equity Plans, to our Consolidated Financial Statements). Stock appreciation rights are classified as a liability and are re-measured at fair value each reporting period.
Earnings per Share
Earnings per common share are computed by dividing consolidated net income attributable to us by the weighted average number of common shares outstanding. Diluted earnings per common share are computed by dividing consolidated net income attributable to us by the weighted average number of common shares outstanding during the period, including any potentially dilutive outstanding securities, such as options and warrants. The potentially dilutive outstanding securities are calculated using the treasury stock method. At December 31, 2010, we had 44,306,677 common shares outstanding, 826,511 options outstanding and 20,500 stock appreciation rights outstanding with no outstanding warrants or other potentially dilutive securities. For additional information, see Note 13, Earnings per Common Share, to our Consolidated Financial Statements.
Capital Leases
As a lessee, we determine if a lease is a capital lease if it meets one of four of the following criteria:
| • | The ownership of the leased property transfers to us by the end of the lease term, or shortly thereafter, in exchange for the payment of a nominal fee. |
| • | The lease contains a bargain purchase option. |
| • | The lease term is equal to 75% or more of the estimated economic life of the leased property. |
| • | The present value at the beginning of the lease term of the minimum lease payments, excluding that portion of the payments representing executor costs such as insurance, maintenance, and taxes to be paid by the lessor, including any profit thereon, equals or exceeds 90% of the excess of the fair value of the leased property to the lessor at the lease inception over any related investment tax credit retained by the lessor and expected to be realized by the lessor. |
As of December 31, 2010 we had capital leases on field vehicles being used in our Illinois, Appalachian and DJ Basins. We initially recorded these leases as Other Property and Equipment on our Consolidated Balance Sheets in the amount of $1.8 million. The remaining obligation to be paid on these leases totaled approximately $0.9 million, of which $0.1 was classified as Senior Secured Line of Credit and Long-Term Debt under Long-Term Liabilities and $0.8 was classified as Accounts Payable under Current Liabilities on our Consolidated Balance Sheets, all of which is expected to be paid in 2011 and 2012. We recorded approximately $0.2 million of amortization on these vehicles, classified as DD&A on our Consolidated Statement of Operations. As of December 31, 2009, we had capital leases on pick-up trucks being used in our Illinois Basin which were initially recorded as Other Property and Equipment on our Consolidated Balance Sheet in the amount of $0.5 million, with approximately $0.3 million in remaining obligations which were classified as Accounts Payable under Current Liabilities on our Consolidated Balance Sheet. In 2009, we recorded approximately $49,000 of amortization on these vehicles, classified as DD&A on our Consolidated Statement of Operations.
79
Table of Contents
Recent Accounting Pronouncements
In December 2010, the Financial Accounting Standards Board (the “FASB”) issued Accounting Standards Update (“ASU”) 2010-29, Disclosure of Supplementary Pro Forma Information for Business Combinations (“ASU 2010-29”). The amendments to the codification clarify that if a public entity presents comparative financial statements, the entity should disclose revenue and earnings of the combined entity as though the business combination(s) that occurred during the current year had occurred as of the beginning of the comparable prior annual reporting period only. Additionally, the supplemental pro forma disclosures under Topic 805 have been expanded to include a description of the nature and amount of material, nonrecurring pro forma adjustments directly attributable to the business combination included in the reported pro forma revenue and earnings. The amendments in ASU 2010-29 are effective prospectively for business combinations for which the acquisition date is on or after the beginning of the first annual reporting period beginning on or after December 15, 2010. Although we have not entered into any significant business combinations in our recent history, we believe that ASU 2010-29 may have a material impact on future disclosures depending on the size and nature of any future business combinations that we may enter into. We adopted ASU 2010-29 on January 1, 2011.
In April 2009, the FASB issued Accounting Standards Codification (“ASC”) 805-20, which amends and clarifies ASC 805 to address application issues regarding initial recognition and measurement, subsequent measurement and accounting and disclosure of assets and liabilities arising from contingencies in a business combination. ASC 805-20 is effective for assets or liabilities arising from contingencies in business combinations for which the acquisition date is on or after the beginning of the first annual reporting period beginning on or after December 15, 2008. Although we did not enter into any significant business combinations during 2010, we believe ASC 805-20 may have a material impact on our future financial statements depending on the size and nature of any future business combinations that we may enter into. We adopted ASC 805-20 on January 1, 2010.
In June 2009, the FASB issued ASU 2009-17, Improvements to Financial Reporting by Enterprises Involved with Variable Interest Entities (“ASU 2009-17”), which was issued to improve financial reporting by enterprises involved with variable interest entities. This statement addresses the effects of certain provisions of FASB Interpretation No. 46(R) (“FIN 46(R)”) and constituent concerns about the application of certain key provisions of FIN 46(R), including those in which the accounting and disclosures do not always provide timely and useful information about an enterprise’s involvement in a variable interest entity. This statement takes effect as of the beginning of each reporting entity’s first annual reporting period that begins after November 15, 2009, for interim periods within that first annual reporting period and for interim reporting periods thereafter. We adopted ASU 2009-17 as of January 1, 2010. Adoption did not have a material effect on our financial position and results of operations.
In January 2010, the FASB issued ASU 2010-01, Equity: Accounting for Distributions to Shareholders with Components of Stock and Cash (“ASU 2010-01”). The amendments to the Codification in this ASU clarify that the stock portion of a distribution to shareholders that allows them to elect to receive cash or stock with a potential limitation on the total amount of cash that all shareholders can elect to receive in the aggregate is considered a share issuance that is reflected in earnings per share prospectively and is not a stock dividend. ASU 2010-01 is effective for interim and annual periods ending on or after December 15, 2009, and should be applied on a retrospective basis. We adopted ASU 2010-01 as of January 1, 2010. Adoption did not have a material effect on our financial position and results of operations.
In January 2010, the FASB issued ASU 2010-02, Consolidation—Accounting and Reporting for Decreases in Ownership of a Subsidiary—A Scope Clarification (“ASU 2010-02”). This ASU clarifies the scope of the decrease in ownership provisions of Subtopic 810-10 and expands the disclosure requirements about deconsolidation of a subsidiary or derecognition of a group of assets to include:
| • | The valuation techniques used to measure the fair value of any retained investment; |
| • | The nature of any continuing involvement with the subsidiary or entity acquiring the group of assets; and |
80
Table of Contents
| • | Whether the transaction that resulted in the deconsolidation or derecognition was with a related party or whether the former subsidiary or entity acquiring the assets will become a related party after the transaction. |
ASU 2010-02 is effective beginning in the period that an entity adopts FASB Statement No. 160, Noncontrolling Interests in Consolidated Financial Statements—an amendment of ARB 51 (“SFAS 160”). If an entity has previously adopted SFAS 160, the amendments are effective beginning in the first interim or annual reporting period ending on or after December 15, 2009. The amendments in ASU 2010-02 should be applied retrospectively to the first period that an entity adopts SFAS 160. We adopted SFAS 160 on January 1, 2009, and subsequently adopted ASU 2010-02 on January 1, 2010. The adoption of this ASU did not have a material effect on our financial position and results of operations.
In January 2010, the FASB issued ASU 2010-06, Fair Value Measurements and Disclosures: Improving Disclosures about Fair Value Measurements (“ASU 2010-06”). This ASU requires additional disclosures and clarifies some existing disclosure requirements about fair value measurement as set forth in ASC 820-10 in order to increase the transparency in financial reporting.
ASU 2010-06 is effective for interim and annual reporting periods beginning after December 15, 2009, except for the disclosures about purchases, sales, issuances, and settlements in the roll forward of activity in Level 3 fair value measurements. Those disclosures are effective for fiscal years beginning after December 15, 2010, and for interim periods within those fiscal years. Early application is permitted. We adopted ASU 2010-06 on January 1, 2010, with no material effect on our financial position and results of operations.
In February 2010, the FASB issued ASU 2010-09, Subsequent Events: Amendments to Certain Recognition and Disclosure Requirements (“ASU 2010-09”). The amendments in this ASU define SEC filers as entities that are required to furnish its financial statements with the SEC or the appropriate agency under Section 12(i) of the Securities Exchange Act of 1934, as amended, and removes the requirement for such entities to disclose a date through which subsequent events have been evaluated in both issued and revised financial statements. Revised financial statements include financial statements revised as a result of either correction of an error or retrospective application of GAAP. The FASB also clarified that if the financial statements have been revised, then an entity that is not an SEC filer should disclose both the date that the financial statements were issued or available to be issued and the date the revised financial statements were issued or available to be issued. We adopted ASU 2010-09 on June 15, 2010, with no material effect on our financial position and results of operations.
3. BUSINESS AND OIL AND GAS PROPERTY ACQUISITIONS AND DISPOSITIONS
Acquisitions
Each of the transactions listed below pertains to the leasing of large tracts of acreage and were recorded as Unevaluated Oil and Gas Properties on our Consolidated Balance Sheets.
In July 2010, we acquired a 100% working interest in certain undeveloped oil and gas leases covering approximately 18,000 net acres located in the DJ Basin in Laramie County, Wyoming. The acreage was acquired for approximately $18.4 million.
In February 2010, we acquired a 100% working interest in leases in Clearfield and Clinton Counties in the Commonwealth of Pennsylvania. The interest was acquired from an individual landowner for approximately $3.0 million. Our interest is subject to an option held by a third party, whereby the third party may elect to participate up to a 50% working interest in any well drilled. We will be accountable for a payment of an additional $1,000 per acre on 600 acres for each of the first five wells drilled on the acreage in the event that the third party elects not to participate in such wells. If the third party elects not to participate in any of the first five wells drilled on the acreage and additional payment by us is required, our total cost would be approximately $6.1 million.
81
Table of Contents
In February 2010, we acquired a 100% working interest in leases in our Butler County, Pennsylvania project area for approximately $5.7 million.
On June 13, 2008, we acquired a 100% working interest in a lease in Clearfield County in the Commonwealth of Pennsylvania. The interest was acquired from E.M. Brown, Inc. for approximately $17.2 million. Pursuant to the leasing agreement, $15.2 million of this amount was paid in June 2008. The remaining $2.0 million payment has been deferred and will be paid in 2012 (for additional information, see Note 8, Commitments and Contingencies, to our Consolidated Financial Statements).
On May 8, 2008, we acquired a 100% working interest in an oil and gas lease in Centre County in the Commonwealth of Pennsylvania. The interest was acquired from Resource Recovery, LLC for approximately $17.4 million. Pursuant to the oil and gas lease, $5.8 million of this amount was paid in May 2008, $5.8 million was paid in June 2008, $1.5 million was paid in May 2009 and $1.5 million was paid in May 2010. The remaining $2.8 million to be paid will be distributed in equal installments of approximately $1.4 million in each of the next two years with the last payment being made in 2012 (for additional information, see Note 8, Commitments and Contingencies, to our Consolidated Financial Statements).
Dispositions
Sumitomo Joint Venture
On September 30, 2010, we entered into a joint venture transaction with Sumitomo. In Butler County, Pennsylvania we sold a 15% non-operated interest in approximately 40,700 net acres for approximately $30.6 million in cash at closing and $30.6 million in the form of a drilling carry of 80% of our drilling and completion costs in the area. Pursuant to the Participation and Exploration Agreement (the “Sumitomo PEA”), Sumitomo has agreed to pay all of the costs to lease approximately 9,000 net acres in the Butler County Area of Mutual Interest (“AMI”) (the “Phase I Leasing”), and is to pay to us a leasing management fee of $1,000 per net acre during the Phase I Leasing. Under the Sumitomo PEA, upon the conclusion of Phase I Leasing, we are to cross assign interests in the leases with Sumitomo to provide uniformity of interest in each lease in the Butler County AMI. Assuming the full 9,000 net acres are leased, the final ownership percentages in the Butler County AMI would be approximately 70% to us and 30% to Sumitomo. In addition to the sale of undeveloped acreage, we also sold to Sumitomo 30% of our interests in 20 Marcellus Shale wells within the Butler County area and 30% of our interest in Keystone Midstream (for additional information on Keystone Midstream, see Note 5, Variable Interest Entities, and Note 6, Equity Method Investments, to our Consolidated Financial Statements).
In our Marcellus Shale joint venture project areas with Williams, which is discussed below, we sold to Sumitomo 20% of our interests in 23,500 net acres for approximately $19.0 million in cash at closing and $19.0 million in the form of a drilling carry of 80% of our drilling and completion costs in the areas. In addition, we sold 20% of our interests in 19 Marcellus Shale wells located in the Williams joint venture areas and 20% of our interest in RW Gathering, LLC (“RW Gathering”) (for additional information on RW Gathering, see Note 6, Equity Method Investments, to our Consolidated Financial Statements).
In addition to the areas above, we sold to Sumitomo 50% of our interests in approximately 4,500 net acres in Fayette and Centre Counties, Pennsylvania for $9.2 million in cash at closing and $9.2 million in the form of a drilling carry of 80% of our drilling and completion costs. Pursuant to the Sumitomo PEA, the drilling carry for these areas may be applied, at our discretion, to drilling and completion costs attributable to either the Butler County or Williams joint venture areas.
At closing, we received approximately $99.5 million in cash, which included a reimbursement for leasing expenses incurred subsequent to the effective date of September 1, 2010, in the amount of approximately $7.6 million. Additionally, the cash payment included a reimbursement for drilling related expenses incurred subsequent to the effective date in the amount of approximately $7.5 million, which was applied against the
82
Table of Contents
drilling carry. As of December 31, 2010, the remaining drilling carry with Sumitomo was approximately $28.8 million. The Sumitomo PEA represents a pooling of assets in a joint undertaking by us and Sumitomo and, therefore, we do not make any accounting for amounts paid on our behalf by Sumitomo. We recognized approximately a $16.5 million gain on the Sumitomo transaction which is classified as (Gain) Loss on Disposal of Asset on our Consolidated Statement of Operations.
Williams Joint Venture
In the second quarter of 2009, we entered into a Participation and Exploration Agreement (the “Williams PEA”) with Williams that was effective as of May 5, 2009. Under the terms and conditions of the Williams PEA, Williams may acquire, through a “drill-to-earn” structure, a 50% working interest in certain oil and gas leases covering approximately 43,672 net acres in Centre, Clearfield and Westmoreland Counties, Pennsylvania (the “Project Area”). The Williams PEA effectively provides that, for Williams to earn its 50% interest in the Project Area, Williams will bear 90% of all costs and expenses incurred in the drilling and completion of all wells jointly drilled in the Project Area until such time as Williams has invested approximately $74.0 million (approximately $33.0 million on behalf of us and $41.0 million for Williams’ 50% share of the wells). The Williams PEA represents a pooling of assets in a joint undertaking by us and Williams and, therefore, we do not make any accounting for the $33.0 million paid on our behalf by Williams. In addition, Williams committed to participate in drilling a minimum of 10 horizontal wells in the Project Area to a depth sufficient to test the Marcellus Shale formation. As of December 31, 2010, Williams had completed its carry obligation and acquired a 50% working interest in the leases within the Project Area, the parties will share all costs of the joint venture operations within an area of mutual interest (including the Project Area) in accordance with their participating interests, which are expected to be on a 50 (Williams)/40 (Rex)/10 (Sumitomo) basis.
In accordance with the terms of the Williams PEA, Williams reimbursed us for approximately $3.1 million for Williams’ share of certain expenses incurred in the acquisition and development of oil and gas leases within the Project Area that we had previously paid. Williams became the operator of the project area on January 1, 2010.
Other
In the first quarter of 2009, we completed the sale of certain oil and gas leases, wells and related assets located primarily in the Permian Basin in the states of Texas and New Mexico for net proceeds of approximately $17.3 million and recorded a loss of $0.4 million. We have reflected the results of these divested operations as discontinued operations rather than a component of continuing operations. For additional information, see Note 4, Discontinued Operations/Assets Held for Sale, to our Consolidated Financial Statements
During the third quarter of 2008, we sold approximately 79,000 net undeveloped acres in Indiana and certain related non-producing wells, which was a part of our New Albany Shale exploration projects, for approximately $8.4 million in proceeds. A related loss of approximately $6.3 million was recorded as a part of continuing operations on our Consolidated Statement of Operations.
83
Table of Contents
4. DISCONTINUED OPERATIONS/ASSETS HELD FOR SALE
On March 24, 2009, we completed the sale of certain oil and gas leases, wells and related assets predominantly located in the Permian Basin in the states of Texas and New Mexico. We received net cash proceeds of approximately $17.3 million, which may be adjusted by certain post-closing adjustments, plus the assumption of certain liabilities, based on an effective date of October 1, 2008. Upon closing of the sale, we used the proceeds to pay down our long-term borrowings on our Senior Credit Facility.
Pursuant to the accounting rules for discontinued operations, these assets were classified as Assets Held for Sale on our Balance Sheet as of December 31, 2008, and results of operations are reflected in Discontinued Operations in our Consolidated Statements of Operations. We recorded a loss on sale of assets of approximately $0.4 million in our Consolidated Statement of Operations. Upon closing of the sale, we recorded severance wages in Discontinued Operations of approximately $0.2 million for our former employees in the Southwest Region. Summarized financial information for Discontinued Operations is set forth in the table below, and does not reflect the costs of certain services provided. Such costs, which were not allocated to the Discontinued Operations, were for services, including legal counsel, insurance, external audit fees, payroll processing, certain human resource services and information technology systems support. As of December 31, 2010 and 2009, we did not have any assets or liabilities classified as held for sale.
| December 31, ($ in thousands) |
||||||||||||
| 2010 | 2009 | 2008 | ||||||||||
| Revenues: |
||||||||||||
| Oil and Gas Sales |
$ | — | $ | 193 | $ | 6,051 | ||||||
| Other Revenue |
— | — | 304 | |||||||||
| Total Operating Revenue |
— | 193 | 6,355 | |||||||||
| Costs and Expenses: |
||||||||||||
| Production and Lease Operating Expense |
— | 237 | 1,799 | |||||||||
| General and Administrative Expense |
— | (97 | ) | 907 | ||||||||
| Exploration Expense |
— | — | 2,198 | |||||||||
| Impairment Expense |
— | — | 8,729 | |||||||||
| Depreciation, Depletion, Amortization and Accretion |
— | — | 1,565 | |||||||||
| (Gain) Loss on Sale of Oil and Gas Properties |
— | — | 41 | |||||||||
| (Gain) Loss from Derivatives, net |
— | (558 | ) | 558 | ||||||||
| Other Income |
— | — | (2 | ) | ||||||||
| Total Costs and Expenses |
— | (418 | ) | 15,795 | ||||||||
| Income (Loss) from Discontinued Operations Before Income Taxes |
— | 611 | (9,440 | ) | ||||||||
| Income Tax (Expense) Benefit |
— | (288 | ) | 1,736 | ||||||||
| Income (Loss) from Discontinued Operations, net of taxes |
$ | — | $ | 323 | $ | (7,704 | ) | |||||
| Production: |
||||||||||||
| Crude Oil (Bbls) |
— | 7,507 | 41,332 | |||||||||
| Natural Gas (Mcf) |
— | 61,661 | 311,280 | |||||||||
| Total (Mcfe) |
— | 106,703 | 559,272 | |||||||||
84
Table of Contents
5. VARIABLE INTEREST ENTITIES
Water Solutions Holdings
We have identified Water Solutions Holdings as a variable interest entity (“VIE”) due to the lack of sufficient equity at risk to permit the entity to finance its activities without additional subordinated financial support. As the 80% interest owner in this entity, we have the obligation to absorb a majority of the losses, which could potentially be significant to the entity, as well as the right to receive benefits, which could potentially be significant. Additionally, we have the power to direct the activities of the entity that most significantly impact the entity’s economic performance through our voting rights on the board of directors. Based on these factors, we have concluded that we hold a controlling financial interest in Water Solutions Holdings and are thus considered the primary beneficiary. As primary beneficiary, we fully consolidated the accounts of Water Solutions Holdings in our financial statements and accounted for the 20% equity interest owned by Sand Hills as a noncontrolling interest. As of December 31, 2010, no creditors have provided financing to Water Solutions Holdings; therefore there is no recourse to our general credit. Water Solutions Holdings is financed through cash contributions from its members.
During 2010, we contributed approximately $1.1 million in cash to fund the operations of Water Solutions Holdings. As of December 31, 2010 and 2009, the carrying amount and classification of Water Solutions Holdings assets and liabilities as consolidated into our financial statements were as follows, with no restrictions or obligations to use certain assets to settle associated liabilities (Cash and Cash Equivalents can only be used to settle obligations due from Water Solutions Holdings):
| December 31, 2010 (in thousands) |
December 31, 2009 (in thousands) |
|||||||
| ASSETS |
||||||||
| Cash and Cash Equivalents |
$ | 137 | $ | — | ||||
| Accounts Receivable |
565 | — | ||||||
| Inventory, Prepaid Expense and Other |
6 | — | ||||||
| Other Property and Equipment |
1,004 | — | ||||||
| Wells and Facilities in Progress |
320 | 776 | ||||||
| Less: Accumulated Depreciation, Depletion and Amortization |
(132 | ) | — | |||||
| Intangible Assets—Net |
123 | 25 | ||||||
| Total Assets |
$ | 2,023 | $ | 801 | ||||
| LIABILITIES |
||||||||
| Accounts Payable |
$ | 210 | $ | — | ||||
| Accrued Expenses |
338 | 370 | ||||||
| Total Liabilities |
$ | 548 | $ | 370 | ||||
Keystone Midstream
As of August 31, 2010, we had identified Keystone Midstream to be a VIE because the holders of equity at risk are protected from the first dollar of loss associated with one of the predominant risks of the entity through the pricing terms of a leasing arrangement with us. In accordance with the leasing agreement, we would be responsible for a reservation fee of $0.30 per Mcf per day of capacity for any volumes processed less than 20 MMcf per day for the first year and volumes less than 40 MMcf per day thereafter. As a result of the capacity reservation fee, Stonehenge, the 60% interest owner of Keystone Midstream, will continue to recuperate its capital contributions regardless of the quantities of gas processed. See Note 8, Commitments and Contingencies, to our Consolidated Financial Statements for additional information.
The processing and sale of natural gas and natural gas liquids is identified as the activity that most significantly impacts Keystone Midstream’s economic performance. As of August 31, 2010, we were the sole producer committed to process gas with Keystone Midstream and, thus, had the power to direct the activities of
85
Table of Contents
the entity that most significantly impacts its economic performance through the volumes of gas that we produce combined with our representation on the board of directors. In addition, we were obligated to absorb the majority of the losses of the entity primarily through the capacity reservation fee described above. Based on these factors, it was determined that we held a controlling financial interest in Keystone Midstream and were considered the primary beneficiary. As the primary beneficiary, we fully consolidated the accounts of Keystone Midstream in our financial statements and accounted for the equity interest owned by Stonehenge as a noncontrolling interest. Keystone Midstream is financed through cash contributions from its members.
On September 30, 2010, we sold 30% of our interest in Keystone Midstream to Sumitomo, decreasing our ownership of the entity to 28% and triggering a re-evaluation of the consolidation analysis. Due to our decreased ownership in Keystone Midstream and our decreased ownership of the Butler County, Pennsylvania assets to be serviced by Keystone Midstream (see Note 3, Business and Oil and Gas Property Acquisitions and Dispositions, to our Consolidated Financial Statements); we no longer have the power to direct the activities that most significantly impact the entity’s economic performance. Thus, we are no longer considered the primary beneficiary of Keystone Midstream and have deconsolidated the operations as of September 1, 2010, the effective date of the sale.
Through our deconsolidation of Keystone Midstream we recognized a gain on the transaction of approximately $115,000. This gain was the result of the re-measurement of our retained investment in Keystone Midstream to its fair value. The gain recognized on the deconsolidation of Keystone Midstream was recorded in (Gain) Loss on Disposal of Asset on our Consolidated Statement of Operations. For additional information, see Note 6, Equity Method Investments, to our Consolidated Financial Statements).
As of December 31, 2009, the carrying amount and classification of Keystone Midstream assets and liabilities as consolidated into our financial statements were as follows, with no restrictions or obligations to use certain assets to settle associated liabilities:
| December 31, 2009 (in thousands) |
||||
| ASSETS |
||||
| Wells and Facilities in Progress |
$ | 4,100 | ||
| Total Assets |
$ | 4,100 | ||
| LIABILITIES |
||||
| Accrued Expenses |
$ | 38 | ||
| Total Liabilities |
$ | 38 | ||
6. EQUITY METHOD INVESTMENTS
RW Gathering
Pursuant to the terms of the Williams PEA, we and Williams agreed to form RW Gathering, LLC (“RW Gathering”), a Delaware limited liability company, to own any gas-gathering assets which we agreed to jointly construct in order to facilitate the development of our Project Area. The initial members of RW Gathering were Williams and us, each owning an equal interest in the company. On September 30, 2010, pursuant to the Sumitomo PEA, we sold 20% of our interest in RW Gathering to Sumitomo, decreasing our ownership in RW Gathering to 40% (for additional information, see Note 3, Business and Oil and Gas Property Acquisitions and Dispositions, to our Consolidated Financial Statements). As of January 1, 2010, Williams was the manager of RW Gathering.
We recorded our investment in RW Gathering of approximately $6.4 million and $0.8 million as of December 31, 2010 and 2009, respectively, on our Consolidated Balance Sheets as Equity Method Investments. During 2010, we contributed approximately $5.6 million in cash to RW Gathering to support current pipeline and
86
Table of Contents
gathering line construction, compared to $0.8 million during the same period in 2009. RW Gathering recorded net losses from continuing operations of $60,000 and $1,000 for the years ended December 31, 2010 and 2009, respectively. The losses incurred were due to insurance fees, bank fees, rent expenses and DD&A expense. Our share of the net loss from continuing operations is recorded on the Statements of Operations as Loss on Equity Method Investments.
Keystone Midstream
As of September 1, 2010, we accounted for our 28% ownership interest in Keystone Midstream via the equity method. Prior to September 1, 2010, Keystone Midstream was a consolidated VIE (see Note 5, Variable Interest Entities, to our Consolidated Financial Statements). Under the equity method, we recorded our investment in Keystone Midstream of approximately $12.0 million on our Consolidated Balance Sheet as Equity Method Investments. In 2010 and 2009, we contributed approximately $9.6 million and $2.5 million, respectively, to Keystone Midstream to primarily support the construction of the cryogenic gas processing plant. Keystone Midstream recorded net losses from continuing operations of $0 and $0.8 million for the years ended December 31, 2010 and 2009, respectively.
Prior to September 1, 2010, we consolidated the operations of Keystone Midstream, where Stonehenge’s share of net loss was recorded as Net Loss Attributable to Noncontrolling Interests. Subsequent to August 31, 2010, we record our share of net losses related to Keystone Midstream as Loss on Equity Method Investments on our Consolidated Statement of Operations. Our share of losses incurred to date under the equity method of accounting are primarily due to project management costs, general and administrative expenses, and DD&A expenses and totaled approximately $0.1 million for the year ended December 31, 2010.
7. CONCENTRATIONS OF CREDIT RISK
At times during the years ended December 31, 2010 and 2009, our cash balance may have exceeded the Federal Deposit Insurance Corporation’s limit of $250,000. There were no losses incurred due to such concentrations.
By using derivative instruments to hedge exposure to changes in commodity prices, we are exposed to credit risk and market risk. Credit risk is the failure of the counterparty to perform under the terms of the derivative contract. When the fair value of the derivative is positive, the counterparty owes us, which creates repayment risk. We minimize the credit or repayment risk in derivative instruments by entering into transactions with high-quality counterparties. Our counterparties are investment grade financial institutions, and lenders in our Senior Credit Facility. We have a master netting agreement in place with our counterparties that provides for the offsetting of payables against receivables from separate derivative contracts. None of our derivative contracts have a collateral provision that would require funding prior to the scheduled settlement date. For additional information, see Note 2, Summary of Significant Accounting Policies, and Note 11, Fair Value of Financial Instruments and Derivative Instruments, to our Consolidated Financial Statements.
We also depend on a relatively small number of purchasers for a substantial portion of our revenue. At December 31, 2010, we carried approximately $8.1 million in production receivable, of which approximately $5.1 million were production receivables due from a single customer, CountryMark Cooperative LLP (“CountryMark”). At December 31, 2009, we carried approximately $6.3 million in production receivable, of which approximately $4.2 million were production receivables due from CountryMark. During the first quarter of 2009, we placed into operation an oil offload facility in the Illinois Basin that we believe will enable us to diversify the purchasers of our oil in the future if we choose to do so. Additionally, we believe the growth in our Appalachian proved reserves will help us to minimize our future risks by diversifying our ratio of oil and gas sales as well as the quantity of purchasers.
87
Table of Contents
8. COMMITMENTS AND CONTINGENCIES
Legal Reserves
At December 31, 2010, our Consolidated Balance Sheet included approximately $0.2 million in reserve for the legal matters referenced in Note 23—Litigation. At December 31, 2009, our Consolidated Balance Sheet included $1.4 million in reserve for various legal proceedings. The accrual of reserves for legal matters is included in Accrued Expenses on the Consolidated Balance Sheets. The establishment of a reserve involves an estimation process that includes the advice of legal counsel and subjective judgment of management. While management believes these reserves to be adequate, it is reasonably possible that we could incur additional loss, the amount of which is not currently estimable, in excess of the amounts currently accrued with respect to those matters in which reserves have been established. Future changes in the facts and circumstances could result in actual liability exceeding the estimated ranges of loss and the amounts accrued. Based on currently available information, we believe that it is remote that future costs related to known contingent liability exposures for legal proceedings will exceed current accruals by an amount that would have a material adverse effect on our consolidated financial position or results of operations, although cash flow could be significantly impacted in the reporting periods in which such costs are incurred.
Acreage Bonus Payments
At December 31, 2010, we had three installment payment commitments on mineral interests that were previously leased. The first commitment provides that we pay $350 per mineral acre for 5,722 acres, or a total commitment of $2.0 million, in 2012. The second commitment requires that we pay $250 per mineral acre for 5,761 acres, or $1.4 million, in each of the next two years for a total commitment of $2.8 million. The third commitment requires that we pay $350 per mineral acre for 762 acres, or $0.3, in each of the next two years for a total commitment of $0.6. We have recorded $1.7 million as a short-term liability in Accrued Expenses on the Consolidated Balance Sheets. The long-term portion of these payments is being recorded in Other Deposits and Liabilities on the Consolidated Balance Sheets.
Environmental
Due to the nature of the natural gas and oil business, we are exposed to possible environmental risks. We have implemented various policies and procedures to avoid environmental contamination and risks from environmental contamination. We conduct periodic reviews to identify changes in the environmental risk profile. These reviews evaluate whether there is a probable liability, its amount, and the likelihood that the liability will be incurred. The amount of any potential liability is determined by considering, among other matters, incremental direct costs of any likely remediation and the proportionate salaries and wages cost of employees who are expected to devote a significant amount of time directly to any remediation effort.
We manage our exposure to environmental liabilities on properties to be acquired by identifying existing problems and assessing the potential liability. Except for contingent liabilities associated with the consent decree with the U.S. EPA relating to alleged H 2 S emissions in the Lawrence Field, we know of no significant probable or possible environmental contingent liabilities.
Contract Wells
In March 2004, we purchased from Standard Steel, LLC certain contractual rights associated with various gas purchase contracts relating to 19 natural gas wells located in Westmoreland County, Pennsylvania. Under the terms of the contracts, we buy 100.0% of the production from these wells from third parties at contracted, fixed prices. The prices we pay may range from $1.10 per Mcf to 55.0% of the market price, plus a $0.10 per Mcf surcharge. There is no loss on these commitments. We have recorded the gross revenue and costs in the Consolidated Statements of Operations. We sell the natural gas extracted from these contract wells to parties unrelated to these natural gas wells and contracts.
88
Table of Contents
Letters of Credit
We have posted $0.8 million, at December 31, 2010, in various letters of credit to secure our drilling and related operations.
Lease Commitments
At December 31, 2010 we have lease commitments for three different office locations and a townhouse. Rent expense has been recorded in General and Administrative expense as $0.4 million, $0.4 million and $0.3 million for the years ended December 31, 2010, 2009 and 2008, respectively. Lease commitments by year for each of the next five years are presented in the table below ($ in thousands).
| 2011 |
$ | 480 | ||
| 2012 |
459 | |||
| 2013 |
463 | |||
| 2014 |
— | |||
| 2015 |
— | |||
| Thereafter |
— | |||
| Total |
$ | 1,402 | ||
Capacity Reservation
In connection with the formation of Keystone Midstream (see Note 5, Variable Interest Entities, and Note 6, Equity Method Investments, to our Consolidated Financial Statements), we entered into a capacity reservation arrangement with Keystone Midstream to ensure sufficient capacity at the Sarsen cryogenic gas processing plant to process our produced natural gas. Under the terms of the arrangement, we have reserved 20 Mmcfe of processing capacity per day for the first year of operations and 40 Mmcfe of processing capacity for the subsequent nine years of operation. If we do not meet our capacity reservation volumes, we are obligated to pay $0.30/Mcfe per day for the difference between actual processed volumes and the reservation volume. The capacity reservation arrangement will be effective on January 1, 2011. As a part of the Sumitomo PEA, we sold to Sumitomo non-operating interests in our Butler County, Pennsylvania project areas, which will be serviced by Keystone Midstream. Pursuant to the terms of the agreement, Sumitomo became a legal party to the capacity reservation arrangement and will be responsible for its proportionate share of the capacity reservation fee in the event that a fee is incurred. It is anticipated that Sumitomo’s proportionate interest will be approximately 30%.
In the event that we do not process any gas through the cryogenic gas processing plant we may be obligated to pay approximately $1.5 million for the first year of operation and approximately $3.1 million for each of the following nine years. As of December 31, 2010, management believes that the probability of incurring these liabilities is remote and that any reservation fee that would be due is not estimable, thus, no provision has been recorded.
Other
In addition to the asset retirement obligation discussed in Note 2, Summary of Significant Accounting Policies, we have withheld from distributions to certain other working interest owners amounts to be applied towards their share of those retirement costs. Such amounts, totaling $0.3 million, are included in Other Deposits and Liabilities at December 31, 2010 and December 31, 2009, respectively.
As of December 31, 2010, we agreed to fund additional expenditures to accelerate the timeline of the Sarsen cryogenic gas processing plant. The expenditures are estimated to be approximately $1.2 million, which we have recorded as Accrued Expenses on our Consolidated Balance Sheet.
89
Table of Contents
9. RELATED PARTY TRANSACTIONS
Leasing Activities
From September 2006 to May 2008, we leased an office building from Shaner Brothers, LLC, a Pennsylvania limited liability company (“Shaner Brothers”). Shaner Brothers is owned by Lance T. Shaner, our Chairman, and Shaner Family Partners Limited Partnership, a Pennsylvania limited partnership controlled by Mr. Shaner. In December 2007, we entered into a new office lease agreement with an unrelated third party and we relocated to the new office space in May 2008. Shaner Brothers thereafter terminated the office lease agreement, leased the office space to an unrelated third party and released us from any further obligations under the agreement. In 2008, we incurred approximately $40,000 in expense paid to Shaner Brothers for rent on this office.
Service Arrangements
In April 2007, we entered into an IT Consultation and Support Services Agreement (the “IT Agreement”), a Service Provider Agreement (the “Service Provider Agreement”) and a Tax Return Engagement Letter Agreement (the “Tax Services Agreement”) with Shaner Hotel Group Limited Partnership, a Delaware limited partnership controlled by Mr. Shaner (“Shaner Hotel”). Pursuant to the IT Agreement, Shaner Hotel agreed to provide us with telecommunication, network administration, and information technology consultation services. Fees for the services provided under this agreement ranged from $55.00 to $125.00 per hour. Pursuant to the Service Provider Agreement, Shaner Hotel agreed to provide us with certain clerical and administrative support services in connection with the management and administration of our 401(k) retirement plan, payroll and employee health and welfare benefit plans. Fees for services provided under this agreement, ranged from $55.00 per hour to $95.00 per hour. Pursuant to the Tax Services Agreement, Shaner Hotel agreed to provide us with certain tax planning and tax return preparation services. Fees for the services provided under this agreement ranged from $100.00 to $155.00 per hour. All three agreements could be terminated by either party upon 90 days advance written notice. For services provided under these agreements, we paid $0.1 million to Shaner Hotels for 2008. We elected to terminate the IT Agreement and Service Provider Agreement during 2008, but we did not terminate the Tax Services Agreement. For 2009, we paid Shaner Hotel approximately $5,000 for services provided under the Tax Services Agreement. We have engaged a third-party to provide us with tax planning and preparation services and expect to limit services provided under the Tax Services Agreement to only prior tax years. No expenses related to these agreements were incurred in 2010.
Aircraft Services
We currently have an oral month-to-month agreement with Charlie Brown Air Corp., a New York corporation owned by Mr. Shaner (“Charlie Brown”), regarding the use of one airplane owned by Charlie Brown. Under our agreement with Charlie Brown, we pay a variable per hour flight rate that ranges from $400 to $1,850 per hour. For the years ended December 31, 2010, 2009 and 2008, we paid Charlie Brown $0.4 million, $0.1 million and $0.1 million, respectively, in relation to these services.
We own a 25% membership interest in Charlie Brown Air II, LLC (“Charlie Brown II”). Shaner Hotel and an unrelated third party each own 25% and 50%, respectively, in Charlie Brown II, which owns and operates an Eclipse 500 aircraft, which was purchased for approximately $1.7 million.
Charlie Brown II has a loan from Graystone Bank to purchase the aircraft that was originally $1.5 million at its inception in June 2007. The loan matures on June 21, 2017 and bears interest at a rate of LIBOR plus 2.5%. The loan required payments of interest only for the first three months of the loan. Thereafter, Charlie Brown II has been required to make monthly payments of principal and interest utilizing an amortization period of 180 months. The Company and Shaner Hotel each guarantee up to twenty five percent, or $0.4 million, of the principal balance of the loan. The balance of this loan as of December 31, 2010, was approximately $1.4 million. For the years ended December 31, 2010, 2009 and 2008, we paid Charlie Brown II $0.2 million, $0.2 million and $0.1 million, respectively, for loan interest, services rendered and retainer fees.
90
Table of Contents
The business affairs of Charlie Brown Air II, LLC are managed by three managers, appointed by each of its three members. We have designated Daniel J. Churay, our President and Chief Executive Officer, as the manager representing our membership interest. Actions of the company must be approved by a majority of the interest percentages of the managers. Each manager votes in matters before the company in accordance with the membership interest percentage of the member that appointed the manager. Certain events, such as the sale by a member of its interest, the merger or consolidation of the company, the filing of bankruptcy, or the sale of the airplane owned by Charlie Brown Air II, LLC, require the written consent of all managers. The consent of managers is also required before the company may change or terminate the management agreement with Charlie Brown, incur any indebtedness, sell substantially all of the company’s assets or sell the airplane owned by the company. In the event that the members are unable to unanimously agree upon any of these matters within 10 days of the proposal of any such matter, an “impasse” may be declared, and the airplane will be sold by the company.
In September 2010, we purchased an undivided 50% interest in a Cessna model 550 aircraft from Charlie Brown for approximately $0.6 million. The purchase of the aircraft has been recorded as Other Property and Equipment on our Consolidated Balance Sheet.
Lance Shaner is our Chairman and a significant stockholder of the Company. Mr. Shaner’s ownership and association with Shaner Brothers, Shaner Solutions, Shaner Hotel, Charlie Brown, Charlie Brown II and us could create a conflict of interest between the interests of those entities and Mr. Shaner’s duties and obligations to us. The compensation for these arrangements and the purchase, leasing, financing, management and other arrangements between us and any Shaner affiliates may not be (to the extent permissible under applicable laws and regulations) a result of arm’s-length negotiations, and the relationships created by virtue of these arrangements may be subject to certain conflicts of interest. Our board of directors (with Mr. Shaner abstaining) performs a regular review of these contractual agreements, whether oral or written, and may continue, extend, amend or terminate any of these agreements.
RW Gathering, LLC
Pursuant to the terms of the Williams PEA, we and Williams agreed to form RW Gathering to own any gas-gathering assets which we agreed to jointly construct in order to facilitate the development of our Project Area (see Note 6, Equity Method Investments, to our Consolidated Financial Statements). For the year ended December 31, 2010, we incurred approximately $0.2 million in compression expenses that were charged to us from Williams Production Appalachia, LLC. These costs are in relation to compression costs incurred by RW Gathering and are recorded as Production and Lease Operating Expense on our Consolidated Statement of Operations. We did not incur such charges in 2009 from Williams Production Appalachia, LLC because we were the operator of RW Gathering at that time. As of December 31, 2010 and 2009, there were no receivables or payables in relation to RW Gathering due to or from us.
Keystone Midstream
We incurred approximately $0.3 million in transportation and processing expenses that were charged to us from Keystone Midstream during 2010 (see Note 1, Basis of Presentation and Principles of Consolidation, Note 5, Variable Interest Entities, and Note 6, Equity Method Investments, to our Consolidated Financial Statements). Prior to September 1, 2010, charges incurred for transportation were eliminated in consolidation. Subsequent to August 31, 2010, such transportation charges are recorded as Production and Lease Operating Expense on our Consolidated Statements of Operations, which total approximately $0.2 million. As of December 31, 2010, we had Accrued Expenses due to Keystone Midstream of approximately $1.3 million, which was comprised of $0.1 million in transportation and processing expenses incurred during the fourth quarter 2010 and $1.2 million in expenses due from us to fund the acceleration of the Sarsen cryogenic gas processing plant construction. There were no related party expenses or amounts due to or from us to Keystone Midstream prior to January 1, 2010.
91
Table of Contents
10. LONG-TERM DEBT
We maintain a revolving credit facility evidenced by the Credit Agreement, dated September 28, 2007, with KeyBank, as Administrative Agent; Royal Bank of Canada, as Syndication Agent; Sovereign Bank, as Documentation Agent; and lenders from time to time parties thereto (as amended from time to time, the “Senior Credit Facility”). Borrowings under the Senior Credit Facility are limited by a borrowing base that is determined in regard to our oil and gas properties. The borrowing base under the Senior Credit Facility is currently $125.0 million; however, the revolving credit facility may be increased up to $300 million upon re-determinations of the borrowing base, consent of the lenders and other conditions prescribed in the agreement. The Senior Credit Facility provides that the borrowing base will be re-determined semi-annually by the lenders, in good faith, based on, among other things, reports regarding our oil and gas reserves attributable to our oil and gas properties, together with a projection of related production and future net income, taxes, operating expenses and capital expenditures. We may, or the Administrative Agent at the direction of a majority of the lenders may, each elect once per calendar year to cause the borrowing base to be re-determined between the scheduled re-determinations. In addition, we may request interim borrowing base re-determinations upon our proposed acquisition of proved developed producing oil and gas reserves with a purchase price for such reserves greater than 10% of the then borrowing base.
On August 30, 2010, we entered into a Fifth Amendment to Credit Agreement (the “Fifth Amendment”) with KeyBank National Association, as Administrative Agent, and the other lenders signatory thereto; amending the Senior Credit Facility. The Fifth Amendment was effective as of August 30, 2010 and amends certain provisions of the Senior Credit Facility, including waiving certain provisions of the Senior Credit Facility to permit our sale and transfer of interest in our Marcellus Shale assets located in the Commonwealth of Pennsylvania, pursuant to the terms and conditions of the Sumitomo PEA. The Fifth Amendment also amended the Senior Credit Facility by increasing the borrowing base from $100.0 million to $125.0 million, effective upon the execution of the Sumitomo PEA. The Fifth Amendment also extended the maturity date of the Senior Credit Facility from September 28, 2012 to September 28, 2013. In addition, pursuant to the Fifth Amendment, Bank of Montreal, Union Bank, N.A., and Wells Fargo Bank, N.A., agreed to become lenders under the Senor Credit Facility, and Allied Irish Bank withdrew as a lender.
Borrowings under the Senior Credit Facility bear interest, at our election, at the Adjusted LIBOR or the Alternative Base Rate (as defined below) plus, in each case an applicable per annum margin. The applicable per annum margin is determined based upon our total borrowing base utilization percentage in accordance with a pricing grid. The applicable per annum margin ranges from 2.00% to 2.75% for Eurodollar loans and .75% to 1.50% for ABR loans. The Adjusted Base Rate is equal to the greater of: (i) KeyBank’s announced prime rate; (ii) the federal funds effective rate from time to time plus 1/2 of 1%; and (iii) LIBO Rate plus 1.25%. Our commitment fee is also dependent on our total borrowing base utilization percentage and is determined based upon an applicable per annum margin which is a flat rate of .50%.
Under the Senior Credit Facility, we may enter into commodity swap agreements with counterparties approved by the lenders, provided that the notional volumes for such agreements, when aggregated with other commodity swap agreements then in effect (other than basis differential swaps on volumes already hedged pursuant to other swap agreements), do not exceed, as of the date the swap agreement is executed, 85% of the reasonably anticipated projected production from our proved developed producing reserves for the 36 months following the date such agreement is entered into, and 75% thereafter, for each of crude oil and natural gas, calculated separately. We may also enter into interest rate swap agreements with counterparties approved by the lenders that convert interest rates from floating to fixed provided that the notional amounts of those agreements, when aggregated with all other similar interest rate swap agreements then in effect, do not exceed the greater of $20 million and 75% of the then outstanding principal amount of our debt for borrowed money which bears interest at a floating rate.
The Senior Credit Facility contains covenants that restrict our ability to, among other things, materially change our business; approve and distribute dividends; enter into transactions with affiliates; create or acquire
92
Table of Contents
additional subsidiaries; incur indebtedness; sell assets; make loans to others; make investments; enter into mergers; incur liens; and enter into agreements regarding swap and other derivative transactions (for further information, see Note 2, Summary of Significant Accounting Policies, Note 7, Concentrations of Credit Risk, and Note 11, Fair Value of Financial Instruments and Derivative Instruments, to our Consolidated Financial Statements). The Senior Credit Facility also requires we meet, on a quarterly basis, minimum financial requirements of consolidated current ratio, EBITDAX to interest expense and total debt to EBITDAX. Borrowings under the Senior Credit Facility have been used to finance our working capital needs and for general corporate purposes in the ordinary course of business, including the exploration, acquisition and development of oil and gas properties. Obligations under the Senior Credit Facility are secured by mortgages on the oil and gas properties of our subsidiaries located in the states of Illinois and Indiana. We are required to maintain liens covering our oil and gas properties representing at least 80% of our total value of all oil and gas properties.
We pledge our oil and natural gas properties as collateral under the Senior Credit Facility and are subject to certain financial covenants. The first of such covenants states that as of the last day of any fiscal quarter, our ratio of EBITDAX for the period of four fiscal quarters ending on such day to interest expense for such period is to be less than 3.0 to 1.0. Additionally, as of the last day of any fiscal quarter our ratio of total debt to EBITDAX for the period of four fiscal quarters ending on such day is to be greater than 4.0 to 1.0. The last covenant states that as of the last day of any fiscal quarter, our ratio of consolidated current assets as of such day to consolidated current liabilities as of such day is to be less than 1.0 to 1.0. As of December 31, 2010, we were in compliance with all of our debt covenants.
In addition to our Senior Credit Facility, we may, from time to time in the normal course of business, finance assets such as vehicles, office equipment and leasehold improvements through debt financing at favorable terms. Long-term debt and lines of credit consists of the following at December 31, 2010 and 2009:
| December 31, 2010 (in thousands) |
December 31, 2009 (in thousands) |
|||||||
| Senior-Secured Lines of Credit(a) |
$ | 10,000 | $ | 23,000 | ||||
| Other Loans and Notes Payable |
949 | 366 | ||||||
| Total Debts |
10,949 | 23,366 | ||||||
| Less Current Portion of Long-Term Debt |
(829 | ) | (317 | ) | ||||
| Total Long-Term Debts |
$ | 10,120 | $ | 23,049 | ||||
| (a) | The Senior Credit Facility requires us to make monthly payments of interest on the outstanding balance of loans made under the agreement. Loans made under the Senior Credit Facility mature on September 28, 2013, and in certain circumstances, we will be required to prepay the loans. The average interest rate on borrowings under our Senior Credit Facility for the year ended December 31, 2010 was approximately 2.3%. The average interest rate on our Other Loans and Notes Payable is approximately 2.4%. |
93
Table of Contents
The following is the principal maturity schedule for debt outstanding as of December 31, 2010:
| Year Ended December 31, (in thousands) |
||||
| 2011 |
$ | 829 | ||
| 2012 |
120 | |||
| 2013 |
10,000 | |||
| 2014 |
— | |||
| 2015 |
— | |||
| Thereafter |
— | |||
| Total |
$ | 10,949 | ||
11. FAIR VALUE OF FINANCIAL INSTRUMENTS AND DERIVATIVE INSTRUMENTS
Our results of operations and operating cash flows are impacted by changes in market prices for oil and natural gas. To mitigate a portion of the exposure to adverse market changes, we enter into oil and natural gas commodity derivative instruments to establish price floor protection. As such, when commodity prices decline to levels that are less than our average price floor, we receive payments that supplement our cash flows. Conversely, when commodity prices increase to levels that are above our average price ceiling, we make payments to our counterparties. We do not enter into these arrangements for speculative trading purposes. As of December 31, 2010, 2009 and 2008, our oil and natural gas derivative commodity instruments consisted of fixed rate swap contracts, puts, collars and put spreads. We did not designate these instruments as cash flow hedges for accounting purposes. Accordingly, associated unrealized gains and losses are recorded directly as other income or expense. For additional information, see Note 2, Summary of Significant Accounting Policies, to our Consolidated Financial Statements.
Swap contracts provide a fixed price for a notional amount of sales volumes. Collars contain a fixed floor price (“put”) and ceiling price (“call”). The put options are purchased from the counterparty by our payment of a cash premium. If the put strike price is greater than the market price for a calculation period, then the counterparty pays us an amount equal to the product of the notional quantity multiplied by the excess of the strike price over the market price. The call options are sold to the counterparty, for which we receive a cash premium. If the market price is greater than the call strike price for a calculation period, then we pay the counterparty an amount equal to the product of the notional quantity multiplied by the excess of the market price over the strike price.
We enter into the majority of our derivative arrangements with two counterparties and have a netting agreement in place with these counterparties. We do not obtain collateral to support the agreements, but we believe our credit risk is currently minimal on these transactions. For additional information on the credit risk regarding our counterparties, see Note 7, Concentrations of Credit Risk, to our Consolidated Financial Statements.
None of our derivatives are designated for hedge accounting but are, to a degree, an economic offset to our oil and natural gas price exposure. We utilize the mark-to-market accounting method to account for these contracts. We recognize all unrealized and realized gains and losses related to these contracts in the Consolidated Statements of Operations as Gain (Loss) on Derivatives, Net under Other Income (Expense).
We received net cash receipts of $0.8 million and $10.4 million for the years ended December 31, 2010 and 2009, respectively. We made net payments of approximately $16.2 million for the year ended December 31, 2008. During the first quarter of 2009, we redeemed our oil hedges related to production in 2011 for net cash proceeds of approximately $4.6 million. Unrealized gains and losses associated with our commodity derivative instruments from continuing operations amounted to a gain of $6.0 million, a loss of $17.1 million and a gain of $43.7 million for the years ended December 31, 2010, 2009 and 2008, respectively.
94
Table of Contents
The following table summarizes the location and amounts of gains and losses on derivative instruments, none of which are designated as hedges for accounting purposes, in our accompanying Consolidated Statements of Operations for the years ended December 31, 2010, 2009 and 2008:
| Year Ended December 31, 2010 (in thousands) |
||||||||||||
| Realized Gains (Losses) |
Unrealized Gains (Losses) |
Total | ||||||||||
| Crude Oil |
||||||||||||
| Reclassification of settled contracts included in prior periods mark-to-market adjustments |
$ | — | $ | 5,782 | $ | 5,782 | ||||||
| Mark-to-market fair value adjustments |
— | (2,819 | ) | (2,819 | ) | |||||||
| Settlement of contracts(a) |
(3,861 | ) | — | (3,861 | ) | |||||||
| Crude Oil Total |
(3,861 | ) | 2,963 | (898 | ) | |||||||
| Natural Gas |
||||||||||||
| Reclassification of settled contracts included in prior periods mark-to-market adjustments |
— | (1,925 | ) | (1,925 | ) | |||||||
| Mark-to-market fair value adjustments |
— | 4,211 | 4,211 | |||||||||
| Settlement of contracts(a) |
4,667 | — | 4,667 | |||||||||
| Natural Gas Total |
4,667 | 2,286 | 6,953 | |||||||||
| Interest Rate |
||||||||||||
| Reclassification of settled contracts included in prior periods mark-to-market adjustments |
— | 711 | 711 | |||||||||
| Mark-to-market fair value adjustments |
— | — | — | |||||||||
| Settlement of contracts(a) |
(711 | ) | — | (711 | ) | |||||||
| Interest Rate Total |
(711 | ) | 711 | — | ||||||||
| Gain (Loss) on Derivatives, Net |
$ | 95 | $ | 5,960 | $ | 6,055 | ||||||
| (a) | These amounts represent the realized gains and losses on settled derivatives, which before settlement are included in the mark-to-market fair value adjustments. |
| Year Ended December 31, 2009 (in thousands) |
||||||||||||
| Realized Gains (Losses) |
Unrealized Gains (Losses) |
Total | ||||||||||
| Crude Oil |
||||||||||||
| Reclassification of settled contracts included in prior periods mark-to-market adjustments |
$ | — | $ | (10,331 | ) | $ | (10,331 | ) | ||||
| Mark-to-market fair value adjustments |
— | (8,114 | ) | (8,114 | ) | |||||||
| Settlement of contracts(a) |
7,198 | — | 7,198 | |||||||||
| Crude Oil Total |
7,198 | (18,445 | ) | (11,247 | ) | |||||||
| Natural Gas |
||||||||||||
| Reclassification of settled contracts included in prior periods mark-to-market adjustments |
— | (1,091 | ) | (1,091 | ) | |||||||
| Mark-to-market fair value adjustments |
— | 1,518 | 1,518 | |||||||||
| Settlement of contracts(a) |
3,216 | — | 3,216 | |||||||||
| Natural Gas Total |
3,216 | 427 | 3,643 | |||||||||
| Interest Rate |
||||||||||||
| Reclassification of settled contracts included in prior periods mark-to-market adjustments |
— | 611 | 611 | |||||||||
| Mark-to-market fair value adjustments |
— | (151 | ) | (151 | ) | |||||||
| Settlement of contracts(a) |
(769 | ) | — | (769 | ) | |||||||
| Interest Rate Total |
(769 | ) | 460 | (309 | ) | |||||||
| Gain (Loss) on Derivatives, Net |
$ | 9,645 | $ | (17,558 | ) | $ | (7,913 | ) | ||||
| (a) | These amounts represent the realized gains and losses on settled derivatives, which before settlement are included in the mark-to-market fair value adjustments. |
95
Table of Contents
| Year Ended December 31, 2008 (in thousands) |
||||||||||||
| Realized Gains (Losses) |
Unrealized Gains (Losses) |
Total | ||||||||||
| Crude Oil |
||||||||||||
| Reclassification of settled contracts included in prior periods mark-to-market adjustments |
$ | — | $ | 10,863 | $ | 10,863 | ||||||
| Mark-to-market fair value adjustments |
— | 30,584 | 30,584 | |||||||||
| Settlement of contracts(a) |
(15,613 | ) | — | (15,613 | ) | |||||||
| Crude Oil Total |
(15,613 | ) | 41,447 | 25,834 | ||||||||
| Natural Gas |
||||||||||||
| Reclassification of settled contracts included in prior periods mark-to-market adjustments |
— | 9 | 9 | |||||||||
| Mark-to-market fair value adjustments |
— | 3,461 | 3,461 | |||||||||
| Settlement of contracts(a) |
(554 | ) | — | (554 | ) | |||||||
| Natural Gas Total |
(554 | ) | 3,470 | 2,916 | ||||||||
| Interest Rate |
||||||||||||
| Reclassification of settled contracts included in prior periods mark-to-market adjustments |
— | — | — | |||||||||
| Mark-to-market fair value adjustments |
— | (1,171 | ) | (1,171 | ) | |||||||
| Settlement of contracts(a) |
(251 | ) | — | (251 | ) | |||||||
| Interest Rate Total |
(251 | ) | (1,171 | ) | (1,422 | ) | ||||||
| Gain (Loss) on Derivatives, Net |
$ | (16,418 | ) | $ | 43,746 | $ | 27,328 | |||||
| (a) | These amounts represent the realized gains and losses on settled derivatives, which before settlement are included in the mark-to-market fair value adjustments. |
As of December 31, 2009, we had entered into an interest rate swap derivative instrument which hedged our interest rate risk associated with changes in LIBOR on $20.0 million of notional value. This interest rate swap contract expired in November 2010. We used the interest rate swap agreement to manage the risk associated with interest payments on amounts outstanding from variable rate borrowings under our Senior Credit Facility. Under our interest rate swap agreement, we agreed to pay an amount equal to a specified fixed rate of interest times a notional principal amount, and to receive in return, a specified variable rate of interest times the same notional principal amount. The interest rate under the swap was 4.15%. The fair value of the swap at December 31, 2009 was a liability of $0.7 million, a decrease of $0.5 million from the year ended December 31, 2008 based on current LIBOR quotes. We have accounted for the interest rate swap by recording the unrealized and realized gains in Gain (Loss) on Derivatives, Net on our Consolidated Statements of Operations.
Our derivative instruments are recorded on the balance sheet as either an asset, or a liability, measured at its fair value. The fair value associated with our derivative instruments from continuing operations was an asset of approximately $2.6 million and a liability of $3.3 million at December 31, 2010 and 2009, respectively. The fair value is based on the valuation methodologies of our counterparties and third-party valuation providers. The use of different market assumptions or valuation methodologies may have a material effect on the estimated fair value amounts.
96
Table of Contents
Our open asset/(liability) financial commodity derivative instrument positions at December 31, 2010 consisted of:
| Period |
Volume | Put Option |
Floor | Ceiling | Swap | Fair Market Value ($ in Thousands) |
||||||||||||||||||
| Oil |
||||||||||||||||||||||||
| 2011—Collar |
576,000 Bbls | $ | — | $ | 68.54 | $ | 104.69 | $ | — | $ | (1,850 | ) | ||||||||||||
| 2012—Collar |
540,000 Bbls | — | 67.10 | 112.03 | — | (1,365 | ) | |||||||||||||||||
| 1,116,000 Bbls | $ | (3,215 | ) | |||||||||||||||||||||
| Natural Gas |
||||||||||||||||||||||||
| 2011—Swap |
720,000 Mcf | $ | — | $ | — | $ | — | $ | 5.28 | $ | 519 | |||||||||||||
| 2011—Put Spread |
720,000 Mcf | 3.68 | 5.00 | — | — | 449 | ||||||||||||||||||
| 2011—Collar |
1,320,000 Mcf | — | 5.18 | 7.18 | — | 1,122 | ||||||||||||||||||
| 2011—Put |
720,000 Mcf | — | 8.00 | — | — | 2,464 | ||||||||||||||||||
| 2012—Swap |
1,320,000 Mcf | — | — | — | 5.58 | 663 | ||||||||||||||||||
| 2012—Collar |
1,320,000 Mcf | — | 5.09 | 7.07 | — | 635 | ||||||||||||||||||
| 6,120,000 Mcf | $ | 5,852 | ||||||||||||||||||||||
The combined fair value of derivatives, none of which are designated or qualifying as hedges, included in our Consolidated Balance Sheets as of December 31, 2010 and December 31, 2009 is summarized below.
| December 31, 2010 (in thousands) |
December 31, 2009 (in thousands) |
|||||||
| Short-Term Derivative Assets: |
||||||||
| Crude Oil—Collars |
$ | — | $ | 178 | ||||
| Natural Gas—Swaps |
519 | 25 | ||||||
| Natural Gas—Collars |
1,132 | 1,921 | ||||||
| Natural Gas—Puts |
2,464 | — | ||||||
| Natural Gas—Put Spread |
449 | — | ||||||
| Total Short-Term Derivative Assets |
$ | 4,564 | $ | 2,124 | ||||
| Long-Term Derivative Assets: |
||||||||
| Crude Oil—Collars |
$ | 63 | $ | 9 | ||||
| Natural Gas—Swaps |
663 | — | ||||||
| Natural Gas—Collars |
723 | 1,664 | ||||||
| Total Long-Term Derivative Assets |
$ | 1,449 | $ | 1,673 | ||||
| Total Derivative Assets |
$ | 6,013 | $ | 3,797 | ||||
| Short-Term Derivative Liabilities: |
||||||||
| Crude Oil—Swaps |
$ | — | $ | (3,615 | ) | |||
| Crude Oil—Collars |
(1,850 | ) | (2,346 | ) | ||||
| Natural Gas—Collars |
(10 | ) | (20 | ) | ||||
| Interest Rate—Swap |
— | (711 | ) | |||||
| Total Short-Term Derivative Liabilities |
$ | (1,860 | ) | $ | (6,692 | ) | ||
| Long-Term Derivative Liabilities: |
||||||||
| Crude Oil—Collars |
$ | (1,428 | ) | $ | (405 | ) | ||
| Natural Gas—Collars |
(88 | ) | (21 | ) | ||||
| Total Long-Term Derivative Liabilities |
$ | (1,516 | ) | $ | (426 | ) | ||
| Total Derivative Liabilities |
$ | (3,376 | ) | $ | (7,118 | ) | ||
Effective January 1, 2008, we adopted FASB ASC 820-10, which among other things, requires enhanced disclosures about assets and liabilities carried at fair value. As defined in FASB ASC 820-10, fair value is the price that would be received to sell an asset or paid to transfer a liability in an orderly transaction between market
97
Table of Contents
participants at the measurement date (exit price). We utilize market data or assumptions that market participants would use in pricing the asset or liability, including assumptions about risk and the risks inherent in the inputs to the valuation technique. These inputs can be readily observable, market corroborated or generally unobservable. We primarily apply the market approach for recurring fair value measurements and attempt to utilize the best available information. FASB ASC 820-10 establishes a fair value hierarchy that prioritizes the inputs used to measure fair value. The hierarchy gives the highest priority to unadjusted quoted prices in active markets for identical assets or liabilities (Level 1 measurement) and lowest priority to unobservable inputs (Level 3 measurement). The three levels of fair value hierarchy defined by FASB ASC 820-10 are as follows:
Level 1—Quoted prices are available in active markets for identical assets or liabilities as of the reporting date.
Level 2—Pricing inputs other than quoted prices in active markets included in Level 1, which are either directly or indirectly observable as of the reporting date. Level 2 includes those financial instruments that are valued using models or other valuation methodologies. These models are primarily industry-standard models that consider various assumptions, including quoted forward prices for commodities, time value, volatility factors and current market and contractual prices for the underlying instruments, as well as other relevant economic measures. Our derivatives, which consist primarily of commodity swaps and collars, are valued using commodity market data which is derived by combining raw inputs and quantitative models and processes to generate forward curves. Where observable inputs are available, directly or indirectly, for substantially the full term of the asset or liability, the instrument is categorized in Level 2.
Level 3—Pricing inputs include significant inputs that are generally less observable from objective sources. These inputs may be used with internally developed methodologies that result in management’s best estimate of fair value.
The following table presents the fair value hierarchy table for assets and liabilities measured at fair value ($ in thousands):
| Total Carrying Value as of December 31, 2010 |
Fair Value Measurements at December 31, 2010 Using: |
|||||||||||||||
| Quoted Prices in Active Markets for Identical Assets (Level 1) |
Significant Other Observable Inputs (Level 2) |
Significant Unobservable Inputs (Level 3) |
||||||||||||||
| Derivatives(a)—commodity swaps, collars and put options |
$ | 2,637 | $ | — | $ | 2,637 | $ | — | ||||||||
| Asset Retirement Obligations |
$ | (17,222 | ) | $ | — | $ | — | $ | (17,222 | ) | ||||||
| (a) | All of our derivatives are classified as Level 2 measurements. For information regarding their classification on our Consolidated Balance Sheets, please refer to the table on page 97 of this report. |
Our derivative contracts are valued by third parties using valuation models that are primarily industry-standard models that consider various inputs including: quoted forward prices; time value; volatility factors; and current market and contractual prices for the underlying instruments, as well as other relevant economic measures. We classify our derivatives as Level 2 if the inputs used in the valuation models are directly observable for substantially the full term of the instrument; however, if the significant inputs were not observable for substantially the full term of the instrument, we would classify those derivatives as Level 3. We categorize our measurements as Level 2 because the valuation of our derivative commodity swaps and collars and interest rate swaps are based on similar transactions observable in active markets or industry standard models that primarily rely on market observable inputs. Substantially all of the assumptions for industry standard models are observable in active markets throughout the full term of the instruments.
98
Table of Contents
Asset Retirement Obligations
We report the fair value of asset retirement obligations on a nonrecurring basis in our Consolidated Balance Sheets. We estimate the fair value of asset retirement obligations based on discounted cash flow projections using numerous estimates, assumptions and judgments regarding such factors as the existence of a legal obligation for an asset retirement obligation; estimated probabilities, amounts and timing of settlements; the credit-adjusted risk-free rate to be used; and inflation rates. These inputs are unobservable, and thus result in a Level 3 classification. See Note 2, Summary of Significant Accounting Policies, to our Consolidated Financial Statements for further information on asset retirement obligations, which includes a reconciliation of the beginning and ending balances which represent the entirety of our Level 3 fair value measurements.
12. INCOME TAXES
We recognize deferred tax liabilities and assets for the expected future tax consequences of events that may be recognized in our financial statements or tax returns. Using this method, deferred tax liabilities and assets are determined based on the difference between the financial carrying amounts and tax bases of assets and liabilities using enacted tax rates. Deferred tax assets are reduced by a valuation allowance when, in the opinion of management, it is more likely than not that some portion or all of the deferred tax assets will not be realized. We recognized deferred tax assets and liabilities upon the consummation of the Reorganization Transactions and acquisition of noncontrolling interests. Before these events, the Predecessor Companies were pass-through entities that did not pay income taxes and did not reflect deferred tax assets and liabilities.
All information in the tables below includes results from continuing operations and discontinued operations.
| Year
Ended December 31, 2010 (in thousands) |
Year Ended December 31, 2009 (in thousands) |
Year Ended December 31, 2008 (in thousands) |
||||||||||
| Current: |
||||||||||||
| Federal |
$ | 11 | $ | — | $ | — | ||||||
| State |
292 | — | — | |||||||||
| Deferred: |
||||||||||||
| Federal |
3,316 | (9,626 | ) | (9,819 | ) | |||||||
| State |
456 | (1,088 | ) | (1,084 | ) | |||||||
| Total Income Tax Expense (Benefit) |
$ | 4,075 | $ | (10,714 | ) | $ | (10,903 | ) | ||||
A reconciliation of income tax expense (benefit) using the statutory U.S. income tax rate compared with actual income tax expense is as follows:
| Year
Ended December 31, 2010 (in thousands) |
Year Ended December 31, 2009 (in thousands) |
|||||||
| Net loss before noncontrolling interests and income taxes |
$ | 10,111 | $ | (26,947 | ) | |||
| Statutory U.S. income tax rate |
35.0 | % | 35.0 | % | ||||
| Tax benefit recognized using statutory U.S. income tax rate |
$ | 3,539 | $ | (9,431 | ) | |||
| Change in estimated future state rate |
77 | 301 | ||||||
| Permanent differences |
33 | 7 | ||||||
| Other |
(167 | ) | (230 | ) | ||||
| Adjusted federal income tax expense (benefit) |
$ | 3,482 | $ | (9,353 | ) | |||
| State income tax expense (benefit) |
593 | (1,361 | ) | |||||
| Total income tax expense (benefit) |
$ | 4,075 | $ | (10,714 | ) | |||
| Effective income tax rate |
40.3 | % | 39.8 | % | ||||
99
Table of Contents
Deferred income taxes reflect the impact of temporary differences between the amount of assets and liabilities recognized for financial reporting purposes and such amounts recognized for tax purposes. Deferred tax liabilities (assets) are comprised of the following at December 31, 2010 and 2009.
| December 31, 2010 (in thousands) |
December 31, 2009 (in thousands) |
|||||||
| Tax effects of temporary differences for: |
||||||||
| Current: |
||||||||
| Assets: |
||||||||
| Unrealized loss on derivatives |
$ | — | $ | 1,830 | ||||
| Other |
1,062 | 997 | ||||||
| Total current deferred tax assets |
1,062 | 2,827 | ||||||
| Liabilities: |
||||||||
| Unrealized gain on derivatives |
(1,100 | ) | — | |||||
| Deferred gain on early hedge settlements |
(1,870 | ) | — | |||||
| Total current deferred tax liabilities |
(2,970 | ) | — | |||||
| Net total current deferred tax asset (liability) |
(1,908 | ) | 2,827 | |||||
| Long-Term: |
||||||||
| Assets: |
||||||||
| Asset retirement obligation |
7,030 | 6,465 | ||||||
| Non-Cash compensation plans |
1,780 | 1,480 | ||||||
| Net operating loss carryforward |
6,550 | 6,750 | ||||||
| Other |
1,330 | 157 | ||||||
| Total long-term deferred tax assets |
16,690 | 14,852 | ||||||
| Liabilities: |
||||||||
| Deferred gain on early hedge settlements |
— | (1,831 | ) | |||||
| Book basis of oil and gas properties in excess of tax basis |
(22,430 | ) | (19,915 | ) | ||||
| Other |
(190 | ) | — | |||||
| Total long-term deferred tax liabilities |
$ | (22,620 | ) | $ | (21,746 | ) | ||
| Net total long-term deferred tax asset (liability) |
(5,930 | ) | (6,894 | ) | ||||
Management continuously evaluates the facts and circumstances representing positive and negative evidence in the determination of our ability to realize the deferred tax assets. These deferred tax assets consist primarily of net operating losses and deductible temporary differences. For the year ended December 31, 2010, management determined, based on positive and negative evidence examined and anticipated future taxable income, that it is now more than likely than not that these deferred tax assets will likely be realized in the future. Accordingly, we determined that it is appropriate to present our deferred tax assets without a valuation allowance.
Our management will continue, in future periods, to assess the likely realization of the deferred tax assets. The valuation allowance may change based on future changes in circumstances.
100
Table of Contents
At December 31, 2010, we had available unused net operating loss carryforwards that may be applied against future taxable income that expire as follows:
| Year of Expiration |
Net Operating Loss Carryforwards (in thousands) |
|||
| 2027 |
$ | 1,057 | ||
| 2028 |
12,869 | |||
| 2029 |
2,160 | |||
| Total |
$ | 16,086 | ||
Effective August 1, 2007, we adopted FASB ASC 740-10, which clarifies the accounting for uncertainty in income taxes recognized in a company’s financial statements in accordance with FASB ASC 740. FASB ASC 740-10 prescribes a recognition threshold and measurement attribute for the financial statement recognition and measurement of a tax position taken or expected to be taken in a tax return. FIN 48 also provides guidance on derecognition, classification, interest and penalties, accounting in interim periods, disclosure and transition. Our practice is to recognize interest related to income tax expense in Interest Expense and penalties in General and Administrative expense. We did not have any accrued interest or penalties as of December 31, 2010 and 2009.
We also adopted FASB ASC 740-10-25-9 as of August 1, 2007. FASB ASC 740-10-25-9 provides that a company’s tax position will be considered settled if the taxing authority has completed its examination, the company does not plan to appeal and it is remote that the taxing authority would reexamine the tax position in the future.
The adoption of FASB ASC 740-10 and FASB ASC 740-10-25-9 had no significant effect on our financial position, results of operations or cash flows.
FASB ASC 740-10 sets forth a two-step process for evaluating tax positions. The first step is financial statement recognition of the tax position based on whether it is more likely than not that the position will be sustained upon examination by taxing authorities and resolution through related appeals or litigation, based on the technical merits of the case. FASB ASC 740-10 mandates certain assumptions in applying the more likely than not judgment, including the presupposition of an examination where the taxing authorities are fully informed of all relevant information for evaluation of the tax position. In other words, FASB ASC 740-10 precludes factoring the likelihood of a tax examination into the evaluation of the outcome so that the evaluation is to focus solely on the technical merits of the position.
Our management has concluded that, as of December 31, 2010, we have not taken any tax positions that would require disclosure as “unrecognized positions” and that no liability balance is required to offset any unsustainable positions.
We file a consolidated federal income tax return and separate or consolidated state income tax returns in the United States Federal jurisdiction and in many state jurisdictions. We are subject to U.S. Federal income tax examinations and to various state tax examinations for periods after August 1, 2007.
101
Table of Contents
13. EARNINGS PER COMMON SHARE
Basic income per common share is calculated based on the weighted average number of common shares outstanding at the end of the period. Diluted income per common share includes the speculative exercise of stock options and SARs, given that the hypothetical effect is not anti-dilutive. Stock options of 715,106 and SARs of 20,500 for the year ending December 31, 2010 were outstanding but not included in the computations of diluted net income per share because their effect would be anti-dilutive. Due to our net loss from continuing operations for the year ended December 31, 2009, we excluded all 873,837 of outstanding stock options and 73,500 SARs because the effect would have been anti-dilutive to the computations. Due to our net loss from continuing operations for the year ended December 31, 2008, we excluded all 993,700 of outstanding stock options and 73,500 SARs because the effect would have been anti-dilutive to the computations (for additional information on our stock options and SARs, see Note 16, Employee Benefit and Equity Plans, to our Consolidated Financial Statements). The following table sets forth the computation of basic and diluted earnings per common share (in thousands except per share data):
| Year Ended December 31, 2010 |
Year Ended December 31, 2009 |
Year Ended December 31, 2008 |
||||||||||
| Numerator (in thousands): |
||||||||||||
| Net Income (Loss) From Continuing Operations |
$ | 6,036 | $ | (16,556 | ) | $ | (40,978 | ) | ||||
| Net Income (Loss) From Discontinued Operations |
— | 323 | (7,704 | ) | ||||||||
| Net Income (Loss) |
$ | 6,036 | $ | (16,233 | ) | $ | (48,682 | ) | ||||
| Denominator (in thousands): |
||||||||||||
| Weighted Average Common Shares Outstanding—Basic |
43,558 | 36,806 | 34,595 | |||||||||
| Effect of Dilutive Securities: |
||||||||||||
| Employee Stock Options and SARs |
112 | — | — | |||||||||
| Weighted Average Common Shares Outstanding—Diluted |
43,670 | 36,806 | 34,595 | |||||||||
| Earnings per Common Share(a): |
||||||||||||
| Basic—Net Income (Loss) From Continuing Operations |
$ | 0.14 | $ | (0.45 | ) | $ | (1.18 | ) | ||||
| —Net Income (Loss) From Discontinued Operations |
— | 0.01 | (0.22 | ) | ||||||||
| —Net Income (Loss) |
$ | 0.14 | $ | (0.44 | ) | $ | (1.40 | ) | ||||
| Diluted —Net Income (Loss) From Continuing Operations |
$ | 0.14 | $ | (0.45 | ) | $ | (1.18 | ) | ||||
| —Net Income (Loss) From Discontinued Operations |
— | 0.01 | (0.22 | ) | ||||||||
| —Net Income (Loss) |
$ | 0.14 | $ | (0.44 | ) | $ | (1.40 | ) | ||||
| (a) | All earnings per share amounts are attributable to Rex common shareholders |
14. CAPITAL STOCK
Currently, our common stock is traded on the NASDAQ Global Market under the trading symbol “REXX”. We have authorized capital stock of 100,000,000 shares of common stock and 100,000 shares of preferred stock. In May 2008, we completed a public offering of 5,775,000 shares of common stock at an offering price of $20.75 per share. In January 2010, we completed a public offering of 6,900,000 shares of common stock at an offering price of $12.25 per share. As of December 31, 2010, we had 44,306,677 shares of common stock outstanding.
102
Table of Contents
15. MAJOR CUSTOMERS
We sold the majority of our oil production in the Illinois Basin to CountryMark Cooperative LLP. The total amount of oil sold to CountryMark Cooperative, LLP in 2010, 2009 and 2008 was approximately $51.8 million, $37.2 million and $74.0 million, respectively. These sales represent 77%, 77% and 88%, respectively, of total oil and natural gas sales.
16. EMPLOYEE BENEFIT AND EQUITY PLANS
401(k) Plan
We sponsor a 401(k) Plan for eligible employees who have satisfied age and service requirements. Employees can make contributions to the plan up to allowable limits. Our contributions to the plan are discretionary. Our contributions to the plan were approximately $0.3 million, $0.1 million and $0.3 million for the years ended December 31, 2010, 2009 and 2008, respectively. We paid approximately $10,000 of expenses during 2010 and $8,000 per year for 2009 and 2008 on behalf of the 401(k).
Equity Plans
We recognize all share-based payments to employees, including grants of employee stock options, in the income statement based on their grant-date fair values, using prescribed option-pricing models. The fair value is expensed over the requisite service period of the individual grantees, which generally equals the vesting period. We report any benefits of tax deductions in excess of recognized compensation as a financing cash flow, rather than as an operating cash flow.
2007 Long-Term Incentive Plan
We have granted stock options, stock appreciation rights and restricted stock awards to various employees and non-employee directors under the terms of our 2007 Long-Term Incentive Plan (the “Plan”). The Plan is administered by the compensation committee of our board of directors (the “Compensation Committee”). Among the Compensation Committee’s responsibilities are selecting participants to receive awards, determining the form, amount and other terms and conditions of awards, interpreting the provisions of the Plan or any award agreement and adopting such rules, forms, instruments and guidelines for administering the Plan as it deems necessary or proper. All actions, interpretations and determinations by the Compensation Committee are final and binding. The composition of the Compensation Committee is intended to permit the awards under the Plan to qualify for exemption under Rule 16b-3 of the Exchange Act. In addition, awards under the Plan, including annual incentive awards paid to executive officers subject to section 162(m) of the Code or covered employees, intend to satisfy the requirements of section 162(m) to permit the deduction by us of the associated expenses for federal income tax purposes. The Compensation Committee has authorized the issuance of 3,079,470 shares under the Plan, with 1,417,494 and 1,848,033 still available as of December 31, 2010 and 2009, respectively.
All awards granted under the Plan have been issued at the prevailing market price at the time of the grant. All outstanding stock options have been awarded with five or ten year expiration at an exercise price equal to our closing price on the NASDAQ Global Market on the day of the award. A forfeiture rate based on a blended average of individual participant terminations and number of awards cancelled is used to estimate forfeitures prospectively.
Stock Options
During the year ended December 31, 2010, the Compensation Committee awarded nonqualified options to purchase a total of 111,174 shares of our common stock to three employees and five non-employee directors. During the year ended December 31, 2009, the Compensation Committee awarded nonqualified options to purchase a total of 68,888 shares of our common stock to one employee and four non-employee directors. The
103
Table of Contents
nonqualified stock options granted to our employees have an exercise price equal to the closing price of our common stock on the NASDAQ Global Market on the date of the grant, and vest and become exercisable on the first, second or third anniversary of the grant date, provided that the option holder remains our employee until that date. The nonqualified stock options granted to our non-employee directors have an exercise price equal to the closing price of our common stock on the NASDAQ Global Market on the date of the grant, and vest and become exercisable in one-third increments on the first, second and third year anniversaries of the date of grant. All options also provide that all unvested options vest and become immediately exercisable upon a “change in control” of us; as such term is defined in the Plan.
During fiscal year 2009, with the approval of our Compensation Committee, we modified the terms of certain stock option award agreements of three former employees located in our Southwest Region to partially vest options previously granted to such individuals. The options were partially vested pursuant to the terms of severance agreements entered into with the former employees as a result of the termination of their employment following the sale of our Southwest Region assets and the closing of our Midland, Texas office in March 2009. As modified, the options partially vested and became exercisable with respect to a total of 58,749 shares of our common stock which had an exercise price of $9.99. We recognized approximately $0.3 million in compensation expense related to these awards, $0.2 million of which would have been recognized over the remaining life of the options had they not been accelerated.
Stock options represent the right to purchase shares of stock in the future at the fair market value of the stock on the date of grant. In the event that any outstanding award expires, is forfeited, cancelled or otherwise terminated without the issuance of shares of our common stock or is otherwise settled in cash, shares of our common stock allocable to such award, including the unexercised portion of such award, shall again be available for the purposes of the Plan. If any award is exercised by tendering shares of our common stock to us, either as full or partial payment, in connection with the exercise of such award under the Plan or to satisfy our withholding obligation with respect to an award, only the number of shares of our common stock issued net of such shares tendered will be deemed delivered for purposes of determining the maximum number of shares of our common stock then available for delivery under the Plan.
A summary of the stock option activity is as follows:
| Number of Shares | Weighted Average Exercise Price |
Weighted Average Remaining Term (in years) |
Aggregate Intrinsic Value (in thousands) |
|||||||||||||
| Options outstanding, December 31, 2007 |
790,000 | $ | 9.90 | |||||||||||||
| Granted |
516,200 | 21.50 | ||||||||||||||
| Exercised |
— | — | ||||||||||||||
| Cancelled/Forfeited/Expired |
(312,500 | ) | 16.86 | |||||||||||||
| Options outstanding, December 31, 2008 |
993,700 | $ | 13.81 | |||||||||||||
| Granted |
68,888 | 4.84 | ||||||||||||||
| Exercised |
— | — | ||||||||||||||
| Cancelled/Forfeited/Expired |
(188,751 | ) | 12.06 | |||||||||||||
| Options outstanding, December 31, 2009 |
873,837 | $ | 13.41 | |||||||||||||
| Granted |
111,174 | 11.83 | ||||||||||||||
| Exercised |
(22,000 | ) | 9.99 | |||||||||||||
| Cancelled/Forfeited/Expired |
(136,500 | ) | 18.18 | |||||||||||||
| Options Outstanding, December 31, 2010 |
826,511 | $ | 12.50 | 6.7 | $ | 2,529 | ||||||||||
| Options Exercisable, December 31, 2010 |
472,213 | $ | 9.65 | 6.9 | 1,891 | |||||||||||
Stock-based compensation expense relating to stock options for the years ended December 31, 2010, 2009 and 2008 totaled $1.0 million, $1.0 million and $3.0 million, respectively. The expense related to stock option
104
Table of Contents
grants was recorded on our Consolidated Statements of Operations under the heading of General and Administrative expense. The intrinsic value of stock options exercised for the years ended December 31, 2010, 2009 and 2008 was $49,000, $0 and $0, respectively. The total tax benefit for the years ended December 31, 2010, 2009 and 2008 was $19,000, $0 and $0, respectively.
The fair value of each option grant is estimated on the date of the grant using the Black-Scholes option-pricing model with the following assumptions:
| Year Ended December 31, | ||||||||||||
| 2010 | 2009 | 2008 | ||||||||||
| Expected dividend yield |
— | — | — | |||||||||
| Expected stock price volatility |
90 | % | 72 | % | 46 | % | ||||||
| Risk-free interest rate |
1.66 | % | 1.87 | % | 3.21 | % | ||||||
| Expected life of options (years) |
4-6.5 | 4-6.5 | 4-6.5 | |||||||||
The dividend yield of zero is based on the fact that we have never paid cash dividends on common stock and have no present intention of doing so. Our expected historical volatility factor was determined by assessing the common stock trading history of eight publicly-traded oil and gas companies that we determined to be similar to us in ways such as their operating strategy, capital structure, production mix and volume and asset size. The risk-free interest rate was determined by interpolating the average yield on a U.S. Treasury bond for a period approximately equal to the expected average life of the options. The average expected life has been determined using the “simplified method” in which the average expected life of the option is equal to the average of the term of the option and the vesting period. We elected to use the simplified method for determining the average expected life because we do not have a history on which to base estimates for the term to exercise of our granted stock options. We used an estimated forfeiture rate of 31.4% in 2010 for calculating stock-based compensation expense related to stock options and this rate is based on historical experience.
Based on the above assumptions, the weighted average estimated fair value of options granted during the years ended December 31, 2010, 2009 and 2008 was $6.74 per share, $3.26 per share and $8.94 per share, respectively. The weighted average exercise price of options granted during 2010, 2009 and 2008 was $11.83, $4.84 and $21.50 per share, respectively.
A summary of the status of our issued and outstanding stock options as of December 31, 2010 is as follows:
| Outstanding | Exercisable | |||||||||||||||||||
| Exercise |
Number Outstanding at 12/31/10 |
Weighted- Average Remaining Contractual Life (Years) |
Weighted- Average Exercise Price |
Number Exercisable at 12/31/10 |
Weighted- Average Exercise Price |
|||||||||||||||
| $9.99 |
326,749 | 6.8 | $ | 9.99 | 326,749 | $ | 9.99 | |||||||||||||
| $9.50 |
125,000 | 6.8 | $ | 9.50 | 125,000 | $ | 9.50 | |||||||||||||
| $13.56 |
33,200 | 7.1 | $ | 13.56 | — | $ | — | |||||||||||||
| $22.34 |
38,000 | 7.3 | $ | 22.34 | — | $ | — | |||||||||||||
| $23.88 |
75,000 | 7.4 | $ | 23.88 | — | $ | — | |||||||||||||
| $23.28 |
4,000 | 2.5 | $ | 23.28 | — | $ | — | |||||||||||||
| $19.92 |
22,000 | 2.6 | $ | 19.92 | — | $ | — | |||||||||||||
| $21.10 |
30,000 | 2.6 | $ | 21.10 | — | $ | — | |||||||||||||
| $5.04 |
61,388 | 8.3 | $ | 5.04 | 20,464 | $ | 5.04 | |||||||||||||
| $10.42 |
36,935 | 9.5 | $ | 10.42 | — | $ | — | |||||||||||||
| $13.01 |
18,526 | 4.5 | $ | 13.01 | — | $ | — | |||||||||||||
| $12.50 |
19,139 | 4.9 | $ | 12.50 | — | $ | — | |||||||||||||
| $12.30 |
36,574 | 4.9 | $ | 12.30 | — | $ | — | |||||||||||||
| Total |
826,511 | 6.7 | 12.50 | 472,213 | 9.65 | |||||||||||||||
105
Table of Contents
The weighted average remaining contractual term and the aggregate intrinsic value for options outstanding at December 31, 2010 were 6.7 years and $2.5 million, respectively. The weighted average remaining contractual term and the aggregate intrinsic value for options exercisable at December 31, 2009 were 6.9 years and $1.9 million, respectively. As of December 31, 2010, unrecognized compensation expense related to stock options totaled approximately $0.8 million, which will be recognized over a weighted average period of 0.8 years.
Stock Appreciation Rights
During the year ended December 31, 2008, the Compensation Committee awarded 109,500 stock appreciation rights (“SARs”) to five employees, and there were no awards made in 2009 or 2010. SARs represent the right to receive cash or shares of common stock in the future equivalent to the difference between the fair market value at the time of exercise and the strike price. The SARs have an exercise price equal to $13.56, the closing price of our common stock on the NASDAQ Global Market on the date of the grant, and vest and become exercisable on the third anniversary of the grant date, provided that the holder remains our employee until that date. The SARs also provide that all unvested SARs vest and become immediately exercisable upon a “change in control” of us, as such term is defined in the Plan. The outstanding SARs issued as of December 31, 2010 may only be exercised for cash settlement. As of December 31, 2010, unrecognized compensation expense related to SARs totaled approximately $0.2 million to be recognized over 0.1 years remaining.
| Outstanding | Exercisable | |||||||||||||||||||||||||||
| Strike Price |
Number of SARs Granted |
SARs Forfeited or Cancelled |
SARs Outstanding |
Weighted- Average Remaining Contractual Life (Years) |
Weighted- Average Strike Price |
SARs | Weighted- Average Exercise Price |
|||||||||||||||||||||
| $13.56 | 109,500 | (89,000 | ) | 20,500 | 7.1 | $ | 13.56 | — | — | |||||||||||||||||||
| Total | 109,500 | (89,000 | ) | 20,500 | 7.1 | $ | 13.56 | — | — | |||||||||||||||||||
As of December 31, 2010, the aggregate intrinsic value of SARs outstanding was approximately $2,000. There have been no SAR exercises to date. All of our SARs were granted in 2008 with grant date fair values of $6.91 per share based on a weighted average exercise price of $13.56 per share, expected annual dividends per share of 0.0%, expected life in years of 6.5, expected volatility of 45.1% and a risk-free interest rate of 4.1%. The dividend yield of zero is based on the fact that we have never paid cash dividends on common stock and have no present intention of doing so. Our expected historical volatility factor was determined by assessing the common stock trading history of eight publicly-traded oil and gas companies that we determined to be similar to us in ways such as their operating strategy, capital structure, production mix and volume and asset size. The risk-free interest rate was determined by interpolating the average yield on a U.S. Treasury bond for a period approximately equal to the expected average life of the SARs. The average expected life has been determined using the “simplified method” in which the average expected life of the SARs is equal to the average of the term of the SARs and the vesting period. We elected to use the simplified method for determining the average expected life because we do not have a history on which to base estimates for the term to exercise of our granted stock options. We do not use an estimated forfeiture rate as all awards are expected to vest and become exercisable.
Restricted Stock Awards
During the year ended December 31, 2010, the Compensation Committee issued 860,563 shares of restricted common stock to 34 employees. During the year ended December 31, 2009, the Compensation Committee issued 261,850 shares of restricted common stock to 15 employees. The shares granted in 2010 are subject to time vesting and performance-based vesting. The shares will vest on the date on which the Compensation Committee certifies that the performance goals have been satisfied, provided that the recipient has been in continuous employment with us from the grant date through the third anniversary of the grant date. Restrictions on the transfer associated with vesting schedules were determined by the Compensation Committee on an individual
106
Table of Contents
award basis. The restricted common stock is valued at the closing price of our common stock on the NASDAQ Global Market on the date of the grant. Upon a “change in control” of us, as such term is defined in the Plan, all restrictions will immediately lapse for performance-based awards with respect to the greater of: (i) 50% of the maximum number of shares or (ii) the number of shares that would be awarded if the applicable performance-based goals and the extent such goals were satisfied are measured as of the date of the change in control. For awards that do not contain a performance-based condition, all restrictions immediately lapse upon a change in control. Compensation expense associated with the restricted stock award is recognized on a straight-line basis over the vesting period.
We recorded compensation expense related to restricted common stock awards of $0.1 million, $0.2 million and $0.1 million for the years ended December 31, 2010, 2009 and 2008, respectively. As of December 31, 2010, total unrecognized compensation cost related to the restricted common stock grants was approximately $2.1 million to be recognized over a weighted average of 2.5 years.
A summary of the restricted stock activity for the years ended December 31, 2010 and 2009 is as follows:
| Number of Shares |
Weighted- Average Grant Date Fair Value |
|||||||
| Restricted stock awards, as of January 1, 2008 |
— | $ | — | |||||
| Awards |
20,000 | 23.00 | ||||||
| Forfeitures |
— | — | ||||||
| Restricted stock awards, as of December 31, 2008 |
20,000 | $ | 23.00 | |||||
| Awards |
261,850 | 2.05 | ||||||
| Forfeitures |
(33,750 | ) | 2.05 | |||||
| Restricted stock awards, as of December 31, 2009 |
248,100 | $ | 3.74 | |||||
| Awards |
860,563 | 12.07 | ||||||
| Forfeitures |
(293,698 | ) | 7.99 | |||||
| Restricted stock awards, as of December 31, 2010 |
814,965 | $ | 11.01 | |||||
17. SUSPENDED EXPLORATORY WELL COSTS
We capitalize the costs of exploratory wells if a well finds a sufficient quantity of reserves to justify its completion as a producing well and we are making sufficient progress towards assessing the reserves and the economic and operating viability of the project.
The following table reflects the net change in capitalized exploratory well costs, excluding those related to our Southwest Region properties which are currently classified as Held for Sale on our Consolidated Balance Sheets as of December 31, 2008, for the years ended December 31, 2010, 2009 and 2008 ($ in thousands):
| 2010 | 2009 | 2008 | ||||||||||
| Beginning Balance at January 1, |
$ | 5,107 | $ | 2,213 | $ | 4,471 | ||||||
| Additions to capitalized exploratory well costs pending the determination of proved reserves |
45,241 | 2,894 | 2,227 | |||||||||
| Divested wells |
(10,770 | ) | — | (4,485 | ) | |||||||
| Reclassification of wells, facilities, and equipment based on the determination of proved reserves |
(23,016 | ) | — | — | ||||||||
| Capitalized exploratory well costs charged to expense |
(4,014 | ) | — | — | ||||||||
| Ending Balance at December 31, |
12,548 | 5,107 | 2,213 | |||||||||
| Less exploratory well costs that have been capitalized for a period of one year or less |
(12,548 | ) | (2,894 | ) | (2,213 | ) | ||||||
| Capitalized exploratory well costs for a period of greater than one year |
$ | — | $ | 2,213 | $ | — | ||||||
| Number of projects that have exploratory well costs capitalized for a period of more than one year |
— | 2 | — | |||||||||
107
Table of Contents
As of December 31, 2009 we had approximately $2.2 million in capitalized exploratory well costs that were capitalized for a period greater than one year. These costs related to two wells in our Appalachian Basin. These wells are in various stages of drilling and completion. On January 1, 2010, Williams became the operator of this joint venture area and does not currently have any plans to complete these wells and connect them into a sales line. While we still believe that these wells are capable of producing commercial quantities of natural gas, the lack of a sales line and plans to construct one give rise to substantial doubt about the carrying values of these wells. We subsequently expensed the carrying values of these wells, which is classified as Impairment Expense on our Consolidated Statement of Operations.
18. COSTS INCURRED IN OIL AND NATURAL GAS ACQUISITION, EXPLORATION AND DEVELOPMENT ACTIVITIES (UNAUDITED)
Costs incurred in oil and natural gas property acquisitions and development are presented below (in thousands):
| 2010 | 2009 | 2008 | ||||||||||
| Consolidated Entities: |
||||||||||||
| Acquisition of Properties |
||||||||||||
| Proved |
$ | 53 | $ | 39 | $ | 4,054 | ||||||
| Unproved |
70,625 | 17,949 | 56,680 | |||||||||
| Exploration Costs |
49,481 | 12,852 | 27,967 | |||||||||
| Development Costs(a) |
32,167 | 12,211 | 21,215 | |||||||||
| Subtotal |
152,326 | 43,051 | 109,916 | |||||||||
| Asset Retirement Obligations |
186 | 255 | 9,562 | |||||||||
| Total Costs Incurred |
$ | 152,512 | $ | 43,306 | $ | 119,478 | ||||||
| Share of Equity Method Investments: |
||||||||||||
| Acquisition of Properties |
||||||||||||
| Proved |
$ | — | $ | — | $ | — | ||||||
| Unproved |
— | — | — | |||||||||
| Exploration Costs |
— | — | — | |||||||||
| Development Costs(a) |
6,018 | 1,241 | — | |||||||||
| Total |
$ | 6,018 | $ | 1,241 | $ | — | ||||||
| (a) | Includes Depreciation expense for support equipment and facilities. |
108
Table of Contents
19. OIL AND NATURAL GAS CAPITALIZED COSTS (UNAUDITED)
Our aggregate capitalized costs for natural gas and oil production activities with applicable accumulated depreciation, depletion and amortization are presented below (in thousands).
| 2010 | 2009 | |||||||
| Consolidated Entities: |
||||||||
| Proven Oil and Natural Gas Properties |
$ | 242,992 | $ | 206,676 | ||||
| Pipelines and Support Equipment |
31,610 | 21,404 | ||||||
| Field Operation Vehicles and Other Equipment |
6,114 | 4,408 | ||||||
| Wells and Facilities in Progress |
37,073 | 33,866 | ||||||
| Unproven Properties |
91,574 | 80,218 | ||||||
| Total |
409,363 | 346,572 | ||||||
| Less Accumulated Depreciation and Depletion |
(91,134 | ) | (74,668 | ) | ||||
| Total |
$ | 318,229 | $ | 271,904 | ||||
| Share of Equity Method Investments: |
||||||||
| Pipelines and Support Equipment |
$ | 10,841 | $ | 21 | ||||
| Field Operation Vehicles and Other Equipment |
29 | — | ||||||
| Wells and Facilities in Progress |
4,122 | 1,220 | ||||||
| Total |
14,992 | 1,241 | ||||||
| Less Accumulated Depreciation and Depletion |
(180 | ) | (1 | ) | ||||
| Total |
$ | 14,812 | $ | 1,240 | ||||
20. OIL AND NATURAL GAS RESERVE QUANTITIES (UNAUDITED)
Our independent engineers, Netherland, Sewell, and Associates, Inc. (“NSAI”) evaluated all of our proved oil and natural gas reserves for the years ended December 31, 2010 and 2009. Schlumberger Consulting and Data Services evaluated the proved reserves on our Marcellus Shale properties for the year ended December 31, 2008, while NSAI evaluated the proved reserves on all of our other properties for the same period. The technical persons responsible for preparing our proved reserves estimates meet the requirements with regards to qualifications, independence, objectivity and confidentiality set forth in the Standards Pertaining to the Estimating and Auditing of Oil and Gas Reserves Information promulgated by the Society of Petroleum Engineers. Our independent third-party engineers do not own an interest in any of our properties and are not employed by us on a contingent basis. We emphasize that reserve estimates are inherently imprecise. Our oil and natural gas reserve estimates were generally based upon extrapolation of historical production trends, analogy to similar properties and volumetric calculations. Accordingly, these estimates are expected to change, and such change could be material and occur in the near term as future information becomes available. All of our proved reserves are located within the United States.
Proved oil and natural gas reserves represent the estimated quantities of oil and natural gas which geoscience and engineering data demonstrate with reasonable certainty will be economically producible—from a given date forward, from known reservoirs, and under existing economic conditions, operating methods and governmental regulations—prior to the time at which contracts providing the right to operate expire, unless evidence indicates that renewal is reasonably certain, regardless of whether deterministic or probabilistic methods are used for the estimation. The project to extract the hydrocarbons must have commenced or the operator must be reasonably certain that it will commence the project within a reasonable time. Proved developed oil and natural gas reserves are those expected to be recovered through existing wells with existing equipment and operating methods. Proved undeveloped reserves are volumes expected to be recovered from new wells on undrilled acreage or from existing wells where a relatively major expenditure is required for recompletion. Reserves on undrilled acreage shall be limited to those drilling units offsetting productive units that are reasonably certain of production when drilled. Proved reserves for other undrilled units can be claimed only
109
Table of Contents
where it can be demonstrated with certainty that there is continuity of production from the existing formation. Proved undeveloped reserves can only be assigned to acreage for which improved recovery technology is contemplated unless such techniques have been proven effective by actual tests in the area and in the same reservoir. Undrilled locations can be classified as having undeveloped reserves only if a development plan has been adopted indicating they are scheduled to be drilled within five years, unless specific circumstances justify a longer time.
In December 2008, the SEC announced that it had approved revisions designed to modernize the oil and gas company reserves reporting requirements. See Note 2, Summary of Significant Accounting Policies, to our Consolidated Financial Statements. We adopted the rules effective December 31, 2009 and the rule changes, including those related to pricing and technology, are included in our reserves estimates.
Presented below is a summary of changes in estimated reserves of the oil and natural gas wells at December 31, 2010, 2009 and 2008. The reserves are proved and exclude reserves associated with our Southwest Region properties that are shown as Assets Held for Sale on our balance sheet. The total proved reserves for these assets at December 31, 2008 and 2007 were 7,408,188 Mcfe and 7,805,502 Mcfe, respectively.
| 2010 | ||||||||||||
| Oil and NGLs (Bbls) |
Natural Gas (Mcf) |
Mcf Equivalents |
||||||||||
| Proved Reserves—Beginning of Period |
11,509,983 | 56,163,170 | 125,223,068 | |||||||||
| Sale of Reserves in Place |
(369,758 | ) | (12,251,612 | ) | (14,470,160 | ) | ||||||
| Extensions and Discoveries |
3,461,768 | 93,229,532 | 114,000,140 | |||||||||
| Revisions of Previous Estimates |
(1,542,033 | ) | (6,511,733 | ) | (15,763,931 | ) | ||||||
| Production(a) |
(717,132 | ) | (3,007,522 | ) | (7,310,314 | ) | ||||||
| Proved Reserves—End of Period |
12,342,828 | 127,621,835 | 201,678,803 | |||||||||
| (a) | Gas production excludes certain production associated with gas sales contracts for which we do not recognize reserves. See Note 6, Commitments and Contingencies, to our Consolidated Financial Statements. |
| 2009 | ||||||||||||
| Oil and NGLs (Bbls) |
Natural Gas (Mcf) |
Mcf Equivalents |
||||||||||
| Proved Reserves—Beginning of Period |
5,993,626 | 30,019,477 | 65,981,233 | |||||||||
| Purchases of Reserves in Place |
— | — | — | |||||||||
| Extensions and Discoveries |
940,883 | 18,422,999 | 24,068,297 | |||||||||
| Revisions of Previous Estimates |
5,302,862 | 9,231,194 | 41,048,366 | |||||||||
| Production(a) |
(727,388 | ) | (1,510,500 | ) | (5,874,828 | ) | ||||||
| Proved Reserves—End of Period |
11,509,983 | 56,163,170 | 125,223,068 | |||||||||
| (a) | Oil production does not include approximately 372 barrels of oil produced attributable to a small oil field that was sold during 2009 and was not evaluated for purposes of reserves in 2008. |
110
Table of Contents
| 2008 | ||||||||||||
| Oil and NGLs (Bbls) |
Natural Gas (Mcf) |
Mcf Equivalents |
||||||||||
| Proved Reserves—Beginning of Period |
11,962,185 | 12,715,898 | 84,489,008 | |||||||||
| Purchases of Reserves in Place |
192,485 | 16,528,437 | 17,683,347 | |||||||||
| Extensions and Discoveries |
165,394 | — | 992,364 | |||||||||
| Revisions of Previous Estimates |
(5,550,249 | ) | 1,812,026 | (31,489,468 | ) | |||||||
| Production |
(776,189 | ) | (1,036,884 | ) | (5,694,018 | ) | ||||||
| Proved Reserves—End of Period |
5,993,626 | 30,019,477 | 65,981,233 | |||||||||
| Proved Developed Reserves |
||||||||||||
| December 31, 2008 |
5,186,518 | 11,695,092 | 42,814,200 | |||||||||
| December 31, 2009 |
8,623,430 | 16,161,494 | 67,902,074 | |||||||||
| December 31, 2010 |
8,799,105 | 32,477,226 | 85,271,856 | |||||||||
Revisions. Revisions represent changes in previous reserves estimates, either upward or downward, resulting from new information normally obtained from developmental drilling and production history or resulting from a change in economic factors, such as commodity prices, operating costs.
We had significant revisions in our oil and NGL reserves of approximately 1.5 MMBOE for the year ended December 31, 2010, which were comprised of negative revisions of approximately 2.2 MMBOE due to the reclassification of conventional PUDs in the Illinois Basin out of the proved category to comply with the 5-year rule for development and approximately 0.2 MMBOE due to performance related to NGL production. These negative revisions were partially offset by positive revisions of approximately 0.9 MMBOE in relation to pricing. The increase in our oil and NGL reserves as of December 31, 2009 through revisions was primarily due to an increase in the price of oil used in the reserves estimates from $41.00 per barrel in 2008 to $57.65 per barrel in 2009, which accounted for positive revisions of approximately 2.2 MMBOE. In addition to an increase in the price of oil, positive performance revisions were approximately 3.0 MMBOE. The increase in our natural gas reserves as of December 31, 2009 through revisions was primarily due to a positive development and production history, which accounted for approximately 10.2 BCFE of the change, which was partially offset by a 1.5 BCFE decrease due to the change in natural gas price used from $5.71 in 2008 to $3.87 in 2009. In 2008, we sustained significant downward revisions in our oil and NGL reserves of approximately 5.6 Bcfe, which was materially all comprised of a decrease in the price of oil used from $92.50 per barrel in 2007 to $41.00 per barrel in 2008.
Extensions, discoveries and other additions. These are additions to proved reserves that result from (1) extension of the proved acreage of previously discovered reservoirs through additional drilling in periods subsequent to discovery and (2) discovery of new fields with proved reserves or of new reservoirs of proved reserves in old fields.
We had significant extensions, discoveries and other additions for the year ended December 31, 2010, of 3.5 MMBOE for oil and NGLs and 93.2 Bcfe for natural gas. These additions were primarily due to the additional proved undeveloped locations that were added to our proved reserve estimates that were a result of our continued drilling success in the Marcellus Shale. Extensions, discoveries and other additions for the year ended December 31, 2009 of 0.9 MMBOE of oil and NGLs and 18.4 Bcfe of natural gas include increases in proved undeveloped locations as a result of our successful exploration efforts in the Marcellus Shale.
21. STANDARDIZED MEASURE OF DISCOUNTED FUTURE NET CASH FLOWS (UNAUDITED)
FASB ASC 932 prescribes guidelines for computing a standardized measure of future net cash flows and changes therein relating to the estimated proved reserves. We followed these guidelines, which are briefly discussed below.
Future cash inflows and future production and development costs are determined by applying year-end prices and costs to estimate quantities of oil and natural gas to be produced. Actual future prices and costs may
111
Table of Contents
be materially higher or lower than the year-end prices and costs used. Estimates are made of quantities of proved reserves and the future periods during which they are expected to be produced based on year-end economic conditions. The resulting future net cash flows are reduced to present value amounts by applying a 10.0% annual discount factor.
The limitations inherent in the reserve quantity estimation process, as discussed previously, are equally applicable to the standardized measure computations since these estimates reflect the valuation process.
The following summary sets forth our future net cash flows relating to proved oil and natural gas reserves based on the standardized measure prescribed by FASB ASC 932 at December 31, 2010, 2009 and 2008 ($ in thousands) and exclude reserves related to our Southwest Region properties that are shown as Assets Held for Sale on our Consolidated Balance Sheets at December 31, 2008:
| 2010 | 2009 | 2008 | ||||||||||
| Future Cash Inflows |
$ | 1,335,068 | (a) | $ | 844,811 | (b) | $ | 428,419 | (c) | |||
| Future Costs: |
||||||||||||
| Production |
(542,814 | ) | (370,212 | ) | (210,603 | ) | ||||||
| Abandonment |
(63,637 | ) | (63,333 | ) | (63,164 | ) | ||||||
| Development |
(152,965 | ) | (86,819 | ) | (51,793 | ) | ||||||
| Net Future Cash Inflow Before Income Taxes |
575,652 | 324,447 | 102,859 | |||||||||
| Future Income Tax Expense |
(139,482 | ) | (53,703 | ) | — | |||||||
| Total Future Net Cash Flows Before 10.0% Discount |
436,170 | 270,744 | 102,859 | |||||||||
| Less: Effect of a 10.0% Discount Factor |
(248,105 | ) | (126,365 | ) | (33,914 | ) | ||||||
| Standardized Measure of Discounted Future Net Cash Flows |
$ | 188,065 | $ | 144,379 | $ | 68,945 | ||||||
| (a) | Calculated using weighted average prices of $4.57 per Mcf, $76.03 per barrel of oil and $31.71 per barrel of NGLs |
| (b) | Calculated using weighted average prices of $3.87 per Mcf and $57.65 per barrel of oil and NGLs |
| (c) | Calculated using weighted average prices of $5.71 per Mcf and $41.00 per barrel of oil |
The principal sources of change in the standardized measure of discounted future net cash flows are as follows:
| 2010 | 2009 | 2008 | ||||||||||
| Standardized Measure—Beginning of Period |
$ | 144,379 | $ | 68,945 | $ | 236,110 | ||||||
| Revisions of Previous Estimates: |
||||||||||||
| Changes in Prices and Production Costs |
8,511 | 16,327 | (232,192 | ) | ||||||||
| Revisions in Quantities |
(50,042 | ) | 76,433 | (46,535 | ) | |||||||
| Changes in Future Development Costs |
(13,480 | ) | (51,419 | ) | (13,473 | ) | ||||||
| Accretion of Discount and Timing of Future Cash Flows |
14,438 | 6,895 | 23,611 | |||||||||
| Net Change in Income Tax(a) |
(34,117 | ) | (30,000 | ) | — | |||||||
| Purchase (Sale) of Reserves in Place |
(10,438 | ) | — | 2,481 | ||||||||
| Plus Extensions, Discoveries, and Other Additions |
44,135 | 5,715 | 12,655 | |||||||||
| Development Costs Incurred |
68,496 | 28,327 | 42,325 | |||||||||
| Sales of Product—Net of Production Costs |
(42,568 | ) | (26,376 | ) | (57,502 | ) | ||||||
| Changes in Timing and Other |
59,830 | 50,573 | 111,103 | |||||||||
| Future Abandonment Costs |
(1,079 | ) | (1,041 | ) | (9,638 | ) | ||||||
| Standardized Measure—End of Period |
$ | 188,065 | $ | 144,379 | $ | 68,945 | ||||||
| (a) | At December 31, 2008, the tax basis of our assets exceeded the future cash flows of our oil and gas properties, which indicates that no future income taxes will be paid. Impairment testing was performed on our oil and gas properties at year end based on escalating future oil and natural gas prices. The standardized measure of discounted future net cash flows is based on the year end SEC commodity prices, which are held constant for the life of the properties. |
112
Table of Contents
22. RESULTS OF OPERATIONS FOR OIL AND GAS PRODUCING ACTIVITIES (UNAUDITED)
Results of operations are equal to revenues, less (a) production costs, (b) impairment expenses, (c) exploration expenses, (d) DD&A expenses, and (e) income tax expense (benefit):
| 2010 | 2009 | 2008 | ||||||||||
| Consolidated Entities (in thousands): |
||||||||||||
| Revenues |
||||||||||||
| Oil and Natural Gas Sales |
$ | 67,224 | $ | 48,534 | $ | 84,013 | ||||||
| Expenses |
||||||||||||
| Production and Lease Operating Expense |
24,656 | 22,157 | 26,511 | |||||||||
| Impairment Expense |
8,863 | 1,625 | 71,349 | |||||||||
| Exploration Expense |
5,242 | 2,080 | 3,261 | |||||||||
| Depletion, Depreciation, Amortization and Accretion |
21,806 | 25,205 | 37,904 | |||||||||
| Total Costs |
60,567 | 51,067 | 139,025 | |||||||||
| Pre-tax Operating Income (Loss) |
6,657 | (2,533 | ) | (55,012 | ) | |||||||
| Income Tax Expense (Benefit) (a) |
2,749 | (1,008 | ) | (10,122 | ) | |||||||
| Results of Operations for Oil and Gas Producing Activities(b) |
$ | 3,908 | $ | (1,525 | ) | $ | (44,890 | ) | ||||
| (a) | Computed using the effective tax rate for each period: 41.3% in 2010; 39.8% in 2009 and; 18.4% in 2008. |
| (b) | Our share of equity investment results of operations for oil and gas producing activities totaled a loss of $42,000 attributable to DD&A expenses. |
23. LITIGATION
In September 2006, the United States Department of Justice (“DOJ”) and the United States Environmental Protection Agency (“EPA”) initiated an enforcement action against us seeking mandatory injunctive relief and potential civil penalties based on allegations that the companies were violating the Clean Air Act in connection with the release of hydrogen sulfide gas and other volatile organic compounds (“VOC’s”) in the course of the our oil producing operations near the towns of Bridgeport, Illinois and Petrolia, Illinois. In June 2007, the United States District Court for the Southern District of Illinois granted the United States’ motion for approval and entry of a proposed consent decree, thereby resolving the enforcement action according to the terms described in the consent decree. The consent decree required us to take certain remedial actions to reduce hydrogen sulfide and VOC emissions and monitor the same. The consent decree did not require us to pay any civil fine or penalty, although it does provide for the possible imposition of specified daily fines and penalties for any violation of the terms and conditions of the consent decree.
In January 2010, we submitted certain proposed revisions to a Directed Inspection and Maintenance Plan previously implemented by us pursuant to the terms of the consent decree. In general, the proposed revisions update the plan to reflect changes in hydrogen sulfide control measures and procedures implemented in the field and changes in procedures for responding to resident complaints of hydrogen sulfide odors. The EPA, DOJ and Illinois EPA all approved these revisions.
Settlement Agreement—Illinois Class Action Litigation
We were a defendant in a class action lawsuit filed in the United States District Court for the Southern District of Illinois. This action was commenced in October 2006, by plaintiffs Julia Leib and Lisa Thompson, individually and as putative class representatives on behalf of all persons and non-governmental entities that own property or reside on property located in the towns of Bridgeport and Petrolia, Illinois. The complaint asserted several causes of action, including violation of the Resource Conservation And Recovery Act, Illinois Environmental Protection Act, negligence, private nuisance, trespass, and willful and wanton misconduct.
113
Table of Contents
In December 2009, we entered into a Settlement Agreement and Release (the “Settlement Agreement”) with Leib and Thompson, individually and on behalf of a certified class, to settle the class action lawsuit. Under the terms of the Settlement Agreement, without any admission of liability, we agreed to pay the class a total of $1.9 million. Pursuant to the terms of a pollution liability policy, $1.0 million of the settlement payment was funded by our insurance carrier. Pursuant to the Settlement Agreement, we also agreed to permanently plug four inactive oil wells. In return for the above consideration, each member of the class released all claims against us that in any way related to hydrogen sulfide or other environmental conditions in the class area that were the subject of, or could have been the subject of, the claims alleged in the class action lawsuit. In addition, each class member released any claims related to any future releases of hydrogen sulfide in the class area on the condition that we substantially comply with the terms and conditions of the consent decree describe above in “Illinois Basin EPA Consent Decree”. The Settlement Agreement did not provide for a release of any potential individual claims of other class members since those claims were not the subject of the class action lawsuit. The Settlement Agreement became effective in April 2010.
Litigation Related to Proposed Oil and Gas Leases in Westmoreland and Clearfield Counties, Pennsylvania
In July 2009, we were named as defendants in a proposed class action lawsuit filed in the Court of Common Pleas of Westmoreland County, Pennsylvania (the “Snyder Case”). The named plaintiffs are five individuals who have sued on behalf of themselves and all persons who are alleged to be similarly situated. The complaint in the Snyder Case generally asserts that a binding contract to lease oil and gas property was formed between the Company and each proposed class member when representatives of Duncan Land & Energy, Inc. (“Duncan Land”), a leasing agent that we engaged, presented a form of proposed oil and gas lease to each person, and each person signed the proposed oil and gas lease form and delivered the executed proposed lease to representatives of Duncan Land. We rejected these leases and never signed them. The plaintiffs seek a judgment declaring the rights of the parties with respect to those proposed leases, as well as damages and other relief as may be established by plaintiffs at trial, together with interest, costs, expenses and attorneys’ fees.
We intend to vigorously defend against the plaintiffs’ attempts to certify the proposed class and to vigorously defend against all of the claims that have been asserted in this lawsuit. Because this lawsuit is still in the early stages of discovery, we are currently unable to express an opinion with respect to the likelihood of an unfavorable outcome. We rejected proposed oil and gas leases that potentially could be certified in the class covering approximately 7,362 acres and a potential obligation for payment of prepaid rentals or bonuses totaling approximately $17.7 million. We are unable to estimate the amount or range of any potential losses that might be associated with other aspects of the plaintiffs’ breach of contract claims in the Snyder Case, or with respect to the plaintiffs’ tort claims in the event of an unfavorable outcome.
We are also a defendant in six other individual lawsuits involving oil and gas leasing activity that were filed during the Winter of 2008 and the Spring of 2009 by individual plaintiffs in the Court of Common Pleas of Westmoreland County, Pennsylvania. These lawsuits involve similar claims and requests for relief as those made in the Snyder Case described above. Because the lawsuits are in the initial stages of litigation, we are unable to express an opinion with respect to the likelihood of an unfavorable outcome
In June 2009, we were also named as a defendant in a lawsuit filed in the Court of Common Pleas of Clearfield County, Pennsylvania (the “Liegey Case”). The Liegey Case was brought by eight individuals involving oil and gas leasing activity in Clearfield County, Pennsylvania. The complaint in the Liegey Case asserts similar claims and requests for relief as those made in the Snyder Case described above. In June 2010, we settled the case and in July 2010, the court dismissed the case.
114
Table of Contents
24. SUBSEQUENT EVENTS
Derivative Activity
On January 6, January 7, February 24 and February 28, 2011, we entered into four derivative commodity transactions. We routinely utilize commodity derivative instruments to mitigate a portion of the exposure to adverse market changes (for additional information on our derivative activities see Note 11, Fair Value of Financial Instruments and Derivative Instruments, to our Consolidated Financial Statements). The first transaction is a standard natural gas swap arrangement on 40,000 Mcf per month from February 2011 through December 2011, for a total of 440,000 Mcf with a fixed price of $4.66 per Mcf. The second transaction is a three-way natural gas collar on 60,000 Mcf per month from February 2011 through December 2012, for a total of 1,380,000 Mcf with an option-1 floor price of $4.00 per Mcf an option-2 price of $4.75 per Mcf and an option-3 ceiling price of $5.25 per Mcf. The third transaction is a standard oil collar on 10,000 barrels per month from January 2013 through December 2013, for a total of 120,000 barrels with a floor of $71.00 per barrel and a ceiling of $130.00 per barrel. The fourth transaction is a standard natural gas swap arrangement on 40,000 Mcf per month from April 2011 through December 2011, for a total of 360,000 Mcf with a fixed price of $4.27 per Mcf.
115
Table of Contents
25. SELECTED QUARTERLY FINANCIAL DATA (UNAUDITED)
The following tables set forth unaudited financial information on a quarterly basis for each of the last two years.
REX ENERGY CORPORATION
CONSOLIDATED STATEMENTS OF OPERATIONS
($ and Shares in Thousands Except per Share Data)
| 2010 | ||||||||||||||||
| March | June | September | December | |||||||||||||
| Revenues |
$ | 16,758 | $ | 15,686 | $ | 16,856 | $ | 19,463 | ||||||||
| Costs and Expenses |
14,766 | 14,873 | 7,316 | 26,025 | ||||||||||||
| Net Loss From Continuing Operations |
1,992 | 813 | 9,540 | (6,562 | ) | |||||||||||
| Net Income From Discontinued Operations |
— | — | — | — | ||||||||||||
| Net Loss |
1,992 | 813 | 9,540 | (6,562 | ) | |||||||||||
| Net Loss Attributable to Noncontrolling Interests |
56 | 64 | 88 | 45 | ||||||||||||
| Net Loss Attributable to Rex Energy |
$ | 2,048 | $ | 877 | $ | 9,628 | $ | (6,517 | ) | |||||||
| Earnings per Common Share Attributable to Rex Common Shareholders: |
||||||||||||||||
| Basic—Continuing Operations |
$ | 0.05 | $ | 0.02 | $ | 0.22 | $ | (0.15 | ) | |||||||
| Basic—Discontinued Operations |
— | — | — | — | ||||||||||||
| Basic—Net Loss |
$ | 0.05 | $ | 0.02 | $ | 0.22 | $ | (0.15 | ) | |||||||
| Basic—Weighted Average Shares Outstanding |
42,126 | 44,028 | 44,051 | 44,002 | ||||||||||||
| Diluted—Continuing Operations |
$ | 0.05 | $ | 0.02 | $ | 0.22 | $ | (0.15 | ) | |||||||
| Diluted—Discontinued Operations |
— | — | — | — | ||||||||||||
| Diluted—Net Loss |
$ | 0.05 | $ | 0.02 | $ | 0.22 | $ | (0.15 | ) | |||||||
| Diluted—Weighted Average Shares Outstanding |
42,200 | 44,117 | 44,103 | 44,002 | ||||||||||||
| 2009 | ||||||||||||||||
| March | June | September | December | |||||||||||||
| Revenues |
$ | 8,830 | $ | 11,541 | $ | 13,055 | $ | 15,265 | ||||||||
| Costs and Expenses |
10,179 | 20,978 | 14,241 | 19,861 | ||||||||||||
| Net Loss From Continuing Operations |
(1,349 | ) | (9,437 | ) | (1,186 | ) | (4,596 | ) | ||||||||
| Net Income From Discontinued Operations |
323 | — | — | — | ||||||||||||
| Net Loss |
(1,026 | ) | (9,437 | ) | (1,186 | ) | (4,596 | ) | ||||||||
| Net Loss Attributable to Noncontrolling Interests |
— | — | — | (12 | ) | |||||||||||
| Net Loss Attributable to Rex Energy |
$ | (1,026 | ) | $ | (9,437 | ) | $ | (1,186 | ) | $ | (4,584 | ) | ||||
| Earnings per Common Share Attributable to Rex Common Shareholders: |
||||||||||||||||
| Basic—Continuing Operations |
$ | (0.04 | ) | $ | (0.26 | ) | $ | (0.03 | ) | $ | (0.12 | ) | ||||
| Basic—Discontinued Operations |
0.01 | — | — | — | ||||||||||||
| Basic—Net Loss |
$ | (0.03 | ) | $ | (0.26 | ) | $ | (0.03 | ) | $ | (0.12 | ) | ||||
| Basic—Weighted Average Shares Outstanding |
36,726 | 36,846 | 36,844 | 36,818 | ||||||||||||
| Diluted—Continuing Operations |
$ | (0.04 | ) | $ | (0.26 | ) | $ | (0.03 | ) | $ | (0.12 | ) | ||||
| Diluted—Discontinued Operations |
0.01 | — | — | — | ||||||||||||
| Diluted—Net Loss |
$ | (0.03 | ) | $ | (0.26 | ) | $ | (0.03 | ) | $ | (0.12 | ) | ||||
| Diluted—Weighted Average Shares Outstanding |
36,726 | 36,846 | 36,844 | 36,818 | ||||||||||||
116
Table of Contents
| ITEM 9. | CHANGE IN AND DISAGREEMENTS WITH ACCOUNTANTS ON ACCOUNTING AND FINANCIAL DISCLOSURE |
Not applicable.
| ITEM 9A. | CONTROLS AND PROCEDURES |
Evaluation of Disclosure Controls and Procedures. We have established disclosure controls and procedures to ensure that material information relating to the company is made known to the officers who certify the financial statements and to other members of senior management and the audit committee of our board of directors. As of December 31, 2010, an evaluation was performed under the supervision and with the participation of our management, including the President and Chief Executive Officer (the “CEO”) and the Chief Financial Officer (the “CFO”), of the effectiveness of the design and operation of the our disclosure controls and procedures (as defined in Rules 13a-15(e), and 15d-15(e) under the Securities Exchange Act of 1934). An evaluation was conducted to ensure that information we are required to disclose in reports that we file or submit under the Securities Exchange Act of 1934 is recorded, processed, summarized and reported within the time periods specified in SEC rules and forms. Our CEO and CFO have concluded that our disclosure controls and procedures were effective as of the date of such evaluation.
Changes in Internal Control over Financial Reporting. No change to our internal control over financial reporting occurred during the year ended December 31, 2010 that has materially affected, or is reasonably likely to materially affect, our internal control over financial reporting.
Management’s Annual Report on Internal Control over Financial Reporting. Our management is responsible for establishing and maintaining adequate internal control over financial reporting (as defined in Rules 13a-15(f), and 15d-15(f) under the Securities Exchange Act of 1934). Management has used the framework set forth in the report entitled Internal Control—Integrated Framework published by the COSO of the Treadway Commission to evaluate the effectiveness of our internal control over financial reporting. Internal control over financial reporting refers to the process designed by, or under the supervision of, our CEO and CFO, and overseen by our board of directors, management and other personnel, to provide reasonable assurance regarding the reliability of financial reporting and the preparation of financial statements for external purposes in accordance with generally accepted accounting principles, and includes those policies and procedures that:
| • | Pertain to the maintenance of records that, in reasonable detail, accurately and fairly reflect the transactions and dispositions of the assets of the company; |
| • | Provide reasonable assurance that transactions are recorded as necessary to permit preparation of financial statements in accordance with general accepted accounting principles, and that receipts and expenditures of the company are being made only in accordance with authorizations of management and directors of the company; and |
| • | Provide reasonable assurance regarding prevention or timely detection of unauthorized acquisition, use or disposition of the company’s assets that could have a material effect on the financial statements. |
Our internal control over financial reporting is a process designed to provide reasonable assurance regarding the reliability of financial reporting and the preparation of financial statements for external purposes in accordance with generally accepted accounting principles, however, neither internal control over financial reporting nor disclosure controls and procedures can provide absolute assurance of achieving financial reporting objectives because of their inherent limitations. Internal control over financial reporting and disclosure controls are processes that involve human diligence and compliance, and are subject to lapses in judgment and breakdowns resulting from human failures. Internal control over financial reporting and disclosure controls also can be circumvented by collusion or improper management override. Because of such limitations, there is a risk that material misstatements may not be prevented, detected or reported on a timely basis by internal control over financial reporting or disclosure controls. However, these inherent limitations are known features of the financial reporting process. Therefore, it is possible to design safeguards for these processes that will reduce, although may not eliminate, these risks.
117
Table of Contents
Management has concluded that our internal controls over financial reporting and our disclosure controls and procedures were effective as of December 31, 2010. Management reviewed the results of their assessment with our Audit Committee. The effectiveness of our internal control over financial reporting as of December 31, 2010 has been audited by Malin, Bergquist & Company, LLP, an independent registered public accounting firm, as stated in their report which is included in Item 8 of this Annual Report on Form 10-K.
| ITEM 9B. | OTHER INFORMATION |
On January 3, 2011, PennTex Resources Illinois, Inc., PennTex Resources, L.P., Rex Energy IV, LLC, and Rex Energy I, LLC (each a direct or indirect wholly owned subsidiary of Rex Energy Corporation, and collectively, the “Suppliers”) and CountryMark Cooperative, LLP entered into Confirmation No. 2, which is effective for the period commencing on January 1, 2011 and ending on December 31, 2011 (the “2011 Confirmation”). Pursuant to the 2011 Confirmation, CountryMark agreed to purchase all crude oil produced by Suppliers from lands covered by the oil and gas leases set forth on Exhibit A to the 2011 Confirmation. The foregoing description of the 2011 Confirmation is qualified in its entirety by reference to the 2011 Confirmation, a copy of which is filed as Exhibit 10.42 to this Annual Report on Form 10-K and which is incorporated herein by reference. Portions of the attached 2011 Confirmation have been redacted pursuant to the Company’s request for confidential treatment filed with the Securities and Exchange Commission.
118
Table of Contents
| ITEM 10. | DIRECTORS, EXECUTIVE OFFICERS AND CORPORATE GOVERNANCE |
The information required by this item is incorporated by reference to such information as set forth in our definitive Proxy Statement (the “2011 Proxy Statement”) for our 2011 annual meeting of stockholders. The 2011 Proxy statement will be filed with the SEC not later than 120 days subsequent to December 31, 2010.
| ITEM 11. | EXECUTIVE COMPENSATION |
The information required by this item is incorporated herein by reference to the 2011 Proxy Statement for the 2011 annual meeting of stockholders, which will be filed with the SEC not later than 120 days subsequent to December 31, 2010.
| ITEM 12. | SECURITY OWNERSHIP OF CERTAIN BENEFICIAL OWNERS AND MANAGEMENT AND RELATED STOCKHOLDER MATTERS |
The information required by this item is incorporated herein by reference to the 2011 Proxy Statement for the 2011 annual meeting of stockholders, which will be filed with the SEC not later than 120 days subsequent to December 31, 2010.
| ITEM 13. | CERTAIN RELATIONSHIPS AND RELATED TRANSACTIONS AND DIRECTOR INDEPENDENCE |
The information required by this item is incorporated herein by reference to the 2011 Proxy Statement for the 2011 annual meeting of stockholders, which will be filed with the SEC not later than 120 days subsequent to December 31, 2010.
| ITEM 14. | PRINCIPAL ACCOUNTANT FEES AND SERVICES |
The information required by this item is incorporated herein by reference to the 2011 Proxy Statement for the 2011 annual meeting of stockholders, which will be filed with the SEC not later than 120 days subsequent to December 31, 2010.
119
Table of Contents
| ITEM 15. | EXHIBITS AND FINANCIAL STATEMENT SCHEDULES. |
(a)(1) Financial Statements
(a)(2) Financial Statement Schedules
All other schedules are omitted because they are not applicable, not required, or because the required information is included in the financial statements or related notes.
(a)(3) Exhibits.
120
Table of Contents
| Exhibit Number |
Exhibit Title | |
| 2.1 | Participation and Exploration Agreement, dated August 31, 2010, by and among Summit Discovery Resources II, LLC, Rex Energy I, LLC, R.E. Gas Development, LLC, joined therein by Rex Energy Operating Corp., and for the limited purposes set forth therein, Rex Energy Corporation and Sumitomo Corporation (incorporated by reference to Exhibit 2.1 to our Current Report on Form 8-K filed with the SEC on September 3, 2010). | |
| 2.2 | Form of Area One Tax Partnership Agreement attached and made a part of the Participation and Exploration Agreement, dated August 31, 2010, by and among Summit Discovery Resources II, LLC, Rex Energy I, LLC, R.E. Gas Development, LLC, joined therein by Rex Energy Operating Corp., and for the limited purposes set forth therein, Rex Energy Corporation and Sumitomo Corporation (incorporated by reference to Exhibit 2.2 to our Current Report on Form 8-K filed with the SEC on September 3, 2010). | |
| 2.3 | Form of Area Two Tax Partnership Agreement attached and made a part of the Participation and Exploration Agreement, dated August 31, 2010, by and among Summit Discovery Resources II, LLC, Rex Energy I, LLC, R.E. Gas Development, LLC, joined therein by Rex Energy Operating Corp., and for the limited purposes set forth therein, Rex Energy Corporation and Sumitomo Corporation (incorporated by reference to Exhibit 2.3 to our Current Report on Form 8-K filed with the SEC on September 3, 2010). | |
| 2.4 | Form of Area Three Tax Partnership Agreement attached and made a part of the Participation and Exploration Agreement, dated August 31, 2010, by and among Summit Discovery Resources II, LLC, Rex Energy I, LLC, R.E. Gas Development, LLC, joined therein by Rex Energy Operating Corp., and for the limited purposes set forth therein, Rex Energy Corporation and Sumitomo Corporation (incorporated by reference to Exhibit 2.4 to our Current Report on Form 8-K filed with the SEC on September 3, 2010). | |
| 2.5 | Form of Area Four Tax Partnership Agreement attached and made a part of the Participation and Exploration Agreement, dated August 31, 2010, by and among Summit Discovery Resources II, LLC, Rex Energy I, LLC, R.E. Gas Development, LLC, joined therein by Rex Energy Operating Corp., and for the limited purposes set forth therein, Rex Energy Corporation and Sumitomo Corporation (incorporated by reference to Exhibit 2.5 to our Current Report on Form 8-K filed with the SEC on September 3, 2010). | |
| 2.6 | Form of Parent Guaranty of Rex Energy Corporation attached and made a part of the Participation and Exploration Agreement, dated August 31, 2010, by and among Summit Discovery Resources II, LLC, Rex Energy I, LLC, R.E. Gas Development, LLC, joined therein by Rex Energy Operating Corp., and for the limited purposes set forth therein, Rex Energy Corporation and Sumitomo Corporation (incorporated by reference to Exhibit 2.6 to our Current Report on Form 8-K filed with the SEC on September 3, 2010). | |
| 2.7 | Form of Parent Guaranty of Sumitomo Corporation attached and made a part of the Participation and Exploration Agreement, dated August 31, 2010, by and among Summit Discovery Resources II, LLC, Rex Energy I, LLC, R.E. Gas Development, LLC, joined therein by Rex Energy Operating Corp., and for the limited purposes set forth therein, Rex Energy Corporation and Sumitomo Corporation (incorporated by reference to Exhibit 2.7 to our Current Report on Form 8-K filed with the SEC on September 3, 2010). | |
| 2.8 | First Amendment to Participation and Exploration Agreement, dated September 30, 2010, by and among Summit Discovery Resources II, LLC, Rex Energy I, LLC, R.E. Gas Development, LLC, joined therein by Rex Energy Operating Corp., and for the limited purposes set forth therein, Rex Energy Corporation and Sumitomo Corporation (incorporated by reference to Exhibit 2.1 to our Current Report on Form 8-K filed with the SEC on October 6, 2010). | |
121
Table of Contents
| Exhibit Number |
Exhibit Title | |
| 3.1 | Certificate of Incorporation of Rex Energy Corporation (incorporated by reference to Exhibit 3.1 to our Registration Statement on Form S-1 (File No. 333-142430) as filed with the SEC on April 27, 2007). | |
| 3.2 | Certificate of Amendment to Certificate of Incorporation of Rex Energy Corporation (incorporated by reference to Exhibit 3.2 to our Registration Statement on Form S-1 (File No. 333-142430) as filed with the SEC on April 27, 2007). | |
| 3.3 | Amended and Restated Bylaws of Rex Energy Corporation (incorporated by reference to Exhibit 3.3 to our Registration Statement on Form S-1 (File No. 333-142430) as filed with the SEC on April 27, 2007). | |
| 3.4 | Amendment to Amended and Restated Bylaws of Rex Energy Corporation (incorporated by reference to Exhibit 3.1 to our Current Report on Form 8-K as filed with the SEC on February 16, 2011). | |
| 4.1 | Form of Specimen Common Stock Certificate of Rex Energy Corporation (incorporated by reference to Exhibit 4.1 to Amendment No. 1 to our Registration Statement on Form S-1 (File No. 333-142430) as filed with the SEC on June 11, 2007). | |
| 10.1+ | Rex Energy Corporation 2007 Long-Term Incentive Plan (incorporated herein by reference to Exhibit 10.1 to the registrant’s Registration Statement on Form S-1/A filed with the SEC on June 11, 2007). | |
| 10.2 | Consent Decree (incorporated by reference to Exhibit 10.5 to our Registration Statement on Form S-1 (File No. 333-142430) as filed with the SEC on April 27, 2007). | |
| 10.3 | Independent Director Agreement with John A. Lombardi dated April 1, 2007 (incorporated by reference to Exhibit 10.6 to our Registration Statement on Form S-1 (File No. 333-142430) as filed with the SEC on April 27, 2007). | |
| 10.4 | Letter Agreement, dated April 13, 2007, between Shaner Hotel Group Limited Partnership and Rex Energy Operating Corp. (incorporated by reference to Exhibit 10.9 to Amendment No. 1 to our Registration Statement on Form S-1 (File No. 333-142430) as filed with the SEC on June 11, 2007). | |
| 10.5 | Summary of oral month-to-month administrative services agreement between Shaner Solutions Limited Partnership and Rex Energy Operating Corp. (incorporated by reference to Exhibit 10.12 to our Registration Statement on Form S-1 (File No. 333-142430) as filed with the SEC on July 6, 2007). | |
| 10.6 | Summary of oral month-to-month agreement regarding use of airplane between Charlie Brown Air Corp. and Rex Energy Operating Corp. (incorporated by reference to Exhibit 10.13 to our Registration Statement on Form S-1 (File No. 333-142430) as filed with the SEC on July 6, 2007). | |
| 10.7 | First Amended and Restated Aircraft Joint Ownership and Management Agreement, dated June 21, 2007, between Charlie Brown Air Corp. and Charlie Brown II Limited Partnership (incorporated by reference to Exhibit 10.18 to Amendment No. 2 to our Registration Statement on Form S-1 (File No. 333-142430) as filed with the SEC on July 6, 2007). | |
| 10.8 | Credit Agreement, dated as of September 28, 2007, among Rex Energy Corporation, as Borrower, KeyBank National Association, as Administrative Agent, BNP Paribas, as Syndication Agent, Sovereign Bank, as Documentation Agent and The Lenders Party Thereto (incorporated by reference to Exhibit 10.1 to our Current Report on Form 8-K as filed with the SEC on October 3, 2007). | |
| 10.9 | Guaranty and Collateral Agreement, dated as of September 28, 2007, made by Rex Energy Corporation and each of the other grantors (as defined therein) in favor of KeyBank National Association, as Administrative Agent (incorporated by reference to Exhibit 10.2 to our Current Report on Form 8-K as filed with the SEC on October 3, 2007). | |
122
Table of Contents
| Exhibit Number |
Exhibit Title | |
| 10.10 | Independent Director Agreement by and between Rex Energy Corporation and Daniel J. Churay effective as of October 19, 2007 (incorporated by reference to Exhibit 10.1 to our Current Report on Form 8-K filed with the SEC on October 19, 2007). | |
| 10.11 | Independent Director Agreement by and between Rex Energy Corporation and John W. Higbee effective as of October 17, 2007 (incorporated by reference to Exhibit 10.1 to our Current Report on Form 8-K filed with the SEC on October 19, 2007). | |
| 10.12* | Rex Energy Corporation Director Compensation Plan Effective As of January 1, 2008. | |
| 10.13+ | Form of Nonqualified Stock Option Award Agreement for employee common stock option awards under Rex Energy 2007 Long-Term Incentive Plan (incorporated by reference to Exhibit 10.28 to our Annual Report on Form 10-K filed with the SEC on March 31, 2008). | |
| 10.14 | Form of Nonqualified Stock Option Award Agreement for non-employee director common stock option awards under Rex Energy 2007 Long-Term Incentive Plan (incorporated by reference to Exhibit 10.29 to our Annual Report on Form 10-K filed with the SEC on March 31, 2008). | |
| 10.15+ | Form of Stock Appreciation Right Award Agreement under Rex Energy 2007 Long-Term Incentive Plan (incorporated by reference to Exhibit 10.30 to our Annual Report on Form 10-K filed with the SEC on March 31, 2008). | |
| 10.16+ | Form of Restricted Stock Award Agreement under Rex Energy 2007 Long-Term Incentive Plan (incorporated by reference to Exhibit 10.2 to our Quarterly Report on Form 10-Q filed with the SEC on August 6, 2008). | |
| 10.17 | First Amendment to Credit Agreement, effective as of April 14, 2008, among Rex Energy Corporation, as Borrower, KeyBank National Association, as Administrative Agent, and The Lenders Signatory Thereto (incorporated by reference to Exhibit 10.1 to our Current Report on Form 8-K filed with the SEC on April 18, 2008). | |
| 10.18 | Purchase Agreement, dated December 23, 2008, by and between Rex Energy I, LLC and Adventure Exploration Partners, LLC (incorporated by reference to Exhibit 10.1 to our Current Report on Form 8-K filed with the SEC on December 30, 2008). | |
| 10.19 | Second Amendment to Credit Agreement, effective December 23, 2008, among Rex Energy Corporation, as Borrower, KeyBank National Association, as Administrative Agent, and The Lenders Signatory Thereto (incorporated by reference to Exhibit 10.1 to our Current Report on Form 8-K filed with the SEC on January 9, 2009). | |
| 10.20 | Operating Agreement of Charlie Brown Air II, LLC dated as of June 26, 2008 (incorporated by reference to Exhibit 10.35 to our Annual Report on Form 10-K/A filed with the SEC on October 9, 2009). | |
| 10.21 | Letter Agreement, dated as of March 9, 2009, by and between Rex Energy I, LL and Adventure Exploration Partners, LLC (incorporated by reference to Exhibit 10.1 to our Current Report on Form 8-K filed with the SEC on March 13, 2009). | |
| 10.22 | Third Amendment to Credit Agreement, effective as of April 20, 2009, among Rex Energy Corporation, as Borrower, KeyBank National Association, as Administrative Agent, and The Lenders Signatory Thereto (incorporated by reference to Exhibit 10.1 to our Current Report on Form 8-K filed with the SEC on April 27, 2009). | |
| 10.23 | Participation and Exploration Agreement dated June 18, 2009 by and among Williams Production Company, LLC, Williams Production Appalachia, LLC, Rex Energy I, LLC and R.E. Gas Development, LLC (incorporated by reference to Exhibit 10.1 to our Current Report on Form 8-K filed with the SEC on June 24, 2009). | |
123
Table of Contents
| Exhibit Number |
Exhibit Title | |
| 10.24 | Tax Partnership Agreement attached and made a part of the Participation and Exploration Agreement dated June 18, 2009 by and among Williams Production Company, LLC, Williams Production Appalachia, LLC, Rex Energy I, LLC and R.E. Gas Development, LLC (incorporated by reference to Exhibit 10.2 to our Current Report on Form 8-K filed with the SEC on June 24, 2009). | |
| 10.25 | Limited Liability Company Agreement of RW Gathering, LLC effective as of June 18, 2009 (incorporated by reference to Exhibit 10.3 to our Current Report on Form 8-K filed with the SEC on June 24, 2009). | |
| 10.26 | Settlement Agreement and Release by and between Julia Leib and Lisa Thompson, individually and on behalf of the certified class, on the one hand, and Rex Energy Operating Corp. and PennTex Resources Illinois, Inc., on the other hand, effective December 17, 2009 (incorporated by reference to Exhibit 10.1 to our Current Report on Form 8-K filed with the SEC on December 22, 2009). | |
| 10.27 | Limited Liability Company Agreement of Keystone Midstream Services, LLC, dated December 21, 2009, by and among R.E. Gas Development, LLC, Stonehenge Energy Resources, L.P. and Keystone Midstream Services, LLC (incorporated by reference to Exhibit 10.1 to our Current Report on Form 8-K filed with the SEC on December 28, 2009). | |
| 10.28 | Contribution Agreement, dated December 21, 2009, by and among R.E. Gas Development, LLC, Stonehenge Energy Resources, L.P. and Keystone Midstream Services, LLC (incorporated by reference to Exhibit 10.2 to our Current Report on Form 8-K filed with the SEC on December 28, 2009). | |
| 10.29 | Gas Gathering, Compression and Processing Agreement, dated December 21, 2009, by and between R.E. Gas Development, LLC, Keystone Midstream Services, LLC and Rex Energy Corporation (incorporated by reference to Exhibit 10.3 to our Current Report on Form 8-K filed with the SEC on December 28, 2009). | |
| 10.30 | Fourth Amendment to Credit Agreement, effective as of December 18, 2009, among Rex Energy Corporation, as Borrower, KeyBank National Association, as Administrative Agent, and The Lenders Signatory Thereto (incorporated by reference to Exhibit 10.4 to our Current Report on Form 8-K filed with the SEC on December 28, 2009). | |
| 10.31 | Assumption Agreement effective as of December 18, 2009 made by R.E. Gas Development, LLC in favor of KeyBank National Association, as Administrative Agent, and the Lenders Party to the Credit Agreement (incorporated by reference to Exhibit 10.5 to our Current Report on Form 8-K filed with the SEC on December 28, 2009). | |
| 10.32 | Supplement to Guaranty and Collateral Agreement effective as of December 18, 2009 made by Rex Energy Corporation in favor of KeyBank National Association, as Administrative Agent, and the Lenders Party to the Credit Agreement (incorporated by reference to Exhibit 10.6 to our Current Report on Form 8-K filed with the SEC on December 28, 2009). | |
| 10.33 | Master Crude Purchase Agreement by and among certain direct and indirect wholly owned subsidiaries of Rex Energy Corporation and CountryMark Cooperative, dated December 30, 2009. (incorporated by reference to Exhibit 10.1 to our Current Report on Form 8-K filed with the SEC on January 5, 2010). | |
| 10.34+ | Form of Restricted Stock Award Agreement or employee restricted stock awards under Rex Energy 2007 Long-Term Incentive Plan (incorporated by reference to Exhibit 10.1 to our Current Report on Form 8-K filed with the SEC on March 31, 2010). | |
| 10.35 | Independent Director Agreement by and between Rex Energy Corporation and Eric L. Mattson effective as of April 30, 2010 (incorporated by reference to Exhibit 10.1 to our Current Report on Form 8-K filed with the SEC on April 30, 2010). | |
124
Table of Contents
| Exhibit Number |
Exhibit Title | |
| 10.36 | Purchase and Sale Agreement dated June 28, 2010 by and between Rex Energy Rockies, LLC and Duncan Oil Partners, LLC (incorporated by reference to Exhibit 10.1 to our Current Report on Form 8-K filed with the SEC on July 7, 2010). | |
| 10.37 | Fifth Amendment to Credit Agreement, effective as of December 18, 2009, among Rex Energy Corporation, as Borrower, KeyBank National Association, as Administrative Agent, and The Lenders Signatory Thereto (incorporated by reference to Exhibit 10.1 to our Current Report on Form 8-K filed with the SEC on September 3, 2010). | |
| 10.38 | First Amendment to Limited Liability Company Agreement of Keystone Midstream Services, LLC, dated September 30, 3010, by and among Keystone Midstream Services, LLC, R.E. Gas Development, LLC, Stonehenge Energy Resources, L.P., and Summit Discovery Resources II, LLC (incorporated by reference to Exhibit 10.1 to our Current Report on Form 8-K filed with the SEC on October 6, 2010). | |
| 10.39+ | Employment Agreement by and between Patrick McKinney and Rex Energy Operating Corp. dated October 1, 2010 (incorporated by reference to Exhibit 10.1 to our Current Report on Form 8-K as filed with the SEC on October 7, 2008). | |
| 10.40+ | Employment Agreement by and between Thomas C. Stabley and Rex Energy Operating Corp. dated October 1, 2010 (incorporated by reference to Exhibit 10.2 to our Current Report on Form 8-K as filed with the SEC on October 7, 2010). | |
| 10.41+ | Employment Agreement by and between Daniel J. Churay and Rex Energy Operating Corp. dated November 1, 2010 (incorporated by reference to Exhibit 10.1 to our Current Report on Form 8-K as filed with the SEC on November 3, 2010). | |
| 10.42* | Confirmation No. 2 under Master Crude Purchase Agreement by and among certain direct and indirect wholly owned subsidiaries of Rex Energy Corporation and CountryMark Cooperative, dated January 3, 2011, for period commencing on January 1, 2011 through December 31, 2011 (Portions of this exhibit are subject to a request for confidential treatment and have been redacted and filed separately with the Securities and Exchange Commission). | |
| 10.43*+ | Separation Agreement by and between Timothy P. Beattie and Rex Energy Operating Corp. dated January 28, 2011. | |
| 10.44+ | Rex Energy Corporation Executive Change of Control Policy (incorporated by reference to Exhibit 10.1 to our Current Report on Form 8-K as filed with the SEC on February 16, 2011). | |
| 10.45* | Form of Non-Employee Director Restricted Stock Award/Phantom Stock Award Agreement under Rex Energy Corporation 2007 Long-Term Incentive Plan. | |
| 21.1* | Subsidiaries of the Registrant. | |
| 23.1* | Consent of Malin, Bergquist & Company, LLP. | |
| 23.2* | Consent of Netherland, Sewell & Associates, Inc. | |
| 31.1* | Certification of Chief Executive Officer (Principal Executive Officer) pursuant to Section 302 of the Sarbanes-Oxley Act. | |
| 31.2* | Certification of Chief Financial Officer (Principal Financial and Principal Accounting Officer) pursuant to Section 302 of the Sarbanes-Oxley Act. | |
| 32.1* | Certification pursuant to 18 U.S.C. Section 1350, as adopted pursuant to Section 906 of the Sarbanes-Oxley Act. | |
| 99.1* | Report of Netherland, Sewell & Associates, Inc. | |
| * | Filed herewith. |
| + | Indicates management contract or compensation plan or arrangement. |
125
Table of Contents
GLOSSARY OF OIL AND NATURAL GAS TERMS
The following is a description of the meanings of some of the oil and gas industry terms used in this report:
Basin. A large natural depression on the earth’s surface in which sediments accumulate.
Bbl. One stock tank barrel, of 42 U.S. gallons liquid volume, of crude oil.
Bcf. Billion cubic feet, determined using the ratio of six Mcf of gas to one Bbl of crude oil, condensate or gas liquids.
Bopd. Barrels of oil per day.
Btu or British Thermal Unit. The quantity of heat required to raise the temperature of one pound of water by one degree Fahrenheit.
Completion. The installation of permanent equipment for the production of oil or gas.
Development or Developmental well. A well drilled within the proved boundaries of an oil or gas reservoir with the intention of completing the stratigraphic horizon known to be productive.
Dry hole. A well found to be incapable of producing hydrocarbons in sufficient quantities such that proceeds from the sale of such production exceed production expenses, taxes and the royalty burden.
Exploitation. A drilling or other project which may target proved or unproved reserves (such as probable or possible reserves), but generally is expected to have lower risk.
Exploration or Exploratory well. A well drilled to find and produce oil or gas reserves not classified as proved, to find a new reservoir in a field previously found to be productive of oil or gas in another reservoir or to extend a known reservoir.
Field. An area consisting of either a single reservoir or multiple reservoirs, all grouped on or related to the same individual geological structural feature and/or stratigraphic condition.
Gross acres or gross wells. The total acres or wells, as the case may be, in which a working interest is owned.
Horizontal drilling. A drilling operation in which a portion of the well is drilled horizontally within a productive or potentially productive formation. This operation usually yields a well which has the ability to produce higher volumes than a vertical well drilled in the same formation.
Injection well or Injection. A well which is used to place liquids or gases into the producing zone during secondary/tertiary recovery operations to assist in maintaining reservoir pressure and enhancing recoveries from the field.
Lease operating expenses. The expenses of lifting oil or gas from a producing formation to the surface, and the transportation and marketing thereof, constituting part of the current operating expenses of a working interest, and also including labor, superintendence, supplies, repairs, short-lived assets, maintenance, allocated overhead costs, ad valorem taxes and other expenses incidental to production, but excluding lease acquisition or drilling or completion expenses.
MBbls. One thousand barrels of crude oil or other liquid hydrocarbons.
MBOE. One thousand barrels of oil equivalent.
126
Table of Contents
Mcf. One thousand cubic feet of natural gas.
Mcfd. One thousand cubic feet of natural gas per day.
MMBbls. One million barrels of oil or other liquid hydrocarbons.
MMBOE. One million barrels of oil equivalent.
MMBtu. One million British thermal units.
MMcf. One million cubic feet of gas.
MMcfe. One million cubic feet equivalent, determined using the ratio of six Mcf of gas to one Bbl of oil, condensate or gas liquids.
Net acres or net wells. The sum of the fractional working interests owned in gross acres or wells, as the case may be.
NYMEX. New York Mercantile Exchange.
PV-10 or present value of estimated future cash flows. An estimate of the present value of the estimated future cash flows from proved oil and gas reserves at a date indicated after deducting estimated production and ad valorem taxes, future capital costs and operating expenses, but before deducting any estimates of federal income taxes. The estimated future cash flows are discounted at an annual rate of 10%, in accordance with the Securities and Exchange Commission’s practice, to determine their “present value.” The present value is shown to indicate the effect of time on the value of the revenue stream and should not be construed as being the fair market value of the properties. Estimates of future cash flows are made using oil and gas prices and operating costs at the date indicated and held constant for the life of the reserves.
Primary recovery. The period of production in which oil and natural gas is produced from its reservoir through the wellbore without enhanced recovery technologies, such as water floods or ASP floods.
Productive well. A well that is found to be capable of producing hydrocarbons in sufficient quantities such that proceeds from the sale of such production exceed production expenses and taxes.
Prospect. A specific geographic area which, based on supporting geological, geophysical or other data and also preliminary economic analysis using reasonably anticipated prices and costs, is deemed to have potential for the discovery of commercial hydrocarbons.
Proved developed non-producing reserves or PDNP. Proved developed reserves expected to be recovered from zones behind casing in existing wells.
Proved developed producing reserves or PDP. Proved developed reserves that are expected to be recovered from completion intervals currently open in existing wells and capable of production to market.
Proved developed reserves. Developed oil and gas reserves are reserves of any category that can be expected to be recovered (i) through existing wells with existing equipment and operating methods or in which the cost of the required equipment is relatively minor compared to the cost of a new well; and (ii) through installed extraction equipment and infrastructure operational at the time of the reserves estimate
Proved reserves. Those quantities of oil and gas, which, by analysis of geosciences and engineering data, can be estimated with reasonable certainty to be economically producible, from a given date forward, from known reservoirs, and under existing economic conditions, operating methods, and government regulations, prior
127
Table of Contents
to the time at which contracts providing the right to operate expire, unless evidence indicates that renewal is reasonably certain, regardless of whether deterministic or probabilistic methods are used for the estimation. The project to extract the hydrocarbons must have commenced or the operator must be reasonably certain that it will commence the project within a reasonable time.
The area of the reservoir considered as proved includes: (i) the area identified by drilling and limited by fluid contacts, if any, and (ii) adjacent undrilled portions of the reservoir that can, with reasonable certainty, be judged to be continuous with it and to contain economically producible oil or gas on the basis of available geosciences and engineering data.
In the absence of data on fluid contacts, proved quantities in a reservoir are limited by the lowest known hydrocarbons as seen in a well penetration unless geosciences, engineering, or performance data and reliable technology establishes a lower contact with reasonable certainty. Where direct observation from well penetrations has defined a highest known oil elevation and the potential exists for an associated gas cap, proved oil reserves may be assigned in the structurally higher portions of the reservoir only if geosciences, engineering or performance data and reliable technology establish the higher contact with reasonable certainty.
Reserves which can be produced economically through application of improved recovery techniques (including, but not limited to, fluid injection) are included in the proved classification when: (i) successful testing by a pilot project in an area of the reservoir with properties no more favorable than in the reservoir as a whole, the operation of an installed program in the reservoir or an analogous reservoir, or other evidence using reliable technology establishes the reasonable certainty of the engineering analysis on which the project or program was based; and (ii) the project has been approved for development by all necessary parties and entities, including governmental entities.
Existing economic conditions include prices and costs at which economic producibility from a reservoir is to be determined. The price shall be the average price during the 12-month period prior to the ending date of the period covered by the report, determined as an unweighted arithmetic average of the first-day-of-the-month price for each month within such period, unless prices are defined by contractual arrangements, excluding escalations based upon future conditions.
Proved undeveloped reserves or PUD. Reserves of any category that are expected to be recovered from new wells on undrilled acreage, or from existing wells where a relatively major expenditure is required for recompletion.
Reserves on undrilled acreage shall be limited to those directly offsetting development spacing areas that are reasonably certain of production when drilled, unless evidence using reliable technology exists that establishes reasonable certainty of economic producibility at greater distances. Undrilled locations can be classified as having undeveloped reserves only if a development plan has been adopted indicating that they are scheduled to be drilled within five years, unless the specific circumstances justify a longer time.
Recompletion. The addition of production from another interval or formation in an existing wellbore.
Reserve life index. An index calculated by dividing year-end proved reserves by the average production during the past year to estimate the number of years of remaining production.
Reservoir. A porous and permeable underground formation containing a natural accumulation of producible oil and/or gas that is confined by impermeable rock or water barriers and is individual and separate from other reservoirs.
Secondary recovery. An artificial method or process used to restore or increase production from a reservoir after the primary production by the natural producing mechanism and reservoir pressure has experienced partial depletion. Gas injection and waterflooding are examples of this technique.
128
Table of Contents
Tertiary recovery. The third stage of hydrocarbon production during which sophisticated techniques that alter the original properties of the oil are used. Chemical flooding (including ASP flooding), miscible displacement and thermal flooding are examples of this technique.
Undeveloped acreage. Lease acreage on which wells have not been drilled or completed to a point that would permit the production of commercial quantities of oil or gas, regardless of whether or not such acreage contains proved reserves.
Waterflooding. A secondary recovery operation in which water is injected into the producing formation in order to maintain reservoir pressure and force oil toward and into the producing wells.
Working interest. The operating interest that gives the owner the right to drill, produce and conduct operating activities on the property and receive a share of production.
Workover. Operations on a producing well to restore or increase production.
129
Table of Contents
Pursuant to the requirements of Section 13 or 15(d) of the Securities Exchange Act of 1934, the registrant has duly caused this report to be signed on its behalf by the undersigned, thereunto duly authorized.
Dated: March 3, 2011
| REX ENERGY CORPORATION | ||
| By: | /s/ DANIEL J. CHURAY | |
| Daniel J. Churay | ||
| President and Chief Executive Officer | ||
Pursuant to the requirements of the Securities Exchange Act of 1934, this report has been signed below by the following persons on behalf of the registrant and in the capacities and on the dates indicated.
| /S/ LANCE T. SHANER Lance T. Shaner |
Chairman of the Board | March 3, 2011 | ||
| /S/ DANIEL J. CHURAY Daniel J. Churay |
President, Chief Executive Officer and Director (Principal Executive Officer) | March 3, 2011 | ||
| /S/ THOMAS C. STABLEY Thomas C. Stabley |
Executive Vice President and Chief Financial Officer (Principal Financial and Accounting Officer) | March 3, 2011 | ||
| /S/ ERIC L. MATTSON Eric L. Mattson |
Director | March 3, 2011 | ||
| /S/ JOHN W. HIGBEE John W. Higbee |
Director | March 3, 2011 | ||
| /S/ JOHN A. LOMBARDI John A. Lombardi |
Director | March 3, 2011 | ||
| /S/ JOHN J. ZAK John J. Zak |
Director | March 3, 2011 | ||
130
Table of Contents
EXHIBIT INDEX
| Exhibit |
Exhibit Title | |
| 2.1 | Participation and Exploration Agreement, dated August 31, 2010, by and among Summit Discovery Resources II, LLC, Rex Energy I, LLC, R.E. Gas Development, LLC, joined therein by Rex Energy Operating Corp., and for the limited purposes set forth therein, Rex Energy Corporation and Sumitomo Corporation (incorporated by reference to Exhibit 2.1 to our Current Report on Form 8-K filed with the SEC on September 3, 2010). | |
| 2.2 | Form of Area One Tax Partnership Agreement attached and made a part of the Participation and Exploration Agreement, dated August 31, 2010, by and among Summit Discovery Resources II, LLC, Rex Energy I, LLC, R.E. Gas Development, LLC, joined therein by Rex Energy Operating Corp., and for the limited purposes set forth therein, Rex Energy Corporation and Sumitomo Corporation (incorporated by reference to Exhibit 2.2 to our Current Report on Form 8-K filed with the SEC on September 3, 2010). | |
| 2.3 | Form of Area Two Tax Partnership Agreement attached and made a part of the Participation and Exploration Agreement, dated August 31, 2010, by and among Summit Discovery Resources II, LLC, Rex Energy I, LLC, R.E. Gas Development, LLC, joined therein by Rex Energy Operating Corp., and for the limited purposes set forth therein, Rex Energy Corporation and Sumitomo Corporation (incorporated by reference to Exhibit 2.3 to our Current Report on Form 8-K filed with the SEC on September 3, 2010). | |
| 2.4 | Form of Area Three Tax Partnership Agreement attached and made a part of the Participation and Exploration Agreement, dated August 31, 2010, by and among Summit Discovery Resources II, LLC, Rex Energy I, LLC, R.E. Gas Development, LLC, joined therein by Rex Energy Operating Corp., and for the limited purposes set forth therein, Rex Energy Corporation and Sumitomo Corporation (incorporated by reference to Exhibit 2.4 to our Current Report on Form 8-K filed with the SEC on September 3, 2010). | |
| 2.5 | Form of Area Four Tax Partnership Agreement attached and made a part of the Participation and Exploration Agreement, dated August 31, 2010, by and among Summit Discovery Resources II, LLC, Rex Energy I, LLC, R.E. Gas Development, LLC, joined therein by Rex Energy Operating Corp., and for the limited purposes set forth therein, Rex Energy Corporation and Sumitomo Corporation (incorporated by reference to Exhibit 2.5 to our Current Report on Form 8-K filed with the SEC on September 3, 2010). | |
| 2.6 | Form of Parent Guaranty of Rex Energy Corporation attached and made a part of the Participation and Exploration Agreement, dated August 31, 2010, by and among Summit Discovery Resources II, LLC, Rex Energy I, LLC, R.E. Gas Development, LLC, joined therein by Rex Energy Operating Corp., and for the limited purposes set forth therein, Rex Energy Corporation and Sumitomo Corporation (incorporated by reference to Exhibit 2.6 to our Current Report on Form 8-K filed with the SEC on September 3, 2010). | |
| 2.7 | Form of Parent Guaranty of Sumitomo Corporation attached and made a part of the Participation and Exploration Agreement, dated August 31, 2010, by and among Summit Discovery Resources II, LLC, Rex Energy I, LLC, R.E. Gas Development, LLC, joined therein by Rex Energy Operating Corp., and for the limited purposes set forth therein, Rex Energy Corporation and Sumitomo Corporation (incorporated by reference to Exhibit 2.7 to our Current Report on Form 8-K filed with the SEC on September 3, 2010). | |
| 2.8 | First Amendment to Participation and Exploration Agreement, dated September 30, 2010, by and among Summit Discovery Resources II, LLC, Rex Energy I, LLC, R.E. Gas Development, LLC, joined therein by Rex Energy Operating Corp., and for the limited purposes set forth therein, Rex Energy Corporation and Sumitomo Corporation (incorporated by reference to Exhibit 2.1 to our Current Report on Form 8-K filed with the SEC on October 6, 2010). | |
131
Table of Contents
| Exhibit |
Exhibit Title | |
| 3.1 | Certificate of Incorporation of Rex Energy Corporation (incorporated by reference to Exhibit 3.1 to our Registration Statement on Form S-1 (File No. 333-142430) as filed with the SEC on April 27, 2007). | |
| 3.2 | Certificate of Amendment to Certificate of Incorporation of Rex Energy Corporation (incorporated by reference to Exhibit 3.2 to our Registration Statement on Form S-1 (File No. 333-142430) as filed with the SEC on April 27, 2007). | |
| 3.3 | Amended and Restated Bylaws of Rex Energy Corporation (incorporated by reference to Exhibit 3.3 to our Registration Statement on Form S-1 (File No. 333-142430) as filed with the SEC on April 27, 2007). | |
| 3.4 | Amendment to Amended and Restated Bylaws of Rex Energy Corporation (incorporated by reference to Exhibit 3.1 to our Current Report on Form 8-K as filed with the SEC on February 16, 2011). | |
| 4.1 | Form of Specimen Common Stock Certificate of Rex Energy Corporation (incorporated by reference to Exhibit 4.1 to Amendment No. 1 to our Registration Statement on Form S-1 (File No. 333-142430) as filed with the SEC on June 11, 2007). | |
| 10.1+ | Rex Energy Corporation 2007 Long-Term Incentive Plan (incorporated herein by reference to Exhibit 10.1 to the registrant’s Registration Statement on Form S-1/A filed with the SEC on June 11, 2007). | |
| 10.2 | Consent Decree (incorporated by reference to Exhibit 10.5 to our Registration Statement on Form S-1 (File No. 333-142430) as filed with the SEC on April 27, 2007). | |
| 10.3 | Independent Director Agreement with John A. Lombardi dated April 1, 2007 (incorporated by reference to Exhibit 10.6 to our Registration Statement on Form S-1 (File No. 333-142430) as filed with the SEC on April 27, 2007). | |
| 10.4 | Letter Agreement, dated April 13, 2007, between Shaner Hotel Group Limited Partnership and Rex Energy Operating Corp. (incorporated by reference to Exhibit 10.9 to Amendment No. 1 to our Registration Statement on Form S-1 (File No. 333-142430) as filed with the SEC on June 11, 2007). | |
| 10.5 | Summary of oral month-to-month administrative services agreement between Shaner Solutions Limited Partnership and Rex Energy Operating Corp. (incorporated by reference to Exhibit 10.12 to our Registration Statement on Form S-1 (File No. 333-142430) as filed with the SEC on July 6, 2007). | |
| 10.6 | Summary of oral month-to-month agreement regarding use of airplane between Charlie Brown Air Corp. and Rex Energy Operating Corp. (incorporated by reference to Exhibit 10.13 to our Registration Statement on Form S-1 (File No. 333-142430) as filed with the SEC on July 6, 2007). | |
| 10.7 | First Amended and Restated Aircraft Joint Ownership and Management Agreement, dated June 21, 2007, between Charlie Brown Air Corp. and Charlie Brown II Limited Partnership (incorporated by reference to Exhibit 10.18 to Amendment No. 2 to our Registration Statement on Form S-1 (File No. 333-142430) as filed with the SEC on July 6, 2007). | |
| 10.8 | Credit Agreement, dated as of September 28, 2007, among Rex Energy Corporation, as Borrower, KeyBank National Association, as Administrative Agent, BNP Paribas, as Syndication Agent, Sovereign Bank, as Documentation Agent and The Lenders Party Thereto (incorporated by reference to Exhibit 10.1 to our Current Report on Form 8-K as filed with the SEC on October 3, 2007). | |
| 10.9 | Guaranty and Collateral Agreement, dated as of September 28, 2007, made by Rex Energy Corporation and each of the other grantors (as defined therein) in favor of KeyBank National Association, as Administrative Agent (incorporated by reference to Exhibit 10.2 to our Current Report on Form 8-K as filed with the SEC on October 3, 2007). | |
132
Table of Contents
| Exhibit |
Exhibit Title | |
| 10.10 | Independent Director Agreement by and between Rex Energy Corporation and Daniel J. Churay effective as of October 19, 2007 (incorporated by reference to Exhibit 10.1 to our Current Report on Form 8-K filed with the SEC on October 19, 2007). | |
| 10.11 | Independent Director Agreement by and between Rex Energy Corporation and John W. Higbee effective as of October 17, 2007 (incorporated by reference to Exhibit 10.1 to our Current Report on Form 8-K filed with the SEC on October 19, 2007). | |
| 10.12* | Rex Energy Corporation Director Compensation Plan Effective As of January 1, 2008. | |
| 10.13+ | Form of Nonqualified Stock Option Award Agreement for employee common stock option awards under Rex Energy 2007 Long-Term Incentive Plan (incorporated by reference to Exhibit 10.28 to our Annual Report on Form 10-K filed with the SEC on March 31, 2008). | |
| 10.14 | Form of Nonqualified Stock Option Award Agreement for non-employee director common stock option awards under Rex Energy 2007 Long-Term Incentive Plan (incorporated by reference to Exhibit 10.29 to our Annual Report on Form 10-K filed with the SEC on March 31, 2008). | |
| 10.15+ | Form of Stock Appreciation Right Award Agreement under Rex Energy 2007 Long-Term Incentive Plan (incorporated by reference to Exhibit 10.30 to our Annual Report on Form 10-K filed with the SEC on March 31, 2008). | |
| 10.16+ | Form of Restricted Stock Award Agreement under Rex Energy 2007 Long-Term Incentive Plan (incorporated by reference to Exhibit 10.2 to our Quarterly Report on Form 10-Q filed with the SEC on August 6, 2008). | |
| 10.17 | First Amendment to Credit Agreement, effective as of April 14, 2008, among Rex Energy Corporation, as Borrower, KeyBank National Association, as Administrative Agent, and The Lenders Signatory Thereto (incorporated by reference to Exhibit 10.1 to our Current Report on Form 8-K filed with the SEC on April 18, 2008). | |
| 10.18 | Purchase Agreement, dated December 23, 2008, by and between Rex Energy I, LLC and Adventure Exploration Partners, LLC (incorporated by reference to Exhibit 10.1 to our Current Report on Form 8-K filed with the SEC on December 30, 2008). | |
| 10.19 | Second Amendment to Credit Agreement, effective December 23, 2008, among Rex Energy Corporation, as Borrower, KeyBank National Association, as Administrative Agent, and The Lenders Signatory Thereto (incorporated by reference to Exhibit 10.1 to our Current Report on Form 8-K filed with the SEC on January 9, 2009). | |
| 10.20 | Operating Agreement of Charlie Brown Air II, LLC dated as of June 26, 2008 (incorporated by reference to Exhibit 10.35 to our Annual Report on Form 10-K/A filed with the SEC on October 9, 2009). | |
| 10.21 | Letter Agreement, dated as of March 9, 2009, by and between Rex Energy I, LL and Adventure Exploration Partners, LLC (incorporated by reference to Exhibit 10.1 to our Current Report on Form 8-K filed with the SEC on March 13, 2009). | |
| 10.22 | Third Amendment to Credit Agreement, effective as of April 20, 2009, among Rex Energy Corporation, as Borrower, KeyBank National Association, as Administrative Agent, and The Lenders Signatory Thereto (incorporated by reference to Exhibit 10.1 to our Current Report on Form 8-K filed with the SEC on April 27, 2009). | |
| 10.23 | Participation and Exploration Agreement dated June 18, 2009 by and among Williams Production Company, LLC, Williams Production Appalachia, LLC, Rex Energy I, LLC and R.E. Gas Development, LLC (incorporated by reference to Exhibit 10.1 to our Current Report on Form 8-K filed with the SEC on June 24, 2009). | |
133
Table of Contents
| Exhibit |
Exhibit Title | |
| 10.24 | Tax Partnership Agreement attached and made a part of the Participation and Exploration Agreement dated June 18, 2009 by and among Williams Production Company, LLC, Williams Production Appalachia, LLC, Rex Energy I, LLC and R.E. Gas Development, LLC (incorporated by reference to Exhibit 10.2 to our Current Report on Form 8-K filed with the SEC on June 24, 2009). | |
| 10.25 | Limited Liability Company Agreement of RW Gathering, LLC effective as of June 18, 2009 (incorporated by reference to Exhibit 10.3 to our Current Report on Form 8-K filed with the SEC on June 24, 2009). | |
| 10.26 | Settlement Agreement and Release by and between Julia Leib and Lisa Thompson, individually and on behalf of the certified class, on the one hand, and Rex Energy Operating Corp. and PennTex Resources Illinois, Inc., on the other hand, effective December 17, 2009 (incorporated by reference to Exhibit 10.1 to our Current Report on Form 8-K filed with the SEC on December 22, 2009). | |
| 10.27 | Limited Liability Company Agreement of Keystone Midstream Services, LLC, dated December 21, 2009, by and among R.E. Gas Development, LLC, Stonehenge Energy Resources, L.P. and Keystone Midstream Services, LLC (incorporated by reference to Exhibit 10.1 to our Current Report on Form 8-K filed with the SEC on December 28, 2009). | |
| 10.28 | Contribution Agreement, dated December 21, 2009, by and among R.E. Gas Development, LLC, Stonehenge Energy Resources, L.P. and Keystone Midstream Services, LLC (incorporated by reference to Exhibit 10.2 to our Current Report on Form 8-K filed with the SEC on December 28, 2009). | |
| 10.29 | Gas Gathering, Compression and Processing Agreement, dated December 21, 2009, by and between R.E. Gas Development, LLC, Keystone Midstream Services, LLC and Rex Energy Corporation (incorporated by reference to Exhibit 10.3 to our Current Report on Form 8-K filed with the SEC on December 28, 2009). | |
| 10.30 | Fourth Amendment to Credit Agreement, effective as of December 18, 2009, among Rex Energy Corporation, as Borrower, KeyBank National Association, as Administrative Agent, and The Lenders Signatory Thereto (incorporated by reference to Exhibit 10.4 to our Current Report on Form 8-K filed with the SEC on December 28, 2009). | |
| 10.31 | Assumption Agreement effective as of December 18, 2009 made by R.E. Gas Development, LLC in favor of KeyBank National Association, as Administrative Agent, and the Lenders Party to the Credit Agreement (incorporated by reference to Exhibit 10.5 to our Current Report on Form 8-K filed with the SEC on December 28, 2009). | |
| 10.32 | Supplement to Guaranty and Collateral Agreement effective as of December 18, 2009 made by Rex Energy Corporation in favor of KeyBank National Association, as Administrative Agent, and the Lenders Party to the Credit Agreement (incorporated by reference to Exhibit 10.6 to our Current Report on Form 8-K filed with the SEC on December 28, 2009). | |
| 10.33 | Master Crude Purchase Agreement by and among certain direct and indirect wholly owned subsidiaries of Rex Energy Corporation and CountryMark Cooperative, dated December 30, 2009. (incorporated by reference to Exhibit 10.1 to our Current Report on Form 8-K filed with the SEC on January 5, 2010). | |
| 10.34+ | Form of Restricted Stock Award Agreement or employee restricted stock awards under Rex Energy 2007 Long-Term Incentive Plan (incorporated by reference to Exhibit 10.1 to our Current Report on Form 8-K filed with the SEC on March 31, 2010). | |
| 10.35 | Independent Director Agreement by and between Rex Energy Corporation and Eric L. Mattson effective as of April 30, 2010 (incorporated by reference to Exhibit 10.1 to our Current Report on Form 8-K filed with the SEC on April 30, 2010). | |
134
Table of Contents
| Exhibit |
Exhibit Title | |
| 10.36 | Purchase and Sale Agreement dated June 28, 2010 by and between Rex Energy Rockies, LLC and Duncan Oil Partners, LLC (incorporated by reference to Exhibit 10.1 to our Current Report on Form 8-K filed with the SEC on July 7, 2010). | |
| 10.37 | Fifth Amendment to Credit Agreement, effective as of December 18, 2009, among Rex Energy Corporation, as Borrower, KeyBank National Association, as Administrative Agent, and The Lenders Signatory Thereto (incorporated by reference to Exhibit 10.1 to our Current Report on Form 8-K filed with the SEC on September 3, 2010). | |
| 10.38 | First Amendment to Limited Liability Company Agreement of Keystone Midstream Services, LLC, dated September 30, 3010, by and among Keystone Midstream Services, LLC, R.E. Gas Development, LLC, Stonehenge Energy Resources, L.P., and Summit Discovery Resources II, LLC (incorporated by reference to Exhibit 10.1 to our Current Report on Form 8-K filed with the SEC on October 6, 2010). | |
| 10.39+ | Employment Agreement by and between Patrick McKinney and Rex Energy Operating Corp. dated October 1, 2010 (incorporated by reference to Exhibit 10.1 to our Current Report on Form 8-K as filed with the SEC on October 7, 2008). | |
| 10.40+ | Employment Agreement by and between Thomas C. Stabley and Rex Energy Operating Corp. dated October 1, 2010 (incorporated by reference to Exhibit 10.2 to our Current Report on Form 8-K as filed with the SEC on October 7, 2010). | |
| 10.41+ | Employment Agreement by and between Daniel J. Churay and Rex Energy Operating Corp. dated November 1, 2010 (incorporated by reference to Exhibit 10.1 to our Current Report on Form 8-K as filed with the SEC on November 3, 2010). | |
| 10.42* | Confirmation No. 2 under Master Crude Purchase Agreement by and among certain direct and indirect wholly owned subsidiaries of Rex Energy Corporation and CountryMark Cooperative, dated January 3, 2011, for period commencing on January 1, 2011 through December 31, 2011 (Portions of this exhibit are subject to a request for confidential treatment and have been redacted and filed separately with the Securities and Exchange Commission). | |
| 10.43*+ | Separation Agreement by and between Timothy P. Beattie and Rex Energy Operating Corp. dated January 28, 2011. | |
| 10.44+ | Rex Energy Corporation Executive Change of Control Policy (incorporated by reference to Exhibit 10.1 to our Current Report on Form 8-K as filed with the SEC on February 16, 2011). | |
| 10.45* | Form of Non-Employee Director Restricted Stock Award/Phantom Stock Award Agreement under Rex Energy Corporation 2007 Long-Term Incentive Plan. | |
| 21.1* | Subsidiaries of the Registrant. | |
| 23.1* | Consent of Malin, Bergquist & Company, LLP. | |
| 23.2* | Consent of Netherland, Sewell & Associates, Inc. | |
| 31.1* | Certification of Chief Executive Officer (Principal Executive Officer) pursuant to Section 302 of the Sarbanes-Oxley Act. | |
| 31.2* | Certification of Chief Financial Officer (Principal Financial and Principal Accounting Officer) pursuant to Section 302 of the Sarbanes-Oxley Act. | |
| 32.1* | Certification pursuant to 18 U.S.C. Section 1350, as adopted pursuant to Section 906 of the Sarbanes-Oxley Act. | |
| 99.1* | Report of Netherland, Sewell & Associates, Inc. | |
| * | Filed herewith. |
| + | Indicates management contract or compensation plan or arrangement. |
135