Attached files
| file | filename |
|---|---|
| 8-K - FORM 8-K - FIRST FINANCIAL BANCORP /OH/ | a8-kinvestorpresentation26.htm |

Investor Presentation
Fourth Quarter 2017
EXHIBIT 99.1

2
Certain statements contained in this presentation which are not statements of historical fact constitute forward-looking statements within the meaning of the
Private Securities Litigation Reform Act of 1995. Such statements include, but are not limited to, certain plans, expectations, goals, projections and benefits
relating to the transaction between the Company and MainSource, which are subject to numerous assumptions, risks and uncertainties. Words such as
„„believes,‟‟ „„anticipates,‟‟ “likely,” “expected,” “estimated,” „„intends‟‟ and other similar expressions are intended to identify forward-looking statements but are not
the exclusive means of identifying such statements. Examples of forward-looking statements include, but are not limited to, statements we make about (i) our
future operating or financial performance, including revenues, income or loss and earnings or loss per share, (ii) future common stock dividends, (iii) our capital
structure, including future capital levels, (iv) our plans, objectives and strategies, and (v) the assumptions that underlie our forward-looking statements.
As with any forecast or projection, forward-looking statements are subject to inherent uncertainties, risks and changes in
circumstances that may cause actual results to differ materially from those set forth in the forward-looking statements. Forward-looking statements are not
historical facts but instead express only management‟s beliefs regarding future results or events, many of which, by their na ture, are inherently uncertain and
outside of the management‟s control. It is possible that actual results and outcomes may differ, possibly materially, from the anticipated results or outcomes
indicated in these forward-looking statements. Important factors that could cause actual results to differ materially from those in our forward-looking statements
include the following, without limitation: (i) economic, market, liquidity, credit, interest rate, operational and technological risks associated with the Company‟s
business; (ii) the effect of and changes in policies and laws or regulatory agencies, including the Dodd-Frank Wall Street Reform and Consumer Protection Act
and other legislation and regulation relating to the banking industry; (iii) management‟s ability to effectively execute its business plans; (iv) mergers and
acquisitions, including costs or difficulties related to the integration of acquired companies; (v) the Company‟s ability to comply with the terms of loss sharing
agreements with the FDIC; (vi) the effect of changes in accounting policies and practices; (vii) changes in consumer spending, borrowing and saving and
changes in unemployment; (viii) changes in customers‟ performance and creditworthiness; and (ix) the costs and effects of litigation and of unexpected or
adverse outcomes in such litigation. Additional factors that may cause our actual results to differ materially from those described in our forward-looking
statements can be found in the Form 10-K for the year ended December 31, 2016, as well as its other filings with the SEC, which are available on the SEC
website at www.sec.gov.
Statements concerning the potential merger of the Company and MainSource may also be forward-looking statements. Please refer to each of the Company‟s
and MainSource‟s Annual Report on Form 10-K for the year ended December 31, 2016, as well as their other filings with the SEC, for a more detailed discussion
of risks, uncertainties and factors that could cause actual results to differ from those discussed in the forward-looking statements.
In addition to factors previously disclosed in reports filed by the Company and MainSource with the SEC, risks and uncertainties for the Company, MainSource
and the combined company include, but are not limited to: the possibility that any of the anticipated benefits of the proposed Merger will not be realized or will not
be realized within the expected time period; the risk that integration of MainSource's operations with those of the Company will be materially delayed or will be
more costly or difficult than expected; the inability to close the Merger in a timely manner; diversion of management's attention from ongoing business operations
and opportunities; the failure to satisfy other conditions to completion of the , including receipt of required regulatory and other approvals; the failure of the
proposed Merger to close for any other reason; the challenges of integrating and retaining key employees; the effect of the announcement of the Merger on the
Company‟s, MainSource‟s or the combined company's respective customer relationships and operating results; the possibility that the Merger may be more
expensive to complete than anticipated, including as a result of unexpected factors or events; and general competitive, economic, political and market conditions
and fluctuations. All forward-looking statements included in this filing are made as of the date hereof and are based on information available at the time of the
filing. Except as required by law, neither the Company nor MainSource assumes any obligation to update any forward-looking statement.
Forward Looking Statement Disclosure
3
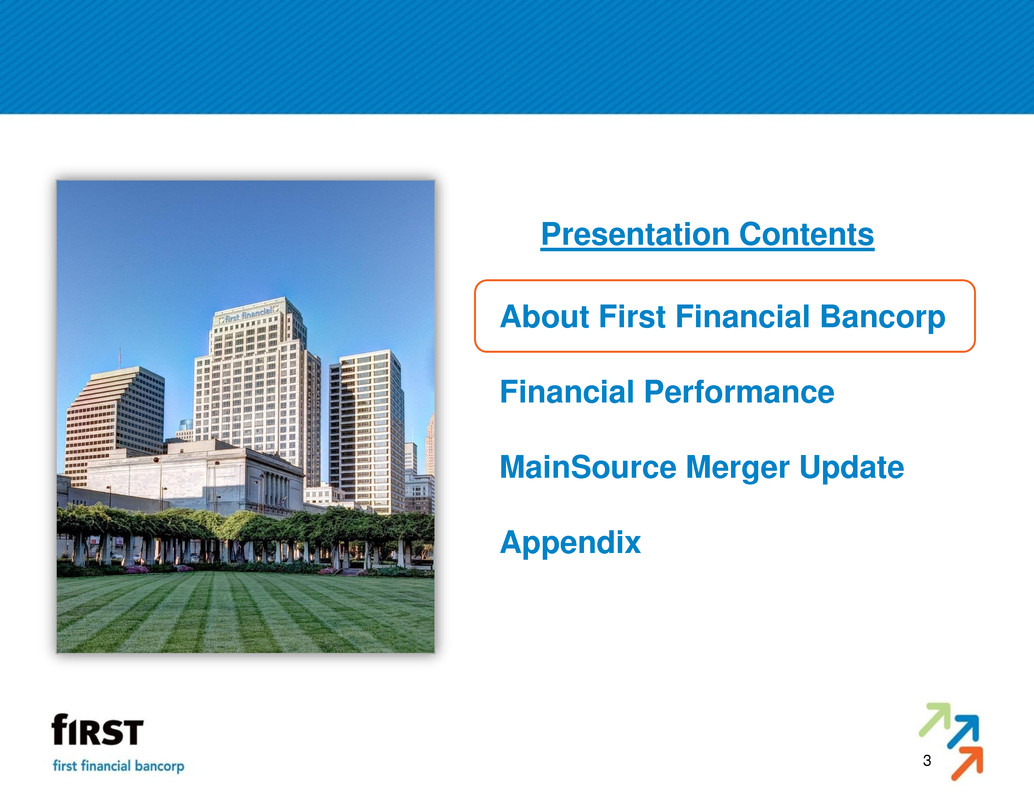
About First Financial Bancorp
Financial Performance
MainSource Merger Update
Appendix
Presentation Contents

4
Company Overview
NASDAQ: FFBC
Overview
Founded: 1863
Headquarters: Cincinnati, Ohio
Banking Centers: 94
Assets: $8.9 billion
Loans: $6.0 billion
Deposits: $6.9 billion
Wealth Mgmt: $2.7 billion AUM
Lines of Business
Commercial / Private Banking
C&I, O-CRE, ABL, Equipment Finance,
Treasury, Wealth Management
Retail Banking
Consumer, Mortgage, Small Business
Investment Commercial Real Estate
Commercial Finance
Quick Service Restaurant,
Insurance Agency Finance
$ in millions except “per share” and where otherwise noted in the presentation
www.bankatfirst.com
$26.35 $26.15 $27.70 $27.45
$28.45
2.58% 2.60% 2.45% 2.48% 2.25%
4Q173Q172Q171Q174Q16
Share Price Dividend Yield
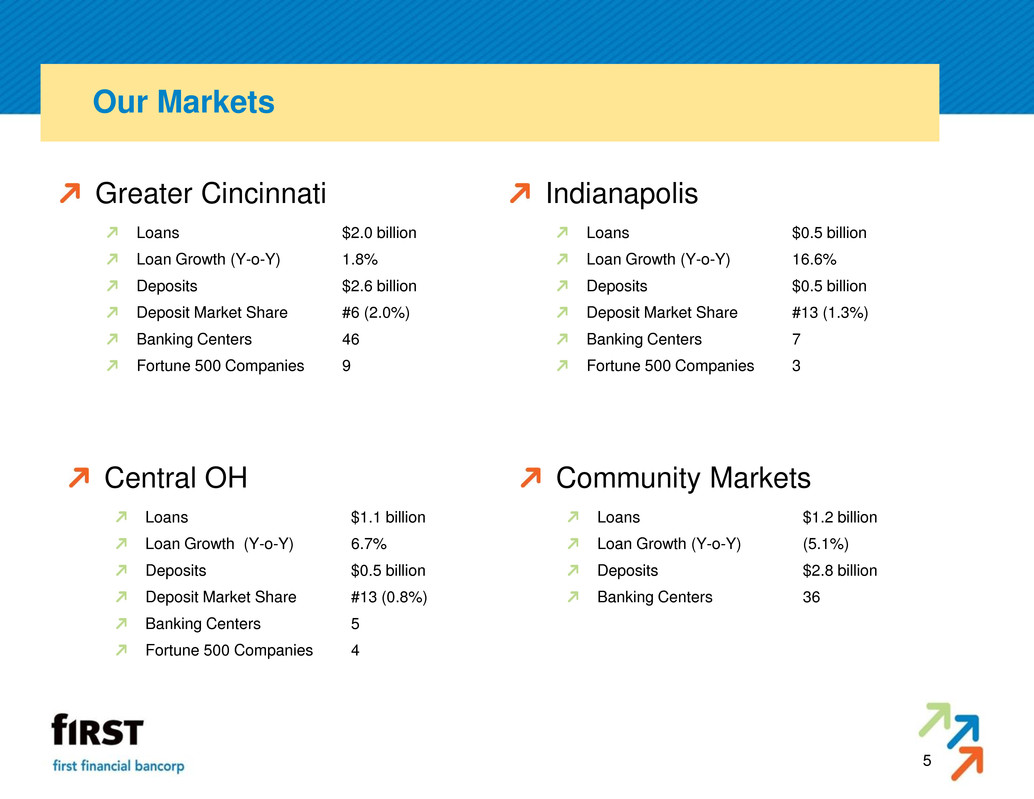
Central OH
Loans $1.1 billion
Loan Growth (Y-o-Y) 6.7%
Deposits $0.5 billion
Deposit Market Share #13 (0.8%)
Banking Centers 5
Fortune 500 Companies 4
5
Our Markets
Indianapolis
Loans $0.5 billion
Loan Growth (Y-o-Y) 16.6%
Deposits $0.5 billion
Deposit Market Share #13 (1.3%)
Banking Centers 7
Fortune 500 Companies 3
Community Markets
Loans $1.2 billion
Loan Growth (Y-o-Y) (5.1%)
Deposits $2.8 billion
Banking Centers 36
Greater Cincinnati
Loans $2.0 billion
Loan Growth (Y-o-Y) 1.8%
Deposits $2.6 billion
Deposit Market Share #6 (2.0%)
Banking Centers 46
Fortune 500 Companies 9

Proven Acquirer
Two FDIC-assisted acquisitions totaling $2.5 billion in assets & generating a $343 million pre-
tax bargain purchase gain (2009)
Two branch acquisitions of 38 offices in Indiana & Ohio (2011)
Three banks in Columbus, Ohio totaling $727 million in assets (2014)
Oak Street Funding, specialty lender focused on the insurance industry, $243 million in assets
(2015)
Pending merger with MainSource Financial Group – close/integration in 1H 2018
Effective Operator
109 consecutive quarters of profitability through 4Q 2017
Replaced the runoff of ~ $2 billion of high yield covered loans
Consolidated 78 banking centers in conjunction with efficiency efforts since 2009
Developed robust enterprise risk management & compliance programs, with board risk
committee since 2010
6
Through the Cycle

Product expansions (since 2009)
Specialty lending (~ $1.2 billion across Franchise, Oak Street, ABL, and Equipment Finance)
Mobile banking & other technology enhancements for clients
Re-entry into mortgage business (2010)
2017 originations of $229 million
Wealth infrastructure improvements
Investment model
Real estate management, tax & insurance outsourcing
Significant technology & infrastructure investments
Continued expansion of risk management & compliance
7
Investments in our Business
Mortgage Origination Platform
Talent & Finance ERP Platform
Enterprise Data Management
Commercial & Consumer CRM

Proven & sustainable business model
Well managed through the cycle
Conservative operating philosophy
Consistent profitability – 109 consecutive quarters
Robust capital management
Prudent steward of shareholders‟ capital
Strong asset quality
Well defined M&A strategy
Selective markets, products & asset diversification
Direct linkage between compensation and performance
Short/long term incentive plans, management stock ownership targets
8
Invest with First Financial

9
1 Includes dividend reinvestment
2 Peer group includes KBW regional bank index peers
3 Based on stock price as of 12/29/2017
4 Based on stock price as of 01/26/2018
Invest with First Financial
Total Shareholder Return1,2
117.5%
55.4%
-4.9%
7.8%
117.5%
50.5%
1.4% 3.9%
148.4%
66.1%
6.6% 7.3%
5 Year 3 Year 1 Year YTD 2018
FFBC KBW Peer Median KBW Peer Top Quartile
3 4 3 3

10
Strategic Priorities
Deliver long term top quartile shareholder returns
Successfully integrate MainSource merger – achieve operational, cultural, & financial
objectives
Deploy capital in an opportunistic & risk-appropriate manner
Invest in innovative solutions that enable our clients to bank with us on their terms
Promote leadership & development within our communities
Proactively develop leadership talent across the organization
Achieve best-in-class compliance & risk management programs
Remain vigilant in our credit philosophy & oversight
Focused growth efforts in metropolitan markets
Maintain process improvement & expense management discipline

11
About First Financial Bancorp
Financial Performance
MainSource Merger Update
Appendix

12
4Q 2017 Highlights – 109th Consecutive Quarter of Profitability
Total assets increased $135.2 million, to $8.9 billion, or 6.1% annualized, compared to the linked quarter.
EOP loans increased $36.1 million, or 2.4% annualized, compared to the linked quarter.
EOP deposits increased $169.0 million, or 10.0% annualized, compared to the linked quarter.
EOP investment securities increased $46.8 million, or 9.2% annualized, compared to the linked quarter.
Balance Sheet
Profitability
Asset Quality
Income Statement
Capital
Noninterest income = $18.4 million.
Noninterest expense = $82.9 million.
Efficiency ratio = 88.2%. Adjusted efficiency ratio = 58.0%2
Effective tax rate of (119.5)%. Adjusted effective tax rate of 30.2%2
Net interest income = $75.6 million, a $5.1 million increase compared to the linked quarter.
Net interest margin of 3.75% on a GAAP basis; 3.82% on a fully tax equivalent basis, a 25 bp increase from the
linked quarter.
Average earning assets grew 4.8% on an annualized basis.
Net income = $24.8 million or $0.40 per diluted share. Adjusted net income = $27.7 million or $0.45 per diluted share2
Return on average assets = 1.13%. Adjusted return on average assets = 1.26%2
Return on average shareholders‟ equity = 10.70%. Adjusted return on average shareholders‟ equity = 11.95%2
Return on average tangible common equity = 13.85%1. Adjusted return on average tangible common equity = 15.46%2
Provision expense = $(0.2) million. Net charge offs = $0.3 million. NCOs / Avg. Loans = 0.02% annualized.
Nonperforming Loans / Total Loans = 0.69%. Nonperforming Assets / Total Assets = 0.50%.
ALLL / Nonaccrual Loans = 224.32%. ALLL / Total Loans = 0.90%. Classified Assets / Total Assets = 0.98%.
Total capital ratio = 13.07%.
Tier 1 capital ratio = 10.63%.
Tangible common equity ratio = 8.30%.
Tangible book value per share = $11.62.
1) See Appendix for non-GAAP reconciliation
2) See Slide 4 for Adjusted Earnings detail.

13
Profitability
Net Income & EPS Return on Average Assets
Return on Tangible Common Equity
All dollars shown in millions, except per share data
$24.8 $24.8
$22.7
$24.4
$23.3
$0.40 $0.40
$0.37
$0.39 $0.38
4Q173Q172Q171Q174Q16
Net Income EPS - diluted
$8,732 $8,717 $8,583 $8,409 $8,360
1.13% 1.13%
1.06%
1.18%
1.11%
4Q173Q172Q171Q174Q16
Average Assets ROAA
$711 $698 $680 $661 $653
13.85% 14.10% 13.42%
14.98%
14.19%
4Q173Q172Q171Q174Q16
Average Tangible Equity ROATCE
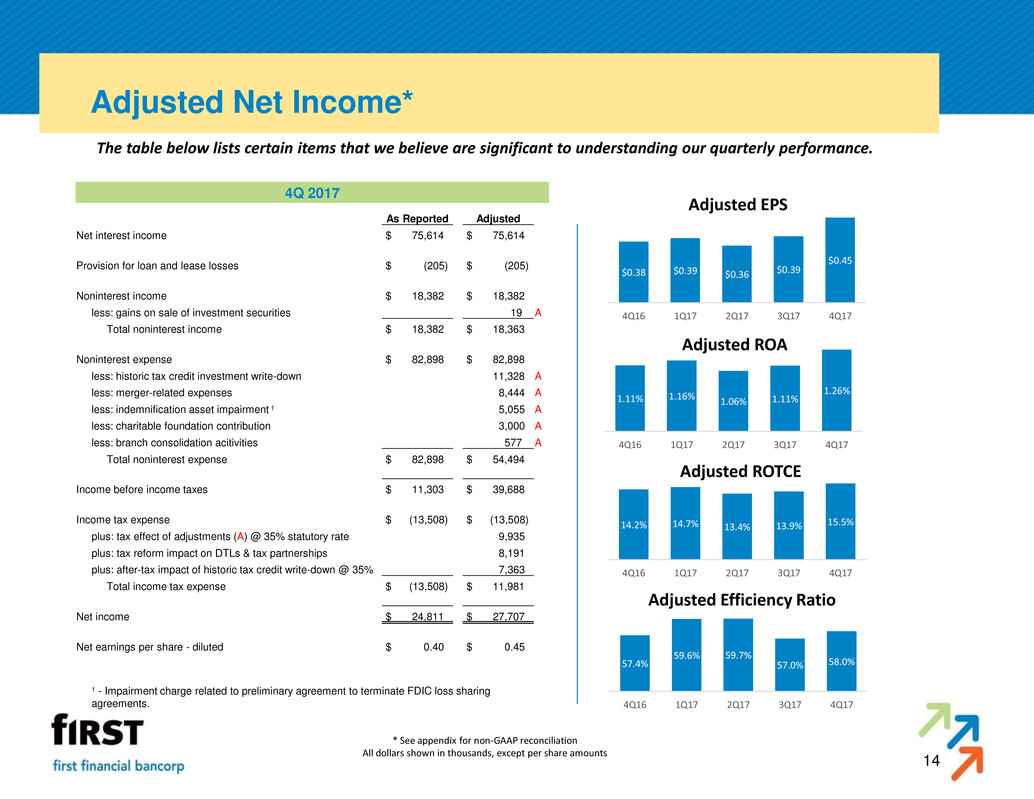
Adjusted Net Income*
* See appendix for non-GAAP reconciliation
All dollars shown in thousands, except per share amounts
The table below lists certain items that we believe are significant to understanding our quarterly performance.
4Q 2017
As Reported Adjusted
Net interest income $ 75,614 $ 75,614
Provision for loan and lease losses $ (205) $ (205)
Noninterest income $ 18,382 $ 18,382
less: gains on sale of investment securities 19 A
Total noninterest income $ 18,382 $ 18,363
Noninterest expense $ 82,898 $ 82,898
less: historic tax credit investment write-down 11,328 A
less: merger-related expenses 8,444 A
less: indemnification asset impairment 1 5,055 A
less: charitable foundation contribution 3,000 A
less: branch consolidation acitivities 577 A
Total noninterest expense $ 82,898 $ 54,494
Income before income taxes $ 11,303 $ 39,688
Income tax expense $ (13,508) $ (13,508)
plus: tax effect of adjustments (A) @ 35% statutory rate 9,935
plus: tax reform impact on DTLs & tax partnerships 8,191
plus: after-tax impact of historic tax credit write-down @ 35% 7,363
Total income tax expense $ (13,508) $ 11,981
Net income $ 24,811 $ 27,707
Net earnings per share - diluted $ 0.40 $ 0.45
1 - Impairment charge related to preliminary agreement to terminate FDIC loss sharing
agreements.
$0.45
$0.39 $0.36 $0.39 $0.38
4Q173Q172Q171Q174Q16
Adjusted EPS
1.26%
1.11% 1.06% 1.16% 1.11%
4Q173Q172Q171Q174Q16
Adjusted ROA
15.5% 13.9% 13.4% 14.7% 14.2%
4Q173Q172Q171Q174Q16
Adjusted ROTCE
58.0% 57.0%
59.7% 59.6%
57.4%
4Q173Q172Q171Q174Q16
Adjusted Efficiency Ratio
14
15
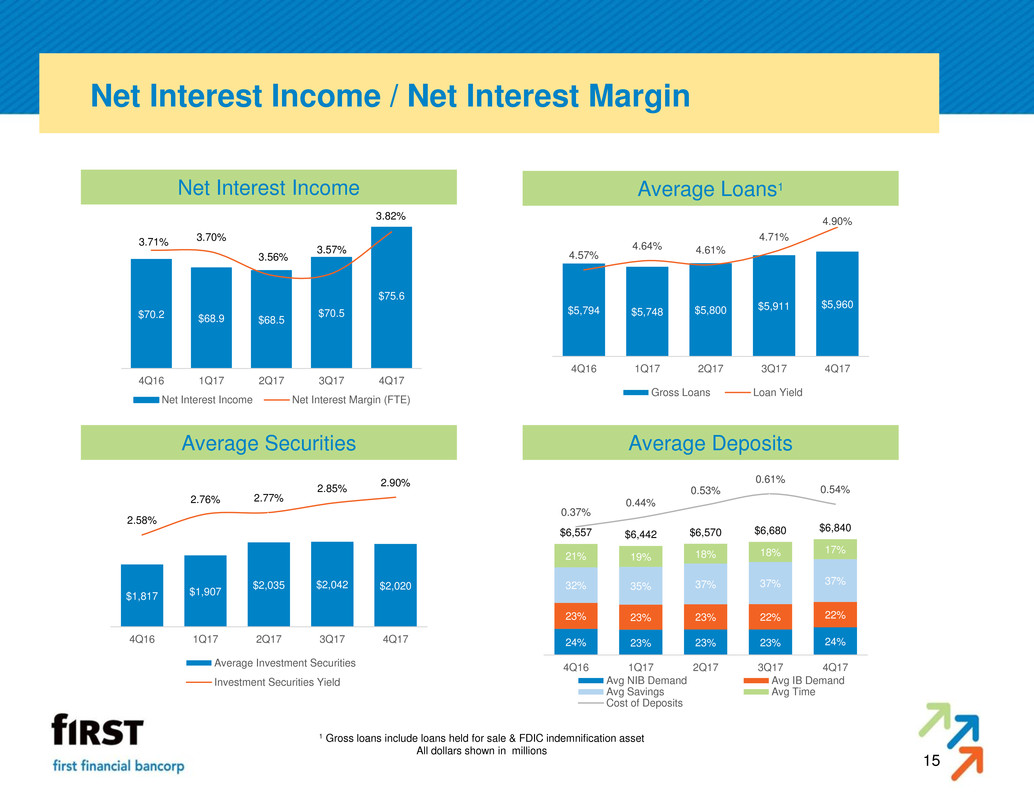
Net Interest Income / Net Interest Margin
1 Gross loans include loans held for sale & FDIC indemnification asset
All dollars shown in millions
Net Interest Income Average Loans1
Average Securities Average Deposits
$75.6
$70.5
$68.5 $68.9
$70.2
3.82%
3.57%
3.56%
3.70% 3.71%
4Q173Q172Q171Q174Q16
Net Interest Income Net Interest Margin (FTE)
$5,960 $5,911 $5,800 $5,748 $5,794
4.90%
4.71%
4.61% 4.64%
4.57%
4Q173Q172Q171Q174Q16
Gross Loans Loan Yield
$2,020 $2,042 $2,035
$1,907 $1,817
2.90%
2.85%
2.77% 2.76%
2.58%
4Q173Q172Q171Q174Q16
Average Investment Securities
Investment Securities Yield
24% 23% 23% 23% 24%
22% 22% 23% 23% 23%
37% 37% 37% 35% 32%
17% 18% 18% 19% 21%
$6,840 $6,680 $6,570 $6,442 $6,557
0.54%
0.61%
0.53%
0.44%
0.37%
4Q173Q172Q171Q174Q16
Avg NIB Demand Avg IB Demand
Avg Savings Avg Time
Cost of Deposits

16
Net Interest Margin
Net Interest Margin (FTE) 4Q17 NIM (FTE) Progression
3.58%
3.43% 3.41%
3.48% 3.48%
0.24%
0.14% 0.15%
0.22% 0.23%
3.82%
3.57% 3.56%
3.70% 3.71%
4Q173Q172Q171Q174Q16
Basic Margin (FTE) Loan Fees
3Q17 3.57%
Earning asset mix 0.05%
Interest recapture 0.02%
Interest recapture from loans previously
classified as nonaccrual
Loan fees 0.10% Predominately loan prepayment fees
Asset Drivers 0.17%
Deposit Cost 0.06%
Impact from deposit pricing strategies
implemented in 3Q17
Funding Mix 0.02%
Favorable mix shift toward lower cost
deposits
Liability Drivers 0.08%
4Q17 3.82%
17
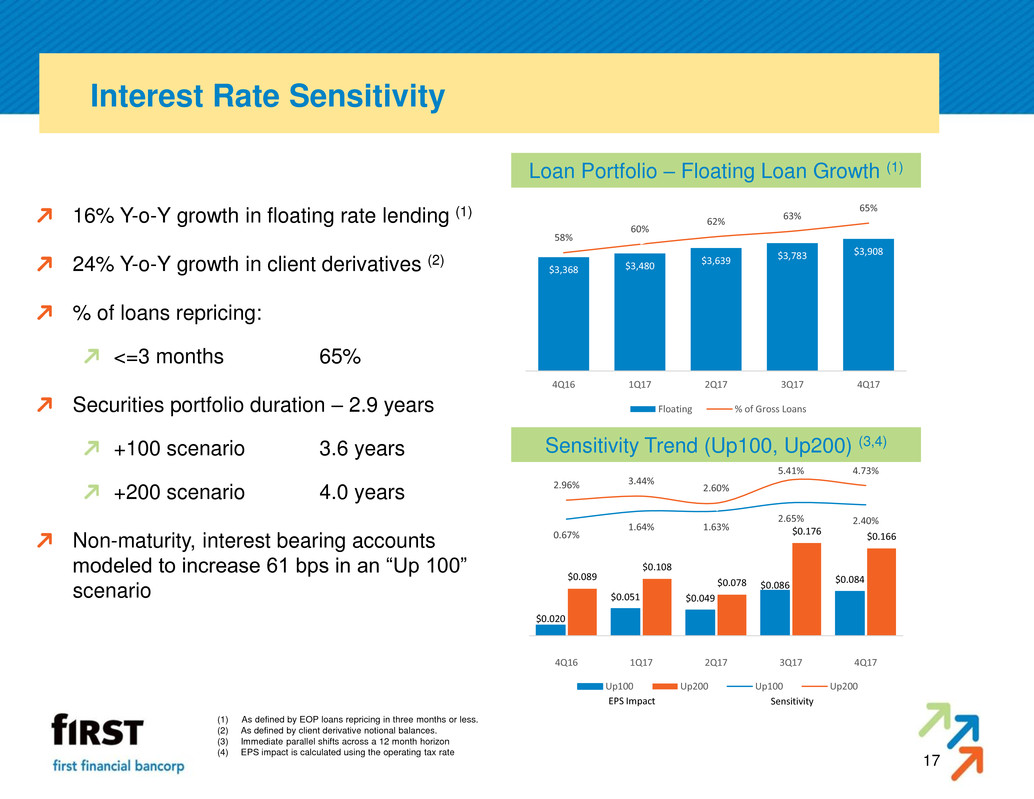
Interest Rate Sensitivity
Loan Portfolio – Floating Loan Growth (1)
Sensitivity Trend (Up100, Up200) (3,4)
16% Y-o-Y growth in floating rate lending (1)
24% Y-o-Y growth in client derivatives (2)
% of loans repricing:
<=3 months 65%
Securities portfolio duration – 2.9 years
+100 scenario 3.6 years
+200 scenario 4.0 years
Non-maturity, interest bearing accounts
modeled to increase 61 bps in an “Up 100”
scenario
(1) As defined by EOP loans repricing in three months or less.
(2) As defined by client derivative notional balances.
(3) Immediate parallel shifts across a 12 month horizon
(4) EPS impact is calculated using the operating tax rate
$3,368 $3,480
$3,639 $3,783
$3,908
58%
60%
62%
63%
65%
4Q16 1Q17 2Q17 3Q17 4Q17
Floating % of Gross Loans
$0.020
$0.051 $0.049
$0.086
$0.084 $0.089
$0.108
$0.078
$0.176
$0.166 0.67%
1.64% 1.63%
2.65% 2.40%
2.96% 3.44% 2.60%
5.41% 4.73%
4Q16 1Q17 2Q17 3Q17 4Q17
Up100 Up200 Up100 Up200
EPS Impact Sensitivity
18
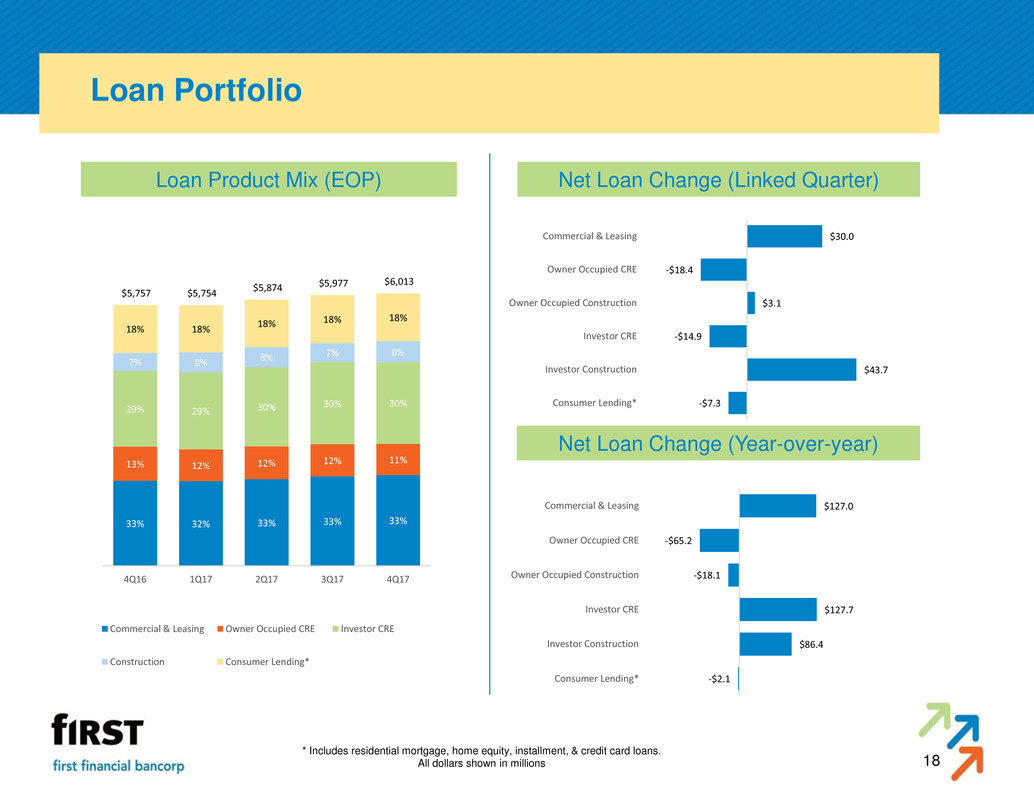
Loan Portfolio
Loan Product Mix (EOP) Net Loan Change (Linked Quarter)
* Includes residential mortgage, home equity, installment, & credit card loans.
All dollars shown in millions
Net Loan Change (Year-over-year)
33% 33% 33% 32% 33%
11% 12% 12% 12% 13%
30% 30% 30% 29% 29%
8% 7% 8%
8% 7%
18% 18% 18%
18% 18%
$6,013 $5,977 $5,874
$5,754 $5,757
4Q173Q172Q171Q174Q16
Commercial & Leasing Owner Occupied CRE Investor CRE
Construction Consumer Lending*
$30.0
-$18.4
$3.1
-$14.9
$43.7
-$7.3
Commercial & Leasing
Owner Occupied CRE
Owner Occupied Construction
Investor CRE
Investor Construction
Consumer Lending*
$127.0
-$65.2
-$18.1
$127.7
$86.4
-$2.1
Commercial & Leasing
Owner Occupied CRE
Owner Occupied Construction
Investor CRE
Investor Construction
Consumer Lending*

19
Loan Portfolio
Loan Portfolio By Geography 1
Average Loan Size & Rate 2
Nationwide Lending Platforms
1 Includes loans held for sale. Excludes purchase accounting loan marks.
2 Average loan balances in $000s, rate represents weighted average coupon & does not
include loan fees
3 Includes Oak Street, Franchise, shared national credits & other loans outside Ohio,
Indiana, & Kentucky.
$437
7%
$533
9%
$5,043
84%
Oak Street
Franchise
All Other Loans
$388 $412
$878
$1,060
$543
$117 $33
4.4% 4.3%
4.2%
5.2%
7.4%
4.0%
4.9%
C&I* OOCRE* ICRE* Franchise Oak Street Mortgage Home
EquityAverage Balance Weighted Average Rate
* Ex.Franchise & OSF
3
$2,818
47%
$1,451
24%
$209
3%
$1,558
26%
Ohio
Indiana
Kentucky
National Business 3

20
Loan Portfolio
C&I Loans By Industry 1 CRE Loans By Collateral 2
1 Industry types included in Other representing greater than 1% of total C&I loans include Agriculture, Retail Trade, Public Administration, Other
Services, Educational Services, Waste Management, Arts, and Transportation.
2 Collateral types included in Other representing greater than 1% of total CRE loans include Student Housing, Farmland, Manufacturing Facility,
Strip Center, Real Estate IUB Other, Recreation Facility, Vacant Land Held for Development, Church/Related, School/Education, and
Convenience Store.
Finance and
Insurance
24%
Accommodation and
Food Services
21%
Manufacturing
12%
Wholesale
Trade
8%
Real Estate and
Rental and Leasing
6%
Construction
4%
Professional,
Scientific, and
Technical Services
4%
Health Care and
Social Assistance
4%
Other
17%
Total C&I Loans: $1.9B
Retail
16%
Residential, Multi
Family 5+
15%
Office
13%
Hotel/Motel
7%
Restaurant
6%
Warehouse
5%
Industrial Facility
5%
Residential, 1-4
Family
4%
Medical Office
3%
Nursing/Assisted
Living
3%
All others
23%
Total CRE Loans: $3.0B

21
Investment Portfolio
Total EOP investments of $2.1 billion
Investment Portfolio / Total Assets = 23.1%
Effective yield = 2.90%
Portfolio duration = 2.9 years
Portfolio Composition Portfolio Quality
Agency, 56%
AAA, 20%
AA-, 4%
BBB, 3%
AA+, 3%
FRB/FHLB Stock, 3%
A+, 2%
AA, 2%
NR, 2%
BBB+, 2%
Other, 3%
Commercial MBS
20%
Asset-backed
Securities
18%
Agency CMOs
18%
Agency Pass-
through Securities
15%
Municipal
Securities
10% Non-Agency Pass-
through Securities
7%
Non-Agency CMOs
4%
Corporate
Securities
3%
Regulatory Stock
3% U.S. Government
Agency Debt
1%
Other
1%
U.S. Government
Debt
0%

22
Asset Quality
Nonperforming Assets / Total Assets Classified Assets / Total Assets
Allowance / Total Loans Net Charge Offs & Provision Expense
All dollars shown in millions
$87.3
$94.3
$98.4
$114.6
$125.2
0.98%
1.08% 1.13%
1.34%
1.48%
4Q173Q172Q171Q174Q16
Classified Assets Classified Assets / Total Assets
$44.4
$52.9
$62.7
$68.4
$54.3
0.50%
0.60%
0.72%
0.80%
0.64%
4Q173Q172Q171Q174Q16
NPAs NPAs / Total Assets
$54.0 $54.5 $54.9 $56.3 $58.0
0.90% 0.91% 0.93%
0.98% 1.01%
4Q173Q172Q171Q174Q16
Allowance for Loan Losses ALLL / Total Loans
$0.3
$3.3 $1.9 $2.0 $2.4
-$0.2
$3.0
$0.5 $0.4
$2.8
0.02%
0.22%
0.13% 0.14% 0.17%
4Q173Q172Q171Q174Q16
NCOs Provision Expense

23
Capital
Tier 1 Common Equity
Tangible Book Value Total Capital
Tangible Common Equity
All capital numbers are considered preliminary
All dollars shown in millions
$721.3
$705.2
$688.1
$669.7
$654.6
$11.62 $11.36
$11.07
$10.78
$10.56
4Q173Q172Q171Q174Q16
Tangible Book Value Tangible Book Value per Share
$721.3
$705.2
$688.1
$669.7
$654.6
8.30% 8.25% 8.09% 8.05% 7.96%
4Q173Q172Q171Q174Q16
Tangible Book Value Tangible Common Ratio
$929.1 $920.6 $905.2 $892.2 $881.2
13.07% 12.98% 13.05% 13.19% 13.10%
12.50%
4Q173Q172Q171Q174Q16
Total Capital Total Capital Ratio Target
$755.7
$746.7
$731.0 $716.7
$703.9
10.63% 10.53% 10.54% 10.59% 10.46%
10.50%
4Q173Q172Q171Q174Q16
Tier 1 Common Equity Tier 1 Common Ratio Target

Outlook
Taxes
Full year 2018 loan growth expected to be in the mid-single digits on a
percentage basis
1Q18 NIM (FTE) projected to be 3.70% – 3.75%
Includes lower FTE adjustment due to tax reform
1Q18 loan fees likely to approximate 2Q17 & 3Q17 levels
1Q18 interest income will reflect 2 fewer days vs. 4Q17
Asset sensitive balance sheet, realization dependent on loan & deposit competition
Noninterest expense base of approximately $51 million near-term,
excluding one time expenses
4Q17 noninterest expense includes approximately $4 million related to higher
incentive compensation and performance based 401(k) contribution
Noninterest
Expense
Net Interest Margin
Balance Sheet
Preliminary full year 2018 effective tax rate of approximately 21%
Will continue to refine as tax reform guidance becomes available
4Q17 adjusted earnings1 included $1.1 million net, after-tax benefit from historic
tax credit investment realized during the period
Credit
Stable credit outlook
Loan losses expected to revert to historical levels over time
1 See slide 4 for further detail.
24

25
About First Financial Bancorp
Financial Performance
MainSource Merger Update
Appendix

Complementary Midwest Footprint
1) All branches located in Northwest Indiana and within the Chicago MSA
Note: Deposit market share data shown pro forma as of 6/30/16
Source: SNL Financial
Deposit Concentration By State OH,
56%
IN, 41%
KY, 3%
FFBC Pro Forma
Dollars in Millions
Top 10 Pro Forma Markets
MSA Rank Branches Deposits
Cincinnati, OH 4 60 $2,884
Indianapolis, IN 13 18 789
Northwest IN ¹ 37 11 781
Louisvil le, KY 9 18 690
Columbus, IN 1 10 671
Dayton, OH 7 10 464
Columbus, OH 15 6 459
Greensburg, IN 1 5 345
Celina, OH 2 4 299
Bloomington, IN 3 3 290
Cincinnati, OH Indianapolis, IN
FFBC (102)
MSFG (101)
Columbus, IN
OH,
42%
IN, 49%
KY,
7%
IL, 1%
26
Transaction Summary
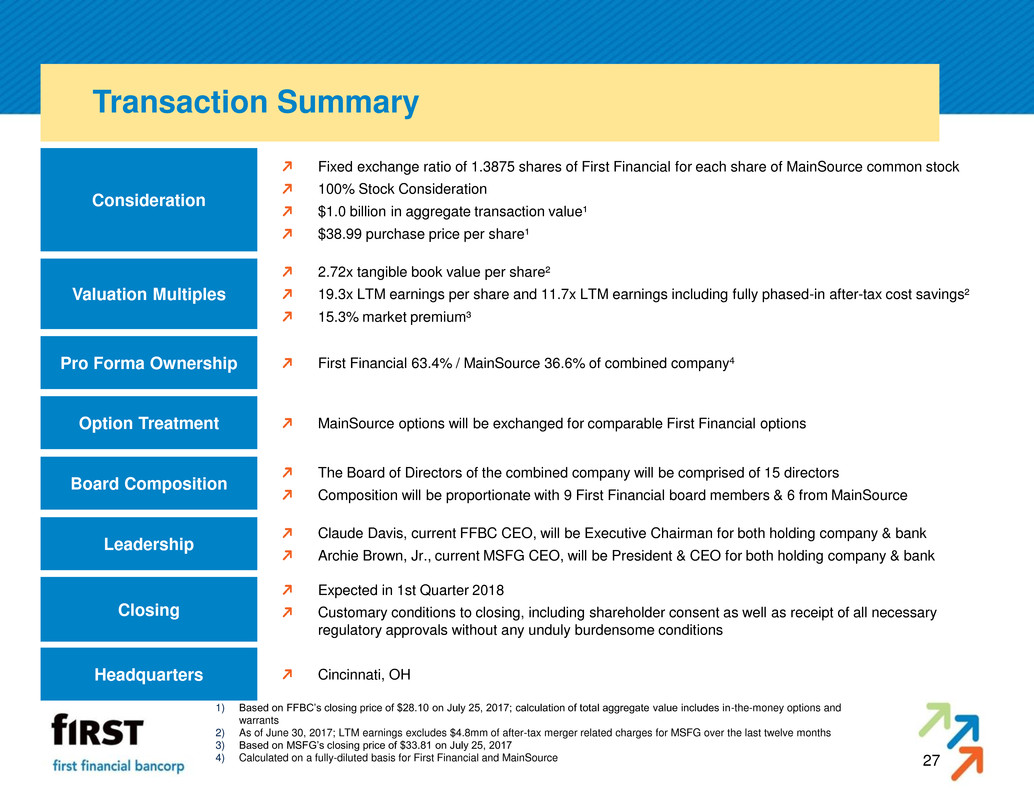
Fixed exchange ratio of 1.3875 shares of First Financial for each share of MainSource common stock
100% Stock Consideration
$1.0 billion in aggregate transaction value¹
$38.99 purchase price per share¹
MainSource options will be exchanged for comparable First Financial options
First Financial 63.4% / MainSource 36.6% of combined company4
The Board of Directors of the combined company will be comprised of 15 directors
Composition will be proportionate with 9 First Financial board members & 6 from MainSource
Claude Davis, current FFBC CEO, will be Executive Chairman for both holding company & bank
Archie Brown, Jr., current MSFG CEO, will be President & CEO for both holding company & bank
Expected in 1st Quarter 2018
Customary conditions to closing, including shareholder consent as well as receipt of all necessary
regulatory approvals without any unduly burdensome conditions
Consideration
Option Treatment
Pro Forma Ownership
Board Composition
Leadership
Closing
1) Based on FFBC‟s closing price of $28.10 on July 25, 2017; calculation of total aggregate value includes in-the-money options and
warrants
2) As of June 30, 2017; LTM earnings excludes $4.8mm of after-tax merger related charges for MSFG over the last twelve months
3) Based on MSFG‟s closing price of $33.81 on July 25, 2017
4) Calculated on a fully-diluted basis for First Financial and MainSource
Headquarters Cincinnati, OH
Valuation Multiples
2.72x tangible book value per share²
19.3x LTM earnings per share and 11.7x LTM earnings including fully phased-in after-tax cost savings²
15.3% market premium³
27

Financial Impact & Assumptions
Estimated $48 million; ~40% of MSFG‟s total noninterest expense base (~14.5% on a combined basis)5
~40% of cost saves from consolidation of 45 – 50 banking centers
~75% of cost saves realized in first year post-close, 100% thereafter
Gross credit mark on MSFG‟s loan portfolio of 1.00% or $31.9 million (net credit mark of 0.2%)
Including MSFG‟s mark on PCI loans the gross transaction credit mark is $37.1 million, or 1.16%
Cost Savings
One-Time Expenses
EPS Accretion
TBV Value Impact
Internal Rate of Return
6.4% in 2018 excl. transaction expenses, 11.1% in 2019 (first full year)
5.4% TBV dilution¹, earnback of 2.75 years using crossover method², 3.15 years using simple method³
18% IRR, above internal targets
Credit Mark
Total restructuring costs of ~$63 million5
1) See Appendix for non-GAAP reconciliation
2) Based on when pro forma tangible book value per share crosses over and begins to exceed projected standalone FFBC tangible book value
per share
3) Based on dilution to tangible book value per share at close divided by earnings per share accretion in 2019
4) All dollar amounts shown pre-tax except reduction in Fed dividend payments
5) Estimated cost savings and restructuring charges may be refined as the companies work through integration planning
$12 million combined annual interchange fee revenue loss due to Durbin
Phase in – 50% in 2019, 100% thereafter
$2 million additional annual expenses from heightened regulatory / compliance costs
Phase in – 50% in 2018, 100% thereafter
$500 thousand reduction in dividend payments on Federal Reserve Bank capital stock due to FAST Act
Phase in – 50% in 2018, 100% thereafter
$46.0 million CDI created (1.5% of core deposits), amortized over 9 years using sum of years digits
$5.1 million write-down on MSFG‟s TruPS, amortized through earnings over 16.3 years
$4.5 million write-down on MSFG‟s CDs & FHLB advances, amortized through earnings over 5.25 years
Regulatory
Adjustments4
Other Purchase
Accounting
Adjustments
28
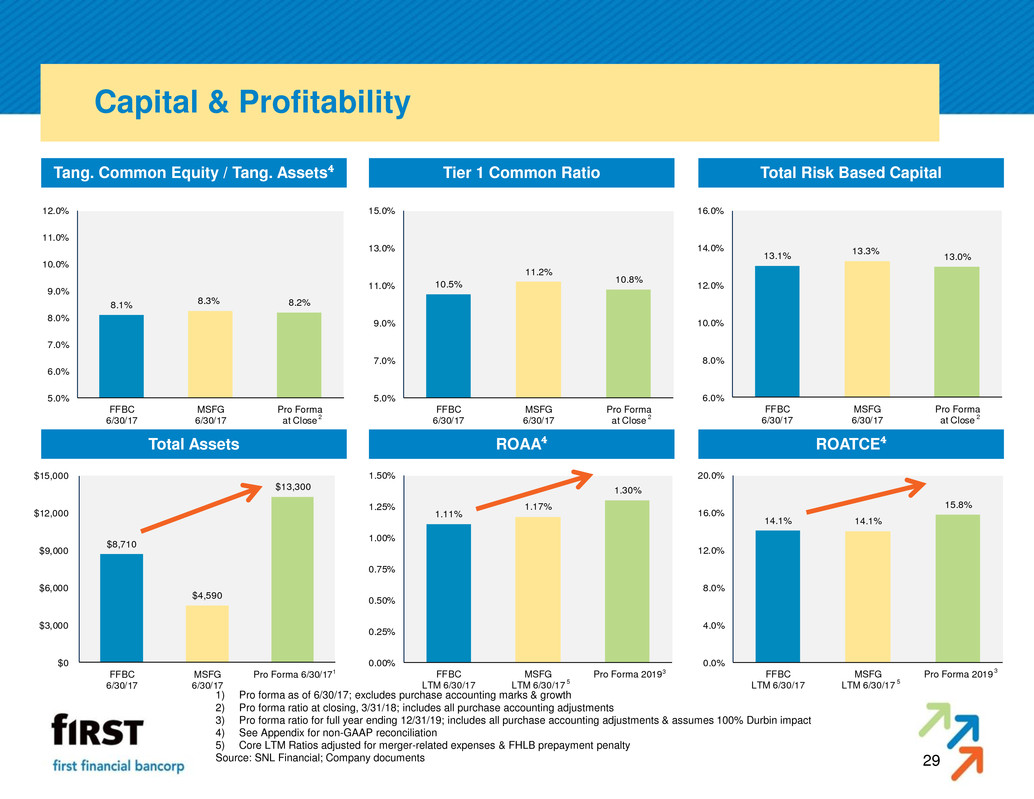
14.1% 14.1%
15.8%
0.0%
4.0%
8.0%
12.0%
16.0%
20.0%
FFBC
LTM 6/30/17
MSFG
LTM 6/30/17
Pro Forma 2019
1.1 %
1.17%
1.30%
0.00%
0.25%
0.50%
0.75%
1.00%
1.25%
1.50%
FFBC
LTM 6/30/17
MSFG
LTM 6/30/17
Pro Forma 2019
Capital & Profitability
Total Assets
Total Risk Based Capital
ROAA⁴ ROATCE⁴
Tang. Common Equity / Tang. Assets⁴
8.1% 8.3% 8.2%
5.0%
6.0%
7.0%
8.0%
9.0%
10.0%
11.0%
12.0%
FFBC
6/3 /17
MSFG
6/30/17
Pro Forma
at Close
Tier 1 Common Ratio
10.5%
11.2%
10.8%
5.0%
7.
9.0%
11.0%
13.0%
15.0%
FFBC
6/30/17
MSFG
6/30/17
Pro Forma
at Close
1) Pro forma as of 6/30/17; excludes purchase accounting marks & growth
2) Pro forma ratio at closing, 3/31/18; includes all purchase accounting adjustments
3) Pro forma ratio for full year ending 12/31/19; includes all purchase accounting adjustments & assumes 100% Durbin impact
4) See Appendix for non-GAAP reconciliation
5) Core LTM Ratios adjusted for merger-related expenses & FHLB prepayment penalty
Source: SNL Financial; Company documents
13.1%
13.3%
13.0%
6.0%
8.0%
10.0%
12.0%
14.0%
16.0%
FFBC
6/30 17
MSFG
6/30/17
Pro Forma
at Close
$8,710
$4,590
$13,300
$0
$3,000
$6,000
$9,000
$12,000
$15,000
FFBC
6/30/17
MSFG
6/30/17
Pro Forma 6/30/17
5 5
29
2
3 3 1
2 2
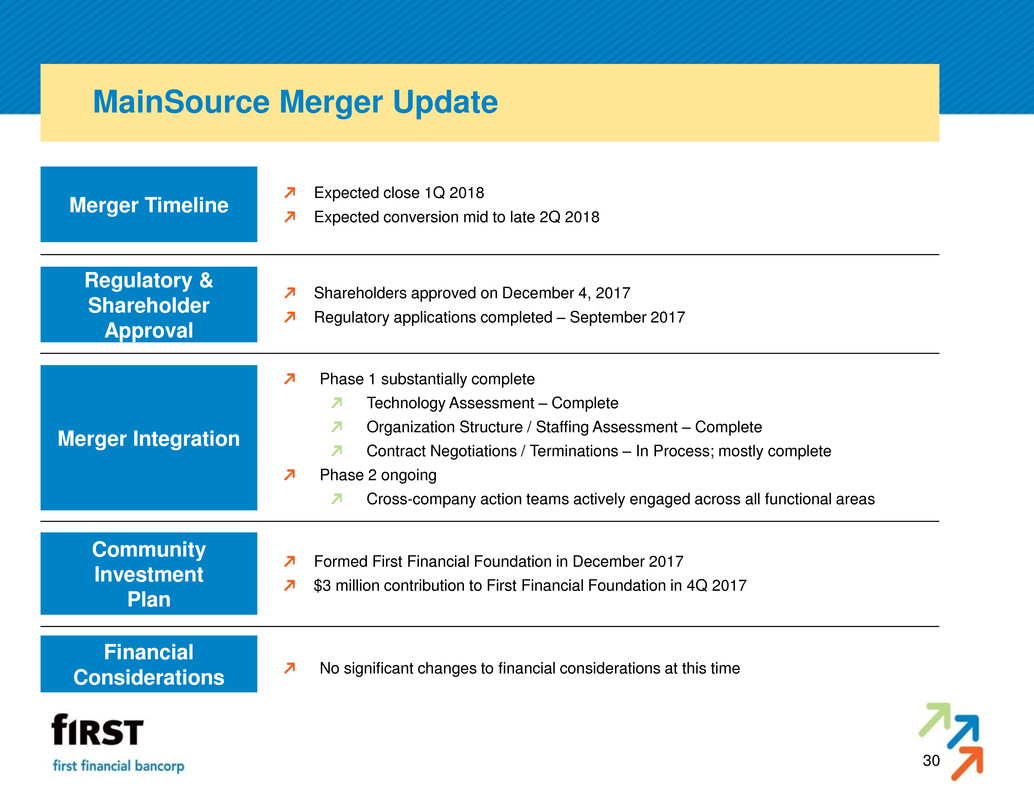
MainSource Merger Update
Regulatory &
Shareholder
Approval
Merger Integration
Financial
Considerations
Shareholders approved on December 4, 2017
Regulatory applications completed – September 2017
Phase 1 substantially complete
Technology Assessment – Complete
Organization Structure / Staffing Assessment – Complete
Contract Negotiations / Terminations – In Process; mostly complete
Phase 2 ongoing
Cross-company action teams actively engaged across all functional areas
Formed First Financial Foundation in December 2017
$3 million contribution to First Financial Foundation in 4Q 2017
Community
Investment
Plan
No significant changes to financial considerations at this time
Merger Timeline
Expected close 1Q 2018
Expected conversion mid to late 2Q 2018
30

Branch Divestiture
Letter of Agreement with United States Department of Justice to divest five
branch locations to resolve competitive concerns
Includes $125 million in loans, $160mm in deposits and all personal
property associated with the branches
4 MainSource Bank branch locations in Columbus, Indiana
529 Washington Street, Columbus, IN 47201
803 Washington Street, Columbus, IN 47201 (Drive-thru)
1901 25th Street, Columbus, IN 47201
2310 W Jonathan Moore Pike, Columbus, IN 47202
1 MainSource Bank branch location in Greensburg, Indiana
304 E 10th Street, Greensburg, IN 47240
Expected to consummate within 180 days following completion of the
merger
31

MSFG 4Q 2017 Highlights
Profitability
Net Interest Income
&
Net Interest Margin
Income Statement
Balance Sheet
Asset Quality
Capital
Net income = $16.6 million, or $14.4 million excluding non-operating items(1)
EPS = $0.64 per diluted share, or $0.55 per diluted share excluding non-operating items(1)
Return on average assets = 1.43%, or 1.24% excluding non-operating items(1)
Return on average shareholders’ equity = 12.5%, or 10.9% excluding non-operating items(1)
Return on average tangible common equity = 17.5%, or 15.2% excluding non-operating items(1)
Net interest income = $37.7 million, a $0.3 million increase compared to the linked quarter
Net interest margin of 3.78% on a fully tax equivalent basis
Purchase accounting marks added nineteen (19) basis points to the net interest margin
Noninterest income = $13.8 million
Noninterest expense = $31.7 million, or $31.3 million excluding non-operating expenses(1)
Efficiency ratio = 59.2%, or 58.5% excluding non-operating items(1)
Effective tax rate of 13.6%, 26.7% excluding the effect of tax reform
EOP loans increased $15 million on a linked quarter basis, or 2% annualized growth
Provision expense = $550K. Net charge offs = $550K. NCOs / Avg. Loans = 0.07% annualized
Nonperforming Assets (w/TDRs) / Total Assets = 0.45%
ALLL / Nonperforming Loans = 139.5%. ALLL / Total Loans = 0.74%
Total capital ratio = 13.6%
Tier 1 capital ratio = 12.9%
Tangible common equity ratio = 8.5%
Tangible book value per common share = $14.93
(1) Non-operating items include $0.3 million in merger-related expenses, net of tax and a $2.5 million income tax benefit due to tax reform. 32

33
About First Financial Bancorp
Financial Performance
MainSource Merger Update
Appendix

34
Appendix: Non-GAAP to GAAP Reconciliation
Net interest income and net interest margin - fully tax equivalent
Dec. 31, Sep. 30, June 30, Mar. 31, Dec. 31, Dec. 31, Dec. 31,
2017 2017 2017 2017 2016 2017 2016
Net interest income 75,614$ 70,479$ 68,520$ 68,932$ 70,166$ 283,545$ 272,671$
Tax equivalent adjustment 1,387 1,353 1,294 1,225 1,077 5,259 4,215
Net interest income - tax equivalent 77,001$ 71,832$ 69,814$ 70,157$ 71,243$ 288,804$ 276,886$
Average earning assets 8,005,100$ 7,989,969$ 7,855,564$ 7,695,717$ 7,630,148$ 7,887,718$ 7,524,233$
Net interest margin* 3.75 % 3.50 % 3.50 % 3.63 % 3.66 % 3.59 % 3.62 %
Net interest margin (fully tax equivalent)* 3.82 % 3.57 % 3.56 % 3.70 % 3.71 % 3.66 % 3.68 %
Three months ended YTD
* Margins are calculated using net interest income annualized divided by average earning assets.
The earnings press release and accompanying presentation include certain non-GAAP ratios, such as net interest income-tax equivalent. The tax
equivalent adjustment to net interest income recognizes the income tax savings when comparing taxable and tax-exempt assets and assumes a
35% tax rate. Management believes that it is a standard practice in the banking industry to present net interest margin and net interest income on
a fully tax equivalent basis. Therefore, management believes these measures provide useful information to investors by allowing them to make peer
comparisons. Management also uses these measures to make peer comparisons.

35
Appendix: Non-GAAP to GAAP Reconciliation
Additional non-GAAP ratios
Dec. 31, Sep. 30, June 30, Mar. 31, Dec. 31, Dec. 31, Dec. 31,
(Dollars in thousands, except per share data) 2017 2017 2017 2017 2016 2017 2016
Net income (a) 24,811$ 24,826$ 22,736$ 24,414$ 23,294$ 96,787$ 88,526$
Average total shareholders' equity 920,194 908,057 889,604 871,215 863,509 897,431 844,784
Less:
Goodw ill and other intangibles (209,379) (209,730) (210,045) (210,324) (210,625) (209,379) (210,625)
Average tangible equity (b) 710,815 698,327 679,559 660,891 652,884 688,052 634,159
Total shareholders' equity 930,664 914,954 898,117 880,065 865,224 930,664 865,224
Less:
Goodw ill and other intangibles (209,379) (209,730) (210,045) (210,324) (210,625) (209,379) (210,625)
Ending tangible equity (c) 721,285 705,224 688,072 669,741 654,599 721,285 654,599
Total assets 8,896,923 8,761,689 8,710,042 8,531,170 8,437,967 8,896,923 8,437,967
Less:
Goodw ill and other intangibles (209,379) (209,730) (210,045) (210,324) (210,625) (209,379) (210,625)
Ending tangible assets (d) 8,687,544 8,551,959 8,499,997 8,320,846 8,227,342 8,687,544 8,227,342
Risk-w eighted assets (e) 7,134,085 7,090,714 6,936,665 6,765,336 6,728,737 7,134,085 6,728,737
Total average assets 8,731,956 8,716,917 8,582,961 8,409,071 8,359,912 8,611,403 8,251,703
Less:
Goodw ill and other intangibles (209,379) (209,730) (210,045) (210,324) (210,625) (209,379) (210,625)
Average tangible assets (f) 8,522,577$ 8,507,187$ 8,372,916$ 8,198,747$ 8,149,287$ 8,402,024$ 8,041,078$
Ending shares outstanding (g) 62,069,087 62,061,465 62,141,071 62,134,285 61,979,552 62,069,087 61,979,552
Ratios
Return on average tangible shareholders' equity (a)/(b) 13.85% 14.10% 13.42% 14.98% 14.19% 14.07% 13.96%
Ending tangible equity as a percent of:
Ending tangible assets (c)/(d) 8.30% 8.25% 8.09% 8.05% 7.96% 8.30% 7.96%
Risk-w eighted assets (c)/(e) 10.11% 9.95% 9.92% 9.90% 9.73% 10.11% 9.73%
Average tangible equity as a percent of average tangible assets (b)/(f) 8.34% 8.21% 8.12% 8.06% 8.01% 8.19% 7.89%
Tangible book value per share (c)/(g) 11.62$ 11.36$ 11.07$ 10.78$ 10.56$ 11.62$ 10.56$
Three months ended YTD
The earnings press release and accompanying presentation include certain non-GAAP ratios. These ratios include: (1) Return on average tangible shareholders' equity; (2) Ending
tangible shareholders' equity as a percent of ending tangible assets; (3) Ending tangible shareholders' equity as a percent of risk-w eighted assets; (4) Average tangible shareholders'
equity as a percent of average tangible assets; and (5) Tangible book value per share. The Company considers these critical metrics w ith w hich to analyze banks. The ratios have
been included in the earnings press release to facilitate a better understanding of the Company's capital structure and f inancial condition.

36
Appendix: Non-GAAP to GAAP Reconciliation
Additional non-GAAP ratios
As Reported Adjusted As Reported Adjusted As Reported Adjusted As Reported Adjusted As Reported Adjusted
Net interest income (f) 75,614$ 75,614$ 70,479$ 70,479$ 68,520$ 68,520$ 68,932$ 68,932$ 70,166$ 70,166$
Provision for loan and lease losses (205) (205) 2,953 2,953 467 467 367 367 2,761 2,761
plus: provision expense adjustment 799
Noninterest income 18,382 18,382 22,942 22,942 17,454 17,454 17,364 17,364 16,946 16,946
less: gains from the redemption of off balance sheet securitizations 5,764
less: tax related adjustment to a limited partnership investment (119)
less: gains on sale of investment securities 19 275 838 516
Total noninterest income (g) 18,382 18,363 22,942 16,903 17,454 16,735 17,364 16,848 16,946 16,946
Noninterest expense 82,898 82,898 54,443 54,443 51,556 51,556 51,045 51,045 50,163 50,163
less: severance expense 3,818 533
less: charter conversion expenses 86
less: historic tax credit investment write-down 11,328
less: merger-related expenses 8,444 800
less: indemnification asset impairment 1 5,055
less: charitable foundation contribution 3,000
less: branch consolidation acitivities 577 154 (92)
Total noninterest expense (e) 82,898 54,494 54,443 49,825 51,556 50,869 51,045 51,137 50,163 50,077
Income before income taxes (i) 11,303 39,688 36,025 35,403 33,951 33,919 34,884 34,276 34,188 34,274
Income tax expense (13,508) (13,508) 11,199 11,199 11,215 11,215 10,470 10,470 10,894 10,894
plus: tax effect of adjustments 9,935 (178) (11) (213) 31
plus: tax reform impact on DTLs & tax partnerships 8,191
plus: after-tax impact of historic tax credit write-down @ 35% 7,363 -
Total income tax expense (h) (13,508) 11,981 11,199 11,021 11,215 11,204 10,470 10,257 10,894 10,925
Net income (a) 24,811$ 27,707$ 24,826$ 24,382$ 22,736$ 22,715$ 24,414$ 24,019$ 23,294$ 23,349$
Average diluted shares (b) 62,132 62,132 62,190 62,190 62,234 62,234 62,140 62,140 62,081 62,081
Average assets (c) 8,731,956 8,731,956 8,716,917 8,716,917 8,582,961 8,582,961 8,409,071 8,409,071 8,359,912 8,359,912
Average shareholders' equity 920,194 920,194 908,057 908,057 889,604 889,604 871,215 871,215 863,509 863,509
Less:
Goodwill and other intangibles (209,379) (209,379) (209,730) (209,730) (210,045) (210,045) (210,324) (210,324) (210,625) (210,625)
Average tangible equity (d) 710,815 710,815 698,327 698,327 679,559 679,559 660,891 660,891 652,884 652,884
1 - Impairment charge related to preliminary agreement to terminate FDIC loss sharing agreements.
Ratios
Net earnings per share - diluted (a)/(b) 0.40$ 0.45$ 0.40$ 0.39$ 0.37$ 0.37$ 0.39$ 0.40$ 0.38$ 0.39$
Return on average assets - (a)/(c) 1.13% 1.26% 1.13% 1.11% 1.06% 1.06% 1.18% 1.16% 1.11% 1.11%
Return on average tangible shareholders' equity - (a)/(d) 13.85% 15.46% 14.10% 13.85% 13.42% 13.41% 14.98% 14.74% 14.19% 14.23%
Efficiency ratio - (e)/((f)+(g)) 88.19% 57.99% 58.28% 57.02% 59.97% 59.67% 59.15% 59.61% 57.58% 57.49%
Effective tax rate - (h)/(i) -119.5% 30.2% 31.1% 31.1% 33.0% 33.0% 30.0% 29.9% 31.9% 31.9%
(Dollars in thousands, except per share data)
4Q164Q17 3Q17 2Q17 1Q17
37
