Attached files
| file | filename |
|---|---|
| 8-K - FORM 8-K - MID AMERICA APARTMENT COMMUNITIES INC. | tv485191_8k.htm |
Exhibit 99.1

CAPITAL MARKETS UPDATE FEBRUARY 2018 ATLANTA / BUCKHEAD PHOENIX / TEMPE DALLAS / FRISCO

CAPITAL MARKETS UPDATE 2 FORWARD LOOKING STATEMENTS This presentation contains forward - looking statements within the meaning of Section 27 A of the Securities Act of 1933 , as amended, as Section 21 E of the Securities Exchange Act of 1934 , as amended . These forward - looking statements, which are based on current expectations, estimates and projections about the industry and markets in which MAA operates and beliefs of and assumptions made by MAA management, involve uncertainties that could significantly affect the financial results of MAA . Words such as “expects,” “anticipates,” “intends,” “plans,” “believes,” “seeks,” “estimates,” and variations of such words and similar expressions are intended to identify such forward - looking statements, which are not historical in nature . In this presentation, forward - looking statements include, but are not limited to, statements about forecasted 2018 operating results, expected benefits and synergies from the merger with Post Properties, Inc . and the timing of those benefits and synergies, the anticipated value of current development projects, estimated costs of property development, the anticipated timing of completion of current development projects and the stabilization of such projects, MAA’s future development projects, the anticipated scope of MAA’s future redevelopment activities and projected incremental rent growth, and other information that is not historical . All statements that address operating performance, events or developments that MAA anticipates or expects will occur in the future are forward - looking statements . These statements are not guarantees of future performance and involve certain risks, uncertainties and assumptions that are difficult to predict . Although MAA believes the expectations reflected in any forward - looking statements are based on reasonable assumptions, MAA can give no assurance that its expectations will be achieved, and therefore actual outcomes and results may differ materially from what is expressed or forecasted in such forward - looking statements . Some of the factors that may affect outcomes and results include, but are not limited to : inability to generate sufficient cash flows due to market conditions, changes in supply and/or demand, competition, uninsured losses, changes in tax and housing laws, or other factors ; exposure as a multifamily - focused REIT to risks inherent in investments in a single industry and sector ; adverse changes in real estate markets ; failure of new acquisitions to achieve anticipated results or be efficiently integrated ; failure of development communities to be completed, if at all, within budget and on a timely basis or to lease - up as anticipated ; unexpected capital needs ; changes in operating costs, including real estate taxes, utilities and insurance costs ; losses from catastrophes in excess of our insurance coverage ; level and volatility of interest or capitalization rates or capital market conditions ; the effect of any rating agency actions ; inability to attract and retain qualified personnel ; cyberliability or potential liability for breaches of our privacy or information security systems ; adverse legislative or regulatory tax changes ; litigation and compliance costs associated with laws requiring access for disabled persons ; risks associated with the Post Properties, Inc . merger, including the integration of MAA’s and Post Properties, Inc . ’s businesses and achieving expected revenue synergies and/or cost savings as a result of the merger ; risks associated with unexpected costs or unexpected liabilities that may arise from the Post Properties, Inc . merger ; and those additional risks and factors discussed in reports filed with the Securities and Exchange Commission by MAA from time to time, including those discussed under the heading “Risk Factors” in its most recently filed Annual Report on Form 10 - K and Quarterly Reports on Form 10 - Q . MAA undertakes no duty to update any forward - looking statements appearing in this presentation . REGULATION G This presentation contains certain non - GAAP financial measures within the meaning of the Securities Exchange Act of 1934 , as amended . MAA’s definitions of these non - GAAP financial measures, among other terms, and reconciliations to the most directly comparable GAAP measures, can be found in the accompanying Appendix and under the “Financial Results” navigation tab on the “For Investors” page of MAA’s website at www . maac . com .
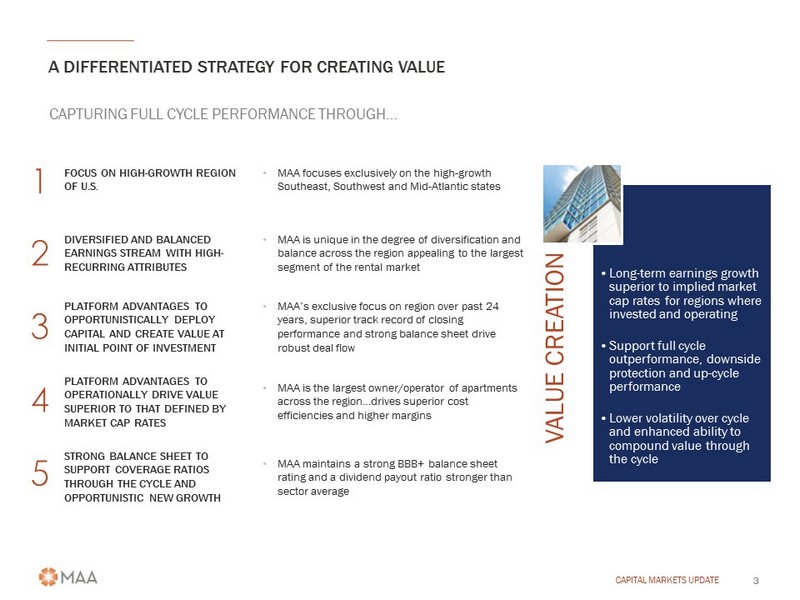
A DIFFERENTIATED STRATEGY FOR CREATING VALUE CAPITAL MARKETS UPDATE 3 CAPTURING FULL CYCLE PERFORMANCE THROUGH… FOCUS ON HIGH - GROWTH REGION OF U.S. • MAA focuses exclusively on the high - growth Southeast, Southwest and Mid - Atlantic states DIVERSIFIED AND BALANCED EARNINGS STREAM WITH HIGH - RECURRING ATTRIBUTES • MAA is unique in the degree of diversification and balance across the region appealing to the largest segment of the rental market PLATFORM ADVANTAGES TO OPPORTUNISTICALLY DEPLOY CAPITAL AND CREATE VALUE AT INITIAL POINT OF INVESTMENT • MAA’s exclusive focus on region over past 24 years, superior track record of closing performance and strong balance sheet drive robust deal flow PLATFORM ADVANTAGES TO OPERATIONALLY DRIVE VALUE SUPERIOR TO THAT DEFINED BY MARKET CAP RATES • MAA is the largest owner/operator of apartments across the region…drives superior cost efficiencies and higher margins STRONG BALANCE SHEET TO SUPPORT COVERAGE RATIOS THROUGH THE CYCLE AND OPPORTUNISTIC NEW GROWTH • MAA maintains a strong BBB+ balance sheet rating and a dividend payout ratio stronger than sector average VALUE CREATION • Long - term earnings growth superior to implied market cap rates for regions where invested and operating • Support full cycle outperformance, downside protection and up - cycle performance • Lower volatility over cycle and enhanced ability to compound value through the cycle
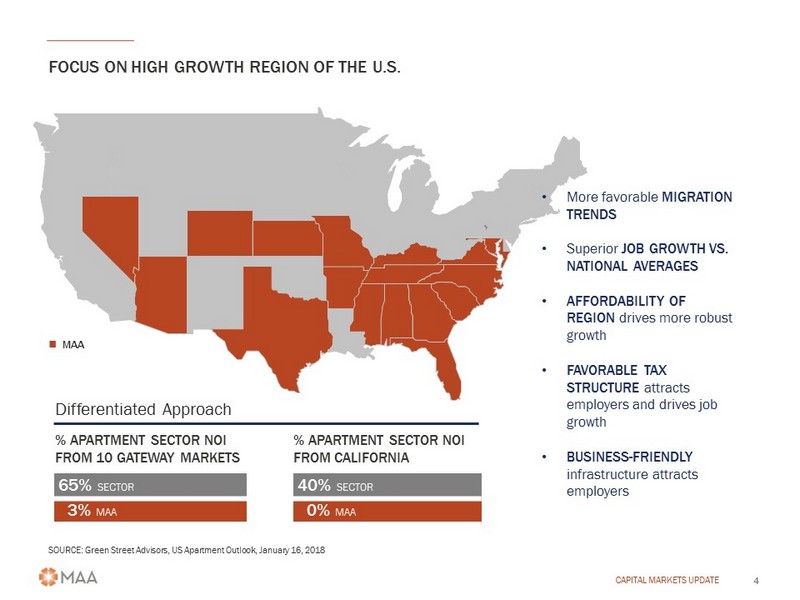
FOCUS ON HIGH GROWTH REGION OF THE U.S. CAPITAL MARKETS UPDATE 4 65% SECTOR 40% SECTOR 3% MAA 0% MAA % APARTMENT SECTOR NOI FROM 10 GATEWAY MARKETS % APARTMENT SECTOR NOI FROM CALIFORNIA SOURCE: Green Street Advisors, US Apartment Outlook, January 16, 2018 • More favorable MIGRATION TRENDS • Superior JOB GROWTH VS. NATIONAL AVERAGES • AFFORDABILITY OF REGION drives more robust growth • FAVORABLE TAX STRUCTURE attracts employers and drives job growth • BUSINESS - FRIENDLY infrastructure attracts employers MAA Differentiated Approach
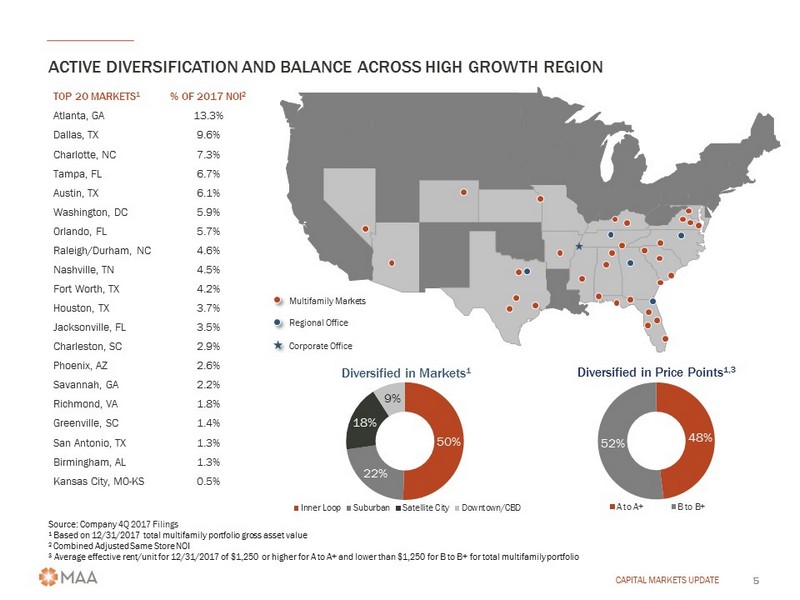
48% 52% Diversified in Price Points 1,3 A to A+ B to B+ Multifamily Markets Regional Office Corporate Office ACTIVE DIVERSIFICATION AND BALANCE ACROSS HIGH GROWTH REGION CAPITAL MARKETS UPDATE 5 50% 22% 18% 9% Diversified in Markets 1 Inner Loop Suburban Satellite City Downtown/CBD TOP 20 MARKETS 1 % OF 2017 NOI 2 Atlanta, GA 13.3% Dallas, TX 9.6% Charlotte, NC 7.3% Tampa, FL 6.7% Austin, TX 6.1% Washington, DC 5.9% Orlando, FL 5.7% Raleigh/Durham, NC 4.6% Nashville, TN 4.5% Fort Worth, TX 4.2% Houston, TX 3.7% Jacksonville, FL 3.5% Charleston, SC 2.9% Phoenix, AZ 2.6% Savannah, GA 2.2% Richmond, VA 1.8% Greenville, SC 1.4% San Antonio, TX 1.3% Birmingham, AL 1.3% Kansas City, MO - KS 0.5% Source: Company 4Q 2017 Filings 1 Based on 12/31/2017 total multifamily portfolio gross asset value 2 Combined Adjusted Same Store NOI 3 Average effective rent/unit for 12/31/2017 of $1,250 or higher for A to A+ and lower than $1,250 for B to B+ for total multif am ily portfolio
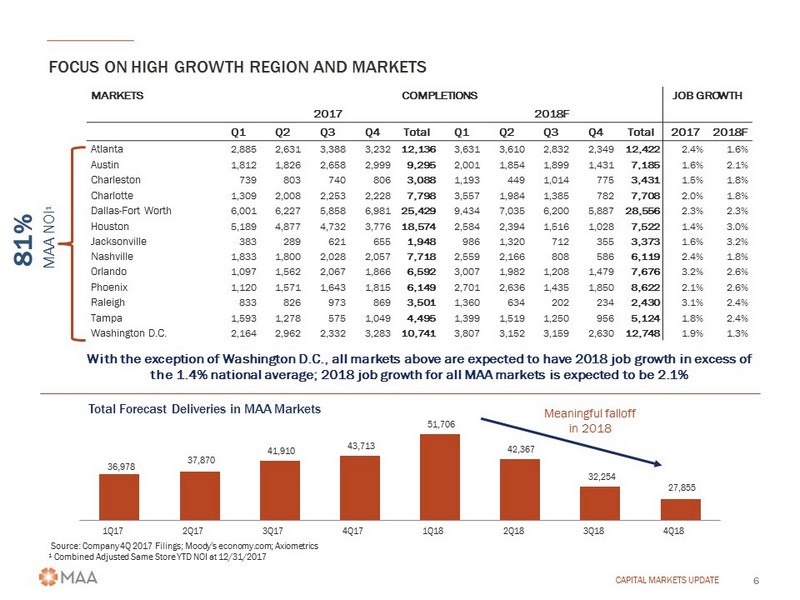
FOCUS ON HIGH GROWTH REGION AND MARKETS CAPITAL MARKETS UPDATE 6 Source: Company 4Q 2017 Filings; Moody’s economy.com; Axiometrics 1 Combined Adjusted Same Store Y TD NOI at 12/31/2017 MARKETS COMPLETIONS JOB GROWTH 2017 2018F Q1 Q2 Q3 Q4 Total Q1 Q2 Q3 Q4 Total 2017 2018F Atlanta 2,885 2,631 3,388 3,232 12,136 3,631 3,610 2,832 2,349 12,422 2.4% 1.6% Austin 1,812 1,826 2,658 2,999 9,295 2,001 1,854 1,899 1,431 7,185 1.6% 2.1% Charleston 739 803 740 806 3,088 1,193 449 1,014 775 3,431 1.5% 1.8% Charlotte 1,309 2,008 2,253 2,228 7,798 3,557 1,984 1,385 782 7,708 2.0% 1.8% Dallas - Fort Worth 6,001 6,227 5,858 6,981 25,429 9,434 7,035 6,200 5,887 28,556 2.3% 2.3% Houston 5,189 4,877 4,732 3,776 18,574 2,584 2,394 1,516 1,028 7,522 1.4% 3.0% Jacksonville 383 289 621 655 1,948 986 1,320 712 355 3,373 1.6% 3.2% Nashville 1,833 1,800 2,028 2,057 7,718 2,559 2,166 808 586 6,119 2.4% 1.8% Orlando 1,097 1,562 2,067 1,866 6,592 3,007 1,982 1,208 1,479 7,676 3.2% 2.6% Phoenix 1,120 1,571 1,643 1,815 6,149 2,701 2,636 1,435 1,850 8,622 2.1% 2.6% Raleigh 833 826 973 869 3,501 1,360 634 202 234 2,430 3.1% 2.4% Tampa 1,593 1,278 575 1,049 4,495 1,399 1,519 1,250 956 5,124 1.8% 2.4% Washington D.C. 2,164 2,962 2,332 3,283 10,741 3,807 3,152 3,159 2,630 12,748 1.9% 1.3% 81% MAA NOI 1 36,978 37,870 41,910 43,713 51,706 42,367 32,254 27,855 1Q17 2Q17 3Q17 4Q17 1Q18 2Q18 3Q18 4Q18 With the exception of Washington D.C., all markets above are expected to have 2018 job growth in excess of the 1.4% national average; 2018 job growth for all MAA markets is expected to be 2.1% Total Forecast Deliveries in MAA Markets Meaningful falloff in 2018

ACTIVE DIVERSIFICATION AND BALANCE POSITIONS THE PORTFOLIO TO SE RVE THE LARGEST SEGMENTS OF RENTER MARKET…BETTER FULL CYCLE PERFORMANCE CAPITAL MARKETS UPDATE 7 0.9% 12.5% 44.0% 28.9% 9.4% 0.5% 3.7% 0.1% 0.0% 4.4% 15.8% 23.7% 20.9% 13.8% 7.6% 5.6% 4.6% 3.6% 0.0% 5.0% 10.0% 15.0% 20.0% 25.0% 30.0% 35.0% 40.0% 45.0% 50.0% MAA NMHC • Downside protection • Helps mitigate new supply pressures over cycle Resident Demographics: Surveyed Monthly Rent Rate Source: 2017 NMHC/Kingsley Renter Preferences Report (based on 258,941 resident responses)

OPPORTUNISTICALLY RECYCLE AND DEPLOY CAPITAL CAPITAL MARKETS UPDATE 8 Since 2012: Opportunistically Recycle Capital • Sold just under 18k units in mostly one - off full retail priced transactions, totaling $1.3B • Average age 26 years; mix of markets: Large 29%; Secondary 38%; Tertiary 33% • Achieved an average IRR of 15.4% on dispositions • Redeployed the capital into just over 10k units, totaling $1.7B in acquisitions Opportunistically Deploy Capital • Exclusive regional focus long - established track record, strong transaction performer drives robust deal flow • Significant Value Creation • $1.27B of acquisitions have been stabilized > 1 year and have resulted in $ 239M in value creation 1 EFFECTIVE BUYER AND SELLER 1 Asset value reflects trailing 12 - month actual NOI, 3% management fee, and $350/unit capital reserves capped using estimated market capitalization rates. Value creation equals asset value minus the purchase price.
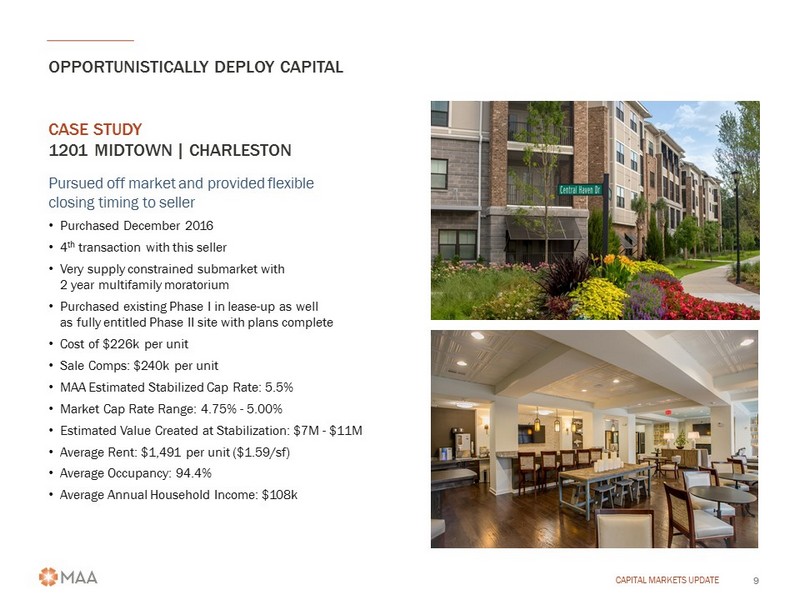
OPPORTUNISTICALLY DEPLOY CAPITAL CAPITAL MARKETS UPDATE 9 CASE STUDY 1201 MIDTOWN | CHARLESTON Pursued off market and provided flexible closing timing to seller • Purchased December 2016 • 4 th transaction with this seller • Very supply constrained submarket with 2 year multifamily moratorium • Purchased existing Phase I in lease - up as well as fully entitled Phase II site with plans complete • Cost of $226k per unit • Sale Comps: $240k per unit • MAA Estimated Stabilized Cap Rate: 5.5% • Market Cap Rate Range: 4.75% - 5.00% • Estimated Value Created at Stabilization: $7M - $11M • Average Rent: $1,491 per unit ($1.59/ sf ) • Average Occupancy: 94.4% • Average Annual Household Income: $108k
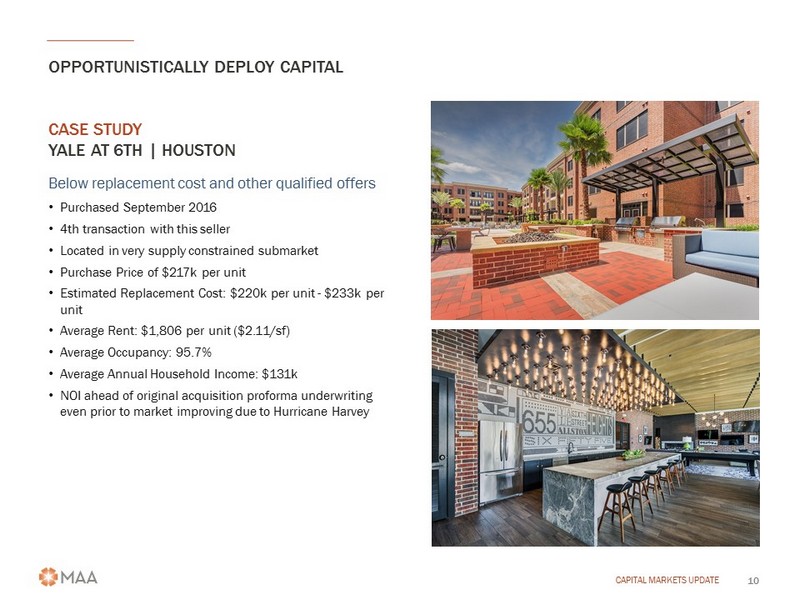
OPPORTUNISTICALLY DEPLOY CAPITAL CAPITAL MARKETS UPDATE 10 CASE STUDY YALE AT 6TH | HOUSTON Below replacement cost and other qualified offers • Purchased September 2016 • 4th transaction with this seller • Located in very supply constrained submarket • Purchase Price of $217k per unit • Estimated Replacement Cost: $220k per unit - $233k per unit • Average Rent: $1,806 per unit ($2.11/ sf ) • Average Occupancy: 95.7% • Average Annual Household Income: $131k • NOI ahead of original acquisition proforma underwriting even prior to market improving due to Hurricane Harvey

OPPORTUNISTICALLY DEPLOY CAPITAL CAPITAL MARKETS UPDATE 11 CASE STUDY CHARLOTTE AT MIDTOWN | NASHVILLE Fell out of contract and seller was motivated • Purchased March 2017 • MAA stepped in at $62.5M ($224k per unit) and closed 1 day after the PSA was executed • MAA Estimated Stabilized Cap Rate: 5.65% • Market Cap Rate Range: 4.75% - 5.00% • Estimated Value Created: $8M - $12M • Estimated Replacement Cost: $220k - $233k per unit • Average Rent: $1,654 per unit ($1.96/ sf ) • Average Occupancy: 95.3% • Average Annual Household Income: $126k
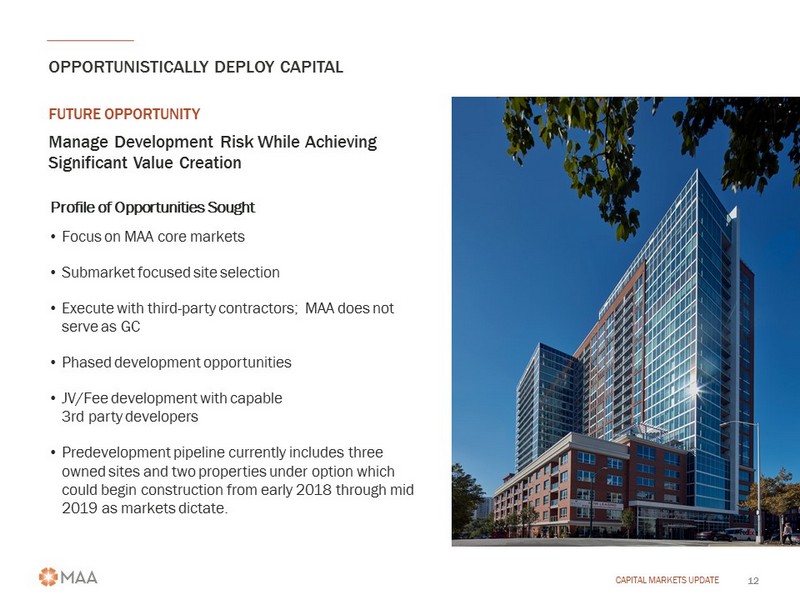
OPPORTUNISTICALLY DEPLOY CAPITAL CAPITAL MARKETS UPDATE 12 Manage Development Risk While Achieving Significant Value Creation FUTURE OPPORTUNITY Profile of Opportunities Sought • Focus on MAA core markets • Submarket focused site selection • Execute with third - party contractors; MAA does not serve as GC • Phased development opportunities • JV/Fee development with capable 3rd party developers • Predevelopment pipeline currently includes three owned sites and two properties under option which could begin construction from early 2018 through mid 2019 as markets dictate.
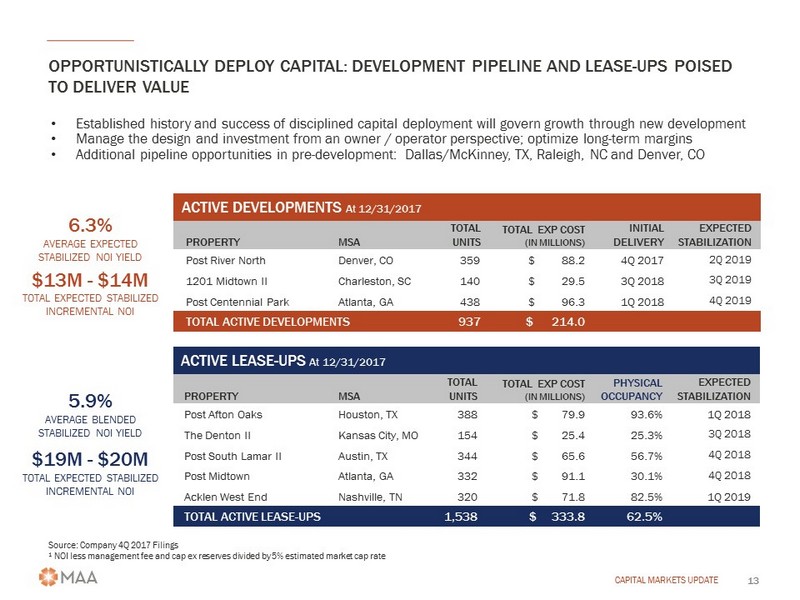
• Established history and success of disciplined capital deployment will govern growth through new development • Manage the design and investment from an owner / operator perspective; optimize long - term margins • Additional pipeline opportunities in pre - development: Dallas/McKinney, TX, Raleigh, NC and Denver, CO OPPORTUNISTICALLY DEPLOY CAPITAL: DEVELOPMENT PIPELINE AND LEASE - UPS POISED TO DELIVER VALUE CAPITAL MARKETS UPDATE 13 PROPERTY MSA TOTAL UNITS TOTAL EXP COST (IN MILLIONS) INITIAL DELIVERY EXPECTED STABILIZATION Post River North Denver, CO 359 $ 88.2 4Q 2017 2Q 2019 1201 Midtown II Charleston, SC 140 $ 29.5 3Q 2018 3Q 2019 Post Centennial Park Atlanta, GA 438 $ 96.3 1Q 2018 4Q 2019 TOTAL ACTIVE DEVELOPMENTS 937 $ 214.0 ACTIVE DEVELOPMENTS At 12/31/2017 Source : Company 4Q 2017 Filings 1 NOI less management fee and cap ex reserves divided by 5% estimated market cap rate PROPERTY MSA TOTAL UNITS TOTAL EXP COST (IN MILLIONS) PHYSICAL OCCUPANCY EXPECTED STABILIZATION Post Afton Oaks Houston, TX 388 $ 79.9 93.6% 1Q 2018 The Denton II Kansas City, MO 154 $ 25.4 25.3% 3Q 2018 Post South Lamar II Austin, TX 344 $ 65.6 56.7% 4Q 2018 Post Midtown Atlanta, GA 332 $ 91.1 30.1% 4Q 2018 Acklen West End Nashville, TN 320 $ 71.8 82.5% 1Q 2019 TOTAL ACTIVE LEASE - UPS 1,538 $ 333.8 62.5% ACTIVE LEASE - UPS At 12/31/2017 5.9% AVERAGE BLENDED STABILIZED NOI YIELD $19M - $ 20M TOTAL EXPECTED STABILIZED INCREMENTAL NOI 6.3% AVERAGE EXPECTED STABILIZED NOI YIELD $13M - $14M TOTAL EXPECTED STABILIZED INCREMENTAL NOI

OPPORTUNISTICALLY DEPLOY CAPITAL CAPITAL MARKETS UPDATE 14 DEVELOPMENT PROJECTS Post River North Denver, CO Post Centennial Park Atlanta, GA Post South Lamar II Austin, TX Cherry Creek (concept) Denver, CO
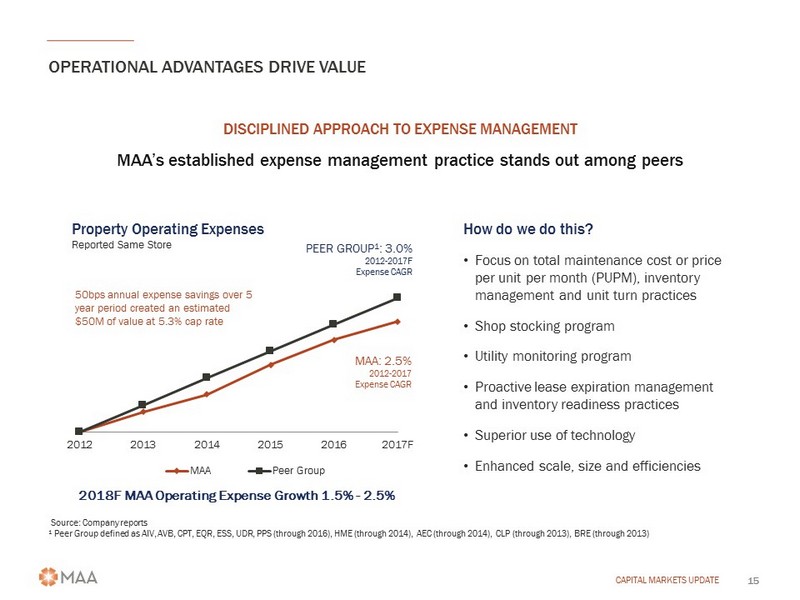
MAA’s established expense management practice stands out among peers OPERATIONAL ADVANTAGES DRIVE VALUE CAPITAL MARKETS UPDATE 15 DISCIPLINED APPROACH TO EXPENSE MANAGEMENT 2012 2013 2014 2015 2016 2017F MAA Peer Group MAA: 2.5% 2012 - 2017 Expense CAGR PEER GROUP 1 : 3.0% 2012 - 2017F Expense CAGR How do we do this? • Focus on total maintenance cost or price per unit per month (PUPM), inventory management and unit turn practices • Shop stocking program • Utility monitoring program • Proactive lease expiration management and inventory readiness practices • Superior use of technology • Enhanced scale, size and efficiencies Source: Company reports 1 Peer Group defined as AIV, AVB, CPT, EQR, ESS, UDR, PPS (through 2016), HME (through 2014), AEC (through 2014), CLP (through 2013), BRE (through 2013) Property Operating Expenses Reported Same Store 50bps annual expense savings over 5 year period created an estimated $50M of value at 5.3% cap rate 2018F MAA Operating Expense Growth 1.5% - 2.5%
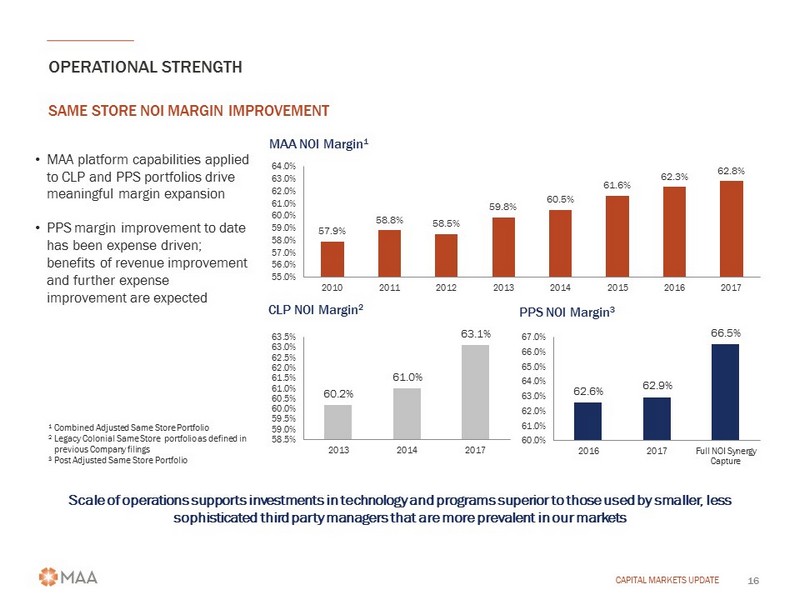
OPERATIONAL STRENGTH CAPITAL MARKETS UPDATE 16 SAME STORE NOI MARGIN IMPROVEMENT • MAA platform capabilities applied to CLP and PPS portfolios drive meaningful margin expansion • PPS margin improvement to date has been expense driven; benefits of revenue improvement and further expense improvement are expected 57.9% 58.8% 58.5% 59.8% 60.5% 61.6% 62.3% 62.8% 55.0% 56.0% 57.0% 58.0% 59.0% 60.0% 61.0% 62.0% 63.0% 64.0% 2010 2011 2012 2013 2014 2015 2016 2017 MAA NOI Margin 1 60.2% 61.0% 63.1% 58.5% 59.0% 59.5% 60.0% 60.5% 61.0% 61.5% 62.0% 62.5% 63.0% 63.5% 2013 2014 2017 CLP NOI Margin 2 62.6% 62.9% 66.5% 60.0% 61.0% 62.0% 63.0% 64.0% 65.0% 66.0% 67.0% 2016 2017 Full NOI Synergy Capture PPS NOI Margin 3 1 Combined Adjusted Same Store Portfolio 2 Legacy Colonial Same Store portfolio as defined in previous Company filings 3 Post Adjusted Same Store Portfolio Scale of operations supports investments in technology and programs superior to those used by smaller, less sophisticated third party managers that are more prevalent in our markets
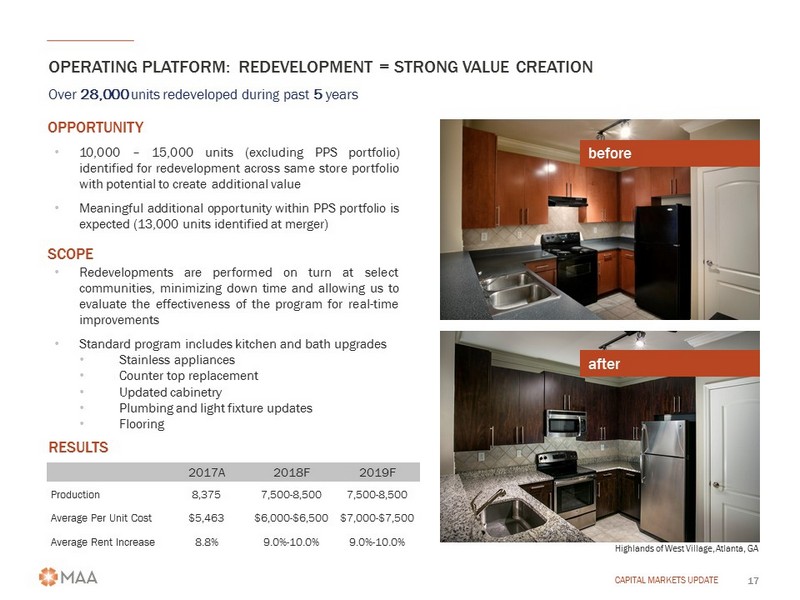
• Redevelopments are performed on turn at select communities, minimizing down time and allowing us to evaluate the effectiveness of the program for real - time improvements • Standard program includes kitchen and bath upgrades • Stainless appliances • Counter top replacement • U pdated cabinetry • Plumbing and light fixture updates • Flooring 2017A 2018F 2019F Production 8,375 7,500 - 8,500 7,500 - 8,500 Average Per Unit Cost $5,463 $6,000 - $6,500 $7,000 - $7,500 Average Rent Increase 8.8% 9.0% - 10.0% 9.0% - 10.0% OPERATING PLATFORM: REDEVELOPMENT = STRONG VALUE CREATION CAPITAL MARKETS UPDATE 17 • 10 , 000 – 15 , 000 units (excluding PPS portfolio) identified for redevelopment across same store portfolio with potential to create additional value • Meaningful additional opportunity within PPS portfolio is expected ( 13 , 000 units identified at merger) Highlands of West Village, Atlanta, GA SCOPE RESULTS OPPORTUNITY before after Over 28,000 units redeveloped during past 5 years
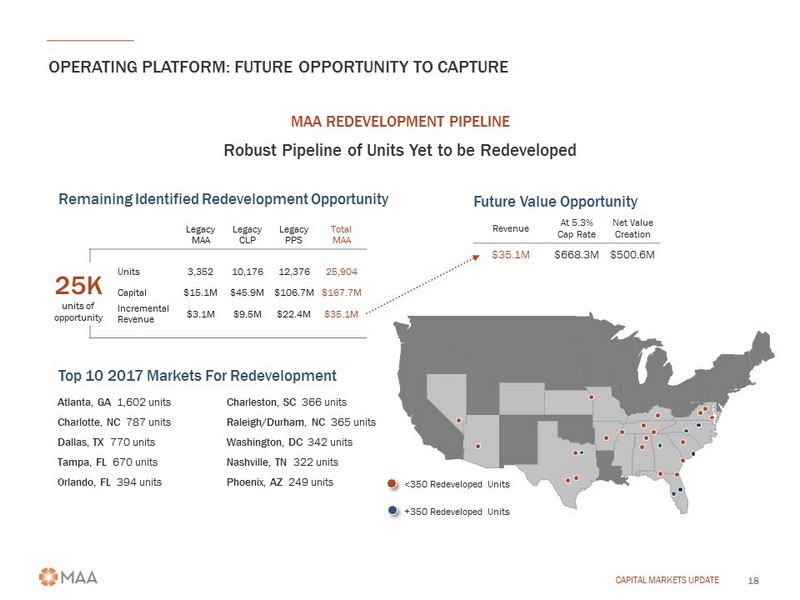
OPERATING PLATFORM: FUTURE OPPORTUNITY TO CAPTURE CAPITAL MARKETS UPDATE 18 Robust Pipeline of Units Yet to be Redeveloped MAA REDEVELOPMENT PIPELINE Remaining Identified Redevelopment Opportunity Future Value Opportunity Revenue At 5.3% Cap Rate Net Value Creation $35.1M $668.3M $500.6M Legacy MAA Legacy CLP Legacy PPS Total MAA Units 3,352 10,176 12,376 25,904 Capital $15.1M $45.9M $106.7M $167.7M Incremental Revenue $3.1M $9.5M $22.4M $35.1M Top 10 2017 Markets For Redevelopment Atlanta, GA 1,602 units Charlotte, NC 787 units Dallas, TX 770 units Tampa, FL 670 units Orlando, FL 394 units Charleston, SC 366 units Raleigh/Durham, NC 365 units Washington, DC 342 units Nashville, TN 322 units Phoenix, AZ 249 units 25K units of opportunity <350 Redeveloped Units +350 Redeveloped Units
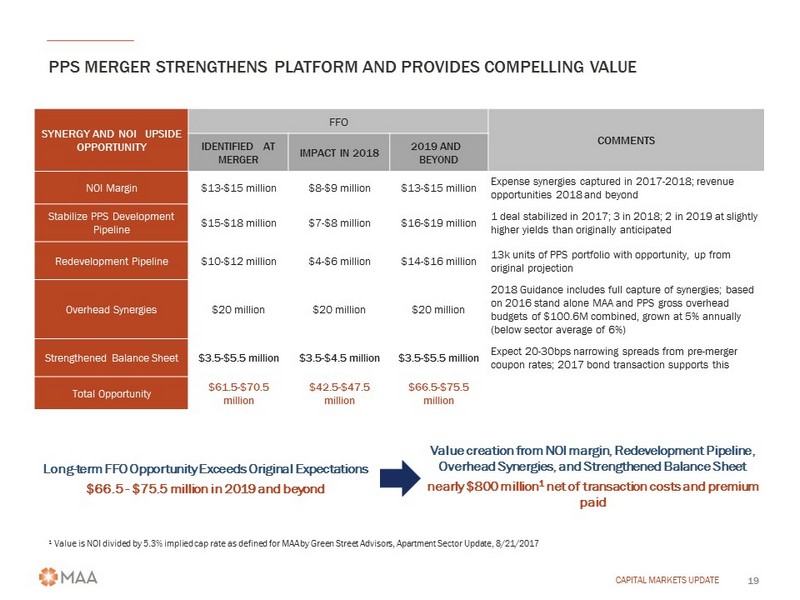
PPS MERGER STRENGTHENS PLATFORM AND PROVIDES COMPELLING VALUE CAPITAL MARKETS UPDATE 19 SYNERGY AND NOI UPSIDE OPPORTUNITY FFO COMMENTS IDENTIFIED AT MERGER IMPACT IN 2018 2019 AND BEYOND NOI Margin $13 - $15 million $ 8 - $ 9 million $ 1 3 - $15 million Expense synergies captured in 2017 - 2018; revenue opportunities 2018 and beyond Stabilize PPS Development Pipeline $15 - $18 million $ 7 - $ 8 million $ 1 6 - $ 1 9 million 1 deal stabilized in 2017; 3 in 2018; 2 in 2019 at slightly higher yields than originally anticipated Redevelopment Pipeline $10 - $12 million $4 - $6 million $14 - $16 million 13k units of PPS portfolio with opportunity, up from original projection Overhead Synergies $20 million $20 million $20 million 2018 Guidance includes f ull capture of synergies ; based on 2016 stand alone MAA and PPS gross overhead budgets of $100.6M combined, grown at 5% annually (below sector average of 6%) Strengthened Balance Sheet $3.5 - $5.5 million $ 3.5 - $ 4 .5 million $3.5 - $5.5 million Expect 20 - 30bps narrowing spreads from pre - merger coupon rates; 2017 bond transaction supports this Total Opportunity $61.5 - $70.5 million $ 4 2.5 - $ 47.5 million $ 6 6 .5 - $ 7 5 .5 million 1 Value is NOI divided by 5.3% implied cap rate as defined for MAA by Green Street Advisors, Apartment Sector Update, 8/21/2017 Value creation from NOI margin, Redevelopment Pipeline, Overhead Synergies, and Strengthened Balance Sheet nearly $800 million 1 net of transaction costs and premium paid Long - term FFO Opportunity Exceeds Original Expectations $66.5 - $75.5 million in 2019 and beyond
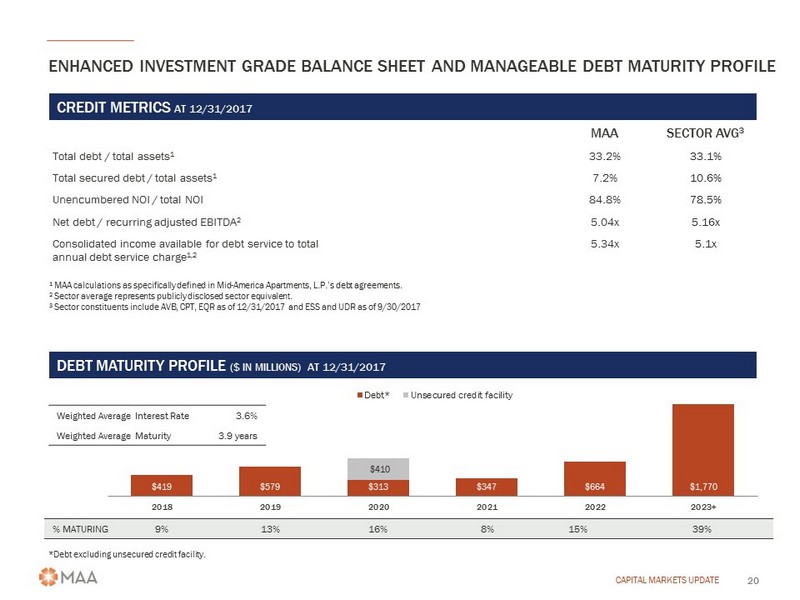
ENHANCED INVESTMENT GRADE BALANCE SHEET AND MANAGEABLE DEBT MATU RITY PROFILE CAPITAL MARKETS UPDATE 20 CREDIT METRICS AT 12/31/2017 MAA SECTOR AVG 3 Total debt / total assets 1 33.2% 33.1% Total secured debt / total assets 1 7.2% 10.6% Unencumbered NOI / total NOI 84.8% 78.5% Net d ebt / recurring adjusted EBITDA 2 5.04x 5.16x Consolidated income available for debt service to total annual debt service charge 1,2 5.34x 5.1x 0.0% 10.8% 6.1% 13.5% 57.0% 12.6% DEBT MATURITY PROFILE ($ IN MILLIONS ) AT 12/31/2017 1 MAA calculations as specifically defined in Mid - America Apartments, L.P.’s debt agreements. 2 Sector average represents publicly disclosed sector equivalent. 3 Sector constituents include AVB, CPT, EQR as of 12/31/2017 and ESS and UDR as of 9/30/2017 % MATURING 9% 13% 16% 8 % 15% 39% $419 $579 $313 $347 $664 $1,770 $410 2018 2019 2020 2021 2022 2023+ Debt* Unsecured credit facility *Debt excluding unsecured credit facility. Weighted Average Interest Rate 3.6% Weighted Average Maturity 3.9 years
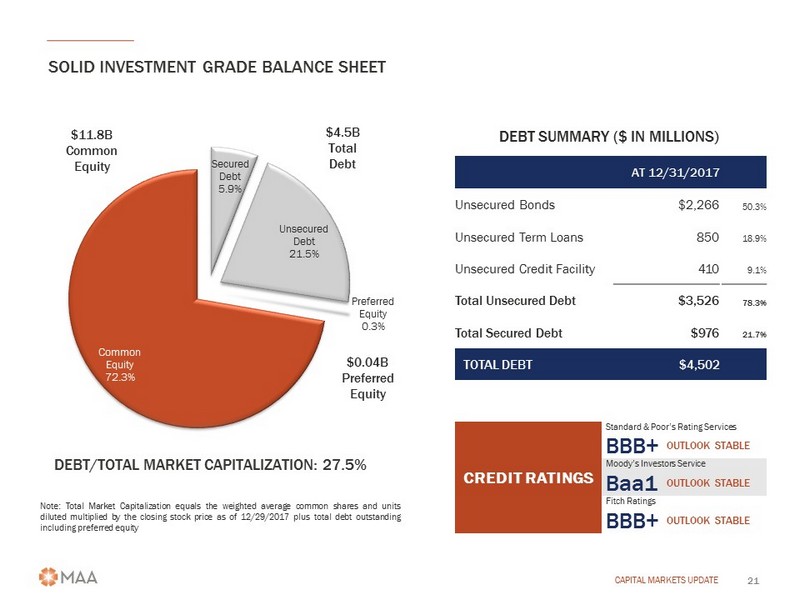
SOLID INVESTMENT GRADE BALANCE SHEET CAPITAL MARKETS UPDATE 21 DEBT SUMMARY ($ IN MILLIONS) AT 12/31/2017 Unsecured Bonds $2,266 50.3% Unsecured Term Loans 850 18.9% Unsecured Credit Facility 410 9.1% Total Unsecured Debt $3,526 78.3% Total Secured Debt $976 21.7% TOTAL DEBT $4,502 Note : Total Market Capitalization equals the weighted average common shares and units diluted multiplied by the closing stock price as of 12 / 29 / 2017 plus total debt outstanding including preferred equity Secured Debt 5.9% Unsecured Debt 21.5% Preferred Equity 0.3% Common Equity 72.3% $11.8B Common Equity $4.5B Total Debt DEBT/TOTAL MARKET CAPITALIZATION: 27.5% $0.04B Preferred Equity CREDIT RATINGS Standard & Poor’s Rating Services BBB+ OUTLOOK STABLE Moody’s Investors Service Baa1 OUTLOOK STABLE Fitch Ratings BBB+ OUTLOOK STABLE
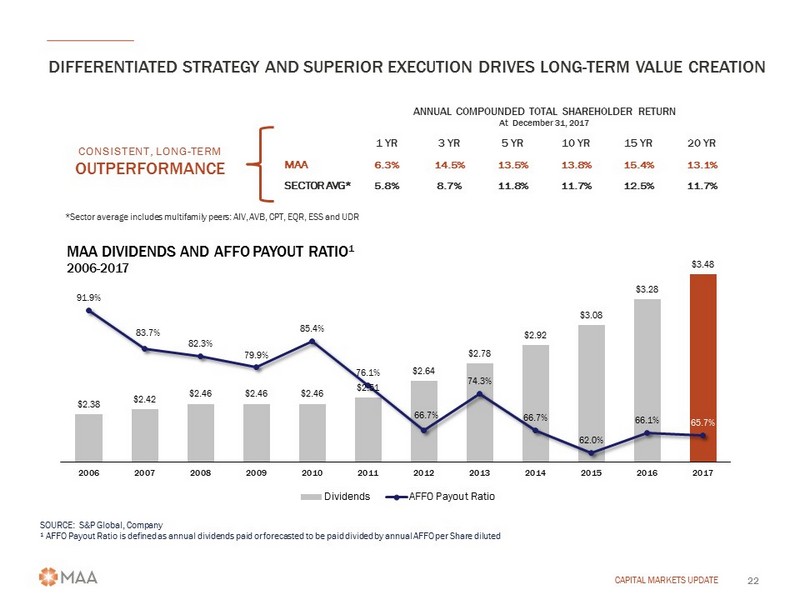
DIFFERENTIATED STRATEGY AND SUPERIOR EXECUTION DRIVES LONG - TERM VALUE CREATION CAPITAL MARKETS UPDATE 22 $2.38 $2.42 $2.46 $2.46 $2.46 $2.51 $2.64 $2.78 $2.92 $3.08 $3.28 $3.48 91.9% 83.7% 82.3% 79.9% 85.4% 76.1% 66.7% 74.3% 66.7% 62.0% 66.1% 65.7% 2006 2007 2008 2009 2010 2011 2012 2013 2014 2015 2016 2017 MAA DIVIDENDS AND AFFO PAYOUT RATIO 1 2006 - 2017 Dividends AFFO Payout Ratio SOURCE: S&P Global, Company 1 AFFO Payout Ratio is defined as annual dividends paid or forecasted to be paid divided by annual AFFO per Share diluted ANNUAL COMPOUNDED TOTAL SHAREHOLDER RETURN At December 31, 2017 1 YR 3 YR 5 YR 10 YR 15 YR 20 YR MAA 6.3% 14.5% 13.5% 13.8% 15.4% 13.1% SECTOR AVG* 5.8% 8.7% 11.8% 11.7% 12.5% 11.7% *Sector average includes multifamily peers: AIV, AVB, CPT, EQR, ESS and UDR CONSISTENT, LONG - TERM OUTPERFORMANCE

CAPITAL MARKETS UPDATE 23 • Focused on driving growing cash flows with lower levels of volatility through the cycle • B alanced capital allocation across the high - growth Southeast, Southwest and Mid - Atlantic regions • Largest owner/operator focused on high - growth Southeast, Southwest and Mid - Atlantic regions; competitive advantages support long - term outperformance and superior value creation • Enhanced development capability to enhance strategic capital recycling and value growth opportunity • Meaningful value opportunity from synergies and NOI lift from PPS portfolio • Enhanced investment grade balance sheet well positioned for future opportunities and potential downside pressures • Attractive and compelling value opportunity within the apartment REIT sector; long - term track record and enhanced platform support multiple pricing at or better than sector average SUMMARY Post Sierra at Frisco Bridges Dallas, TX Yale @ 6th Houston, TX Post South End Charlotte, NC The Denton Kansas City, MO - KS High Rise at Post Alexander Atlanta, GA Skysong Phoenix, AZ
CAPITAL MARKETS UPDATE 24 AT DECEMBER 31, 2017 APPENDIX Reconciliation of Non - GAAP Financial Measures Definitions of Non - GAAP Financial Measures
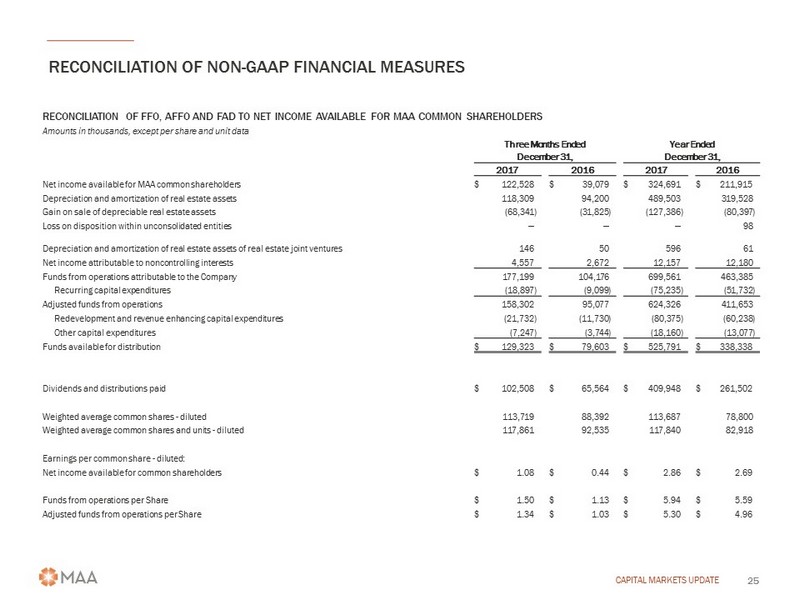
RECONCILIATION OF NON - GAAP FINANCIAL MEASURES CAPITAL MARKETS UPDATE 25 RECONCILIATION OF FFO, AFFO AND FAD TO NET INCOME AVAILABLE FOR MAA COMMON SHAREHOLDERS Amounts in thousands, except per share and unit data Three Months Ended Year Ended December 31, December 31, 2017 2016 2017 2016 Net income available for MAA common shareholders $ 122,528 $ 39,079 $ 324,691 $ 211,915 Depreciation and amortization of real estate assets 118,309 94,200 489,503 319,528 Gain on sale of depreciable real estate assets (68,341 ) (31,825 ) (127,386 ) (80,397 ) Loss on disposition within unconsolidated entities — — — 98 Depreciation and amortization of real estate assets of real estate joint ventures 146 50 596 61 Net income attributable to noncontrolling interests 4,557 2,672 12,157 12,180 Funds from operations attributable to the Company 177,199 104,176 699,561 463,385 Recurring capital expenditures (18,897 ) (9,099 ) (75,235 ) (51,732 ) Adjusted funds from operations 158,302 95,077 624,326 411,653 Redevelopment and revenue enhancing capital expenditures (21,732 ) (11,730 ) (80,375 ) (60,238 ) Other capital expenditures (7,247 ) (3,744 ) (18,160 ) (13,077 ) Funds available for distribution $ 129,323 $ 79,603 $ 525,791 $ 338,338 Dividends and distributions paid $ 102,508 $ 65,564 $ 409,948 $ 261,502 Weighted average common shares - diluted 113,719 88,392 113,687 78,800 Weighted average common shares and units - diluted 117,861 92,535 117,840 82,918 Earnings per common share - diluted: Net income available for common shareholders $ 1.08 $ 0.44 $ 2.86 $ 2.69 Funds from operations per Share $ 1.50 $ 1.13 $ 5.94 $ 5.59 Adjusted funds from operations per Share $ 1.34 $ 1.03 $ 5.30 $ 4.96
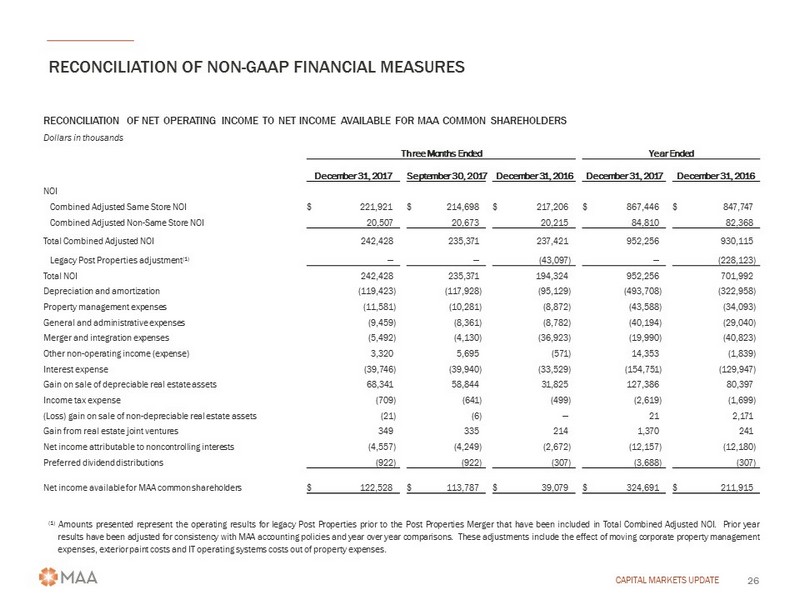
RECONCILIATION OF NON - GAAP FINANCIAL MEASURES CAPITAL MARKETS UPDATE 26 RECONCILIATION OF NET OPERATING INCOME TO NET INCOME AVAILABLE FOR MAA COMMON SHAREHOLDERS Dollars in thousands Three Months Ended Year Ended December 31, 2017 September 30, 2017 December 31, 2016 December 31, 2017 December 31, 2016 NOI Combined Adjusted Same Store NOI $ 221,921 $ 214,698 $ 217,206 $ 867,446 $ 847,747 Combined Adjusted Non - Same Store NOI 20,507 20,673 20,215 84,810 82,368 Total Combined Adjusted NOI 242,428 235,371 237,421 952,256 930,115 Legacy Post Properties adjustment (1) — — (43,097 ) — (228,123 ) Total NOI 242,428 235,371 194,324 952,256 701,992 Depreciation and amortization (119,423 ) (117,928 ) (95,129 ) (493,708 ) (322,958 ) Property management expenses (11,581 ) (10,281 ) (8,872 ) (43,588 ) (34,093 ) General and administrative expenses (9,459 ) (8,361 ) (8,782 ) (40,194 ) (29,040 ) Merger and integration expenses (5,492 ) (4,130 ) (36,923 ) (19,990 ) (40,823 ) Other non - operating income (expense) 3,320 5,695 (571 ) 14,353 (1,839 ) Interest expense (39,746 ) (39,940 ) (33,529 ) (154,751 ) (129,947 ) Gain on sale of depreciable real estate assets 68,341 58,844 31,825 127,386 80,397 Income tax expense (709 ) (641 ) (499 ) (2,619 ) (1,699 ) (Loss) gain on sale of non - depreciable real estate assets (21 ) (6 ) — 21 2,171 Gain from real estate joint ventures 349 335 214 1,370 241 Net income attributable to noncontrolling interests (4,557 ) (4,249 ) (2,672 ) (12,157 ) (12,180 ) Preferred dividend distributions (922 ) (922 ) (307 ) (3,688 ) (307 ) Net income available for MAA common shareholders $ 122,528 $ 113,787 $ 39,079 $ 324,691 $ 211,915 ( 1 ) Amounts presented represent the operating results for legacy Post Properties prior to the Post Properties Merger that have been included in Total Combined Adjusted NOI . Prior year results have been adjusted for consistency with MAA accounting policies and year over year comparisons . These adjustments include the effect of moving corporate property management expenses, exterior paint costs and IT operating systems costs out of property expenses .
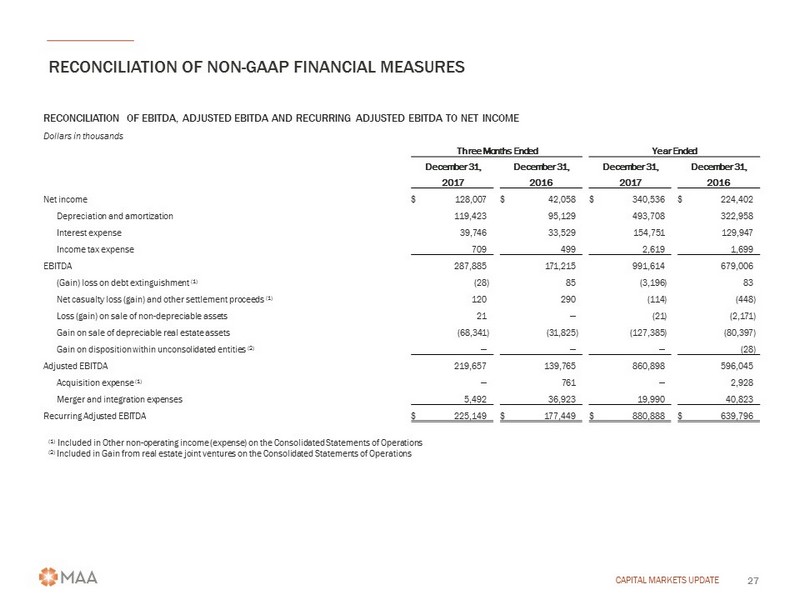
RECONCILIATION OF NON - GAAP FINANCIAL MEASURES CAPITAL MARKETS UPDATE 27 RECONCILIATION OF EBITDA, ADJUSTED EBITDA AND RECURRING ADJUSTED EBITDA TO NET INCOME Dollars in thousands Three Months Ended Year Ended December 31, December 31, December 31, December 31, 2017 2016 2017 2016 Net income $ 128,007 $ 42,058 $ 340,536 $ 224,402 Depreciation and amortization 119,423 95,129 493,708 322,958 Interest expense 39,746 33,529 154,751 129,947 Income tax expense 709 499 2,619 1,699 EBITDA 287,885 171,215 991,614 679,006 (Gain) loss on debt extinguishment (1) (28 ) 85 (3,196 ) 83 Net casualty loss (gain) and other settlement proceeds (1) 120 290 (114 ) (448 ) Loss (gain) on sale of non - depreciable assets 21 — (21 ) (2,171 ) Gain on sale of depreciable real estate assets (68,341 ) (31,825 ) (127,385 ) (80,397 ) Gain on disposition within unconsolidated entities (2) — — — (28 ) Adjusted EBITDA 219,657 139,765 860,898 596,045 Acquisition expense (1) — 761 — 2,928 Merger and integration expenses 5,492 36,923 19,990 40,823 Recurring Adjusted EBITDA $ 225,149 $ 177,449 $ 880,888 $ 639,796 (1) Included in Other non - operating income (expense) on the Consolidated Statements of Operations (2) Included in Gain from real estate joint ventures on the Consolidated Statements of Operations
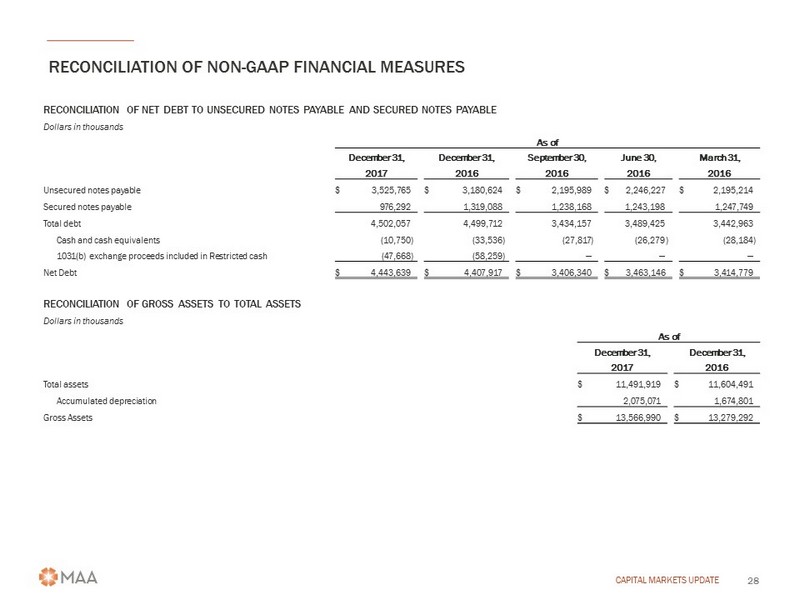
RECONCILIATION OF NON - GAAP FINANCIAL MEASURES CAPITAL MARKETS UPDATE 28 RECONCILIATION OF NET DEBT TO UNSECURED NOTES PAYABLE AND SECURED NOTES PAYABLE Dollars in thousands As of December 31, December 31, September 30, June 30, March 31, 2017 2016 2016 2016 2016 Unsecured notes payable $ 3,525,765 $ 3,180,624 $ 2,195,989 $ 2,246,227 $ 2,195,214 Secured notes payable 976,292 1,319,088 1,238,168 1,243,198 1,247,749 Total debt 4,502,057 4,499,712 3,434,157 3,489,425 3,442,963 Cash and cash equivalents (10,750 ) (33,536 ) (27,817 ) (26,279 ) (28,184 ) 1031(b) exchange proceeds included in Restricted cash (47,668 ) (58,259 ) — — — Net Debt $ 4,443,639 $ 4,407,917 $ 3,406,340 $ 3,463,146 $ 3,414,779 RECONCILIATION OF GROSS ASSETS TO TOTAL ASSETS Dollars in thousands As of December 31, December 31, 2017 2016 Total assets $ 11,491,919 $ 11,604,491 Accumulated depreciation 2,075,071 1,674,801 Gross Assets $ 13,566,990 $ 13,279,292
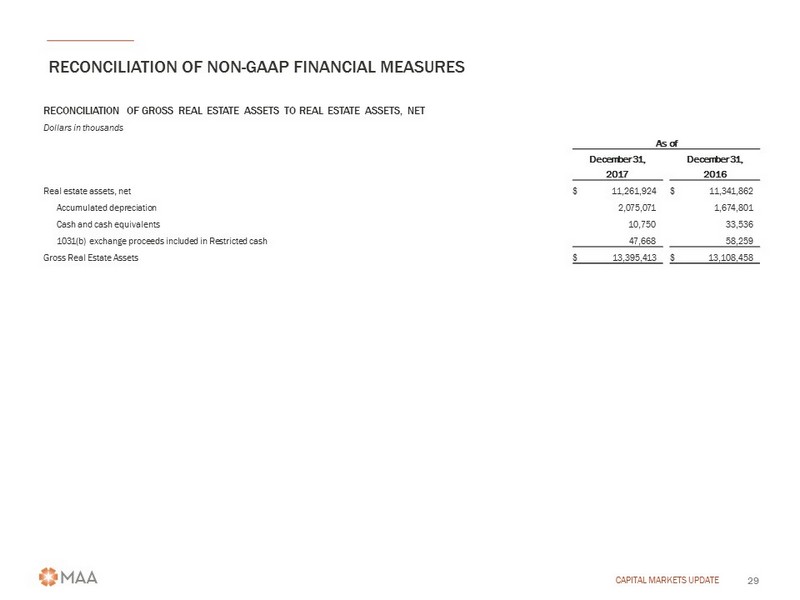
RECONCILIATION OF NON - GAAP FINANCIAL MEASURES CAPITAL MARKETS UPDATE 29 RECONCILIATION OF GROSS REAL ESTATE ASSETS TO REAL ESTATE ASSETS, NET Dollars in thousands As of December 31, December 31, 2017 2016 Real estate assets, net $ 11,261,924 $ 11,341,862 Accumulated depreciation 2,075,071 1,674,801 Cash and cash equivalents 10,750 33,536 1031(b) exchange proceeds included in Restricted cash 47,668 58,259 Gross Real Estate Assets $ 13,395,413 $ 13,108,458
DEFINITIONS OF NON - GAAP FINANCIAL MEASURES CAPITAL MARKETS UPDATE 30 Adjusted EBITDA For purposes of calculations in this release, Adjusted Earnings Before Interest, Income Taxes, Depreciation and Amortization, or Adjusted EBITDA, is composed of EBITDA adjusted for net gain or loss on asset sales and insurance and other settlement procee ds, and gain or loss on debt extinguishment. As an owner and operator of real estate, MAA considers Adjusted EBITDA to be an important measure of performance from core operations because Adjusted EBITDA does not include various income and expense items that are not indicative of operating performance. Adjusted EBITDA should not be considered as an alternative to Net inc ome available for MAA common shareholders as an indicator of financial performance. MAA's computation of Adjusted EBITDA may diff er from the methodology utilized by other companies to calculate Adjusted EBITDA. Adjusted Funds From Operations (AFFO) AFFO is composed of FFO less recurring capital expenditures. AFFO should not be considered as an alternative to Net income available for MAA common shareholders. As an owner and operator of real estate, MAA considers AFFO to be an important measur e of performance from operations because AFFO measures the ability to control revenues, expenses and recurring capital expenditures. Combined Adjusted Same Store NOI Combined Adjusted Same Store NOI represents total operating revenues less total property operating expenses, excluding depreciation, for all properties classified within the Combined Adjusted Same Store Portfolio during the period. Combined Adj ust ed Same Store NOI should not be considered as an alternative to Net income available for MAA common shareholders. MAA believes Combined Adjusted Same Store NOI is a helpful tool in evaluating the operating performance within MAA's markets because it measures the core operations of property performance by excluding corporate level expenses and other items not related to property operating performance .
DEFINITIONS OF NON - GAAP FINANCIAL MEASURES CAPITAL MARKETS UPDATE 31 EBITDA For purposes of calculations in this release, Earnings Before Interest, Income Taxes, Depreciation and Amortization, or EBITDA, i s composed of net income plus depreciation and amortization, interest expense, and income taxes. As an owner and operator of r eal estate, MAA considers EBITDA to be an important measure of performance from core operations because EBITDA does not include various expense items that are not indicative of operating performance. EBITDA should not be considered as an alternative to Net income available for MAA common shareholders as an indicator of financial performance. Funds Available for Distribution (FAD) FAD is composed of FFO less total capital expenditures, excluding development spending and property acquisitions. FAD should not be considered as an alternative to Net income available for MAA common shareholders. As an owner and operator of real estate , MAA considers FAD to be an important measure of performance from core operations because FAD measures the ability to control revenues, expenses and total capital expenditures.

DEFINITIONS OF NON - GAAP FINANCIAL MEASURES CAPITAL MARKETS UPDATE 32 Funds From Operations (FFO) FFO represents net income available for MAA common shareholders (computed in accordance with U.S. generally accepted accounting principles, or GAAP) excluding extraordinary items, asset impairment, gains or losses on disposition of real estat e a ssets, plus net income attributable to noncontrolling interest, depreciation and amortization of real estate assets, and adjustments for joint ventures to reflect FFO on the same basis. Because noncontrolling interest is added back, FFO, when used in this document, represents FFO attributable to the Company. While MAA's definition of FFO is in accordance with the National Association of Rea l Estate Investment Trusts' definition, it may differ from the methodology for calculating FFO utilized by other REITs and, acc ord ingly, may not be comparable to such other REITs. FFO should not be considered as an alternative to Net income available for MAA common shareholders as an indicator of operating performance. MAA believes that FFO is helpful in understanding operating performance in that FFO excludes depreciation and amortization of real estate assets. MAA believes that GAAP historical cost depreciation of real estate assets is generally not correlated with changes in the value of those assets, whose value does no t diminish predictably over time, as historical cost depreciation implies. Gross Assets Gross Assets represents Total assets plus Accumulated depreciation, the accumulated depreciation for corporate properties, which is included in Corporate property, net on the Consolidated Balance Sheets and accumulated depreciation for Assets held for sa le, which is included in Assets held for sale on the Consolidated Balance Sheets. MAA believes that Gross Assets can be used as a helpful tool in evaluating its balance sheet positions. MAA believes that GAAP historical cost depreciation of real estate a sse ts is generally not correlated with changes in the value of those assets, whose value does not diminish predictably over time, as h ist orical cost depreciation implies.
DEFINITIONS OF NON - GAAP FINANCIAL MEASURES CAPITAL MARKETS UPDATE 33 Gross Real Estate Assets Gross Real Estate Assets represents Real estate assets, net plus Accumulated depreciation, the accumulated depreciation for corporate properties, which is included in Corporate property, net on the Consolidated Balance Sheets, and accumulated depreciation for Assets held for sale, which is included in Assets held for sale on the Consolidated Balance Sheets plus Cash an d cash equivalents plus 1031(b) exchange proceeds included in Restricted cash on the Consolidated Balance Sheets. MAA believes that Gross Real Estate Assets can be used as a helpful tool in evaluating its balance sheet positions. MAA believes that GAA P historical cost depreciation of real estate assets is generally not correlated with changes in the value of those assets, who se value does not diminish predictably over time, as historical cost depreciation implies. Net Debt Net Debt represents Unsecured notes payable and Secured notes payable less Cash and cash equivalents and 1031(b) proceeds included in Restricted cash on the Consolidated Balance Sheets. MAA believes Net Debt is a helpful tool in evaluating its de bt position. Net Operating Income (NOI) Net operating income represents total operating revenues less total property operating expenses, excluding depreciation, for all properties held during the period, regardless of their status as held for sale. NOI should not be considered as an alternativ e t o Net income available for MAA common shareholders. MAA believes NOI by market is a helpful tool in evaluating the operating performance within MAA's markets because it measures the core operations of property performance by excluding corporate level expenses and other items not related to property operating performance.
DEFINITIONS OF NON - GAAP FINANCIAL MEASURES CAPITAL MARKETS UPDATE 34 Recurring Adjusted EBITDA Recurring Adjusted EBITDA represents Adjusted EBITDA further adjusted to exclude certain items that are not considered part of MAA's core business operations such as acquisition and merger and integration expenses. MAA believes Recurring Adjusted EBIT DA is an important performance measure as it adjusts for certain items that by their nature are not comparable over periods and therefore tend to obscure actual operating performance. Recurring Adjusted EBITDA should not be considered as an alternative to Net income available for MAA common shareholders as an indicator of operating performance. MAA's computation of Recurring Adjusted EBITDA may differ from the methodology utilized by other companies to calculate Recurring Adjusted EBITDA. Average Effective Rent per Unit Average effective rent per unit represents the average of gross rent amounts after the effect of leasing concessions for occupied units plus prevalent market rates asked for unoccupied units, divided by the total number of units. Leasing concessions repre sen t discounts to the current market rate. MAA believes average effective rent is a helpful measurement in evaluating average pric ing . It does not represent actual rental revenue collected per unit. Average Physical Occupancy Average physical occupancy represents the average of the daily physical occupancy for the quarter. Combined Adjusted Same Store Portfolio Combined Adjusted Same Store Portfolio represents the MAA Same Store Portfolio and the Post Adjusted Same Store Portfolio considered as a single portfolio, as if the Post Adjusted Same Store Portfolio was owned by MAA during all periods presented. Fo r comparability purposes, certain adjustments have been made to the prior year Post Adjusted Same Store Portfolio. See the definition of the Post Adjusted Same Store Portfolio for more details.
DEFINITIONS OF NON - GAAP FINANCIAL MEASURES CAPITAL MARKETS UPDATE 35 Development Portfolio Communities remain identified as development until certificates of occupancy are obtained for all units under development. Once all units are delivered and available for occupancy, the community moves into the Lease - up Portfolio. Lease - up Portfolio New acquisitions acquired during lease - up and newly developed communities remain in the Lease - up Portfolio until stabilized. Non - Same Store Portfolio Non - Same Store Portfolio includes recent acquisitions, communities that have been identified for disposition, and communities that have undergone a significant casualty loss. MAA Same Store Portfolio MAA reviews its Same Store Portfolio at the beginning of each calendar year, or as significant transactions warrant. Communities are generally added into the MAA Same Store Portfolio if they were owned and stabilized at the beginning of the previous year. Communities that have been approved by MAA's Board of Directors for disposition are excluded from the MAA Same Store Portfoli o. Communities that have undergone a significant casualty loss are also excluded from the MAA Same Store Portfolio. Within the MAA Same Store Portfolio communities are designated as operating in Large or Secondary Markets: Large Market Same Store communities are generally those communities in markets with a population of at least one million and at least 1% of the total public multifamily REIT units. Secondary Market Same Store communities are generally those communities in markets with either a population less than one million or less than 1% of the total public multifamily REIT units, or both.
DEFINITIONS OF NON - GAAP FINANCIAL MEASURES CAPITAL MARKETS UPDATE 36 Post Adjusted Same Store Portfolio Post Adjusted Same Store Portfolio represents the Post Properties same store portfolio that would have been in effect had the properties been owned by MAA since January 1, 2016. Prior year results have been adjusted for consistency with MAA accounting policies and year over year comparisons. The primary adjustments include moving corporate property management expenses, exterior paint costs and IT operating systems costs out of property expenses. Because these properties have only been owned by MAA since December 1, 2016, they were not included in the MAA Same Store Portfolio for periods prior to January 2018. See MA A Same Store Portfolio for more information regarding inclusion. These properties have been identified in certain tables to pr ovi de Combined Adjusted Same Store results as if the properties had been owned by MAA in prior periods. These properties became eligible to join the MAA Same Store portfolio in January 2018. Stabilized Communities Communities are considered stabilized after achieving at least 90% occupancy for 90 days. Total Market Capitalization Total Market Capitalization equals the number of shares of common stock plus units not held by MAA at period end multiplied by the closing stock price at period end, plus total debt outstanding. Unencumbered NOI Unencumbered NOI represents NOI generated by our unencumbered assets (as defined in MAALP's bond covenants).