Attached files
| file | filename |
|---|---|
| 8-K - 8-K - Zendesk, Inc. | zen_8-kxq4x2017.htm |
| EX-99.3 - EXHIBIT 99.3 - Zendesk, Inc. | zendeskq42017highlightsf.htm |
| EX-99.2 - EXHIBIT 99.2 - Zendesk, Inc. | a2017q4shareholderletter.htm |
| EX-99.1 - EXHIBIT 99.1 - Zendesk, Inc. | zen_8-kxq4x2017xex991.htm |
| EX-3.1 - EXHIBIT 3.1 - Zendesk, Inc. | zendesk-amendedandrestated.htm |

ASC 606 Investor Deck
Exhibit 99.4

Zendesk Adoption Bacground
Adoption date
1/1/18
Full retrospective adoption
(FY16 and FY17 restated)ADOPTION
BACKGROUND
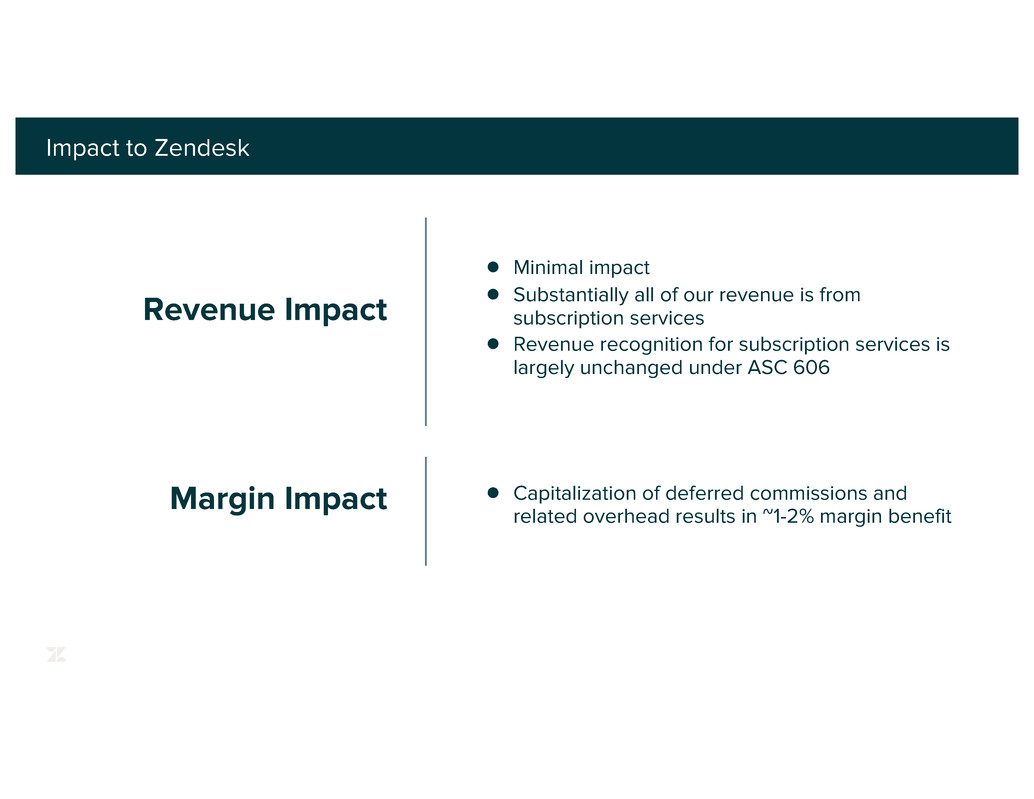
● Minimal impact
● Substantially all of our revenue is from
subscription services
● Revenue recognition for subscription services is
largely unchanged under ASC 606
● Capitalization of deferred commissions and
related overhead results in ~1-2% margin benefit
Impact to Zendesk
Revenue Impact
Margin Impact

Revenue Impact - Annual
ASC605 ASC606
$312.0 $312.8
YoY Growth - 37.5%
YoY Growth - 38.0%
ASC605 ASC606
$430.5 $430.2
FY 2016 FY 2017
Total Revenue ($MM)

Revenue Impact
$000s FY16 Q1'17 Q2'17 Q3'17 Q4'17 FY17
REVENUE
ASC 605 - Reported 311,999 93,007 101,273 112,786 123,426 430,492
ASC 606 - Restated 312,844 93,888 102,096 112,265 121,916 430,165
Impact 845 881 823 (521) (1,510) (327)

GAAP Margin Impact - Annual
GAAP Operating
Expenses ($MM)
ASC605 ASC606
$322.4 $317.1
ASC605 ASC606
$417.7 $408.9
(33.4%) (31.4%)
(26.6%) (24.7%)
GAAP Operating
Margin (%)
FY2016 FY2017
GAAP Margin Impact
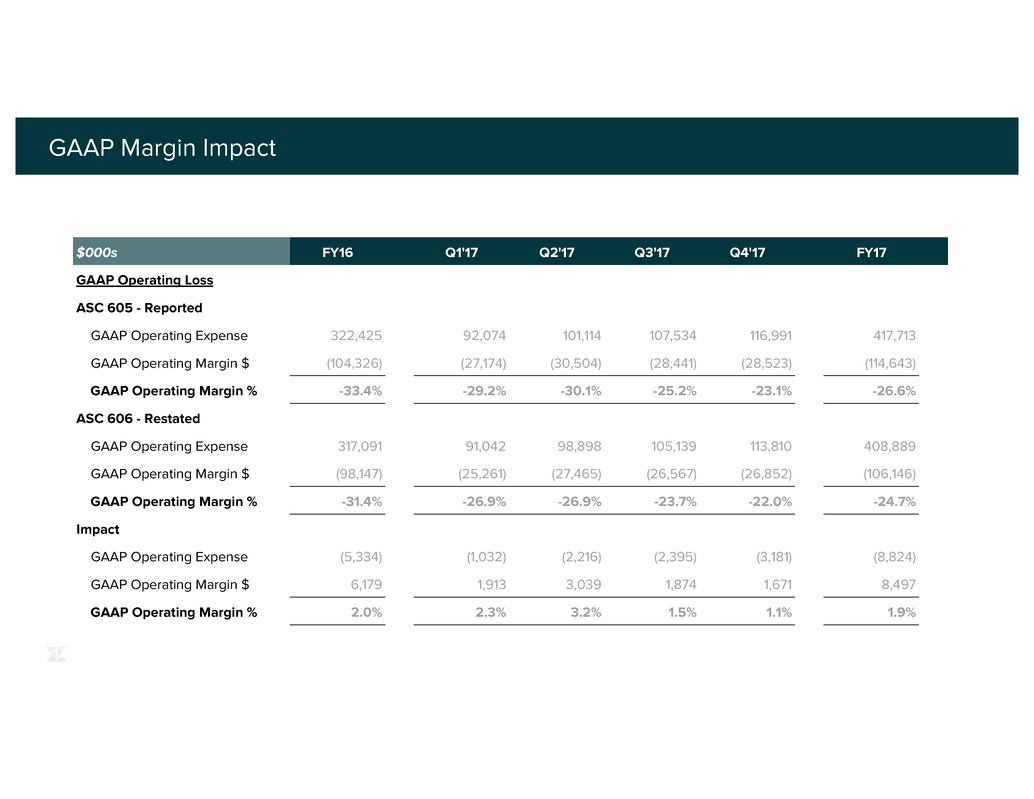
$000s FY16 Q1'17 Q2'17 Q3'17 Q4'17 FY17
GAAP Operating Loss
ASC 605 - Reported
GAAP Operating Expense 322,425 92,074 101,114 107,534 116,991 417,713
GAAP Operating Margin $ (104,326) (27,174) (30,504) (28,441) (28,523) (114,643)
GAAP Operating Margin % -33.4% -29.2% -30.1% -25.2% -23.1% -26.6%
ASC 606 - Restated
GAAP Operating Expense 317,091 91,042 98,898 105,139 113,810 408,889
GAAP Operating Margin $ (98,147) (25,261) (27,465) (26,567) (26,852) (106,146)
GAAP Operating Margin % -31.4% -26.9% -26.9% -23.7% -22.0% -24.7%
Impact
GAAP Operating Expense (5,334) (1,032) (2,216) (2,395) (3,181) (8,824)
GAAP Operating Margin $ 6,179 1,913 3,039 1,874 1,671 8,497
GAAP Operating Margin % 2.0% 2.3% 3.2% 1.5% 1.1% 1.9%

Non-GAAP Margin Impact - Annual
Non-GAAP Operating
Expenses ($MM)
ASC605 ASC606
$251.8
$246.8
ASC605 ASC606
$334.7
$326.4
(6.8%)
(4.9%) (4.0%)
(2.1%)Non-GAAP Operating
Margin (%)
FY2016 FY2017

Non-GAAP Margin Impact
$000s FY16 Q1'17 Q2'17 Q3'17 Q4'17 FY17
Non-GAAP Operating Loss
ASC 605 - Reported
Non-GAAP Operating Expense 251,786 73,678 80,453 86,190 94,409 334,731
Non-GAAP Operating Margin $ (21,076) (5,245) (6,187) (3,264) (2,411) (17,108)
Non-GAAP Operating Margin % -6.8% -5.6% -6.1% -2.9% -2.0% -4.0%
ASC 606 - Restated
Non-GAAP Operating Expense 246,802 72,755 78,366 83,938 91,344 326,404
Non-GAAP Operating Margin $ (15,247) (3,441) (3,277) (1,533) (856) (9,108)
Non-GAAP Operating Margin % -4.9% -3.7% -3.2% -1.4% -0.7% -2.1%
Impact
Non-GAAP Operating Expense (4,984) (923) (2,087) (2,252) (3,065) (8,327)
Non-GAAP Operating Margin $ 5,829 1,804 2,910 1,731 1,555 8,000
Non-GAAP Operating Margin % 1.9% 1.9% 2.9% 1.5% 1.3% 1.9%

Selected Balance Sheet Impact
$000s FY16 FY17
ASC 605 ASC 606
Pre-FY16
Impact FY16 Impact ASC 605 ASC 606 Impact
Assets
Deferred costs 0 11,285 6,077 5,208 0 15,771 15,771
Deferred costs, noncurrent 0 11,057 2,809 8,248 0 15,395 15,395
Total 0 22,342 8,886 13,456 0 31,166 31,166
Liabilities
Deferred revenue 124,533 122,829 118 (1,822) 175,737 174,360 (1,377)

No Cash Flow Impact
ASC605 ASC606
$24.5 $24.5
FY 2016
ASC605 ASC606
$42.1 $42.1
FY 2017
Operating Cash
Flow ($MM)

Financial Statements
with 606 Adjustments
Consolidated Balance Sheets – FY17 Quarterly
Consolidated Statements of Operations – FY17 & FY16
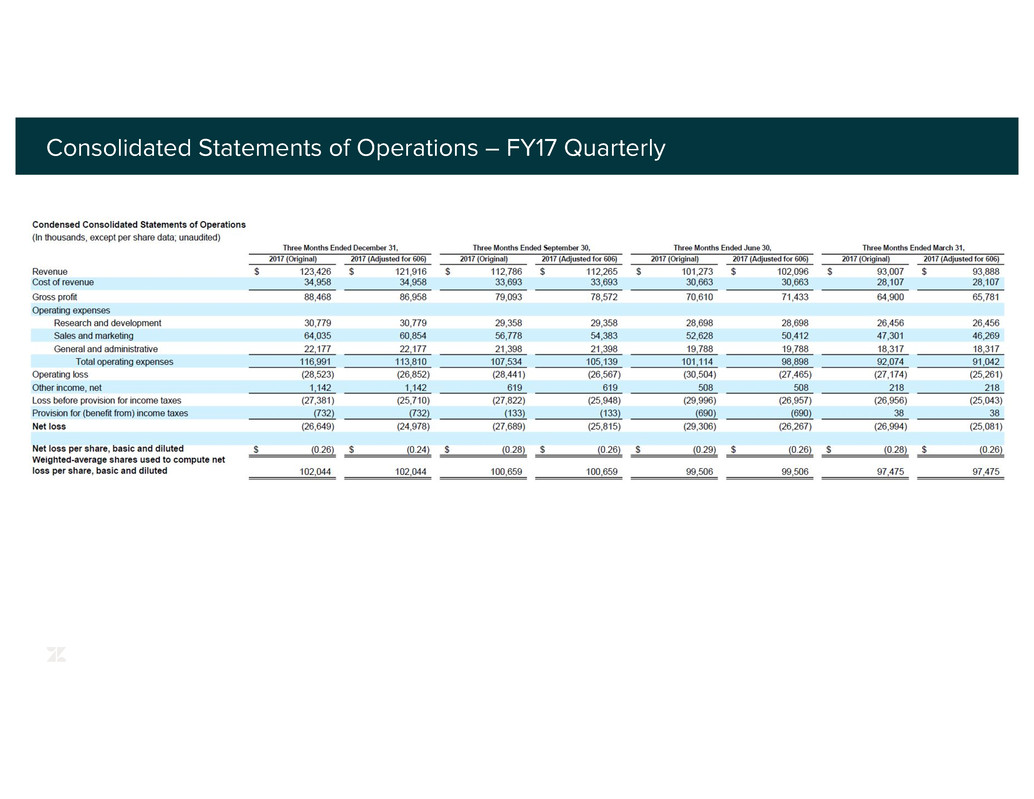
Consolidated Statements of Operations – FY17 Quarterly
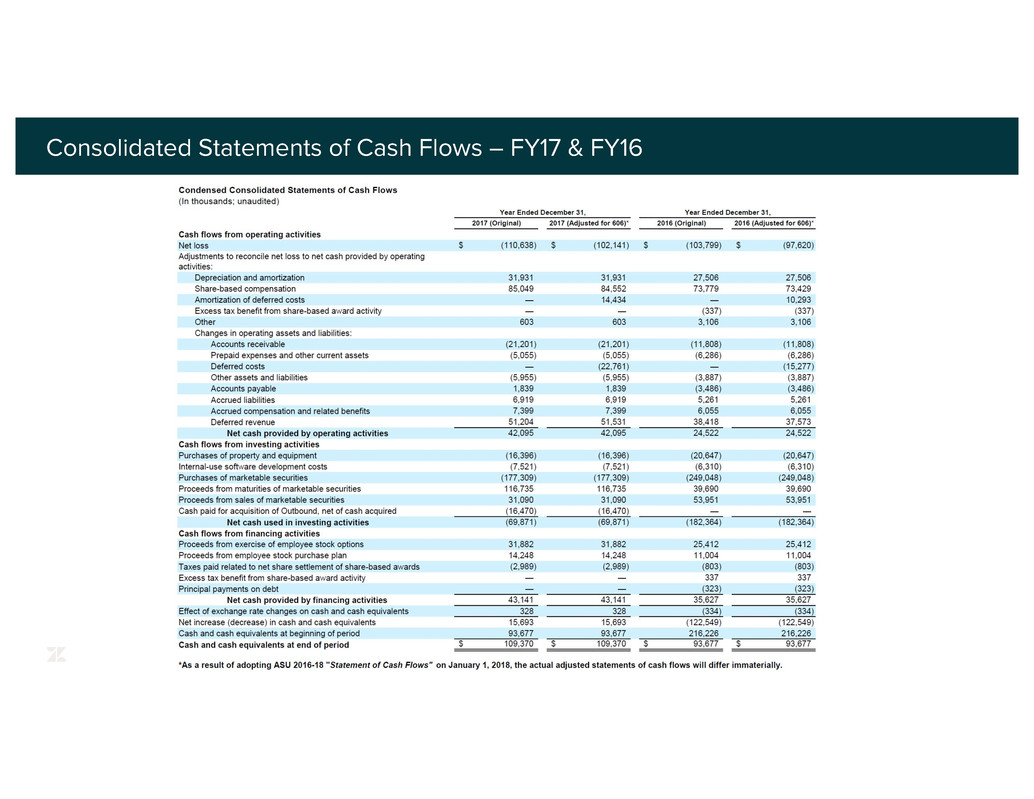
Consolidated Statements of Cash Flows – FY17 & FY16
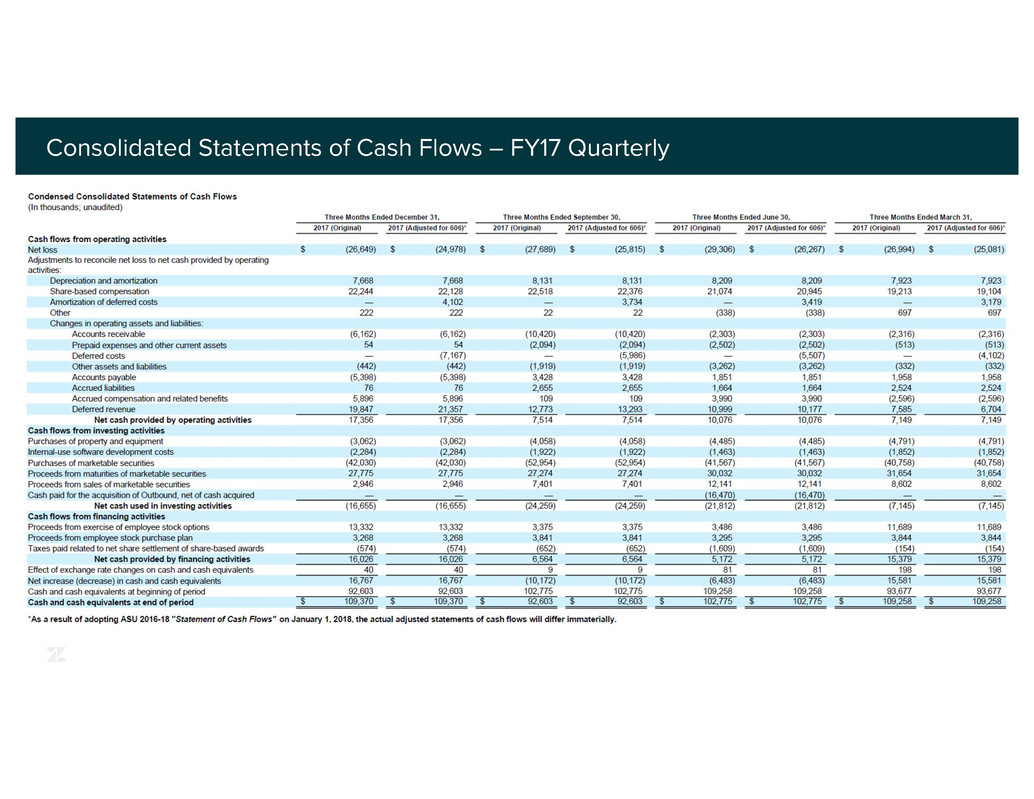
Consolidated Statements of Cash Flows – FY17 Quarterly

Non-GAAP
Reconciliation Tables

Non-GAAP Reconciliations – FY17 & FY16
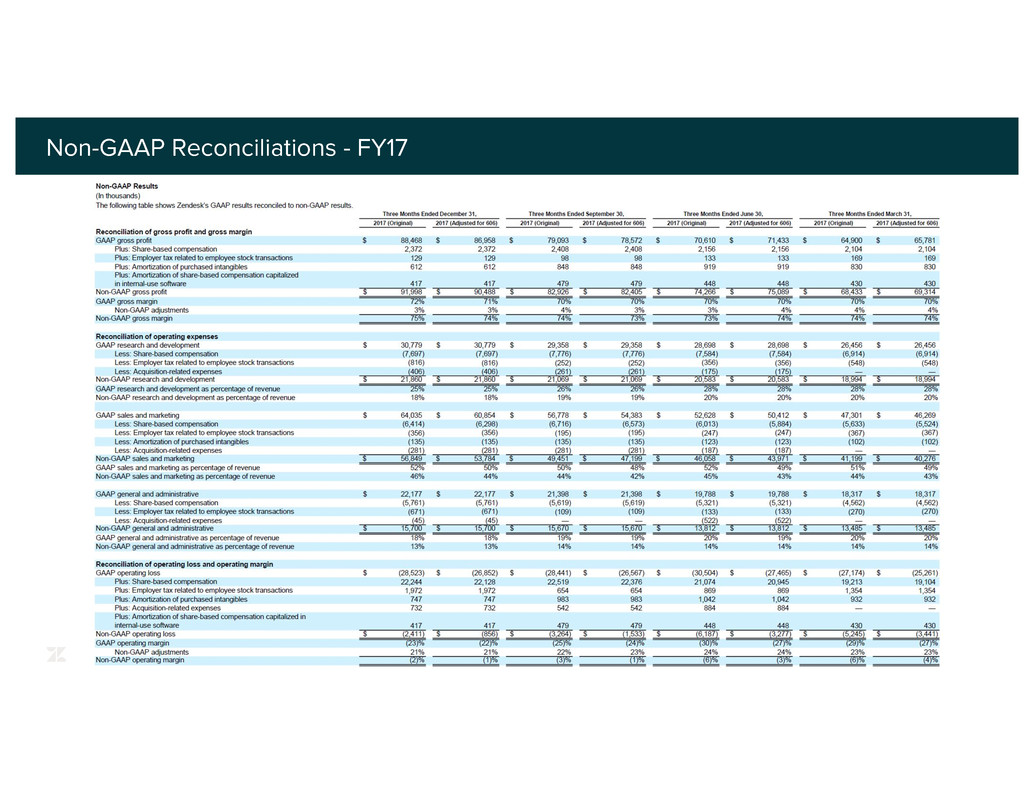
Non-GAAP Reconciliations - FY17
