Attached files
| file | filename |
|---|---|
| 8-K - FORM 8-K ON INVESTOR PRESENTATION - WESBANCO INC | fin8k020618.htm |
| EX-99.1 - INVESTOR PRESENTATION IN PDF - WESBANCO INC | ex991.pdf |

John IannoneVice President, Investor Relations304-905-7021 Investor Presentation (Q1 2018)(WSBC financials as of Q4 2017)

Forward-looking statements in this report relating to WesBanco’s plans, strategies, objectives, expectations, intentions and adequacy of resources, are made pursuant to the safe harbor provisions of the Private Securities Litigation Reform Act of 1995. The information contained in this report should be read in conjunction with WesBanco’s Form 10-K for the year ended December 31, 2016 and documents subsequently filed by WesBanco with the Securities and Exchange Commission (“SEC”), including WesBanco’s Form 10-Q for the quarters ended March 31, June 30 and September 30, 2017, which are available at the SEC’s website, www.sec.gov or at WesBanco’s website, www.wesbanco.com. Investors are cautioned that forward-looking statements, which are not historical fact, involve risks and uncertainties, including those detailed in WesBanco’s most recent Annual Report on Form 10-K filed with the SEC under “Risk Factors” in Part I, Item 1A. Such statements are subject to important factors that could cause actual results to differ materially from those contemplated by such statements, including, without limitation, that the businesses of WesBanco and FTSB may not be integrated successfully or such integration may take longer to accomplish than excepted; the expected cost savings and any revenue synergies from the merger of WesBanco and FTSB may not be fully realized within the expected timeframes; disruption from the merger of WesBanco and FTSB may make it more difficult to maintain relationships with clients, associates, or suppliers; the effects of changing regional and national economic conditions; changes in interest rates, spreads on earning assets and interest-bearing liabilities, and associated interest rate sensitivity; sources of liquidity available to WesBanco and its related subsidiary operations; potential future credit losses and the credit risk of commercial, real estate, and consumer loan customers and their borrowing activities; actions of the Federal Reserve Board, the Federal Deposit Insurance Corporation, the SEC, the Financial Institution Regulatory Authority, the Municipal Securities Rulemaking Board, the Securities Investors Protection Corporation, and other regulatory bodies; potential legislative and federal and state regulatory actions and reform, including, without limitation, the impact of the implementation of the Dodd-Frank Act; adverse decisions of federal and state courts; fraud, scams and schemes of third parties; internet hacking; competitive conditions in the financial services industry; rapidly changing technology affecting financial services; marketability of debt instruments and corresponding impact on fair value adjustments; and/or other external developments materially impacting WesBanco’s operational and financial performance. WesBanco does not assume any duty to update forward-looking statements. Forward-Looking Statements 1
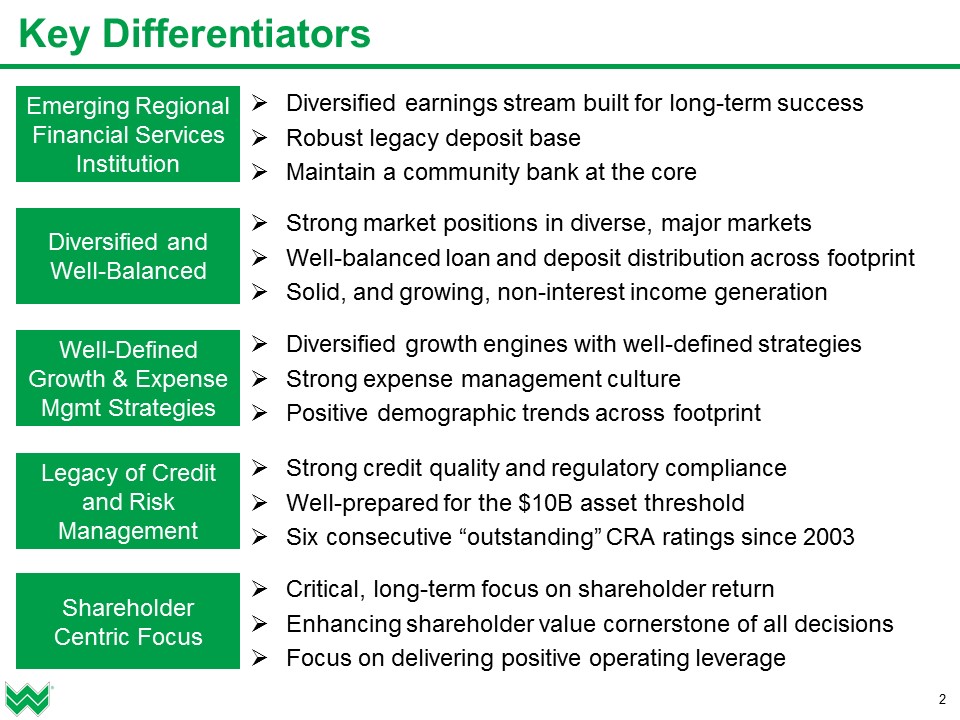
2 Key Differentiators Diversified earnings stream built for long-term successRobust legacy deposit baseMaintain a community bank at the core Emerging Regional Financial Services Institution Diversified and Well-Balanced Well-Defined Growth & Expense Mgmt Strategies Legacy of Credit and Risk Management Shareholder Centric Focus Strong market positions in diverse, major marketsWell-balanced loan and deposit distribution across footprintSolid, and growing, non-interest income generation Diversified growth engines with well-defined strategiesStrong expense management culturePositive demographic trends across footprint Strong credit quality and regulatory complianceWell-prepared for the $10B asset thresholdSix consecutive “outstanding” CRA ratings since 2003 Critical, long-term focus on shareholder returnEnhancing shareholder value cornerstone of all decisionsFocus on delivering positive operating leverage
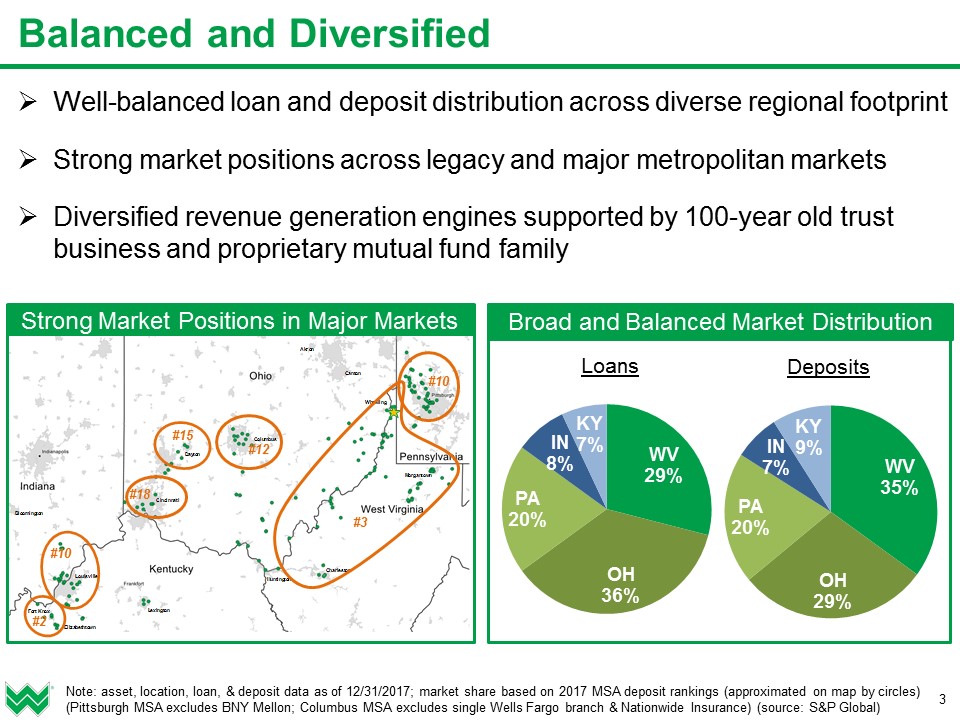
3 Balanced and Diversified Well-balanced loan and deposit distribution across diverse regional footprintStrong market positions across legacy and major metropolitan marketsDiversified revenue generation engines supported by 100-year old trust business and proprietary mutual fund family Note: asset, location, loan, & deposit data as of 12/31/2017; market share based on 2017 MSA deposit rankings (approximated on map by circles) (Pittsburgh MSA excludes BNY Mellon; Columbus MSA excludes single Wells Fargo branch & Nationwide Insurance) (source: S&P Global) Strong Market Positions in Major Markets Broad and Balanced Market Distribution #18 #12 #15 #2 #10 #10 #3

4 Investment Rationale Well-balanced financial services company with a diversified earnings stream and a strong legacy of credit and risk managementDisciplined growth, balanced by a fundamental focus on expense management, that delivers positive operating leverageEmphasis on customer service to ensure relationship value that meets all customer needs efficiently and effectivelyWell-defined growth and $10 billion asset threshold strategies for long-term successFocus on shareholder value through earnings and dividend growthFavorable asset quality and operating metrics when compared to peersStock trades at an ~1x multiple discount – despite favorable operating metrics Well-positioned for continued, high-quality growth withstrong upside market appreciation potential Note: multiple discount based on stock prices and consensus estimates (current year and next year) as of 2/1/18 (source: FactSet)
Growth and $10 Billion Asset Threshold Strategies

6 Long-Term Growth Strategies Focus on Delivering Positive Operating Leverage Strong Legacy of Credit Quality, Risk Management, and Compliance Diversified Loan Portfolio with C&I and Home Equity Lending Focus Long History of Strong Wealth Management Capabilities Retail Banking Service Strategies & Core Deposit Advantage Franchise-Enhancing Expansion within Contiguous Markets

7 Diversified Loan Portfolio Focus on strategic growth, diversification, and credit qualityExpansion of Commercial and Industrial (C&I), HELOC, and Residential Mortgage portfoliosTargeted reductions in consumer portfolio to reduce risk profileFull suite of treasury management products, including international services, foreign exchange, and enhanced wire and lockbox capabilitiesAverage loans to average deposits ratio of 90.3% provides opportunity for continued loan growthManageable lending exposure, with no concentrations, to the energy-related, hotel, and retail industries $6.3 Billion Loan Portfolio Note: loan and deposit data as of quarter ending 12/31/17; CAGR based on 12/31/12; organic CAGR excludes loans acquired from Your Community Bankshares (9/9/16) and ESB Financial (2/10/15) Five-Year CAGR Loan CategoryC&IHELOCResidential R/EComm’l R/E (Total)Consumer Total19%14%11%10%4% Organic11%10%3%4%(6%)

Private Banking$540MM in private banking loans and deposits1,700+ relationships Growth opportunities from shale-related private wealth managementExpansion in Kentucky and Indiana 8 Strong Wealth Management Capabilities Note: assets, loans, deposits, and clients as of 12/31/17; chart financials as of 12/31 unless otherwise stated Private Banking Loans and Deposits(as of 12/31) ($MM) Trust & Investments$3.9B of trust and mutual fund assets under management5,000+ relationshipsGrowth opportunities from shale-related private wealth managementExpansion in Kentucky and IndianaWesMark funds Securities BrokerageSecurities investment salesLicensed banker programInvestment advisory servicesRegional player/coach programExpand external business development opportunitiesExpansion in Kentucky and Indiana CAGR52% InsurancePersonal, commercial, title, health, and lifeExpand title business in all marketsApplied quotation software utilization (personal)TPA services for small business healthcare plans Trust Assets(Market Value as of 12/31) ($B) CAGR4% `

9 Franchise Expansion Targeted acquisitions in existing markets and new higher-growth metro areasCritical, long-term focus on shareholder returnStrong capital and liquidity, along with strong regulatory compliance processes, provides ability to execute transactions quickly Diligent efforts to maintain a community bank oriented value-based approach to our marketsHistory of successful acquisitions that have improved earnings Contiguous Markets Radius Franchise-Enhancing Acquisitions FTSB: announced Nov-17; to close 1H18YCB: announced May-16; closed Sep-16ESB: announced Oct-14; closed Feb-15Fidelity: announced Jul-12; closed Nov-12AmTrust: announced Jan-09; closed Mar-09Oak Hill: announced Jul-07; closed Nov-07 Note: AmTrust was an acquisition of five branches; see appendix for summary of proposed First Sentry Bancshares (FTSB) merger

$10 Billion Asset Threshold Strategy 10 Will cross the $10 billion asset threshold during the first half of 2018 upon the closing of the mergerApproximately $9 million estimated, annual pre-tax income impact from reduced interchange income and additional FDIC expenses50% impact expected during the second half of 2019Well-positioned from staffing, infrastructure, processes, compliance, DFAST reporting, and CRA perspectivesMajority of preparatory costs (staff, software, consulting) have been incurred to-dateCurrently anticipate no large, single-period investment requirementOver the next few years, will continue to target additional franchise-enhancing acquisition(s) within a six-hour drive of Wheeling headquarters First Sentry Bancshares merger is the first step in a multi-faceted strategyWill continue to target either a combination of several small- to mid-sized deals, or a larger, several billion dollar asset transactionWell-prepared and strategically positioned for the $10 billion asset threshold Note: see appendix for summary of proposed First Sentry Bancshares (FTSB) merger
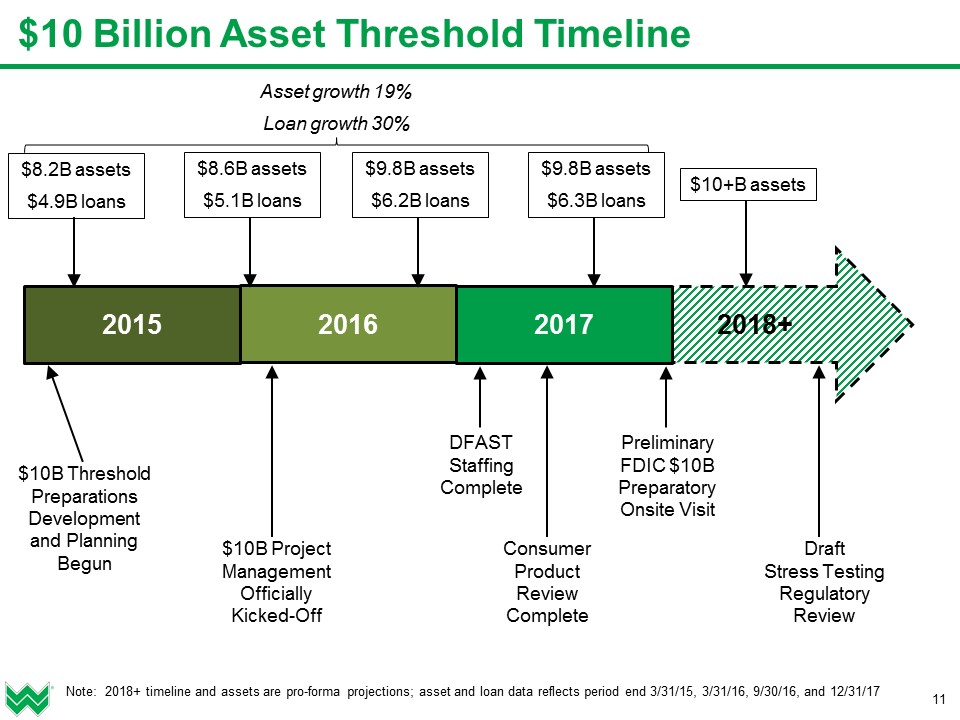
$10 Billion Asset Threshold Timeline 11 2018+ 2017 2016 2015 Note: 2018+ timeline and assets are pro-forma projections; asset and loan data reflects period end 3/31/15, 3/31/16, 9/30/16, and 12/31/17 $10+B assets $9.8B assets$6.3B loans $9.8B assets$6.2B loans $8.6B assets$5.1B loans $8.2B assets$4.9B loans Asset growth 19%Loan growth 30% $10B Project Management Officially Kicked-Off DFAST Staffing Complete Consumer Product Review Complete Preliminary FDIC $10B Preparatory Onsite Visit DraftStress Testing Regulatory Review $10B Threshold Preparations Development and Planning Begun

$10 Billion Asset Threshold Milestones 12 Note: $10B Project Management officially kicked-off Q1 2016 Milestone Project Complete Completion Date GAP Analysis Q1 2017 DFAST Staffing Q2 2017 Stress Testing Data Discovery and Planning Q2 2017 Modeling Software Installation Q2 2017 Consumer Product Review Q2 2017 Credit Model Development Q3 2017 Data Management Software Installation Q3 2017 Preliminary FDIC $10B Preparatory Onsite Visit Q4 2017 Aggregator Model Implementation Q4 2017 Data Governance Council in process Q1 2018 Consumer Product Library Deployment in process Q2 2018 Draft Stress Testing Regulatory Review in process TBD

Returning Value to Shareholders Focus on appropriate capital allocation to provide flexibility while continuing to enhance shareholder valueQ4 2017 dividend payout ratio of 39.4% provides upside potentialQ4 2017 dividend yield 2.5%, compared to 1.6% for bank group 13 Note: dividend through November 2017 declaration announcement; WSBC dividend payout ratio based on earnings per share excluding merger-related costs and net tax deferred asset revaluation; WSBC dividend yield based upon 2/1/18 closing stock price of $41.56; bank group ($5B to $10B total assets) dividend data as of 4Q2017 (source as of 2/2/18: S&P Global) Tangible Book Value per Share ($) Quarterly Dividend per Share ($) +86% +52%

Financial Overview
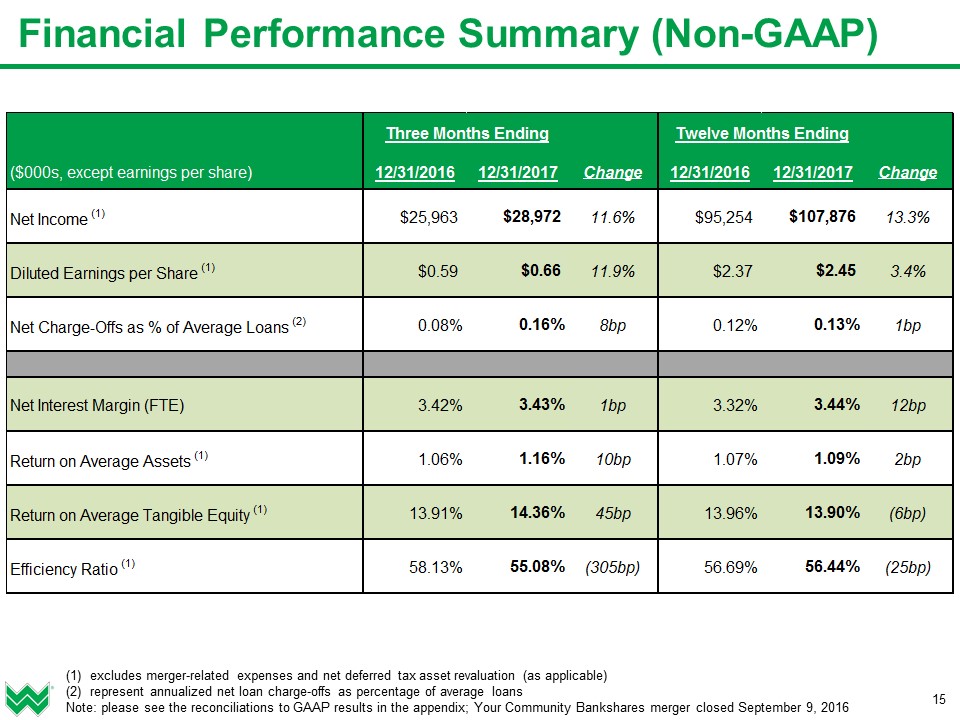
Financial Performance Summary (Non-GAAP) 15 excludes merger-related expenses and net deferred tax asset revaluation (as applicable)represent annualized net loan charge-offs as percentage of average loansNote: please see the reconciliations to GAAP results in the appendix; Your Community Bankshares merger closed September 9, 2016

16 Financial and Operational Highlights – Q4 2017 Net income up 11.6% and EPS up 11.9% to $0.66 (excluding certain costs)Return on tangible common equity of 14.4% (excluding certain costs)Executing upon well-defined, long-term operational and growth strategies in order to maintain a strong financial institution for shareholdersWell-positioned for success in any type of operating environmentInvesting in becoming a larger company while carefully managing costsCommitted to driving positive operating leverage and enhancing shareholder value and returnStrong efficiency ratio of 55.1%, down 305 basis points from the prior yearSuccessful balance sheet remix strategy while loan portfolio quality was diversified and strengthenedStrategic focus loan categories delivered mid-single digit year-over-year loan growth of 4.0% in total commercial lending and 4.0% in home equity lendingTargeted reductions in consumer portfolio (indirect lending) to reduce risk profileContinued sale of a higher percentage of residential real estate mortgages in the secondary market, which has benefit of increasing fee income Note: financial data as of quarter ending 12/31/2017, and compared to the quarter ending 12/31/2016; certain costs excludes merger-related expenses and net deferred tax asset revaluation; please see the reconciliations to GAAP results in the appendix

17 Favorable Operating Metrics Disciplined execution upon growth strategies providing favorable performance versus peer group across key operating metrics Note: financial data as of 12/31; current YTD data as of 12/31/2017; please see the reconciliations in the appendix; peer group includes SRCE, CHFC, CBU, EGBN, FNB, FCF, FFBC, FRME, NBTB, ONB, PRK, PNFP, STBA, TMP, TOWN, UBSH, UBSI; peer ratios from S&P Global and company reports (as of 2/2/18) and represent simple averages for ROTCE & efficiency ratio, and weighted averages for ROAA & NPAs to Assets Efficiency Ratio Return on Average Assets Return on Average Tangible Equity Non-Performing Assets to Total Assets * 2017 Peer Average adjusted for net deferred tax asset revaluation (sources: S&P Global, company reports) * *

Net Interest Margin (NIM) During 2017, NIM remained relatively consistent, reflecting increases in the Federal Reserve target federal funds rate and higher margin YCB net assets acquired but offset by higher funding costs and yield curve flatteningPositioned for asset sensitivity in a rising interest rate environmentTotal interest-bearing deposit costs during 2017 only increased 6 basis points year-over-year, benefiting from non-interest bearing deposits growing to 26% of total deposits and, potentially, our core deposit funding advantageDecline in yield curve since the end of 2016 and expectation for higher deposit betas provide NIM expansion headwindPotential exists for recent Federal tax reform benefits to be “competed away” over time by the industry through lower than normal loan yields and higher deposit costs 18 Net Interest Margin (FTE) Note: the “yield curve” represents the spread difference in the market yields for the 2-year and 10-year U.S. Treasury securities; the spread was ~125bp at 12/31/2016 and declined to ~55bp at 12/31/2017 (source: Federal Reserve H.15 Selected Interest Rates)
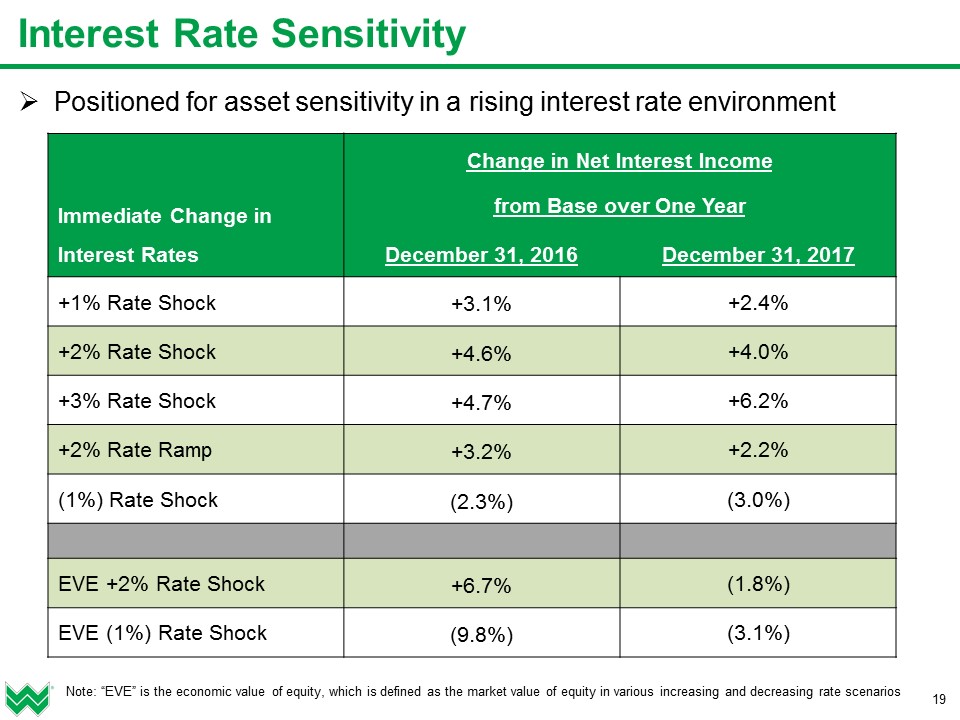
Interest Rate Sensitivity Positioned for asset sensitivity in a rising interest rate environment 19 Immediate Change in Interest Rates Change in Net Interest Incomefrom Base over One Year December 31, 2016 December 31, 2017 +1% Rate Shock +3.1% +2.4% +2% Rate Shock +4.6% +4.0% +3% Rate Shock +4.7% +6.2% +2% Rate Ramp +3.2% +2.2% (1%) Rate Shock (2.3%) (3.0%) EVE +2% Rate Shock +6.7% (1.8%) EVE (1%) Rate Shock (9.8%) (3.1%) Note: “EVE” is the economic value of equity, which is defined as the market value of equity in various increasing and decreasing rate scenarios

Strong legacy of credit and risk managementBased upon conservative underwriting standardsMature enterprise risk management program headed by Chief Risk Officer addressing key risks in all business lines and functional areasReports to board-level Risk CommitteeEnhancing strong compliance management systemStrong and scalable BSA/AML functionLiquidity, loan, and capital stress testing for post-$10 billion DFAST reportingStrong regulatory capital ratios well above regulatory requirementsSix consecutive “outstanding” CRA ratings since 2003 Risk Management and Regulatory Compliance 20 Basel III Tier 1 Risk-Based Capital Ratio Basel III Common Equity Tier 1 Capital Ratio Note: Your Community Bankshares merger closed September 9, 2016; 4Q17 Tier 1 Capital Ratios impacted by the $12.8 million net deferred tax asset revaluation, if excluded, the Risk-Based and Common Equity ratios would have been 14.22% and 12.24%, respectively

Appendix

First Sentry Bancshares Transaction Highlights Solidifies WesBanco’s position in the Huntington-Charleston corridorVery strong deposit market share in the Huntington-Ashland MSABridges the market gap between Charleston, West Virginia and Southeast OhioStrong local leadership to remain in placeGeoffrey Sheils, FTSB President & CEO, to become WesBanco market presidentHuntington market advisory board to be led by FTSB Chairman Robert Beymer, and comprised of current FTSB directorsHigh-performing commercial bank ROAA of 0.96%ROATCE of 13.36%Ability to leverage WSBC platform product suite through FTSB’s distributionTrust and wealth management revenue synergies expected, though not modeled 22 Strategic Rationale Financially Attractive Expected to be ~2.2% accretive to 2018 EPS and ~3.3% accretive to 2019 EPS(1) Tangible book value (“TBV”) dilution of ~1.2% at close TBV earn-back estimated to be ~2.5 years using the “crossover method”(2) and including all merger-related expenses, purchase accounting adjustments, and cost savingsDouble-digit internal rate of returnPro-forma capital ratios remain substantially in excess of “well-capitalized” guidelines Note: as presented and disclosed in conjunction with the announcement of the merger agreement with First Sentry Bancshares on November 13, 2017 (1) Excludes merger-related charges; assumes 75% cost savings phase-in 2018 and 100% phase-in thereafter (2) Crossover method defined as the number of years for projected pro forma TBV per share to exceed projected stand-alone TBV per share

Excludes loans held for saleNote: as presented and disclosed in conjunction with the announcement of the merger agreement with First Sentry Bancshares on November 13, 2017; location and financial data as of 9/30/17 (source: S&P Global) First Sentry Bancshares Strategic Rationale 23 Strengthens WesBanco’s franchise by bridging existing markets in Charleston, West Virginia and Southeast OhioRetention of experienced local management team and key business generators to preserve franchise valueHigh-performing commercial banking franchise with strong deposit growthOpportunity to increase revenue by introducing WesBanco’s wealth management, expanded lending abilities, and treasury management products to the marketplace Comparatively priced transaction with compelling financial metrics

Stock Performance: Long-Term Cumulative Return 24 Note: cumulative return since WSBC IPO compared to the cumulative return for the S&P500 Index over the same time period

Executive Position Years in Banking Years atWSBC James Gardill Chairman of the Board 45* 45 Todd Clossin President & Chief Executive Officer 34 5 Robert Young EVP – Chief Financial Officer 32 17 Lynn Asensio EVP – Retail Administration 40 13 Ivan Burdine EVP – Chief Credit Officer 38 5 Jonathan Dargusch EVP – Wealth Management 37 8 Steve Lawrence EVP – Chief Internal Auditor 38 24 Michael Perkins EVP – Chief Risk & Administration Officer 23 23 Anthony Pietranton EVP – Human Resources 30** 5 Brent Richmond EVP – Treasury & Strategic Planning 33 16 Jayson Zatta EVP – Chief Banking Officer 32 10 Experienced and Stable Management Team * as legal counsel to WesBanco ** in financial services, including nine in banking 25
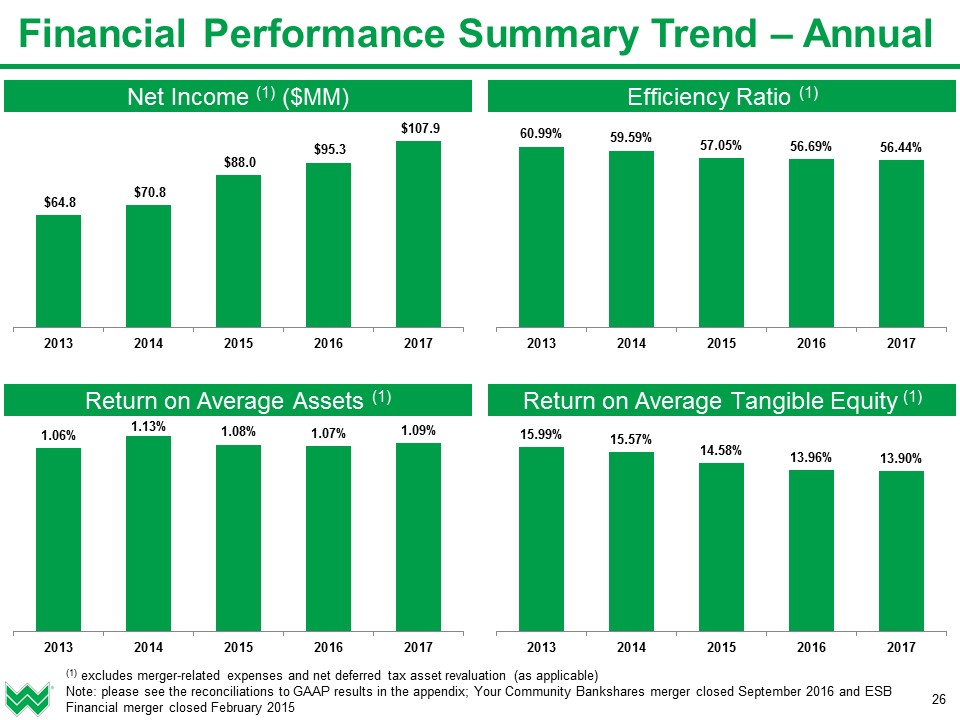
Financial Performance Summary Trend – Annual 26 Efficiency Ratio (1) Net Income (1) ($MM) (1) excludes merger-related expenses and net deferred tax asset revaluation (as applicable)Note: please see the reconciliations to GAAP results in the appendix; Your Community Bankshares merger closed September 2016 and ESB Financial merger closed February 2015 Return on Average Tangible Equity (1) Return on Average Assets (1)

Loan loss allowance decline due to improvement in credit quality Legacy Loan Loss Allowance and Total Loans Non-Performing Assets to Total Assets Net Charge-Offs as % of Average Loans NPAs to Total Loans, OREO & Repossessed Assets Diligent Focus on Credit Quality – Annual Trend 27 Note: please see the reconciliations to GAAP results in the appendix; Your Community Bankshares merger closed September 2016 and ESB Financial merger closed February 2015; “Legacy” as defined in WSBC’s ALLL model glossary are “loans that were originated by WesBanco Bank, Inc.”

Reconciliation: Efficiency Ratio 28 Note: “efficiency ratio” is non-interest expense excluding restructuring and merger-related expense divided by total income; FTE represents fully taxable equivalent; Your Community Bankshares merger closed September 2016 and ESB Financial merger closed February 2015

Reconciliation: Net Income and EPS (Diluted) 29 Note: Your Community Bankshares merger closed September 2016 and ESB Financial merger closed February 2015

30 (1) three-, six-, and nine-month (as applicable) figures are annualizedNote: Your Community Bankshares merger closed September 2016 and ESB Financial merger closed February 2015 Reconciliation: Return on Average Assets

31 (1) three-, six-, and nine-month (as applicable) figures are annualized; amortization of intangibles tax effected at 35%Note: Your Community Bankshares merger closed September 2016 and ESB Financial merger closed February 2015 Reconciliation: Return on Average Tangible Equity

32 Note: Your Community Bankshares merger closed September 2016 and ESB Financial merger closed February 2015; “Legacy” as defined in WSBC’s ALLL model glossary are “loans that were originated by WesBanco Bank, Inc.” Reconciliation: Legacy Loan Loss Allowance and Total Loans