Attached files
| file | filename |
|---|---|
| EX-32 - CERTIFICATIONS UNDER SECTION 906 OF THE SARBANES-OXLEY ACT OF 2002 - FASTENAL CO | fast1231201710-kexhibit32.htm |
| EX-31 - CERTIFICATIONS UNDER SECTION 302 OF THE SARBANES-OXLEY ACT OF 2002 - FASTENAL CO | fast1231201710-kexhibit31.htm |
| EX-23 - CONSENT OF INDEPENDENT REGISTERED PUBLIC ACCOUNTING FIRM - FASTENAL CO | fast1231201710-kexhibit23.htm |
| EX-21 - SUBSIDIARIES OF FASTENAL COMPANY - FASTENAL CO | fast1231201710-kexhibit21.htm |
| EX-10.1 - BONUS PROGRAM FOR EXECUTIVE OFFICERS - FASTENAL CO | fast1231201710-kexhibit101.htm |
| 10-K - 10-K - FASTENAL CO | fast1231201710-k.htm |
2017 ANNUAL REPORT
9706257 | 2017 Annual Report | 2.18 KV | Printed in the USA
2017 ANNUAL REPORT

2017 ANNUAL REPORT 2017 ANNUAL REPORT
CO
UN
TR
IES
W
ITH I
N-MARKET LOCATION
S
JAMES C. JANSEN
Executive Vice President - Manufacturing
HOLDEN LEWIS
Executive Vice President and
Chief Financial Officer
LELAND J. HEIN
Senior Executive Vice President - Sales
SHERYL A. LISOWSKI
Controller, Chief Accounting Officer,
and Treasurer
DANIEL L. FLORNESS
President and Chief Executive Officer
WILLIAM J. DRAZKOWSKI
Executive Vice President -
National Accounts Sales
EXECUTIVE OFFICER
S
ANNUAL
MEETING
The annual meeting of shareholders
will be held at 10:00 a.m., central
time, April 24, 2018, at our home
office located at 2001 Theurer
Boulevard, Winona, Minnesota.
HOME
OFFICE
Fastenal Company
2001 Theurer Boulevard
Winona, Minnesota 55987-0978
Phone: (507) 454-5374
Fax: (507) 453-8049
LEGAL
COUNSEL
INDEPENDENT
REGISTERED PUBLIC
ACCOUNTING FIRM
Faegre Baker Daniels LLP
Minneapolis, Minnesota
KPMG LLP
Minneapolis, Minnesota
FORM
10-K
TRANSFER
AGENT
A copy of our 2017 Annual
Report on Form 10-K filed with
the Securities and Exchange
Commission is available without
charge to shareholders upon written
request to internal audit at the
address of our home office listed on
this page.
Copies of our latest press releases,
unaudited supplemental company
information, and monthly sales
information are available at:
http://investor.fastenal.com.
Equiniti Trust Company
Mendota Heights, Minnesota
CORPOR
ATE INFORM
ATIO
N
$4.4 BILLIO
N
NET SALE
S
NET EARNING
S
$578.6 MILLIO
N
TABLE OF CONTENTS
1-3 Letter to Shareholders
4-5 10-Year Selected Financial
Data & Financial Highlights
6 Stock and Financial Data
MICHAEL J. DOLAN
Self-Employed Business Consultant,
Retired Executive Vice President and
Chief Operating Officer,
The Smead Manufacturing Company
SCOTT A. SATTERLEE
Retired President of North America
Surface Transportation Division, C.H.
Robinson Worldwide, Inc.
RITA J. HEISE
Self-Employed Business Consultant,
Retired Corporate Vice President and
Chief Information Officer of
Cargill, Incorporated
STEPHEN L. EASTMAN
President of the Parts, Garments,
and Accessories Division of
Polaris Industries Inc.
(recreational vehicle manufacturer)
DANIEL L. JOHNSON
President and Chief Executive Officer of
M.A. Mortenson Company (family owned
construction company)
REYNE K. WISECUP
DARREN R. JACKSON
Retired Chief Executive Officer,
Advance Auto Parts, Inc.
WILLARD D. OBERTON
Chairman of the Board, Retired President
and Chief Executive Officer,
Fastenal Company
MICHAEL J. ANCIUS
Vice President and Chief Financial Officer,
A.L.M. Holding Company
(construction and energy company)DIRECTOR
S
DANIEL L. FLORNESS
NO. OF FASTENAL SCHOOL OF
BUSINESS COURSE COMPLETIONS
655,261
BRANCHES
2,383
INVENTORY VALUE
$1.1 BILLION
NO. OF ORDERS PROCESSED
37,641,814
20,565
EMPLOYEES
127,000+
EMPLOYEE SAFETY
COACHING, TRAINING, &
INSPECTION EVENTS
GLANCE
FASTENAL
AT A
143 MILLIONMILES DELIVERED 834DELIVEREDMILLION POUNDS
50,000+
BIN STOCKS
ACTIVE
605
ONSITE
LOCATIONS 71,000
+
VENDING MACHINES INSTALLED
DAILY SALES
GROWTH TO
CUSTOMERS
WITH VENDING
13.2%
GARY A. POLIPNICK
Executive Vice President -
FAST Solutions®
REYNE K. WISECUP
Senior Executive Vice President -
Human Resources
JEFFERY M. WATTS
Executive Vice President -
International Sales
TERRY M. OWEN
Senior Executive Vice President -
Sales Operations
JOHN L. SODERBERG
Executive Vice President -
Information Technology
CHARLES S. MILLER
Executive Vice President - Sales
7 Stock Performance Highlights
8 A Deeper Level of Value
INSIDE
BACK
COVER
Directors
Executive Officers
Corporate Information
NICHOLAS J. LUNDQUIST
Senior Executive Vice President -
Operations
24
2017 ANNUAL REPORT
1
LETTER TO
SHAREHOLDERS
A Good Year for the Blue Team
Our 50th year was a good year for Fastenal, a year for our
customers and employees to experience improving success, a
year for our suppliers to participate in this success, and a year for
our shareholders to enjoy a return on their investment.
It was also a year to remind us about the nature of Fastenal.
We believe in people. We believe we can accomplish anything
if everyone in the organization pursues a common goal. And we
believe we can accomplish our goals faster if we unleash the vast
human potential within the organization.
We have a common goal; it’s Growth Through Customer Service.
We also have a means to unleash our potential; it’s called
challenging each other, providing great training, and operating
with a decentralized decision-making mindset.
What a difference a couple of years can make.
At the end of 2015, our customers were experiencing a weak
economy and we were struggling for growth. We closed out the
year with a daily sales contraction of about 2% during the fourth
quarter. In 2016, we worked extremely hard, but it often felt like
we were running in place.
We found our footing as we stepped into 2017. We also started to
‘Think Big,’ and we rekindled our belief in our ability to grow faster.
For the year, we grew our sales around 11% and grew our pre-tax
earnings around 11% – a return to double digits on both fronts. We
are proud of this accomplishment.
Here is a quick recap of 2017. In the first quarter we grew both
sales and pre-tax earnings around 6%, a welcome improvement.
Our momentum continued in the second quarter as we grew our
sales around 11% and our pre-tax earnings around 13%. We were
excited to create some leverage in the business. (For this purpose,
we define leverage as pre-tax earnings growing faster than sales.)
In the third quarter we grew both our sales and pre-tax earnings
around 12%. That was less satisfying than the second quarter. We
understand our growth drivers, and we understand that our primary
growth drivers carry a lower gross profit margin contribution. This
challenges our gross profit margins as our sales mix changes.
Our complementary challenge is simply to manage our operating
expenses as this sales mix change progresses.
These aren’t new comments, but they’re worth repeating. Our lack
of leverage in the third quarter did raise some concerns for us. We
believe we should be able to leverage 12% revenue growth. That
said, there are a couple of items worth noting about the quarter.
First, there was one less business day (63 days in 2017 versus
64 days in 2016). One less day means about $18 million less in
sales; however, certain expenses are linked to the month, not the
day, and they don’t drop when we lose a business day. Examples
include base payroll dollars, benefits, vehicle payments, insurance,
and occupancy. This hurts our gross profit percentage as freight
utilization suffers. It also hurts our operating expense percentage
as facility and people utilization suffers.
The second item centers on people costs and on our aggressive
ramp-up related to our Onsite rollout. Late in 2016, we modified
our branch manager compensation formula. This change, when
combined with an added element to reward for Onsite revenue
growth, added to our expense growth. We have also been
aggressively adding resources to vet and implement new Onsite
locations. We view this as a great long-term investment, but it did
create some added expenses in the near term. These two items
will also impact subsequent quarters.
This brings us to the fourth quarter, when we grew our sales about
15%. Given the relatively strong gross profit margin performance
in the fourth quarter of 2016, we did not expect to leverage our
pre-tax earnings; however, we did expect pre-tax earnings to grow
within two or three percentage points of sales growth. We fell just
shy of this and grew our pre-tax earnings about 11%. We moved a
bit too slowly on challenging our gross profit margins. As president
and CEO, that’s on me. With that said, I’m glad we continued to
invest in our future. This will serve us well in 2018.
You might have noticed the discussion above was focused on
sales growth and pre-tax earnings growth. The recent income
tax changes in the United States had a meaningful impact on our
fourth quarter net earnings – our tax expense dropped and our
net earnings grew faster. By focusing our discussion on pre-tax
results, we were able to provide you with a more ‘straightforward’
discussion. (We like straightforward.)
You may be wondering why a tax law signed in 2017 and effective
in 2018 would impact our net earnings in the fourth quarter of
2017. This relates to the tax liabilities we had previously recorded
on our financial statements for deferred taxes. To make a long
story short, these liabilities (which will come due in future years)
were recorded using the old income tax rates but will be paid using
the new income tax rates. The accounting rules stipulate that we
recognize this impact in the quarter the tax law is signed, hence
our recognition in the fourth quarter of 2017.
We also expect that the recent income tax changes will continue to
have a meaningful impact on our results. This impact is magnified
by the global mix of our business, which remains ‘U.S.-centric’
despite our continued international expansion. From an historical
perspective, we didn’t start to expand our global footprint until we
entered Canada in the mid-1990s. Because of this, our business
in the United States enjoyed a 30-year ‘head start’ and continues
to generate over 85% of our sales and profits. As a result, our
2017 ANNUAL REPORT
2
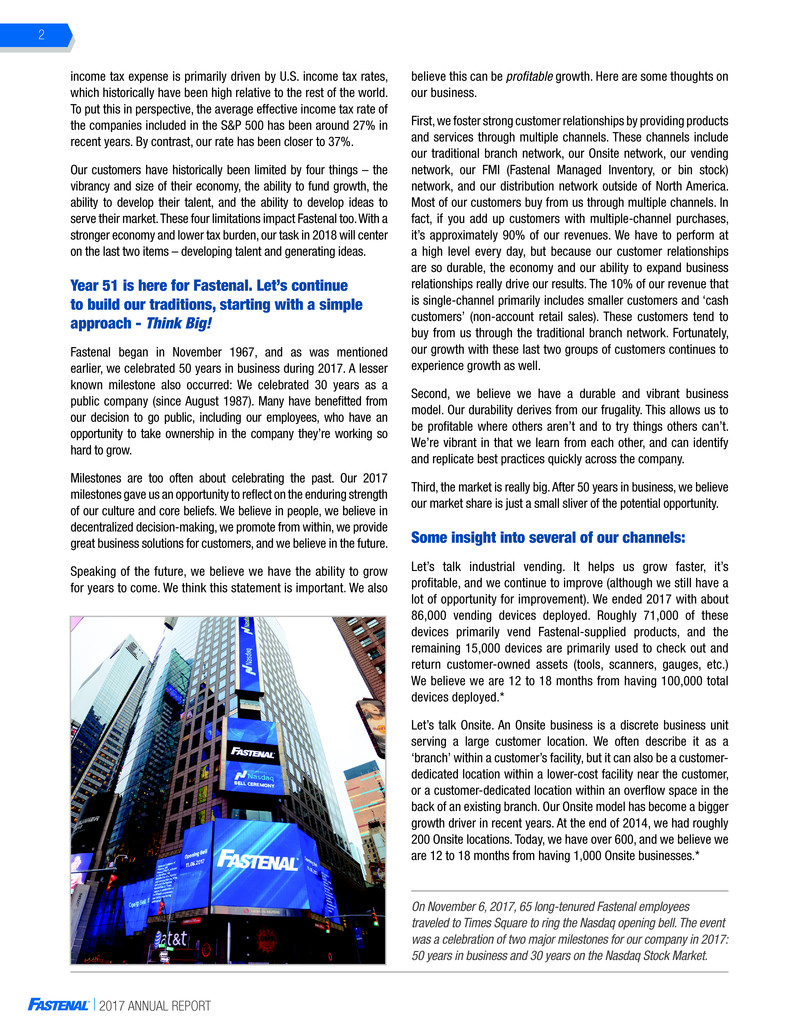
On November 6, 2017, 65 long-tenured Fastenal employees
traveled to Times Square to ring the Nasdaq opening bell. The event
was a celebration of two major milestones for our company in 2017:
50 years in business and 30 years on the Nasdaq Stock Market.
income tax expense is primarily driven by U.S. income tax rates,
which historically have been high relative to the rest of the world.
To put this in perspective, the average effective income tax rate of
the companies included in the S&P 500 has been around 27% in
recent years. By contrast, our rate has been closer to 37%.
Our customers have historically been limited by four things – the
vibrancy and size of their economy, the ability to fund growth, the
ability to develop their talent, and the ability to develop ideas to
serve their market. These four limitations impact Fastenal too. With a
stronger economy and lower tax burden, our task in 2018 will center
on the last two items – developing talent and generating ideas.
Year 51 is here for Fastenal. Let’s continue
to build our traditions, starting with a simple
approach - Think Big!
Fastenal began in November 1967, and as was mentioned
earlier, we celebrated 50 years in business during 2017. A lesser
known milestone also occurred: We celebrated 30 years as a
public company (since August 1987). Many have benefitted from
our decision to go public, including our employees, who have an
opportunity to take ownership in the company they’re working so
hard to grow.
Milestones are too often about celebrating the past. Our 2017
milestones gave us an opportunity to reflect on the enduring strength
of our culture and core beliefs. We believe in people, we believe in
decentralized decision-making, we promote from within, we provide
great business solutions for customers, and we believe in the future.
Speaking of the future, we believe we have the ability to grow
for years to come. We think this statement is important. We also
believe this can be profitable growth. Here are some thoughts on
our business.
First, we foster strong customer relationships by providing products
and services through multiple channels. These channels include
our traditional branch network, our Onsite network, our vending
network, our FMI (Fastenal Managed Inventory, or bin stock)
network, and our distribution network outside of North America.
Most of our customers buy from us through multiple channels. In
fact, if you add up customers with multiple-channel purchases,
it’s approximately 90% of our revenues. We have to perform at
a high level every day, but because our customer relationships
are so durable, the economy and our ability to expand business
relationships really drive our results. The 10% of our revenue that
is single-channel primarily includes smaller customers and ‘cash
customers’ (non-account retail sales). These customers tend to
buy from us through the traditional branch network. Fortunately,
our growth with these last two groups of customers continues to
experience growth as well.
Second, we believe we have a durable and vibrant business
model. Our durability derives from our frugality. This allows us to
be profitable where others aren’t and to try things others can’t.
We’re vibrant in that we learn from each other, and can identify
and replicate best practices quickly across the company.
Third, the market is really big. After 50 years in business, we believe
our market share is just a small sliver of the potential opportunity.
Some insight into several of our channels:
Let’s talk industrial vending. It helps us grow faster, it’s
profitable, and we continue to improve (although we still have a
lot of opportunity for improvement). We ended 2017 with about
86,000 vending devices deployed. Roughly 71,000 of these
devices primarily vend Fastenal-supplied products, and the
remaining 15,000 devices are primarily used to check out and
return customer-owned assets (tools, scanners, gauges, etc.)
We believe we are 12 to 18 months from having 100,000 total
devices deployed.*
Let’s talk Onsite. An Onsite business is a discrete business unit
serving a large customer location. We often describe it as a
‘branch’ within a customer’s facility, but it can also be a customer-
dedicated location within a lower-cost facility near the customer,
or a customer-dedicated location within an overflow space in the
back of an existing branch. Our Onsite model has become a bigger
growth driver in recent years. At the end of 2014, we had roughly
200 Onsite locations. Today, we have over 600, and we believe we
are 12 to 18 months from having 1,000 Onsite businesses.*

2017 ANNUAL REPORT
3
DANIEL L. FLORNESS
President and Chief Executive Officer
* We don’t have a crystal ball. This is neither a prediction nor a target; it’s our stated belief in the future.
We often speak about national accounts and government accounts.
These aren’t channels; they’re customer types. What makes
them different is we utilize a non-branch sales force to cultivate
and grow these relationships (although local branch and Onsite
personnel provide most of the delivery and stocking services). We
have a great sales team, and they are operating at a very high
level. These two customer groups represent just over 50% of our
revenue and contribute nearly 70% of our growth.
Our 50-year-old business evolves.
We have some core beliefs, and these beliefs typically manifest
in our strategy. We believe our marketplace can be under-served
by traditional distribution; therefore, we live by a Growth Through
Customer Service motto. We believe proximity to our customer is
a key ingredient to service; therefore, we operate a very frugal
business ethic to stretch our ability to operate smaller distribution
locations close to our customer. Finally, we know the needs of
our customers, the nature of our competitive landscape, and the
location of our marketplace change every day; therefore, we need
to evolve and understand our marketplace to provide success for
our customers, our employees, our suppliers, and our shareholders.
Here are two perspectives – one on our evolution over the last 15
years focused on time, the other on marketplace differences.
Time – In the five-year period from 2003 to 2007 we opened
around 1,000 branch locations and we closed/consolidated seven.
The number of Onsite businesses increased from around 75 to
130, and the number of deployed vending devices went from very
few to still very few.
In the five-year period from 2008 to 2012 we opened around
550 branch locations and we closed/consolidated around 65. The
number of Onsite businesses increased from around 130 to 160,
and the number of deployed vending devices went from very few
to around 21,000.
In the five-year period from 2013 to 2017 we opened approximately
175 branch locations; however, we closed/consolidated around
450. The number of Onsite businesses increased from around 160
to over 600, and the number of deployed vending devices went
from around 21,000 to around 86,000. This evolution positions us
to provide a greater service from an ever closer proximity.
Markets – We operate in individual marketplaces (cities) ranging
from large to small. We think of it as three distinct markets.
Large markets: In the United States, there are approximately
100 Major MSAs (defined as Metropolitan Statistical Areas with
a population over 500,000 people). The Large MSA markets
represent just over half of our revenues, just over half of our branch
locations, and just over half of our Onsite locations.
Smaller Markets: In the United States, we track approximately
170 Small MSAs (defined as Metropolitan Statistical Areas with a
population under 500,000 people). Our home office is located in one
of these Small MSAs, an area that includes La Crosse, Wisconsin
and Winona, Minnesota. The Small MSA markets represent just
over 15% of our revenues, around 15% of our branch locations,
and just over 15% of our Onsite locations.
Markets ignored by others: For lack of a better term, we refer to
the rest as our ‘Non-MSA’ markets (primarily smaller towns and
rural areas). The Non-MSA markets represent about a third of our
revenues, about a third of our branch locations, and about a third
of our Onsite locations.
I personally find this information really exciting because our
business model is successful in various channels (branch, Onsite,
vending, FMI, etc.), in various economies (United States, Canada,
Mexico, and overseas), and in a range of market sizes, from major
cities to small towns. It all adds up to a lot of great opportunities
for members of the Blue Team to be successful serving customers.
Finally, some thoughts on our obligations:
After two years in this role, I try to be honest about the quality
and type of leadership I provide. The Blue Team deserves great
leadership every day. If you flip to the inside back cover of this
report, you will see a group of talented, dedicated, and diverse
leaders. If you look deeper into the organization, you will see an
incredible depth of talent and potential – we are fortunate.
When thinking about my obligation to our team, several thoughts
come to mind: (1) to communicate, (2) to listen, and (3) to challenge
the team to Think Big!
When thinking about the obligations of every Fastenal employee to
each other, again several thoughts come to mind: (1) be willing to
learn and change, (2) be willing to help each other succeed, and
(3) be willing to challenge each other to Think Big!
And finally, a few overriding obligations for everyone at Fastenal:
(1) Create opportunities for your customers and for your employees
every day. (2) Think Big! This means - have a plan, stretch yourself,
and vet your business plan with those around you (your team, your
peers, your mentor or leader). (3) Make wise decisions.
Thank you for your belief in Fastenal, and thank you for being a
shareholder. We will endeavor to make wise decisions every day
as we embark on our next 50 years of Growth Through Customer
Service.
Sincerely,
2017 ANNUAL REPORT
4
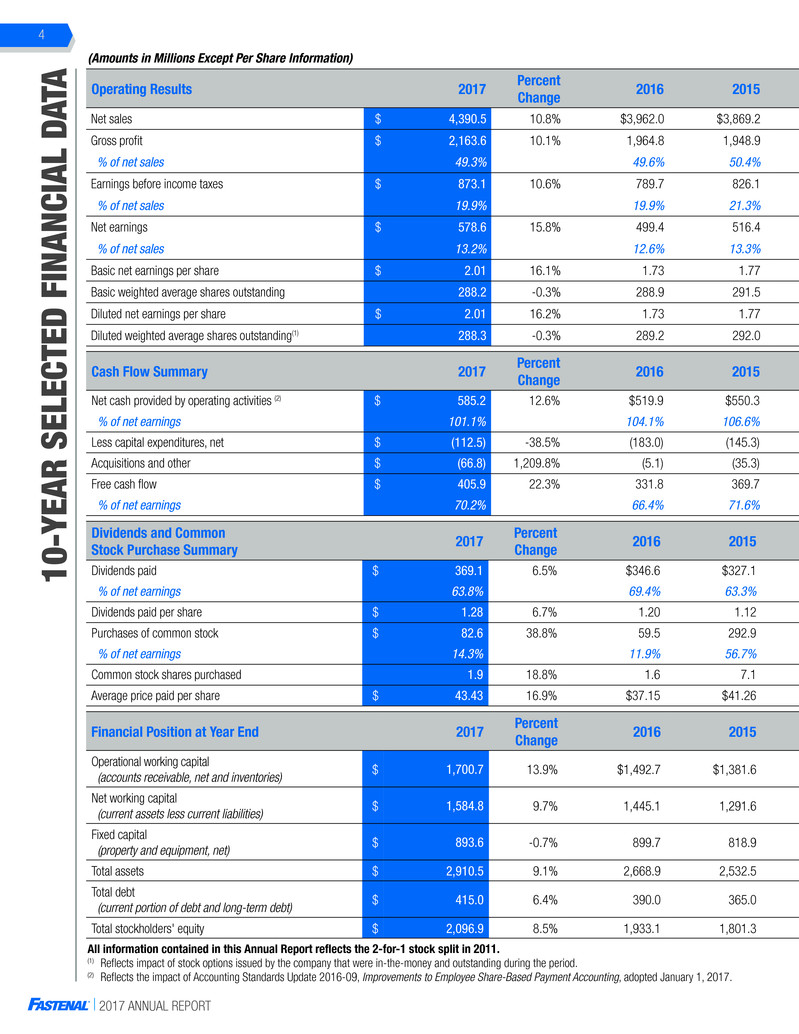
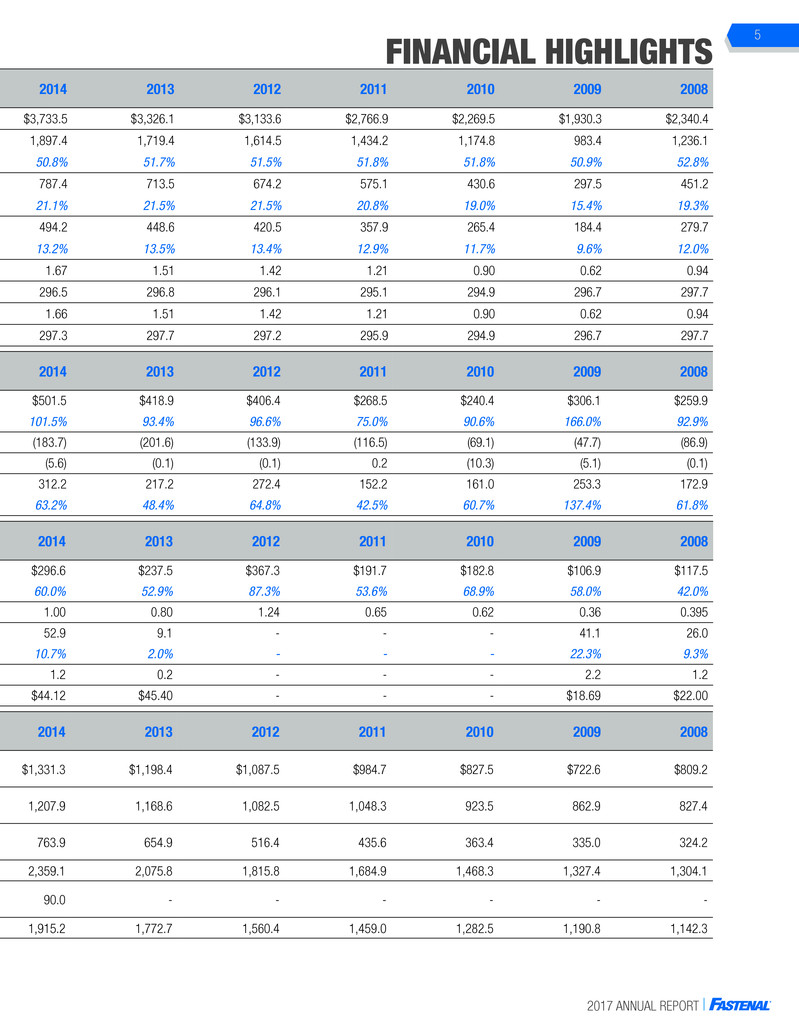
Operating Results 2017 Percent Change 2016 2015 2014 2013 2012 2011 2010 2009 2008
Net sales $ 4,390.5 10.8% $3,962.0 $3,869.2 $3,733.5 $3,326.1 $3,133.6 $2,766.9 $2,269.5 $1,930.3 $2,340.4
Gross profit $ 2,163.6 10.1% 1,964.8 1,948.9 1,897.4 1,719.4 1,614.5 1,434.2 1,174.8 983.4 1,236.1
% of net sales 49.3% 49.6% 50.4% 50.8% 51.7% 51.5% 51.8% 51.8% 50.9% 52.8%
Earnings before income taxes $ 873.1 10.6% 789.7 826.1 787.4 713.5 674.2 575.1 430.6 297.5 451.2
% of net sales 19.9% 19.9% 21.3% 21.1% 21.5% 21.5% 20.8% 19.0% 15.4% 19.3%
Net earnings $ 578.6 15.8% 499.4 516.4 494.2 448.6 420.5 357.9 265.4 184.4 279.7
% of net sales 13.2% 12.6% 13.3% 13.2% 13.5% 13.4% 12.9% 11.7% 9.6% 12.0%
Basic net earnings per share $ 2.01 16.1% 1.73 1.77 1.67 1.51 1.42 1.21 0.90 0.62 0.94
Basic weighted average shares outstanding 288.2 -0.3% 288.9 291.5 296.5 296.8 296.1 295.1 294.9 296.7 297.7
Diluted net earnings per share $ 2.01 16.2% 1.73 1.77 1.66 1.51 1.42 1.21 0.90 0.62 0.94
Diluted weighted average shares outstanding(1) 288.3 -0.3% 289.2 292.0 297.3 297.7 297.2 295.9 294.9 296.7 297.7
Dividends and Common
Stock Purchase Summary 2017
Percent
Change 2016 2015 2014 2013 2012 2011 2010 2009 2008
Dividends paid $ 369.1 6.5% $346.6 $327.1 $296.6 $237.5 $367.3 $191.7 $182.8 $106.9 $117.5
% of net earnings 63.8% 69.4% 63.3% 60.0% 52.9% 87.3% 53.6% 68.9% 58.0% 42.0%
Dividends paid per share $ 1.28 6.7% 1.20 1.12 1.00 0.80 1.24 0.65 0.62 0.36 0.395
Purchases of common stock $ 82.6 38.8% 59.5 292.9 52.9 9.1 - - - 41.1 26.0
% of net earnings 14.3% 11.9% 56.7% 10.7% 2.0% - - - 22.3% 9.3%
Common stock shares purchased 1.9 18.8% 1.6 7.1 1.2 0.2 - - - 2.2 1.2
Average price paid per share $ 43.43 16.9% $37.15 $41.26 $44.12 $45.40 - - - $18.69 $22.00
Financial Position at Year End 2017 Percent Change 2016 2015 2014 2013 2012 2011 2010 2009 2008
Operational working capital
(accounts receivable, net and inventories) $ 1,700.7 13.9% $1,492.7 $1,381.6 $1,331.3 $1,198.4 $1,087.5 $984.7 $827.5 $722.6 $809.2
Net working capital
(current assets less current liabilities) $ 1,584.8 9.7% 1,445.1 1,291.6 1,207.9 1,168.6 1,082.5 1,048.3 923.5 862.9 827.4
Fixed capital
(property and equipment, net) $ 893.6 -0.7% 899.7 818.9 763.9 654.9 516.4 435.6 363.4 335.0 324.2
Total assets $ 2,910.5 9.1% 2,668.9 2,532.5 2,359.1 2,075.8 1,815.8 1,684.9 1,468.3 1,327.4 1,304.1
Total debt
(current portion of debt and long-term debt) $ 415.0 6.4% 390.0 365.0 90.0 - - - - - -
Total stockholders' equity $ 2,096.9 8.5% 1,933.1 1,801.3 1,915.2 1,772.7 1,560.4 1,459.0 1,282.5 1,190.8 1,142.3
All information contained in this Annual Report reflects the 2-for-1 stock split in 2011.
(1) Reflects impact of stock options issued by the company that were in-the-money and outstanding during the period.
(2) Reflects the impact of Accounting Standards Update 2016-09, Improvements to Employee Share-Based Payment Accounting, adopted January 1, 2017.
(Amounts in Millions Except Per Share Information)
10-YEAR SELECTED FINANCIAL
DA
TA
Cash Flow Summary 2017 Percent Change 2016 2015 2014 2013 2012 2011 2010 2009 2008
Net cash provided by operating activities (2) $ 585.2 12.6% $519.9 $550.3 $501.5 $418.9 $406.4 $268.5 $240.4 $306.1 $259.9
% of net earnings 101.1% 104.1% 106.6% 101.5% 93.4% 96.6% 75.0% 90.6% 166.0% 92.9%
Less capital expenditures, net $ (112.5) -38.5% (183.0) (145.3) (183.7) (201.6) (133.9) (116.5) (69.1) (47.7) (86.9)
Acquisitions and other $ (66.8) 1,209.8% (5.1) (35.3) (5.6) (0.1) (0.1) 0.2 (10.3) (5.1) (0.1)
Free cash flow $ 405.9 22.3% 331.8 369.7 312.2 217.2 272.4 152.2 161.0 253.3 172.9
% of net earnings 70.2% 66.4% 71.6% 63.2% 48.4% 64.8% 42.5% 60.7% 137.4% 61.8%
2017 ANNUAL REPORT
5
Operating Results 2017 Percent Change 2016 2015 2014 2013 2012 2011 2010 2009 2008
Net sales $ 4,390.5 10.8% $3,962.0 $3,869.2 $3,733.5 $3,326.1 $3,133.6 $2,766.9 $2,269.5 $1,930.3 $2,340.4
Gross profit $ 2,163.6 10.1% 1,964.8 1,948.9 1,897.4 1,719.4 1,614.5 1,434.2 1,174.8 983.4 1,236.1
% of net sales 49.3% 49.6% 50.4% 50.8% 51.7% 51.5% 51.8% 51.8% 50.9% 52.8%
Earnings before income taxes $ 873.1 10.6% 789.7 826.1 787.4 713.5 674.2 575.1 430.6 297.5 451.2
% of net sales 19.9% 19.9% 21.3% 21.1% 21.5% 21.5% 20.8% 19.0% 15.4% 19.3%
Net earnings $ 578.6 15.8% 499.4 516.4 494.2 448.6 420.5 357.9 265.4 184.4 279.7
% of net sales 13.2% 12.6% 13.3% 13.2% 13.5% 13.4% 12.9% 11.7% 9.6% 12.0%
Basic net earnings per share $ 2.01 16.1% 1.73 1.77 1.67 1.51 1.42 1.21 0.90 0.62 0.94
Basic weighted average shares outstanding 288.2 -0.3% 288.9 291.5 296.5 296.8 296.1 295.1 294.9 296.7 297.7
Diluted net earnings per share $ 2.01 16.2% 1.73 1.77 1.66 1.51 1.42 1.21 0.90 0.62 0.94
Diluted weighted average shares outstanding(1) 288.3 -0.3% 289.2 292.0 297.3 297.7 297.2 295.9 294.9 296.7 297.7
Dividends and Common
Stock Purchase Summary 2017
Percent
Change 2016 2015 2014 2013 2012 2011 2010 2009 2008
Dividends paid $ 369.1 6.5% $346.6 $327.1 $296.6 $237.5 $367.3 $191.7 $182.8 $106.9 $117.5
% of net earnings 63.8% 69.4% 63.3% 60.0% 52.9% 87.3% 53.6% 68.9% 58.0% 42.0%
Dividends paid per share $ 1.28 6.7% 1.20 1.12 1.00 0.80 1.24 0.65 0.62 0.36 0.395
Purchases of common stock $ 82.6 38.8% 59.5 292.9 52.9 9.1 - - - 41.1 26.0
% of net earnings 14.3% 11.9% 56.7% 10.7% 2.0% - - - 22.3% 9.3%
Common stock shares purchased 1.9 18.8% 1.6 7.1 1.2 0.2 - - - 2.2 1.2
Average price paid per share $ 43.43 16.9% $37.15 $41.26 $44.12 $45.40 - - - $18.69 $22.00
Financial Position at Year End 2017 Percent Change 2016 2015 2014 2013 2012 2011 2010 2009 2008
Operational working capital
(accounts receivable, net and inventories) $ 1,700.7 13.9% $1,492.7 $1,381.6 $1,331.3 $1,198.4 $1,087.5 $984.7 $827.5 $722.6 $809.2
Net working capital
(current assets less current liabilities) $ 1,584.8 9.7% 1,445.1 1,291.6 1,207.9 1,168.6 1,082.5 1,048.3 923.5 862.9 827.4
Fixed capital
(property and equipment, net) $ 893.6 -0.7% 899.7 818.9 763.9 654.9 516.4 435.6 363.4 335.0 324.2
Total assets $ 2,910.5 9.1% 2,668.9 2,532.5 2,359.1 2,075.8 1,815.8 1,684.9 1,468.3 1,327.4 1,304.1
Total debt
(current portion of debt and long-term debt) $ 415.0 6.4% 390.0 365.0 90.0 - - - - - -
Total stockholders' equity $ 2,096.9 8.5% 1,933.1 1,801.3 1,915.2 1,772.7 1,560.4 1,459.0 1,282.5 1,190.8 1,142.3
All information contained in this Annual Report reflects the 2-for-1 stock split in 2011.
(1) Reflects impact of stock options issued by the company that were in-the-money and outstanding during the period.
(2) Reflects the impact of Accounting Standards Update 2016-09, Improvements to Employee Share-Based Payment Accounting, adopted January 1, 2017.
FINANCIAL HIGHLIGHTS
Cash Flow Summary 2017 Percent Change 2016 2015 2014 2013 2012 2011 2010 2009 2008
Net cash provided by operating activities (2) $ 585.2 12.6% $519.9 $550.3 $501.5 $418.9 $406.4 $268.5 $240.4 $306.1 $259.9
% of net earnings 101.1% 104.1% 106.6% 101.5% 93.4% 96.6% 75.0% 90.6% 166.0% 92.9%
Less capital expenditures, net $ (112.5) -38.5% (183.0) (145.3) (183.7) (201.6) (133.9) (116.5) (69.1) (47.7) (86.9)
Acquisitions and other $ (66.8) 1,209.8% (5.1) (35.3) (5.6) (0.1) (0.1) 0.2 (10.3) (5.1) (0.1)
Free cash flow $ 405.9 22.3% 331.8 369.7 312.2 217.2 272.4 152.2 161.0 253.3 172.9
% of net earnings 70.2% 66.4% 71.6% 63.2% 48.4% 64.8% 42.5% 60.7% 137.4% 61.8%

2017 ANNUAL REPORT
6
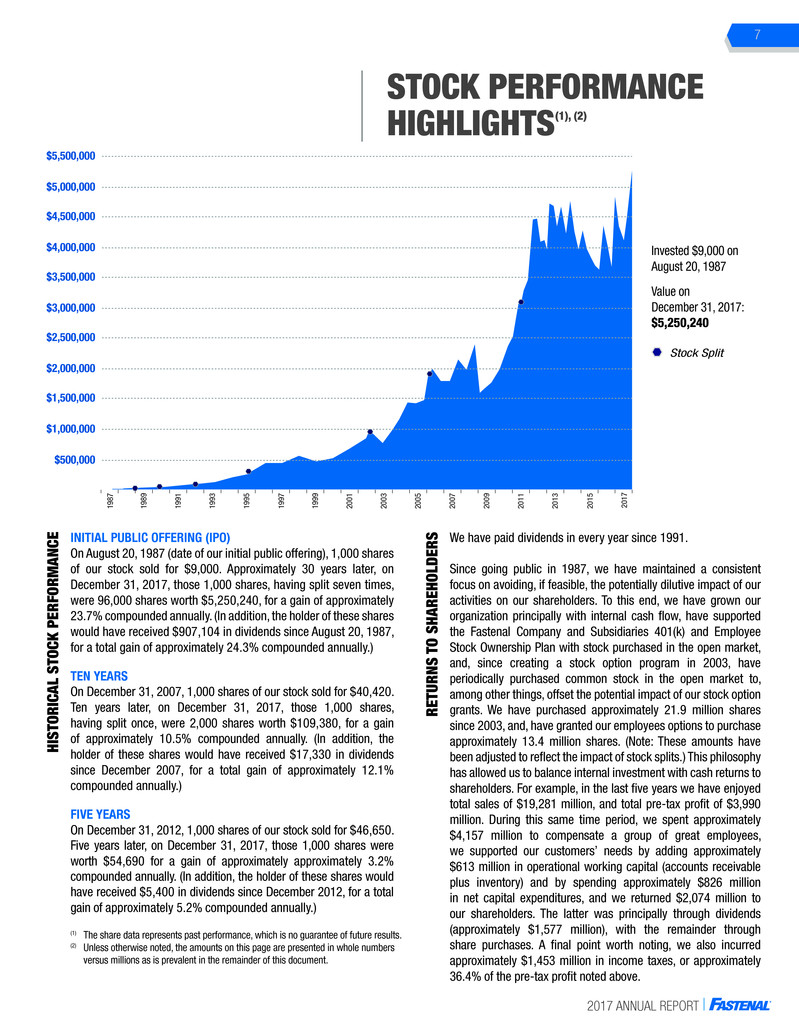
2017 High Low 2016 High Low
First quarter $52.22 $46.17 First quarter $49.87 $36.53
Second quarter 51.76 42.10 Second quarter 48.93 42.70
Third quarter 45.73 39.97 Third quarter 45.36 39.92
Fourth quarter 55.14 44.51 Fourth quarter 49.17 38.16
As of January 19, 2018, there were approximately 1,100 record holders of our common stock, which includes nominees or broker
dealers holding stock on behalf of an estimated 220,000 beneficial owners.
In 2017 and 2016, we paid dividends per share totaling $1.28 and $1.20, respectively. On January 16, 2018, we announced a
quarterly dividend of $0.37 per share to be paid on February 27, 2018 to shareholders of record at the close of business on January
31, 2018. Our board of directors intends to continue paying quarterly dividends, provided that any future determination as to
payment of dividends will depend upon the financial condition and results of operations of the company and such other factors as
are deemed relevant by the board of directors.
We purchased 1,900,000 shares of our common stock in 2017 at an average price of $43.43 per share. In 2016, we purchased
1,600,000 shares of our common stock at an average price of $37.15 per share.
Common Stock Data
Our shares are traded on The Nasdaq Stock Market under the symbol ‘FAST.’ The following
table sets forth, by quarter, the high and low closing sale price of our shares on The Nasdaq
Stock Market for the last two years(1).
2017 Net Sales
Gross
Profit
Pre-tax
Earnings
Net
Earnings
Basic
Net Earnings
per Share (1)
Diluted
Net Earnings
per Share (1)
First quarter 1,047.7 518.0 210.9 134.2 0.46 0.46
Second quarter 1,121.5 558.5 235.4 148.9 0.52 0.52
Third quarter 1,132.8 555.9 226.0 143.1 0.50 0.50
Fourth quarter 1,088.5 531.2 200.8 152.4 (2) 0.53 (2) 0.53 (2)
Total 4,390.5 2,163.6 873.1 578.6 (3) 2.01 (3) 2.01 (3)
2016 Net Sales
Gross
Profit
Pre-tax
Earnings
Net
Earnings
Basic
Net Earnings
per Share (1)
Diluted
Net Earnings
per Share (1)
First quarter 986.7 491.5 199.9 126.2 0.44 0.44
Second quarter 1,014.3 501.6 207.8 131.5 0.46 0.45
Third quarter 1,013.1 499.8 201.2 126.9 0.44 0.44
Fourth quarter 947.9 471.9 180.8 114.8 0.40 0.40
Total 3,962.0 1,964.8 789.7 499.4 1.73 1.73
(1) The closing sale price was obtained from Shareholder.com, a division of Nasdaq OMX.
STOCK
AND
FINANCIAL
DATA
SELECTED Q
UA
RTER
LY FINANCIAL
DA
TA (UN
AUDITED
)
(Dollar Amounts in Millions
Except Share and
Per Share Information)
(1) Amounts may not foot due to rounding difference.
(2) Absent the impact of the Tax Act, our net earnings for the fourth quarter of 2017 would have been approximately $128.1, and our basic and diluted net earnings
per share would have each been $0.45.
(3) Absent the impact of the Tax Act, our net earnings for 2017 would have been approximately $554.2, and our basic and diluted net earnings per share would
have each been $1.92.
$
$
$
$
2017 ANNUAL REPORT
7
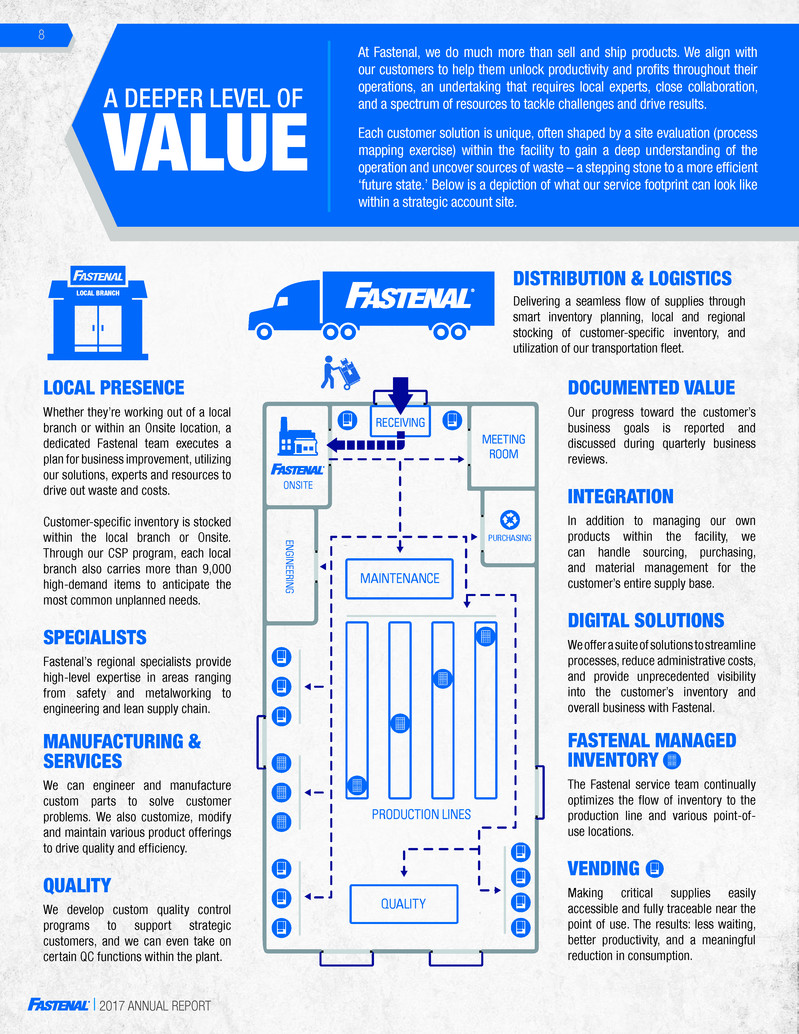
Invested $9,000 on
August 20, 1987
Value on
December 31, 2017:
$5,250,240
STOCK PERFORMANCE
HIGHLIGHTS(1), (2)
(1) The share data represents past performance, which is no guarantee of future results.
(2) Unless otherwise noted, the amounts on this page are presented in whole numbers
versus millions as is prevalent in the remainder of this document.
$1,000,000
$2,000,000
$3,000,000
$4,000,000
$5,000,000
$1,500,000
$500,000
$2,500,000
$3,500,000
$4,500,000
$5,500,000
198
7
198
9
199
1
199
3
199
5
199
7
199
9
200
1
200
3
200
5
200
7
200
9
201
1
201
3
201
5
201
7
Stock Split
INITIAL PUBLIC OFFERING (IPO)
On August 20, 1987 (date of our initial public offering), 1,000 shares
of our stock sold for $9,000. Approximately 30 years later, on
December 31, 2017, those 1,000 shares, having split seven times,
were 96,000 shares worth $5,250,240, for a gain of approximately
23.7% compounded annually. (In addition, the holder of these shares
would have received $907,104 in dividends since August 20, 1987,
for a total gain of approximately 24.3% compounded annually.)
TEN YEARS
On December 31, 2007, 1,000 shares of our stock sold for $40,420.
Ten years later, on December 31, 2017, those 1,000 shares,
having split once, were 2,000 shares worth $109,380, for a gain
of approximately 10.5% compounded annually. (In addition, the
holder of these shares would have received $17,330 in dividends
since December 2007, for a total gain of approximately 12.1%
compounded annually.)
FIVE YEARS
On December 31, 2012, 1,000 shares of our stock sold for $46,650.
Five years later, on December 31, 2017, those 1,000 shares were
worth $54,690 for a gain of approximately approximately 3.2%
compounded annually. (In addition, the holder of these shares would
have received $5,400 in dividends since December 2012, for a total
gain of approximately 5.2% compounded annually.)
HISTORICAL STOCK PERFORMANC
E
RETURNS
TO
SHAREHOLDER
S We have paid dividends in every year since 1991.
Since going public in 1987, we have maintained a consistent
focus on avoiding, if feasible, the potentially dilutive impact of our
activities on our shareholders. To this end, we have grown our
organization principally with internal cash flow, have supported
the Fastenal Company and Subsidiaries 401(k) and Employee
Stock Ownership Plan with stock purchased in the open market,
and, since creating a stock option program in 2003, have
periodically purchased common stock in the open market to,
among other things, offset the potential impact of our stock option
grants. We have purchased approximately 21.9 million shares
since 2003, and, have granted our employees options to purchase
approximately 13.4 million shares. (Note: These amounts have
been adjusted to reflect the impact of stock splits.) This philosophy
has allowed us to balance internal investment with cash returns to
shareholders. For example, in the last five years we have enjoyed
total sales of $19,281 million, and total pre-tax profit of $3,990
million. During this same time period, we spent approximately
$4,157 million to compensate a group of great employees,
we supported our customers’ needs by adding approximately
$613 million in operational working capital (accounts receivable
plus inventory) and by spending approximately $826 million
in net capital expenditures, and we returned $2,074 million to
our shareholders. The latter was principally through dividends
(approximately $1,577 million), with the remainder through
share purchases. A final point worth noting, we also incurred
approximately $1,453 million in income taxes, or approximately
36.4% of the pre-tax profit noted above.
QUALITY
PRODUCTION LINES
MAINTENANCE
MEETING
ROOM
PURCHASING
RECEIVING
ONSITE
ENGINEERING
2017 ANNUAL REPORT
8
LOCAL PRESENCE
Whether they’re working out of a local
branch or within an Onsite location, a
dedicated Fastenal team executes a
plan for business improvement, utilizing
our solutions, experts and resources to
drive out waste and costs.
Customer-specific inventory is stocked
within the local branch or Onsite.
Through our CSP program, each local
branch also carries more than 9,000
high-demand items to anticipate the
most common unplanned needs.
SPECIALISTS
Fastenal’s regional specialists provide
high-level expertise in areas ranging
from safety and metalworking to
engineering and lean supply chain.
MANUFACTURING &
SERVICES
We can engineer and manufacture
custom parts to solve customer
problems. We also customize, modify
and maintain various product offerings
to drive quality and efficiency.
QUALITY
We develop custom quality control
programs to support strategic
customers, and we can even take on
certain QC functions within the plant.
DOCUMENTED VALUE
Our progress toward the customer’s
business goals is reported and
discussed during quarterly business
reviews.
INTEGRATION
In addition to managing our own
products within the facility, we
can handle sourcing, purchasing,
and material management for the
customer’s entire supply base.
DIGITAL SOLUTIONS
We offer a suite of solutions to streamline
processes, reduce administrative costs,
and provide unprecedented visibility
into the customer’s inventory and
overall business with Fastenal.
FASTENAL MANAGED
INVENTORY
The Fastenal service team continually
optimizes the flow of inventory to the
production line and various point-of-
use locations.
VENDING
Making critical supplies easily
accessible and fully traceable near the
point of use. The results: less waiting,
better productivity, and a meaningful
reduction in consumption.
Delivering a seamless flow of supplies through
smart inventory planning, local and regional
stocking of customer-specific inventory, and
utilization of our transportation fleet.
A DEEPER LEVEL OF
LOCAL BRANCH
DISTRIBUTION & LOGISTICS
VALUE
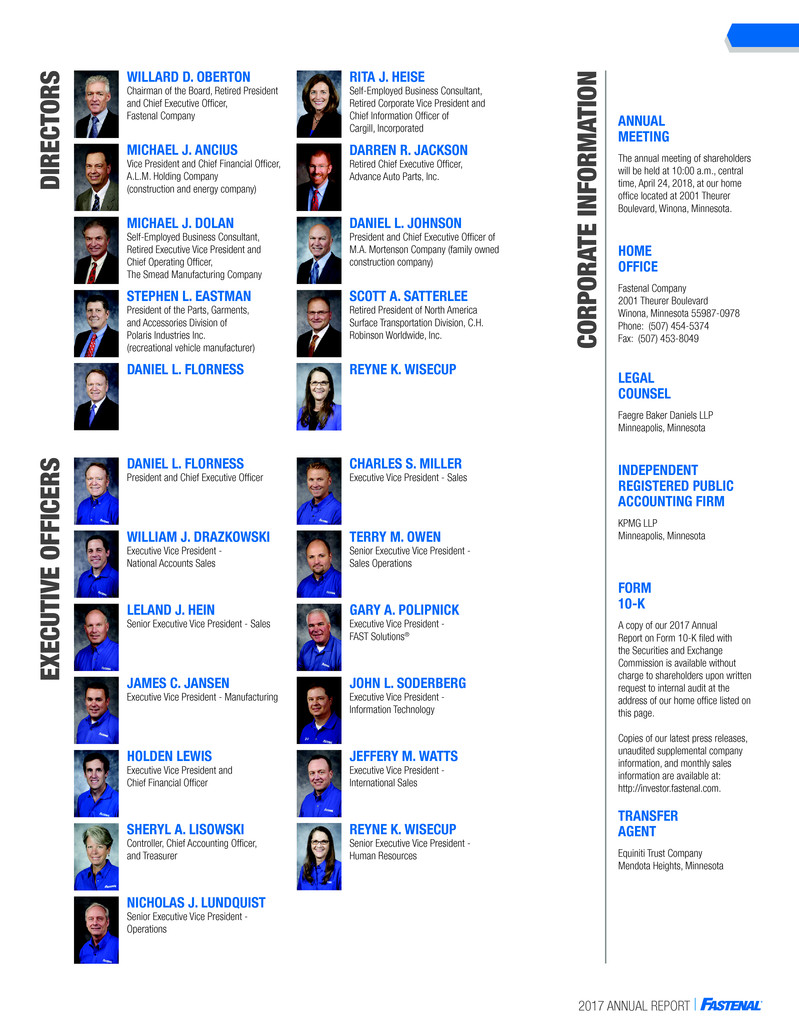
At Fastenal, we do much more than sell and ship products. We align with
our customers to help them unlock productivity and profits throughout their
operations, an undertaking that requires local experts, close collaboration,
and a spectrum of resources to tackle challenges and drive results.
Each customer solution is unique, often shaped by a site evaluation (process
mapping exercise) within the facility to gain a deep understanding of the
operation and uncover sources of waste – a stepping stone to a more efficient
‘future state.’ Below is a depiction of what our service footprint can look like
within a strategic account site.
2017 ANNUAL REPORT 2017 ANNUAL REPORT
CO
UN
TR
IES
W
ITH I
N-MARKET LOCATION
S
JAMES C. JANSEN
Executive Vice President - Manufacturing
HOLDEN LEWIS
Executive Vice President and
Chief Financial Officer
LELAND J. HEIN
Senior Executive Vice President - Sales
SHERYL A. LISOWSKI
Controller, Chief Accounting Officer,
and Treasurer
DANIEL L. FLORNESS
President and Chief Executive Officer
WILLIAM J. DRAZKOWSKI
Executive Vice President -
National Accounts Sales
EXECUTIVE OFFICER
S
ANNUAL
MEETING
The annual meeting of shareholders
will be held at 10:00 a.m., central
time, April 24, 2018, at our home
office located at 2001 Theurer
Boulevard, Winona, Minnesota.
HOME
OFFICE
Fastenal Company
2001 Theurer Boulevard
Winona, Minnesota 55987-0978
Phone: (507) 454-5374
Fax: (507) 453-8049
LEGAL
COUNSEL
INDEPENDENT
REGISTERED PUBLIC
ACCOUNTING FIRM
Faegre Baker Daniels LLP
Minneapolis, Minnesota
KPMG LLP
Minneapolis, Minnesota
FORM
10-K
TRANSFER
AGENT
A copy of our 2017 Annual
Report on Form 10-K filed with
the Securities and Exchange
Commission is available without
charge to shareholders upon written
request to internal audit at the
address of our home office listed on
this page.
Copies of our latest press releases,
unaudited supplemental company
information, and monthly sales
information are available at:
http://investor.fastenal.com.
Equiniti Trust Company
Mendota Heights, Minnesota
CORPOR
ATE INFORM
ATIO
N
$4.4 BILLIO
N
NET SALE
S
NET EARNING
S
$578.6 MILLIO
N
TABLE OF CONTENTS
1-3 Letter to Shareholders
4-5 10-Year Selected Financial
Data & Financial Highlights
6 Stock and Financial Data
MICHAEL J. DOLAN
Self-Employed Business Consultant,
Retired Executive Vice President and
Chief Operating Officer,
The Smead Manufacturing Company
SCOTT A. SATTERLEE
Retired President of North America
Surface Transportation Division, C.H.
Robinson Worldwide, Inc.
RITA J. HEISE
Self-Employed Business Consultant,
Retired Corporate Vice President and
Chief Information Officer of
Cargill, Incorporated
STEPHEN L. EASTMAN
President of the Parts, Garments,
and Accessories Division of
Polaris Industries Inc.
(recreational vehicle manufacturer)
DANIEL L. JOHNSON
President and Chief Executive Officer of
M.A. Mortenson Company (family owned
construction company)
REYNE K. WISECUP
DARREN R. JACKSON
Retired Chief Executive Officer,
Advance Auto Parts, Inc.
WILLARD D. OBERTON
Chairman of the Board, Retired President
and Chief Executive Officer,
Fastenal Company
MICHAEL J. ANCIUS
Vice President and Chief Financial Officer,
A.L.M. Holding Company
(construction and energy company)DIRECTOR
S
DANIEL L. FLORNESS
NO. OF FASTENAL SCHOOL OF
BUSINESS COURSE COMPLETIONS
655,261
BRANCHES
2,383
INVENTORY VALUE
$1.1 BILLION
NO. OF ORDERS PROCESSED
37,641,814
20,565
EMPLOYEES
127,000+
EMPLOYEE SAFETY
COACHING, TRAINING, &
INSPECTION EVENTS
GLANCE
FASTENAL
AT A
143 MILLIONMILES DELIVERED 834DELIVEREDMILLION POUNDS
50,000+
BIN STOCKS
ACTIVE
605
ONSITE
LOCATIONS 71,000
+
VENDING MACHINES INSTALLED
DAILY SALES
GROWTH TO
CUSTOMERS
WITH VENDING
13.2%
GARY A. POLIPNICK
Executive Vice President -
FAST Solutions®
REYNE K. WISECUP
Senior Executive Vice President -
Human Resources
JEFFERY M. WATTS
Executive Vice President -
International Sales
TERRY M. OWEN
Senior Executive Vice President -
Sales Operations
JOHN L. SODERBERG
Executive Vice President -
Information Technology
CHARLES S. MILLER
Executive Vice President - Sales
7 Stock Performance Highlights
8 A Deeper Level of Value
INSIDE
BACK
COVER
Directors
Executive Officers
Corporate Information
NICHOLAS J. LUNDQUIST
Senior Executive Vice President -
Operations
24

2017 ANNUAL REPORT
9706257 | 2017 Annual Report | 2.18 KV | Printed in the USA
2017 ANNUAL REPORT
