Attached files
| file | filename |
|---|---|
| EX-99.1 - EXHIBIT 99.1 - Clearwater Paper Corp | a51753358ex99_1.htm |
| 8-K - CLEARWATER PAPER CORP. 8-K - Clearwater Paper Corp | a51753358.htm |
Exhibit 99.2

CLEARWATER PAPER CORPORATIONFOURTH QUARTER AND FULL YEAR 2017SUPPLEMENTAL INFORMATION 02/05/18 LINDA MASSMANPRESIDENT, CHIEF EXECUTIVE OFFICER AND DIRECTORJOHN HERTZSENIOR VICE PRESIDENT FINANCE AND CHIEF FINANCIAL OFFICER

FORWARD-LOOKING STATEMENTS This presentation of supplemental information contains, in addition to historical information, certain forward-looking statements within the meaning of the Private Securities Litigation Reform Act of 1995, including statements regarding outlook for Q1 2018; the costs, timing and benefits associated with strategic capital investments and operational improvements; our Shelby, N.C. expansion; debt ratios; financial models; estimated Q1 2018 net earnings, EBITDA, and adjusted EBITDA; and estimated Q1 2018 operating income, adjusted operating income, adjusted net earnings, net earnings per diluted common share, adjusted net earnings per diluted common share, net sales and adjusted operating margin; Q1 and full year 2018 product volumes shipped, product pricing and sales mix, cost and timing of major maintenance and repairs, pulp costs, energy costs, and productivity gains. These forward-looking statements are based on management’s current expectations, estimates, assumptions and projections that are subject to change. Our actual results of operations may differ materially from those expressed or implied by the forward-looking statements contained in this presentation. Important factors that could cause or contribute to such differences include the risks and uncertainties described from time to time in the company's public filings with the Securities and Exchange Commission, as well as the following: competitive pricing pressures for our products, including as a result of increased capacity as additional manufacturing facilities are operated by our competitors;the loss of or changes in prices in regards to a significant customer;changes in customer product preferences and competitors' product offerings;our ability to successfully implement our operational efficiencies and cost savings strategies;our ability to execute on our expansion strategies, including on-time completion of our planned new tissue manufacturing operations in Shelby, North Carolina;customer acceptance and timing and quantity of purchases of our tissue products, including the existence of sufficient demand for and the quality of tissue produced by our expanded Shelby, North Carolina operations when they are completed;changes in the U.S. and international economies and in general economic conditions in the regions and industries in which we operate;labor disruptions;changes in transportation costs and disruptions in transportation services;changes in the cost and availability of wood fiber and wood pulp;manufacturing or operating disruptions, including IT system and IT system implementation failures, equipment malfunction and damage to our manufacturing facilities;changes in costs for and availability of packaging supplies, chemicals, energy and maintenance and repairs;cyclical industry conditions; changes in expenses and required contributions associated with our pension plans;environmental liabilities or expenditures;cyber-security risks;reliance on a limited number of third-party suppliers for raw materials;our inability to service our debt obligations;restrictions on our business from debt covenants and terms; andchanges in laws, regulations or industry standards affecting our business.Forward-looking statements contained in this presentation present management’s views only as of the date of this presentation. We undertake no obligation to publicly update forward-looking statements, whether as a result of new information, future events or otherwise. 2
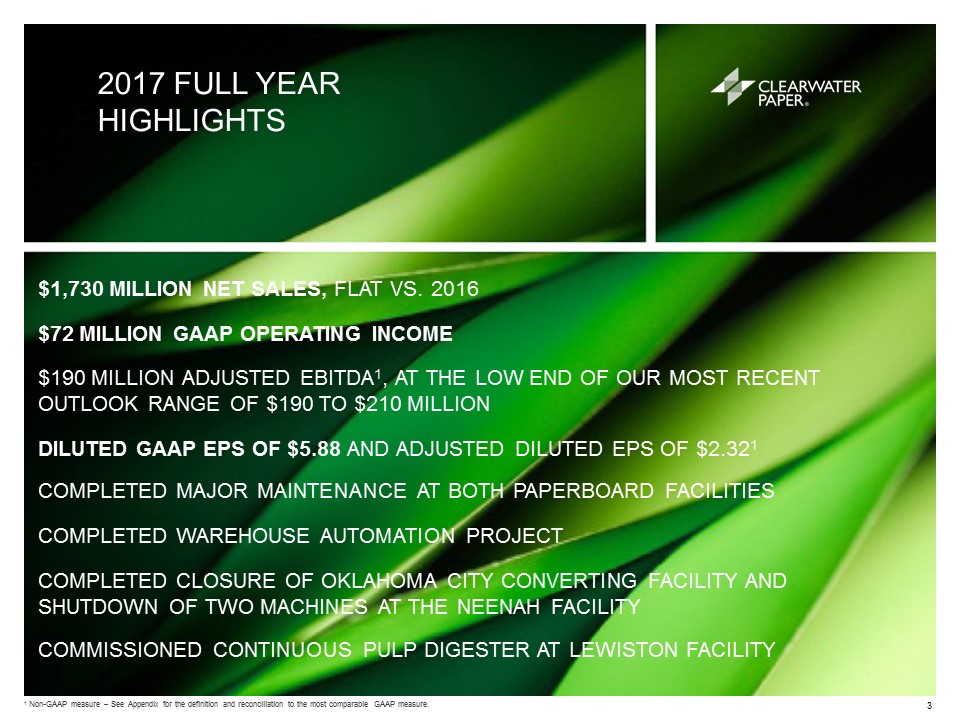
2017 FULL YEARHIGHLIGHTS $1,730 MILLION NET SALES, FLAT VS. 2016 $72 MILLION GAAP OPERATING INCOME$190 MILLION ADJUSTED EBITDA1, AT THE LOW END OF OUR MOST RECENT OUTLOOK RANGE OF $190 TO $210 MILLION DILUTED GAAP EPS OF $5.88 AND ADJUSTED DILUTED EPS OF $2.321 COMPLETED MAJOR MAINTENANCE AT BOTH PAPERBOARD FACILITIESCOMPLETED WAREHOUSE AUTOMATION PROJECTCOMPLETED CLOSURE OF OKLAHOMA CITY CONVERTING FACILITY AND SHUTDOWN OF TWO MACHINES AT THE NEENAH FACILITYCOMMISSIONED CONTINUOUS PULP DIGESTER AT LEWISTON FACILITY 1 Non-GAAP measure – See Appendix for the definition and reconciliation to the most comparable GAAP measure. 3

FOURTH QUARTERFINANCIAL HIGHLIGHTS $437 MILLION NET SALES, UP 2% VS. Q3'17 $27 MILLION GAAP OPERATING INCOME$58 MILLION ADJUSTED EBITDA1, AT HIGH END OF OUTLOOK RANGE OF $50 TO $60 MILLION DILUTED GAAP EPS OF $4.88 AND ADJUSTED DILUTED EPS OF $0.871AN INCREMENTAL $12 MILLION CONTRIBUTION TO COST SAVINGS FROM STRATEGIC CAPITAL AND OPERATIONAL EFFICIENCY INITIATIVES IN Q4’17 COMPARED TO Q4’16 1 Non-GAAP measure – See Appendix for the definition and reconciliation to the most comparable GAAP measure. 4

FINANCIAL SUMMARY (GAAP BASIS)(UNAUDITED) Twelve Months Ended December 31, (Dollars in thousands - except per-share amounts) Q1'16 Q2'16 Q3'16 Q4'16 Q1'17 Q2'17 Q3'17 Q4'17 2016 2017 Net sales $437,204 $436,671 $435,320 $425,568 $437,525 $429,663 $426,504 $436,716 $1,734,763 $1,730,408 Gross Profit $68,557 $74,820 $38,715 $57,044 $50,495 $48,930 $39,923 $61,439 $239,136 $200,787 Selling, general and administrative expenses1 ($30,795 ) ($34,655 ) ($29,435 ) ($32,934 ) ($29,937 ) ($29,265 ) ($34,472 ) ($34,785 ) ($127,819 ) ($128,459 ) Operating income $37,762 $40,165 $9,280 $24,110 $20,558 $19,665 $5,451 $26,654 $111,317 $72,328 Consumer Products 18,390 18,544 17,201 13,781 6,189 10,534 4,436 7,457 67,916 28,616 Pulp and Paperboard 35,163 40,032 9,956 27,581 27,248 21,595 15,023 34,642 112,732 98,508 Corporate (15,791 ) (18,411 ) (17,877 ) (17,252 ) (12,879 ) (12,464 ) (14,008 ) (15,445 ) (69,331 ) (54,796 ) Operating margin 8.6 % 9.2 % 2.1 % 5.7 % 4.7 % 4.6 % 1.3 % 6.1 % 6.4 % 4.2 % Interest expense, net2 ($7,643 ) ($7,396 ) ($7,520 ) ($8,092 ) ($8,043 ) ($7,673 ) ($7,683 ) ($7,975 ) ($30,651 ) ($31,374 ) Income tax (provision) benefit3 ($11,673 ) ($11,905 ) ($859 ) ($6,675 ) ($5,000 ) ($3,955 ) $3,095 $62,245 ($31,112 ) $56,385 Net earnings $18,446 $20,864 $901 $9,343 $7,515 $8,037 $863 $80,924 $49,554 $97,339 Net earnings per diluted common share $1.05 $1.21 $0.05 $0.56 $0.45 $0.48 $0.05 $4.88 $2.90 $5.88 5 1 Selling, general and administrative expenses for the third quarter and twelve months ended 2016 includes gain on divested assets of $1.8 million.2 Interest expense, net for the fourth quarter and twelve months ended 2016 includes debt retirement costs of $0.4 million.3 The Income tax benefit in Q4 and Full Year '17 is primarily due to the remeasurement of deferred tax liabilities as a result of the Tax Cuts and Jobs Act (the "Act") signed into law on December 22, 2017. The resulting net tax benefit is included in the three and twelve months ended December 31, 2017. The Act is complex and significantly changes the U.S. corporate income tax system by, among other things, reducing the Federal corporate income tax rate from 35% to 21%.
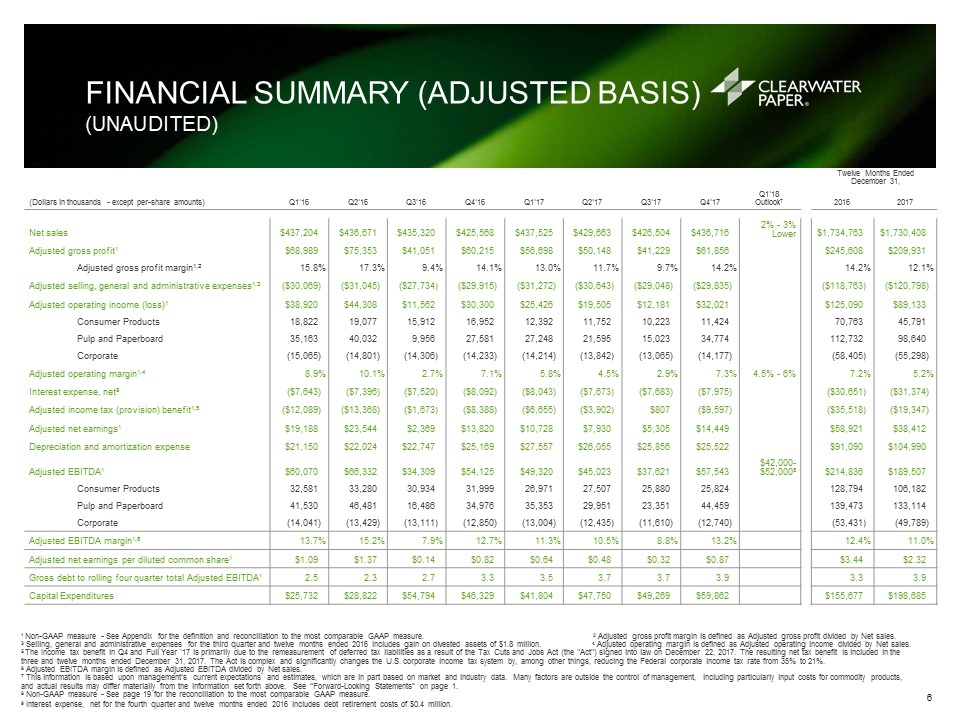
FINANCIAL SUMMARY (ADJUSTED BASIS)(UNAUDITED) 1 Non-GAAP measure - See Appendix for the definition and reconciliation to the most comparable GAAP measure. 2 Adjusted gross profit margin is defined as Adjusted gross profit divided by Net sales.3 Selling, general and administrative expenses for the third quarter and twelve months ended 2016 includes gain on divested assets of $1.8 million. 4 Adjusted operating margin is defined as Adjusted operating income divided by Net sales.5 The Income tax benefit in Q4 and Full Year '17 is primarily due to the remeasurement of deferred tax liabilities as a result of the Tax Cuts and Jobs Act (the "Act") signed into law on December 22, 2017. The resulting net tax benefit is included in the three and twelve months ended December 31, 2017. The Act is complex and significantly changes the U.S. corporate income tax system by, among other things, reducing the Federal corporate income tax rate from 35% to 21%.6 Adjusted EBITDA margin is defined as Adjusted EBITDA divided by Net sales.7 This information is based upon management’s current expectations and estimates, which are in part based on market and industry data. Many factors are outside the control of management, including particularly input costs for commodity products, and actual results may differ materially from the information set forth above. See “Forward-Looking Statements” on page 1.8 Non-GAAP measure - See page 19 for the reconciliation to the most comparable GAAP measure.9 Interest expense, net for the fourth quarter and twelve months ended 2016 includes debt retirement costs of $0.4 million. Twelve Months Ended December 31, (Dollars in thousands - except per-share amounts) Q1'16 Q2'16 Q3'16 Q4'16 Q1'17 Q2'17 Q3'17 Q4'17 Q1'18 Outlook7 2016 2017 Net sales $437,204 $436,671 $435,320 $425,568 $437,525 $429,663 $426,504 $436,716 2% - 3% Lower $1,734,763 $1,730,408 Adjusted gross profit1 $68,989 $75,353 $41,051 $60,215 $56,698 $50,148 $41,229 $61,856 $245,608 $209,931 Adjusted gross profit margin1,2 15.8 % 17.3 % 9.4 % 14.1 % 13.0 % 11.7 % 9.7 % 14.2 % 14.2 % 12.1 % Adjusted selling, general and administrative expenses1,3 ($30,069 ) ($31,045 ) ($27,734 ) ($29,915 ) ($31,272 ) ($30,643 ) ($29,048 ) ($29,835 ) ($118,763 ) ($120,798 ) Adjusted operating income (loss)1 $38,920 $44,308 $11,562 $30,300 $25,426 $19,505 $12,181 $32,021 $125,090 $89,133 Consumer Products 18,822 19,077 15,912 16,952 12,392 11,752 10,223 11,424 70,763 45,791 Pulp and Paperboard 35,163 40,032 9,956 27,581 27,248 21,595 15,023 34,774 112,732 98,640 Corporate (15,065 ) (14,801 ) (14,306 ) (14,233 ) (14,214 ) (13,842 ) (13,065 ) (14,177 ) (58,405 ) (55,298 ) Adjusted operating margin1,4 8.9 % 10.1 % 2.7 % 7.1 % 5.8 % 4.5 % 2.9 % 7.3 % 4.5% - 6% 7.2 % 5.2 % Interest expense, net9 ($7,643 ) ($7,396 ) ($7,520 ) ($8,092 ) ($8,043 ) ($7,673 ) ($7,683 ) ($7,975 ) ($30,651 ) ($31,374 ) Adjusted income tax (provision) benefit1,5 ($12,089 ) ($13,368 ) ($1,673 ) ($8,388 ) ($6,655 ) ($3,902 ) $807 ($9,597 ) ($35,518 ) ($19,347 ) Adjusted net earnings1 $19,188 $23,544 $2,369 $13,820 $10,728 $7,930 $5,305 $14,449 $58,921 $38,412 Depreciation and amortization expense $21,150 $22,024 $22,747 $25,169 $27,557 $26,055 $25,856 $25,522 $91,090 $104,990 Adjusted EBITDA1 $60,070 $66,332 $34,309 $54,125 $49,320 $45,023 $37,621 $57,543 $42,000-$52,0008 $214,836 $189,507 Consumer Products 32,581 33,280 30,934 31,999 26,971 27,507 25,880 25,824 128,794 106,182 Pulp and Paperboard 41,530 46,481 16,486 34,976 35,353 29,951 23,351 44,459 139,473 133,114 Corporate (14,041 ) (13,429 ) (13,111 ) (12,850 ) (13,004 ) (12,435 ) (11,610 ) (12,740 ) (53,431 ) (49,789 ) Adjusted EBITDA margin1,6 13.7 % 15.2 % 7.9 % 12.7 % 11.3 % 10.5 % 8.8 % 13.2 % 12.4 % 11.0 % Adjusted net earnings per diluted common share1 $1.09 $1.37 $0.14 $0.82 $0.64 $0.48 $0.32 $0.87 $3.44 $2.32 Gross debt to rolling four quarter total Adjusted EBITDA1 2.5 2.3 2.7 3.3 3.5 3.7 3.7 3.9 3.3 3.9 Capital Expenditures $25,732 $28,822 $54,794 $46,329 $41,804 $47,750 $49,269 $59,862 $155,677 $198,685 6

2017 VS. 2016CONSOLIDATED ADJUSTED EBITDA1 BRIDGE 1 Non-GAAP measure – See Appendix for the definition and reconciliation to the most comparable GAAP measure. PRICE/MIX Stronger mix of ultra tissue, lower parent roll and non-retail sales in CPD VOLUME Lower due to away-from-home volume. Lower parent roll volume due to shutdown of two tissue machines at the Neenah facility. Partially offset by higher paperboard shipment volume due to Manchester Industries acquisition RAW MATERIALS Higher raw material pricing on pulp, caustic, polyethylene, and packaging supplies TRANSPORTATION Higher line haul rates, diesel prices, costs due to weather related events, and costs to service demand WAGES & BENEFITS Lower due to warehouse automation and lower medical expenses, all partly offset by annual wage increases OKC/NEENAH Savings due to Oklahoma City facility closure and shutdown of two tissue machines at the Neenah facility, including lower wages and maintenance, partly offset by higher freight OTHER Lower due to cost saving initiatives, partly offset by professional services ADJ, EBITDA1(MILLIONS) 1 1 7

Q4’17 VS. Q3’17CONSOLIDATED ADJUSTED EBITDA1 BRIDGE 1 Non-GAAP measure – See Appendix for the definition and reconciliation to the most comparable GAAP measure. PRICE/MIX Lower promotional spend and stronger mix of ultra quality tissue sales, partially offset by paperboard mix VOLUME Lower retail tissue and parent roll sales, partly offset by higher paperboard shipments TRANSPORTATION Higher customer freight rates due to weather related events and costs to service Q4 demand MAINTENANCE Idaho major maintenance outage completed in Q3and lower planned maintenance at CPD Mills WAGES & BENEFITS Higher medical claims ADJ, EBITDA1(MILLIONS) 1 1 8

Q4’17 VS. Q4’16CONSOLIDATED ADJUSTED EBITDA1 BRIDGE 1 Non-GAAP measure – See Appendix for the definition and reconciliation to the most comparable GAAP measure. PRICE/MIX Stronger mix of ultra tissue, lower parent roll sales and lower promotional spend at CPD, and higher paperboard pricing due to Q3'17 increase VOLUME Lower non-retail tissue sales, partly offset by higher paperboard shipment volume due to Manchester Industries acquisition PULP/WOOD FIBER Higher external pulp pricing TRANSPORTATION Higher line haul rates, diesel prices, rates in connection with weather related events, costs to service Q4'17 demand ENERGY Higher electrical purchases due to turbine outage at Idaho facility MAINTENANCE Lower planned maintenance OKC/NEENAH Savings due to Oklahoma City facility closure and shutdown of two tissue machines at the Neenah facility, including lower wages and maintenance, partly offset by higher freight ADJ, EBITDA1(MILLIONS) 1 1 Net productivity improvement vs. Q4'16 of $12 million 9

1 Based on Q1’15 prices, input costs, and market and industry data. Many factors are outside the control of management, including particularly input costs for commodity products, and actual results may differ materially from the information set forth above. See “Forward-Looking Statements” on page 1.2 The Continuous Digester was placed into service in Q4’17. 2015 - 2016 and 2017 cost savings contributions were $0.3M and $1.7M, respectively.. STRATEGIC INVESTMENT AND OPERATIONAL IMPROVEMENT SCORECARD AS OF Q4'17 Strategic plan announced in Q1’15, expected capex of $229-$241 million Expected to yield a $115-$145 million cost savings by the end of 20181 Continuous Digester2 Warehouse Automation Other Projects Operational Improvements TOTAL STRATEGIC CAPEX $148-$158 $32-$34 $49 $0 FULL RUN-RATE EXPECTED IMPACT (MILLIONS $)1 COST SAVINGS1 $30-$35 $20-$21 $21-$24 $44-$65 2015-2016 COST SAVINGS ACHIEVED 2017 COST SAVINGS ACHIEVED 10

SHELBY EXPANSION:$340 MILLION PAPER MACHINE Install NTT Tissue Machine and Converting Equipment LOCATION Shelby, NC adjacent to current Tissue plant CAPACITY 70,000 Tons COST $283 Million START PRODUCTION Q1-2019 FULL SHIPMENT RUN-RATE Late 2020 11 WAREHOUSE CONSOLIDATION Improve operational efficiency in Eastern Regions. Less reliance on 3PL LOCATION Shelby, NC adjacent to current Tissue plant COST $57 Million CONSTRUCTION Q2-2017 through Q1-2019

1 Includes away-from-home (AFH), contract and parent roll tissue products. 2 Includes retail, AFH, and contract tissue case products. 3 Non-GAAP measure – See Appendix for the definition and reconciliation to the most comparable GAAP measure. 4 Non-GAAP measure – Segment Adjusted EBITDA margin is defined as Segment Adjusted EBITDA divided by Segment net sales. KEY SEGMENT RESULTS -CONSUMER PRODUCTS(UNAUDITED) Q1'16 Q2'16 Q3'16 Q4'16 Q1'17 Q2'17 Q3'17 Q4'17 CONSUMER PRODUCTS CROSS-CYCLE FINANCIAL MODEL Shipments Non-Retail (short tons)1 24,358 20,028 18,384 19,182 16,678 13,736 12,958 12,190 Retail (short tons) 75,027 79,095 82,216 77,704 78,686 77,714 77,544 75,123 Total Tissue Tons 99,385 99,123 100,600 96,886 95,364 91,450 90,502 87,313 Converted Products (cases in thousands)2 12,990 13,229 13,770 12,886 13,123 12,709 12,727 12,662 Sales Price Non-Retail ($/short ton)1 $1,477 $1,496 $1,506 $1,442 $1,439 $1,454 $1,468 $1,394 Retail ($/short ton) $2,784 $2,747 $2,742 $2,757 $2,772 $2,723 $2,754 $2,855 Total Tissue ($/short ton) $2,464 $2,494 $2,516 $2,496 $2,539 $2,533 $2,574 $2,651 Segment net sales ($ in thousands) $245,018 $247,912 $253,319 $242,131 $242,423 $231,912 $232,916 $234,656 Segment GAAP operating income ($ in thousands) $18,390 $18,544 $17,201 $13,781 $6,189 $10,534 $4,436 $7,457 Segment GAAP operating margin 7.5% 7.5% 6.8% 5.7% 2.6% 4.5% 1.9% 3.2% Segment Adjusted EBITDA3 ($ in thousands) $32,581 $33,280 $30,934 $31,999 $26,971 $27,507 $25,880 $25,824 Segment Adjusted EBITDA margin4 13.3% 13.4% 12.2% 13.2% 11.1% 11.9% 11.1% 11.0% 17.0% 12

CLEARWATER PAPERTISSUE SHIPMENTSAND U.S. RETAIL TISSUE MARKET U.S. Retail Tissue Market Q4'17 ($) (MultiOutlet)1 CATEGORY PRIVATELABEL BRANDS TOTAL Total RetailTissue Share ($) 26 % 74 % 100 % % ChangeQ4’17 vs. Q3’17 — % — % — % 1 Data Source: IRI Worldwide data through December 31, 2017. CLW Q4'17 by Market Segment(% of Tons) CLW Q3'17 by Market Segment(% of Tons) Other Other Parent Rolls Parent Rolls AFH AFH Retail Retail 13

PRICE/MIX Lower promotional spend and stronger mix of ultra quality tissue sales VOLUME Lower retail tissue and parent roll sales TRANSPORTATION Higher customer freight rates due to weather related events and costs to service Q4 demand MAINTENANCE Lower planned maintenance WAGES & BENEFITS Higher medical claims SG&A Lower due to cost saving initiatives Q4'17 VS. Q3'17CONSUMER PRODUCTS ADJUSTED EBITDA1 BRIDGE 1 Non-GAAP measure – See Appendix for the definition and reconciliation to the most comparable GAAP measure. SEGMENT ADJ. EBITDA1(MILLIONS) 1 1 14

KEY SEGMENT RESULTS – PULP AND PAPERBOARD(UNAUDITED) 1 Non-GAAP measure – See Appendix for the definition and reconciliation to the most comparable GAAP measure.2 Non-GAAP measure – Segment Adjusted EBITDA margin is defined as Segment Adjusted EBITDA divided by Segment net sales.3 Results include the impact of Manchester Industries acquisition, which was acquired at the end of Q4’16. Q1'16 Q2'16 Q3'16 Q4'16 Q1'173 Q2'173 Q3'173 Q4'173 PULP ANDPAPERBOARDCROSS-CYCLEFINANCIAL MODEL Shipments Paperboard (short tons) 201,340 199,132 196,271 199,415 210,382 207,152 200,569 210,098 Sales Price Paperboard ($/short ton) $952 $948 $927 $920 $927 $955 $965 $962 Segment net sales ($ in thousands) $192,186 $188,759 $182,001 $183,437 $195,102 $197,751 $193,588 $202,060 Segment GAAP operating income ($ in thousands) $35,163 $40,032 $9,956 $27,581 $27,248 $21,595 $15,023 $34,642 Segment GAAP operating margin 18.3% 21.2% 5.5% 15.0% 14.0% 10.9% 7.8% 17.1% Segment Adjusted EBITDA1 ($ in thousands) $41,530 $46,481 $16,486 $34,976 $35,353 $29,951 $23,351 $44,459 Segment Adjusted EBITDA margin2 21.6% 24.6% 9.1% 19.1% 18.1% 15.1% 12.1% 22.0% 19.0% 15

CLEARWATER PAPERPAPERBOARD SHIPMENTS ANDU.S. PAPERBOARD MARKET U.S. Paperboard Production3 CATEGORY CLEARWATER PAPER OTHER Total Domestic SBS1 Market Share 14 % 86 % Folding 18 % 82 % Food Service2 15 % 85 % Liquid Packaging 5 % 95 % 1 Solid Bleached Sulfate.2 Food Service includes cup, plate, dish and tray products.3 Data Source: American Forest and Paper Association Solid Bleached Domestic Production – December YTD 2017. CLW Q4'17 by Market Segment(% of Tons) CLW Q3'17 by Market Segment(% of Tons) Folding Folding Liquid Pkg Liquid Pkg Food Service Food Service 16

PRICE/MIX Relatively stable mix VOLUME Higher paperboard shipments TRANSPORTATION Higher freight rates primarily due to weather related events MAINTENANCE Idaho major maintenance outage completed in Q3 Q4’17 vs. Q3'17 PULP AND PAPERBOARD ADJUSTED EBITDA1 BRIDGE 1 Non-GAAP measure – See Appendix for the definition and reconciliation to the most comparable GAAP measure. SEGMENT ADJ. EBITDA1(MILLIONS) 1 1 17

CLEARWATER PAPER CROSS-CYCLE FINANCIAL MODEL 1 Non-GAAP measure – See Appendix for the definition and reconciliation to the most comparable GAAP measure. Twelve Months Ended December 31, CLEARWATER PAPER CROSS-CYCLE FINANCIAL MODEL (Dollars in thousands) Q1'16 Q2'16 Q3'16 Q4'16 Q1'17 Q2'17 Q3'17 Q4'17 2016 2017 Net sales 100 % 100 % 100 % 100 % 100 % 100 % 100 % 100 % 100 % 100 % 100 % Adjusted gross profit margin1 15.8 % 17.3 % 9.4 % 14.1 % 13.0 % 11.7 % 9.7 % 14.2 % 14.2 % 12.1 % 17.0 % Adjusted SG&A expenses1 as % of net sales (6.9 %) (7.1 %) (6.8 %) (7.0 %) (7.1 %) (7.1 %) (6.8 %) (6.8 %) (6.9 %) (7.0 %) (6.0 %) Adjusted operating margin1 8.9 % 10.1 % 2.7 % 7.1 % 5.8 % 4.5 % 2.9 % 7.3 % 7.2 % 5.2 % 11.0 % Adjusted net earnings1 as % of net sales 4.4 % 5.4 % 0.5 % 3.2 % 2.5 % 1.8 % 1.2 % 2.5 % 3.4 % 2.2 % 5.0 % Adjusted EBITDA margin1 13.7 % 15.2 % 7.9 % 12.7 % 11.3 % 10.5 % 8.8 % 13.2 % 12.4 % 11.0 % 15.0 % 18

Q1’18 OUTLOOK1RECONCILIATION OF NON-GAAP FINANCIAL MEASURES (UNAUDITED) 1 This information is based upon management’s current expectations and estimates, which are in part based on market and industry data. Many factors are outside the control of management, including particularly input costs for commodity products, and actual results may differ materially from the information set forth above. See “Forward-Looking Statements” on page 1.2 EBITDA is a non-GAAP measure that management uses as a supplemental performance measure. The most directly comparable GAAP measure is net earnings (loss). EBITDA is net earnings adjusted for net interest expense (including debt retirement costs), income taxes, and depreciation and amortization. It should not be considered as an alternative to net earnings computed under GAAP.3 Adjusted EBITDA excludes the impact of the items listed that we do not believe are indicative of our core operating performance. OUTLOOK THREE MONTHS ENDINGMARCH 31, 2018 RANGE OF ESTIMATE (Dollars in thousands) FROM TO Earnings before interest, income taxes, and depreciation & amortization (EBITDA)2: GAAP net earnings $4,700 $9,700 Interest expense, net 6,800 8,000 Income tax provision 1,700 3,500 Depreciation and amortization expense 24,200 26,200 EBITDA2 $37,400 $47,400 Directors' equity-based compensation expense 300 300 Reorganization related expenses 4,300 4,300 Adjusted EBITDA3 $42,000 $52,000 19

Q1’18 OUTLOOK1RECONCILIATION OF NON-GAAPFINANCIAL MEASURES (UNAUDITED) 1 This information is based upon management’s current expectations and estimates, which are in part based on market and industry data. Many factors are outside the control of management, including particularly input costs for commodity products, and actual results may differ materially from the information set forth above. See “Forward-Looking Statements” on page 1.2 Adjusted operating income, Adjusted net earnings and Adjusted net earnings per diluted common share exclude the impact of the items listed that we do not believe are indicative of our core operating performance.3 All non-tax items are tax effected at a 26.0% annual rate.4 GAAP net earnings per diluted common share and Adjusted net earnings per diluted common share are calculated utilizing fourth quarter 2017 diluted average common shares outstanding of 16,568 (in thousands). OUTLOOK THREE MONTHS ENDINGMARCH 31, 2018 RANGE OF ESTIMATE (Dollars in thousands) FROM TO GAAP Operating Income $16,000 $21,000 Directors' equity-based compensation expense 300 300 Reorganization related expenses 4,300 4,300 Adjusted operating income2 $20,600 $25,600 (Dollars in thousands) FROM TO GAAP net earnings $4,700 $9,700 Adjustments, after tax3: Directors' equity-based compensation expense 220 220 Reorganization related expenses 3,180 3,180 Adjusted net earnings2 $8,100 $13,100 FROM TO GAAP net earnings per diluted common share4 $0.28 $0.59 Adjusted net earnings per diluted common share2,4 $0.49 $0.79 20

Q1'18 OUTLOOK1 2% - 3% Lower 4.5% - 6% $42M - $52M $0.49 - $0.79 NET SALES ADJUSTED OPERATING MARGIN2,3 ADJUSTED EBITDA2 ADJUSTED NET EARNINGS PER DILUTED COMMON SHARE2,4 1 This information is based upon management’s current expectations and estimates, which are in part based on market and industry data. Many factors are outside the control of management, including particularly input costs for commodity products, and actual results may differ materially from the information set forth above. See “Forward-Looking Statements” on page 1.2 Non-GAAP measure – See prior slides for the reconciliation to the most comparable GAAP measure.3 Adjusted operating margin is defined as net sales divided by adjusted operating income.4 Adjusted net earnings per diluted common share is calculated utilizing fourth quarter 2017 diluted average common shares outstanding of 16,568 (in thousands). 21
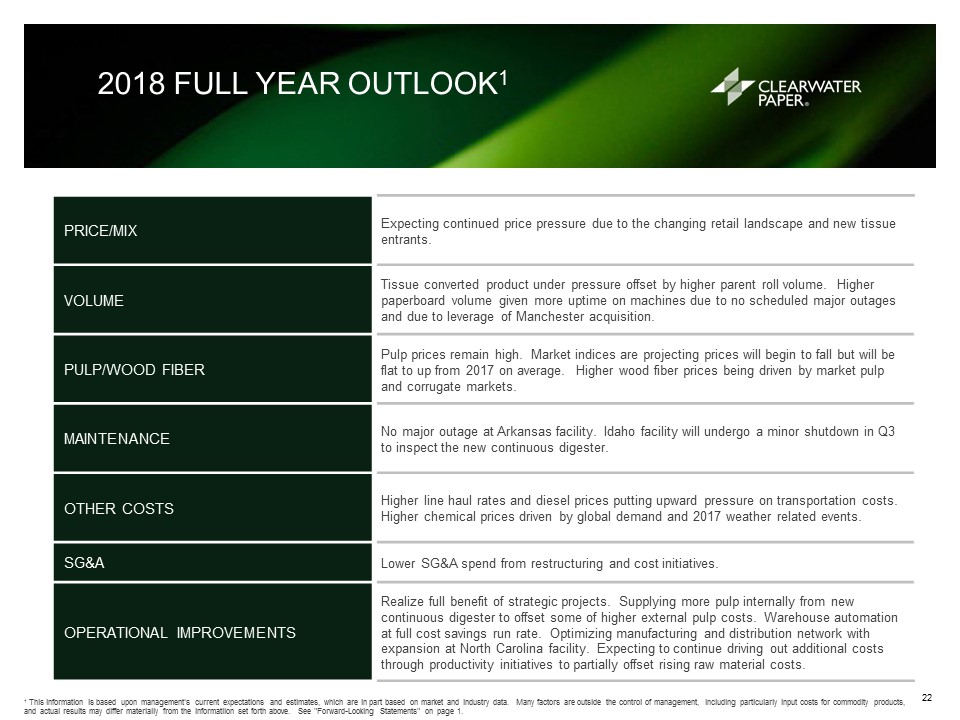
PRICE/MIX Expecting continued price pressure due to the changing retail landscape and new tissue entrants. VOLUME Tissue converted product under pressure offset by higher parent roll volume. Higher paperboard volume given more uptime on machines due to no scheduled major outages and due to leverage of Manchester acquisition. PULP/WOOD FIBER Pulp prices remain high. Market indices are projecting prices will begin to fall but will be flat to up from 2017 on average. Higher wood fiber prices being driven by market pulp and corrugate markets. MAINTENANCE No major outage at Arkansas facility. Idaho facility will undergo a minor shutdown in Q3 to inspect the new continuous digester. OTHER COSTS Higher line haul rates and diesel prices putting upward pressure on transportation costs. Higher chemical prices driven by global demand and 2017 weather related events. SG&A Lower SG&A spend from restructuring and cost initiatives. OPERATIONAL IMPROVEMENTS Realize full benefit of strategic projects. Supplying more pulp internally from new continuous digester to offset some of higher external pulp costs. Warehouse automation at full cost savings run rate. Optimizing manufacturing and distribution network with expansion at North Carolina facility. Expecting to continue driving out additional costs through productivity initiatives to partially offset rising raw material costs. 2018 FULL YEAR OUTLOOK1 1 This information is based upon management's current expectations and estimates, which are in part based on market and industry data. Many factors are outside the control of management, including particularly input costs for commodity products, and actual results may differ materially from the informatiion set forth above. See "Forward-Looking Statements" on page 1. 22

APPENDIX 23

ADJUSTED GROSS PROFIT& ADJUSTED SG&ARECONCILIATION OF NON-GAAPFINANCIAL MEASURES (UNAUDITED) 1 Gross profit is defined as net sales minus cost of sales.2 Adjusted gross profit and Adjusted selling, general and administrative expenses exclude the impact of the items listed that we do not believe are indicative of our core operating performance.3 Selling, general and administrative expenses for the third quarter and twelve months ended 2016 includes gain on divested assets of $1.8 million. Twelve Months Ended December 31, (Dollars in thousands) Q1'16 Q2'16 Q3'16 Q4'16 Q1'17 Q2'17 Q3'17 Q4'17 2016 2017 Gross profit1 $68,557 $74,820 $38,715 $57,044 $50,495 $48,930 $39,923 $61,439 $239,136 $200,787 Costs associated with Long Island facility closure 432 533 466 460 466 661 610 298 1,891 2,035 Pension settlement expense — — 1,870 — — — — — 1,870 — Costs associated with Oklahoma City facility closure — — — 1,662 5,737 275 576 119 1,662 6,707 Costs associated with Neenah paper machines shutdown — — — 1,049 — — — — 1,049 — Write-off of assets as a result of Warehouse Automation project — — — — — 41 — — — 41 Accelerated depreciation of assets as a result of Warehouse Automation project — — — — — 241 120 — — 361 Adjusted gross profit2 $68,989 $75,353 $41,051 $60,215 $56,698 $50,148 $41,229 $61,856 $245,608 $209,931 Selling, general and administrative expenses (SG&A)3 ($30,795 ) ($34,655 ) ($29,435 ) ($32,934 ) ($29,937 ) ($29,265 ) ($34,472 ) ($34,785 ) ($127,819 ) ($128,459 ) Directors' equity-based compensation expense (benefit) 726 3,610 89 354 (1,450 ) (1,483 ) 463 (363 ) 4,779 (2,833 ) Costs associated with Oklahoma City facility closure — — — — — — 4,481 3,530 — 8,011 Pension settlement expense — — 1,612 — — — — — 1,612 — Manchester Industries acquisition related expenses — — — 2,665 115 105 — — 2,665 220 Reorganization expenses associated with SG&A cost control measures — — — — — — 480 1,783 — 2,263 Adjusted selling, general and administrative expenses2 ($30,069 ) ($31,045 ) ($27,734 ) ($29,915 ) ($31,272 ) ($30,643 ) ($29,048 ) ($29,835 ) ($118,763 ) ($120,798 ) 24

SEGMENT ADJUSTED OPERATING INCOME (LOSS)RECONCILIATION OF NON-GAAP FINANCIAL MEASURES (UNAUDITED) 1 Adjusted operating income (loss) excludes the impact of the items listed that we do not believe are indicative of our core operating performance. Twelve Months Ended December 31, (Dollars in thousands) Q1'16 Q2'16 Q3'16 Q4'16 Q1'17 Q2'17 Q3'17 Q4'17 2016 2017 Consumer Products Operating income $18,390 $18,544 $17,201 $13,781 $6,189 $10,534 $4,436 $7,457 $67,916 $28,616 Costs associated with Long Island facility closure 432 533 466 460 466 661 610 298 1,891 2,035 Gain associated with the sale of the specialty mills, net — — (1,755 ) — — — — — (1,755 ) — Costs associated with Oklahoma City facility closure — — — 1,662 5,737 275 5,057 3,649 1,662 14,718 Costs associated with Neenah paper machines shutdown — — — 1,049 — — — — 1,049 — Write-off of assets as a result of Warehouse Automation project — — — — — 41 — — — 41 Accelerated depreciation of assets as a result of Warehouse Automation project — — — — — 241 120 — — 361 Reorganization expenses associated with SG&A cost control measures — — — — — — — 20 — 20 Adjusted Consumer Products operating income1 $18,822 $19,077 $15,912 $16,952 $12,392 $11,752 $10,223 $11,424 $70,763 $45,791 Pulp and Paperboard Operating Income $35,163 $40,032 $9,956 $27,581 $27,248 $21,595 $15,023 $34,642 $112,732 $98,508 Reorganization expenses associated with SG&A cost control measures — — — — — — — 132 — 132 Adjusted Pulp and Paperboard operating income1 $35,163 $40,032 $9,956 $27,581 $27,248 $21,595 $15,023 $34,774 $112,732 $98,640 Corporate Operating loss ($15,791 ) ($18,411 ) ($17,877 ) ($17,252 ) ($12,879 ) ($12,464 ) ($14,008 ) ($15,445 ) ($69,331 ) ($54,796 ) Directors' equity-based compensation expense (benefit) 726 3,610 89 354 (1,450 ) (1,483 ) 463 (363 ) 4,779 (2,833 ) Pension settlement expense — — 3,482 — — — — — 3,482 — Manchester Industries acquisition related expenses — — — 2,665 115 105 — — 2,665 220 Reorganization expenses associated with SG&A cost control measures — — — — — — 480 1,631 — 2,111 Adjusted Corporate operating loss1 ($15,065 ) ($14,801 ) ($14,306 ) ($14,233 ) ($14,214 ) ($13,842 ) ($13,065 ) ($14,177 ) ($58,405 ) ($55,298 ) 25

ADJUSTED NET EARNINGS & ADJUSTED NET EARNINGS PER DILUTED COMMON SHARE RECONCILIATION OF NON-GAAP FINANCIAL MEASURES (UNAUDITED) 1 All non-tax items are tax effected at the expected annual rate for that period.2 Adjusted net earnings and Adjusted net earnings per diluted common share exclude the impact of the items listed that we do not believe are indicative of our core operating performance. 3 The federal tax rate change in Q4 and Full Year '17 is primarily due to the remeasurement of deferred tax liabilities as a result of the Tax Cuts and Jobs Act (the "Act") signed into law on December 22, 2017. The resulting net tax benefit is included in the three and twelve months ended December 31, 2017. The Act is complex and significantly changes the U.S. corporate income tax system by, among other things, reducing the Federal corporate income tax rate from 35% to 21%. Twelve Months Ended December 31, (Dollars in thousands - except per-share amounts) Q1'16 Q2'16 Q3'16 Q4'16 Q1'17 Q2'17 Q3'17 Q4'17 2016 2017 GAAP net earnings $18,446 $20,864 $901 $9,343 $7,515 $8,037 $863 $80,924 $49,554 $97,339 Adjustments, after tax1: Directors' equity-based compensation expense (benefit) 465 2,335 57 229 (957 ) (988 ) 306 (242 ) 3,086 (1,881 ) Costs associated with Long Island facility closure 277 345 300 297 308 440 402 199 1,219 1,349 Gain associated with the sale of the specialty mills, net — — (1,129 ) — — — — — (1,129 ) — Pension settlement expense — — 2,240 — — — — — 2,240 — Costs associated with Oklahoma City facility closure — — — 1,073 3,786 183 3,338 2,434 1,073 9,741 Costs associated with Neenah paper machines shutdown — — — 678 — — — — 678 — Manchester Industries acquisition related expenses — — — 2,200 76 70 — — 2,200 146 Write-off of assets as a result of Warehouse Automation project — — — — — 27 — — — 27 Accelerated depreciation of assets as a result of Warehouse Automation project — — — — — 161 79 — — 240 Reorganization expenses associated with SG&A cost control measures — — — — — — 317 1,189 — 1,506 Federal tax rate change3 — — — — — — — (70,055 ) — (70,055 ) Adjusted net earnings2 $19,188 $23,544 $2,369 $13,820 $10,728 $7,930 $5,305 $14,449 $58,921 $38,412 Net earnings per diluted common share $1.05 $1.21 $0.05 $0.56 $0.45 $0.48 $0.05 $4.88 $2.90 $5.88 Adjustments, after tax:1 Directors' equity-based compensation expense (benefit) 0.03 0.14 — 0.01 (0.06 ) (0.06 ) 0.02 (0.01 ) 0.18 (0.11 ) Costs associated with Long Island facility closure 0.02 0.02 0.02 0.02 0.02 0.03 0.02 0.01 0.07 0.08 Gain associated with the sale of the specialty mills, net — — (0.07 ) — — — — — (0.07 ) — Pension settlement expense — — 0.13 — — — — — 0.13 — Costs associated with Oklahoma City facility closure — — — 0.06 0.23 0.01 0.20 0.15 0.06 0.59 Costs associated with Neenah paper machines shutdown — — — 0.04 — — — — 0.04 — Manchester Industries acquisition related expenses — — — 0.13 — 0.01 — — 0.13 0.01 Write-off of assets as a result of Warehouse Automation project — — — — — — — — — — Accelerated depreciation of assets as a result of Warehouse Automation project — — — — — 0.01 0.01 — — 0.01 Reorganization expenses associated with SG&A cost control measures — — — — — — 0.02 0.07 — 0.09 Federal tax rate change3 — — — — — — — (4.23 ) — (4.23 ) Adjusted net earnings per diluted common share2 $1.09 $1.37 $0.14 $0.82 $0.64 $0.48 $0.32 $0.87 $3.44 $2.32 26

ADJUSTED INCOME TAX PROVISION RECONCILIATION OF NON-GAAP FINANCIAL MEASURE (UNAUDITED) 1 Adjusted income tax provision excludes the impact of the items listed that we do not believe are indicative of our core operating performance.2The federal tax rate change in Q4 and Full Year '17 is primarily due to the remeasurement of deferred tax liabilities as a result of the Tax Cuts and Jobs Act (the "Act") signed into law on December 22, 2017. The resulting net tax benefit is included in the three and twelve months ended December 31, 2017. The Act is complex and significantly changes the U.S. corporate income tax system by, among other things, reducing the Federal corporate income tax rate from 35% to 21%. Twelve Months Ended December 31, (Dollars in thousands) Q1'16 Q2'16 Q3'16 Q4'16 Q1'17 Q2'17 Q3'17 Q4'17 2016 2017 GAAP income tax provision ($11,673 ) ($11,905 ) ($859 ) ($6,675 ) ($5,000 ) ($3,955 ) $3,095 $62,245 ($31,112 ) $56,385 Adjustments, tax impact: Directors' equity-based compensation (expense) benefit (261 ) (1,275 ) (32 ) (125 ) 493 495 (157 ) 121 (1,693 ) 952 Costs associated with Long Island facility closure (155 ) (188 ) (166 ) (163 ) (158 ) (221 ) (208 ) (99 ) (672 ) (686 ) Gain associated with the sale of the specialty mills, net — — 626 — — — — — 626 — Pension settlement expense — — (1,242 ) — — — — — (1,242 ) — Costs associated with Oklahoma City facility closure — — — (589 ) (1,951 ) (92 ) (1,719 ) (1,215 ) (589 ) (4,977 ) Costs associated with Neenah paper machines shutdown — — — (371 ) — — — — (371 ) — Manchester Industries acquisition related expenses — — — (465 ) (39 ) (35 ) — — (465 ) (74 ) Write-off of assets as a result of Warehouse Automation project — — — — — (14 ) — — — (14 ) Accelerated depreciation of assets as a result of Warehouse Automation project — — — — — (80 ) (41 ) — — (121 ) Reorganization expenses associated with SG&A cost control measures — — — — — — (163 ) (594 ) — (757 ) Federal tax rate change2 — — — — — — — (70,055 ) — (70,055 ) Adjusted income tax (provision) benefit1 ($12,089 ) ($13,368 ) ($1,673 ) ($8,388 ) ($6,655 ) ($3,902 ) $807 ($9,597 ) ($35,518 ) ($19,347 ) 27

EBITDA & ADJUSTED EBITDA RECONCILIATION OF NON-GAAP FINANCIAL MEASURES (UNAUDITED) 1 EBITDA is a non-GAAP measure that management uses as a supplemental performance measure. The most directly comparable GAAP measure is net earnings. EBITDA is net earnings adjusted for net interest expense (including debt retirement costs), income taxes, and depreciation and amortization. It should not be considered as an alternative to net earnings computed under GAAP.2 Interest expense, net for the fourth quarter and twelve months ended 2016 includes debt retirement costs of $0.4 million.3 Adjusted EBITDA excludes the impact of the items listed that we do not believe are indicative of our core operating performance. Twelve Months Ended December 31, (Dollars in thousands) Q1'16 Q2'16 Q3'16 Q4'16 Q1'17 Q2'17 Q3'17 Q4'17 2016 2017 Earnings before interest, income taxes, and depreciation & amortization (EBITDA)1 GAAP net earnings $18,446 $20,864 $901 $9,343 $7,515 $8,037 $863 $80,924 $49,554 $97,339 Interest expense, net2 7,643 7,396 7,520 8,092 8,043 7,673 7,683 7,975 30,651 31,374 Income tax provision (benefit) 11,673 11,905 859 6,675 5,000 3,955 (3,095 ) (62,245 ) 31,112 (56,385 ) Depreciation and amortization expense 21,150 22,024 22,747 25,169 27,557 26,055 25,856 25,522 91,090 104,990 EBITDA1 $58,912 $62,189 $32,027 $49,279 $48,115 $45,720 $31,307 $52,176 $202,407 $177,318 Directors' equity-based compensation expense (benefit) 726 3,610 89 354 (1,450 ) (1,483 ) 463 (363 ) 4,779 (2,833 ) Costs associated with Long Island facility closure 432 533 466 460 466 365 314 298 1,891 1,443 Gain associated with the sale of the specialty mills, net — — (1,755 ) — — — — — (1,755 ) — Pension settlement expense — — 3,482 — — — — — 3,482 — Costs associated with Oklahoma City facility closure — — — 318 2,074 275 5,057 3,649 318 11,055 Costs associated with Neenah paper machines shutdown — — — 1,049 — — — — 1,049 — Manchester Industries acquisition related expenses — — — 2,665 115 105 — — 2,665 220 Write-off of assets as a result of Warehouse Automation project — — — — — 41 — — — 41 Reorganization expenses associated with SG&A cost control measures — — — — — — 480 1,783 — 2,263 Adjusted EBITDA3 $60,070 $66,332 $34,309 $54,125 $49,320 $45,023 $37,621 $57,543 $214,836 $189,507 28

SEGMENT EBITDA & ADJUSTED EBITDA RECONCILIATION OF NON-GAAPFINANCIAL MEASURES (UNAUDITED) 1 Segment EBITDA is a non-GAAP measure that management uses as a supplemental performance measure. The most directly comparable GAAP measure is segment operating income (loss). Segment EBITDA is segment operating income (loss) adjusted for depreciation and amortization. It should not be considered as an alternative to segment operating income (loss) computed under GAAP. 2 Segment Adjusted EBITDA excludes the impact of the items listed that we do not believe are indicative of our core operating performance. Twelve Months Ended December 31, (Dollars in thousands) Q1'16 Q2'16 Q3'16 Q4'16 Q1'17 Q2'17 Q3'17 Q4'17 2016 2017 Consumer Products Operating income $18,390 $18,544 $17,201 $13,781 $6,189 $10,534 $4,436 $7,457 $67,916 $28,616 Depreciation and amortization expense 13,759 14,203 15,022 16,391 18,242 16,292 16,073 14,400 59,375 65,007 Segment EBITDA1 $32,149 $32,747 $32,223 $30,172 $24,431 $26,826 $20,509 $21,857 $127,291 $93,623 Costs associated with Long Island facility closure 432 533 466 460 466 365 314 298 1,891 1,443 Gain associated with the sale of the specialty mills, net — — (1,755 ) — — — — — (1,755 ) — Costs associated with Oklahoma City facility closure — — — 318 2,074 275 5,057 3,649 318 11,055 Costs associated with Neenah paper machines shutdown — — — 1,049 — — — — 1,049 — Write-off of assets as a result of Warehouse Automation project — — — — — 41 — — — 41 Reorganization expenses associated with SG&A cost control measures — — — — — — — 20 — 20 Segment Adjusted EBITDA2 $32,581 $33,280 $30,934 $31,999 $26,971 $27,507 $25,880 $25,824 $128,794 $106,182 Pulp and Paperboard Operating income $35,163 $40,032 $9,956 $27,581 $27,248 $21,595 $15,023 $34,642 $112,732 $98,508 Depreciation and amortization expense 6,367 6,449 6,530 7,395 8,105 8,356 8,328 9,685 26,741 34,474 Segment EBITDA1 $41,530 $46,481 $16,486 $34,976 $35,353 $29,951 $23,351 $44,327 $139,473 $132,982 Reorganization expenses associated with SG&A cost control measures — — — — — — — 132 — 132 Segment Adjusted EBITDA2 $41,530 $46,481 $16,486 $34,976 $35,353 $29,951 $23,351 $44,459 $139,473 $133,114 Corporate Operating loss ($15,791 ) ($18,411 ) ($17,877 ) ($17,252 ) ($12,879 ) ($12,464 ) ($14,008 ) ($15,445 ) ($69,331 ) ($54,796 ) Depreciation and amortization expense 1,024 1,372 1,195 1,383 1,210 1,407 1,455 1,437 4,974 5,509 Corporate EBITDA1 ($14,767 ) ($17,039 ) ($16,682 ) ($15,869 ) ($11,669 ) ($11,057 ) ($12,553 ) ($14,008 ) ($64,357 ) ($49,287 ) Directors' equity-based compensation expense (benefit) 726 3,610 89 354 (1,450 ) (1,483 ) 463 (363 ) 4,779 (2,833 ) Pension settlement expense — — 3,482 — — — — — 3,482 — Manchester Industries acquisition related expenses — — — 2,665 115 105 — — 2,665 220 Reorganization expenses associated with SG&A cost control measures — — — — — — 480 1,631 — 2,111 Corporate Adjusted EBITDA2 ($14,041 ) ($13,429 ) ($13,111 ) ($12,850 ) ($13,004 ) ($12,435 ) ($11,610 ) ($12,740 ) ($53,431 ) ($49,789 ) 29

1 Discretionary free cash flow is defined as net cash provided by operating activities less payments for maintenance capital expenditures. Management uses free cash flow to help assess the cash generation ability of the company and funds available for investing activities, such as acquisitions, investing in the business to drive growth, and financing activities, including debt payments and share repurchases. Free cash flow does not represent cash available only for discretionary expenditures, since the Company has mandatory debt service requirements and other contractual and non-discretionary expenditures. In addition, free cash flow may not be the same as similar measures provided by other companies due to potential differences in methods of calculation and items being excluded. 2 Maintenance capital expenditures consists of non-discretionary capital expenditures for purposes of replacing or maintaining current assets or that are essential in nature for health, safety or environmental purposes. DISCRETIONARY FREE CASH FLOW RECONCILIATION OF NON-GAAP FINANCAIL MEASURE (UNAUDITED) DISCRETIONARY FREE CASH FLOW1 Twelve Months Ending December 31, (Dollars in millions) 2016 2017 GAAP net cash provided by operating activities 172,751 $177,670 Payments for maintenance capital expenditures2 (59,400 ) (41,323 ) Discretionary free cash flow1 $113,351 $136,347 30

FOR MORE INFORMATION:WWW.CLEARWATERPAPER.COM 31