Attached files
| file | filename |
|---|---|
| EX-99.1 - EXHIBIT 99.1 - Prestige Consumer Healthcare Inc. | exhibit991fy18-q3earningsr.htm |
| 8-K - 8-K - Prestige Consumer Healthcare Inc. | a8-kpressreleasedecember31.htm |

Exhibit 99.2
This presentation contains certain “forward-looking” statements within the meaning of the Private Securities Litigation Reform Act of 1995, such
as statements regarding the Company’s expected financial performance, including revenue growth, adjusted EPS, and adjusted free cash flow;
the Company’s ability to de-lever; the availability of M&A opportunities; the market position and consumption trends for the Company’s brands;
the Company’s focus on brand-building; and the impact of tax reform, including on the Company’s effective tax rate, cash flow, ability to pay
down debt and fund M&A. Words such as “trend,” “continue,” “will,” “expect,” “project,” “anticipate,” “likely,” “estimate,” “may,” “should,” “could,”
“would,” and similar expressions identify forward-looking statements. Such forward-looking statements represent the Company’s expectations
and beliefs and involve a number of known and unknown risks, uncertainties and other factors that may cause actual results to differ materially
from those expressed or implied by such forward-looking statements. These factors include, among others, general economic and business
conditions, regulatory matters, competitive pressures, supplier issues, disruptions to distribution, unexpected costs or liabilities, and other risks
set forth in Part I, Item 1A. Risk Factors in the Company’s Annual Report on Form 10-K for the year ended March 31, 2017 and in Part II, Item 1A
Risk Factors in the Company’s Quarterly Report on Form 10-Q for the quarter ended December 31, 2017. You are cautioned not to place undue
reliance on these forward-looking statements, which speak only as of the date this presentation. Except to the extent required by applicable law,
the Company undertakes no obligation to update any forward-looking statement contained in this presentation, whether as a result of new
information, future events, or otherwise.
All adjusted GAAP numbers presented are footnoted and reconciled to their closest GAAP measurement in the attached reconciliation schedules
or in our February 1, 2018 earnings release in the “About Non-GAAP Financial Measures” section.


Q3 Revenue of $270.6 million, up 24.8% versus PY Q3
Revenue increase of 2.0%(1) pro forma for the Fleet acquisition
– As expected, Q3 average shipment times reverted to historical levels
Solid total company consumption growth of 2.4%(2) exceeded shipment growth
Adjusted EPS of $0.70(3), up versus $0.61 PY Q3
Gross Margin of 54.6%
– Margin negatively impacted by higher freight and warehouse costs
– Expect margin impact of these costs to persist in Q4
Continued solid Adjusted Free Cash Flow of $44.8 million(3), resulting in leverage of 5.4x(4)
One year post-closing, the focus at Fleet continues to be on brand building
Continued strategy of de-leveraging to build future M&A capacity
Expect consistent pipeline of M&A opportunities in FY 19 and beyond


Differentiated Consumer Engagement Differentiated Formulation
New Products That Enhance Consumer Experience New Products That Enhance Efficacy

Long-Term Brand-Building Toolkit
* IRI MULO Data as of calendar year-end 2017; Categories include those pertaining to PBH’s core brands (SE, Monistat, BC / Goody’s, Clear Eyes, DenTek, Dramamine, Beano, Fleet, Boudreaux’s, Little
Remedies, The Doctor’s, Efferdent, Chloraseptic, Luden’s, Debrox, Compound W, Nix)
(0.4%)
2.5%
3.7%
Private Label Categories
Growing the Category and Outpacing Private Label
*
Together, NPD and Brand-Building Differentiate versus Private Label and Branded Competition
2012 – 2017 Consumption CAGR*
Leverage portfolio’s long-standing brand heritage with
focused digital and content marketing
Develop consumer insights to refine brand-building
efforts
Focus new product development on attractive
opportunities that are key to category growth
Capitalize on new channel development opportunities

Solid financial performance in Q3 and YTD Q3 FY 18:
− Q3 Revenue of $270.6 million, an increase of 24.8% vs prior year
− Q3 Adjusted EBITDA(3) of $93.0 million, an increase of 24.1% vs prior year
− Q3 Adjusted EPS of $0.70(3), an increase of 14.8% vs prior year
$270.6
$93.0
$216.8
$74.9
Total Revenue Adjusted EBITDA Adjusted EPS
Q3 FY 18 Q3 FY 17
24.8%
24.1% 14.8%
$0.70 $0.61
(3) (3)
Dollar values in millions, except per share data.
$785.2
$270.2
$641.4
$229.6
Total Revenue Adjusted EBITDA Adjusted EPS
YTD Q3 FY 18 YTD Q3 FY 17
22.4%
17.7%
7.7%
$1.97 $1.83
(3) (3)

Q3 FY 18 Q3 FY 17 % Chg Q3 FY 18 Q3 FY 17 % Chg
Total Revenue 270.6$ 216.8$ 24.8% 785.2$ 641.4$ 22.4%
Adjusted Gross Margin 147.7 124.5 18.6% 439.0 370.1 18.6%
% Margin 54.6% 57.5% 55.9% 57.7%
Adjusted A&P 35.8 30.7 16.8% 112.2 86.9 29.1%
% Total Revenue 13.2% 14.2% 14.3% 13.6%
Adjusted G&A 20.1 18.9 6.1% 60.5 53.6 13.0%
% Total Revenue 7.4% 8.7% 7.7% 8.3%
D&A (ex. COGS D&A) 7.1 5.9 21.8% 21.5 18.7 14.9%
% Total Revenue 2.6% 2.7% 2.7% 2.9%
Adjusted Operating Income 84.6$ 69.1$ 22.5% 244.8$ 210.9$ 16.1%
% Margin 31.3% 31.9% 31.2% 32.9%
Adjusted Earnings Per Share 0.70$ 0.61$ 14.8% 1.97$ 1.83$ 7.7%
Adjusted EBITDA 93.0$ 74.9$ 24.1% 270.2$ 229.6$ 17.7%
% Margin 34.3% 34.6% 34.4% 35.8%
Revenue growth of +24.8%
– YTD Revenue growth of
1.5%(1) pro forma for Fleet
– Fleet contributed $54.1
million of Revenue during the
quarter
Gross Margin of 54.6%(3)
– Increased freight and
warehousing costs during the
quarter
A&P up $5 million from Q3 FY 17
Adjusted G&A(3) of 7.4% of
Revenue from continued
operating leverage
Dollar values in millions, except per share data.
(3)
(3)
(3)
(3)
(3)
(3)

$156.2 $149.9
Adjusted Free Cash Flow
$44.8 $49.6
Adjusted Free Cash Flow
Q3 Adjusted Free Cash Flow impacted by timing of
Capital Expenditures in Q3 vs prior year
Net Debt(3) at December 31 of $2,032 million; leverage
ratio(4) of 5.4x at end of Q3
Total debt reduction of $40 million in Q3 and $145
million in YTD Q3 FY 18
Q3 FY 18 Q3 FY 17 YTD Q3 FY 18 YTD Q3 FY 17
4.1%
(9.7%)
(3) (3)
Dollar values in millions.
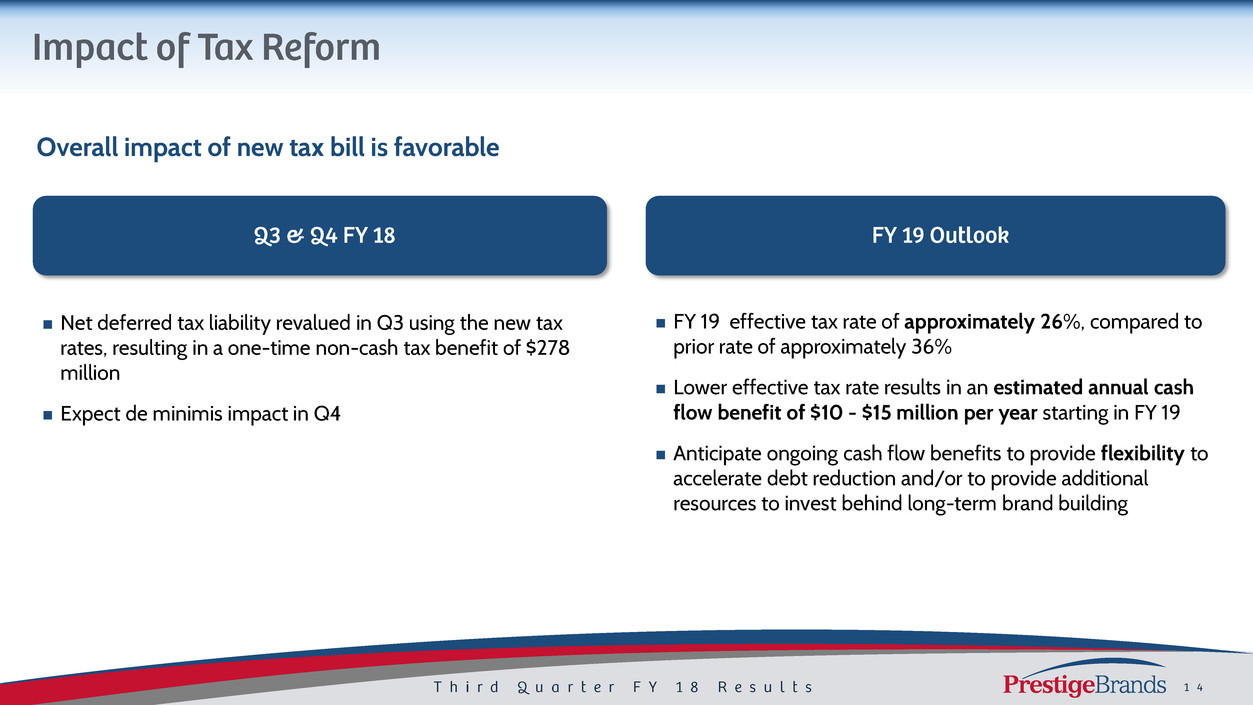
Net deferred tax liability revalued in Q3 using the new tax
rates, resulting in a one-time non-cash tax benefit of $278
million
Expect de minimis impact in Q4
Expect de minimis benefit in Q4
FY 18 blended annual rate of
approximately 31% to 32%
FY 19 effective tax rate of approximately 26%, compared to
prior rate of approximately 36%
Lower effective tax rate results in an estimated annual cash
flow benefit of $10 - $15 million per year starting in FY 19
Anticipate ongoing cash flow benefits to provide flexibility to
accelerate debt reduction and/or to provide additional
resources to invest behind long-term brand building
Overall impact of new tax bill is favorable


Continued solid consumption trends in-line with long-term outlook
Continue to gain share across portfolio
Well positioned for long-term growth despite continued headwinds at retail
Dollar values in millions, except per share data.
Revenue of $1,040 to $1,060 million
— Growth of +18% to +20%
— Pro forma Revenue growth of +2.0% to +2.5%
Both Revenue and Pro Forma Revenue growth in-line
with low end of range due to retailer headwind
— Growth of +18%, Revenue of $1,040 million
Adjusted EPS +9% to +13% ($2.58 to $2.68)(5) Growth of +9%, Adjusted EPS of $2.58(3)
Adjusted Free Cash Flow of $205 million(6) or more No change
New
Revenue growth of 18% or more, or approximately $1,040 million or more, in-line with lower end of
range due to retailer headwinds
Pro forma for the Fleet acquisition, Revenue growth of +[2.0]%
Adjusted EPS $2.58(5) per share or more (growth of 9% or more)
Adjusted Free Cash Flow of $205 million or more(6)


(1) Organic Revenue Growth and Proforma Revenue Growth are Non-GAAP financial measures and are reconciled to the most
closely related GAAP financial measure in the attached Reconciliation Schedules and / or our earnings release in the “About
Non-GAAP Financial Measures” section.
(2) Total company consumption is based on domestic IRI multi-outlet + C-Store retail dollar sales for the twelve month period
ending 12-31-17 and net revenues as a proxy for consumption for certain untracked channels, and international consumption
which includes Canadian consumption for leading retailers, Australia consumption for leading brands, and other international
net revenues as a proxy for consumption.
(3) Adjusted Gross Margin, Adjusted A&P, Adjusted G&A, Adjusted EBITDA, Adjusted Operating Income, Adjusted Net Income,
Adjusted EPS, Adjusted Free Cash Flow and Net Debt are Non-GAAP financial measures and are reconciled to their most closely
related GAAP financial measures in the attached Reconciliation Schedules and / or in our earnings release in the “About Non-
GAAP Financial Measures” section.
(4) Leverage ratio reflects net debt / covenant defined EBITDA.
(5) Adjusted EPS for FY 18 is a projected Non-GAAP financial measure, is reconciled to projected GAAP EPS in the attached
Reconciliation Schedules and / or in our earnings release in the “About Non-GAAP Financial Measures” section and is calculated
based on projected GAAP EPS less costs associated with Fleet integration.
(6) Adjusted Free Cash Flow for FY 18 is a projected Non-GAAP financial measure, is reconciled to projected GAAP Net Cash
Provided by Operating Activities in the attached Reconciliation Schedules and / or in our earnings release in the “About Non-
GAAP Financial Measures” section and is calculated based on projected Net Cash Provided by Operating Activities less projected
capital expenditures plus payments associated with acquisitions less tax effect of payments associated with acquisitions.

Three Months Ended Dec. 31, Nine Months Ended Dec. 31,
2017 2016 2017 2016
(In Thousands)
GAAP Total Revenues $ 270,615 $ 216,763 $ 785,214 $ 641,390
Revenue Growth 24.8% 22.4%
Adjustments:
Revenue associated with acquisitions (54,143) - (160,692) -
Revenues associated with divested brands - (5,921) - (22,905)
Non-GAAP Organic Revenues $ 216,472 $ 210,842 $ 624,522 $ 618,485
Non-GAAP Organic Revenue Growth 2.7% 1.0%
Non-GAAP Organic Revenues $ 216,472 $ 210,842 $ 624,522 $ 618,485
Revenues associated with acquisitions 54,143 54,503 160,692 155,502
Non-GAAP Proforma Revenues $ 270,615 $ 265,345 $ 785,214 $ 773,987
Non-GAAP Proforma Revenue Growth 2.0% 1.5%

Three Months Ended Dec. 31, Nine Months Ended Dec. 31,
2017 2016 2017 2016
(In Thousands)
GAAP Total Revenues $ 270,615 $ 216,763 $ 785,214 $ 641,390
GAAP Gross Profit $ 147,674 $ 124,547 $ 435,248 $ 370,103
Adjustments:
Integration, transition and other costs associated with
acquisitions - - 3,719 -
Total adjustments - - 3,719 -
Non-GAAP Adjusted Gross Margin $ 147,674 $ 124,547 $ 438,967 $ 370,103
Non-GAAP Adjusted Gross Margin as a Percentage of GAAP
Total Revenues 54.6% 57.5% 55.9% 57.7%
Three Months Ended Dec. 31, Nine Months Ended Dec. 31,
2017 2016 2017 2016
(In Thousands)
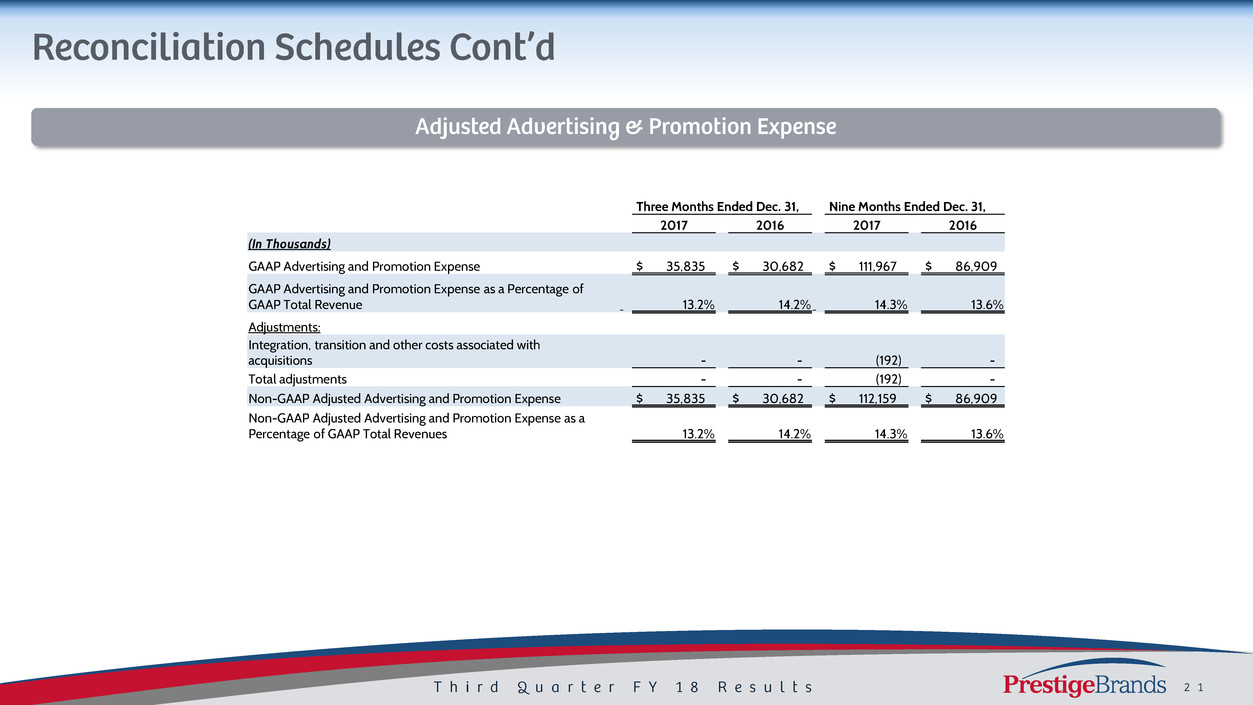
GAAP Advertising and Promotion Expense $ 35,835 $ 30,682 $ 111,967 $ 86,909
GAAP Advertising and Promotion Expense as a Percentage of
GAAP Total Revenue 13.2% 14.2% 14.3% 13.6%
Adjustments:
Integration, transition and other costs associated with
acquisitions - - (192) -
Total adjustments - - (192) -
Non-GAAP Adjusted Advertising and Promotion Expense $ 35,835 $ 30,682 $ 112,159 $ 86,909
Non-GAAP Adjusted Advertising and Promotion Expense as a
Percentage of GAAP Total Revenues 13.2% 14.2% 14.3% 13.6%

Three Months Ended Dec. 31, Nine Months Ended Dec. 31,
2017 2016 2017 2016
(In Thousands)
GAAP General and Administrative Expense 21,207$ 22,131$ 63,110$ 60,383$
GAAP General and Administrative Expense as a Percentage of
GAAP Total Revenue 7.8% 10.2% 8.0% 9.4%
Adjustments:
Integration, transition and other costs associated with
acquisitions and divestitures 405 3,182 1,877 6,828
Tax adjustment associated with acquisitions 704 - 704 -
Total adjustments 1,109 3,182 2,581 6,828
Non-GAAP Adjusted General and Administrative Expense 20,098$ 18,949$ 60,529$ 53,555$
Non-GAAP Adjusted General and Administrative Expense
Percentage as a Percentage of GAAP Total Revenues 7.4% 8.7% 7.7% 8.3%

Three Months Ended Dec. 31, Nine Months Ended Dec. 31,
2017 2016 2017 2016
(In Thousands)
GAAP Net Income 314,793$ 31,641$ 379,257$ 58,305$
Interest expense, net 25,864 18,554 79,041 60,511
(Benefit) provision for income taxes (257,154) 19,092 (219,609) 33,743
Depreciation and amortization 8,340 5,852 25,381 18,700
Non-GAAP EBITDA 91,843 75,139 264,070 171,259
Non-GAAP EBITDA Margin 33.9% 34.7% 33.6% 26.7%
Adjustments:
Integration, transition and other costs associated with acquisitions
and divestitures in Cost of Goods Sold - - 3,719 -
Integration, transition and other costs associated with acquisitions
and divestitures in Advertising and Promotion Expense - - (192) -
Integration, transition and other costs associated with acquisitions
and divestitures in General and Administrative Expense 405 3,182 1,877 6,828
Tax adjustment associated with acquisitions 704 - 704 -
(Gain) loss on divestitures - (3,405) - 51,552
Total adjustments 1,109 (223) 6,108 58,380
Non-GAAP Adjusted EBITDA 92,952$ 74,916$ 270,178$ 229,639$
Non-GAAP Adjusted EBITDA Margin 34.3% 34.6% 34.4% 35.8%

Three Months Ended Dec. 31, Nine Months Ended Dec. 31,
2017 2016 2017 2016
Net
Income EPS
Net
Income EPS
Net
Income EPS
Net
Income EPS
(In Thousands, except per share data)
GAAP Net Income 314,793$ 5.88$ 31,641$ 0.59$ 379,257$ 7.08$ 58,305$ 1.09$
Adjustments:
Integration, transition and other costs associated with
acquisitions and divestitures in Cost of Goods Sold - - - - 3,719 0.07 - -
Integration, transition and other costs associated with
acquisitions and divestitures in Advertising and
Promotion Expense - - - - (192) - - -
Integration, transition and other costs associated with
acquisitions and divetitures in General and
Administrative Expense 405 0.01 3,182 0.06 1,877 0.04 6,828 0.13
Tax adjustment associated with acquisition in General
and Administrative Expense 704 0.01 - - 704 0.01 - -
Accelerated amortization of debt origination costs - - - - - - 1,131 0.02
(Gain) loss on divestitures - - (3,405) (0.06) - - 51,552 0.97
Tax impact of adjustments (405) (0.01) 2,638 0.05 (2,230) (0.04) (18,586) (0.35)
Normalized tax rate adjustment (278,192) (5.19) (1,477) (0.03) (277,880) (5.19) (1,477) (0.03)
Total Adjustments (277,488) (5.18) 938 0.02 (274,002) (5.11) 39,448 0.74
Non-GAAP Adjusted Net Income and Adjusted EPS 37,305$ 0.70$ 32,579$ 0.61$ 105,255$ 1.97$ 97,753$ 1.83$
Three Months Ended Dec. 31, Nine Months Ended Dec. 31,
2017 2016 2017 2016
(In Thousands)
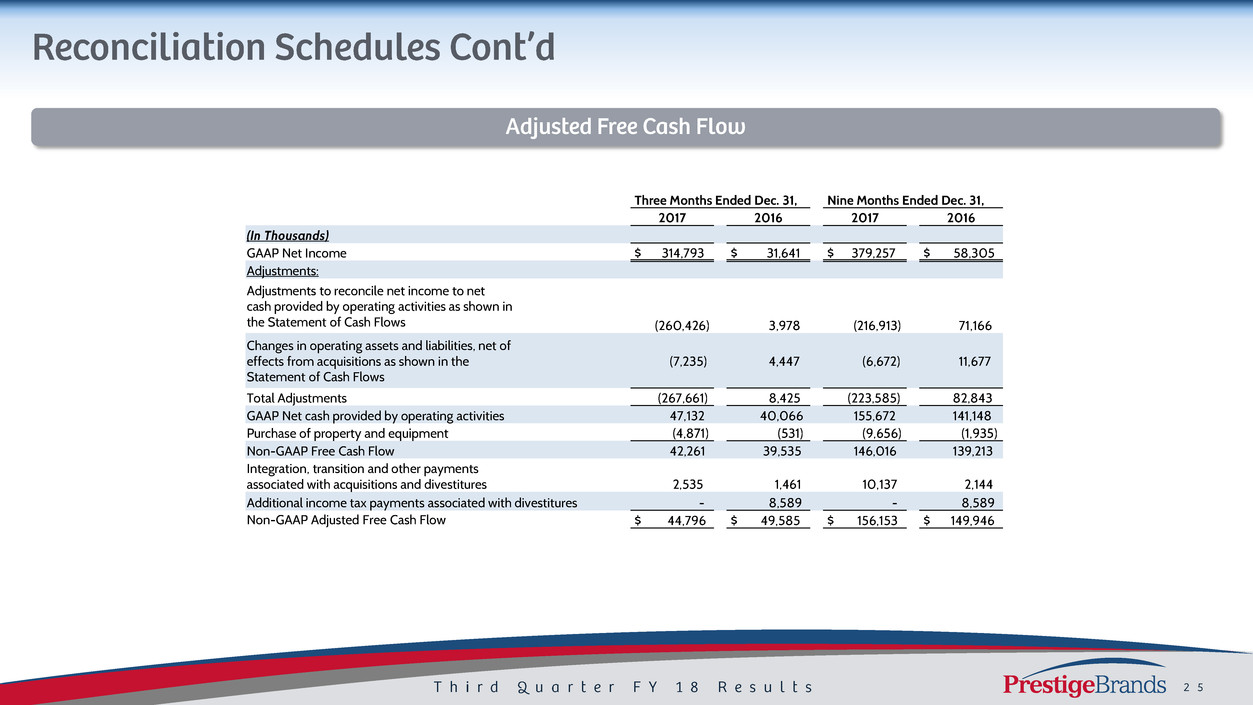
GAAP Net Income $ 314,793 $ 31,641 $ 379,257 $ 58,305
Adjustments:
Adjustments to reconcile net income to net
cash provided by operating activities as shown in
the Statement of Cash Flows (260,426) 3,978 (216,913) 71,166
Changes in operating assets and liabilities, net of
effects from acquisitions as shown in the
Statement of Cash Flows
(7,235) 4,447 (6,672) 11,677
Total Adjustments (267,661) 8,425 (223,585) 82,843
GAAP Net cash provided by operating activities 47,132 40,066 155,672 141,148
Purchase of property and equipment (4,871) (531) (9,656) (1,935)
Non-GAAP Free Cash Flow 42,261 39,535 146,016 139,213
Integration, transition and other payments
associated with acquisitions and divestitures 2,535 1,461 10,137 2,144
Additional income tax payments associated with divestitures - 8,589 - 8,589
Non-GAAP Adjusted Free Cash Flow $ 44,796 $ 49,585 $ 156,153 $ 149,946
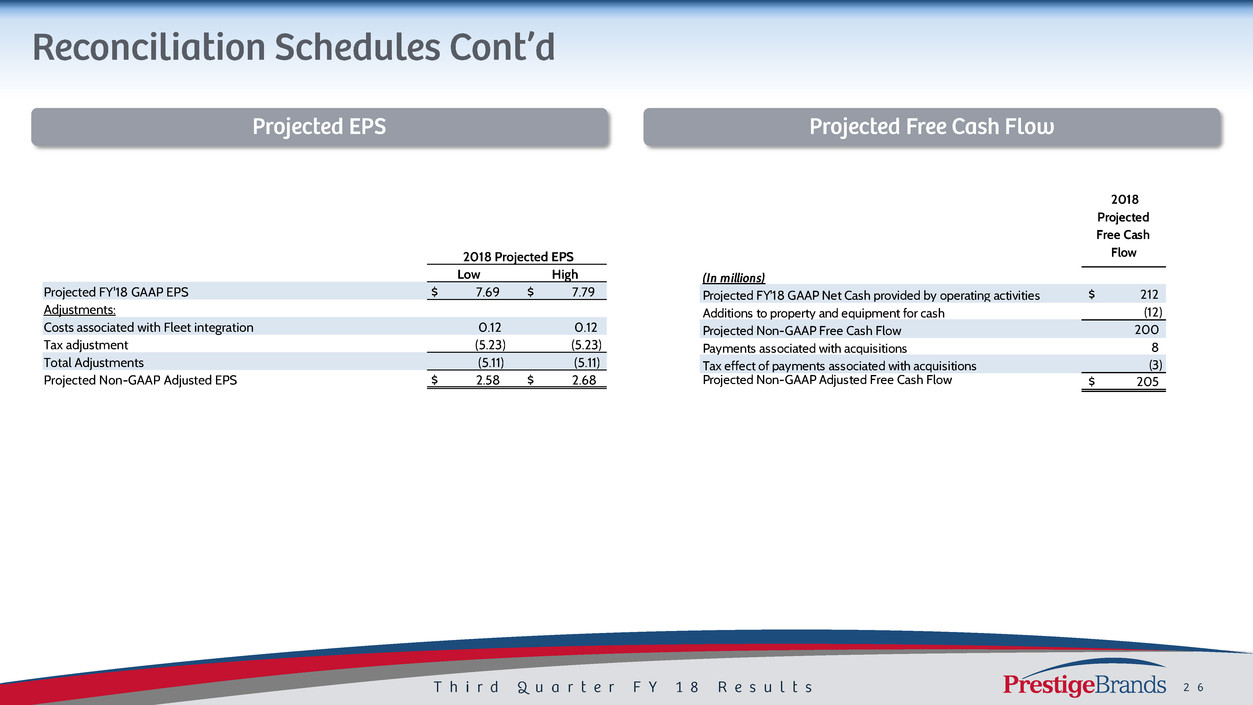
2018 Projected EPS
Low High
Projected FY'18 GAAP EPS $ 7.69 $ 7.79
Adjustments:
Costs associated with Fleet integration 0.12 0.12
Tax adjustment (5.23) (5.23)
Total Adjustments (5.11) (5.11)
Projected Non-GAAP Adjusted EPS $ 2.58 $ 2.68
2018
Projected
Free Cash
Flow
(In millions)
Projected FY'18 GAAP Net Cash provided by operating activities 212$
Additions to property and equipment for cash (12)
Projected Non-GAAP Free Cash Flow 200
Payments associated with acquisitions 8
Tax effect of payments associated with acquisitions (3)
Projected Non-GAAP Adjusted Free Cash Flow 205$
