Attached files
| file | filename |
|---|---|
| 8-K - BANKWELL FINANCIAL GROUP, INC. 8-K 1 31 18 - Bankwell Financial Group, Inc. | bwfg8k-013118.htm |
| EX-99.1 - EXHIBIT 99.1 - PRESS RELEASE - Bankwell Financial Group, Inc. | ex99-1.htm |

Bankwell Financial Group4Q’17 Investor Presentation

Safe Harbor This presentation may contain certain forward-looking statements about the Company. Forward-looking statements include statements regarding anticipated future events and can be identified by the fact that they do not relate strictly to historical or current facts. They often include words such as “believe,” “expect,” “would,” “should,” “could,” or “may.” Forward-looking statements, by their nature, are subject to risks and uncertainties. Certain factors that could cause actual results to differ materially from expected results include increased competitive pressures, changes in the interest rate environment, general economic conditions or conditions within the securities markets, and legislative and regulatory changes that could adversely affect the business in which the Company and its subsidiaries are engaged.

Bankwell : A Growth Story Bankwell is one of the fastest growing and most profitable community banks in Connecticut. Named “One of the Top 100 Community Banks Under $10 billion” in 2016 1Named a 2017 Sandler O’Neill and Partners “Sm-All Star” 2 March 21, 2017 report issued by S&P Global Market Intelligence29 institutions comprise the 2017 list, which has the objective to identify the top performing small-cap banks and thrifts in the country 2016 $1,628,919 Strengthened executive, credit and finance teams 2017 $1,796,607 Bankwell Throughout The YearsAssets

Why Bankwell? Consistently strong performer in highly attractive markets 1 as of December 31st, 2017

Bankwell Profile $1.80B asset Connecticut-based bank with key focus on CRE and C&I lending9 existing branches in Fairfield & New Haven Counties with 3 opening in 2Q’18Strong performance in ‘17, but reported metrics significantly impacted by DTA write down due to Dec-17 tax law change:8.93% Return on Equity 0.80% Return on Avg Assets$20.59 Tangible Book ValueConsidered “Well Capitalized”; Capital Ratios1 exceeding required levels: 9.61% Tier 1 Leverage 10.99% CET 1 / RWA 12.19% Total Capital / RWA Company Overview NASDAQ: BWFG Footprint Existing branches (9)Branch application approved (3) Attractive core market of Fairfield County / Bridgeport-Stamford-Norwalk MSA2nd most affluent MSA & per capita personal income (PCPI) among highest in the USA18.3% of MSA households earn enough to rank in the top 5% all US householdsOpportunity to expand without risk of cannibalization 1 Regulatory ratios are Bank ratios based on call report filings

4Q’17 Highlights Reported net income of $2.1MM, or $0.27 per share for 4Q’17, versus $3.3MM or $0.43 per share for the same period in 2016The Company's Board of Directors declared a $0.12 per share cash dividend, a 71% increasePerformance driven by strong organic loan growth, record gross loan balance of $1.54BGross Loans increased $177MM from year-end 2016Year-to-date metrics reflect outstanding core portfolio performance; i.e. loan yield (4.50%) & NIM (3.30%)2017 loan & asset growth funded without increasing the Bank’s reliance on Wholesale funds as a percent of assetsSeveral one-time items contributed to a $0.26 reduction in reported 4Q’17 EPS; on a “core” basis, 4Q’17 EPS is $0.531$(3.3MM) tax adjustment due to DTA write off, as a result of the tax law changes enacted in late 2017$0.9MM after tax adjustment due to a reduction of the ALLL reserve as a result of a methodology change$0.6MM after tax credit as a result of refining the servicingasset model assumptions for servicing retained loan sales$0.2MM after tax charge due to strategic decision to stopResidential Mortgage loan origination 1 Please refer to BWFG’s 4Q’17 Earnings Release for further detail

Financial Highlights Dollars in thousands, except per share data 2014 2015 2016 2017 Total assets $1,099,531 $1,330,372 $1,628,919 $1,796,607 Loans, net $915,981 $1,129,748 $1,343,895 $1,520,879 Loans to deposits 110.7% 109.1% 105.6% 110.1% Efficiency ratio 68.7% 62.3% 56.5% 54.9% Net interest margin 3.84% 3.77% 3.54% 3.30% Total capital to risk weighted assets 13.55% 13.39% 12.85% 12.19% Return on average equity 5.13% 6.76% 8.94% 8.93% Tangible book value per share $16.35 $17.43 $18.98 $20.59 Net interest income $31,660 $42,788 $49,092 $54,364 Net income $4,568 $9,030 $12,350 $13,830 EPS (fully diluted) $0.78 $1.21 $1.62 $1.78 1 1 Values are based on reported earnings / performance, which includes impact of DTA write-off, ALLL methodology change and other “one-off” items please refer to BWFG’s 4Q’17 Earnings Release for further detail

Consolidated Statement of Income 4Q’17 3Q’17 4Q’16Total Interest Income $18.7 $18.3 $16.6Total Interest Expense $4.8 $4.5 $3.4Net Interest Income $13.9 $13.9 $13.3(Credit) / Provision for Loan Losses $(0.5) $0.4 $0.7Net Interest Income after Provision $14.4 $13.5 $12.5Non Interest Income $1.5 $0.8 $0.4Non Interest Expense $8.6 $8.1 $7.8Pre-Tax Income $7.4 $6.2 $5.2Income Tax Expense $5.3 $1.9 $1.9Reported Net Income (Loss) $2.1 $4.3 $3.3EPS $0.27 $0.55 $0.43 Key drivers vs prior quarter Net Interest Income growth driven by strong loan originations, partially offset from rising cost of funds on deposits & increased borrowingsProvision for Loan Losses favorable due to one-time adjustment reflecting ALLL methodology changeNon Interest Income favorable as a result of refining the servicing asset model assumptions for servicing retained loan salesNon Interest Expense increase over prior quarter in support of ongoing business growth, reflected in increased C&B & Occupancy / Equipment expensesTax Expense reflects one-time DTA write off due to new Corporate Tax rate $MMs 1 Please refer to BWFG’s 4Q’17 Earnings Release for further detail 1 1 1
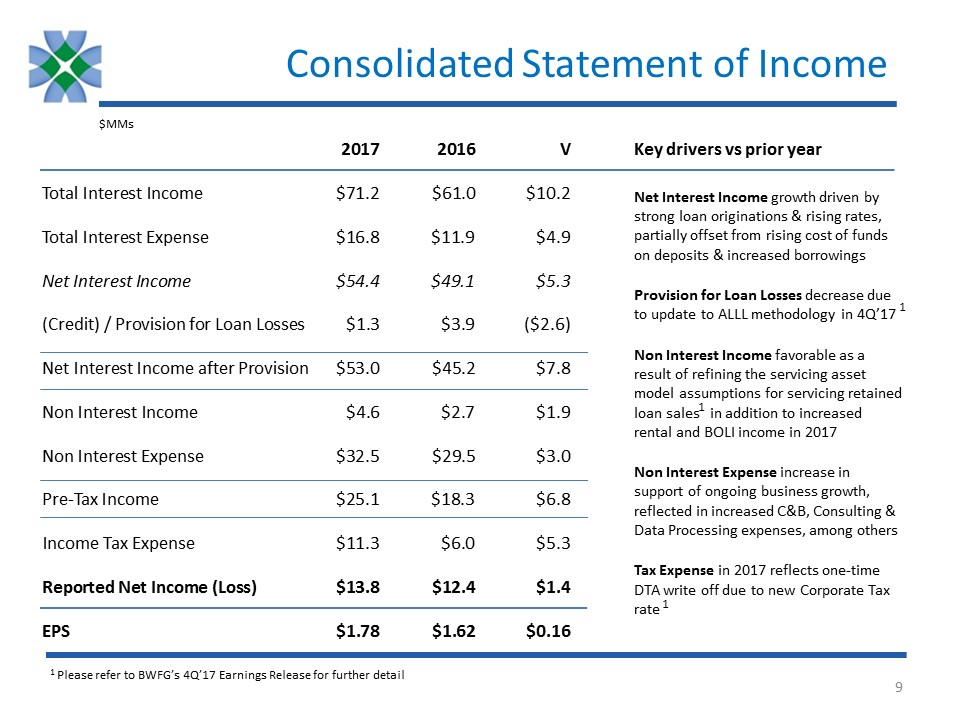
Consolidated Statement of Income 2017 2016 VTotal Interest Income $71.2 $61.0 $10.2Total Interest Expense $16.8 $11.9 $4.9Net Interest Income $54.4 $49.1 $5.3(Credit) / Provision for Loan Losses $1.3 $3.9 ($2.6)Net Interest Income after Provision $53.0 $45.2 $7.8Non Interest Income $4.6 $2.7 $1.9Non Interest Expense $32.5 $29.5 $3.0Pre-Tax Income $25.1 $18.3 $6.8Income Tax Expense $11.3 $6.0 $5.3Reported Net Income (Loss) $13.8 $12.4 $1.4EPS $1.78 $1.62 $0.16 Key drivers vs prior yearNet Interest Income growth driven by strong loan originations & rising rates, partially offset from rising cost of funds on deposits & increased borrowingsProvision for Loan Losses decrease due to update to ALLL methodology in 4Q’17Non Interest Income favorable as a result of refining the servicing asset model assumptions for servicing retained loan sales in addition to increased rental and BOLI income in 2017Non Interest Expense increase in support of ongoing business growth, reflected in increased C&B, Consulting & Data Processing expenses, among othersTax Expense in 2017 reflects one-time DTA write off due to new Corporate Tax rate $MMs 1 Please refer to BWFG’s 4Q’17 Earnings Release for further detail 1 1 1

Financial Performance Trends $MMs Net IncomeCAGR 18% RevenueCAGR 20% YTD Metrics Reported CoreROAE 8.93% 10.16%ROAA 0.80% 0.91%ROATCE 9.10% 10.36%Net Income $13.8MM $15.7MM One-time non-recurring charges negatively impacted earnings in 4Q’17See page 6 in this presentation and 4Q’17 Earnings Release for further details

Loan Portfolio CAGR 18% $MMs $1,543 $1,366 $1,148 $930

Loan Portfolio Concentration Commercial Real Estate Total Loan Portfolio Consumer/ Other 1 1 Includes Owner Occupied CRE December 2017 Product & Property Type Diversification Ongoing stratification and in-depth monitoring of concentration limits

Loan Portfolio Concentration: CRE Geography Distribution Measured Approach To ExpansionFollowing Existing Customers To New Locations CRE to Risk Based Capital Ratio Proven track record as CRE LenderStrong risk management practices in placeDeveloped rigorous suite of risk management reports, enabling multi-level portfolio stratificationTeam of 13 skilled credit analysts with average experience > 20 years Dec 2017
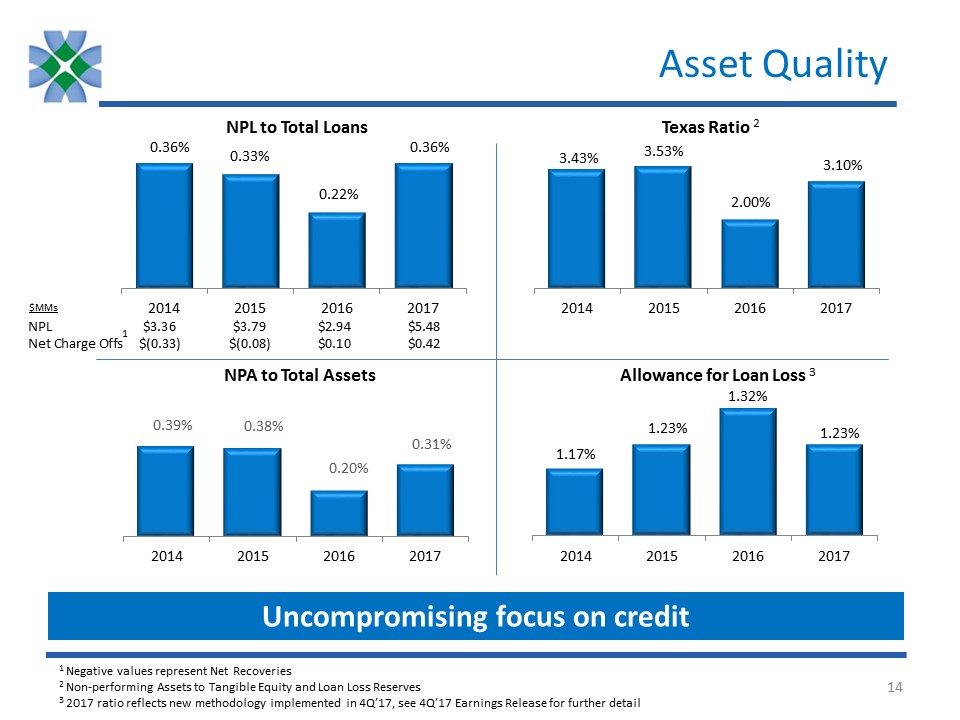
Asset Quality 1 Negative values represent Net Recoveries2 Non-performing Assets to Tangible Equity and Loan Loss Reserves3 2017 ratio reflects new methodology implemented in 4Q’17, see 4Q’17 Earnings Release for further detail NPL to Total Loans Texas Ratio 2 NPL $3.36 $3.79 $2.94 $5.48Net Charge Offs $(0.33) $(0.08) $0.10 $0.42 $MMs 1 Allowance for Loan Loss NPA to Total Assets Uncompromising focus on credit 3

Deposits CAGR 19% $MMs $835 $1,047 $1,289 Deposit growth enabled Bankwell to slightly decrease Wholesale funding as a % of assets 1 Wholesale funding comprised of Listed Time Deposits, Brokered Time Deposits & Money Market Accounts, FHLB borrowings $1,398 1

Deposit Initiatives Branch expansion in existing footprint scheduled for 2Q’18Ongoing expansion of Treasury Management offeringsAdded IOLTA/escrow sub-account functionality, targeting law firms, medical practices, real estate management companies & CPAsLaunched Commercial Card / P-card offeringLaunched Merchant Services programLaunching online account opening in 1Q’18

Management Team Name Years Experience Selected Professional Biography At Bankwell Christopher GrusekePresident & CEO(since 2015) 25+ Founding investor of Bankwell’s precursor, Bank of New Canaan, member of BoD and ALCO Committee 2009 to 201220 year Investment Banking career focused on financial institutions, securitizations and interest rate risk managementManagement positions include Chief Operating Officer of Greenwich Capital Markets Rebuilt Leadership teamFocus on financial performance Penko IvanovEVP & CFO(since 2016) 25+ CFO for Darien Rowayton Bank & Doral Bank’s US OperationsProven track record in building, improving and overseeing all areas of Finance, including Controllership, SOX, Treasury, FP&A, as well as internal and external reporting functionsPrior experience include 8 yrs with GE Capital in various finance roles Restructured Finance team with 5 new hires in 2017Scaled closing, reporting & FP&A processes for future growth Heidi S. DeWyngaertEVP & Chief Lending Officer(since 2004) 30+ Previously at Webster Bank, managing the Fairfield County Commercial Real Estate group10 years as Vice President for CRE at First Union National Bank High quality direct commercial lending13 years building broad network Creation of Portfolio Management team David P. DineenEVP & Head of Community Banking(since 2016) 30+ Previously at Capital One Commercial Bank as the National Market Manager for Treasury Management and Deposit Services Managed Retail Branch networks and Treasury Management sales teams at NorthFork Bank and Commerce Bank Build out of new Treasury Management (“TM”) teamInvesting in new TM products & ServicesInvesting in online account opening Christine A. ChivilyEVP & Chief Risk & Credit Officer (since 2013) 30+ Previously a Risk Manager for CRE and C&I at Peoples United BankSVP/Senior Credit Officer at RBS Greenwich Capital Markets (11 yrs); Director - Northeast Region, Multifamily at Freddie Mac (5 yrs); Manager, Loan Servicing - Distressed Assets at M&T Bank Built team of 13 skilled credit analysts with average experience > 20 yearsExpanded annual loan review & stress testing process Laura J. WaitzEVP & Chief of Staff(since 2017) 30+ Previously Senior Managing Director, Global Head of Human Resources at The Blackstone Group (9 yrs)Also at Citi Alternative Investments as MD & Global Head of Compensation & at Deutsche Bank as Head of Compensation (Americas) & as Global Compensation Mgr. for Private Equity & Investment Bank
