Attached files
| file | filename |
|---|---|
| 8-K - 8-K - APARTMENT INVESTMENT & MANAGEMENT CO | a8-kq42017earningsrelease.htm |

Page
Earnings Release | ||
Consolidated Statements of Operations | ||
Consolidated Balance Sheets | ||
Schedule 1 – Funds From Operations and Adjusted Funds From Operations Reconciliation | ||
Schedule 2 – Funds From Operations and Adjusted Funds From Operations Information | ||
Schedule 3 – Property Net Operating Income | ||
Schedule 4 – Apartment Home Summary | ||
Schedule 5 – Capitalization and Financial Metrics | ||
Schedule 6 – Same Store Operating Results | ||
Schedule 7 – Real Estate Portfolio Data by Market | ||
Schedule 8 – Disposition and Acquisition Activity | ||
Schedule 9 – Real Estate Capital Additions Information | ||
Schedule 10 – Redevelopment/Development Portfolio | ||
Glossary and Reconciliations of Non-GAAP Financial and Operating Measures | ||

Aimco Reports Fourth Quarter Results
Denver, Colorado, February 1, 2018 - Apartment Investment and Management Company (“Aimco”) (NYSE: AIV) announced today fourth quarter results for 2017.
Chairman and Chief Executive Officer Terry Considine comments: “2017 was a solid year for Aimco. Revenues were up, expenses were almost flat, and Aimco achieved NOI growth greater than 4% for the 7th year in a row. The quality of the Aimco portfolio improved through value created by our redevelopment and transaction activities, contributing to average revenue per apartment home of $2,123, up 7%.
“In 2018, we expect consumer demand for apartments to be strong, supported by favorable demographics and an accelerating economy. The diversification of the Aimco portfolio provides a hedge against elevated supply in some markets. We expect Aimco’s investment in redevelopment and development activities to increase Net Asset Value and to contribute future earnings growth.”
Chief Financial Officer Paul Beldin adds: “2017 AFFO of $2.12 per share met the midpoint of our guidance range, Pro forma FFO of $2.45 per share was $0.01 ahead of the midpoint of guidance, and Same Store NOI growth was comfortably within our guidance range. The Aimco balance sheet is safe and strong with abundant liquidity and with minimal borrowings on our $600 million revolving credit facility.
“In 2018, Aimco expects earnings from our Same Store, Redevelopment and Other Real Estate portfolios to add $0.10 per share to AFFO. This earnings growth will be offset somewhat by lower earnings from the planned and continuing wind down of our Asset Management business and lower income tax benefits due to the recent tax law change. We anticipate Pro forma FFO per share in a range of $2.42 to $2.52 and AFFO per share in a range of $2.11 to $2.21.”
Financial Results: Full Year Pro forma FFO Up 6%; AFFO Up 8%
FOURTH QUARTER | FULL YEAR | ||||||||||||||||||||
(all items per common share - diluted) | 2017 | 2016 | Variance | 2017 | 2016 | Variance | |||||||||||||||
Net income | $ | 1.67 | $ | 1.03 | 62 | % | $ | 1.96 | $ | 2.67 | (27 | %) | |||||||||
Funds From Operations (FFO) | $ | 0.63 | $ | 0.60 | 5 | % | $ | 2.45 | $ | 2.31 | 6 | % | |||||||||
Add back Aimco share of preferred equity redemption related amounts | $ | — | $ | — | — | % | $ | — | $ | 0.01 | (100 | %) | |||||||||
Pro forma Funds From Operations (Pro forma FFO) | $ | 0.63 | $ | 0.60 | 5 | % | $ | 2.45 | $ | 2.32 | 6 | % | |||||||||
Deduct Aimco share of Capital Replacements | $ | (0.07 | ) | $ | (0.10 | ) | (30 | %) | $ | (0.33 | ) | $ | (0.35 | ) | (6 | %) | |||||
Adjusted Funds From Operations (AFFO) | $ | 0.56 | $ | 0.50 | 12 | % | $ | 2.12 | $ | 1.97 | 8 | % | |||||||||
Net Income (per diluted common share) - Year-over-year, fourth quarter net income increased primarily due to higher gains on the sale of apartment communities.
Pro forma FFO (per diluted common share) - Aimco’s fourth quarter Pro forma FFO increased by $0.03 per share, or 5%, on a year-over-year basis. Property results contributed the following to Pro forma FFO:
• | $0.02 from Same Store Property Net Operating Income growth of 3.1%, driven by a 2.8% increase in revenue, offset by a 2.1% increase in expenses; and |
• | $0.01 from the lease-up over the last 12 months of more than 800 renovated homes at Redevelopment communities and completion of the lease-up of One Canal in Boston, Massachusetts and Indigo in Redwood City, California; offset by |
• | ($0.03) lower Property Net Operating Income from apartment communities sold in 2016. |
| 1 |
As compared to 2016, lower interest rates, higher transactional income, and other factors contributed an additional $0.03 to Pro forma FFO.
The results above exclude Property Net Operating Income from the second quarter reacquisition of the 47% interest in the Palazzo communities, which was largely offset by higher interest expense related to temporary borrowings used to fund the purchase.
Adjusted Funds from Operations (per diluted common share) - The $0.03 increase year-over-year in Pro forma FFO per share plus $0.03 in lower capital replacement spending due to fewer apartment homes increased AFFO per share by $0.06, or 12%.
Operating Results: Fourth Quarter Same Store NOI Up 3.1%; Full Year Up 4.2%
FOURTH QUARTER | FULL YEAR | |||||||||||||||
Year-over-Year | Sequential | Year-over-Year | ||||||||||||||
2017 | 2016 | Variance | 3rd Qtr. | Variance | 2017 | 2016 | Variance | |||||||||
Average Rent Per Apartment Home | $1,784 | $1,739 | 2.6 | % | $1,773 | 0.6 | % | $1,765 | $1,709 | 3.3 | % | |||||
Other Income Per Apartment Home | 175 | 170 | 2.9 | % | 189 | (7.4 | %) | 178 | 175 | 1.7 | % | |||||
Average Revenue Per Apartment Home | $1,959 | $1,909 | 2.6 | % | $1,962 | (0.2 | %) | $1,943 | $1,884 | 3.1 | % | |||||
Average Daily Occupancy | 96.3 | % | 96.1 | % | 0.2 | % | 96.0 | % | 0.3 | % | 96.0 | % | 96.0 | % | — | % |
$ in Millions | ||||||||||||||||
Revenue | $148.4 | $144.4 | 2.8 | % | $148.2 | 0.2 | % | $587.6 | $569.5 | 3.2 | % | |||||
Expenses | 40.4 | 39.6 | 2.1 | % | 42.3 | (4.4 | %) | 167.4 | 166.1 | 0.7 | % | |||||
NOI | $108.0 | $104.8 | 3.1 | % | $105.9 | 2.0 | % | $420.2 | $403.4 | 4.2 | % | |||||
Same Store Rental Rates - Aimco measures changes in rental rates by comparing, on a lease-by-lease basis, the rate on a newly executed lease to the rate on the expiring lease for that same apartment. Newly executed leases are classified either as a new lease, where a vacant apartment is leased to a new customer, or as a renewal. The table below details changes in new and renewal lease rates.
2017 | 1st Qtr. | 2nd Qtr. | 3rd Qtr. | Oct | Nov | Dec | 4th Qtr. | Full Year | ||||||||
Renewal rent increases | 5.1 | % | 4.6 | % | 4.5 | % | 4.6 | % | 4.4 | % | 4.4 | % | 4.5 | % | 4.6 | % |
New lease rent increases | (1.0 | %) | 1.0 | % | 1.4 | % | (1.1 | %) | (1.4 | %) | 0.2 | % | (0.8 | %) | 0.6 | % |
Weighted average rent increases | 1.9 | % | 2.7 | % | 3.0 | % | 1.8 | % | 1.2 | % | 1.9 | % | 1.6 | % | 2.5 | % |
Average Daily Occupancy | 95.9 | % | 95.9 | % | 96.0 | % | 96.2 | % | 96.3 | % | 96.4 | % | 96.3 | % | 96.0 | % |
During fourth quarter, Aimco focused on increasing occupancy, resulting in a 30 basis point increase in Average Daily Occupancy as compared to the third quarter.
| 2 |
Redevelopment/Development
Aimco’s second line of business is the redevelopment and development of apartment communities. Aimco invests in this line of business when it believes the investment will yield risk-adjusted returns in excess of those expected from the apartment communities sold in paired trades to fund these construction projects. Aimco favors redevelopment because it permits adjustment of the scope and timing of spending to align with changing market conditions. Aimco also undertakes ground-up development of apartment communities when warranted by risk-adjusted investment returns.
During the fourth quarter, Aimco invested $51 million in redevelopment and development. In Center City, Philadelphia, Aimco completed de-leasing of and commenced construction on the fourth and final tower of Park Towne Place. Lease-up of this tower is scheduled to commence in the spring of 2018. At December 31, 2017, the first three towers combined were 89% leased with approximately 40 homes remaining to lease at the third tower in order to reach stabilized occupancy.
As previously announced, Aimco is developing Parc Mosaic, a $117 million, 226 apartment home community located in Boulder, Colorado on the site of its former Eastpointe apartment community. During the fourth quarter, Aimco completed de-leasing of Eastpointe and commenced demolition and construction.
During the fourth quarter, Aimco leased 103 apartment homes at its redevelopment communities. At December 31, 2017, Aimco’s lease-up exposure at active redevelopment and development projects included approximately 611 apartment homes, 232 of which were in the fourth tower of Park Towne Place and 215 were in Parc Mosaic.
Portfolio Management: Revenue Per Apartment Home Up 7% to $2,123
Aimco portfolio strategy seeks predictable rent growth from a portfolio of apartment communities that is diversified across “A,” “B” and “C+” price points, averaging “B/B+” in quality, and that is also diversified across the largest markets in the U.S. Please refer to the Glossary for a description of Aimco Portfolio Quality Ratings.
As part of its portfolio strategy, Aimco seeks to sell each year up to 10% of the apartment communities in its portfolio and to reinvest the proceeds from such sales in uses such as property upgrades, redevelopment of communities in its current portfolio, occasional development of new communities, and selective acquisitions of apartment communities with projected free cash flow returns higher than expected from the communities sold to fund the activity. Through this disciplined approach to capital recycling, Aimco has significantly increased the quality and expected growth rate of its portfolio.
FOURTH QUARTER | ||||||||
2017 | 2016 | Variance | ||||||
Apartment Communities | 136 | 141 | (5 | ) | ||||
Apartment Homes | 36,904 | 39,161 | (2,257 | ) | ||||
Revenue per Apartment Home | $ | 2,123 | $ | 1,981 | 7 | % | ||
Portfolio Average Rents as a Percentage of Local Market Average Rents | 113 | % | 112 | % | 1 | % | ||
Percentage A (4Q 2017 Revenue per Apartment Home $2,707) | 53 | % | 51 | % | 2 | % | ||
Percentage B (4Q 2017 Revenue per Apartment Home $1,848) | 32 | % | 36 | % | (4 | %) | ||
Percentage C+ (4Q 2017 Revenue per Apartment Home $1,721) | 15 | % | 13 | % | 2 | % | ||
NOI Margin | 70 | % | 69 | % | 1 | % | ||
Free Cash Flow Margin | 65 | % | 64 | % | 1 | % | ||
| 3 |
Fourth Quarter Real Estate Portfolio - For its entire portfolio, Aimco’s average monthly revenue per apartment home was $2,123 for fourth quarter 2017, a 7% increase compared to fourth quarter 2016. This increase is due to year-over-year growth in Same Store revenue as well as Aimco’s second quarter reacquisition of the 47% interest in the Palazzo communities, lease-up of redevelopment and acquisition properties, and the sale of apartment communities with average monthly revenues per apartment home lower than those of the retained portfolio.
Dispositions - In the fourth quarter, Aimco sold five lower-rated apartment communities with 2,291 apartment homes for a gain of $298 million and gross proceeds of $397 million resulting in $381 million in net proceeds to Aimco. Two of these properties are affordable communities located in Washington, DC and Philadelphia, and three are located in southern New Jersey and southern Virginia.
In January 2018, Aimco agreed to sell its interests in the entities owning the La Jolla Cove property in settlement of legal actions filed in 2014 by a group of disappointed buyers who had hoped to acquire the property. As a result of the settlement, Aimco recognized in its 2017 results a gross impairment loss of $35.8 million, $25.6 million of which relates to the establishment of a deferred tax liability assumed at acquisition. Upon closing of the transaction, the tax liability will be assumed by the buyer, resulting in no economic loss to Aimco. The remaining $10.2 million accounting loss is offset by cash distributions paid to Aimco during its ownership and avoided legal costs for continued litigation.
On an economic basis, Aimco agreed to sell the entity at roughly its purchase price, adjusted for retained cash distributions and avoided legal costs.
Also in January 2018, Aimco sold three additional apartment communities with 513 apartment homes for a gain of approximately $50 million, net of tax, and gross proceeds of $72 million resulting in $65 million in net proceeds to Aimco. Two of these communities are located in southern Virginia and one is located in suburban Maryland.
Proceeds from the 2017 and 2018 sales were used to repay outstanding borrowings on Aimco’s revolving credit facility, effectively funding the equity portion of the Palazzo reacquisition as well as Aimco’s 2017 redevelopment and development activities.
Balance Sheet and Liquidity
Aimco Leverage
Aimco targets net leverage of $3.8 billion. As of the end of the year, Aimco’s leverage was above this target due to the timing of three apartment community sales discussed above, which closed in January 2018.
Non-recourse Property Debt - During the fourth quarter, Aimco closed or rate-locked two non-recourse, fixed-rate property loans totaling $189 million. On a weighted average basis, these loans have a 7.7 year term and an interest rate of 3.48%, 117 basis points above the corresponding treasury rates at the time of pricing.
The net effect of 2017 property debt refinancing activities has been to lower Aimco’s weighted average fixed interest rates by about 20 basis points to 4.64%.
| 4 |
Aimco leverage includes Aimco’s share of long-term, non-recourse, property debt secured by apartment communities, a term loan, outstanding borrowings under its revolving credit facility, and outstanding preferred equity. Aimco leverage excludes non-recourse property debt obligations of consolidated partnerships served by its Asset Management business (described further in the Glossary). Please refer to Supplemental Schedule 5(a) for the presentation of Aimco leverage and a reconciliation of Aimco proportionate leverage to Aimco’s consolidated leverage.
AS OF DECEMBER 31, 2017 | |||||||
$ in Millions | Amount | % of Total | Weighted Avg. Maturity (Yrs.) | ||||
Aimco share of long-term, non-recourse property debt | $ | 3,553 | 87 | % | 7.2 | ||
Term loan | 250 | 6 | % | 0.5 | |||
Outstanding borrowings on revolving credit facility | 67 | 2 | % | 4.1 | |||
Preferred Equity* | 227 | 5 | % | 40.0 | |||
Total leverage | $ | 4,097 | 100 | % | 8.5 | ||
Cash, restricted cash and investments in securitization trust assets | (176 | ) | |||||
Net Leverage | $ | 3,921 | |||||
* Aimco’s Preferred Equity is perpetual in nature; however, for illustrative purposes, Aimco has computed the weighted average maturity of its total leverage assuming a 40-year maturity for its Preferred Equity. | |||||||
Leverage Ratios
Aimco target leverage ratios are Proportionate Debt and Preferred Equity to Adjusted EBITDA below 7.0x and Adjusted EBITDA to Interest Expense and Preferred Dividends greater than 2.5x. Aimco also focuses on the ratios of Proportionate Debt to Adjusted EBITDA and Adjusted EBITDA to Adjusted Interest Expense. Please see the Glossary for definitions of these non-GAAP measures and, where appropriate, reconciliations to the nearest GAAP measure.
Aimco calculates Adjusted EBITDA and Adjusted Interest Expense used in its leverage ratios based on current quarter amounts, annualized.
FOURTH QUARTER 2017 | |
Proportionate Debt to Adjusted EBITDA | 6.5x |
Proportionate Debt and Preferred Equity to Adjusted EBITDA | 6.9x |
Adjusted EBITDA to Adjusted Interest Expense | 3.3x |
Adjusted EBITDA to Adjusted Interest Expense and Preferred Dividends | 3.1x |
Aimco’s leverage ratios have been adjusted on a pro forma basis to reflect the disposition of five apartment communities during the period as if the sales had closed on October 1, 2017. The effect of this pro forma adjustment may be found in the Adjusted EBITDA reconciliation in the Glossary.
Liquidity
At December 31, 2017, Aimco held cash and restricted cash of $95 million and had available capacity to borrow $521 million under its revolving credit facility, after consideration of outstanding borrowings of $67 million and $12 million of letters of credit backed by the facility. Aimco uses its credit facility primarily for working capital and other short-term purposes and to secure letters of credit.
Aimco also held unencumbered apartment communities with an estimated fair market value of approximately $1.8 billion at December 31, 2017.
| 5 |
Dividend - As previously announced, the Aimco Board of Directors declared a quarterly cash dividend of $0.38 per share of Class A Common Stock for the quarter ended December 31, 2017. On an annualized basis, this represents an increase of 6% compared to the dividends paid during 2017. This dividend is payable on February 28, 2018, to stockholders of record on February 16, 2018.
2018 Outlook
The Aimco strategy remains unchanged: focusing on excellence in property operations; value creation through redevelopment and occasional development; portfolio management based on a disciplined approach to capital recycling; a safe, flexible balance sheet with abundant liquidity; and a simple business model executed by a performance-oriented and collaborative team. Aimco executes this consistent strategy with an eye on sustainable long-term growth.
Components of 2017 to 2018 AFFO Growth
(at the midpoint of guidance range)
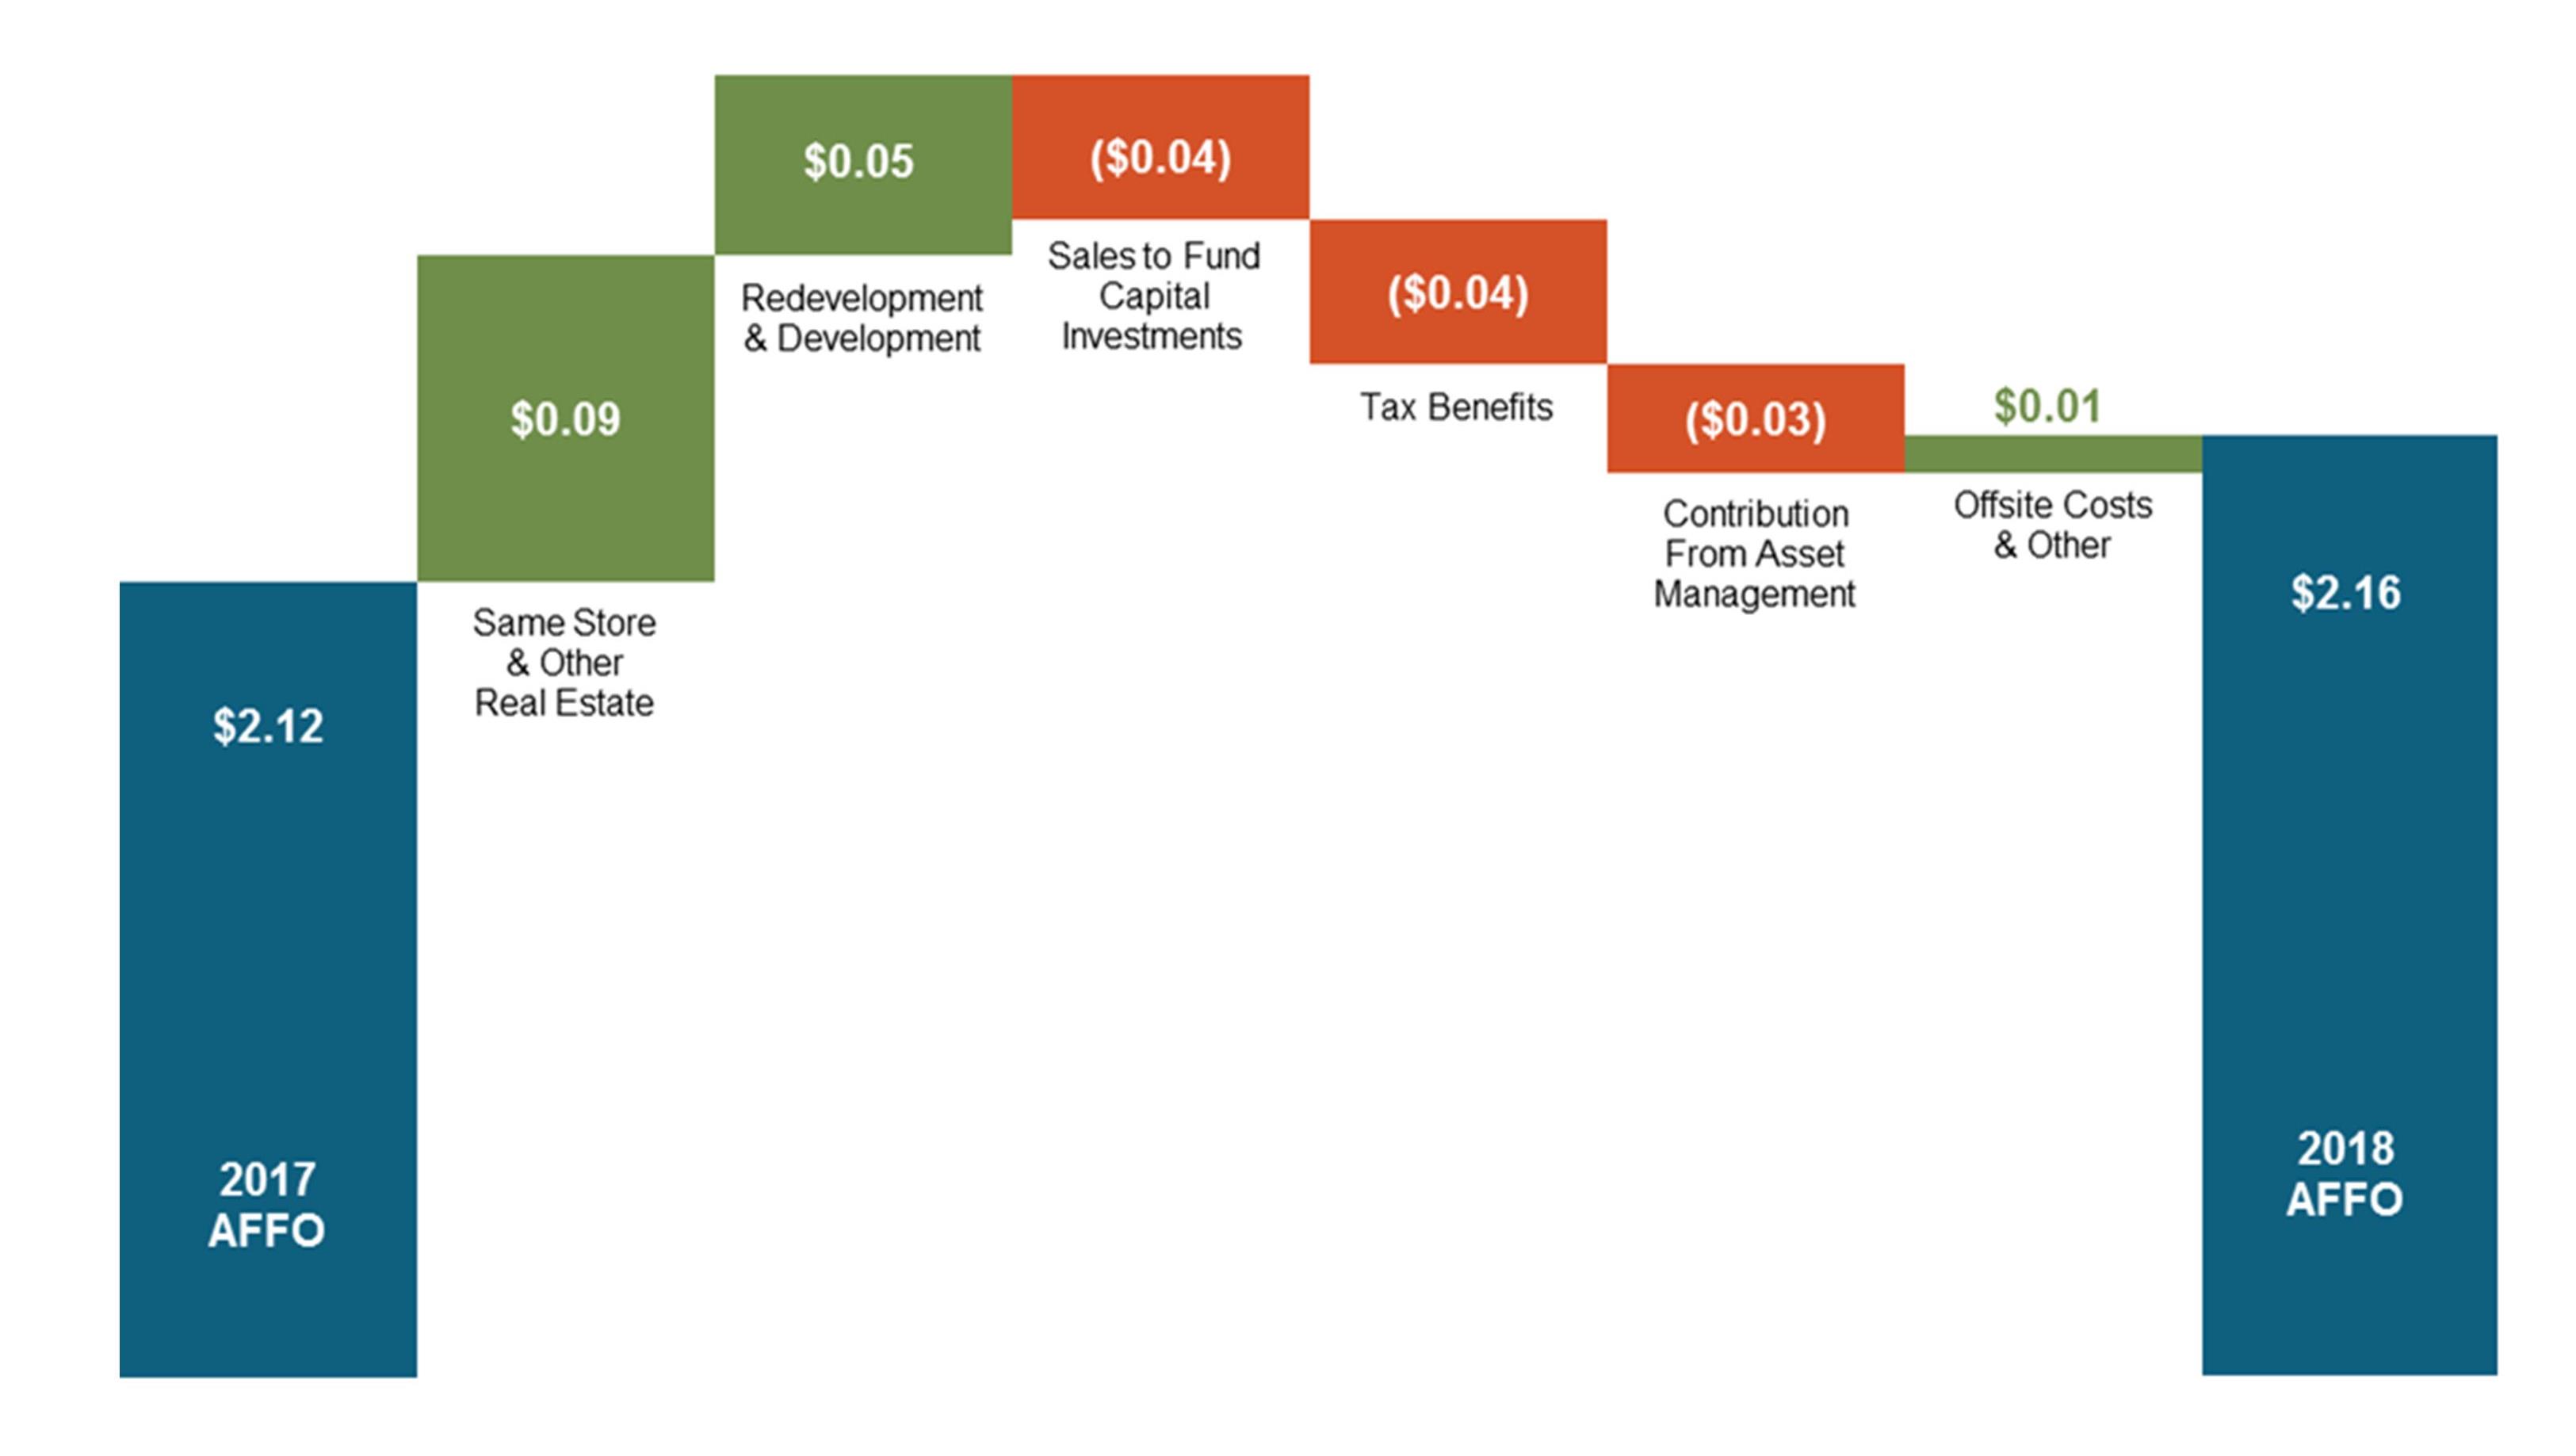
Aimco expects 2018 Pro forma FFO per share in the range of $2.42 to $2.52 with AFFO per share of $2.11 to $2.21. At the guidance range midpoint, Aimco’s projected 2018 AFFO growth of 2% reflects:
• | $0.14 per share growth from its core business of market-rate apartment ownership and Redevelopment and Development; |
• | $0.01 per share of growth from lower offsite costs and lower casualties; and |
• | income lost from apartment communities sold to fund redevelopment and development activity ($0.04 per share), lower tax benefits primarily from the effect of the recent tax law change ($0.04 per share), and planned lower income from the wind down of Aimco’s Asset Management business ($0.03 per share). |
Aimco is engaged in litigation with Airbnb to protect Aimco’s property right to select its residents and their neighbors. Due the unpredictable nature of these cases and associated legal costs, Aimco will exclude such costs from 2018 Pro forma FFO and AFFO.
| 6 |
Aimco projects its Same Store portfolio to provide NOI growth in the range of 1.70% to 3.10%, resulting from revenue growth in the range of 2.10% to 3.10% and expense growth between 2.60% and 3.60%. At the midpoint, Aimco expects revenue growth of 2.60%, comprised of average daily occupancy 10 basis points higher than 2017 and lease rate growth of 2.50%, based on blended lease rates similar to 2017. At the midpoint, Aimco expects expenses to increase by 3.10%, of which 110 basis points is due to the increase in real estate taxes compared to 2017 taxes that were lowered by successful appeals, and higher property hazard insurance costs resulting from worldwide casualty events in 2017.
($ Amounts represent Aimco Share) | FULL YEAR 2018 | FULL YEAR 2017 | |
Net Income per share | $0.36 to $0.46 | $1.96 | |
Pro forma FFO per share | $2.42 to $2.52 | $2.45 | |
AFFO per share | $2.11 to $2.21 | $2.12 | |
Select Components of FFO | |||
Same Store Operating Measures | |||
Revenue change compared to prior year | 2.10% to 3.10% | 3.20% | |
Expense change compared to prior year | 2.60% to 3.60% | 0.70% | |
NOI change compared to prior year | 1.70% to 3.10% | 4.20% | |
Asset Management and Other Earnings | |||
Asset Management Contribution | $36M | $41M | |
Tax Benefits [1] | $16M to $18M | $23M | |
Offsite Costs | |||
Property management expenses | $20M | $21M | |
General and administrative expenses | $44M | $44M | |
Total Offsite Costs | $64M | $65M | |
Capital Investments | |||
Redevelopment/Development | $120M to $200M | $172M | |
Property upgrades | $80M to $100M | $101M | |
Transactions | |||
Property dispositions - Real Estate [2] | $180M to $220M | $381M | |
Property acquisitions | $0M | $452M | |
Portfolio Quality | |||
Average revenue per apartment home | ~$2,175 | $2,123 | |
Balance Sheet | |||
Proportionate Debt to Adjusted EBITDA | ~6.5x | 6.5x | |
Proportionate Debt and Preferred Equity to Adjusted EBITDA | ~6.9x | 6.9x | |
[1] | 2017 tax benefits as shown above exclude a $0.5 million deferred tax revaluation adjustment recognized as a result of the recent tax reform legislation, which is excluded from Aimco’s calculation of Pro forma FFO and AFFO. | ||
[2] | In January 2018, Aimco sold two apartment communities located in southern Virginia and one apartment community located in suburban Maryland, for net proceeds of $65 million. | ||
| 7 |
($ Amounts represent Aimco Share) | FIRST QUARTER 2018 |
Net income per share | $0.29 to $0.33 |
Pro forma FFO per share | $0.57 to $0.61 |
AFFO per share | $0.50 to $0.54 |
Earnings Conference Call Information
Live Conference Call: | Conference Call Replay: |
Friday, February 2, 2018 at 1:00 p.m. ET | Replay available until April 2, 2018 |
Domestic Dial-In Number: 1-888-317-6003 | Domestic Dial-In Number: 1-877-344-7529 |
International Dial-In Number: 1-412-317-6061 | International Dial-In Number: 1-412-317-0088 |
Passcode: 8442076 | Passcode: 10115141 |
Live webcast and replay: www.aimco.com/investors | |
Supplemental Information
The full text of this Earnings Release and the Supplemental Information referenced in this release are available on Aimco’s website at www.aimco.com/investors.
Glossary & Reconciliations of Non-GAAP Financial and Operating Measures
Financial and operating measures found in this Earnings Release and the Supplemental Information include certain financial measures used by Aimco management that are measures not defined under accounting principles generally accepted in the United States (“GAAP”). These measures are defined in the Glossary in the Supplemental Information and reconciled to the most comparable GAAP measures.
About Aimco
Aimco is a real estate investment trust focused on the ownership and management of quality apartment communities located in select markets in the United States. Aimco is one of the country’s largest owners and operators of apartments, with ownership interests in 182 communities in 22 states and the District of Columbia. Aimco common shares are traded on the New York Stock Exchange under the ticker symbol AIV, and are included in the S&P 500. For more information about Aimco, please visit our website at www.aimco.com.
Contact
Lynn Stanfield, Senior Vice President, Finance
Investor Relations 303-793-4661, investor@aimco.com
| 8 |
Forward-looking Statements
This Earnings Release and Supplemental Information contain forward-looking statements within the meaning of the federal securities laws, including, without limitation, statements regarding projected results and specifically forecasts of first quarter and full year 2018 results, including but not limited to: FFO, Pro forma FFO and selected components thereof; AFFO; Aimco redevelopment/development investments and projected yield on such investments, timelines and Net Operating Income contribution; expectations regarding sales of Aimco apartment communities and the use of proceeds thereof; and Aimco liquidity and leverage metrics.
These forward-looking statements are based on management’s judgment as of this date, which is subject to risks and uncertainties. Risks and uncertainties include, but are not limited to: Aimco’s ability to maintain current or meet projected occupancy, rental rate and property operating results; the effect of acquisitions, dispositions, redevelopments and developments; Aimco’s ability to meet budgeted costs and timelines, and achieve budgeted rental rates related to Aimco redevelopments and developments; and Aimco’s ability to comply with debt covenants, including financial coverage ratios.
Actual results may differ materially from those described in these forward-looking statements and, in addition, will be affected by a variety of risks and factors, some of which are beyond Aimco’s control, including, without limitation:
• | Real estate and operating risks, including fluctuations in real estate values and the general economic climate in the markets in which Aimco operates and competition for residents in such markets; national and local economic conditions, including the pace of job growth and the level of unemployment; the amount, location and quality of competitive new housing supply; the timing of acquisitions, dispositions, redevelopments and developments; and changes in operating costs, including energy costs; |
• | Financing risks, including the availability and cost of capital markets’ financing; the risk that cash flows from operations may be insufficient to meet required payments of principal and interest; and the risk that earnings may not be sufficient to maintain compliance with debt covenants; |
• | Insurance risks, including the cost of insurance, and natural disasters and severe weather such as hurricanes; and |
• | Legal and regulatory risks, including costs associated with prosecuting or defending claims and any adverse outcomes; the terms of governmental regulations that affect Aimco and interpretations of those regulations; and possible environmental liabilities, including costs, fines or penalties that may be incurred due to necessary remediation of contamination of apartment communities presently or previously owned by Aimco. |
In addition, Aimco’s current and continuing qualification as a real estate investment trust involves the application of highly technical and complex provisions of the Internal Revenue Code and depends on Aimco’s ability to meet the various requirements imposed by the Internal Revenue Code, through actual operating results, distribution levels and diversity of stock ownership.
Readers should carefully review Aimco’s financial statements and the notes thereto, as well as the section entitled “Risk Factors” in Item 1A of Aimco’s Annual Report on Form 10-K for the year ended December 31, 2016, and the other documents Aimco files from time to time with the Securities and Exchange Commission.
These forward-looking statements reflect management’s judgment as of this date, and Aimco assumes no obligation to revise or update them to reflect future events or circumstances. This press release does not constitute an offer of securities for sale.
| 9 |
Consolidated Statements of Operations | ||||||||||||||||
(in thousands, except per share data) (unaudited) | ||||||||||||||||
Three Months Ended | Year Ended | |||||||||||||||
December 31, | December 31, | |||||||||||||||
2017 | 2016 | 2017 | 2016 | |||||||||||||
REVENUES | ||||||||||||||||
Rental and other property revenues attributable to Real Estate | $ | 231,509 | $ | 227,658 | $ | 918,148 | $ | 899,891 | ||||||||
Rental and other property revenues of partnerships served by Asset Management business | 18,719 | 18,406 | 74,046 | 74,640 | ||||||||||||
Tax credit and transaction revenues | 5,001 | 3,429 | 13,243 | 21,323 | ||||||||||||
Total revenues | 255,229 | 249,493 | 1,005,437 | 995,854 | ||||||||||||
OPERATING EXPENSES | ||||||||||||||||
Property operating expenses attributable to Real Estate | 79,120 | 76,021 | 318,939 | 317,957 | ||||||||||||
Property operating expenses of partnerships served by Asset Management business | 8,995 | 8,757 | 35,440 | 36,956 | ||||||||||||
Depreciation and amortization | 97,348 | 87,710 | 366,184 | 333,066 | ||||||||||||
General and administrative expenses | 12,058 | 11,255 | 43,657 | 46,784 | ||||||||||||
Other expenses, net | 4,544 | 5,656 | 11,353 | 14,295 | ||||||||||||
Provision for real estate impairment loss [1] | 35,881 | — | 35,881 | — | ||||||||||||
Total operating expenses | 237,946 | 189,399 | 811,454 | 749,058 | ||||||||||||
Operating income | 17,283 | 60,094 | 193,983 | 246,796 | ||||||||||||
Interest income | 2,081 | 1,956 | 8,332 | 7,797 | ||||||||||||
Interest expense | (49,193 | ) | (50,484 | ) | (194,615 | ) | (196,389 | ) | ||||||||
Other, net | 92 | 530 | 7,694 | 6,071 | ||||||||||||
(Loss) income before income taxes and gain on dispositions | (29,737 | ) | 12,096 | 15,394 | 64,275 | |||||||||||
Income tax benefit | 17,248 | 8,739 | 32,126 | 25,208 | ||||||||||||
(Loss) income before gain on dispositions | (12,489 | ) | 20,835 | 47,520 | 89,483 | |||||||||||
Gain on dispositions of real estate, net of tax | 298,678 | 156,564 | 299,559 | 393,790 | ||||||||||||
Net income | 286,189 | 177,399 | 347,079 | 483,273 | ||||||||||||
Noncontrolling interests: | ||||||||||||||||
Net income attributable to noncontrolling interests in consolidated real estate partnerships | (7,569 | ) | (3,160 | ) | (9,084 | ) | (25,256 | ) | ||||||||
Net income attributable to preferred noncontrolling interests in Aimco OP | (1,938 | ) | (1,963 | ) | (7,764 | ) | (7,239 | ) | ||||||||
Net income attributable to common noncontrolling interests in Aimco OP | (12,293 | ) | (7,869 | ) | (14,457 | ) | (20,368 | ) | ||||||||
Net income attributable to noncontrolling interests | (21,800 | ) | (12,992 | ) | (31,305 | ) | (52,863 | ) | ||||||||
Net income attributable to Aimco | 264,389 | 164,407 | 315,774 | 430,410 | ||||||||||||
Net income attributable to Aimco preferred stockholders | (2,149 | ) | (2,156 | ) | (8,594 | ) | (11,994 | ) | ||||||||
Net income attributable to participating securities | (143 | ) | (251 | ) | (319 | ) | (635 | ) | ||||||||
Net income attributable to Aimco common stockholders | $ | 262,097 | $ | 162,000 | $ | 306,861 | $ | 417,781 | ||||||||
Net income attributable to Aimco per common share – basic | $ | 1.68 | $ | 1.04 | $ | 1.96 | $ | 2.68 | ||||||||
Net income attributable to Aimco per common share – diluted | $ | 1.67 | $ | 1.03 | $ | 1.96 | $ | 2.67 | ||||||||
Weighted average common shares outstanding – basic | 156,423 | 156,171 | 156,323 | 156,001 | ||||||||||||
Weighted average common shares outstanding – diluted | 156,878 | 156,540 | 156,796 | 156,391 | ||||||||||||
[1] In January 2018, Aimco agreed to sell its interests in the entities owning the La Jolla Cove property in settlement of legal actions filed in 2014 by a group of disappointed buyers who had hoped to acquire the property. As a result of the settlement, Aimco recognized in its 2017 results a gross impairment loss of $35.8 million, $25.6 million of which relates to the establishment of a deferred tax liability assumed at acquisition. Upon closing of the transaction, the tax liability will be assumed by the buyer, resulting in no economic loss to Aimco. The remaining $10.2 million accounting loss is offset by cash distributions paid to Aimco during its ownership and avoided legal costs for continued litigation. On an economic basis, Aimco agreed to sell the entity at roughly its purchase price, adjusted for retained cash distributions and avoided legal costs. | ||||||||||||||||
| 10 |
Consolidated Balance Sheets | |||||||||
(in thousands) (unaudited) | |||||||||
December 31, 2017 | December 31, 2016 | ||||||||
Assets | |||||||||
Real estate | $ | 7,927,753 | $ | 7,931,117 | |||||
Accumulated depreciation | (2,522,358 | ) | (2,421,357 | ) | |||||
Net real estate | 5,405,395 | 5,509,760 | |||||||
Cash and cash equivalents | 60,498 | 45,821 | |||||||
Restricted cash | 34,827 | 36,405 | |||||||
Goodwill | 37,808 | 37,808 | |||||||
Other assets | 234,931 | 255,960 | |||||||
Assets held for sale | 17,959 | — | |||||||
Assets of partnerships served by Asset Management business: | |||||||||
Real estate, net | 224,873 | 245,648 | |||||||
Cash and cash equivalents | 16,288 | 15,423 | |||||||
Restricted cash | 30,928 | 33,501 | |||||||
Other assets | 15,533 | 52,492 | |||||||
Total Assets | $ | 6,079,040 | $ | 6,232,818 | |||||
Liabilities and Equity | |||||||||
Non-recourse property debt secured by Aimco Real Estate communities | $ | 3,563,041 | $ | 3,648,623 | |||||
Debt issue costs | (17,932 | ) | (18,347 | ) | |||||
Non-recourse property debt, net | 3,545,109 | 3,630,276 | |||||||
Term loan, net | 249,501 | — | |||||||
Revolving credit facility borrowings | 67,160 | 17,930 | |||||||
Accrued liabilities and other | 200,540 | 218,937 | |||||||
Liabilities of partnerships served by Asset Management business: | |||||||||
Non-recourse property debt, net | 227,141 | 236,426 | |||||||
Accrued liabilities and other | 19,812 | 62,630 | |||||||
Deferred income [1] | 12,487 | 18,452 | |||||||
Total Liabilities | 4,321,750 | 4,184,651 | |||||||
Preferred noncontrolling interests in Aimco OP | 101,537 | 103,201 | |||||||
Equity: | |||||||||
Perpetual preferred stock | 125,000 | 125,000 | |||||||
Class A Common Stock | 1,572 | 1,569 | |||||||
Additional paid-in capital | 3,900,042 | 4,051,722 | |||||||
Accumulated other comprehensive income | 3,603 | 1,011 | |||||||
Distributions in excess of earnings | (2,367,073 | ) | (2,385,399 | ) | |||||
Total Aimco equity | 1,663,144 | 1,793,903 | |||||||
Noncontrolling interests in consolidated real estate partnerships | (1,716 | ) | 151,121 | ||||||
Common noncontrolling interests in Aimco OP | (5,675 | ) | (58 | ) | |||||
Total equity | 1,655,753 | 1,944,966 | |||||||
Total liabilities and equity | $ | 6,079,040 | $ | 6,232,818 | |||||
[1] | Deferred income primarily represents cash received by Aimco and other amounts required by GAAP to be recognized in earnings in future periods as Aimco performs certain responsibilities under tax credit agreements or as other events occur. Please refer to the Glossary for information about the Asset Management business and a projection of the timing of income recognition related to the tax credit arrangements. | ||||||||
| 11 |
Supplemental Schedule 1 | |||||||||||||||||
Funds From Operations and Adjusted Funds From Operations Reconciliation | |||||||||||||||||
(in thousands, except per share data) (unaudited) | |||||||||||||||||
Three Months Ended December 31, | Year Ended December 31, | ||||||||||||||||
2017 | 2016 | 2017 | 2016 | ||||||||||||||
Net income attributable to Aimco common stockholders | $ | 262,097 | $ | 162,000 | $ | 306,861 | $ | 417,781 | |||||||||
Adjustments: | |||||||||||||||||
Real estate depreciation and amortization, net of noncontrolling partners’ interest | 94,700 | 83,031 | 352,109 | 314,840 | |||||||||||||
Gain on dispositions and other, net of noncontrolling partners’ interest | (254,631 | ) | (156,205 | ) | (262,583 | ) | (381,131 | ) | |||||||||
Income taxes related to gain on dispositions and other | (10,440 | ) | 1,954 | (8,265 | ) | 6,374 | |||||||||||
Common noncontrolling interests in Aimco OP’s share of above adjustments | 7,637 | 3,308 | (3,810 | ) | 2,782 | ||||||||||||
Amounts allocable to participating securities | 41 | 102 | (81 | ) | 88 | ||||||||||||
FFO Attributable to Aimco common stockholders | $ | 99,404 | $ | 94,190 | $ | 384,231 | $ | 360,734 | |||||||||
Tax benefit related to tax reform legislation, net of common noncontrolling interests in Aimco OP and participating securities [1] | (498 | ) | — | (498 | ) | — | |||||||||||
Preferred equity redemption related amounts, net of common noncontrolling interests in Aimco OP and participating securities | — | — | — | 1,877 | |||||||||||||
Pro forma FFO Attributable to Aimco common stockholders | $ | 98,906 | $ | 94,190 | $ | 383,733 | $ | 362,611 | |||||||||
Capital Replacements, net of common noncontrolling interests in Aimco OP and participating securities | (11,008 | ) | (15,217 | ) | (51,760 | ) | (55,289 | ) | |||||||||
AFFO Attributable to Aimco common stockholders | $ | 87,898 | $ | 78,973 | $ | 331,973 | $ | 307,322 | |||||||||
Weighted average common shares outstanding | 156,423 | 156,171 | 156,323 | 156,001 | |||||||||||||
Dilutive common share equivalents | 455 | 369 | 473 | 390 | |||||||||||||
Total shares and dilutive share equivalents | 156,878 | 156,540 | 156,796 | 156,391 | |||||||||||||
Net income attributable to Aimco per common share – diluted | $ | 1.67 | $ | 1.03 | $ | 1.96 | $ | 2.67 | |||||||||
FFO per share – diluted | $ | 0.63 | $ | 0.60 | $ | 2.45 | $ | 2.31 | |||||||||
Pro forma FFO per share – diluted | $ | 0.63 | $ | 0.60 | $ | 2.45 | $ | 2.32 | |||||||||
AFFO per share – diluted | $ | 0.56 | $ | 0.50 | $ | 2.12 | $ | 1.97 | |||||||||
[1] | In connection with the Tax Cuts and Jobs Act signed into law December 2017, Aimco recognized a net income tax benefit, which Aimco has excluded from Pro forma FFO as further explained in the Glossary. | ||||||||||||||||
| 12 |
Supplemental Schedule 2 | ||||||||||||||||||
Funds From Operations and Adjusted Funds From Operations Information | (page 1 of 2) | |||||||||||||||||
Three Months and Year Ended December 31, 2017 Compared to Three Months and Year Ended December 31, 2016 | ||||||||||||||||||
(consolidated amounts, in thousands) (unaudited) | ||||||||||||||||||
Three Months Ended | Year Ended | |||||||||||||||||
December 31, | December 31, | |||||||||||||||||
2017 Aimco Share [1] | 2017 | 2016 | 2017 | 2016 | ||||||||||||||
Real Estate [2] | ||||||||||||||||||
Rental and other property revenues | ||||||||||||||||||
Same Store | 99.5 | % | $ | 149,171 | $ | 145,130 | $ | 590,424 | $ | 572,435 | ||||||||
Redevelopment/Development | 99.9 | % | 46,789 | 44,221 | 184,970 | 170,753 | ||||||||||||
Acquisition | 100.0 | % | 6,223 | 4,106 | 22,521 | 7,667 | ||||||||||||
Other Real Estate | 102.6 | % | 19,970 | 19,018 | 78,539 | 75,760 | ||||||||||||
Total rental and other property revenues | 99.9 | % | 222,153 | 212,475 | 876,454 | 826,615 | ||||||||||||
Property operating expenses | ||||||||||||||||||
Same Store | 99.5 | % | 40,625 | 39,790 | 168,199 | 166,567 | ||||||||||||
Redevelopment/Development | 99.8 | % | 18,080 | 15,919 | 67,880 | 64,209 | ||||||||||||
Acquisition | 100.0 | % | 2,241 | 2,192 | 8,886 | 4,377 | ||||||||||||
Other Real Estate | 99.5 | % | 7,324 | 7,006 | 29,144 | 28,935 | ||||||||||||
Total property operating expenses | 99.6 | % | 68,270 | 64,907 | 274,109 | 264,088 | ||||||||||||
Real Estate net operating income | 100.0 | % | 153,883 | 147,568 | 602,345 | 562,527 | ||||||||||||
Property management expenses | 100.5 | % | (6,030 | ) | (5,729 | ) | (21,467 | ) | (21,773 | ) | ||||||||
Casualties | 99.7 | % | (1,055 | ) | (190 | ) | (7,982 | ) | (5,681 | ) | ||||||||
Other Expense, net | 100.8 | % | (2,293 | ) | (4,348 | ) | (4,984 | ) | (5,276 | ) | ||||||||
Interest expense on non-recourse property debt | 99.8 | % | (40,588 | ) | (44,652 | ) | (169,079 | ) | (175,667 | ) | ||||||||
Interest income | 100.0 | % | 1,814 | 1,703 | 7,057 | 6,825 | ||||||||||||
FFO related to Sold and Held for Sale communities [3] | 96.8 | % | 5,508 | 9,567 | 26,027 | 46,268 | ||||||||||||
Contribution from Real Estate | 99.9 | % | 111,239 | 103,919 | 431,917 | 407,223 | ||||||||||||
Asset Management [4] | ||||||||||||||||||
Net operating income of partnerships served by Asset Management business | 106.9 | % | 11,053 | 10,378 | 43,493 | 40,888 | ||||||||||||
Interest expense on non-recourse property debt of partnerships | 106.1 | % | (3,253 | ) | (3,345 | ) | (13,031 | ) | (13,387 | ) | ||||||||
FFO related to Sold and Held for Sale communities | 100.0 | % | 7 | 633 | 252 | 2,273 | ||||||||||||
Amount available for payment of Asset Management fees | 104.7 | % | 7,807 | 7,666 | 30,714 | 29,774 | ||||||||||||
Tax credit income, net | 100.0 | % | 2,510 | 3,187 | 10,049 | 16,546 | ||||||||||||
Other income | 100.0 | % | 2,332 | 579 | 5,208 | 8,290 | ||||||||||||
Asset management expenses | 110.3 | % | (1,526 | ) | (1,424 | ) | (5,934 | ) | (5,804 | ) | ||||||||
Contribution from Asset Management | 103.6 | % | 11,123 | 10,008 | 40,037 | 48,806 | ||||||||||||
General and administrative and investment management expenses | 100.0 | % | (12,058 | ) | (11,255 | ) | (43,657 | ) | (46,784 | ) | ||||||||
Depreciation and amortization related to non-real estate assets | 100.0 | % | (2,712 | ) | (2,842 | ) | (10,373 | ) | (10,971 | ) | ||||||||
Other expense, net [5] | 99.4 | % | (2,023 | ) | (512 | ) | (5,001 | ) | (6,857 | ) | ||||||||
Interest expense on corporate borrowings | 100.0 | % | (5,287 | ) | (2,321 | ) | (12,102 | ) | (6,588 | ) | ||||||||
Historic tax credit benefit | 100.0 | % | 1,135 | 4,960 | 5,764 | 14,511 | ||||||||||||
Other tax benefits, net | 100.0 | % | 6,558 | 3,908 | 17,909 | 11,648 | ||||||||||||
Preferred dividends and distributions | 100.0 | % | (4,087 | ) | (4,119 | ) | (16,358 | ) | (19,233 | ) | ||||||||
Common noncontrolling interests in Aimco OP | 100.0 | % | (4,656 | ) | (4,561 | ) | (18,267 | ) | (17,586 | ) | ||||||||
Amounts allocated to participating securities | 100.0 | % | (102 | ) | (149 | ) | (400 | ) | (547 | ) | ||||||||
Aimco share of amounts associated with unconsolidated partnerships | [6] | 814 | 448 | 2,319 | 2,602 | |||||||||||||
Noncontrolling interests’ share of the above amounts | [6] | (540 | ) | (3,294 | ) | (7,557 | ) | (15,490 | ) | |||||||||
FFO Attributable to Aimco common stockholders | $ | 99,404 | $ | 94,190 | $ | 384,231 | $ | 360,734 | ||||||||||
Tax benefit related to tax reform legislation, net of common noncontrolling interests in Aimco OP and participating securities [7] | (498 | ) | — | (498 | ) | — | ||||||||||||
Preferred stock redemption related amounts | — | — | — | 1,877 | ||||||||||||||
Pro Forma FFO Attributable to Aimco common stockholders | $ | 98,906 | $ | 94,190 | $ | 383,733 | $ | 362,611 | ||||||||||
Capital Replacements | (11,612 | ) | (16,144 | ) | (54,164 | ) | (58,792 | ) | ||||||||||
Noncontrolling interests’ share of Capital Replacements | 604 | 927 | 2,404 | 3,503 | ||||||||||||||
AFFO Attributable to Aimco common stockholders | $ | 87,898 | $ | 78,973 | $ | 331,973 | $ | 307,322 | ||||||||||
Please see the following page for footnote descriptions
| 13 |
Supplemental Schedule 2 (continued) | ||
Funds From Operations and Adjusted Funds From Operations Information | (page 2 of 2) | |
[1] | Represents percentages readers may use to calculate Aimco share of the consolidated amounts presented, based on results for three months ended December 31, 2017. Aimco share of certain items may exceed 100% due to the inclusion of its share of unconsolidated partnership items, which are excluded from the consolidated amounts shown. On June 30, 2017, Aimco reacquired the 47% limited partner interest in the Palazzo joint venture. The three apartment communities held by the joint venture are included in Redevelopment/Development. The percentage that may be used for the year ended December 31, 2017 is 93.2%. Please refer to the discussion of Aimco Proportionate Financial Information in the Glossary for further information. | |
[2] | Contribution from Real Estate consists of property net operating income and other items of income or expense that relate to this portfolio, including property management expenses, casualty losses, interest expense related to non-recourse property debt encumbering the communities in this portfolio, and interest income Aimco earns on its investment in a securitization trust that holds certain Aimco property debt. The communities included in the Real Estate portfolio are primarily market rate apartment communities. | |
[3] | In fourth quarter 2017, Aimco sold two affordable apartment communities located in Washington, DC and Philadelphia and three apartment communities located in suburban New Jersey and southern Virginia. Additionally, at December 31, 2017, Aimco had two apartment communities located in southern Virginia and one apartment community located in suburban Maryland, classified as held for sale, which were sold in January 2018. | |
[4] | Contribution from Asset Management includes: fees and other amounts paid to Aimco from the net operating income of partnerships that own low-income housing tax credit apartment communities less interest expense incurred on non-recourse property debt obligations of the partnerships; income associated with delivery of tax credits to the non-Aimco investors in the partnerships (including amounts received during the period and amounts received in previous periods); and other income less asset management expenses (including certain allocated offsite costs related to the operation of this business). | |
Aimco estimates net asset value for its Asset Management business as the present value of the future cash flows Aimco expects to receive. Following repayment of such fees and other amounts due to Aimco, residual cash flows generally accrue to the non-Aimco limited partners. A multiple of 4.8x (which multiple may vary over time), may be applied to the annualized fourth quarter Contribution from Asset Management to arrive at Aimco’s estimate of net asset value of the Asset Management business. | ||
[5] | Other expense, net, which is not allocated to Real Estate or Asset Management generally consists of insurance expense and certain legal costs. | |
[6] | Represents Aimco share of FFO and Pro forma FFO amounts of its unconsolidated communities and the noncontrolling interest partners’ share of such amounts for consolidated communities. These amounts are included in the calculated percentages shown for Aimco share of the consolidated amounts. | |
[7] | In connection with the Tax Cuts and Jobs Act signed into law December 2017, Aimco recognized a net income tax benefit, which Aimco has excluded from Pro forma FFO as further explained in the Glossary. | |
| 14 |

Supplemental Schedule 3(a) | |||||||||||||||||||||||||
Property Net Operating Income - Real Estate | |||||||||||||||||||||||||
Trailing Five Quarters | |||||||||||||||||||||||||
(consolidated amounts, in thousands) (unaudited) | |||||||||||||||||||||||||
Three Months Ended | |||||||||||||||||||||||||
2017 Aimco Share [1] | December 31, 2017 | September 30, 2017 | June 30, 2017 | March 31, 2017 | December 31, 2016 | ||||||||||||||||||||
Rental and other property revenues | |||||||||||||||||||||||||
Same Store | 99.5 | % | $ | 149,171 | $ | 148,920 | $ | 146,557 | $ | 145,776 | $ | 145,130 | |||||||||||||
Redevelopment/Development | 99.9 | % | 46,789 | 47,433 | 45,659 | 45,089 | 44,221 | ||||||||||||||||||
Acquisition | 100.0 | % | 6,223 | 5,961 | 5,462 | 4,875 | 4,106 | ||||||||||||||||||
Other Real Estate | 102.6 | % | 19,970 | 20,476 | 19,340 | 18,753 | 19,018 | ||||||||||||||||||
Total rental and other property revenues | 99.9 | % | $ | 222,153 | $ | 222,790 | $ | 217,018 | $ | 214,493 | $ | 212,475 | |||||||||||||
Property operating expenses | |||||||||||||||||||||||||
Same Store | 99.5 | % | $ | 40,625 | $ | 42,513 | $ | 41,932 | $ | 43,129 | $ | 39,790 | |||||||||||||
Redevelopment/Development | 99.8 | % | 18,080 | 16,792 | 16,750 | 16,258 | 15,919 | ||||||||||||||||||
Acquisition | 100.0 | % | 2,241 | 2,269 | 2,146 | 2,230 | 2,192 | ||||||||||||||||||
Other Real Estate | 99.5 | % | 7,324 | 7,566 | 7,078 | 7,176 | 7,006 | ||||||||||||||||||
Total property operating expenses | 99.6 | % | $ | 68,270 | $ | 69,140 | $ | 67,906 | $ | 68,793 | $ | 64,907 | |||||||||||||
Property Net Operating Income | |||||||||||||||||||||||||
Same Store | 99.5 | % | $ | 108,546 | $ | 106,407 | $ | 104,625 | $ | 102,647 | $ | 105,340 | |||||||||||||
Redevelopment/Development | 99.9 | % | 28,709 | 30,641 | 28,909 | 28,831 | 28,302 | ||||||||||||||||||
Acquisition | 100.0 | % | 3,982 | 3,692 | 3,316 | 2,645 | 1,914 | ||||||||||||||||||
Other Real Estate | 104.3 | % | 12,646 | 12,910 | 12,262 | 11,577 | 12,012 | ||||||||||||||||||
Total Property Net Operating Income | 100.0 | % | $ | 153,883 | $ | 153,650 | $ | 149,112 | $ | 145,700 | $ | 147,568 | |||||||||||||
Property net operating income in the table above is presented on a consolidated basis, which includes 100% of consolidated real estate partnership results and excludes the results of unconsolidated real estate partnerships, which are accounted for using the equity method of accounting. | |||||||||||||||||||||||||
[1] | Represents percentages readers may use to calculate Aimco’s share of the consolidated amounts presented based on results for the three months ended December 31, 2017, which may be used as a proxy for earlier periods shown for Same Store, Acquisition and Other Real Estate. On June 30, 2017, Aimco reacquired the 47% limited partner interest in the joint venture that owns the Palazzo communities, which are included in Redevelopment/Development. Aimco’s proportionate share of Redevelopment/Development property net operating income amounts for the three months ended June 30, 2017 was approximately 87%, and may be used as a proxy for earlier periods shown. Aimco’s share of certain items may exceed 100% due to the inclusion of its share of unconsolidated partnership items, which are excluded from the consolidated amounts shown. Please refer to the discussion of Aimco Proportionate Financial Information in the Glossary for further information. | ||||||||||||||||||||||||
| 15 | |
Supplemental Schedule 3(b) | ||||||||||||||||||||
Property Net Operating Income - Sold and Held For Sale Communities | ||||||||||||||||||||
Trailing Five Quarters | ||||||||||||||||||||
(consolidated amounts, in thousands) (unaudited) | ||||||||||||||||||||
Three Months Ended | ||||||||||||||||||||
December 31, 2017 | September 30, 2017 | June 30, 2017 | March 31, 2017 | December 31, 2016 | ||||||||||||||||
Sold and Held for Sale Property Net Operating Income [1] | ||||||||||||||||||||
Sold Apartment Communities: | ||||||||||||||||||||
Real Estate [2] | $ | 4,373 | $ | 5,801 | $ | 5,833 | $ | 5,639 | $ | 8,592 | ||||||||||
Asset Management | — | (36 | ) | 52 | 263 | 358 | ||||||||||||||
Held for Sale Apartment Communities [3] | 1,249 | 1,244 | 1,240 | 1,223 | 1,259 | |||||||||||||||
Total Sold and Held for Sale Property Net Operating Income | $ | 5,622 | $ | 7,009 | $ | 7,125 | $ | 7,125 | $ | 10,209 | ||||||||||
[1] | Property net operating income for Sold and Held for Sale communities presented above reflects consolidated, or 100%, amounts and is included in the FFO related to sold and held for sale apartment communities lines on Supplemental Schedule 2. |
[2] | In fourth quarter 2017, Aimco sold two affordable apartment communities located in Washington, DC and Philadelphia and three apartment communities located in southern New Jersey and southern Virginia. |
[3] | At December 31, 2017, Aimco had two apartment communities located in southern Virginia and one apartment community located in suburban Maryland classified as held for sale, which were sold in January 2018. |
| 16 | |
Supplemental Schedule 4 | ||||||||||
Apartment Home Summary | ||||||||||
As of December 31, 2017 | ||||||||||
(unaudited) | ||||||||||
Number of Apartment Communities | Number of Apartment Homes | Aimco Share of Apartment Homes | ||||||||
Real Estate Portfolio: | ||||||||||
Consolidated | ||||||||||
Same Store | 92 | 26,386 | 26,239 | |||||||
Redevelopment/Development | 15 | 6,386 | 6,375 | |||||||
Acquisitions | 2 | 578 | 578 | |||||||
Other Real Estate | 20 | 2,899 | 2,870 | |||||||
Held for Sale | 3 | 513 | 434 | |||||||
Total Consolidated | 132 | 36,762 | 36,496 | |||||||
Unconsolidated | 4 | 142 | 72 | |||||||
Total Real Estate Portfolio | 136 | 36,904 | 36,568 | |||||||
Asset Management: | ||||||||||
Consolidated | 39 | 6,211 | n/a | |||||||
Unconsolidated | 7 | 687 | n/a | |||||||
Total Asset Management | 46 | 6,898 | n/a | |||||||
Total | 182 | 43,802 | 36,568 | |||||||
Please refer to the Glossary for definitions of Real Estate, including each of the subcategories within Real Estate, and Asset Management. |
| 17 |
Supplemental Schedule 5(a) | ||||||||||||||||||||||
Capitalization and Financial Metrics | ||||||||||||||||||||||
As of December 31, 2017 | ||||||||||||||||||||||
(dollars in thousands) (unaudited) | ||||||||||||||||||||||
Leverage Balances and Characteristics [1] | ||||||||||||||||||||||
Debt | Aimco Amounts | Aimco Share of Unconsolidated Partnerships | Noncontrolling Interests | Total Aimco Share | Weighted Average Maturity (Years) | Weighted Average Stated Interest Rate | ||||||||||||||||
Fixed rate loans payable | $ | 3,480,378 | $ | 7,035 | $ | (16,595 | ) | $ | 3,470,818 | 7.2 | 4.64 | % | ||||||||||
Floating rate tax-exempt bonds | 82,663 | — | — | 82,663 | 6.0 | 2.70 | % | |||||||||||||||
Total non-recourse property debt | $ | 3,563,041 | $ | 7,035 | $ | (16,595 | ) | $ | 3,553,481 | [2] | 7.2 | 4.60 | % | |||||||||
Term loan | 250,000 | — | — | 250,000 | 0.5 | 2.92 | % | |||||||||||||||
Revolving credit facility borrowings | 67,160 | — | — | 67,160 | 4.1 | 3.26 | % | |||||||||||||||
Preferred Equity | 226,537 | — | — | 226,537 | 40.0 | [3] | 7.22 | % | ||||||||||||||
Total Leverage | $ | 4,106,738 | $ | 7,035 | $ | (16,595 | ) | $ | 4,097,178 | 8.5 | 4.62 | % | ||||||||||
Cash and restricted cash | (94,815 | ) | — | 1,271 | (93,544 | ) | ||||||||||||||||
Securitization trust assets | (82,794 | ) | — | — | (82,794 | ) | [4] | |||||||||||||||
Net Leverage | $ | 3,929,129 | $ | 7,035 | $ | (15,324 | ) | $ | 3,920,840 | |||||||||||||
Leverage Ratios [5] | |||||||
Fourth Quarter 2017 | |||||||
Debt to Adjusted EBITDA | 6.5x | ||||||
Debt and Preferred Equity to Adjusted EBITDA | 6.9x | ||||||
Adjusted EBITDA to Adjusted Interest | 3.3x | ||||||
Adjusted EBITDA to Adjusted Interest and Preferred Dividends | 3.1x | ||||||
Revolving Line of Credit Debt Coverage Covenants | |||||||
Amount | Covenant | ||||||
Fixed Charge Coverage Ratio | 2.01x | 1.40x | |||||
Credit Ratings | |||||||
Standard and Poor’s | Corporate Credit Rating | BBB- (stable) | |||||
Fitch Ratings | Issuer Default Rating | BBB- (stable) | |||||
[1] | Aimco excludes the non-recourse property debt obligations of consolidated partnerships served by the Asset Management business from its net leverage calculations, because they are not Aimco’s obligations and have limited effect on the amount of fees and other payments Aimco expects to receive. This non-recourse debt begins maturing in 2020, with 26.0% of the balance at December 31, 2017 maturing after 2027. | ||||||||||
[2] | Represents the carrying amount of Aimco’s debt. At December 31, 2017, Aimco’s debt had a mark-to-market liability of $55.1 million. Aimco computed the fair value of its debt utilizing a Money-Weighted Average Interest Rate on its fixed-rate property debt of 4.09%, which rate takes into account the timing of amortization and maturities, and a market rate of 3.77% that considers the duration of the existing property debt using a similar lending source, the loan-to-value and coverage, as well as timing of amortization and maturities. | ||||||||||
[3] | Preferred Equity is perpetual in nature; however, for illustrative purposes, Aimco has computed the weighted average of its total leverage assuming a 40-year maturity for its Preferred Equity. | ||||||||||
[4] | In 2011, $673.8 million of Aimco’s loans payable were securitized in a trust holding only these loans. Aimco purchased the subordinate positions in the trust that holds these loans for $51.5 million. These investments have a face value of $100.9 million and a carrying amount of $82.8 million, and are included in other assets (attributable to the Real Estate portfolio) on Aimco’s Consolidated Balance Sheet at December 31, 2017. The amount of these investments effectively reduces Aimco’s leverage. | ||||||||||
[5] | Please refer to the Glossary for discussion of Aimco’s leverage ratios, which are computed using Aimco share of debt, as well as reconciliations of the inputs to the calculation to the nearest GAAP measures. The calculation of Aimco’s leverage ratios have been adjusted to reflect the disposition of five apartments communities during the period as if the sales had closed on October 1, 2017, because the proceeds from these sales was used to reduce leverage prior to December 31, 2017. Please refer to the Glossary for additional information. | ||||||||||
| 18 |
Supplemental Schedule 5(b) | |||||||||||||||||||
As of December 31, 2017 | |||||||||||||||||||
Capitalization and Financial Metrics | |||||||||||||||||||
(share, unit and dollar amounts in thousands) (unaudited) | |||||||||||||||||||
Aimco Share Non-Recourse Property Debt | |||||||||||||||||||
Amortization | Maturities | Total | Maturities as a Percent of Total | Average Rate on Maturing Debt | |||||||||||||||
2018 1Q | $ | 18,425 | $ | 127,073 | $ | 145,498 | 3.68 | % | 3.88 | % | |||||||||
2018 2Q | 18,916 | 11,130 | 30,046 | 0.32 | % | 4.86 | % | ||||||||||||
2018 3Q | 19,192 | — | 19,192 | — | % | — | % | ||||||||||||
2018 4Q | 20,165 | 35,530 | 55,695 | 1.03 | % | 4.15 | % | ||||||||||||
Total 2018 | 76,698 | 173,733 | 250,431 | 5.03 | % | 4.00 | % | ||||||||||||
2019 1Q | 19,568 | 54,103 | 73,671 | 1.57 | % | 4.56 | % | ||||||||||||
2019 2Q | 19,087 | 212,577 | 231,664 | 6.16 | % | 5.77 | % | ||||||||||||
2019 3Q | 17,169 | 213,436 | 230,605 | 6.18 | % | 5.74 | % | ||||||||||||
2019 4Q | 17,938 | — | 17,938 | — | % | — | % | ||||||||||||
Total 2019 | 73,762 | 480,116 | 553,878 | 13.91 | % | 5.62 | % | ||||||||||||
2020 | 67,416 | 296,913 | 364,329 | 8.60 | % | 6.13 | % | ||||||||||||
2021 | 51,759 | 635,258 | [1] | 687,017 | 18.40 | % | 5.27 | % | |||||||||||
2022 | 42,268 | 233,439 | 275,707 | 6.76 | % | 4.77 | % | ||||||||||||
2023 | 33,143 | 138,089 | 171,232 | 4.00 | % | 4.86 | % | ||||||||||||
2024 | 28,050 | 252,191 | 280,241 | 7.30 | % | 3.39 | % | ||||||||||||
2025 | 21,863 | 187,447 | 209,310 | 5.43 | % | 3.53 | % | ||||||||||||
2026 | 16,721 | 155,571 | 172,292 | 4.51 | % | 3.34 | % | ||||||||||||
2027 | 8,200 | 215,557 | 223,757 | 6.24 | % | 3.37 | % | ||||||||||||
Thereafter | 249,830 | 14,605 | 264,435 | 0.42 | % | 1.03 | % | ||||||||||||
Total | $ | 669,710 | $ | 2,782,919 | $ | 3,452,629 | |||||||||||||
Securitization Trust Assets | 100,852 | [1] | |||||||||||||||||
Aimco share non-recourse property debt | $ | 3,553,481 | |||||||||||||||||
Preferred Equity | ||||||||||||
Shares/Units Outstanding as of December 31, 2017 | Date First Available for Redemption by Aimco | Coupon | Amount | |||||||||
Class A Perpetual Preferred Stock | 5,000 | 5/17/2019 | 6.875 | % | $ | 125,000 | ||||||
Preferred Partnership Units | 3,822 | 7.634 | % | 101,537 | ||||||||
Total Preferred Equity | 7.215 | % | $ | 226,537 | ||||||||
Common Stock, Partnership Units and Equivalents | |||
As of | |||
December 31, 2017 | |||
Class A Common Stock outstanding | 156,477 | ||
Participating unvested restricted stock | 160 | ||
Dilutive options, share equivalents and non-participating unvested restricted stock | 476 | ||
Total shares and dilutive share equivalents | 157,113 | ||
Common Partnership Units and equivalents | 7,337 | ||
Total shares, units and dilutive share equivalents | 164,450 | ||
[1] | The securitized property loans mature in 2021, and will repay Aimco’s subordinate positions in the securitization trust, which reduces Aimco’s 2021 refunding requirements from $736.1 million to $635.3 million, or 18.4% of total non-recourse property debt outstanding at December 31, 2017. | ||||||||||
| 19 |
Supplemental Schedule 6(a) | ||||||||||||||||||||||||||||||||||||||||||||||
Same Store Operating Results | ||||||||||||||||||||||||||||||||||||||||||||||
Fourth Quarter 2017 Compared to Fourth Quarter 2016 | ||||||||||||||||||||||||||||||||||||||||||||||
(in thousands, except community, home and per home data) (unaudited) | ||||||||||||||||||||||||||||||||||||||||||||||
Revenue | Expenses | Net Operating Income | Net Operating Income Margin | Average Daily Occupancy During Period | Average Revenue per Aimco Apartment Home | |||||||||||||||||||||||||||||||||||||||||
Apartment Communities | Apartment Homes | Aimco Share of Apartment Homes | 4Q 2017 | 4Q 2016 | Growth | 4Q 2017 | 4Q 2016 | Growth | 4Q 2017 | 4Q 2016 | Growth | 4Q 2017 | 4Q 2017 | 4Q 2016 | 4Q 2017 | 4Q 2016 | ||||||||||||||||||||||||||||||
Atlanta | 5 | 817 | 817 | $ | 4,287 | $ | 4,159 | 3.1 | % | $ | 1,688 | $ | 1,541 | 9.5 | % | $ | 2,599 | $ | 2,618 | (0.7 | %) | 60.6% | 95.8% | 95.4% | $ | 1,825 | $ | 1,780 | ||||||||||||||||||
Bay Area | 7 | 1,328 | 1,328 | 11,832 | 11,540 | 2.5 | % | 2,320 | 2,600 | (10.8 | %) | 9,512 | 8,940 | 6.4 | % | 80.4% | 97.2% | 96.0% | 3,057 | 3,016 | ||||||||||||||||||||||||||
Boston | 12 | 4,173 | 4,173 | 20,489 | 19,692 | 4.0 | % | 6,564 | 6,235 | 5.3 | % | 13,925 | 13,457 | 3.5 | % | 68.0% | 96.2% | 95.5% | 1,701 | 1,647 | ||||||||||||||||||||||||||
Chicago | 9 | 2,882 | 2,882 | 14,358 | 13,936 | 3.0 | % | 4,303 | 4,230 | 1.7 | % | 10,055 | 9,706 | 3.6 | % | 70.0% | 96.7% | 96.5% | 1,717 | 1,671 | ||||||||||||||||||||||||||
Denver | 7 | 1,925 | 1,886 | 9,024 | 8,912 | 1.3 | % | 2,141 | 2,097 | 2.1 | % | 6,883 | 6,815 | 1.0 | % | 76.3% | 95.4% | 96.6% | 1,671 | 1,631 | ||||||||||||||||||||||||||
Greater New York | 9 | 496 | 496 | 4,493 | 4,447 | 1.0 | % | 1,474 | 1,448 | 1.8 | % | 3,019 | 2,999 | 0.7 | % | 67.2% | 96.2% | 96.0% | 3,138 | 3,113 | ||||||||||||||||||||||||||
Greater Washington, DC | 12 | 5,085 | 5,057 | 23,550 | 23,199 | 1.5 | % | 6,903 | 6,718 | 2.8 | % | 16,647 | 16,481 | 1.0 | % | 70.7% | 96.0% | 96.2% | 1,618 | 1,589 | ||||||||||||||||||||||||||
Los Angeles | 10 | 2,965 | 2,964 | 23,713 | 22,700 | 4.5 | % | 4,443 | 4,860 | (8.6 | %) | 19,270 | 17,840 | 8.0 | % | 81.3% | 97.3% | 96.3% | 2,740 | 2,651 | ||||||||||||||||||||||||||
Miami | 3 | 873 | 873 | 5,670 | 5,604 | 1.2 | % | 1,516 | 1,479 | 2.5 | % | 4,154 | 4,125 | 0.7 | % | 73.3% | 96.6% | 97.4% | 2,241 | 2,197 | ||||||||||||||||||||||||||
Philadelphia | 3 | 1,320 | 1,241 | 6,112 | 6,174 | (1.0 | %) | 1,993 | 1,795 | 11.0 | % | 4,119 | 4,379 | (5.9 | %) | 67.4% | 96.3% | 96.4% | 1,704 | 1,720 | ||||||||||||||||||||||||||
San Diego | 6 | 2,001 | 2,001 | 11,401 | 10,914 | 4.5 | % | 2,815 | 2,705 | 4.1 | % | 8,586 | 8,209 | 4.6 | % | 75.3% | 96.4% | 96.7% | 1,970 | 1,881 | ||||||||||||||||||||||||||
Seattle | 2 | 239 | 239 | 1,593 | 1,575 | 1.1 | % | 511 | 490 | 4.3 | % | 1,082 | 1,085 | (0.3 | %) | 67.9% | 94.4% | 95.9% | 2,354 | 2,291 | ||||||||||||||||||||||||||
Other Markets | 7 | 2,282 | 2,282 | 11,925 | 11,542 | 3.3 | % | 3,756 | 3,402 | 10.4 | % | 8,169 | 8,140 | 0.4 | % | 68.5% | 95.4% | 95.0% | 1,827 | 1,775 | ||||||||||||||||||||||||||
Total | 92 | 26,386 | 26,239 | $ | 148,447 | $ | 144,394 | 2.8 | % | $ | 40,427 | $ | 39,600 | 2.1 | % | $ | 108,020 | $ | 104,794 | 3.1 | % | 72.8% | 96.3% | 96.1% | $ | 1,959 | $ | 1,909 | ||||||||||||||||||
The financial information presented on this schedule is proportionate financial information and represents a disaggregation of Aimco’s Real Estate segment. Please refer to the Glossary for a reconciliation of the Same Store operating results shown above to Aimco’s measure of segment performance, Proportionate Property Net Operating Income. | |
| 20 | |
Supplemental Schedule 6(b) | ||||||||||||||||||||||||||||||||||||||||||||||
Same Store Operating Results | ||||||||||||||||||||||||||||||||||||||||||||||
Fourth Quarter 2017 Compared to Third Quarter 2017 | ||||||||||||||||||||||||||||||||||||||||||||||
(in thousands, except community, home and per home data) (unaudited) | ||||||||||||||||||||||||||||||||||||||||||||||
Revenue | Expenses | Net Operating Income | Net Operating Income Margin | Average Daily Occupancy During Period | Average Revenue per Aimco Apartment Home | |||||||||||||||||||||||||||||||||||||||||
Apartment Communities | Apartment Homes | Aimco Share of Apartment Homes | 4Q 2017 | 3Q 2017 | Growth | 4Q 2017 | 3Q 2017 | Growth | 4Q 2017 | 3Q 2017 | Growth | 4Q 2017 | 4Q 2017 | 3Q 2017 | 4Q 2017 | 3Q 2017 | ||||||||||||||||||||||||||||||
Atlanta | 5 | 817 | 817 | $ | 4,287 | $ | 4,350 | (1.4 | %) | $ | 1,688 | $ | 1,624 | 3.9 | % | $ | 2,599 | $ | 2,726 | (4.7 | %) | 60.6% | 95.8% | 96.2% | $ | 1,825 | $ | 1,846 | ||||||||||||||||||
Bay Area | 7 | 1,328 | 1,328 | 11,832 | 11,699 | 1.1 | % | 2,320 | 2,849 | (18.6 | %) | 9,512 | 8,850 | 7.5 | % | 80.4% | 97.2% | 96.7% | 3,057 | 3,036 | ||||||||||||||||||||||||||
Boston | 12 | 4,173 | 4,173 | 20,489 | 20,277 | 1.0 | % | 6,564 | 6,574 | (0.2 | %) | 13,925 | 13,703 | 1.6 | % | 68.0% | 96.2% | 95.7% | 1,701 | 1,692 | ||||||||||||||||||||||||||
Chicago | 9 | 2,882 | 2,882 | 14,358 | 14,453 | (0.7 | %) | 4,303 | 4,436 | (3.0 | %) | 10,055 | 10,017 | 0.4 | % | 70.0% | 96.7% | 96.8% | 1,717 | 1,727 | ||||||||||||||||||||||||||
Denver | 7 | 1,925 | 1,886 | 9,024 | 9,189 | (1.8 | %) | 2,141 | 2,309 | (7.3 | %) | 6,883 | 6,880 | — | % | 76.3% | 95.4% | 96.3% | 1,671 | 1,686 | ||||||||||||||||||||||||||
Greater New York | 9 | 496 | 496 | 4,493 | 4,403 | 2.0 | % | 1,474 | 1,549 | (4.8 | %) | 3,019 | 2,854 | 5.8 | % | 67.2% | 96.2% | 94.4% | 3,138 | 3,135 | ||||||||||||||||||||||||||
Greater Washington, DC | 12 | 5,085 | 5,057 | 23,550 | 23,793 | (1.0 | %) | 6,903 | 7,483 | (7.8 | %) | 16,647 | 16,310 | 2.1 | % | 70.7% | 96.0% | 95.9% | 1,618 | 1,635 | ||||||||||||||||||||||||||
Los Angeles | 10 | 2,965 | 2,964 | 23,713 | 23,383 | 1.4 | % | 4,443 | 4,754 | (6.5 | %) | 19,270 | 18,629 | 3.4 | % | 81.3% | 97.3% | 95.5% | 2,740 | 2,755 | ||||||||||||||||||||||||||
Miami | 3 | 873 | 873 | 5,670 | 5,628 | 0.7 | % | 1,516 | 1,486 | 2.0 | % | 4,154 | 4,142 | 0.3 | % | 73.3% | 96.6% | 94.9% | 2,241 | 2,265 | ||||||||||||||||||||||||||
Philadelphia | 3 | 1,320 | 1,241 | 6,112 | 6,074 | 0.6 | % | 1,993 | 2,066 | (3.5 | %) | 4,119 | 4,008 | 2.8 | % | 67.4% | 96.3% | 95.1% | 1,704 | 1,715 | ||||||||||||||||||||||||||
San Diego | 6 | 2,001 | 2,001 | 11,401 | 11,438 | (0.3 | %) | 2,815 | 2,950 | (4.6 | %) | 8,586 | 8,488 | 1.2 | % | 75.3% | 96.4% | 97.0% | 1,970 | 1,966 | ||||||||||||||||||||||||||
Seattle | 2 | 239 | 239 | 1,593 | 1,637 | (2.7 | %) | 511 | 515 | (0.8 | %) | 1,082 | 1,122 | (3.6 | %) | 67.9% | 94.4% | 96.7% | 2,354 | 2,361 | ||||||||||||||||||||||||||
Other Markets | 7 | 2,282 | 2,282 | 11,925 | 11,883 | 0.4 | % | 3,756 | 3,694 | 1.7 | % | 8,169 | 8,189 | (0.2 | %) | 68.5% | 95.4% | 95.6% | 1,827 | 1,815 | ||||||||||||||||||||||||||
Total | 92 | 26,386 | 26,239 | $ | 148,447 | $ | 148,207 | 0.2 | % | $ | 40,427 | $ | 42,289 | (4.4 | %) | $ | 108,020 | $ | 105,918 | 2.0 | % | 72.8% | 96.3% | 96.0% | $ | 1,959 | $ | 1,962 | ||||||||||||||||||
The financial information presented on this schedule is proportionate financial information and represents a disaggregation of Aimco’s Real Estate segment. Please refer to the Glossary for a reconciliation of the Same Store operating results shown above to Aimco’s measure of segment performance, Proportionate Property Net Operating Income. | |
| 21 | |
Supplemental Schedule 6(c) | ||||||||||||||||||||||||||||||||||||||||||||||
Same Store Operating Results | ||||||||||||||||||||||||||||||||||||||||||||||
Year Ended December 31, 2017 Compared to Year Ended December 31, 2016 | ||||||||||||||||||||||||||||||||||||||||||||||
(in thousands, except community, home and per home data) (unaudited) | ||||||||||||||||||||||||||||||||||||||||||||||
Revenue | Expenses | Net Operating Income | Net Operating Income Margin | Average Daily Occupancy During Period | Average Revenue per Aimco Share of Apartment Home | |||||||||||||||||||||||||||||||||||||||||
Apartment Communities | Apartment Homes | Aimco Share of Apartment Homes | YTD 4Q 2017 | YTD 4Q 2016 | Growth | YTD 4Q 2017 | YTD 4Q 2016 | Growth | YTD 4Q 2017 | YTD 4Q 2016 | Growth | YTD 4Q 2017 | YTD 4Q 2017 | YTD 4Q 2016 | YTD 4Q 2017 | YTD 4Q 2016 | ||||||||||||||||||||||||||||||
Atlanta | 5 | 817 | 817 | $ | 17,026 | $ | 16,357 | 4.1 | % | $ | 6,785 | $ | 6,758 | 0.4 | % | $ | 10,241 | $ | 9,599 | 6.7 | % | 60.1% | 95.6% | 95.0% | $ | 1,816 | $ | 1,756 | ||||||||||||||||||
Bay Area | 7 | 1,328 | 1,328 | 46,545 | 45,478 | 2.3 | % | 11,018 | 11,296 | (2.5 | %) | 35,527 | 34,182 | 3.9 | % | 76.3% | 96.4% | 95.6% | 3,029 | 2,986 | ||||||||||||||||||||||||||
Boston | 12 | 4,173 | 4,173 | 80,730 | 77,540 | 4.1 | % | 26,809 | 26,291 | 2.0 | % | 53,921 | 51,249 | 5.2 | % | 66.8% | 95.7% | 96.4% | 1,685 | 1,607 | ||||||||||||||||||||||||||
Chicago | 9 | 2,882 | 2,882 | 57,203 | 55,386 | 3.3 | % | 17,666 | 17,674 | — | % | 39,537 | 37,712 | 4.8 | % | 69.1% | 96.9% | 96.2% | 1,707 | 1,665 | ||||||||||||||||||||||||||
Denver | 7 | 1,925 | 1,886 | 35,849 | 34,966 | 2.5 | % | 9,011 | 8,596 | 4.8 | % | 26,838 | 26,370 | 1.8 | % | 74.9% | 95.6% | 95.9% | 1,656 | 1,611 | ||||||||||||||||||||||||||
Greater New York | 9 | 496 | 496 | 17,787 | 17,426 | 2.1 | % | 6,080 | 5,930 | 2.5 | % | 11,707 | 11,496 | 1.8 | % | 65.8% | 95.5% | 95.2% | 3,128 | 3,074 | ||||||||||||||||||||||||||
Greater Washington, DC | 12 | 5,085 | 5,057 | 94,165 | 92,151 | 2.2 | % | 28,483 | 28,302 | 0.6 | % | 65,682 | 63,849 | 2.9 | % | 69.8% | 96.2% | 96.3% | 1,612 | 1,577 | ||||||||||||||||||||||||||
Los Angeles | 10 | 2,965 | 2,964 | 93,053 | 89,447 | 4.0 | % | 19,350 | 19,942 | (3.0 | %) | 73,703 | 69,505 | 6.0 | % | 79.2% | 96.1% | 96.1% | 2,722 | 2,618 | ||||||||||||||||||||||||||
Miami | 3 | 873 | 873 | 22,456 | 21,821 | 2.9 | % | 6,242 | 6,276 | (0.5 | %) | 16,214 | 15,545 | 4.3 | % | 72.2% | 95.7% | 96.7% | 2,240 | 2,154 | ||||||||||||||||||||||||||
Philadelphia | 3 | 1,320 | 1,241 | 24,345 | 24,305 | 0.2 | % | 8,182 | 8,031 | 1.9 | % | 16,163 | 16,274 | (0.7 | %) | 66.4% | 95.5% | 95.6% | 1,712 | 1,706 | ||||||||||||||||||||||||||
San Diego | 6 | 2,001 | 2,001 | 45,120 | 42,985 | 5.0 | % | 11,226 | 11,025 | 1.8 | % | 33,894 | 31,960 | 6.1 | % | 75.1% | 96.8% | 96.5% | 1,941 | 1,855 | ||||||||||||||||||||||||||
Seattle | 2 | 239 | 239 | 6,425 | 6,073 | 5.8 | % | 2,113 | 2,040 | 3.6 | % | 4,312 | 4,033 | 6.9 | % | 67.1% | 95.9% | 96.4% | 2,335 | 2,197 | ||||||||||||||||||||||||||
Other Markets | 7 | 2,282 | 2,282 | 46,858 | 45,587 | 2.8 | % | 14,391 | 13,973 | 3.0 | % | 32,467 | 31,614 | 2.7 | % | 69.3% | 95.0% | 94.5% | 1,802 | 1,761 | ||||||||||||||||||||||||||
Total | 92 | 26,386 | 26,239 | $ | 587,562 | $ | 569,522 | 3.2 | % | $ | 167,356 | $ | 166,134 | 0.7 | % | $ | 420,206 | $ | 403,388 | 4.2 | % | 71.5% | 96.0% | 96.0% | $ | 1,943 | $ | 1,884 | ||||||||||||||||||
The financial information presented on this schedule is proportionate financial information and represents a disaggregation of Aimco’s Real Estate segment. Please refer to the Glossary for a reconciliation of the Same Store operating results shown above to Aimco’s measure of segment performance, Proportionate Property Net Operating Income. | |
| 22 | |
Supplemental Schedule 6(d) | |||||||||||||||
Same Store Operating Expense Detail | |||||||||||||||
(in thousands) (unaudited) | |||||||||||||||
Quarterly Comparison | |||||||||||||||
4Q 2017 | % of Total | 4Q 2016 | $ Change | % Change | |||||||||||
Operating expenses [1] | $ | 17,390 | 43.0 | % | $ | 17,596 | $ | (206 | ) | (1.2 | %) | ||||
Real estate taxes | 12,922 | 32.0 | % | 12,629 | 293 | 2.3 | % | ||||||||
Utilities [2] | 8,305 | 20.5 | % | 7,947 | 358 | 4.5 | % | ||||||||
Insurance | 1,810 | 4.5 | % | 1,428 | 382 | 26.8 | % | ||||||||
Total | $ | 40,427 | 100.0 | % | $ | 39,600 | $ | 827 | 2.1 | % | |||||
Sequential Comparison | |||||||||||||||
4Q 2017 | % of Total | 3Q 2017 | $ Change | % Change | |||||||||||
Operating expenses [1] | $ | 17,390 | 43.0 | % | $ | 19,502 | $ | (2,112 | ) | (10.8 | %) | ||||
Real estate taxes | 12,922 | 32.0 | % | 12,972 | (50 | ) | (0.4 | %) | |||||||
Utilities [2] | 8,305 | 20.5 | % | 8,224 | 81 | 1.0 | % | ||||||||
Insurance | 1,810 | 4.5 | % | 1,591 | 219 | 13.8 | % | ||||||||
Total | $ | 40,427 | 100.0 | % | $ | 42,289 | $ | (1,862 | ) | (4.4 | %) | ||||
Year-To-Date Comparison | |||||||||||||||
YTD 4Q 2017 | % of Total | YTD 4Q 2016 | $ Change | % Change | |||||||||||
Operating expenses [1] | $ | 74,696 | 44.6 | % | $ | 75,671 | $ | (976 | ) | (1.3 | %) | ||||
Real estate taxes | 53,304 | 31.9 | % | 51,734 | 1,570 | 3.0 | % | ||||||||
Utilities [2] | 32,802 | 19.6 | % | 31,984 | 818 | 2.6 | % | ||||||||
Insurance | 6,554 | 3.9 | % | 6,745 | (192 | ) | (2.8 | %) | |||||||
Total | $ | 167,356 | 100.0 | % | $ | 166,134 | $ | 1,220 | 0.7 | % | |||||
[1] | Includes onsite payroll, repairs and maintenance, software and technology expenses, marketing, expensed turnover costs and other property related operating expenses. |
[2] | Aimco’s residents reimburse Aimco for the cost of utilities. These costs are included in rental and other property revenue on Aimco’s consolidated statements of operations. These reimbursements for the three months ended December 31, 2017, December 31, 2016 and September 30, 2017 were $5.2 million, $4.8 million, and $5.2 million, respectively, and for the years ended December 31, 2017 and 2016 were $20.2 million and $20.0 million, respectively. |
The operating expense information presented on this schedule is proportionate financial information and represents a disaggregation of Aimco’s Real Estate segment operating expenses. Please refer to the Glossary for a reconciliation of the total Same Store operating expense information shown above to Aimco’s measure of segment performance, Real Estate Proportionate Property Net Operating Income. | |
| 23 |
Supplemental Schedule 7(a) | ||||||||||||||||||||||||||||||||
Real Estate Portfolio Data by Market | ||||||||||||||||||||||||||||||||
Fourth Quarter 2017 Compared to Fourth Quarter 2016 | ||||||||||||||||||||||||||||||||
(unaudited) | ||||||||||||||||||||||||||||||||
Quarter Ended December 31, 2017 | Quarter Ended December 31, 2016 | |||||||||||||||||||||||||||||||
Apartment Communities | Apartment Homes | Aimco Share of Apartment Homes | % Aimco NOI | Average Revenue per Aimco Apartment Home | Apartment Communities | Apartment Homes | Aimco Share of Apartment Homes | % Aimco NOI | Average Revenue per Aimco Apartment Home | |||||||||||||||||||||||
Atlanta | 5 | 817 | 817 | 1.7 | % | $ | 1,786 | 5 | 817 | 817 | 1.7 | % | $ | 1,736 | ||||||||||||||||||
Bay Area | 16 | 3,236 | 3,236 | 13.1 | % | 2,993 | 16 | 3,236 | 3,236 | 11.5 | % | 2,841 | ||||||||||||||||||||
Boston | 15 | 4,689 | 4,689 | 11.5 | % | 1,918 | 15 | 4,689 | 4,689 | 10.6 | % | 1,800 | ||||||||||||||||||||
Chicago | 10 | 3,246 | 3,246 | 7.0 | % | 1,715 | 10 | 3,246 | 3,246 | 7.2 | % | 1,671 | ||||||||||||||||||||
Denver | 8 | 2,065 | 2,026 | 4.4 | % | 1,668 | 8 | 2,065 | 2,026 | 4.8 | % | 1,617 | ||||||||||||||||||||
Greater New York | 18 | 1,040 | 1,040 | 4.0 | % | 3,370 | 18 | 1,040 | 1,040 | 4.0 | % | 3,324 | ||||||||||||||||||||
Greater Washington, DC | 13 | 5,325 | 5,297 | 11.1 | % | 1,616 | 14 | 5,478 | 5,430 | 11.8 | % | 1,593 | ||||||||||||||||||||
Los Angeles | 13 | 4,347 | 4,346 | 18.7 | % | 2,973 | 13 | 4,347 | 3,696 | 15.3 | % | 2,804 | ||||||||||||||||||||
Miami | 5 | 2,652 | 2,641 | 6.6 | % | 2,244 | 5 | 2,612 | 2,601 | 7.6 | % | 2,266 | ||||||||||||||||||||
Philadelphia | 5 | 2,796 | 2,717 | 6.4 | % | 2,045 | 6 | 3,244 | 3,165 | 6.8 | % | 1,858 | ||||||||||||||||||||
San Diego | 12 | 2,423 | 2,353 | 6.5 | % | 1,919 | 12 | 2,423 | 2,353 | 6.5 | % | 1,837 | ||||||||||||||||||||
Seattle | 2 | 239 | 239 | 0.7 | % | 2,354 | 2 | 239 | 239 | 0.7 | % | 2,291 | ||||||||||||||||||||
Other Markets | 14 | 4,029 | 3,921 | 8.3 | % | 1,753 | 17 | 5,725 | 5,617 | 11.5 | % | 1,580 | ||||||||||||||||||||
Total [1] | 136 | 36,904 | 36,568 | 100.0 | % | $ | 2,123 | 141 | 39,161 | 38,155 | 100.0 | % | $ | 1,981 | ||||||||||||||||||
[1] | Real Estate portfolio information presented above includes those apartment communities in which Aimco held an equity interest as of the end of each period presented. Aimco’s portfolio at December 31, 2017, included four communities owned by unconsolidated real estate partnerships. Aimco’s portfolio at December 31, 2016, included the same four communities owned by unconsolidated real estate partnerships and five apartment communities that have been sold. | ||||||||
| 24 | |
Supplemental Schedule 7(b) | ||||||||||||||||||||||||||
Real Estate Portfolio Data by Market | ||||||||||||||||||||||||||
Third Quarter 2017 Market Information | ||||||||||||||||||||||||||
(unaudited) | ||||||||||||||||||||||||||
Aimco portfolio strategy seeks predictable rent growth from a portfolio of apartment communities that is diversified across “A,” “B” and “C+” price points, averaging “B/B+” in quality, and that is diversified across the largest markets in the U.S. Please refer to the Glossary for a description of Aimco Portfolio Quality Ratings. The schedule below illustrates Aimco’s Real Estate portfolio quality based on 3Q 2017 data, the most recent period for which third-party data is available. Aimco adjusts the portfolio data to remove apartment communities sold through the current quarter, if any. The average age of Aimco’s portfolio, adjusted for its sizable investment in redevelopment, is approximately 27 years. Please see the Glossary for further information. | ||||||||||||||||||||||||||
Quarter Ended September 30, 2017 | ||||||||||||||||||||||||||
Apartment Communities [1] | Apartment Homes | Aimco Share of Apartment Homes | % Aimco NOI | Average Rent per Aimco Apartment Home [2] | Market Rent [3] | Percentage of Market Rent Average | Average Age of Apartment Communities | |||||||||||||||||||
Atlanta | 5 | 817 | 817 | 1.8 | % | $ | 1,591 | $ | 1,044 | 152.4 | % | 22 | ||||||||||||||
Bay Area | 16 | 3,236 | 3,236 | 12.4 | % | 2,711 | 2,711 | 100.0 | % | 20 | ||||||||||||||||
Boston | 15 | 4,689 | 4,689 | 11.4 | % | 1,778 | 2,120 | 83.9 | % | 30 | ||||||||||||||||
Chicago | 10 | 3,246 | 3,246 | 7.0 | % | 1,515 | 1,275 | 118.8 | % | 22 | ||||||||||||||||
Denver | 8 | 2,065 | 2,026 | 4.6 | % | 1,462 | 1,206 | 121.2 | % | 22 | ||||||||||||||||
Greater New York | 18 | 1,040 | 1,040 | 3.8 | % | 3,229 | 3,039 | 106.3 | % | 87 | ||||||||||||||||
Greater Washington, DC | 13 | 5,325 | 5,297 | 11.0 | % | 1,477 | 1,675 | 88.2 | % | 48 | ||||||||||||||||
Los Angeles | 13 | 4,347 | 4,346 | 18.4 | % | 2,760 | 1,786 | 154.5 | % | 12 | ||||||||||||||||
Miami | 5 | 2,640 | 2,629 | 7.1 | % | 2,018 | 1,391 | 145.1 | % | 24 | ||||||||||||||||
Philadelphia | 5 | 2,797 | 2,718 | 6.3 | % | 1,808 | 1,241 | 145.7 | % | 31 | ||||||||||||||||
San Diego | 12 | 2,423 | 2,353 | 7.1 | % | 1,719 | 1,664 | 103.3 | % | 26 | ||||||||||||||||
Seattle | 2 | 239 | 239 | 0.7 | % | 2,090 | 1,616 | 129.3 | % | 3 | ||||||||||||||||
Other Markets | 14 | 4,029 | 3,921 | 8.4 | % | 1,547 | 1,305 | 118.5 | % | 27 | ||||||||||||||||
Total | 136 | 36,893 | 36,557 | 100.0 | % | $ | 1,922 | $ | 1,707 | 112.6 | % | 27 | ||||||||||||||
[1] | The portfolio information presented above includes all Real Estate apartment communities in which Aimco held an equity interest as of September 30, 2017, which included four apartment communities owned by unconsolidated real estate partnerships. | ||||||||||
[2] | Represents rents, after concessions and vacancy loss, divided by Aimco Share of Apartment Homes. Does not include other rental income. | ||||||||||
[3] | 3Q 2017 per REIS. | ||||||||||
| 25 |
Supplemental Schedule 8 | ||||||||||||||||||||||||||||||
Apartment Community Disposition and Acquisition Activity | ||||||||||||||||||||||||||||||
(dollars in millions, except average revenue per home) (unaudited) | ||||||||||||||||||||||||||||||
Real Estate Disposition and Acquisition Activity | ||||||||||||||||||||||||||||||
Fourth Quarter and Full Year 2017 Dispositions | ||||||||||||||||||||||||||||||
Number of Apartment Communities [1] | Number of Apartment Homes | Weighted Average Ownership | Gross Proceeds | NOI Cap Rate [2] | Free Cash Flow Cap Rate [2] | Property Debt | Net Sales Proceeds [3] | Aimco Net Proceeds [4] | Average Revenue per Apartment Home | |||||||||||||||||||||
5 | 2,291 | 99% | $ | 397.0 | 5.4 | % | 4.7 | % | $ | 4.0 | $ | 385.3 | $ | 381.1 | $ | 1,337 | ||||||||||||||
[1] In fourth quarter 2017, Aimco sold two affordable apartment communities located in Washington, DC and Philadelphia and three apartment communities located in southern New Jersey and southern Virginia. | ||||||||||||||||||||||||||||||
[2] Please refer to the Glossary for definitions of NOI Cap Rate and Free Cash Flow Cap Rate. | ||||||||||||||||||||||||||||||
[3] Net Sales Proceeds are after repayment of debt, if any, net working capital settlements, payment of transaction costs and debt prepayment penalties, if applicable. | ||||||||||||||||||||||||||||||
[4] Aimco Net Proceeds are Net Sales Proceeds adjusted for distributions made to noncontrolling interests in real estate partnerships. | ||||||||||||||||||||||||||||||
Full Year 2017 Acquisitions | ||||||||||||||||||||||||||||||
Apartment Community Name | Location | Month Acquired | Apartment Homes | Purchase Price | ||||||||||||||||||||||||||
Palazzo [5] | Los Angeles, CA | June | 1,382 | $ | 451.5 | |||||||||||||||||||||||||
[5] Aimco reacquired the 47% limited partner interest in the Palazzo joint venture and now wholly owns the three apartment communities. The purchase price reflects Aimco’s assumption of the limited partner’s share of existing non-recourse property debt of $140.5 million and Aimco’s payment of $311.0 million of cash funded primarily with bank borrowings repaid in December 2017 and January 2018. | ||||||||||||||||||||||||||||||
Asset Management Business Disposition Activity | ||||||||||||||||||||||||||||||
Full Year 2017 Asset Management Dispositions | ||||||||||||||||||||||||||||||
Partnerships served by the Asset Management business sold two apartment communities for net proceeds of $5.0 million during the year ended December 31, 2017. | ||||||||||||||||||||||||||||||
| 26 | |
Supplemental Schedule 9 | ||||||||
Real Estate Capital Additions Information | ||||||||
(in thousands, except per apartment home data) (unaudited) | ||||||||
Aimco classifies capital additions as Capital Replacements (“CR”), Capital Improvements (“CI”), Property Upgrades, Redevelopment, Development or Casualty. Recurring capital additions are apportioned between CR and CI based on the useful life of the item under consideration and the period over which Aimco has owned the item. Under this method of classification, CR represents the portion of the item consumed during Aimco’s ownership of the item, while CI represents capital additions that are made to enhance the value, profitability or useful life of an asset from its original purchase condition. Please see the Glossary for further descriptions. | ||||||||
Three Months Ended December 31, 2017 | Year Ended December 31, 2017 | |||||||
Capital Additions [1] | ||||||||
Capital Replacements | ||||||||
Buildings and grounds | $ | 5,118 | $ | 27,078 | ||||
Turnover capital additions | 1,518 | 6,822 | ||||||
Capitalized site payroll and indirect costs | 953 | 4,137 | ||||||
Capital Replacements | 7,589 | 38,037 | ||||||
Capital Improvements | 5,088 | 17,039 | ||||||
Property Upgrades | 20,833 | 101,497 | ||||||
Redevelopment [2] | 42,699 | 158,141 | ||||||
Development | 8,465 | 14,248 | ||||||
Casualty | 2,351 | 9,060 | ||||||
Total [3] | $ | 87,025 | $ | 338,022 | ||||
Total apartment homes | 36,249 | 36,249 | ||||||
Capital Replacements per apartment home | $ | 209 | $ | 1,049 | ||||
[1] | Includes capital additions to Aimco’s Real Estate portfolio. This information is presented on a consolidated basis, which includes 100% of consolidated real estate partnership capital additions and excludes the capital additions made by unconsolidated real estate partnerships, which are accounted for using the equity method of accounting. Aimco’s share of capital additions for the year ended December 31, 2017 included $37.5 million of Capital Replacements, $16.9 million of Capital Improvements, $100.8 million of Property Upgrades, $153.6 million of Redevelopment, $14.2 million of Development, and $9.0 million of Casualty. | ||||
[2] | Redevelopment spending in this schedule includes amounts for larger projects presented within Supplemental Schedule 10 and also includes spending related to other projects that are not presented in Supplemental Schedule 10. | ||||
[3] | For the three months and year ended December 31, 2017, capital additions for Aimco’s Real Estate portfolio include $1.7 million and $7.6 million of capitalized interest costs, respectively. | ||||
| 27 |
Supplemental Schedule 10 | ||||||||||||||||||||||||||||||||||||||
Redevelopment/Development Portfolio | (Page 1 of 4) | |||||||||||||||||||||||||||||||||||||
As of December 31, 2017 | ||||||||||||||||||||||||||||||||||||||
(dollars in millions, except per home information) (unaudited) | ||||||||||||||||||||||||||||||||||||||
Number of Apartment Homes | Percentage of Completed Homes Leased | Estimated Net Investment | Inception-to-Date Net Investment | Average Revenue per Apartment Home Redeveloped or Constructed | ||||||||||||||||||||||||||||||||||
Location | Total Apartment Homes | Approved for Redevelopment / To Be Constructed | Completed | Expected Occupancy Stabilization [1] | Expected NOI Stabilization [1] | Prior to Investment | Expected Stabilized | Expected Incremental Commercial Revenue | ||||||||||||||||||||||||||||||
Under Redevelopment/Development | ||||||||||||||||||||||||||||||||||||||
Bay Parc | Miami, FL | 474 | 15 | — | — | % | $ | 20.0 | $ | 15.3 | [2] | [2] | $ | 2,036 | $ | 2,200 | $ | 0.1 | ||||||||||||||||||||
Calhoun Beach Club | Minneapolis, MN | 332 | 275 | 59 | 92 | % | 28.7 | 9.4 | [3] | [3] | 2,718 | 3,200 | — | |||||||||||||||||||||||||
Flamingo South Beach | Miami, FL | 1,305 | [4] | [4] | [4] | 9.7 | 4.2 | [4] | [4] | 2,496 | 2,535 | — | ||||||||||||||||||||||||||
Palazzo at Park La Brea | Los Angeles, CA | 521 | 389 | 267 | 96 | % | 24.5 | 16.2 | 2Q 2020 | 3Q 2021 | 3,259 | 3,750 | — | |||||||||||||||||||||||||
Palazzo East at Park La Brea | Los Angeles, CA | 611 | 611 | 4 | 75 | % | 28.0 | 0.8 | 4Q 2020 | 1Q 2022 | 3,428 | 3,655 | — | |||||||||||||||||||||||||
Parc Mosaic | Boulder, CO | 226 | 226 | — | — | % | 117.0 | 27.0 | 4Q 2020 | 1Q 2022 | n/a | 3,100 | — | |||||||||||||||||||||||||
Park Towne Place | Philadelphia, PA | 942 | 942 | 694 | 89 | % | 176.0 | 140.8 | 1Q 2019 | 2Q 2020 | 1,689 | 2,640 | 0.2 | |||||||||||||||||||||||||
Saybrook Pointe | San Jose, CA | 324 | 324 | 245 | 96 | % | 18.3 | 14.9 | 1Q 2019 | 2Q 2020 | 2,660 | 2,960 | — | |||||||||||||||||||||||||
Yorktown | Lombard, IL | 364 | 292 | 142 | 92 | % | 25.7 | 18.3 | [5] | [5] | 1,577 | 2,160 | — | |||||||||||||||||||||||||
Lease-up complete, NOI stabilization period | ||||||||||||||||||||||||||||||||||||||
One Canal | Boston, MA | 310 | 310 | 310 | 195.2 | 195.2 | 2Q 2018 | n/a | 3,865 | 1.1 | ||||||||||||||||||||||||||||
The Sterling | Philadelphia, PA | 534 | 534 | 534 | 71.5 | 71.0 | 4Q 2018 | 2,015 | 2,685 | 1.2 | ||||||||||||||||||||||||||||
Total | 5,943 | 3,918 | 2,255 | $ | 714.6 | $ | 513.1 | |||||||||||||||||||||||||||||||
[1] | Redevelopments provide Aimco with the flexibility to align the timing of the completed apartment homes with market demand. As such, expected occupancy stabilization and expected NOI stabilization dates may change as market conditions evolve. |
[2] | This phase of redevelopment encompasses common area, amenity improvements, the creation of a new retail space and residential homes on one floor. |
[3] | In response to market conditions, during the third quarter, Aimco decided to pause redevelopment activities pertaining to apartment homes and will reassess an appropriate time to resume such activity. Redevelopment of common areas, such as corridors, is ongoing and expected to be complete during the first quarter 2018. |
[4] | This phase of the redevelopment encompasses common areas and security system upgrades. |
[5] | In response to market conditions, during third quarter, Aimco decided to pause redevelopment activities and will reassess an appropriate time to resume redevelopment activity. |
See the following pages for Terms and Definitions and a Description of Redevelopment Projects. | |
| 28 | |
Supplemental Schedule 10 (Continued) | ||||||||||||||||||||||||||
Redevelopment/Development Valuation Information | (Page 2 of 4) | |||||||||||||||||||||||||
(dollars in millions) (unaudited) | ||||||||||||||||||||||||||
Three Months Ended December 31, 2017 | Year Ended December 31, 2017 | |||||||||||||||||||||||||
Occupancy Stabilized Communities | Communities Under Construction or in Lease-up | Total Redevelopment/Development Portfolio | Occupancy Stabilized Communities | Communities Under Construction or in Lease-up | Total Redevelopment/Development Portfolio | |||||||||||||||||||||
Proportionate Property NOI [1] | ||||||||||||||||||||||||||
Proportionate Property NOI | $ | 5.6 | $ | 23.1 | $ | 28.7 | $ | 23.7 | $ | 84.8 | $ | 108.5 | ||||||||||||||
Occupancy stabilized communities | ||||||||||||||||||||||||||
Annualized fourth quarter 2017 Proportionate Property NOI | $ | 26.7 | [2] | |||||||||||||||||||||||
Range of applicable NOI capitalization rates | 4.50% - 5.00% | [3] | ||||||||||||||||||||||||
Communities under construction or in lease-up | ||||||||||||||||||||||||||
Estimated pre-redevelopment Proportionate Property NOI | $ | 102.8 | ||||||||||||||||||||||||
Inception-to-date net investment - Aimco share | $ | 246.9 | ||||||||||||||||||||||||
Projected NOI yield on incremental investment at stabilization | 6.1 | % | ||||||||||||||||||||||||
Projected proportionate incremental stabilized property NOI | $ | 15.1 | ||||||||||||||||||||||||
Total estimated post redevelopment Proportionate Property NOI | $ | 117.9 | ||||||||||||||||||||||||
Range of applicable NOI capitalization rates | 4.30% - 4.70% | [4] | ||||||||||||||||||||||||
[1] | The financial information presented on this schedule is proportionate financial information and represents a disaggregation of Aimco’s Real Estate segment. Please refer to the Glossary for a reconciliation of the Redevelopment/Development operating results shown above to Aimco’s measure of segment performance, Proportionate Property NOI. Proportionate Property NOI for the year ended December 31, 2017, includes the Palazzo communities at 53% for the six months ended June 30, 2017. Aimco reacquired the 47% limited partner interest in the joint venture on June 30, 2017 and now owns 100% of these communities. | |||||||||||||||||||||||||
[2] | During the fourth quarter, Aimco recognized a multi-period adjustment of real estate taxes. Aimco adjusted fourth quarter Proportionate Property NOI to exclude the out of period effect in the calculation of annualized fourth quarter Proportionate Property NOI. | |||||||||||||||||||||||||
[3] | Occupancy stabilized communities includes Pacifica Park, a 104 home community in the Bay Area, Vivo, a 91 home community in Cambridge, Massachusetts, One Canal, a 310 home community in Boston, Massachusetts and The Sterling, a 534 home community in Philadelphia, Pennsylvania. Average rents for these communities are greater than 125% of their respective local market average rents, making these communities, on average, "A" quality as defined by Aimco. Based on these factors, and information provided by the CBRE North American Cap Rate Study for First Half 2017, NOI capitalization rates for this set of communities could range from 4.50% - 5.00%. | |||||||||||||||||||||||||
[4] | Communities are located in high-quality submarkets in Boulder, Center City Philadelphia, Chicago, Los Angeles, Miami, Minneapolis and San Jose. Projected stabilized average rents for these communities are greater than 125% of their respective local market average rents, making these communities, on average, "A" quality as defined by Aimco. Based on these factors, and information provided by the CBRE North American Cap Rate Study for First Half 2017, NOI capitalization rates for this set of communities could range from 4.30% - 4.70%. | |||||||||||||||||||||||||
Aimco estimates the fair value of occupancy stabilized communities by annualizing the most recent quarter’s Proportionate Property NOI and applying an appropriate capitalization rate. Aimco estimates the fair value for the communities under construction or in lease-up by discounting projected future cash flows through community stabilization. See Aimco’s September 30, 2017 NAV Presentation on Aimco’s website at www.aimco.com/investors for additional information. The fair value of these communities could also be derived by applying an appropriate capitalization rate to estimated post redevelopment Proportionate Property NOI. The post redevelopment Proportionate Property NOI may be calculated as the combination of Pre-redevelopment Proportionate Property NOI (defined on the next page) and the projected proportionate incremental stabilized property NOI as estimated based on the projected yield on current inception-to-date investment. | ||||||||||||||||||||||||||
See the following pages for Terms and Definitions and a Description of Redevelopment Projects. | ||||||||||||||||||||||||||
| 29 | |
Supplemental Schedule 10 (Continued) | ||||||||||||||||
Redevelopment/Development Portfolio | (Page 3 of 4) | |||||||||||||||
Terms and Definitions | ||||||||||||||||
Estimated Net Investment - represents total estimated investment, net of tax and other credits earned by Aimco as a direct result of its redevelopment or development of the community. Total estimated investment includes all capitalized costs projected to be incurred to redevelop or develop the respective community, as determined in accordance with GAAP. | ||||||||||||||||
Expected Occupancy Stabilization - period in which Aimco expects to achieve stabilized occupancy (greater than 90%). | ||||||||||||||||
Expected NOI Stabilization - period in which Aimco expects to achieve stabilized rents and operating costs, generally five quarters after Stabilized Occupancy. | ||||||||||||||||
Average Revenue per Apartment Home Redeveloped or Constructed - represents the actual revenues per apartment home, which includes rents and other rental income, prior to redevelopment, and the projected revenues per apartment home following redevelopment or construction, excluding rent and other rental income from commercial leases (which are presented separately on page 1 of this schedule). Projections of stabilized revenues per apartment home are based on management’s judgment at the start of a redevelopment or development project. These projections consider factors including but not limited to: current rent; other rental income expectations; and revenue achievement to date as compared to current market rents. | ||||||||||||||||
Pre-redevelopment Proportionate Property NOI - estimated by applying (a) market revenue and expense growth rates derived from third-party information for the period immediately preceding construction through the current period to (b) Proportionate Property NOI results immediately preceding construction. | ||||||||||||||||
Projected Net Operating Income Yield on Incremental Investment at Stabilization - for redevelopment projects, represents projected stabilized incremental net operating income (including commercial lease income) as a percentage of the Estimated Net Investment. Projected incremental net operating income for redevelopment projects includes the estimated stabilized rate increase that is expected to be achieved and the estimated expense savings resulting from the redevelopment. For development projects, this represents projected stabilized net operating income as a percentage of the Estimated Net Investment. | ||||||||||||||||
Occupancy Stabilized Communities - includes communities classified as part of Redevelopment/Development for which construction has been completed, but for which the requirements to be reclassified into Same Store have not yet been met. Please refer to the definition of Same Store in the Glossary. | ||||||||||||||||
Communities Under Construction or in Lease-up - represents communities classified as part of Redevelopment/Development and included in Supplemental Schedule 10, as well as other communities classified as Redevelopment/Development that are smaller in scope and therefore not included in Supplemental Schedule 10. | ||||||||||||||||
| 30 | |
Supplemental Schedule 10 (Continued) | |
Redevelopments/Development Project Summaries | (Page 4 of 4) |
Bay Parc Miami, FL | The current phase of the redevelopment includes: improvements to the leasing and lobby areas; redesign of the retail space including addition of a street café; updated landscaping; and expansion of the pool deck. During the fourth quarter, Aimco commenced the redevelopment of the apartment homes on one floor of the building, which are expected to be completed in the second quarter of 2018. The common areas and amenities are expected to be completed in first quarter 2018. The next phase of the redevelopment is expected to include upgrades to all of the apartment homes within the community. |
Calhoun Beach Club Minneapolis, MN | The community includes a 12-story building with 275 homes and 38,000 square feet of commercial and retail space on the first two floors, and a 9-story building with 57 homes that is registered as a historic building. During first quarter, Aimco commenced an initial phase of redevelopment, which includes upgrading the 275 homes and common areas with luxury finishes and creating limited access penthouse homes with an exclusive common area on the top two floors of the 12-story building. In response to market conditions, during the third quarter, Aimco decided to pause redevelopment activities pertaining to apartment homes. Redevelopment of the corridors in the 12-story building continues and is expected to be completed in first quarter 2018. Aimco will reassess an appropriate time to resume apartment home redevelopment activity pertaining to apartment homes. |
Flamingo South Beach Miami, FL | The current phase of the redevelopment includes the full upgrade of the property-wide security systems, including biometrics and destination elevators, and upgrade of the common areas of the center tower and mid-rise building. The second phase of the redevelopment is expected to include upgrades to the apartment homes in the center tower and mid-rise building and a redesign of the North Tower. |
Palazzo at Park La Brea Los Angeles, CA | The phased redevelopment began in 2012 with completion of enhancements of the fitness center and spa in 2013. In 2014, Aimco completed the upgrade of 77 fourth floor penthouses. The current phase of the project includes the renovation of 389 apartment homes on the first three floors, or 75% of the homes in the community, and enhancements to the corridors on these floors. Aimco slowed the construction pace to better align the delivery of completed apartment homes with market demand. As Aimco evaluates the success of the project and other investment alternatives, Aimco may redevelop the remaining 55 penthouse homes. |
Palazzo East at Park La Brea Los Angeles, CA | The current phase of the redevelopment includes renovation of the apartment homes to distinguish the community from Palazzo at Park La Brea and Villas at Park La Brea. The redevelopment also includes updated elevator lobbies and corridors. Aimco will complete the redevelopment of the common areas before beginning renovation of the apartment homes. |
Parc Mosaic Boulder, CO | This is a ground-up development of a 226 apartment home community. Aimco completed de-leasing of the existing property and commenced demolition and construction in the fourth quarter with completion anticipated in late 2019. |
Park Towne Place Philadelphia, PA | Aimco is redeveloping the four towers at this community, one at a time. During third quarter, Aimco completed construction of the third tower, which is now 79% leased at rates consistent with underwriting. The success of the first three towers led Aimco to proceed with redevelopment of the fourth and final tower. De-leasing is complete and construction started on schedule during the fourth quarter. The estimated $176.0 million net investment for the approved phases represents a gross investment of $219.7 million, reduced by $43.7 million of historic tax credits. |
Saybrook Pointe San Jose, CA | The redevelopment includes redesigning kitchens, installing new flooring, and upgrading lighting fixtures within the apartment homes and upgrades to all community amenities. |
Yorktown Apartment Homes Lombard, IL | The redevelopment includes modernization of the common areas, expansion of the fitness center, and lobby renovation. The renovation of the apartment homes includes upgraded finishes and creation of open living spaces. In response to market conditions, during the third quarter, Aimco decided to pause redevelopment activities and will reassess an appropriate time to resume redevelopment activity. |
| 31 | |
GLOSSARY AND RECONCILIATIONS OF NON-GAAP FINANCIAL AND OPERATING MEASURES
This Earnings Release and Supplemental Information include certain financial and operating measures used by Aimco management that are not calculated in accordance with accounting principles generally accepted in the United States, or GAAP. Aimco’s definitions and calculations of these non-GAAP financial and operating measures and other terms may differ from the definitions and methodologies used by other REITs and, accordingly, may not be comparable. These non-GAAP financial and operating measures should not be considered an alternative to GAAP net income or any other GAAP measurement of performance and should not be considered an alternative measure of liquidity.
AIMCO OP: AIMCO Properties, L.P., a Delaware limited partnership, is the operating partnership in Aimco’s UPREIT structure. Aimco owns approximately 96% of the common partnership units of the Aimco OP.
AIMCO PROPORTIONATE FINANCIAL INFORMATION: Within this Earnings Release and Supplemental Information, Aimco provides certain financial information necessary to calculate Aimco’s share of financial information. This information is not, nor is it intended to be, a presentation in accordance with GAAP. Aimco’s proportionate share of financial information includes Aimco’s share of unconsolidated real estate partnerships and excludes the noncontrolling interest partners’ share of consolidated real estate partnerships.
Aimco does not control the unconsolidated real estate partnerships and the calculation of Aimco’s share of the assets and liabilities and revenues and expenses does not represent a legal claim to a proportionate share of such items. The amount of cash distributions partners in such partnerships may receive is based upon specific provisions in the partnership agreements and may vary based on whether such distributions are generated from operations, capital events or liquidation.
Proportionate information benefits the users of Aimco’s financial information by providing the amount of revenues, expenses, assets, liabilities and other items attributable to Aimco stockholders. Other companies may calculate their proportionate information differently than Aimco does, limiting the usefulness as a comparative measure. Because of these limitations, the non-GAAP Aimco proportionate financial information should not be considered in isolation or as a substitute for information included in Aimco’s financial statements as reported under GAAP.
ASSET MANAGEMENT: Asset Management refers generally to the activities Aimco performs in its role as general partner in partnerships holding low-income housing tax credit apartment communities, and which are structured to provide for the pass-through of tax credits and deductions to their partners. Aimco holds nominal ownership positions in these partnerships, generally less than 1%. In its role, Aimco provides asset management and other services to these partnerships and receives fees and other payments in return. To the extent the amounts due Aimco are not paid currently, the balances accrue and are satisfied from the partnerships’ future operating or liquidating cash flow. Aimco also recognizes tax credit income as the tax credits and tax deductions are delivered to the partners and is generally responsible for ensuring the underlying apartment communities comply with the requirements to earn low-income housing tax credits. Aimco’s relationship with these partnerships is different than real estate ownership and is better described as an Asset Management business. Aimco has limited upside or downside exposure. Aimco values the Asset Management business based on the discounted future cash flows it expects to receive.
Aimco consolidates most of these partnerships and their underlying apartment communities under GAAP. Aimco’s share of the results of operations of these apartment communities was approximately 95% at
| 32 |
December 31, 2017 (inclusive of unconsolidated communities) and represents cash flows from operations that are currently available to pay fees and other amounts due under the contractual agreements.
Under the tax credit agreements, Aimco will receive additional semi-annual cash contributions totaling $10.1 million through 2019. As of December 31, 2017, Aimco also had $4.7 million of net unamortized deferred income related to cash contributions previously received by Aimco in exchange for the allocation of tax credits and related tax benefits to investors in tax credit arrangements.
Cash Contributions To Be Received | Amortization of Deferred Tax Credit Income | Expense | Projected Income | ||||||||||||||
2018 | $ | 5,528 | $ | 397 | $ | (310 | ) | $ | 5,615 | ||||||||
2019 | 4,597 | (724 | ) | (213 | ) | 3,660 | |||||||||||
2020 | — | 2,511 | (133 | ) | 2,378 | ||||||||||||
2021 | — | 1,370 | (96 | ) | 1,274 | ||||||||||||
2022 | — | 823 | (46 | ) | 777 | ||||||||||||
Thereafter | — | 1,149 | (47 | ) | 1,102 | ||||||||||||
Total | $ | 10,125 | $ | 5,526 | $ | (845 | ) | $ | 14,806 | ||||||||
AVERAGE AGE OF APARTMENT COMMUNITIES: Calculated by Aimco on a property-by-property basis based on the year the community was originally built, adjusted for redevelopment and/or other major capital improvements that effectively reduce the age of the community. Such investments include construction of new buildings and/or amenities, replacement or modernization of mechanical, plumbing and electrical systems and other investments that are consequential in nature.
CAPITAL ADDITIONS DEFINITIONS
CAPITAL IMPROVEMENTS (CI): CI includes all non-Redevelopment capital additions that are made to enhance the value, profitability or useful life of an asset from its original purchase condition.
CAPITAL REPLACEMENTS (CR): Unlike CI, CR does not increase the useful life of an asset from its original purchase condition. CR represents the portion of capital additions that are deemed to replace the consumed portion of acquired capital assets. CR is deducted in the calculation of AFFO.
CASUALTY CAPITAL ADDITIONS: Casualty capital additions represent capitalized costs incurred in connection with the restoration of an asset after a casualty event such as a hurricane, tornado, flood or fire.
PROPERTY UPGRADES: Property Upgrades may include kitchen and bath remodeling; energy conservation projects; and investments in longer-lived materials designed to reduce turnover costs, such as simulated wood flooring and granite countertops. Property Upgrades differ from Redevelopment Additions in that they are generally lesser in scope and do not significantly disrupt property operations.
REDEVELOPMENT ADDITIONS: Redevelopment additions represent capital additions intended to enhance the value of the apartment community through the ability to generate higher average rental rates. Redevelopment additions may include costs related to entitlement, which enhance the value of a community through increased density, and costs related to renovation of exteriors, common areas or apartment homes.
DEVELOPMENT ADDITIONS: Development additions represent construction and related capitalized costs associated with ground-up development projects.
| 33 |
CONTRIBUTION FROM ASSET MANAGEMENT: As presented in Supplemental Schedule 2, Contribution from Asset Management consists of fees and other amounts paid to Aimco from the net operating income of partnerships that own low-income housing tax credit apartment communities less interest expense incurred on non-recourse property-level debt obligations of the partnerships; income associated with delivery of tax credits to the non-Aimco investors in the partnerships (including amounts received during the period and amounts received in previous periods); and other income; less asset management expenses (including certain allocated offsite costs related to the operation of this business).
CONTRIBUTION FROM REAL ESTATE: As presented in Supplemental Schedule 2, Contribution from Real Estate consists of property net operating income and other items of income or expense that relate to the Real Estate portfolio, including property management expenses, casualty losses, interest expense related to non-recourse property debt encumbering these communities, and interest income Aimco earns on its investment in a securitization trust that holds certain Aimco property debt.
FREE CASH FLOW: Free Cash Flow, as calculated for Aimco’s retained portfolio, represents an apartment community’s property net operating income, less spending for Capital Replacements. Capital Replacement spending is a measure of the cost of capital asset used during the period. Aimco believes that Free Cash Flow is useful to investors as a supplemental measure of apartment community performance because it takes into consideration costs incurred during the period to replace capital assets that have been consumed during Aimco’s ownership.
FREE CASH FLOW CAP RATE: Free Cash Flow Cap Rate represents the NOI Cap Rate, adjusted for assumed Capital Replacements spending of $1,200 per apartment home.
FREE CASH FLOW MARGIN: Free Cash Flow Margin represents an apartment community’s property net operating income less $1,200 per apartment home of assumed annual Capital Replacement spending, as a percentage of the apartment community’s rental and other property revenues.
FUNDS FROM OPERATIONS (FFO): FFO is a commonly used measure of REIT performance, which the National Association of Real Estate Investment Trusts (NAREIT) defines as net income, computed in accordance with GAAP, excluding gains from sales of, and impairment losses recognized with respect to, depreciable property, plus depreciation and amortization, and after adjustments for unconsolidated partnerships and joint ventures. Aimco computes FFO for all periods presented in accordance with the guidance set forth by NAREIT.
In addition to FFO, Aimco uses PRO FORMA FUNDS FROM OPERATIONS (Pro forma FFO) and ADJUSTED FUNDS FROM OPERATIONS (AFFO) to measure performance. Pro forma FFO represents FFO as defined above, excluding preferred equity redemption related amounts (adjusted for noncontrolling interests). Preferred equity redemption related amounts (gains or losses) are items that periodically affect net income attributable to Aimco common stockholders computed in accordance with GAAP. Aimco excludes preferred equity redemption related amounts (gains or losses) from its computation of Pro forma FFO because such amounts are not representative of operating performance.
Additionally in 2017, Aimco recognized a net tax benefit associated with the December 2017 tax reform legislation consisting of a benefit related to the revaluation of net deferred tax liabilities of Aimco’s taxable REIT subsidiaries, partially offset by a valuation allowance related to deferred tax assets. Aimco excluded the revaluation from its computation of Pro forma FFO because this type of tax benefit occurs infrequently and is not representative of Aimco’s operating performance.
AFFO represents Pro forma FFO reduced by Capital Replacements (also adjusted for noncontrolling interests) and is Aimco’s primary measure of current period performance.
| 34 |
FFO, Pro forma FFO and AFFO are non-GAAP measures that Aimco believes are helpful to investors in understanding Aimco’s performance because they capture features particular to real estate performance by recognizing that real estate generally appreciates over time or maintains residual value to a much greater extent than other capital assets such as machinery, computers or other personal property. FFO, Pro forma FFO and AFFO should not be considered alternatives to net income (loss) as determined in accordance with GAAP, as indicators of performance. There can be no assurance that Aimco’s method of computing FFO, Pro forma FFO or AFFO is comparable with that of other real estate investment trusts.
The following table reconciles GAAP net income per share to Pro forma FFO per share and AFFO per share, each as presented at the mid-point of Aimco’s guidance:
(dollars per share) (unaudited) | First Quarter | Full Year | |||||
2018 | 2018 | ||||||
Net income | $ | 0.31 | $ | 0.41 | |||
Depreciation, net | 0.59 | 2.37 | |||||
Gain on disposition of real estate, net of tax | (0.31 | ) | (0.31 | ) | |||
Pro forma FFO | 0.59 | 2.47 | |||||
Capital Replacements, net | (0.07 | ) | (0.31 | ) | |||
AFFO | $ | 0.52 | $ | 2.16 | |||
LEVERAGE RATIO DEFINITIONS
Aimco’s leverage strategy targets the ratio of Debt and Preferred Equity to Adjusted EBITDA to be below 7.0x and the ratio of Adjusted EBITDA to Adjusted Interest and Preferred Dividends to be greater than 2.5x. Aimco also focuses on the ratios of Debt to Adjusted EBITDA and Adjusted EBITDA Coverage of Adjusted Interest. Aimco believes these ratios, which are based in part on non-GAAP financial information, are commonly used by investors and analysts to assess the relative financial risk associated with balance sheets of companies within the same industry, and they are believed to be similar to measures used by rating agencies to assess entity credit quality.
Aimco leverage includes Aimco’s share of long-term, non-recourse property debt secured by apartment communities in the Real Estate portfolio, a one-year term loan, outstanding borrowings under its revolving credit facility, and outstanding preferred equity. Aimco leverage excludes non-recourse property debt obligations of consolidated partnerships served by the Asset Management business (described further under the Asset Management definition, above). The value of the Asset Management business is attributed to the fees paid to Aimco from the operation and liquidation of the underlying partnerships, and the non-recourse property debt obligations of the partnerships in this business are not Aimco’s obligations and have limited effect on the amount of fees and other amounts Aimco expects to receive under the contractual agreements. Aimco reconciles consolidated balances to Aimco’s net leverage on Supplemental Schedule 5(a).
Aimco calculates its leverage ratios based on current quarter amounts, annualized.
As described further in the Leverage Ratios discussion in the Earnings Release and in Supplemental Schedule 5(a), Aimco adjusted its fourth quarter leverage ratios to reflect the disposition of five apartment communities during the period as if the sales had closed on October 1, 2017, because the proceeds from these sales were used to reduce leverage as of December 31, 2017.
| 35 |
ADJUSTED EARNINGS BEFORE INTEREST, TAXES, DEPRECIATION AND AMORTIZATION (ADJUSTED EBITDA): Adjusted EBITDA represents Aimco’s share of the consolidated amount of Aimco net income, adjusted to exclude the effect of the following items for the reasons set forth below:
• | Adjusted Interest Expense, defined below, to allow investors to compare a measure of Aimco’s earnings before the effects of Aimco’s indebtedness with that of other companies in the real estate industry; |
• | preferred dividends, to allow investors to compare a measure of Aimco’s earnings before the effects of Aimco’s capital structure and indebtedness with that of other companies in the real estate industry; |
• | income taxes, to allow investors to measure Aimco’s performance independent of income taxes, which may vary significantly from other companies within Aimco’s industry due to leverage and tax planning strategies, among other factors; |
• | depreciation and amortization, gains or losses on dispositions and impairment losses related to real estate, for similar reasons to those set forth in the discussion of FFO, Pro forma FFO and AFFO above; and |
• | other items, including gains on dispositions of non-depreciable assets, as these are items that periodically affect Aimco operations, but that are not necessarily representative of Aimco’s ability to service its debt obligations. |
A reconciliation of net income attributable to Aimco Common Stockholders to Adjusted EBITDA for Aimco’s Real Estate portfolio for the three months ended December 31, 2017 is as follows:
(in thousands) (unaudited) | Three Months Ended December 31, 2017 | ||
Net income attributable to Aimco Common Stockholders | $ | 262,097 | |
Adjustments: | |||
Adjusted Interest Expense | 42,219 | ||
Income tax benefit | (17,248 | ) | |
Depreciation and amortization, net of noncontrolling interest | 97,418 | ||
Gains on disposition and other, net of income taxes and noncontrolling partners’ interests | (255,516 | ) | |
Preferred stock dividends | 2,149 | ||
Net income attributable to noncontrolling interests in Aimco Operating Partnership | 14,374 | ||
Pro forma adjustment (described above) | (4,248 | ) | |
Adjusted EBITDA | $ | 141,245 | |
Annualized Adjusted EBITDA | $ | 564,980 | |
ADJUSTED INTEREST EXPENSE: Adjusted Interest Expense represents Aimco’s proportionate share of interest expense on non-recourse property debt encumbering Real Estate apartment communities and interest on the credit facility borrowings less (i) prepayment penalties and amortization of debt issuance costs and (ii) the amount of interest income recognized by Aimco related to its investment in the subordinated tranches in a securitization trust holding primarily Aimco property debt. Adjusted Interest Expense also excludes interest expense related to non-recourse property debt obligations of consolidated partnerships served by the Asset Management business.
| 36 |
Adjusted Interest Expense and Preferred Dividends as used in the leverage ratios on Supplemental Schedule 5(a) are calculated as follows:
(in thousands) (unaudited) | Three Months Ended December 31, 2017 | ||
Interest expense per consolidated statement of operations | $ | 49,193 | |
Interest expense related to non-recourse property debt obligations of consolidated partnerships served by the Asset Management business | (3,166 | ) | |
Interest expense attributable to Real Estate portfolio | 46,027 | ||
Adjustments: | |||
Adjustments related to interest of consolidated and unconsolidated partnerships | (105 | ) | |
Debt prepayment penalties and other non-interest items | (496 | ) | |
Amortization of debt issue costs | (1,393 | ) | |
Interest income received on securitization investment | (1,814 | ) | |
Adjusted Interest Expense | $ | 42,219 | |
Preferred Dividends | 4,087 | ||
Adjusted Interest Expense and Preferred Dividends | $ | 46,306 | |
Annualized Adjusted Interest Expense | $ | 168,876 | |
Annualized Adjusted Interest Expense and Preferred Dividends | $ | 185,224 | |
FIXED CHARGE COVERAGE RATIO: As defined by Aimco’s credit agreement, the ratio of (a) EBITDA to (b) fixed charges, which represent the sum of (i) Aimco’s proportionate share of interest expense (excluding prepayment penalties and amortization of debt issuance costs), (ii) debt amortization and (iii) Preferred Dividends, for the four fiscal quarters preceding the date of calculation. The calculation of certain of these measures as defined by Aimco’s Credit Agreement may differ from those used by Aimco in the calculations of its Leverage Ratios.
PREFERRED DIVIDENDS: Preferred dividends include dividends paid with respect to Aimco’s Preferred Stock and the Aimco OP’s Preferred Partnership Units, exclusive of preferred equity redemption related amounts.
PREFERRED EQUITY: Preferred equity represents the redemption amounts for Aimco’s Preferred Stock and the Aimco OP’s Preferred Partnership Units and may be found in Aimco’s consolidated balance sheets and on Supplemental Schedule 5(b).
PROPORTIONATE DEBT TO ADJUSTED EBITDA RATIO: The ratio of (a) Aimco’s share of net leverage as calculated on Supplemental Schedule 5(a) and shown above, excluding Preferred Equity to (b) Adjusted EBITDA.
PROPORTIONATE DEBT AND PREFERRED EQUITY TO ADJUSTED EBITDA RATIO: The ratio of (a) Aimco’s share of net leverage attributable to its Real Estate portfolio as calculated on Supplemental Schedule 5(a) and shown above to (b) Adjusted EBITDA.
NET OPERATING INCOME (NOI) CAP RATE: NOI Cap Rate is calculated based on Aimco’s share of the proportionate property NOI for the trailing twelve months prior to sale , less a 3% management fee, divided by Aimco gross proceeds.
NET OPERATING INCOME (NOI) MARGIN: Represents an apartment community’s net operating income as a percentage of the apartment community’s rental and other property revenues.
| 37 |
OTHER EXPENSES, NET: Other expenses, net includes franchise taxes, risk management activities related to Aimco’s unconsolidated partnerships and certain other corporate expenses and expenses specifically related to Aimco’s administration of its real estate partnerships, for example, services such as audit, tax and legal.
PROPERTY NET OPERATING INCOME (NOI) and PROPORTIONATE PROPERTY NOI: NOI is defined by Aimco as total property rental and other property revenues less direct property operating expenses, including real estate taxes. NOI does not include: property management revenues, primarily from affiliates; casualties; property management expenses; depreciation; or interest expense. NOI is helpful because it helps both investors and management to understand the operating performance of real estate excluding costs associated with decisions about acquisition pricing, overhead allocations and financing arrangements. NOI is also considered by many in the real estate industry to be a useful measure for determining the value of real estate. Reconciliations of NOI as presented in this Earnings Release and Supplemental Information to Aimco’s consolidated GAAP amounts are provided below.
Due to the diversity of its economic ownership interests in its apartment communities in the periods presented, Aimco evaluates the performance of the apartment communities in its Real Estate segment using Proportionate Property NOI, which represents Aimco’s share of the NOI for the apartment communities that Aimco consolidates and manages but excludes apartment communities that it does not consolidate. Reconciliation of the Same Store Proportionate Property NOI presented on Supplemental Schedule 6 and the Redevelopment/Development Proportionate Property NOI presented on Supplemental Schedule 10 to the Real Estate segment Proportionate Property NOI has been provided below. Additionally, Real Estate segment Proportionate Property NOI has been further reconciled to Real Estate net operating income as shown on Supplemental Schedule 2 and income before gain on dispositions per the consolidated statements of operations.
| 38 |
Real Estate Segment NOI Reconciliation | ||||||||||||||||||||
(in thousands)(unaudited) | Three Months Ended | Year to Date | ||||||||||||||||||
December 31, 2017 | September 30, 2017 | December 31, 2016 | December 31, 2017 | December 31, 2016 | ||||||||||||||||
Rental and other property revenues | ||||||||||||||||||||
Same Store | $ | 148,447 | $ | 148,207 | $ | 144,394 | $ | 587,562 | $ | 569,522 | ||||||||||
Redevelopment/Development | 46,718 | 47,357 | 37,982 | 172,517 | 145,315 | |||||||||||||||
Acquisitions | 6,223 | 5,961 | 4,106 | 22,520 | 7,667 | |||||||||||||||
Other Real Estate | 18,282 | 17,906 | 17,581 | 71,892 | 69,083 | |||||||||||||||
Total Real Estate segment proportionate rental and other property revenues | $ | 219,670 | $ | 219,431 | $ | 204,063 | $ | 854,491 | $ | 791,587 | ||||||||||
Property operating expenses | ||||||||||||||||||||
Same Store | $ | 40,427 | $ | 42,289 | $ | 39,600 | $ | 167,356 | $ | 166,134 | ||||||||||
Redevelopment/Development | 18,050 | 16,764 | 14,042 | 63,982 | 56,481 | |||||||||||||||
Acquisitions | 2,241 | 2,269 | 2,192 | 8,886 | 4,377 | |||||||||||||||
Other Real Estate | 6,255 | 6,274 | 5,987 | 24,962 | 24,644 | |||||||||||||||
Total Real Estate segment proportionate property operating expenses | $ | 66,973 | $ | 67,596 | $ | 61,821 | $ | 265,186 | $ | 251,636 | ||||||||||
Property net operating income | ||||||||||||||||||||
Same Store | $ | 108,020 | $ | 105,918 | $ | 104,794 | $ | 420,206 | $ | 403,388 | ||||||||||
Redevelopment/Development | 28,668 | 30,593 | 23,940 | 108,535 | 88,834 | |||||||||||||||
Acquisitions | 3,982 | 3,692 | 1,914 | 13,634 | 3,290 | |||||||||||||||
Other Real Estate | 12,027 | 11,632 | 11,594 | 46,930 | 44,439 | |||||||||||||||
Total Real Estate proportionate property net operating income | $ | 152,697 | $ | 151,835 | $ | 142,242 | $ | 589,305 | $ | 539,951 | ||||||||||
Proportionate adjustments and operations of consolidated properties not managed | 1,186 | 1,815 | 5,326 | 13,040 | 22,576 | |||||||||||||||
Real Estate net operating income | $ | 153,883 | $ | 153,650 | $ | 147,568 | $ | 602,345 | $ | 562,527 | ||||||||||
Corporate and other amounts not allocated to Real Estate | (166,372 | ) | (131,273 | ) | (126,733 | ) | (554,825 | ) | (473,044 | ) | ||||||||||
(Loss) income before gain on dispositions | $ | (12,489 | ) | $ | 22,377 | $ | 20,835 | $ | 47,520 | $ | 89,483 | |||||||||
Proportionate Property NOI for Aimco’s Real Estate reportable segment includes proportionate and other adjustments, primarily to remove the results of operations of a consolidated property not managed by Aimco, which are included in Real Estate net operating income as presented on Supplemental Schedule 2. Corporate and other amounts not allocated to Real Estate represents the adjustment necessary to reconcile Real Estate net operating income to the nearest GAAP measure, income before gain on dispositions. This adjustment includes operating results of apartment communities sold during the periods shown or held for sale at the end of the period and the operating results of apartment communities owned by consolidated partnerships served by Aimco’s Asset Management business. This amount also includes property management revenues and expenses, depreciation and amortization, general and administrative expenses, other operating expenses, interest expense and income tax benefit, which are not included in Real Estate Proportionate Property NOI.
| 39 |
PORTFOLIO QUALITY RATINGS: Aimco measures the quality of apartment communities in its Real Estate portfolio based on average rents of our apartment homes compared to local market average rents as reported by a third-party provider of commercial real estate performance and analysis. Under this rating system, Aimco classifies as “A” quality apartment communities those earning rents greater than 125% of the local market average, as “B” quality apartment communities those earning rents between 90% and 125% of the local market average; “C+” quality apartment communities those earning rents greater than $1,100 per month, but lower than 90% of the local market average; and “C” quality apartment communities those earning rents less than $1,100 per month and lower than 90% of the local market average.
REAL ESTATE: Real Estate represents Aimco’s portfolio of apartment communities diversified by both price point and geography. Real Estate includes predominantly market rate apartment communities in which Aimco holds substantial equity ownership interest, generally 100%. Aimco’s Real Estate portfolio is classified into four categories, as follows:
SAME STORE: Same Store apartment communities are apartment communities that (a) are owned and managed by Aimco, (b) had reached a stabilized level of operations as of January 1, 2016 and maintained it throughout the current and the comparable prior periods and (c) are not expected to be sold within 12 months.
ACQUISITION: Includes apartment communities acquired since January 1, 2016.
REDEVELOPMENT/DEVELOPMENT: Includes apartment communities currently under construction that have not achieved a stabilized level of operations and those that have been completed in recent years that had not achieved and maintained stabilized operations for both the current and the comparable prior periods.
OTHER REAL ESTATE: Real Estate apartment communities that do not meet the Same Store, Acquisition or Redevelopment/Development definitions.
SOLD AND HELD FOR SALE APARTMENT COMMUNITIES: Apartment communities either sold since January 1, 2016, or classified as held for sale at the end of the period. For purposes of highlighting results of operations related to Aimco’s retained portfolio, results for Sold and Held For Sale Apartment Communities are excluded from property net operating income and presented separately for Real Estate and Asset Management on a net basis on Supplemental Schedule 2. Information about property net operating income for Sold and Held For Sale Apartment Communities may be found on Supplemental Schedule 3(b).
| 40 |