Attached files
| file | filename |
|---|---|
| EX-99.2 - EXHIBIT 99.2 - SEACOAST BANKING CORP OF FLORIDA | tv484561_ex99-2.htm |
| EX-99.1 - EXHIBIT 99.1 - SEACOAST BANKING CORP OF FLORIDA | tv484561_ex99-1.htm |
| 8-K - FORM 8-K - SEACOAST BANKING CORP OF FLORIDA | tv484561_8k.htm |
Exhibit 99.3
Q4 - 2017 Earnings Presentation Contact: (email) Chuck.Shaffer@SeacoastBank.com (phone) 772.221.7003 (web) www.SeacoastBanking.com
This press release contains "forward - looking statements" within the meaning, and protections, of Section 27 A of the Securities Act of 1933 and Section 21 E of the Securities Exchange Act of 1934 , including, without limitation, statements about future financial and operating results, cost savings, enhanced revenues, economic and seasonal conditions in our markets, and improvements to reported earnings that may be realized from cost controls, tax law changes, and for integration of banks that we have acquired, or expect to acquire, as well as statements with respect to Seacoast's objectives, strategic plans, including Vision 2020 , expectations and intentions and other statements that are not historical facts . Actual results may differ from those set forth in the forward - looking statements . Forward - looking statements include statements with respect to our beliefs, plans, objectives, goals, expectations, anticipations, estimates and intentions, and involve known and unknown risks, uncertainties and other factors, which may be beyond our control, and which may cause the actual results, performance or achievements of Seacoast to be materially different from future results, performance or achievements expressed or implied by such forward - looking statements . You should not expect us to update any forward - looking statements . You can identify these forward - looking statements through our use of words such as “may,” “will,” “anticipate,” “assume,” “should,” “support”, “indicate,” “would,” “believe,” “contemplate,” “expect,” “estimate,” “continue,” “further”, “point to,” “project,” “could,” “intend” or other similar words and expressions of the future . These forward - looking statements may not be realized due to a variety of factors, including, without limitation : the effects of future economic and market conditions, including seasonality ; governmental monetary and fiscal policies, as well as legislative, tax and regulatory changes ; changes in accounting policies, rules and practices ; the risks of changes in interest rates on the level and composition of deposits, loan demand, liquidity and the values of loan collateral, securities, and interest sensitive assets and liabilities ; interest rate risks, sensitivities and the shape of the yield curve ; the effects of competition from other commercial banks, thrifts, mortgage banking firms, consumer finance companies, credit unions, securities brokerage firms, insurance companies, money market and other mutual funds and other financial institutions operating in our market areas and elsewhere, including institutions operating regionally, nationally and internationally, together with such competitors offering banking products and services by mail, telephone, computer and the Internet ; and the failure of assumptions underlying the establishment of reserves for possible loan losses . The risks of mergers and acquisitions, include, without limitation : unexpected transaction costs, including the costs of integrating operations ; the risks that the businesses will not be integrated successfully or that such integration may be more difficult, time - consuming or costly than expected ; the potential failure to fully or timely realize expected revenues and revenue synergies, including as the result of revenues following the merger being lower than expected ; the risk of deposit and customer attrition ; any changes in deposit mix ; unexpected operating and other costs, which may differ or change from expectations ; the risks of customer and employee loss and business disruption, including, without limitation, as the result of difficulties in maintaining relationships with employees ; increased competitive pressures and solicitations of customers by competitors ; as well as the difficulties and risks inherent with entering new markets . All written or oral forward - looking statements attributable to us are expressly qualified in their entirety by this cautionary notice, including, without limitation, those risks and uncertainties described in our annual report on Form 10 - K for the year ended December 31 , 2016 under “Special Cautionary Notice Regarding Forward - Looking Statements” and “Risk Factors”, and otherwise in our SEC reports and filings . Such reports are available upon request from the Company, or from the Securities and Exchange Commission, including through the SEC’s Internet website at http : //www . sec . gov . Cautionary Notice Regarding Forward - Looking Statements 2
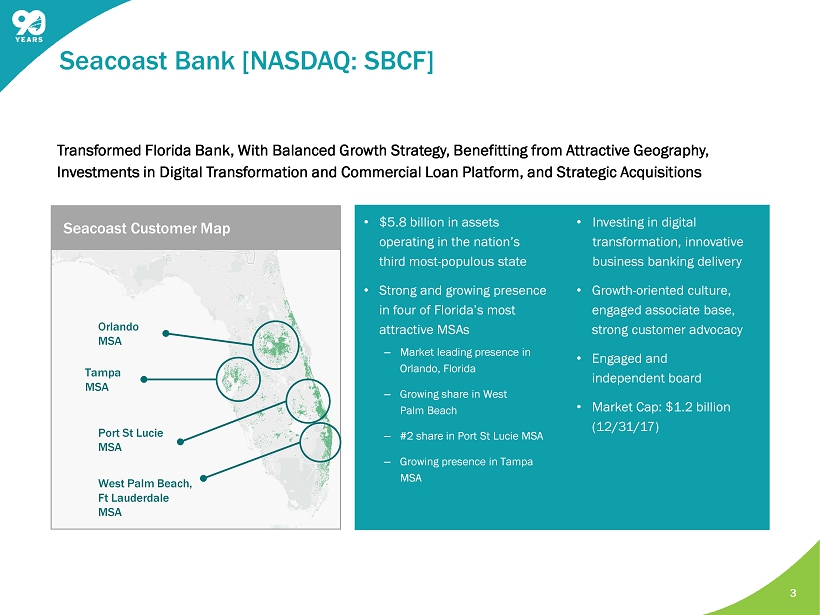
• $5.8 billion in assets operating in the nation’s third most - populous state • Strong and growing presence in four of Florida’s most attractive MSAs ‒ Market leading presence in Orlando, Florida ‒ Growing share in West Palm Beach ‒ #2 share in Port St Lucie MSA ‒ Growing presence in Tampa MSA • Investing in digital transformation, innovative business banking delivery • Growth - oriented culture, engaged associate base, strong customer advocacy • Engaged and independent board • Market Cap: $1.2 billion (12/31/17 ) Transformed Florida Bank , With Balanced Growth Strategy, Benefitting from Attractive Geography, Investments in Digital Transformation and Commercial Loan Platform, and Strategic Acquisitions 3 Seacoast Bank [NASDAQ: SBCF] Orlando MSA West Palm Beach, Ft Lauderdale MSA Port St Lucie MSA Tampa MSA Seacoast Customer Map
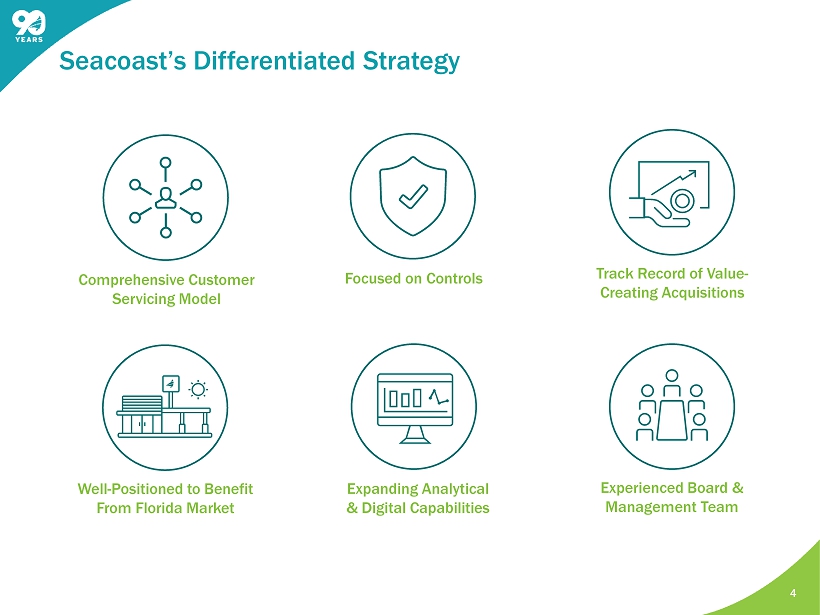
4 Seacoast’s Differentiated Strategy Experienced Board & Management Team Comprehensive Customer Servicing Model Track Record of Value - Creating Acquisitions Expanding Analytical & Digital Capabilities Well - Positioned to Benefit From Florida Market Focused on Controls
5 4Q and Full Year 2017 Highlights With a growing presence in Florida’s most attractive markets, we have one of Florida’s top - performing banking franchises. • Achieved full - year adjusted EPS guidance target range, despite the impact from hurricanes • Increased tangible book value per share to $11.15 per share at year end up from $9.37 at the end of the prior year. This represents a 19% growth in tangible capital per share, overcoming the dilutive effect of the capital raise in early 2017 and the effect of an $8.6 million write down of the Company’s deferred tax assets as the result of the Tax Cuts and Jobs Act of 2017. • The fourth quarter earnings per share totaled $ 0.28 on a GAAP basis, and $0.37 per share on an adjusted basis 1 . Full - year 2017 earnings per share totaled $0.99 on a GAAP basis, and $1.28 per share on an adjusted basis 1 . • Full - year 2017 net income increased 47% to $42.9 million, while net revenue increased 32% to $234.8 million . Adjusted full - year net income 1 increased 42% to $55.3 million. • Ended the year with a 1.23% adjusted Return on Tangible Assets 1 and 13.5% adjusted Return on Average Tangible Common Equity 1 . • E ntered the Tampa - St. Petersburg - Clearwater market through the acquisitions of Gulfshore Bank and NorthStar Banking Corporation. Additionally, we deepened our South Florida presence with the acquisition of Palm Beach Community Bank. • During the quarter, organic deposits grew by 10% on an annualized basis. 1 Non - GAAP measure, see “Explanation of Certain Unaudited Non - GAAP Financial Measures” Effective in the first quarter of 2017, adjusted net income and adjusted noninterest expense exclude the effect of amortizati on of acquisition - related intangibles. Prior periods have been revised to conform with the current period presentation.
6 Notable Items Affecting Fourth Quarter 2017 Results Tax Cuts and Jobs Act of 2017 • An estimated $8.6 million of additional income tax expense was recorded to write down the Company’s net deferred tax assets as a result of the Tax Cuts and Jobs Act of 2017. The Company’s effective tax rate will decline in 2018 from 35.1% to 23.1%. Hurricane Impacts • The Company’s results in both the third and fourth quarter were impacted by the fall season hurricanes as a result of waived service charges, recovery expenses, a charge - off related to a single Caribbean exporter, and business disruption. Sale of Visa Class B Shares • A $15.2 million gain on sale of shares of Visa Class B was recorded in the fourth quarter. These shares were purchased in early 2017. Merger and acquisition related charges • During the fourth quarter, the company recorded $6.8 million in merger related charges associated with change in control payments, legal and investment banking fees and contract termination expenses associated with the purchase of NorthStar Banking Corporation and Palm Beach Community Bank.
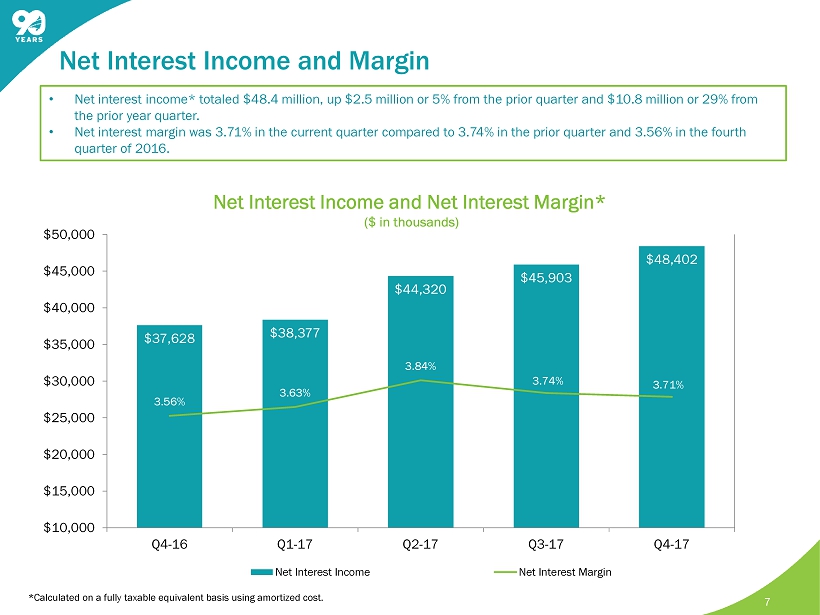
7 Net Interest Income and Net Interest Margin* ($ in thousands) • Net interest income* totaled $48.4 million, up $2.5 million or 5% from the prior quarter and $10.8 million or 29% from the prior year quarter. • Net interest margin was 3.71% in the current quarter compared to 3.74% in the prior quarter and 3.56% in the fourth quarter of 2016. *Calculated on a fully taxable equivalent basis using amortized cost. Net Interest Income and Margin $37,628 $38,377 $44,320 $45,903 $48,402 3.56% 3.63% 3.84% 3.74% 3.71% $10,000 $15,000 $20,000 $25,000 $30,000 $35,000 $40,000 $45,000 $50,000 Q4-16 Q1-17 Q2-17 Q3-17 Q4-17 Net Interest Income Net Interest Margin
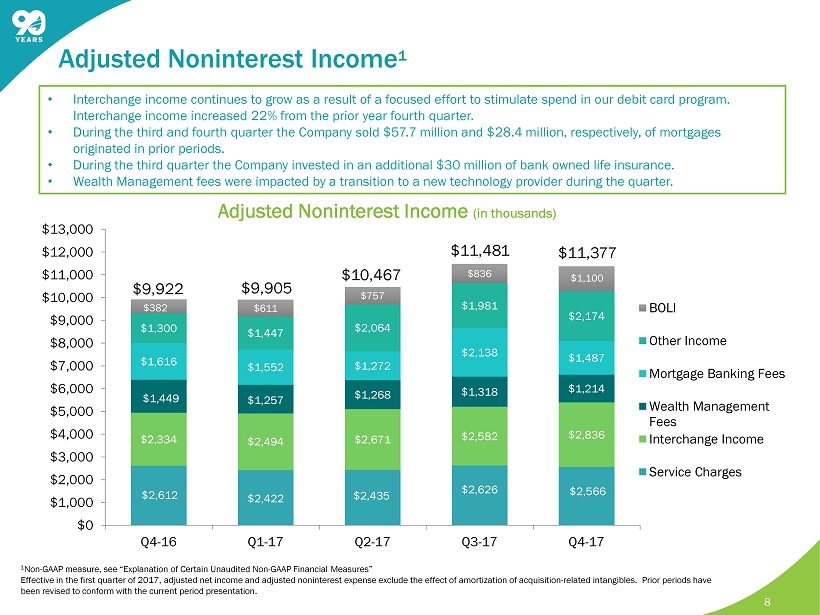
8 $2,612 $2,422 $2,435 $2,626 $2,566 $2,334 $2,494 $2,671 $2,582 $2,836 $1,449 $1,257 $1,268 $1,318 $1,214 $1,616 $1,552 $1,272 $2,138 $1,487 $1,300 $1,447 $2,064 $1,981 $2,174 $611 $757 $836 $1,100 $0 $1,000 $2,000 $3,000 $4,000 $5,000 $6,000 $7,000 $8,000 $9,000 $10,000 $11,000 $12,000 $13,000 Q4-16 Q1-17 Q2-17 Q3-17 Q4-17 BOLI Other Income Mortgage Banking Fees Wealth Management Fees Interchange Income Service Charges $836 Adjusted Noninterest Income (in thousands) $9,922 • Interchange income continues to grow as a result of a focused effort to stimulate spend in our debit card program. Interchange income increased 22% from the prior year fourth quarter. • During the third and fourth quarter the Company sold $ 57.7 million and $28.4 million, respectively, of mortgages originated in prior periods. • During the third quarter the Company invested in an additional $30 million of bank owned life insurance. • Wealth Management fees were impacted by a transition to a new technology provider during the quarter. $9,905 $10,467 $11,481 $11,377 $ 382 Adjusted Noninterest Income 1 1 Non - GAAP measure, see “Explanation of Certain Unaudited Non - GAAP Financial Measures” Effective in the first quarter of 2017, adjusted net income and adjusted noninterest expense exclude the effect of amortizati on of acquisition - related intangibles. Prior periods have been revised to conform with the current period presentation.
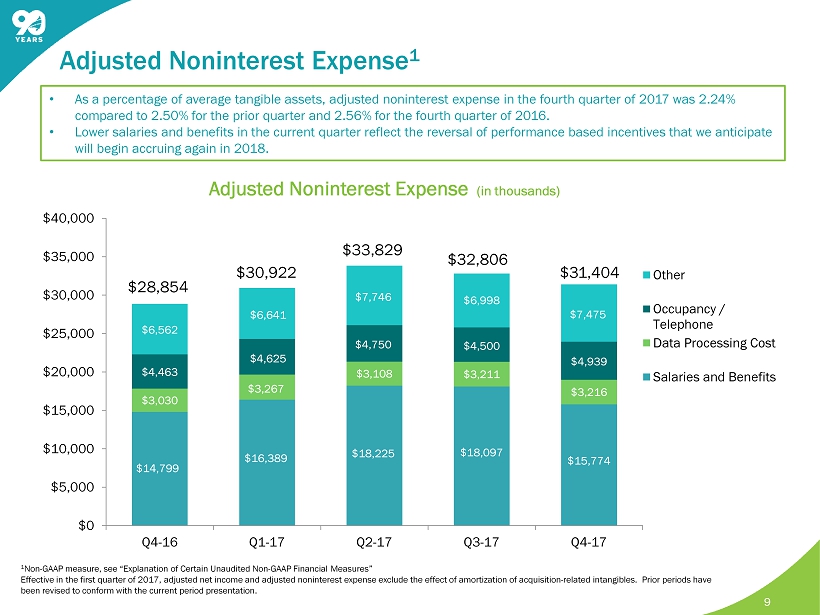
9 $14,799 $16,389 $18,225 $18,097 $15,774 $3,030 $3,267 $3,108 $3,211 $3,216 $4,463 $4,625 $4,750 $4,500 $4,939 $6,562 $6,641 $7,746 $6,998 $7,475 $0 $5,000 $10,000 $15,000 $20,000 $25,000 $30,000 $35,000 $40,000 Q4-16 Q1-17 Q2-17 Q3-17 Q4-17 Other Occupancy / Telephone Data Processing Cost Salaries and Benefits Adjusted Noninterest Expense (in thousands) $31,404 $28,854 $30,922 $33,829 $32,806 • As a percentage of average tangible assets, adjusted noninterest expense in the fourth quarter of 2017 was 2.24% compared to 2.50% for the prior quarter and 2.56 % for the fourth quarter of 2016. • Lower salaries and benefits in the current quarter reflect the reversal of performance based incentives that we anticipate will begin accruing again in 2018. 1 Non - GAAP measure, see “Explanation of Certain Unaudited Non - GAAP Financial Measures” Effective in the first quarter of 2017, adjusted net income and adjusted noninterest expense exclude the effect of amortizati on of acquisition - related intangibles. Prior periods have been revised to conform with the current period presentation. Adjusted Noninterest Expense 1
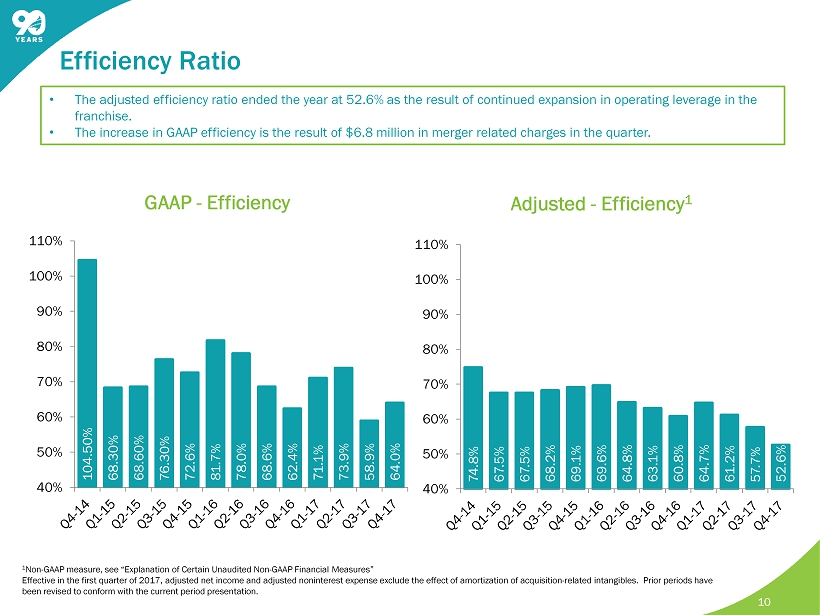
10 104.50% 68.30% 68.60% 76.30% 72.6% 81.7% 78.0% 68.6% 62.4% 71.1% 73.9% 58.9% 64.0% 40% 50% 60% 70% 80% 90% 100% 110% GAAP - Efficiency 74.8% 67.5% 67.5% 68.2% 69.1% 69.6% 64.8% 63.1% 60.8% 64.7% 61.2% 57.7% 52.6% 40% 50% 60% 70% 80% 90% 100% 110% Adjusted - Efficiency 1 1 Non - GAAP measure, see “Explanation of Certain Unaudited Non - GAAP Financial Measures” Effective in the first quarter of 2017, adjusted net income and adjusted noninterest expense exclude the effect of amortizati on of acquisition - related intangibles. Prior periods have been revised to conform with the current period presentation. • The adjusted efficiency ratio ended the year at 52.6% as the result of continued expansion in operating leverage in the franchise. • The increase in GAAP efficiency is the result of $6.8 million in merger related charges in the quarter. Efficiency Ratio
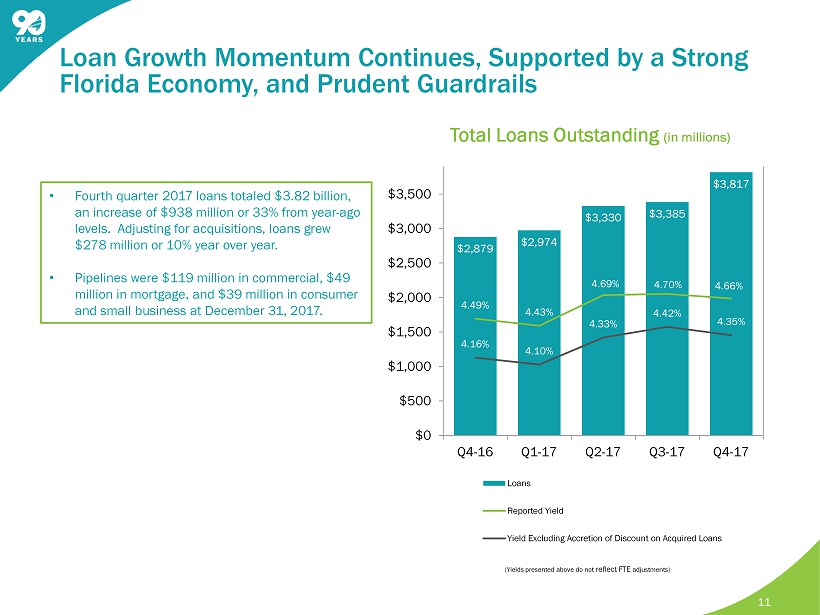
11 Total Loans Outstanding (in millions) • Fourth quarter 2017 loans totaled $3.82 billion, an increase of $938 million or 33% from year - ago levels. Adjusting for acquisitions, loans grew $278 million or 10% year over year. • Pipelines were $119 million in commercial, $49 million in mortgage, and $39 million in consumer and small business at December 31, 2017. $2,879 $2,974 $3,330 $3,385 $3,817 4.49% 4.43% 4.69% 4.70% 4.66% 4.16% 4.10% 4.33% 4.42% 4.35% $0 $500 $1,000 $1,500 $2,000 $2,500 $3,000 $3,500 Q4-16 Q1-17 Q2-17 Q3-17 Q4-17 Loans Reported Yield Yield Excluding Accretion of Discount on Acquired Loans Loan Growth Momentum Continues, Supported by a Strong Florida Economy, and Prudent Guardrails (Yields presented above do not reflect FTE adjustments)
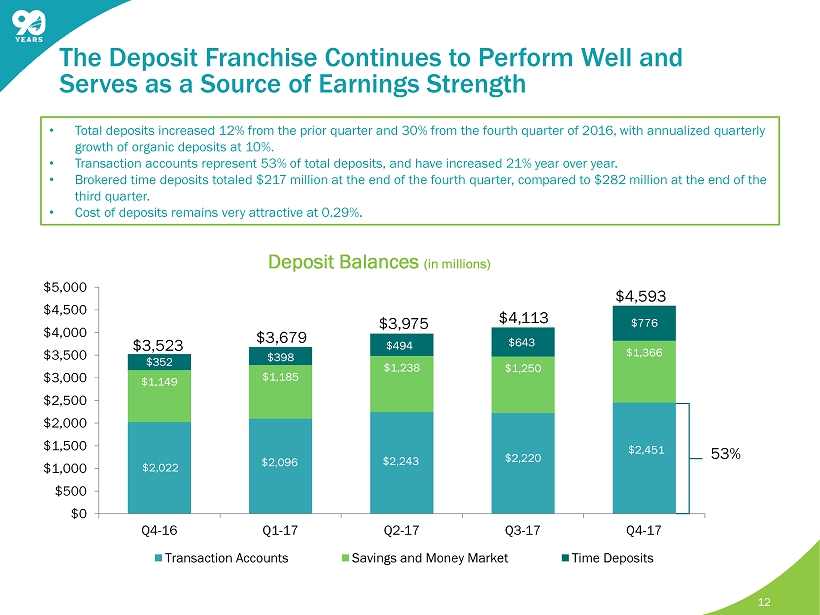
12 • Total deposits increased 12% from the prior quarter and 30% from the fourth quarter of 2016, with annualized quarterly growth of organic deposits at 10%. • Transaction accounts represent 53% of total deposits, and have increased 21% year over year. • Brokered time deposits totaled $217 million at the end of the fourth quarter, compared to $282 million at the end of the third quarter. • Cost of deposits remains very attractive at 0.29%. $2,022 $2,096 $2,243 $2,220 $2,451 $1,149 $1,185 $1,238 $1,250 $1,366 $352 $398 $494 $643 $776 $0 $500 $1,000 $1,500 $2,000 $2,500 $3,000 $3,500 $4,000 $4,500 $5,000 Q4-16 Q1-17 Q2-17 Q3-17 Q4-17 Transaction Accounts Savings and Money Market Time Deposits Deposit Balances (in millions) $4,593 $3,523 $3,679 $3,975 53% $4,113 The Deposit Franchise Continues to Perform Well and Serves as a Source of Earnings Strength
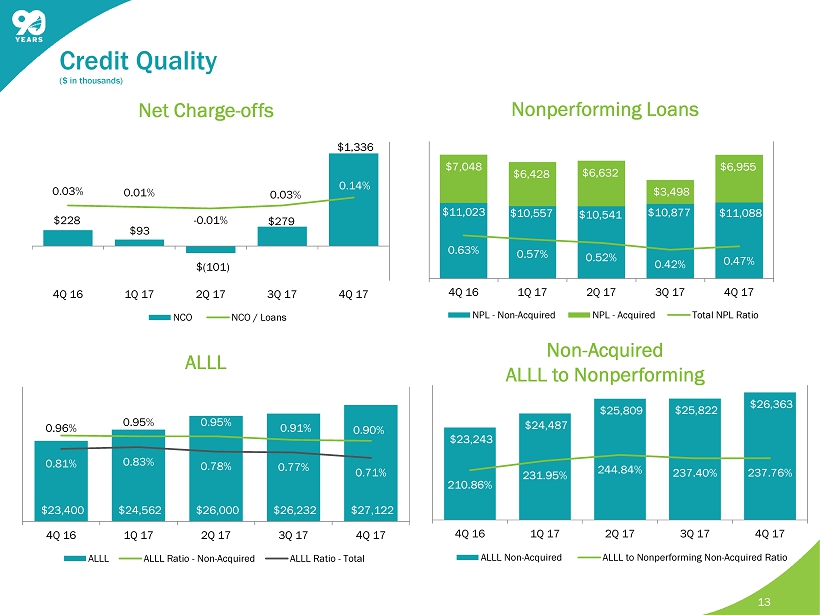
13 Net Charge - offs Nonperforming Loans ALLL $23,400 $24,562 $26,000 $26,232 $27,122 0.96% 0.95% 0.95% 0.91% 0.90% 0.81% 0.83% 0.78% 0.77% 0.71% 4Q 16 1Q 17 2Q 17 3Q 17 4Q 17 ALLL ALLL Ratio - Non-Acquired ALLL Ratio - Total Non - Acquired ALLL to Nonperforming $228 $93 $(101) $279 $1,336 0.03% 0.01% - 0.01% 0.03% 0.14% 4Q 16 1Q 17 2Q 17 3Q 17 4Q 17 NCO NCO / Loans $11,023 $10,557 $10,541 $10,877 $11,088 $7,048 $6,428 $6,632 $3,498 $6,955 0.63% 0.57% 0.52% 0.42% 0.47% 4Q 16 1Q 17 2Q 17 3Q 17 4Q 17 NPL - Non-Acquired NPL - Acquired Total NPL Ratio Credit Quality ($ in thousands) $23,243 $24,487 $25,809 $25,822 $26,363 210.86% 231.95% 244.84% 237.40% 237.76% 4Q 16 1Q 17 2Q 17 3Q 17 4Q 17 ALLL Non-Acquired ALLL to Nonperforming Non-Acquired Ratio
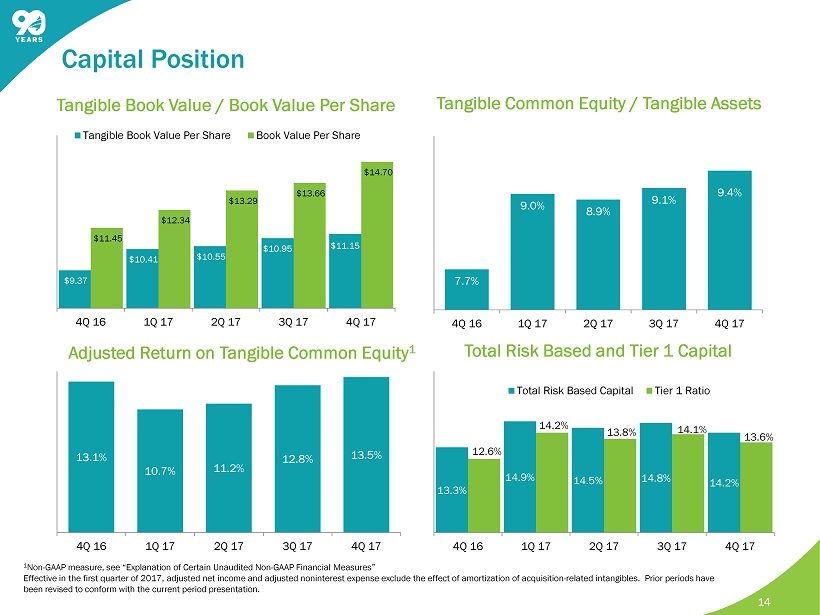
Capital Position 14 Tangible Book Value / Book Value Per Share $9.37 $10.41 $10.55 $10.95 $11.15 $11.45 $12.34 $13.29 $13.66 $14.70 4Q 16 1Q 17 2Q 17 3Q 17 4Q 17 Tangible Book Value Per Share Book Value Per Share 13.1% 10.7% 11.2% 12.8% 13.5% 4Q 16 1Q 17 2Q 17 3Q 17 4Q 17 Adjusted Return on Tangible Common Equity 1 13.3% 14.9% 14.5% 14.8% 14.2% 12.6% 14.2% 13.8% 14.1% 13.6% 4Q 16 1Q 17 2Q 17 3Q 17 4Q 17 Total Risk Based Capital Tier 1 Ratio Total Risk Based and Tier 1 Capital Tangible Common Equity / Tangible Assets 7.7% 9.0% 8.9% 9.1% 9.4% 4Q 16 1Q 17 2Q 17 3Q 17 4Q 17 1 Non - GAAP measure, see “Explanation of Certain Unaudited Non - GAAP Financial Measures” Effective in the first quarter of 2017, adjusted net income and adjusted noninterest expense exclude the effect of amortizati on of acquisition - related intangibles. Prior periods have been revised to conform with the current period presentation.
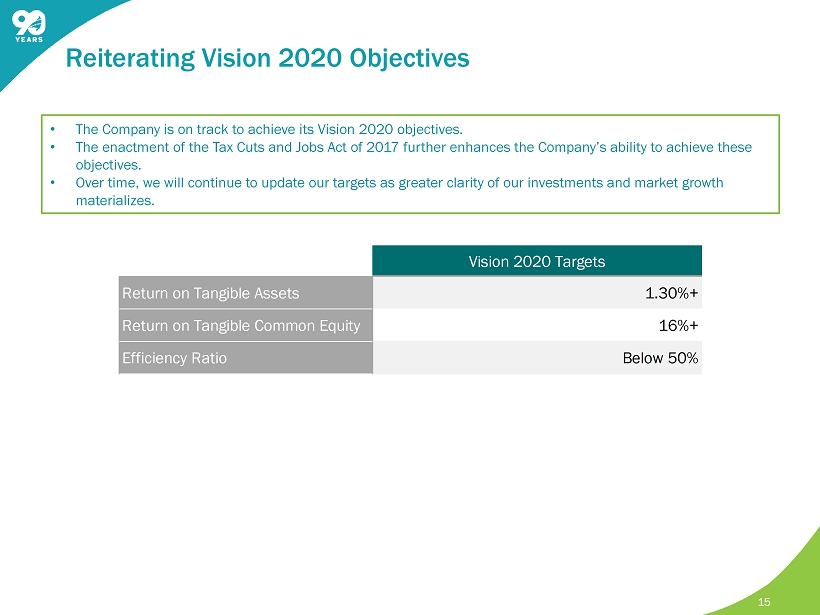
Reiterating Vision 2020 Objectives 15 • The Company is on track to achieve its Vision 2020 objectives. • The enactment of the Tax Cuts and Jobs Act of 2017 further enhances the Company’s ability to achieve these objectives. • Over time, we will continue to update our targets as greater clarity of our investments and market growth materializes. Vision 2020 Targets Return on Tangible Assets 1.30%+ Return on Tangible Common Equity 16%+ Efficiency Ratio Below 50%
Investor Presentation Charles M. Shaffer Executive Vice President Chief Financial Officer (772) 221 - 7003 Chuck.Shaffer@seacoastbank.com INVESTOR RELATIONS www.SeacoastBanking.com NASDAQ: SBCF 16 16 Contact Details: Seacoast Banking Corporation of Florida

17
This presentation contains financial information determined by methods other than Generally Accepted Accounting Principles (“GAAP”) . The financial highlights provide reconciliations between GAAP net income and adjusted net income, GAAP income and adjusted pretax, preprovision income . Management uses these non - GAAP financial measures in its analysis of the Company’s performance and believes these presentations provide useful supplemental information, and a clearer understanding of the Company’s performance . The Company believes the non - GAAP measures enhance investors’ understanding of the Company’s business and performance and if not provided would be requested by the investor community . These measures are also useful in understanding performance trends and facilitate comparisons with the performance of other financial institutions . The limitations associated with operating measures are the risk that persons might disagree as to the appropriateness of items comprising these measures and that different companies might calculate these measures differently . The Company provides reconciliations between GAAP and these non - GAAP measures . These disclosures should not be considered an alternative to GAAP . Explanation of Certain Unaudited Non - GAAP Financial Measures 18
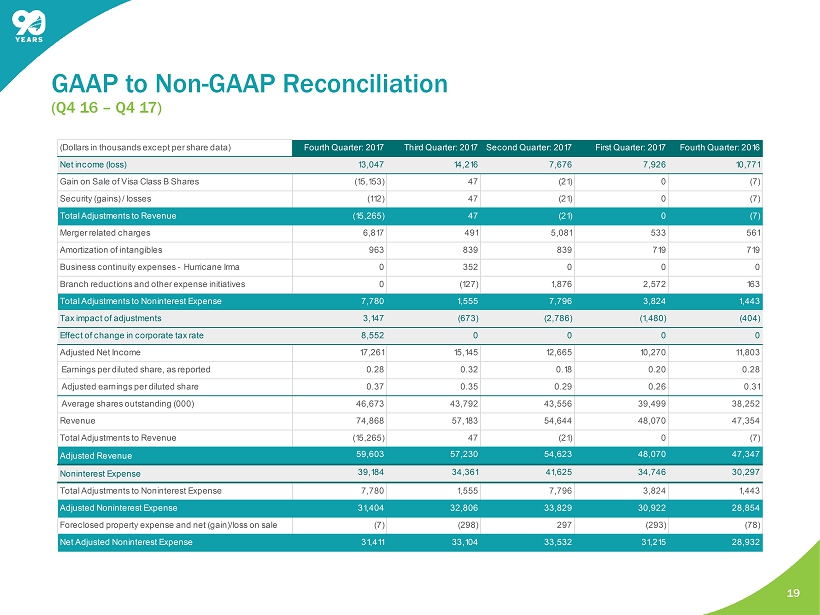
( Q4 16 – Q4 17) GAAP to Non - GAAP Reconciliation 19 (Dollars in thousands except per share data) Fourth Quarter: 2017 Third Quarter: 2017Second Quarter: 2017 First Quarter: 2017 Fourth Quarter: 2016 Net income (loss) 13,047 14,216 7,676 7,926 10,771 Gain on Sale of Visa Class B Shares (15,153) 47 (21) 0 (7) Security (gains) / losses (112) 47 (21) 0 (7) Total Adjustments to Revenue (15,265) 47 (21) 0 (7) Merger related charges 6,817 491 5,081 533 561 Amortization of intangibles 963 839 839 719 719 Business continuity expenses - Hurricane Irma 0 352 0 0 0 Branch reductions and other expense initiatives 0 (127) 1,876 2,572 163 Total Adjustments to Noninterest Expense 7,780 1,555 7,796 3,824 1,443 Tax impact of adjustments 3,147 (673) (2,786) (1,480) (404) Effect of change in corporate tax rate 8,552 0 0 0 0 Adjusted Net Income 17,261 15,145 12,665 10,270 11,803 Earnings per diluted share, as reported 0.28 0.32 0.18 0.20 0.28 Adjusted earnings per diluted share 0.37 0.35 0.29 0.26 0.31 Average shares outstanding (000) 46,673 43,792 43,556 39,499 38,252 Revenue 74,868 57,183 54,644 48,070 47,354 Total Adjustments to Revenue (15,265) 47 (21) 0 (7) Adjusted Revenue 59,603 57,230 54,623 48,070 47,347 Noninterest Expense 39,184 34,361 41,625 34,746 30,297 Total Adjustments to Noninterest Expense 7,780 1,555 7,796 3,824 1,443 Adjusted Noninterest Expense 31,404 32,806 33,829 30,922 28,854 Foreclosed property expense and net (gain)/loss on sale (7) (298) 297 (293) (78) Net Adjusted Noninterest Expense 31,411 33,104 33,532 31,215 28,932
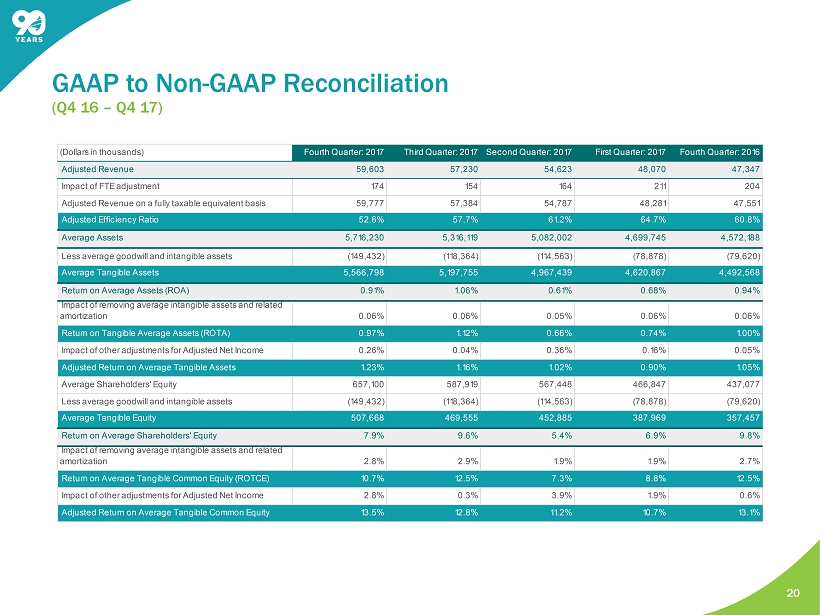
GAAP to Non - GAAP Reconciliation ( Q4 16 – Q4 17) 20 (Dollars in thousands) Fourth Quarter: 2017 Third Quarter: 2017Second Quarter: 2017 First Quarter: 2017 Fourth Quarter: 2016 Adjusted Revenue 59,603 57,230 54,623 48,070 47,347 Impact of FTE adjustment 174 154 164 211 204 Adjusted Revenue on a fully taxable equivalent basis 59,777 57,384 54,787 48,281 47,551 Adjusted Efficiency Ratio 52.6% 57.7% 61.2% 64.7% 60.8% Average Assets 5,716,230 5,316,119 5,082,002 4,699,745 4,572,188 Less average goodwill and intangible assets (149,432) (118,364) (114,563) (78,878) (79,620) Average Tangible Assets 5,566,798 5,197,755 4,967,439 4,620,867 4,492,568 Return on Average Assets (ROA) 0.91% 1.06% 0.61% 0.68% 0.94% Impact of removing average intangible assets and related amortization 0.06% 0.06% 0.05% 0.06% 0.06% Return on Tangible Average Assets (ROTA) 0.97% 1.12% 0.66% 0.74% 1.00% Impact of other adjustments for Adjusted Net Income 0.26% 0.04% 0.36% 0.16% 0.05% Adjusted Return on Average Tangible Assets 1.23% 1.16% 1.02% 0.90% 1.05% Average Shareholders' Equity 657,100 587,919 567,448 466,847 437,077 Less average goodwill and intangible assets (149,432) (118,364) (114,563) (78,878) (79,620) Average Tangible Equity 507,668 469,555 452,885 387,969 357,457 Return on Average Shareholders' Equity 7.9% 9.6% 5.4% 6.9% 9.8% Impact of removing average intangible assets and related amortization 2.8% 2.9% 1.9% 1.9% 2.7% Return on Average Tangible Common Equity (ROTCE) 10.7% 12.5% 7.3% 8.8% 12.5% Impact of other adjustments for Adjusted Net Income 2.8% 0.3% 3.9% 1.9% 0.6% Adjusted Return on Average Tangible Common Equity 13.5% 12.8% 11.2% 10.7% 13.1%