Attached files
| file | filename |
|---|---|
| EX-99.1 - EXHIBIT 99.1 - VARIAN MEDICAL SYSTEMS INC | tv483996_ex99-1.htm |
| 8-K - FORM 8-K - VARIAN MEDICAL SYSTEMS INC | tv483996_8k.htm |
Exhibit 99.2

J. Michael Bruff Vice President, Investor Relations mike.bruff@varian.com January 24, 2018 First Quarter Fiscal Year 2018

This presentation is intended exclusively for investors. It is not intended for use in Sales or Marketing. 2 Forward - Looking Statements Except for historical information, this presentation contains forward - looking statements within the meaning of the Private Securities Litigation Reform Act of 1995 . Statements concerning industry outlook, including growth drivers, future trends in cancer incidence and trends in cancer treatment needs, demand, innovation and growth opportunities ; Varian Medical System, Inc . ’s (”Varian” or the “company”) future orders, revenues, backlog or earnings growth ; future financial results ; market acceptance of or transition to new products or technology such as our Edge ̺ radiosurgery system, TrueBeam ̺ , HyperArc TM , 360 Oncology TM , HALCYON TM , image - guided radiation therapy, stereotactic radiosurgery and proton therapy, and any statements using the terms “could”, “believe”, “expect”, “outlook”, “anticipate”, ”vision”, “estimate”, “future”, “horizon”, “aiming”, “driving”, “target” or similar statements are forward - looking statements that involve risks and uncertainties that could cause the company’s actual results to differ materially from those anticipated . Such risks and uncertainties include global economic conditions and changes to trends for cancer treatment regionally ; the impact of changes to the Affordable Health Care for America Act (including excise taxes on medical devices) and any further healthcare reforms (including changes to Medicare and Medicaid), and/or changes to third - party reimbursement levels ; currency exchange rates and tax rates ; the impact of the Tax Cuts and Jobs Act ; demand for the company’s products ; the company’s ability to develop, commercialize, and deploy new products ; the company’s ability to meet Food and Drug Administration (FDA) and other regulatory requirements for product clearances or to comply with FDA and other regulatory regulations or procedures, changes in the regulatory environment, including with respect to FDA requirements ; the company’s assessment of the goodwill associated with its particle therapy business, challenges associated with the successful commercialization of the company’s particle therapy business ; the risks associated with providing financing for the construction and start - up operations of proton therapy centers ; the effect of adverse publicity ; the company’s reliance on sole or limited - source suppliers ; the company’s ability to maintain or increase margins ; the impact of competitive products and pricing ; the potential loss of key distributors or key personnel ; challenges to public tender awards and the loss of such awards or other orders ; and the other risks listed from time to time in the company’s filings with the Securities and Exchange Commission, which by this reference are incorporated herein . The company assumes no obligation to update or revise the forward - looking statements in this presentation because of new information, future events, or otherwise . Reconciliations to GAAP financials can be found at http : //investors . varian . com/financialstatements and the appendix to this presentation . Varian has not filed the Form 10 - Q for the quarter ended December 29 , 2017 . As a result, all financial results described here should be considered preliminary, and are subject to change to reflect any necessary adjustments, or changes in accounting estimates, that are identified prior to the time the company completes these filings . Medical Advice Disclaimer Varian as a medical device manufacturer cannot and does not recommend specific treatment approaches. Individual treatment res ult s may vary.

Long - Term Strategy
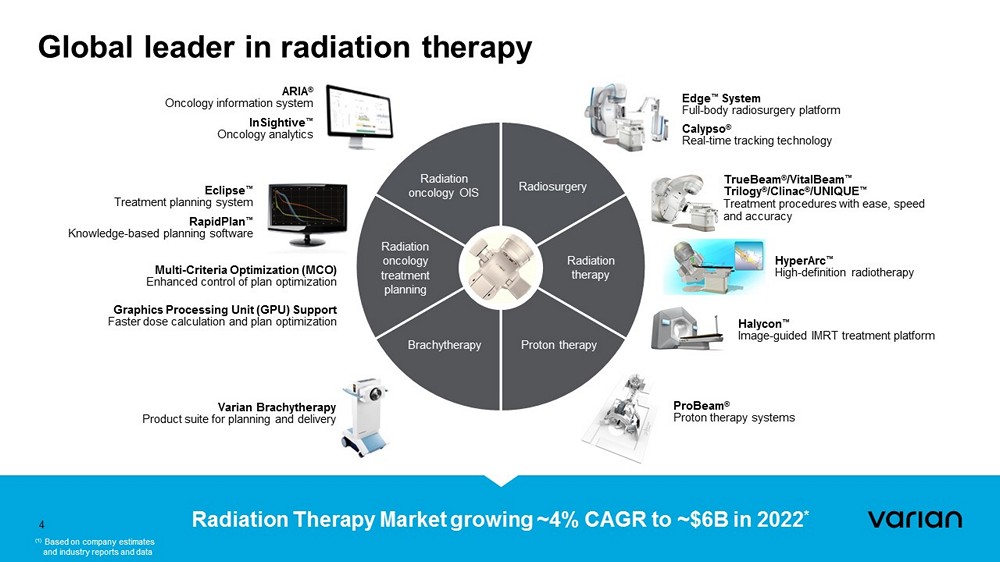
Eclipse ™ Treatment planning system RapidPlan ™ Knowledge - based planning software Calypso ® Real - time tracking technology Edge ™ System Full - body radiosurgery platform Halycon ™ Image - guided IMRT treatment platform TrueBeam ® /VitalBeam ™ Trilogy ® /Clinac ® /UNIQUE ™ Treatment procedures with ease, speed and accuracy Varian Brachytherapy Product suite for planning and delivery ProBeam ® Proton therapy systems Radiation oncology OIS Radiosurgery Brachytherapy Radiation oncology treatment planning Proton therapy Radiation therapy Global leader in radiation therapy ARIA ® Oncology information system InSightive ™ Oncology analytics Radiation Therapy Market growing ~4% CAGR to ~$6B in 2022 * (1) Based on company estimates * and industry reports and data 4 HyperArc ™ High - definition radiotherapy Multi - Criteria Optimization (MCO) Enhanced control of plan optimization Graphics Processing Unit (GPU) Support Faster dose calculation and plan optimization

Long - term growth and value creation strategy 5 Global Leader in Radiation Therapy Radiation oncology OIS Radiosurgery Brachytherapy Radiation oncology treatment planning Proton therapy Radiation therapy Global Leader of Multi - Disciplinary, Integrated Cancer Care Solutions Interventional oncology Surgical oncology Diagnostic imaging Radiation oncology Precision medicine Medical oncology Generate insights Call on all oncologists Aggregate data Disseminated insights Build AI/ML capabilities

Long - term growth and value creation strategy Global Leader of Multi - Disciplinary, Integrated Cancer Care Solutions 6 Interventional oncology Surgical oncology Diagnostic imaging Radiation oncology Precision medicine Medical oncology Generate insights Call on all oncologists Aggregate data Disseminated insights Build AI/ML capabilities Expand Addressable Market 1 to Patient - Centered Care Coordination $2.0B $5.3B $6.0B $6.3B 20%+ $12.3B $7.3B Care Coordination* Radiation Oncology 2017 2022 ~4% (1) Based on company estimates and industry reports; oncology care coordination represents a segment of the care coordination mar ke t

Growth priorities and strategic enablers 7 We are here Global Leader in Radiation Therapy Global Leader of Multi - Disciplinary, Integrated Cancer Care Solutions Long - Term Growth and Value Creation Strategy Strengthen Leadership in Radiation Therapy Extend Global Footprint Expand Addressable Market Growth Priorities High Quality Care Through Innovation Build Software Services & Big Data Expertise Operational Efficiency Optimize Cash Conversion & Capital Structure Strategic Enablers Where we are headed

Growth priority: Strengthen our leadership in radiation therapy (1) Based on company estimates and industry reports and data Executing on HyperArc launch our high - definition radiotherapy technology ⁃ 19 orders in the first quarter ⁃ 60% are upgrades Global market leader in radiation therapy, increasing share in a 4.5% growth market and extending leadership over the trailing twelve months Grew linac install base by 3% ; total install base of 7,876 units R&D up 12% maintaining commitment to driving high - quality, organic innovation Strong Orders Growth in the quarter ⁃ Oncology orders growth of 7% , with orders growth across all regions ⁃ 2 new Proton orders Since launch last May, Halcyon treatment platform ⁃ 62 orders to date ⁃ More than half are incremental ⁃ >40% for greenfield sites ⁃ New scaled configurations optimized for different customer segments 8
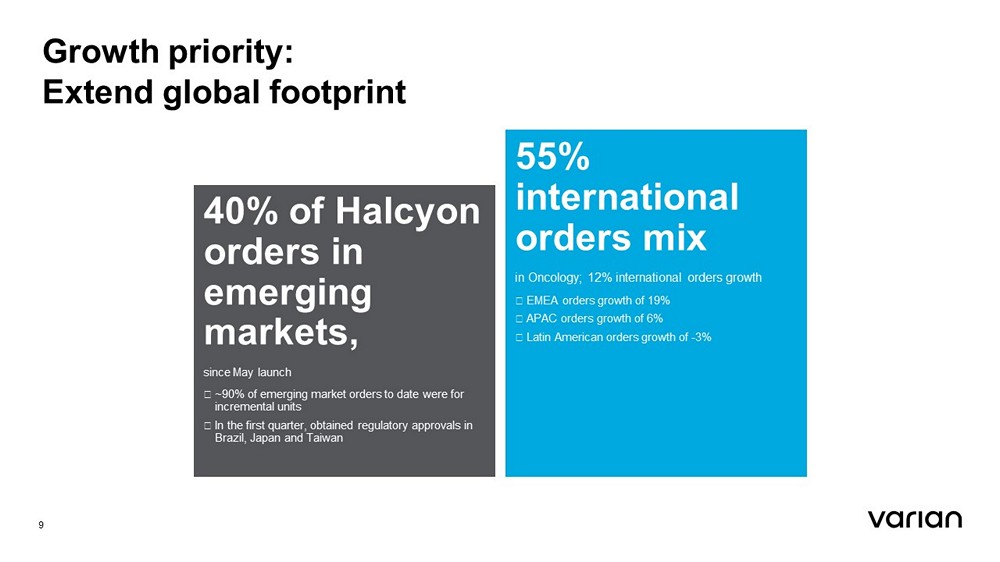
Growth priority: Extend global footprint 55% international orders mix in Oncology; 12% international orders growth ⁃ EMEA orders growth of 19% ⁃ APAC orders growth of 6% ⁃ Latin American orders growth of - 3% 40% of Halcyon orders in emerging markets, since May launch ⁃ ~90% of emerging market orders to date were for incremental units ⁃ In the first quarter, obtained regulatory approvals in Brazil, Japan and Taiwan 9

Growth priority: Expand addressable market Financial flexibility to evaluate investment opportunities including both organic and inorganic options ⁃ Cash flow from operations grew 118% ⁃ Decreased debt across the year Unique software customers grew 4% during the first quarter; newer applications fuelling enthusiasm for Varian software solutions ⁃ Install base doubled for RapidPlan TM , our knowledge - based treatment planning software ⁃ Double - digit growth of install base for Velocity TM , our longitudinal cancer imaging solution 10

1Q FY 2018 Business Highlights

First patient treated with Varian HyperArc high - definition radiotherapy Varian publishes 2017 Sustainability Report Year in review 12 JANUARY 2017 FEB MAR APR MAY JUN JUL AUG SEP OCT NOV DECEMBER 2017 Varian honored as one of the top 100 most sustainable companies Spin - off of Varex Varian names new CFO Varian Eclipse users generate highest scoring plans in international treatment plan competition Varian installs Cyclotron at Georgia Proton Treatment Center Varian announces Penn Medicine treats world’s first patient on Halcyon system Halcyon receives Shonin approval in Japan Varian opens new facility in Brazil Varian partners with Penn Medicine for proton therapy training and education Halcyon receives ANVISA registration in Brazil Peter MacCallum Cancer Centre in Australia standardizes on Varian solution for cancer treatment planning Halcyon introduced José Baselga and Jean - Luc Butel appointed to Board of Directors of Varian Halcyon receives Taiwan FDA approval Varian ranks first in overall manufacturer, system, and service performance in 2017 Survey of Radiation Oncology Professionals

Cash Flow from Operations 1 ($M) $0 $50 $100 $150 $200 1Q FY17 2Q FY17 3Q FY17 4Q FY17 1Q FY18 Non - GAAP EPS ($) $0.00 $0.25 $0.50 $0.75 $1.00 $1.25 1Q FY17 2Q FY17 3Q FY17 4Q FY17 1Q FY18 Financial highlights Operating Trends* Strong performance in key financial measures • Revenues up 13% due to higher linac systems sales in Oncology operating segment • Cash Flow from Operations more than doubled driven by operating income growth and working capital improvements Oncology DSO down from 108 to 103 days • Non - GAAP operating earnings up 7 percentage points to 19%, driven by strong top - line growth and operating leverage • Non - GAAP earnings per diluted share more than doubled due to strong growth, operational execution and the non - recurrence of a prior - year accounts receivable reserve in the Particle Therapy business * All financial metrics, including historical figures, reflect the new revenue recognition standard, ASC 606. (1) Cash Flow is shown on a Total Company basis, including Varex prior to the spinoff. 13 Revenues ($M) Non - GAAP Operating Earnings (%) $0 $250 $500 $750 1Q FY17 2Q FY17 3Q FY17 4Q FY17 1Q FY18 0% 5% 10% 15% 20% 1Q FY17 2Q FY17 3Q FY17 4Q FY17 1Q FY18 +7 pts Y/Y +110% Y/Y +118% Y/Y +13% Y/Y

Varian linac install base Install Base Trends Varian strengthened its global leadership in radiation therapy • Each geography grew respective install base in the first quarter 14 Q1FY17 Q3FY17 Q2FY17 Q4FY17 Q1FY18 7,630 Total 7,876 +3%

Key wins Americas EMEIA APAC Spain – Osakidetza 2 TrueBeams Denmark tender 15 linacs – Mix of TrueBeams and Halcyon over 4 years Poland Ministry of Health national tender 5 linac s – 1 Halcyon, 1 TrueBeam , 3 VitalBeams India Agartala and Jaipur cancer centers 5 linacs – 2 TrueBeams , 3 Unique Alabama Cancer Care Aria and Eclipse University of Chicago Eclipse Brazil, Aruba, Dominican Republic Halcyon orders UCSF Mission Bay 2 TrueBeams China – Qingdao Central Hospital, Fudan University affiliated hospital, Zhuhai People’s Hospital Edge orders Australia – Sir Charles Gairdner Hospital TrueBeam order Philippines – Manila Doctors Hospital VitalBeam order Japan – Saisekai Yokohama East and National Saitama Hospital TrueBeam orders Norton Healthcare 3 TrueBeams , Aria, InSightive and Eclipse 15

1Q FY 2018 Financial Overview
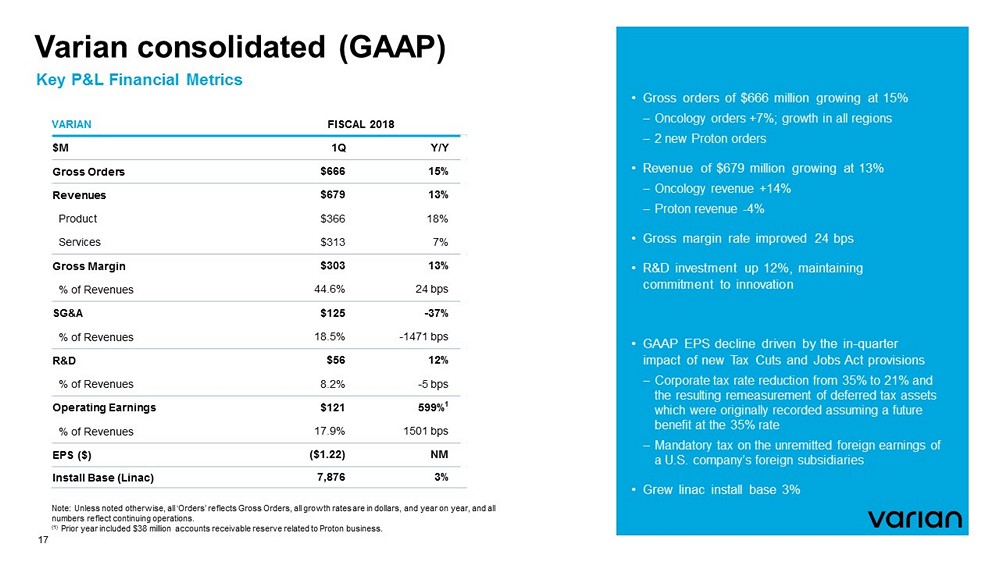
Varian consolidated (GAAP) Key P&L Financial Metrics 17 VARIAN FISCAL 2018 $M 1Q Y/Y Gross Orders $666 15% Revenues $679 13% Product $366 18% Services $313 7% Gross Margin $303 13% % of Revenues 44.6% 24 bps SG&A $125 - 37% % of Revenues 18.5% - 1471 bps R&D $56 12% % of Revenues 8.2% - 5 bps Operating Earnings $121 599% 1 % of Revenues 17.9% 1501 bps EPS ($) ($1.22) NM Install Base ( Linac ) 7,876 3% • Gross orders of $666 million growing at 15% Oncology orders +7%; growth in all regions 2 new Proton orders • Revenue of $679 million growing at 13% Oncology revenue +14% Proton revenue - 4% • Gross margin rate improved 24 bps • R&D investment up 12%, maintaining commitment to innovation • GAAP EPS decline driven by the in - quarter impact of new Tax Cuts and Jobs Act provisions Corporate tax rate reduction from 35% to 21% and the resulting remeasurement of deferred tax assets which were originally recorded assuming a future benefit at the 35% rate Mandatory tax on the unremitted foreign earnings of a U.S. company’s foreign subsidiaries • Grew linac install base 3% Note: Unless noted otherwise, all ‘Orders’ reflects Gross Orders, all growth rates are in dollars, and year on year, and all numbers reflect continuing operations. (1) Prior year included $38 million accounts receivable reserve related to Proton business.

VARIAN FISCAL 2018 $M 1Q Y/Y Gross Orders $666 15% Revenues $679 13% Product $366 18% Services $313 7% Gross Margin $304 13% % of Revenues 44.8% 22 bps SG&A $122 - 18% % of Revenues 18.0% - 689 bps R&D $56 12% % of Revenues 8.2% - 5 bps Operating Earnings $126 84% 1 % of Revenues 18.6% 716 bps EPS ($) $1.06 110% Install Base ( Linac ) 7,876 3% Varian consolidated (non - GAAP) Key P&L Financial Metrics 18 Note: Unless noted otherwise, all ‘Orders’ reflects Gross Orders, all growth rates are in dollars, and year on year, and all numbers reflect continuing operations. (1) Prior year included $38 million accounts receivable reserve related to Proton business. • Gross orders of $666 million growing at 15% Oncology orders +7%; growth in all regions 2 new Proton orders • Revenue of $679 million growing at 13% Oncology revenue +14% Proton revenue - 4% • Gross margin rate improved 22 bps • SG&A declined 18% primarily driven by the non - recurrence of prior year’s $38 million accounts receivable reserve related to the proton business Excluding prior year’s $38 million reserve, SG&A increased approximately $10 million, or 9 percent, driven by targeted investments in product management and sales headcount • R&D investment up 12%, maintaining commitment to innovation • Non - GAAP EPS more than doubled due to strong growth and operational execution Excludes tax effect of the change in law related to the Tax Cuts and Jobs Act • Grew linac install base 3%

$0.0 $50.0 $100.0 $150.0 $200.0 $250.0 GAAP Tax on Earnings Impact of Mandatory Repatriaton of Unremitted Foreign Earnings Impact of Re- Measurment on Deferred Tax Assets Non-GAAP Tax on Earnings Tax Cuts and Jobs Act enactment Impact on First Quarter Fiscal Year 2018 Results The ‘Tax Cuts and Jobs Act’ was signed into U.S. law on December 22, 2017 • Two provisions of the new law had an immediate impact on first quarter fiscal year 2018 1. U.S. corporate tax rate was reduced from 35% to 21%, requiring Varian to remeasure deferred tax assets which were originally recorded assuming a future benefit at the 35% rate 2. As part of the transition to the new territorial system, the new law imposes tax on the unremitted foreign earnings of a U.S. company’s foreign subsidiaries 15.5% for liquid earnings; 8% for illiquid earnings Companies may elect to pay this tax, often called a “toll charge,” over an 8 - year period; Varian intends to make that election • After impacts of the new legislation provisions, Varian’s resulting GAAP effective tax rate for the first quarter is 191.5%, or $234.7M • Varian Non - GAAP effective tax rate is 22.5%, or $28.6M, excluding the tax related to the repatriation of foreign earnings and lower corporate tax rate impact on deferred tax assets Similarly, Non - GAAP net earnings per diluted share exclude these items 19 $234.7M $169.3M $37.8M $28.6M Earnings from continuing operations before taxes $122.6M $127.1M Effective tax rate 191.5% 22.5% EPS ($) ($1.22) $1.06 Note ‘M’ denote $s in millions.

Varian consolidated Key Balance Sheet and Cash Flow Metrics • Cash Flow from Operations more than doubled driven by operating income growth and working capital improvements Oncology DSO down from 108 to 103 days • Continuing to strengthen financial flexibility through operational execution and by steadily reducing debt 20 VARIAN FISCAL 2017 FISCAL 2018 $M 1Q 2Q 3Q 4Q 1Q Cash & Cash Equivalents 1 $815 $706 $658 $716 $823 Cash Flow from Operations 2 $82 $32 $155 $130 $179 Y/Y % 6.0% 1.0% 63.0% - 15.0% 117.8% Total Debt $607 $547 $364 $350 $340 (1) Presented on a continuing operations basis, except 1Q FY17, which includes Varex . (2) Cash Flow is shown on a Total Company basis, including Varex prior to the spinoff.

Oncology operating segment Key Financial Metrics • Strong start to the year with orders growth at nearly 7%, with growth in all regions Oncology orders mix: North America 45%, International 55% 12 new orders for Halcyon in the quarter; 19 new orders for HyperArc • Product revenue growth of 20% driven by robust linac system sales • Services growth of 8% includes new performance obligations for installation, training and warranty per adoption of ASC 606 • Continuing to invest in research and development while maintaining focus on driving operational leverage in the segment 21 VARIAN FISCAL 2018 $M 1Q Y/Y Gross Orders $620 7% Revenues $649 14% Product $338 20% Services $311 8% Gross Margin $301 15% % of Rev 46.3% 39 bps Operating Earnings 1 $138 19% % of Rev 21.3% 96 bps Install Base ( Linac ) 7,876 3% Note: Unless noted otherwise, all ‘Orders’ reflects Gross Orders, all growth rates are in dollars, and year on year, and all numbers reflect continuing operations. (1) Operating earnings includes an allocation of corporate costs based on relative revenue between the operating segments. The allocated corporate costs excludes certain transactions or adjustments that are considered non - operational in nature, such as restructuring and impairment charges, significant litigation matters and acquisition related items.

Oncology gross orders by geography AMERICAS 2% 1Q Y/Y APAC 6% 1Q Y/Y EMEA 19% 1Q Y/Y 22

Particle Therapy operating segment Key Financial Metrics • 2 new orders of ProBeam ® Compact systems, both in the Americas region University of Alabama University of Miami • 4 th quarter in a row with 2 Proton orders • 7 operational sites with 24 rooms in 5 countries; 16 more sites in progress across the world • Revenue, margin and related growth rates may be volatile until we get to operational scale across the business Revenue declined driven by project timing Gross margin declined due to mix of lower - margin deals in the current period • Operating earnings increased driven by continued operational discipline and non - recurrence of prior year’s $38 million accounts receivable reserve 23 VARIAN FISCAL 2018 $M 1Q Y/Y Gross Orders $46 965% Revenues $29 - 4% Product $27 2% Services $2 - 49% Gross Margin $2 - 52% % of Revenues 8.0% - 806 bps Operating Earnings 1 - $15 NM % of Revenues - 52.2% NM Note: Unless noted otherwise, all ‘Orders’ reflects Gross Orders, all growth rates are in dollars, and year on year, and all numbers reflect continuing operations. (1) Operating earnings includes an allocation of corporate costs based on relative revenue between the operating segments. The allocated corporate costs excludes certain transactions or adjustments that are considered non - operational in nature, such as restructuring and impairment charges, significant litigation matters and acquisition related items.
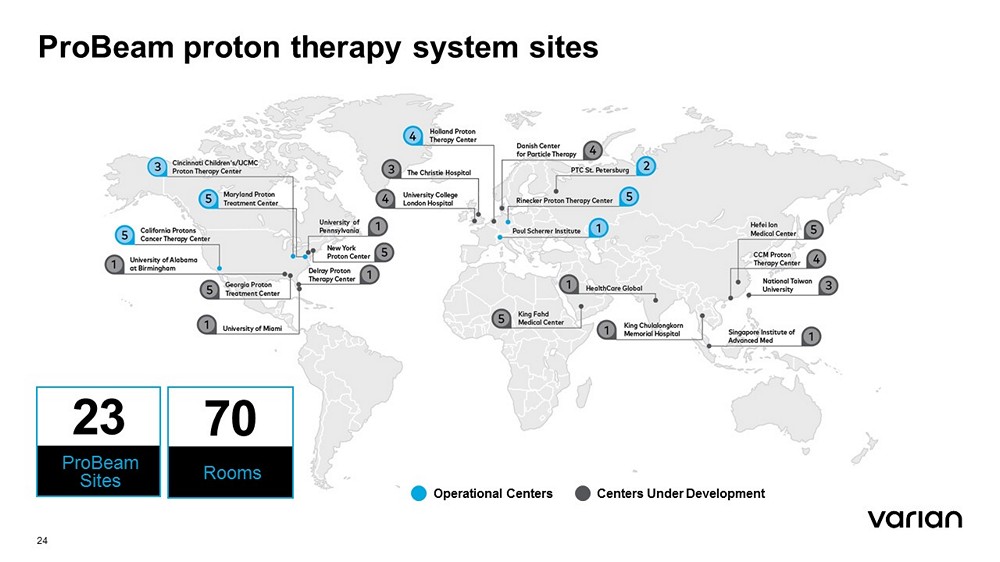
ProBeam proton therapy system sites 23 ProBeam Sites Rooms Operational Centers Centers Under Development 70 24

FY 2018 Guidance

Varian consolidated Updated Fiscal Year 2018 Guidance Raising full fiscal year 2018 guidance after considering the following: • Stronger radiation therapy market performance; stronger performance of Varian in the market • Implementation of the Tax Cuts and Jobs Act 26 VARIAN $M FY16 Actual FY17 Actual FY18 Guidance Revenue $2,594 $2,619 4% to 7% Non - GAAP Operating Earnings as percent of revenue 1 18.0% 15.1% 18% to 19% Non - GAAP EPS ($) 1 $3.67 $3.26 $4.24 to $4.36 Weighted Average Diluted Shares (M) 96 93 93 Non - GAAP Effective Tax Rate 1 25.5% 23.4% 21% Cash Flow from Operations 2 $356 $399 $475 to $550 (1) These values are presented on a non - GAAP basis. We have not provided a reconciliation of non - GAAP guidance measures to the corre sponding GAAP measures on a forward - looking basis due to potential significant variability and limited visibility of the excluded items. (2) Cash Flow is shown on a Total Company basis, including Varex .

1Q FY 2018 Financial Overview

Non - GAAP disclosure 28 Discussion of Non - GAAP Financial Measures This presentation includes the following non - GAAP financial measures derived from our Condensed Consolidated Statements of Earnings : non - GAAP operating earnings, non - GAAP net earnings and non - GAAP net earnings per diluted share . We define non - GAAP operating earnings from continuing operations as operating earnings from continuing operations excluding amortization of intangible assets, restructuring charges, legal costs, impairment charges and acquisition - related expenses and benefits . These measures are not presented in accordance with, nor are they a substitute for U . S . generally accepted accounting principles, or GAAP . In addition, these measures may be different from non - GAAP measures used by other companies, limiting their usefulness for comparison purposes . The non - GAAP financial measures should not be considered in isolation from measures of financial performance prepared in accordance with GAAP . Investors are cautioned that there are material limitations associated with the use of non - GAAP financial measures as an analytical tool . We have provided a reconciliation of each non - GAAP financial measure used in this earnings release to the most directly comparable GAAP financial measure . We have not provided a reconciliation of non - GAAP guidance measures to the corresponding GAAP measures on a forward - looking basis due to the potential significant variability and limited visibility of the excluded items discussed below . We utilize a number of different financial measures, both GAAP and non - GAAP, in analyzing and assessing the overall performance of our business, in making operating decisions, forecasting and planning for future periods, and determining payments under compensation programs . We consider the use of the non - GAAP measures to be helpful in assessing the performance of the ongoing operation of our business . We believe that disclosing non - GAAP financial measures provides useful supplemental data that, while not a substitute for financial measures prepared in accordance with GAAP, allows for greater transparency in the review of our financial and operational performance . We also believe that disclosing non - GAAP financial measures provides useful information to investors and others in understanding and evaluating our operating results and future prospects in the same manner as management and in comparing financial results across accounting periods and to those of peer companies . Non - GAAP operating earnings and non - GAAP net earnings exclude the following items, except for significant effects of tax legislation, which are only excluded from non - GAAP net earnings : Amortization of intangible assets : We do not acquire businesses and assets on a predictable cycle . The amount of purchase price allocated to intangible assets and the term of amortization can vary significantly and are unique to each acquisition or purchase . We believe that excluding amortization of intangible assets allows the users of our financial statements to better review and understand the historic and current results of our operations, and also facilitates comparisons to peer companies . Acquisition - related expenses and benefits : We incur expenses or benefits with respect to certain items associated with our acquisitions, such as transaction costs, changes in the fair value of contingent consideration liabilities, gain or expense on settlement of pre - existing relationships, etc . We exclude such expenses or benefits as they are related to acquisitions and have no direct correlation to the operation of our on - going business . Restructuring and impairment charges : We incur restructuring and impairment charges that result from events, which arise from unforeseen circumstances and/or often occur outside of the ordinary course of our on - going business . Although these events are reflected in our GAAP financials, these unique transactions may limit the comparability of our on - going operations with prior and future periods . Significant effects of tax legislation : We may incur significant effects of tax legislation that are generally unrelated to the level of business activity in the period in which the effects of such legislation are reported . We exclude such expenses, because we believe this does not accurately reflect the underlying performance of our continuing business operations . This exclusion is applicable to non - GAAP net earnings only . Significant litigation charges or benefits and legal costs : We may incur charges or benefits as well as legal costs from time to time related to litigation and other contingencies . We exclude these charges or benefits, when significant, as well as legal costs associated with significant legal matters, because we do not believe they are reflective of on - going business and operating results . We apply our GAAP consolidated effective tax rate to our non - GAAP financial measures, other than when the underlying item has a materially different tax treatment . From time to time in the future, there may be other items that we may exclude if we believe that doing so is consistent with the goal of providing useful information to investors and management . Non - GAAP items are generally included in selling, general and administrative expenses, except for significant effects of tax legislation and unless otherwise specified .

GAAP to non - GAAP reconciliation 29 (1) Includes $1.3 million, $1.2 million, $1.2 million, $1.3 million and $1.2 million, respectively in cost of revenues for the pe rio ds presented. (2) Other includes acquisition - related expenses and benefits. (3) Represents the tax effect of a change in law related to the U.S. Tax Cuts and Jobs Act. The corporate rate reduction results in a remeasurement of our Deferred Tax Assets of $37.8 million. The mandatory deemed repatriation of unremitted foreign earnings results in an estimated charge of $169.3 million. (4) Excludes immaterial net earnings (loss) from continuing operations attributable to noncontrolling interests for the periods p re sented. THE FOLLOWING TABLE RECONCILES GAAP AND NON - GAAP FINANCIAL MEASU RES FOR VARIAN’S CONTINUING OPERATIONS Dollars and shares in millions, except per share amounts 1Q FY17 2Q FY17 3Q FY17 4Q FY17 1Q FY18 Non - GAAP adjustments Amortization of intangible assets (1) $2.8 $2.8 $2.9 $3.1 $3.1 Restructuring charges $3.6 $2.4 $2.8 $3.8 - Legal costs $6.2 $10.0 $0.2 - - Impairment charges $38.3 - - $13.1 - Other (2) $0.3 $0.6 $0.5 $1.3 $1.5 Total non - GAAP adjustments to operating earnings $51.2 $15.8 $6.4 $21.3 $4.6 Tax effects of non - GAAP adjustments ($11.3) ($0.8) ($0.6) ($3.4) ($1.0) Significant effects of tax legislation (3) - - - - $207.1 Total net earnings from continuing operations impact from non - GAAP adjustments $39.9 $15.0 $5.8 $17.9 $210.7 Operating earnings reconciliation GAAP operating earnings from continuing operations $17.4 $90.1 $88.5 $104.2 $121.4 Total operating earnings from continuing operations impact from non - GAAP adjustments $51.2 $15.8 $6.4 $21.3 $4.6 Non - GAAP operating earnings from continuing operations $68.6 $105.9 $94.9 $125.5 $126.0 Net earnings (loss) and net earnings (loss) per diluted share reconciliation GAAP net earnings (loss) from continuing operations attributable to Varian (4) $7.6 $69.5 $69.7 $78.7 ($112.3) Total net earnings from continuing operations impact from non - GAAP adjustments $39.9 $15.0 $5.8 $17.9 $210.7 Non - GAAP net earnings from continuing operations attributable to Varian $47.5 $84.5 $75.5 $96.6 $98.4 GAAP net earnings (loss) per diluted share from continuing operations $0.08 $0.74 $0.75 $0.85 ($1.22) Non - GAAP net earnings per diluted share from continuing operations $0.50 $0.90 $0.82 $1.04 $1.06 Shares used in computing GAAP net earnings per diluted share 94.2 93.7 92.4 92.6 91.6 Shares used in computing non - GAAP net earnings per diluted share 94.2 93.7 92.4 92.6 92.7

Total revenues by sales classification 30 CC – Constant currency $M 1Q FY17 2Q FY17 3Q FY17 4Q FY17 1Q FY18 Product revenues $309.2 $364.9 $326.2 $402.8 $365.6 Y/Y 18% Service revenues $292.3 $298.3 $306.6 $319.0 $312.9 Y/Y 7% Total revenues $601.5 $663.2 $632.8 $721.8 $678.5 Y/Y 13% Y/Y – CC 11% Product revenues as a percentage of total revenues 51% 55% 52% 56% 54% Service revenues as a percentage of total revenues 49% 45% 48% 44% 46%

Total revenues by region 31 $M 1Q FY17 2Q FY17 3Q FY17 4Q FY17 1Q FY18 Americas revenues $298.2 $341.6 $336.3 $368.6 $356.7 Y/Y 20% Y/Y – CC 20% EMEA revenues $184.0 $185.3 $169.5 $220.4 $193.0 Y/Y 5% Y/Y – CC - 2% APAC revenues $119.3 $136.3 $127.0 $132.8 $128.8 Y/Y 8% Y/Y – CC 10% Total revenues $601.5 $663.2 $632.8 $721.8 $678.5 Y/Y 13% Y/Y – CC 11% CC – Constant currency

Total Oncology revenues by sales classification 32 $M 1Q FY17 2Q FY17 3Q FY17 4Q FY17 1Q FY18 Product revenues $282.4 $334.8 $259.7 $353.7 $338.3 Y/Y 20% Y/Y – CC 18% Service revenues $288.8 $297.1 $304.7 $315.6 $311.1 Y/Y 8% Y/Y – CC 6% Total revenues $571.2 $631.9 $564.4 $669.3 $649.4 Y/Y 14% Y/Y – CC 12% Product as a percentage of total Oncology Systems revenues 49% 53% 46% 53% 52% Service as a percentage of total Oncology Systems revenues 51% 47% 54% 47% 48% Oncology Systems revenues as a percentage of total revenues 95% 95% 89% 93% 96% CC – Constant currency
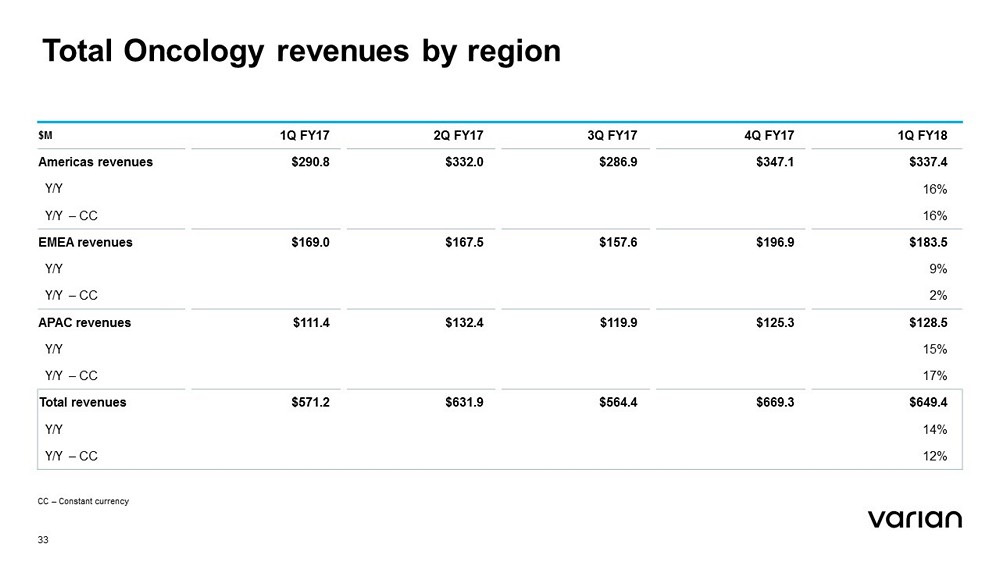
Total Oncology revenues by region 33 $M 1Q FY17 2Q FY17 3Q FY17 4Q FY17 1Q FY18 Americas revenues $290.8 $332.0 $286.9 $347.1 $337.4 Y/Y 16% Y/Y – CC 16% EMEA revenues $169.0 $167.5 $157.6 $196.9 $183.5 Y/Y 9% Y/Y – CC 2% APAC revenues $111.4 $132.4 $119.9 $125.3 $128.5 Y/Y 15% Y/Y – CC 17% Total revenues $571.2 $631.9 $564.4 $669.3 $649.4 Y/Y 14% Y/Y – CC 12% CC – Constant currency

Total Particle Therapy revenues by sales classification 34 $M 1Q FY17 2Q FY17 3Q FY17 4Q FY17 1Q FY18 Product revenues $26.8 $30.1 $66.5 $49.1 $27.3 Y/Y 2% Service revenues $3.5 $1.2 $1.9 $3.4 $1.8 Y/Y - 49% Total revenues $30.3 $31.3 $68.4 $52.5 $29.1 Y/Y - 4% VPT revenues as a percentage of total revenues 5% 5% 11% 7% 4%

Oncology gross orders by region 35 $M 1Q FY17 2Q FY17 3Q FY17 4Q FY17 1Q FY18 Americas orders $293.6 $335.2 $331.9 $479.0 $299.5 Y/Y 2% Y/Y – CC 2% EMEA orders $160.1 $180.3 $204.5 $315.4 $190.4 Y/Y 19% Y/Y – CC 13% APAC orders $123.0 $119.5 $151.3 $153.0 $130.0 Y/Y 6% Y/Y – CC 6% Total orders $576.7 $635.0 $687.7 $947.4 $619.9 Y/Y 7% Y/Y – CC 6% CC – Constant currency

Our promise 36 People powering victories Imagine a world without fear of cancer. We do, every day. We innovate new technologies for treating cancer and for connecting clinical teams to advance patient outcomes. Through ingenuity we inspire new victories and empower people in the fight against cancer. We are Varian.