Attached files
| file | filename |
|---|---|
| 8-K - 8-K - VARIAN MEDICAL SYSTEMS INC | tv483154_8k.htm |
Exhibit 99.1

New revenue accounting standard (ASC 606) and FY18 guidance January 11, 2018 Gary E. Bischoping Jr., Chief Financial Officer Magnus Momsen, Chief Accounting Officer J. Michael Bruff, Vice President Investor Relations

FORWARD - LOOKING STATEMENTS Except for historical information, this presentation contains forward - looking statements within the meaning of the Private Securities Litigation Reform Act of 1995 . Statements concerning industry outlook, including growth drivers, future trends in cancer incidence and trends in cancer treatment needs, demand, innovation and growth opportunities ; Varian Medical System, Inc . ’s (”Varian” or the “company”) future orders, revenues, backlog or earnings growth ; future financial results ; market acceptance of or transition to new products or technology such as our Edge TM radiosurgery system, TrueBeam ̺ , HyperArc TM , 360 Oncology TM , HALCYON TM , image - guided radiation therapy, stereotactic radiosurgery and proton therapy, and any statements using the terms “could”, “believe”, “expect”, “outlook”, “anticipate”, ”vision”, “estimate”, “future”, “horizon”, “aiming”, “driving”, “target” or similar statements are forward - looking statements that involve risks and uncertainties that could cause the company’s actual results to differ materially from those anticipated . Such risks and uncertainties include global economic conditions and changes to trends for cancer treatment regionally ; the impact of changes to the Affordable Health Care for America Act (including excise taxes on medical devices) and any further healthcare reforms (including changes to Medicare and Medicaid), and/or changes to third - party reimbursement levels ; currency exchange rates and tax rates ; demand for the company’s products ; the company’s ability to develop, commercialize, and deploy new products ; the company’s ability to meet Food and Drug Administration (FDA) and other regulatory requirements for product clearances or to comply with FDA and other regulatory regulations or procedures, changes in the regulatory environment, including with respect to FDA requirements ; the company’s assessment of the goodwill associated with its particle therapy business, challenges associated with the successful commercialization of the company’s particle therapy business ; the risks associated with providing financing for the construction and start - up operations of proton therapy centers ; the effect of adverse publicity ; the company’s reliance on sole or limited - source suppliers ; the company’s ability to maintain or increase margins ; the impact of competitive products and pricing ; the potential loss of key distributors or key personnel ; challenges to public tender awards and the loss of such awards or other orders ; the impact of the new Tax Cuts and Jobs Act ; and the other risks listed from time to time in the company’s filings with the Securities and Exchange Commission, which by this reference are incorporated herein . The company assumes no obligation to update or revise the forward - looking statements in this presentation because of new information, future events, or otherwise . Reconciliations to GAAP financials can be found at http : //investors . varian . com/financialstatements and the appendix to this presentation . Medical Advice Disclaimer Varian as a medical device manufacturer cannot and does not recommend specific treatment approaches. Individual treatment res ult s may vary. 2

New revenue accounting standard (ASC 606) Change in service orders policy Fiscal years 2016 and 2017 Adjusted Key Earnings Financial Metrics FY18 guidance (translation) Q&A Appendix: Financial Metrics 3 Agenda

New revenue accounting standard (ASC 606) 4

New revenue accounting standard (ASC 606) Step 1 Identify the contracts with the customer Step 2 Identify the separate performance obligations in the contract Step 3 Determine the transaction price Step 5 Recognize revenue when (or as) the entity satisfies a performance obligation 5 Step 4 Allocate the transaction price to the separate performance obligations

What does not change? • Economics of the overall business; cash and net operating cash flows • Operating expenses, including commissions expense • Non - GAAP reconciling items • Customer billings • Customer relationships What changes? • Revenues and gross margin related to contingent payments, software and additional performance obligations • Operating earnings, net earnings from continuing operations and net earnings per diluted share from continuing operations • Accounts receivable, inventories, accrued liabilities, deferred revenues, deferred income taxes and backlog • Disclosures related to the new revenue recognition standard What are the impacts? • Fiscal years 2017 and 2016 have been restated for comparability • Financial impacts of changes to periods prior to fiscal year 2016 have been recorded to retained earnings as of the end of fiscal year 2015 • Fiscal year 2018 annual guidance will be translated to the new standard, ASC 606 6 New revenue accounting standard (ASC 606) Adopting new accounting standard for revenue recognition in fiscal Q1 fiscal year 2018

Contingent Payment Example Financial Impact Both examples have a hardware sale for $2,000, of which $1,900 is the fair value of the hardware and $100 is the fair value of the installation service; hardware cost of $1,000 and installation cost of $75. Example 1 • Payment terms 80% on machine delivery, 20% due after completion of installation. Machine delivered in P1, installation completed in P2. Example 2: • Payment terms 0% on delivery, 100% due after completion of installation. Machine delivered in P1, installation completed in P2. What changed? Hardware revenue recognized upon machine delivery and no longer tied to underlying contractual billing milestones What’s the impact? Greater hardware revenue in period of delivery What did not change? • Timing of installation • Economics of the deal; net operating cash flows 7 Cumulative period 1 and 2 total revenue and gross margin did not change Prior Std New Std Inc / (Dec) Prior Std New Std Inc / (Dec) Example 1: HW Sale for $2M, payment terms Example 1 Revenues - HW & Installation $1,600 $1,900 $300 $400 $100 ($300) Cost of Revenues $1,000 $1,000 $0 $75 $75 $0 Gross Margin $600 $900 $300 $325 $25 ($300) % of Revenues 37.5% 47.4% 81.3% 25.0% Example 2 Revenues - HW & Installation $0 $1,900 $1,900 $2,000 $100 ($1,900) Cost of Revenues $0 $1,000 $1,000 $1,075 $75 ($1,000) Gross Margin $0 $900 $900 $925 $25 ($900) % of Revenues 47.4% 46.3% 25.0% Period 1 Period 2 Contingent Payment Examples

VSOE Example Financial Impact 8 Example Three software products (Product A, B & C) sold together with a fair value of $250 each and cost of $50 each Software Product A & B have VSOE, Product C does not Software Products A and B are delivered in P1 and Product C is delivered in P2 What changed? VSOE is no longer required to separate out the fair value of delivered and undelivered software products What’s the impact? Software revenue recognized in period of delivery What did not change? • Timing of software delivery • Economics of the deal; cash and net operating cash flows Cumulative period 1 and 2 total revenue and gross margin did not change Prior Standard Revenues $0 $750 $750 Cost of Revenues $0 $150 $150 Gross Margin $0 $600 $600 % of Revenues N/A 80% 80% New Standard Revenues $500 $250 $750 Cost of Revenues $100 $50 $150 Gross Margin $400 $200 $600 % of Revenues 80% 80% 80% Period 1 Period 2 Cummulative VSOE Example
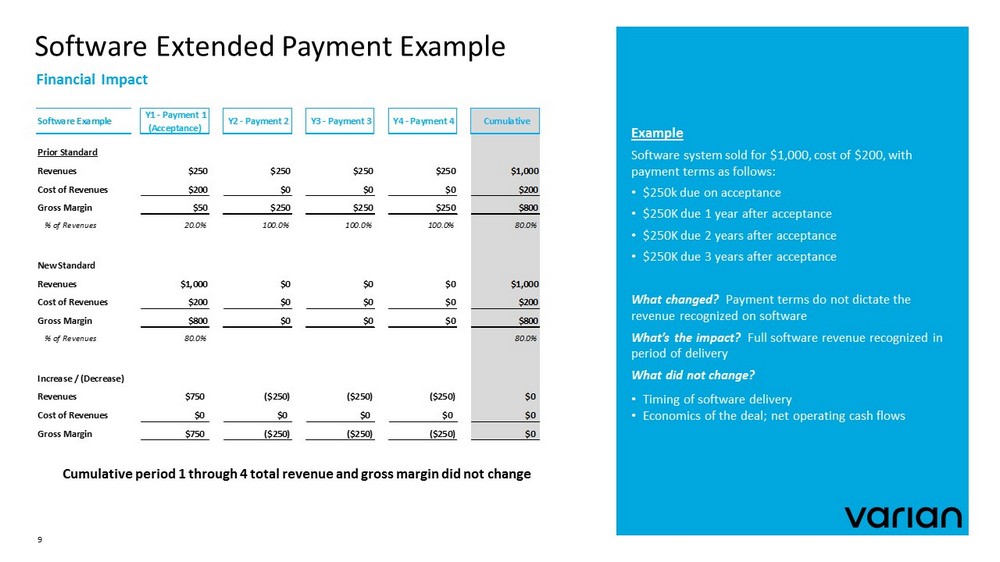
Software Extended Payment Example Financial Impact 9 Example Software system sold for $1,000, cost of $200, with payment terms as follows: • $250k due on acceptance • $250K due 1 year after acceptance • $250K due 2 years after acceptance • $250K due 3 years after acceptance What changed? Payment terms do not dictate the revenue recognized on software What’s the impact? Full software revenue recognized in period of delivery What did not change? • Timing of software delivery • Economics of the deal; net operating cash flows Cumulative period 1 through 4 total revenue and gross margin did not change Prior Standard Revenues $250 $250 $250 $250 $1,000 Cost of Revenues $200 $0 $0 $0 $200 Gross Margin $50 $250 $250 $250 $800 % of Revenues 20.0% 100.0% 100.0% 100.0% 80.0% New Standard Revenues $1,000 $0 $0 $0 $1,000 Cost of Revenues $200 $0 $0 $0 $200 Gross Margin $800 $0 $0 $0 $800 % of Revenues 80.0% 80.0% Increase / (Decrease) Revenues $750 ($250) ($250) ($250) $0 Cost of Revenues $0 $0 $0 $0 $0 Gross Margin $750 ($250) ($250) ($250) $0 Y2 - Payment 2 Y3 - Payment 3 Y4 - Payment 4 Cumulative Software Example Y1 - Payment 1 (Acceptance)
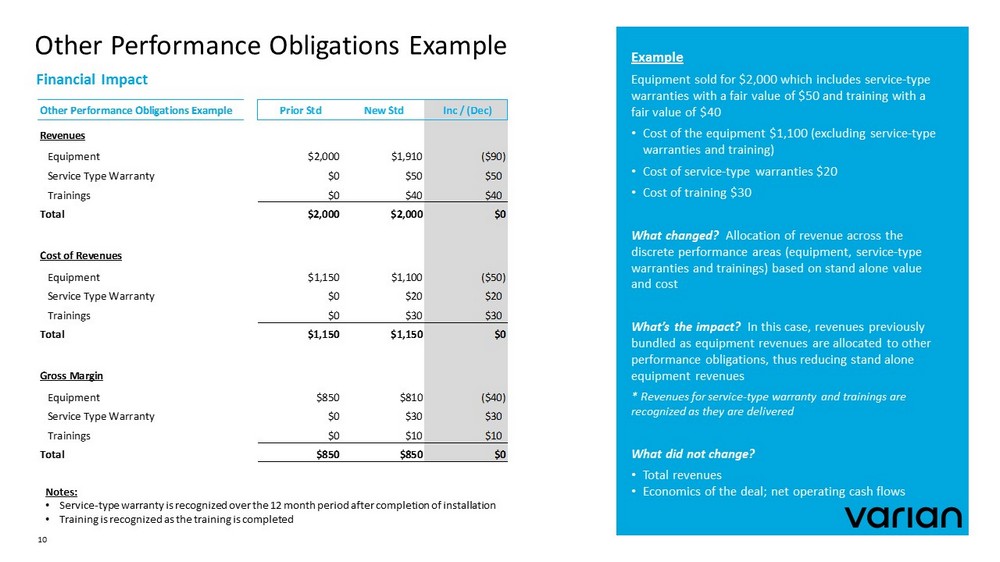
Other Performance Obligations Example Financial Impact 10 Example Equipment sold for $2,000 which includes service - type warranties with a fair value of $50 and training with a fair value of $40 • Cost of the equipment $1,100 (excluding service - type warranties and training) • Cost of service - type warranties $20 • Cost of training $30 What changed? Allocation of revenue across the discrete performance areas (equipment, service - type warranties and trainings) based on stand alone value and cost What’s the impact? In this case, revenues previously bundled as equipment revenues are allocated to other performance obligations, thus reducing stand alone equipment revenues * Revenues for service - type warranty and trainings are recognized as they are delivered What did not change? • Total revenues • Economics of the deal; net operating cash flows Notes: • Service - type warranty is recognized over the 12 month period after completion of installation • Training is recognized as the training is completed Other Performance Obligations Example Prior Std New Std Inc / (Dec) Revenues Equipment $2,000 $1,910 ($90) Service Type Warranty $0 $50 $50 Trainings $0 $40 $40 Total $2,000 $2,000 $0 Cost of Revenues Equipment $1,150 $1,100 ($50) Service Type Warranty $0 $20 $20 Trainings $0 $30 $30 Total $1,150 $1,150 $0 Gross Margin Equipment $850 $810 ($40) Service Type Warranty $0 $30 $30 Trainings $0 $10 $10 Total $850 $850 $0

$900 $1,200 $1,500 $1,800 $2,100 $2,400 $2,700 FY17 Restated to prior years Recognized in current year Other, net FY17 VSOE Contingent Revenue (Terms) $1,500 $1,800 $2,100 $2,400 $2,700 FY16 Restated to prior years Recognized in current year Other, net FY16 VSOE Contingent Revenue (Terms) FY17 and FY16 Revenue prior to new revenue standard 11 Bridge items reflect upfront recognition of revenue from the following: 1. VSOE related to recognition of all software items on delivery 2. Contingent revenue (terms) related to recognition of deliverables based on fair value 3. Other reflects the net impact of additional items, primarily driven by training and service - type warranty Note: The bridge reflects an additional decrease in 2017 and 2016 revenues of $20M and $18M, respectively from what was disclosed in our 2017 Form 10 - K filed in November. This resulted primarily from the carve out for training and service - type warranties that had not been quantified at the time of our 10 - K filing. $2.67B $2.62B $2.62B $2.59B GAAP Revenue – Prior Standard GAAP Revenue – New Standard (606) GAAP Revenue – New Standard (606) GAAP Revenue – Prior Standard
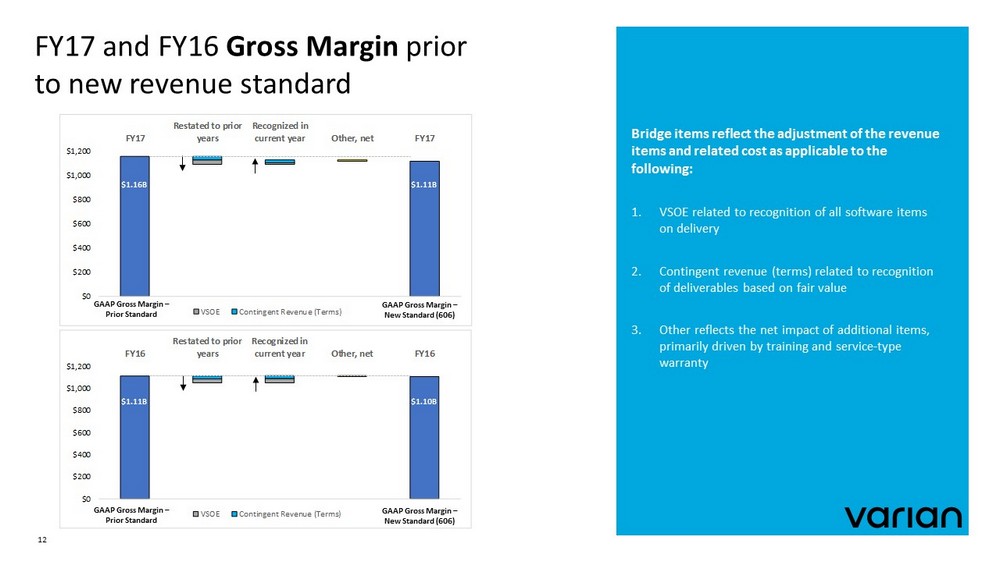
$0 $200 $400 $600 $800 $1,000 $1,200 FY17 Restated to prior years Recognized in current year Other, net FY17 VSOE Contingent Revenue (Terms) $0 $200 $400 $600 $800 $1,000 $1,200 FY16 Restated to prior years Recognized in current year Other, net FY16 VSOE Contingent Revenue (Terms) FY17 and FY16 Gross Margin prior to new revenue standard 12 $1.16B $1.11B $1.11B $1.10B GAAP Gross Margin – Prior Standard GAAP Gross Margin – New Standard (606) GAAP Gross Margin – Prior Standard GAAP Gross Margin – New Standard (606) Bridge items reflect the adjustment of the revenue items and related cost as applicable to the following: 1. VSOE related to recognition of all software items on delivery 2. Contingent revenue (terms) related to recognition of deliverables based on fair value 3. Other reflects the net impact of additional items, primarily driven by training and service - type warranty

Change in Service Orders Policy
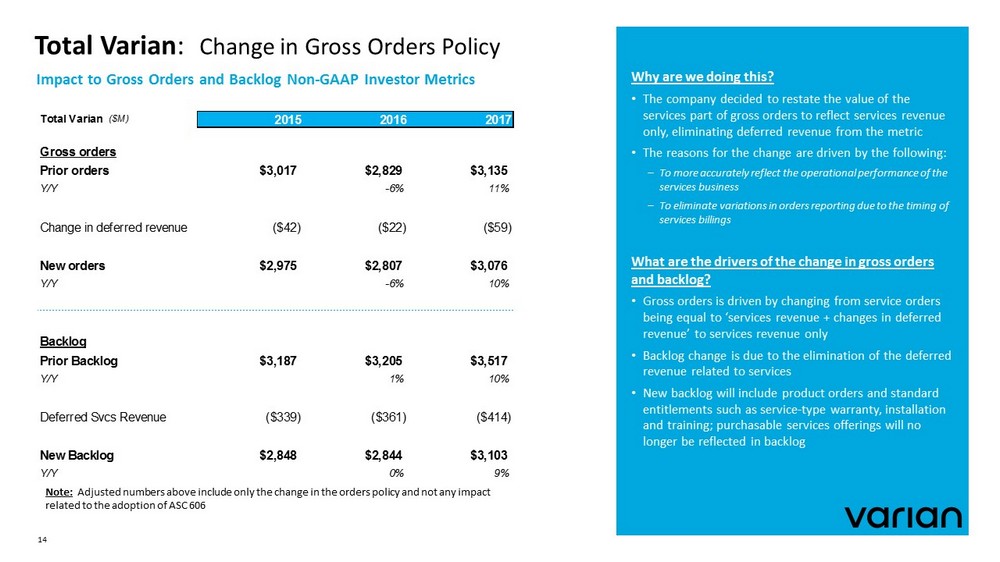
Total Varian : Change in Gross Orders Policy Impact to Gross Orders and Backlog Non - GAAP Investor Metrics 14 Total Varian ($M) 2015 2016 2017 Gross orders Prior orders $3,017 $2,829 $3,135 Y/Y -6% 11% Change in deferred revenue ($42) ($22) ($59) New orders $2,975 $2,807 $3,076 Y/Y -6% 10% Backlog Prior Backlog $3,187 $3,205 $3,517 Y/Y 1% 10% Deferred Svcs Revenue ($339) ($361) ($414) New Backlog $2,848 $2,844 $3,103 Y/Y 0% 9% Why are we doing this? • The company decided to restate the value of the services part of gross orders to reflect services revenue only, eliminating deferred revenue from the metric • The reasons for the change are driven by the following: To more accurately reflect the operational performance of the services business To eliminate variations in orders reporting due to the timing of services billings What are the drivers of the change in gross orders and backlog? • Gross orders is driven by changing from service orders being equal to ‘services revenue + changes in deferred revenue’ to services revenue only • Backlog change is due to the elimination of the deferred revenue related to services • New backlog will include product orders and standard entitlements such as service - type warranty, installation and training; purchasable services offerings will no longer be reflected in backlog Note: Adjusted numbers above include only the change in the orders policy and not any impact related to the adoption of ASC 606

Oncology : Change in Gross Orders Policy Impact to Gross Orders and Backlog Non - GAAP Investor Metrics 15 Oncology business unit ($M) 2015 2016 2017 Gross orders Prior orders $2,700 $2,724 $2,906 Y/Y 1% 7% Change in deferred revenue ($45) ($22) ($59) New orders $2,655 $2,702 $2,847 Y/Y 2% 5% Backlog Prior Backlog $2,841 $2,933 $3,195 Y/Y 3% 9% Deferred Svcs Revenue ($339) ($361) ($414) New Backlog $2,502 $2,572 $2,781 Y/Y 3% 8% • These changes only impact the Oncology business orders as Varian Particle Therapy business already reflects the value of the services part of gross orders as services revenue only Note: Adjusted numbers above include only the change in the orders policy and not any impact related to the adoption of ASC 606

Fiscal Years 2016 and 2017 Adjusted Key Earnings Financial Metrics
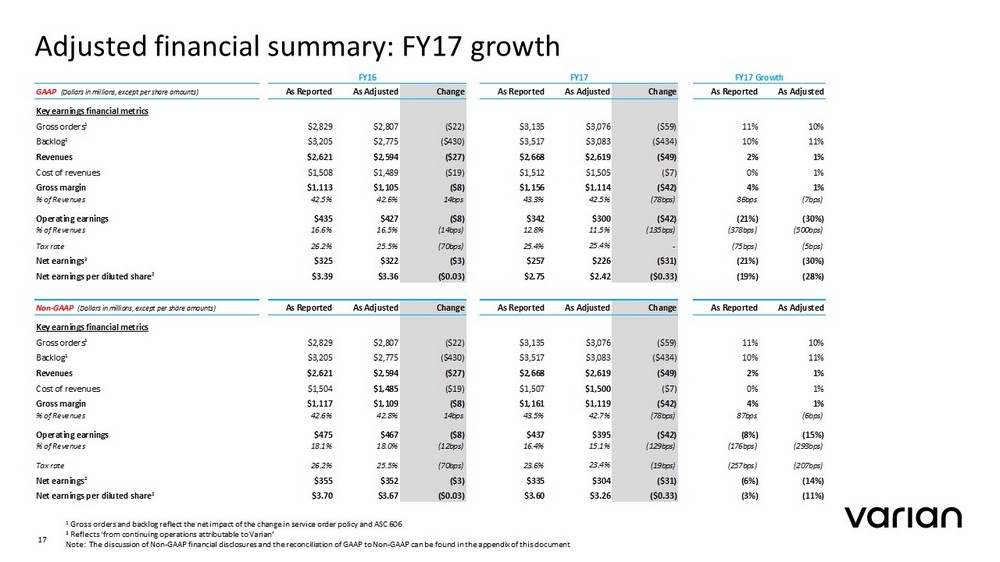
Adjusted financial summary: FY17 growth 17 1 Gross orders and backlog reflect the net impact of the change in service order policy and ASC 606 2 Reflects ‘from continuing operations attributable to Varian’ Note: The discussion of Non - GAAP financial disclosures and the reconciliation of GAAP to Non - GAAP can be found in the appendix of this document GAAP (Dollars in millions, except per share amounts) As Reported As Adjusted Change As Reported As Adjusted Change As Reported As Adjusted Key earnings financial metrics Gross orders 1 $2,829 $2,807 ($22) $3,135 $3,076 ($59) 11% 10% Backlog 1 $3,205 $2,775 ($430) $3,517 $3,083 ($434) 10% 11% Revenues $2,621 $2,594 ($27) $2,668 $2,619 ($49) 2% 1% Cost of revenues $1,508 $1,489 ($19) $1,512 $1,505 ($7) 0% 1% Gross margin $1,113 $1,105 ($8) $1,156 $1,114 ($42) 4% 1% % of Revenues 42.5% 42.6% 14bps 43.3% 42.5% (78bps) 86bps (7bps) Operating earnings $435 $427 ($8) $342 $300 ($42) (21%) (30%) % of Revenues 16.6% 16.5% (14bps) 12.8% 11.5% (135bps) (378bps) (500bps) Tax rate 26.2% 25.5% (70bps) 25.4% 25.4% - (75bps) (5bps) Net earnings 2 $325 $322 ($3) $257 $226 ($31) (21%) (30%) Net earnings per diluted share 2 $3.39 $3.36 ($0.03) $2.75 $2.42 ($0.33) (19%) (28%) Non-GAAP (Dollars in millions, except per share amounts) As Reported As Adjusted Change As Reported As Adjusted Change As Reported As Adjusted Key earnings financial metrics Gross orders 1 $2,829 $2,807 ($22) $3,135 $3,076 ($59) 11% 10% Backlog 1 $3,205 $2,775 ($430) $3,517 $3,083 ($434) 10% 11% Revenues $2,621 $2,594 ($27) $2,668 $2,619 ($49) 2% 1% Cost of revenues $1,504 $1,485 ($19) $1,507 $1,500 ($7) 0% 1% Gross margin $1,117 $1,109 ($8) $1,161 $1,119 ($42) 4% 1% % of Revenues 42.6% 42.8% 14bps 43.5% 42.7% (78bps) 87bps (6bps) Operating earnings $475 $467 ($8) $437 $395 ($42) (8%) (15%) % of Revenues 18.1% 18.0% (12bps) 16.4% 15.1% (129bps) (176bps) (293bps) Tax rate 26.2% 25.5% (70bps) 23.6% 23.4% (19bps) (257bps) (207bps) Net earnings 2 $355 $352 ($3) $335 $304 ($31) (6%) (14%) Net earnings per diluted share 2 $3.70 $3.67 ($0.03) $3.60 $3.26 ($0.33) (3%) (11%) FY16 FY17 FY17 Growth

Adjusted GAAP financial summary: FY17 by quarter 18 1 Gross orders and backlog reflect the net impact of the change in service order policy and ASC 606 2 Reflects ‘from continuing operations attributable to Varian’ Note: The discussion of Non - GAAP financial disclosures and the reconciliation of GAAP to Non - GAAP can be found in the appendix of this document GAAP (Dollars in millions, except per share amounts) 1Q 2Q 3Q 4Q FY17 1Q 2Q 3Q 4Q FY17 1Q 2Q 3Q 4Q FY17 Key earnings financial metrics Gross orders 1 $590 $676 $830 $1,039 $3,135 $581 $663 $810 $1,022 $3,076 ($9) ($13) ($20) ($17) ($59) Backlog 1 $3,165 $3,136 $3,255 $3,517 $3,517 $2,737 $2,686 $3,255 $3,083 $3,083 ($428) ($450) $0 ($434) ($434) Revenues $612 $655 $662 $739 $2,668 $601 $663 $633 $722 $2,619 ($11) $8 ($29) ($17) ($49) Cost of revenues $336 $380 $368 $428 $1,512 $334 $388 $367 $416 $1,505 ($2) $8 ($1) ($12) ($7) Gross margin $276 $275 $294 $311 $1,156 $267 $275 $266 $306 $1,114 ($9) $0 ($28) ($5) ($42) % of Revenues 45.1% 42.0% 44.3% 42.1% 43.3% 44.4% 41.6% 42.0% 42.4% 42.5% (67bps) (48bps) (232bps) 24bps (78bps) Operating earnings $26 $90 $116 $110 $342 $17 $90 $88 $105 $300 ($9) $0 ($28) ($5) ($42) % of Revenues 4.3% 13.7% 17.6% 14.8% 12.8% 2.9% 13.6% 14.0% 14.4% 11.5% (137bps) (13bps) (358bps) (40bps) (135bps) Tax rate 48.3% 23.1% 22.2% 25.0% 25.4% 58.6% 23.1% 21.1% 24.9% 25.4% 1029bps 1bps (104bps) (3bps) - Net earnings 2 $15 $69 $90 $83 $257 $8 $70 $69 $79 $226 ($7) $1 ($21) ($4) ($31) Net earnings per diluted share 2 $0.15 $0.74 $0.98 $0.89 $2.75 $0.08 $0.74 $0.75 $0.85 $2.42 ($0.07) $0.00 ($0.22) ($0.04) ($0.33) Non-GAAP (Dollars in millions, except per share amounts) 1Q 2Q 3Q 4Q FY17 1Q 2Q 3Q 4Q FY17 1Q 2Q 3Q 4Q FY17 Key earnings financial metrics Gross orders 1 $590 $676 $830 $1,039 $3,135 $581 $663 $810 $1,022 $3,076 ($9) ($13) ($20) ($17) ($59) Backlog 1 $3,165 $3,136 $3,255 $3,517 $3,517 $2,737 $2,686 $3,255 $3,083 $3,083 ($428) ($450) $0 ($434) ($434) Revenues $612 $655 $662 $739 $2,668 $601 $663 $633 $722 $2,619 ($11) $8 ($29) ($17) ($49) Cost of revenues $335 $378 $368 $426 $1,507 $333 $386 $367 $414 $1,500 ($2) $8 ($1) ($12) ($7) Gross margin $277 $277 $294 $313 $1,161 $268 $277 $266 $308 $1,119 ($9) $0 ($28) ($5) ($42) % of Revenues 45.3% 42.2% 44.5% 42.3% 43.5% 44.6% 41.7% 42.2% 42.5% 42.7% (67bps) (48bps) (232bps) 25bps (78bps) Operating earnings $77 $106 $123 $131 $437 $68 $106 $95 $126 $395 ($9) $0 ($28) ($5) ($42) % of Revenues 12.6% 16.1% 18.5% 17.7% 16.4% 11.4% 16.0% 15.0% 17.4% 15.1% (123bps) (16bps) (353bps) (33bps) (129bps) Tax rate 29.7% 21.6% 21.5% 23.5% 23.6% 32.1% 20.5% 20.3% 23.4% 23.4% 241bps (117bps) (122bps) (10bps) (19bps) Net earnings 2 $55 $83 $96 $101 $335 $48 $84 $75 $97 $304 ($7) $1 ($21) ($4) ($31) Net earnings per diluted share 2 $0.59 $0.89 $1.04 $1.09 $3.60 $0.50 $0.90 $0.82 $1.04 $3.26 ($0.08) $0.02 ($0.22) ($0.04) ($0.33) ChangeAS ADJUSTEDAS REPORTED

FY18 Guidance (Translation)

Varian consolidated FY18 Guidance (1) These values are presented on a non - GAAP basis. We have not provided a reconciliation of non - GAAP guidance measures to the corre sponding GAAP measures on a forward - looking basis due to potential significant variability and limited visibility of the excluded items. . 20 FY18 guidance for revenue, operating earnings percent of revenue and earnings per share metrics change based on the adoption of ASC 606 • Under the new standard, ASC 606, the fiscal year 2018 revenue guidance range is increased to 3 percent to 5 percent driven by lower fiscal year 2017 revenue • Under the new standard, ASC 606, the decrease in operating earnings as a percent of revenue guidance from the prior standard to the new standard is primarily driven by the increasing deferral of certain performance obligations • Under the new standard, ASC 606, there is no change to fiscal year 2018 weighted average diluted share guidance or effective tax rate guidance • Therefore, under the new standard, ASC 606, the deferral of certain performance obligations results in lower net earnings; as such, fiscal year 2018 guidance range for EPS is lower under the new standard FY18 guidance for cash flow from operations is not impacted by the adoption of ASC 606 Note: FY18 guidance under the NEW standard is only impacted by the adoption of ASC 606 and does not consider any updates based on the first quarter just completed in fiscal 2018 or the just passed Tax Cuts and Jobs Act $M PRIOR Standard NEW Standard Revenue 2% to 4% 3% to 5% Operating Earnings Percent 18% to 19% 17.5% to 18.5% EPS ($) 1 $4.20 to $4.32 $4.05 to $4.17 Weighted Average Diluted Shares(M) 93 93 Effective Tax Rate 23% 23% Cash Flow from Operations $475 to $550 $475 to $550 FY18 Guidance

Q&A
Appendix: Financial Metrics

Non - GAAP disclosure 23 Discussion of Non - GAAP Financial Measures This presentation includes the following non - GAAP financial measures derived from our Condensed Consolidated Statements of Earnings : non - GAAP operating earnings, non - GAAP net earnings and non - GAAP net earnings per diluted share . These measures are not presented in accordance with, nor are they a substitute for U . S . generally accepted accounting principles, or GAAP . In addition, these measures may be different from non - GAAP measures used by other companies, limiting their usefulness for comparison purposes . The non - GAAP financial measures should not be considered in isolation from measures of financial performance prepared in accordance with GAAP . Investors are cautioned that there are material limitations associated with the use of non - GAAP financial measures as an analytical tool . We have provided a reconciliation of each non - GAAP financial measure used here to the most directly comparable GAAP financial measure . We have not provided a reconciliation of non - GAAP guidance measures to the corresponding GAAP measures on a forward - looking basis due to the potential significant variability and limited visibility of the excluded items discussed below . We utilize a number of different financial measures, both GAAP and non - GAAP, in analyzing and assessing the overall performance of our business, in making operating decisions, forecasting and planning for future periods, and determining payments under compensation programs . We consider the use of the non - GAAP measures to be helpful in assessing the performance of the ongoing operation of our business . We believe that disclosing non - GAAP financial measures provides useful supplemental data that, while not a substitute for financial measures prepared in accordance with GAAP, allows for greater transparency in the review of our financial and operational performance . We also believe that disclosing non - GAAP financial measures provides useful information to investors and others in understanding and evaluating our operating results and future prospects in the same manner as management and in comparing financial results across accounting periods and to those of peer companies . Non - GAAP operating earnings and non - GAAP net earnings exclude the following items : Amortization of intangible assets : We do not acquire businesses and assets on a predictable cycle . The amount of purchase price allocated to intangible assets and the term of amortization can vary significantly and are unique to each acquisition or purchase . We believe that excluding amortization of intangible assets allows the users of our financial statements to better review and understand the historic and current results of our operations, and also facilitates comparisons to peer companies . Acquisition - related expenses and benefits : We incur expenses or benefits with respect to certain items associated with our acquisitions, such as transaction costs, changes in the fair value of contingent consideration liabilities, gain or expense on settlement of pre - existing relationships, etc . We exclude such expenses or benefits as they are related to acquisitions and have no direct correlation to the operation of our on - going business . Restructuring and impairment charges : We incur restructuring and impairment charges that result from events, which arise from unforeseen circumstances and/or often occur outside of the ordinary course of our on - going business . Although these events are reflected in our GAAP financials, these unique transactions may limit the comparability of our on - going operations with prior and future periods . Significant litigation charges or benefits and legal costs : We may incur charges or benefits as well as legal costs from time to time related to litigation and other contingencies . We exclude these charges or benefits, when significant, as well as legal costs associated with significant legal matters, because we do not believe they are reflective of on - going business and operating results . We apply our GAAP consolidated effective tax rate to our non - GAAP financial measures, other than when the underlying item has a materially different tax treatment . From time to time in the future, there may be other items that we may exclude if we believe that doing so is consistent with the goal of providing useful information to investors and management . Non - GAAP items are generally included in selling, general and administrative expenses, unless otherwise specified .

Adjusted GAAP to non - GAAP reconciliation 24 (1) Includes $1 million, $1 million, $1 million, $1 million and $5 million respectively, in cost of revenues for the periods pres ent ed. (2) Other includes acquisition - related expenses and benefits. (3) Excludes immaterial net earnings (loss) from continuing operations attributable to non - controlling interests for the periods pre sented. $M, except per share amount 1Q 2Q 3Q 4Q Full Year 2017 Non-GAAP adjustments Amortization of intangible assets (1) $3 $3 $3 $3 $12 Restructuring charges $4 $2 $3 $4 $13 Legal costs $6 $10 $0 $0 $16 Impairment charges $38 $0 $0 $13 $51 Other (2) $0 $1 $1 $1 $3 Total non-GAAP adjustments $51 $16 $7 $21 $95 Tax effects of non-GAAP adjustments ($11) ($2) ($1) ($3) ($17) Total net earnings from continuing operations impact from non-GAAP adjustments $40 $14 $6 $18 $78 Operating earnings reconciliation GAAP operating earnings from continuing operations $17 $90 $88 $105 $300 Total operating earnings from continuing operations impact from non-GAAP adjustments $51 $16 $7 $21 $95 Non-GAAP operating earnings from continuing operations $68 $106 $95 $126 $395 Net earnings and diluted net earnings per share reconciliation GAAP net earnings from continuing operations attributable to Varian (3) $8 $70 $69 $79 $226 Total net earnings from continuing operations impact from non-GAAP adjustments $40 $14 $6 $18 $78 Non-GAAP net earnings from continuing operations attributable to Varian $48 $84 $75 $97 $304 GAAP net earnings per diluted share from continuing operations $0.08 $0.74 $0.75 $0.85 $2.42 Non-GAAP net earnings per diluted share from continuing operations $0.50 $0.90 $0.82 $1.04 $3.26 Shares used in GAAP and non GAAP net earnings per diluted share calculation 94.2 93.7 92.4 92.6 93.2

Varian consolidated (GAAP) Key P&L Financial Metrics 25 Note: Unless noted otherwise, all ‘Orders’ reflects Gross Orders, all growth rates are in dollars, and year on year, and all numbers reflect continuing operations. $M Full Year Y/Y Full Year Y/Y Gross Orders $3,135 11% $3,076 10% Revenues $2,668 2% $2,619 1% Product $1,555 -2% $1,402 -4% Svcs $1,113 7% $1,217 7% GM $1,156 4% $1,114 1% % of Rev 43.3% 86 bps 42.5% -7 bps SG&A $604 26% $604 26% % of Rev 22.6% 441 bps 23.0% 464 bps R&D $210 5% $210 5% % of Rev 7.9% 23 bps 8.0% 29 bps Operating Earnings $342 -21% $300 -30% % of Rev 12.8% -378 bps 11.5% -500 bps EPS ($) $2.75 -19% $2.42 -28% Install Base (Linac) 7,833 4% 7,833 4% VARIAN Fiscal 2017 Fiscal 2017 AS REPORTED AS ADJUSTED

Varian consolidated (non - GAAP) Key P&L Financial Metrics Note: Unless noted otherwise, all ‘Orders’ reflects Gross Orders, all growth rates are in dollars, and year on year, and all numbers reflect continuing operations. 26 $M Full Year Y/Y Full Year Y/Y Gross Orders $3,135 11% $3,076 10% Revenues $2,668 2% $2,619 1% Product $1,555 -2% $1,402 -4% Svcs $1,113 7% $1,217 7% GM $1,161 4% $1,119 1% % of Rev 43.5% 87 bps 42.7% -6 bps SG&A $514 16% $514 16% % of Rev 19.3% 240 bps 19.6% 258 bps R&D $210 5% $210 5% % of Rev 7.9% 23 bps 8.0% 29 bps Operating Earnings $437 -8% $395 -15% % of Rev 16.4% -176 bps 15.1% -293 bps EPS ($) $3.60 -3% $3.26 -11% Install Base (Linac) 7,833 4% 7,833 4% VARIAN Fiscal 2017 Fiscal 2017 AS REPORTED AS ADJUSTED

Varian consolidated Key Balance Sheet and Cash Flow Metrics • No change due to adoption of ASC 606 VARIAN FISCAL 2017 $M 1Q 2Q 3Q 4Q Full Year Cash & Cash Equivalents 1 $815 $706 $658 $716 - Cash Flows from Operations 2 $82 $32 $155 $130 $399 Y/Y % 6.0% 1.0% 63.0% - 15.0% 12.0% Total Debt $607 $547 $364 $350 - (1) Presented on a continuing operations basis, except 1Q which includes Varex . (2) Cash Flow is shown on a Total Company basis, including Varex prior to the spinoff. 27

Oncology business unit Key Financial Metrics 28 Note: Unless noted otherwise, all ‘Orders’ reflects Gross Orders, all growth rates are in dollars, and year on year, and all numbers reflect continuing operations. 1 Business unit operating earnings includes an allocation of corporate costs based on relative revenue between the business units. The allocated corporate costs excludes certain transactions or adjustments that are considered non - operational in nature, such as restructuring and impairment charges, significant litigation matters and acquisition related items. $M Full Year Y/Y Full Year Y/Y Gross Orders $2,906 7% $2,847 5% Revenues $2,486 1% $2,437 0% Product $1,383 -3% $1,230 -5% Svcs $1,103 7% $1,207 7% GM $1,140 5% $1,098 2% % of Rev 45.8% 159 bps 45.1% 64 bps Operating Earnings 1 $521 0% $479 -6% % of Rev 20.9% -15 bps 19.7% -135 bps Install Base (Units) 7,833 4% 7,833 4% VARIAN Fiscal 2017 Fiscal 2017 AS REPORTED AS ADJUSTED

Particle Therapy business unit Key Financial Metrics VARIAN FISCAL 2017 $M Full Year Y/Y Gross Orders $229 120% Revenues $182 12% Product $172 13% Svcs $10 4% GM $16 - 36% % of Rev 8.8% - 661 bps Operating Earnings 1 - $96 - 115% % of Rev - 52.5% - 2,507 bps 29 Note: Unless noted otherwise, all ‘Orders’ reflects Gross Orders, all growth rates are in dollars, and year on year, and all numbers reflect continuing operations. 1 Business unit operating earnings includes an allocation of corporate costs based on relative revenue between the business units. The allocated corporate costs excludes certain transactions or adjustments that are considered non - operational in nature, such as restructuring and impairment charges, significant litigation matters and acquisition related items. • No change due to adoption of ASC 606

Total revenues by sales classification 30 $M 1Q 2Q 3Q 4Q FY17 Product revenues $309 $365 $325 $403 $1,402 Y/Y -4% Service revenues $292 $298 $308 $319 $1,217 Y/Y 7% Total revenues $601 $663 $633 $722 $2,619 Y/Y 1% Product as a percentage of total revenues 51% 55% 51% 56% 54% Service as a percentage of total revenues 49% 45% 49% 44% 46%

Total Oncology revenues by sales classification 31 $M 1Q 2Q 3Q 4Q FY17 Product revenues $282 $336 $258 $354 $1,230 Y/Y -5% Service revenues $289 $296 $306 $316 $1,207 Y/Y 7% Total revenues $571 $632 $564 $670 $2,437 Y/Y 0% Product as a percentage of Oncology Systems revenues 49% 53% 46% 53% 50% Service as a percentage of Oncology Systems revenues 51% 47% 54% 47% 50% Oncology Systems revenues as a percentage of total revenues 95% 95% 89% 93% 93%

Total Particle Therapy revenues by sales classification 32 $M 1Q 2Q 3Q 4Q FY17 Product revenues $27 $29 $67 $49 $172 Y/Y 13% Service revenues $3 $2 $2 $3 $10 Y/Y 4% Total revenues $30 $31 $69 $52 $182 Y/Y 12% VPT revenues as a percentage of total revenues 5% 5% 11% 7% 7%
