Attached files
| file | filename |
|---|---|
| EX-99.1 - EXHIBIT 99.1 - SS&C Technologies Holdings Inc | dp85092_ex9901.htm |
| EX-2.1 - EXHIBIT 2.1 - SS&C Technologies Holdings Inc | dp85092_ex0201.htm |
| 8-K - FORM 8-K - SS&C Technologies Holdings Inc | dp85092_8k.htm |
Exhibit 99.2
SS&C Technologies (NASDAQ:SSNC) January 11, 2018 Leading Software Provider to the Institutional, Alternative and Wealth Management Markets SS&C to Acquire DST Systems
Safe Harbor Statement 1 Safe Harbor Statement Certain information contained in this presentation constitutes forward - looking statements for purposes of the safe harbor provisions under the Private Securities Litigation Reform Act of 1995. Forward - looking statements include statements concerning plans, objectives, goals, strategies, expectations, intentions, p rojections, developments, future events, performance, underlying assumptions, and other statements that are other than statements of historical facts. The forward - looking statements contained herein include, but are not limited to, statements about the expected effects on SS&C of the proposed acquisition of DST, the expected timing and conditions preceden t r elating to the proposed acquisition of DST, anticipated earnings enhancements, synergies, and other strategic options. Without limiting the foregoing, the words “believe s”, “anticipates”, “plans”, “expects”, “estimates”, “projects”, “forecasts”, “may”, “assume”, “anticipates”, “intend”, “will”, “continue”, “opportunity”, “predict”, “potential”, “future”, “ gua rantee”, “likely”, “target”, “indicate”, “would”, “could” and “should” and similar expressions are intended to identify forward - looking statements, although not all forward - looking statements are acc ompanied by such words. Such statements reflect the best judgment of SS&C and DST management based on factors currently known but are subject to risks and uncertainties, which c oul d cause actual results to differ materially from those anticipated. Such risks and uncertainties include, but are not limited to, unanticipated issues associated with the sat isf action of the conditions precedent to the proposed acquisition; issues associated with obtaining necessary regulatory approvals and the terms and conditions of such approvals; the inability to obtain financing and the terms of any financing; the inability to integrate successfully DST within SS&C and to obtain anticipated synergies; exposure to potential litigation; and changes in anticipated costs related to the acquisition of DST. Additional factors that could cause actual results and developments to differ materially include, among o the rs, the state of the economy and the financial services industry, SS&C's and DST’s ability to finalize large client contracts, fluctuations in customer demand for SS&C's and DST’s p rod ucts and services, intensity of competition from application vendors, delays in product development, SS&C's and DST’s ability to control expenses, terrorist activities , risks of cyber attacks, exposure to litigation, SS&C's ability to integrate acquired businesses, the effect of the acquisitions on customer demand for SS&C's products and services, the market pr ice of SS&C's stock prevailing from time to time, SS&C's and DST’s cash flow from operations, general economic conditions, and those risks discussed in the “Risk Factors” sect ion s of SS&C’s and DST’s 2016 Annual Report on Form 10 - K and 2017 Quarterly Reports on Form 10 - Q, which are on file with the Securities and Exchange Commission. Forward - lookin g statements speak only as of the date on which they are made and, except to the extent required by applicable securities laws, we undertake no obligation to update or revis e a ny forward - looking statements.
Disclaimer 2 Disclaimer For the purposes of the following disclaimers, references to this "presentation" shall be deemed to include references to the presenters' speeches, the question and answer session and any other related verbal or written communications . This presentation is being made to you solely for your information and may not be reproduced, further distributed to any othe r p erson or published, in whole or in part, for any purpose . This presentation does not constitute an offer, invitation or inducement to acquire or sell any shares or other securities an d n o offer, invitation or inducement to acquire or sell any shares or other securities is being made by or in connection with this presentation. Although reasonable care has been taken to ensure that the facts stated in this presentation are accurate and that the opinions expressed are fair and reasonable, the contents of this presentation have not been verified by SS&C or any other person. Accordingly no representation or warranty, express or implied, is made as to the fairness, accuracy, completeness or correctness of the information and opinions contained in this presentation and no relianc e s hould be placed on such information or opinions. Neither SS&C nor any of its directors, officers, employees or advisers nor any other person acc ept s any liability whatsoever for any loss howsoever arising from any use of such information or opinions or otherwise arising in connection with this presentation. Nothing in this presentation should be taken as profit statements of forecasts regarding SS&C's expectation for earnings per share during the fourth quarter or full - year 2017, for 2018 or for subsequent periods . This presentation is not an offer to sell or the solicitation of an offer to buy any securities of SS&C, nor will there be any sales of securities of SS&C in any jurisdiction in which the offer, solicitation or sale would be unlawful prior to registration or qualification under the securities laws of any such jurisdiction . The distribution of this presentation in jurisdictions outside of the United States may be restricted by law, and persons into wh ose possession this presentation comes should inform themselves about, and observe, any such restrictions. Any failure to comply with any of those restrictions may constitute a violation of the securities laws of any such jurisdictions . By participating in this presentation you agree to be bound by the above terms. This presentation contains certain non - GAAP financial measures. A “non - GAAP financial measure” is defined as a numerical measure of a company’s financial performance that excludes or includes amounts so as to be different than the most directly comparable measure calculated and presented in acco rda nce with generally accepted accounting principles (GAAP) in the statement of income, balance sheet or statement of cash flows of SS&C or DST. The appendix to this presentation in cludes reconciliations of non - GAAP financial measures used in this presentation to the most directly comparable GAAP financial measures. These measures are presented beca use management uses such non - GAAP financial measures because it believes that they are meaningful measures of performance. The method of calculating these non - GAAP financia l measures may differ from the methods used by other companies and, as a result, the non - GAAP financial measures presented in this presentation may not be comparable to other similarly titled measures disclosed by other companies. Any analysis of non - GAAP financial measures should be considered in addition to, rather than as a substitute for, oth er information provided in accordance with GAAP.
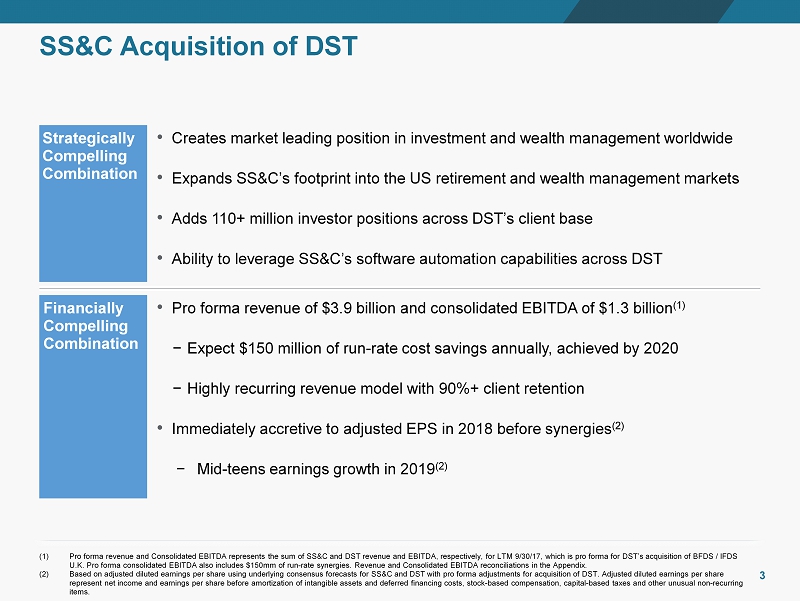
Chart sequence Accent 5 Accent 6 197 199 201 237 169 0 10 133 199 28 114 147 204 104 50 91 155 213 Accent 1 Accent 2 Accent 3 Accent 4 Txt \ L2 Primary Txt \ D1 Txt \ D2 Txt \ L1 230 230 230 0 0 0 255 255 255 0 0 0 SS&C Acquisition of DST 3 • Creates market leading position in investment and wealth management worldwide • Expands SS&C’s footprint into the US retirement and wealth management markets • Adds 110+ million investor positions across DST’s client base • Ability to leverage SS&C’s software automation capabilities across DST • Pro forma revenue of $3.9 billion and consolidated EBITDA of $1.3 billion (1) − Expect $150 million of run - rate cost savings annually, achieved by 2020 − Highly recurring revenue model with 90%+ client retention • Immediately accretive to adjusted EPS in 2018 before synergies (2) − Mid - teens earnings growth in 2019 (2) Strategically Compelling Combination Financially Compelling Combination (1) Pro forma revenue and Consolidated EBITDA represents the sum of SS&C and DST revenue and EBITDA, respectively, for LTM 9/30/ 17, which is pro forma for DST’s acquisition of BFDS / IFDS U.K. Pro forma consolidated EBITDA also includes $150mm of run - rate synergies. Revenue and Consolidated EBITDA reconciliations i n the Appendix. ( 2 ) Based on adjusted diluted earnings per share using underlying consensus forecasts for SS&C and DST with pro forma adjustments for acquisition of DST . Adjusted diluted earnings per share represent net income and earnings per share before amortization of intangible assets and deferred financing costs, stock - based c ompensation, capital - based taxes and other unusual non - recurring items.
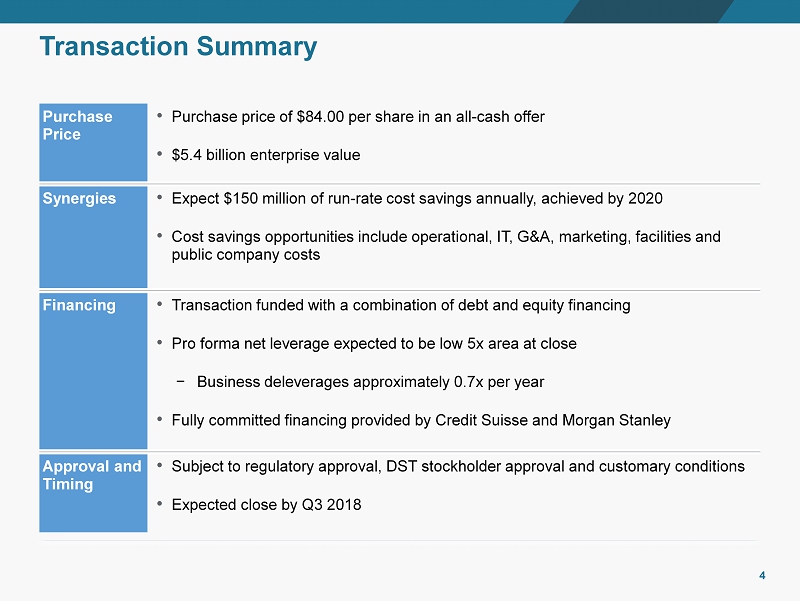
Chart sequence Accent 5 Accent 6 197 199 201 237 169 0 10 133 199 28 114 147 204 104 50 91 155 213 Accent 1 Accent 2 Accent 3 Accent 4 Txt \ L2 Primary Txt \ D1 Txt \ D2 Txt \ L1 230 230 230 0 0 0 255 255 255 0 0 0 Transaction Summary 4 • Purchase price of $84.00 per share in an all - cash offer • $5.4 billion enterprise value Purchase Price • Expect $150 million of run - rate cost savings annually , achieved by 2020 • Cost savings opportunities include operational, IT, G&A, marketing, facilities and public company costs Synergies Financing • Transaction funded with a combination of debt and equity financing • Pro forma net leverage expected to be low 5x area at close − Business deleverages approximately 0.7x per year • Fully committed financing provided by Credit Suisse and Morgan Stanley Approval and Timing • Subject to regulatory approval, DST stockholder approval and customary conditions • Expected close by Q3 2018
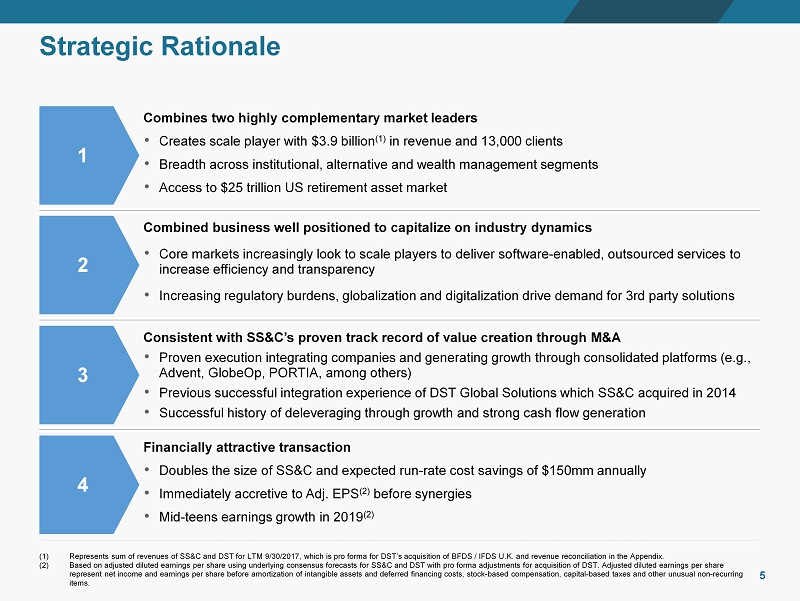
Chart sequence Accent 5 Accent 6 197 199 201 237 169 0 10 133 199 28 114 147 204 104 50 91 155 213 Accent 1 Accent 2 Accent 3 Accent 4 Txt \ L2 Primary Txt \ D1 Txt \ D2 Txt \ L1 230 230 230 0 0 0 255 255 255 0 0 0 Strategic Rationale 5 Combines two highly complementary market leaders • Creates scale player with $3.9 billion (1) in revenue and 13,000 clients • Breadth across institutional , alternative and wealth management segments • Access to $25 trillion US retirement asset market Combined business well positioned to capitalize on industry dynamics • Core markets increasingly look to scale players to deliver software - enabled, outsourced services to increase efficiency and transparency • Increasing regulatory burdens, globalization and digitalization drive demand for 3rd party solutions Consistent with SS&C’s proven track record of value creation through M&A • Proven execution integrating companies and generating growth through consolidated platforms (e.g., Advent, GlobeOp, PORTIA, among others) • Previous successful integration experience of DST Global Solutions which SS&C acquired in 2014 • Successful history of deleveraging through growth and strong cash flow generation Financially attractive transaction • Doubles the size of SS&C and expected run - rate cost savings of $150mm annually • Immediately accretive to Adj. EPS (2) before synergies • Mid - teens earnings growth in 2019 (2) 1 2 3 4 (1) Represents sum of revenues of SS&C and DST for LTM 9/30/2017, which is pro forma for DST’s acquisition of BFDS / IFDS U.K . and revenue reconciliation in the Appendix . (2) Based on adjusted diluted earnings per share using underlying consensus forecasts for SS&C and DST with pro forma adjustments for acquisition o f D ST. Adjusted diluted earnings per share represent net income and earnings per share before amortization of intangible assets and deferred financing costs, stock - based c ompensation, capital - based taxes and other unusual non - recurring items.
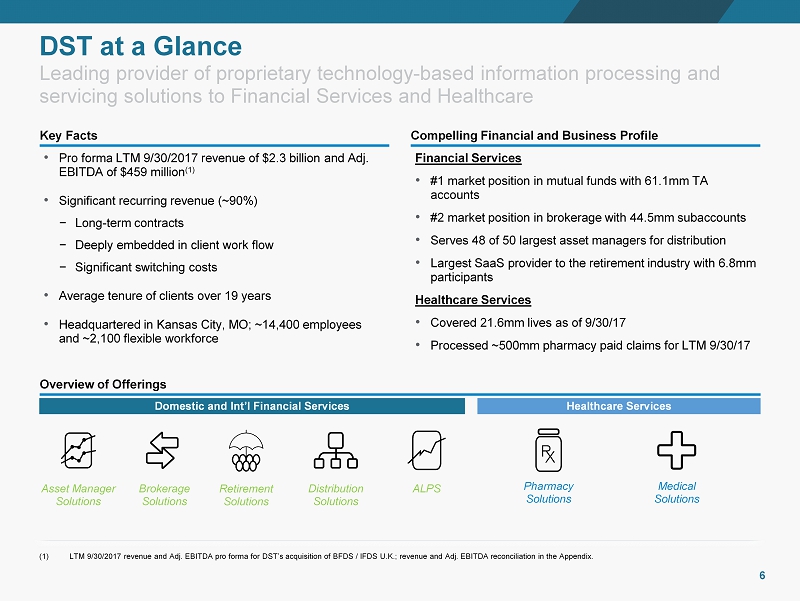
Chart sequence Accent 5 Accent 6 197 199 201 237 169 0 10 133 199 28 114 147 204 104 50 91 155 213 Accent 1 Accent 2 Accent 3 Accent 4 Txt \ L2 Primary Txt \ D1 Txt \ D2 Txt \ L1 230 230 230 0 0 0 255 255 255 0 0 0 DST at a Glance 6 Compelling Financial and Business Profile Overview of Offerings Key Facts Domestic and Int’l Financial Services Healthcare Services 0% 1% 2% 3% 4% 5% 6% 0 1 2 3 4 5 6 Mercury Venus Earth Mars Jupiter Saturn Uranus Neptune Pluto January March April February • Pro forma LTM 9/30/2017 revenue of $2.3 billion and Adj. EBITDA of $459 million (1) • Significant recurring revenue (~90%) − Long - term contracts − Deeply embedded in client work flow − Significant switching costs • Average tenure of clients over 19 years • Headquartered in Kansas City, MO; ~14,400 employees and ~2,100 flexible workforce Financial Services • #1 market position in mutual funds with 61.1mm TA accounts • #2 market position in brokerage with 44.5mm subaccounts • Serves 48 of 50 largest asset managers for distribution • Largest SaaS provider to the retirement industry with 6.8mm participants Healthcare Services • Covered 21.6mm lives as of 9/30/17 • Processed ~500mm pharmacy paid claims for LTM 9/30/17 Pharmacy Solutions Medical Solutions Asset Manager Solutions Brokerage Solutions Retirement Solutions ALPS Distribution Solutions Leading provider of proprietary technology - based information processing and servicing solutions to Financial Services and Healthcare (1) LTM 9/30/2017 revenue and Adj. EBITDA pro forma for DST’s acquisition of BFDS / IFDS U.K.; revenue and Adj. EBITDA reconciliation in the Appendix.
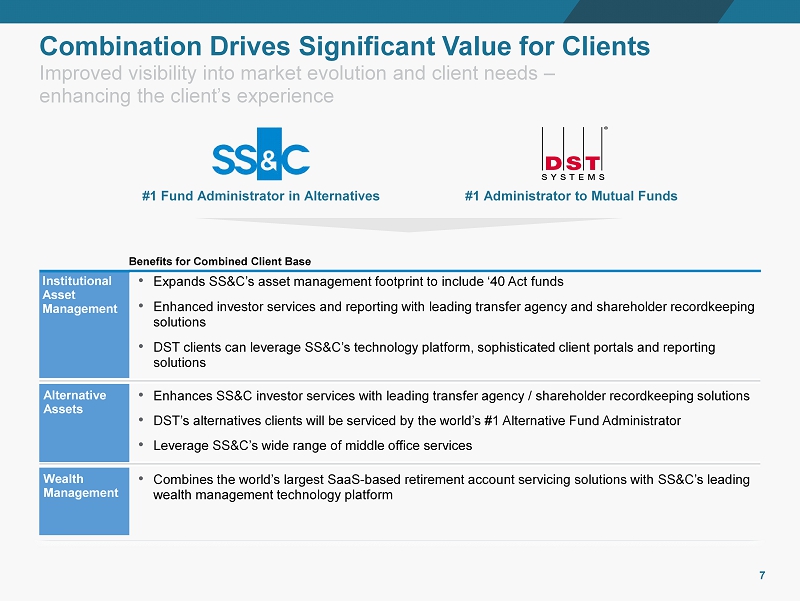
Chart sequence Accent 5 Accent 6 197 199 201 237 169 0 10 133 199 28 114 147 204 104 50 91 155 213 Accent 1 Accent 2 Accent 3 Accent 4 Txt \ L2 Primary Txt \ D1 Txt \ D2 Txt \ L1 230 230 230 0 0 0 255 255 255 0 0 0 Institutional Asset Management • Expands SS&C’s asset management footprint to include ‘40 Act funds • Enhanced investor services and reporting with leading transfer agency and shareholder recordkeeping solutions • DST clients can leverage SS&C’s technology platform, sophisticated client portals and reporting solutions Alternative Assets • Enhances SS&C investor services with leading transfer agency / shareholder recordkeeping solutions • DST’s alternatives clients will be serviced by the world’s #1 Alternative Fund Administrator • Leverage SS&C’s wide range of middle office services Wealth Management • Combines the world’s largest SaaS - based retirement account servicing solutions with SS&C’s leading wealth management technology platform Benefits for Combined Client Base 7 Combination Drives Significant Value for Clients Improved visibility into market evolution and client needs – enhancing the client’s experience #1 Administrator to Mutual Funds #1 Fund Administrator in Alternatives
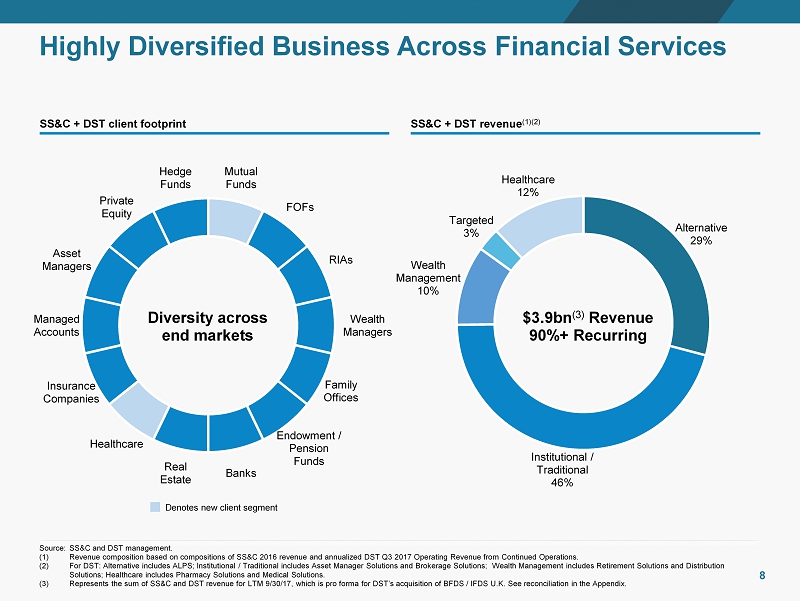
Chart sequence Accent 5 Accent 6 197 199 201 237 169 0 10 133 199 28 114 147 204 104 50 91 155 213 Accent 1 Accent 2 Accent 3 Accent 4 Txt \ L2 Primary Txt \ D1 Txt \ D2 Txt \ L1 230 230 230 0 0 0 255 255 255 0 0 0 Alternative 29% Institutional / Traditional 46% Wealth Management 10% Targeted 3% Healthcare 12% Mutual Funds FOFs RIAs Wealth Managers Family Offices Endowment / Pension Funds Banks Real Estate Healthcare Insurance Companies Managed Accounts Asset Managers Private Equity Hedge Funds Highly Diversified Business Across Financial Services 8 Source: SS&C and DST management. (1) Revenue composition based on compositions of SS&C 2016 revenue and annualized DST Q3 2017 Operating Revenue from Continued Operations. (2) For DST: Alternative includes ALPS; Institutional / Traditional includes Asset Manager Solutions and Brokerage Solutions; W ealth Management includes Retirement Solutions and Distribution Solutions; Healthcare includes Pharmacy Solutions and Medical Solutions. (3) Represents the sum of SS&C and DST revenue for LTM 9/30/17, which is pro forma for DST’s acquisition of BFDS / IFDS U.K . See reconciliation in the Appendix. SS&C + DST revenue (1)(2) SS&C + DST client footprint Diversity across end markets $3.9bn (3) Revenue 90%+ Recurring Denotes new client segment
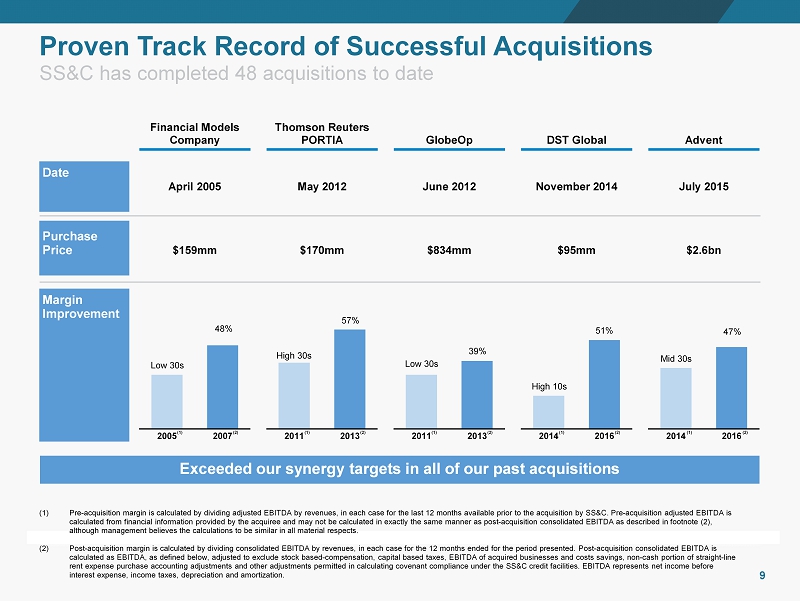
Chart sequence Accent 5 Accent 6 197 199 201 237 169 0 10 133 199 28 114 147 204 104 50 91 155 213 Accent 1 Accent 2 Accent 3 Accent 4 Txt \ L2 Primary Txt \ D1 Txt \ D2 Txt \ L1 230 230 230 0 0 0 255 255 255 0 0 0 SS&C has completed 48 acquisitions to date Proven Track Record of Successful Acquisitions 9 2005 2007 Date Acquisition Purchase Price Margin Improvement Exceeded our synergy targets in all of our past acquisitions 2011 2013 2011 2013 2014 2016 2014 2016 Financial Models Company Thomson Reuters PORTIA DST Global Advent GlobeOp Low 30s 48% High 30s 57% Low 30s 39% 51% High 10s April 2005 May 2012 June 2012 November 2014 July 2015 $159mm $170mm $834mm $95mm $2.6bn 47% Mid 30s (1) Pre - acquisition margin is calculated by dividing adjusted EBITDA by revenues, in each case for the last 12 months available prior to the acquisition by SS&C. Pre - acquisition adjusted EBITDA is calculated from financial information provided by the acquiree and may not be calculated in exactly the same manner as post - acqu isition consolidated EBITDA as described in footnote (2), although management believes the calculations to be similar in all material respects. (2 ) Post - acquisition margin is calculated by dividing consolidated EBITDA by revenues, in each case for the 12 months ended for the period present ed. Post - acquisition consolidated EBITDA is calculated as EBITDA, as defined below, adjusted to exclude stock based - compensation, capital based taxes, EBITDA of acquired bu sinesses and costs savings, non - cash portion of straight - line rent expense purchase accounting adjustments and other adjustments permitted in calculating covenant compliance under the SS& C c redit facilities. EBITDA represents net income before interest expense, income taxes, depreciation and amortization. (1) (2) (1) (2) (1) (2) (1) (2) (1) (2)
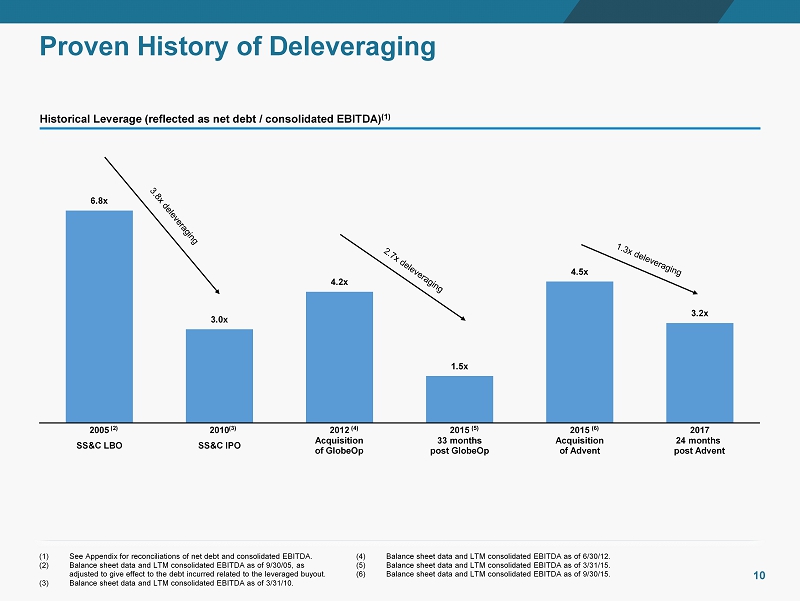
Chart sequence Accent 5 Accent 6 197 199 201 237 169 0 10 133 199 28 114 147 204 104 50 91 155 213 Accent 1 Accent 2 Accent 3 Accent 4 Txt \ L2 Primary Txt \ D1 Txt \ D2 Txt \ L1 230 230 230 0 0 0 255 255 255 0 0 0 6.8x 3.0x 4.2x 1.5x 4.5x 3.2x 2005 2010 2012 2015 2015 2017 Proven History of Deleveraging 10 (1) See Appendix for reconciliations of net debt and consolidated EBITDA. (2) Balance sheet data and LTM consolidated EBITDA as of 9/30/05, as adjusted to give effect to the debt incurred related to the leveraged buyout. (3) Balance sheet data and LTM consolidated EBITDA as of 3/31/10. (4) Balance sheet data and LTM consolidated EBITDA as of 6/30/12 . ( 5 ) Balance sheet data and LTM consolidated EBITDA as of 3/31/15. (6) Balance sheet data and LTM consolidated EBITDA as of 9/30/15 . (2) (4) (5) (6) (3) Historical Leverage (reflected as net debt / consolidated EBITDA ) (1) SS&C LBO SS&C IPO Acquisition of GlobeOp 33 months post GlobeOp 24 months post Advent Acquisition of Advent
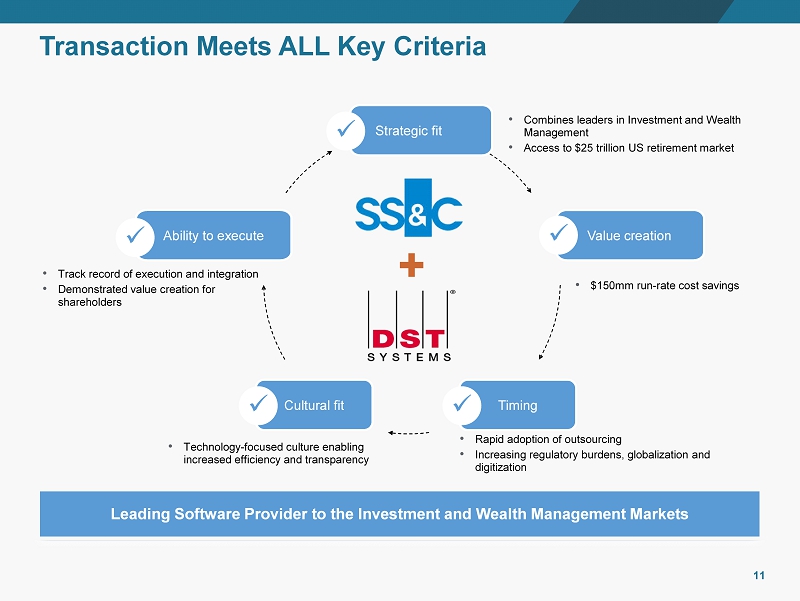
Chart sequence Accent 5 Accent 6 197 199 201 237 169 0 10 133 199 28 114 147 204 104 50 91 155 213 Accent 1 Accent 2 Accent 3 Accent 4 Txt \ L2 Primary Txt \ D1 Txt \ D2 Txt \ L1 230 230 230 0 0 0 255 255 255 0 0 0 Transaction Meets ALL K ey C riteria 11 Strategic fit x Value creation x Timing x Ability to execute x Cultural fit x • Combines leaders in Investment and Wealth Management • Access to $25 trillion US retirement market • $150mm run - rate cost savings • Rapid adoption of outsourcing • Increasing regulatory burdens, globalization and digitization • Technology - focused culture enabling increased efficiency and transparency • Track record of execution and integration • Demonstrated value creation for shareholders Leading Software Provider to the Investment and Wealth Management Markets

Appendix
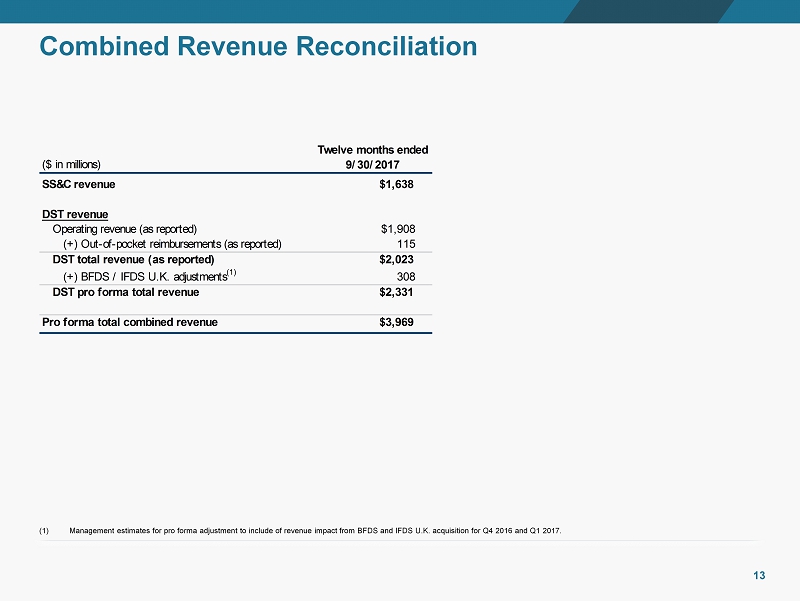
Chart sequence Accent 5 Accent 6 197 199 201 237 169 0 10 133 199 28 114 147 204 104 50 91 155 213 Accent 1 Accent 2 Accent 3 Accent 4 Txt \ L2 Primary Txt \ D1 Txt \ D2 Txt \ L1 230 230 230 0 0 0 255 255 255 0 0 0 Combined Revenue Reconciliation 13 Twelve months ended ($ in millions) 9/30/2017 SS&C revenue $1,638 DST revenue Operating revenue (as reported) $1,908 (+) Out-of-pocket reimbursements (as reported) 115 DST total revenue (as reported) $2,023 (+) BFDS / IFDS U.K. adjustments (1) 308 DST pro forma total revenue $2,331 Pro forma total combined revenue $3,969 (1) Management estimates for pro forma adjustment to include of revenue impact from BFDS and IFDS U.K. acquisition for Q4 2016 and Q1 2017.
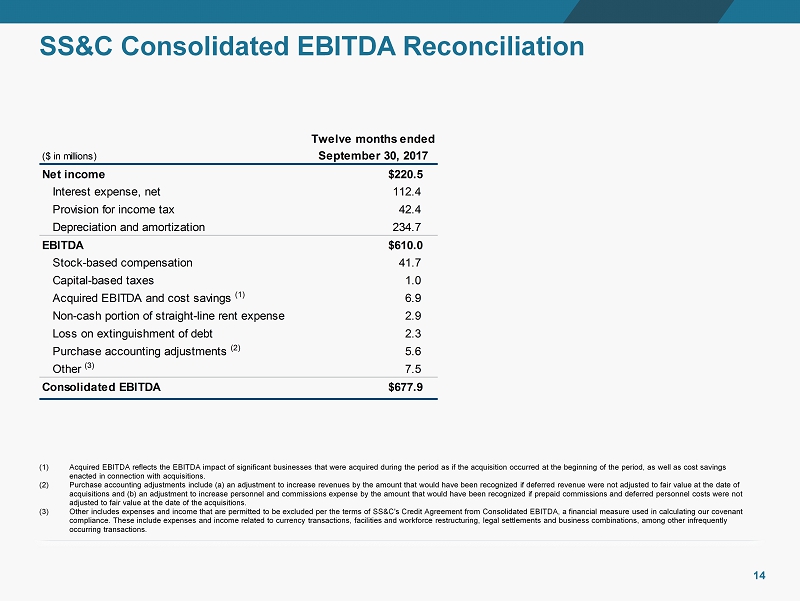
Chart sequence Accent 5 Accent 6 197 199 201 237 169 0 10 133 199 28 114 147 204 104 50 91 155 213 Accent 1 Accent 2 Accent 3 Accent 4 Txt \ L2 Primary Txt \ D1 Txt \ D2 Txt \ L1 230 230 230 0 0 0 255 255 255 0 0 0 SS&C Consolidated EBITDA Reconciliation 14 Twelve months ended ($ in millions) September 30, 2017 Net income $220.5 Interest expense, net 112.4 Provision for income tax 42.4 Depreciation and amortization 234.7 EBITDA $610.0 Stock-based compensation 41.7 Capital-based taxes 1.0 Acquired EBITDA and cost savings (1) 6.9 Non-cash portion of straight-line rent expense 2.9 Loss on extinguishment of debt 2.3 Purchase accounting adjustments (2) 5.6 Other (3) 7.5 Consolidated EBITDA $677.9 (1) Acquired EBITDA reflects the EBITDA impact of significant businesses that were acquired during the period as if the acquisiti on occurred at the beginning of the period, as well as cost savings enacted in connection with acquisitions . (2) Purchase accounting adjustments include (a) an adjustment to increase revenues by the amount that would have been recognized if deferred revenue were not adjusted to fair value at the date of acquisitions and (b) an adjustment to increase personnel and commissions expense by the amount that would have been recognized i f prepaid commissions and deferred personnel costs were not adjusted to fair value at the date of the acquisitions . (3) Other includes expenses and income that are permitted to be excluded per the terms of SS&C's Credit Agreement from Consolidat ed EBITDA, a financial measure used in calculating our covenant compliance. These include expenses and income related to currency transactions, facilities and workforce restructuring, legal se ttlements and business combinations, among other infrequently occurring transactions.
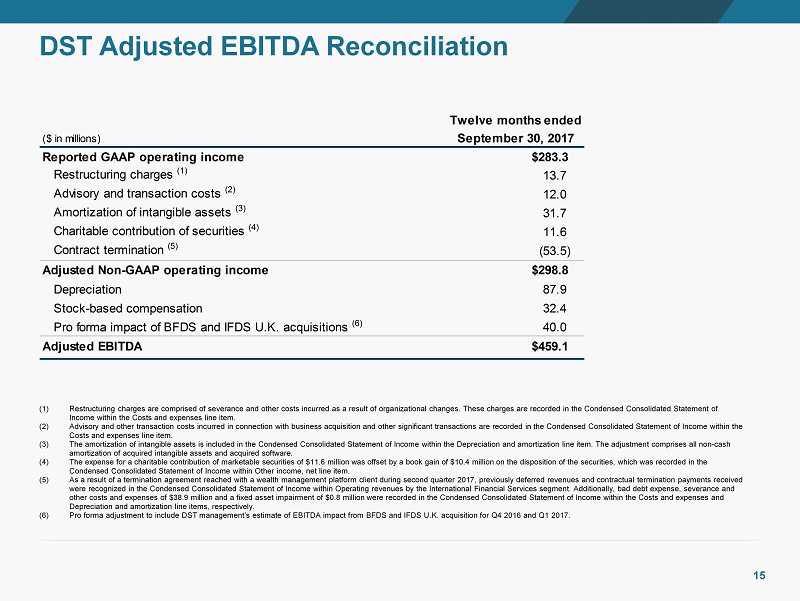
Chart sequence Accent 5 Accent 6 197 199 201 237 169 0 10 133 199 28 114 147 204 104 50 91 155 213 Accent 1 Accent 2 Accent 3 Accent 4 Txt \ L2 Primary Txt \ D1 Txt \ D2 Txt \ L1 230 230 230 0 0 0 255 255 255 0 0 0 DST Adjusted EBITDA Reconciliation 15 Twelve months ended ($ in millions) September 30, 2017 Reported GAAP operating income $283.3 Restructuring charges (1) 13.7 Advisory and transaction costs (2) 12.0 Amortization of intangible assets (3) 31.7 Charitable contribution of securities (4) 11.6 Contract termination (5) (53.5) Adjusted Non-GAAP operating income $298.8 Depreciation 87.9 Stock-based compensation 32.4 Pro forma impact of BFDS and IFDS U.K. acquisitions (6) 40.0 Adjusted EBITDA $459.1 (1) Restructuring charges are comprised of severance and other costs incurred as a result of organizational changes. These charge s are recorded in the Condensed Consolidated Statement of Income within the Costs and expenses line item. (2) Advisory and other transaction costs incurred in connection with business acquisition and other significant transactions are re corded in the Condensed Consolidated Statement of Income within the Costs and expenses line item . (3) The amortization of intangible assets is included in the Condensed Consolidated Statement of Income within the Depreciation a nd amortization line item. The adjustment comprises all non - cash amortization of acquired intangible assets and acquired software . (4) The expense for a charitable contribution of marketable securities of $11.6 million was offset by a book gain of $10.4 millio n on the disposition of the securities, which was recorded in the Condensed Consolidated Statement of Income within Other income, net line item . (5) As a result of a termination agreement reached with a wealth management platform client during second quarter 2017, previousl y deferred revenues and contractual termination payments received were recognized in the Condensed Consolidated Statement of Income within Operating revenues by the International Financial Se rvi ces segment. Additionally, bad debt expense, severance and other costs and expenses of $38.9 million and a fixed asset impairment of $0.8 million were recorded in the Condensed Consoli dat ed Statement of Income within the Costs and expenses and Depreciation and amortization line items, respectively . (6) Pro forma adjustment to include DST management’s estimate of EBITDA impact from BFDS and IFDS U.K. acquisition for Q4 2016 a nd Q1 2017.
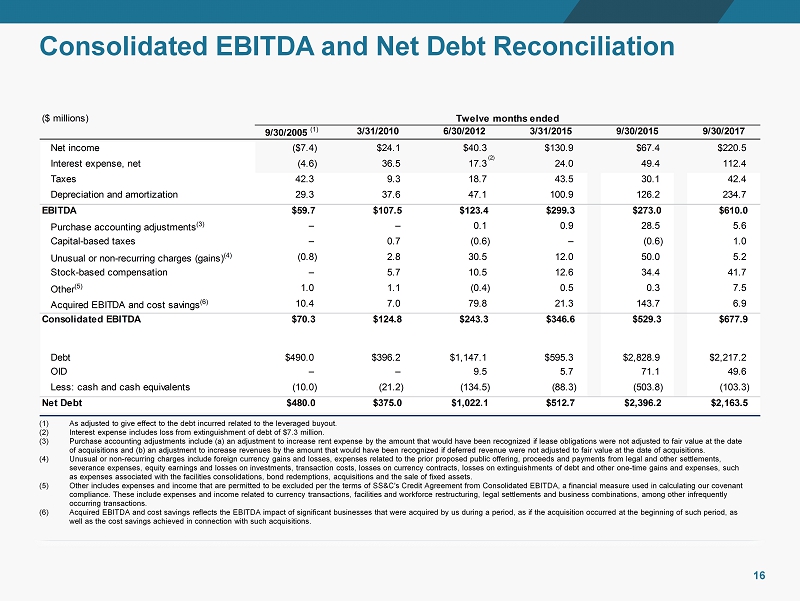
Chart sequence Accent 5 Accent 6 197 199 201 237 169 0 10 133 199 28 114 147 204 104 50 91 155 213 Accent 1 Accent 2 Accent 3 Accent 4 Txt \ L2 Primary Txt \ D1 Txt \ D2 Txt \ L1 230 230 230 0 0 0 255 255 255 0 0 0 Consolidated EBITDA and Net Debt Reconciliation 16 (1) As adjusted to give effect to the debt incurred related to the leveraged buyout. (2) Interest expense includes loss from extinguishment of debt of $7.3 million. (3) Purchase accounting adjustments include (a) an adjustment to increase rent expense by the amount that would have been recognized if le ase obligations were not adjusted to fair value at the date of acquisitions and (b) an adjustment to increase revenues by the amount that would have been recognized if deferred revenue wer e not adjusted to fair value at the date of acquisitions. (4) Unusual or non - recurring charges include foreign currency gains and losses, expenses related to the prior proposed public offering, proc eeds and payments from legal and other settlements, severance expenses, equity earnings and losses on investments, transaction costs, losses on currency contracts, losses on ext ing uishments of debt and other one - time gains and expenses, such as expenses associated with the facilities consolidations, bond redemptions, acquisitions and the sale of fixed assets. (5) Other includes expenses and income that are permitted to be excluded per the terms of SS&C's Credit Agreement from Consolidat ed EBITDA, a financial measure used in calculating our covenant compliance. These include expenses and income related to currency transactions, facilities and workforce restructuring, legal se ttlements and business combinations, among other infrequently occurring transactions. (6) Acquired EBITDA and cost savings reflects the EBITDA impact of significant businesses that were acquired by us during a period, as if the acquisition occurred at the beginning of such period, as well as the cost savings achieved in connection with such acquisitions. ($ millions) Twelve months ended 9/30/2005 (1) 3/31/2010 6/30/2012 3/31/2015 9/30/2015 9/30/2017 Net income ($7.4) $24.1 $40.3 $130.9 $67.4 $220.5 Interest expense, net (4.6) 36.5 17.3 24.0 49.4 112.4 Taxes 42.3 9.3 18.7 43.5 30.1 42.4 Depreciation and amortization 29.3 37.6 47.1 100.9 126.2 234.7 EBITDA $59.7 $107.5 $123.4 $299.3 $273.0 $610.0 Purchase accounting adjustments (3) – – 0.1 0.9 28.5 5.6 Capital-based taxes – 0.7 (0.6) – (0.6) 1.0 Unusual or non-recurring charges (gains) (4) (0.8) 2.8 30.5 12.0 50.0 5.2 Stock-based compensation – 5.7 10.5 12.6 34.4 41.7 Other (5) 1.0 1.1 (0.4) 0.5 0.3 7.5 Acquired EBITDA and cost savings (6) 10.4 7.0 79.8 21.3 143.7 6.9 Consolidated EBITDA $70.3 $124.8 $243.3 $346.6 $529.3 $677.9 Debt $490.0 $396.2 $1,147.1 $595.3 $2,828.9 $2,217.2 OID – – 9.5 5.7 71.1 49.6 Less: cash and cash equivalents (10.0) (21.2) (134.5) (88.3) (503.8) (103.3) Net Debt $480.0 $375.0 $1,022.1 $512.7 $2,396.2 $2,163.5 (2)