Attached files
| file | filename |
|---|---|
| 8-K - 8-K - BLUEGREEN VACATIONS CORP | bxg-20180111x8k.htm |

BBX Capital bluegreen vacations Investor Luncheon January 12, 2018

Forward Looking Statements This presentation contains forward-looking statements based largely on current expectations of BBX Capital (“the Company”) or its subsidiaries, including Bluegreen Vacations, that involve a number of risks and uncertainties. All opinions, forecasts, projections, future plans or other statements, other than statements of historical fact, are forward-looking statements. Forward looking statements can be identified by the use of words or phrases such as "plans," "believes," "will," "expects," "anticipates," "intends," "estimates," "our view," "we see," "would" and words and phrases of similar meaning. The forward-looking statements in this presentation are also forward-looking statements within the meaning of Section 27A of the Securities Act of 1933, as amended, and Section 21E of the Securities Exchange Act of 1934, as amended, and involve substantial risks and uncertainties that are subject to change based on factors which are, in many instances, beyond our control. We can give no assurance that such expectations will prove to have been correct. Actual results, performance, or achievements could differ materially from those contemplated, expressed, or implied by the forward-looking statements contained herein. When considering forward-looking statements, you should keep in mind the risks, uncertainties and other cautionary statements made in this presentation. You should not place undue reliance on any forward-looking statement, which speaks only as of the date made. This presentation also contains information regarding the past performance of the Company, its subsidiaries and their respective investments and operations, and you should note that prior or current performance is not a guarantee or indication of future performance, and not all past activities or investments are described, some of which were not successful or resulted in losses. Some factors which may affect the accuracy of the forward-looking statements apply generally to the industries in which the Company operates, including the development, operation, management and investment in residential and commercial real estate, the resort development and vacation ownership industries in which Bluegreen operates, the home improvement industry in which Renin operates, the confectionary industry in which BBX Sweet Holdings and IT’SUGAR operate, and the pizza franchise industry in which the Company has recently commenced activities. Risks and uncertainties include, without limitation, risks associated with the ability to successfully implement currently anticipated plans and generate earnings, long term growth, and increased shareholder value, book value, and/or intrinsic value; the performance of entities in which BBX Capital has made investments may not be profitable or perform as anticipated; BBX Capital is dependent upon dividends from its subsidiaries, principally Bluegreen, to fund its operations; BBX Capital's subsidiaries may not be in a position to pay dividends, dividend payments may be subject to certain restrictions, including restrictions contained in debt instruments , and may be subject to declaration by such subsidiary's board of directors or managers; the risks relating to acquisitions, including acquisitions in diverse industries, integration risks, risks regarding achieving profitability, foreign currency transaction risk, and goodwill and other intangible impairment risks; risks relating to the monetization of BBX Capital's legacy assets; and risks related to litigation and other legal proceedings involving BBX Capital and its subsidiaries. The Company's investment in Bluegreen exposes the Company to risks of Bluegreen's business and its ability to pay dividends to BBX Capital, and risks inherent in the vacation ownership industry, including the risk that Bluegreen's marketing expenses will increase; the risk that Bluegreen’s capital-light business activities or other operations may not be successful because of changes in economic conditions or otherwise, the risk that Bluegreen may not be successful in competing against larger hospitality branded affiliated companies, the risk its marketing alliances with Bass Pro Shops and Choice Hotels may not be a s successful or grow as anticipated and the risk that Bluegreen's strategy to grow profitability and increase long-term value may not be realized as anticipated, if at all. In addition, with respect to BBX Capital's Real Estate and Middle Market Division, the risks and uncertainties include risks relating to the real estate market and real estate development, the risk that joint venture partners may not fulfill their obligations and the projects may not be developed as anticipated or be profitable, and contractual commitments may not be completed on the terms provided or at all; risks related to increases in the availability and cost of chocolate and other confections; risks relating to the acquisition of IT’SUGAR, including the risk that the revenue anticipated to be generated by its operations will not be achieved, that net income may not be generated when anticipated or at all, and that the transaction may not be advantageous and the Company may not realize the anticipated benefits of the acquisition; and risks related to our pizza franchise operations, including that stores may not be opened when or in the number anticipated, stores opened may not operate profitably, and the Company’s pizza franchise activities may not be successful. Additional risks and uncertainties are described in BBX Capital's Quarterly Report on Form 10-Q for the quarter ended September 30, 2017and Annual Report on Form 10-K for the year ended December 31, 2016, and are available to view on the SEC's website, www.sec.gov; on BBX Capital's website, www.BBXCapital.com; and Bluegreen information is available on Bluegreen Vacations’ website, www.bluegreenvacations.com. BBX Capital cautions that the foregoing factors are not exclusive, and we do not undertake, and specifically disclaim any obligation, to update or supplement any forward-looking statements whether as a result of changes in circumstances, new information, subsequent events or otherwise.
Welcome & Introductions Alan B. Levan BBX Capital Chairman and Chief Executive Officer Bluegreen Vacations Chairman 2
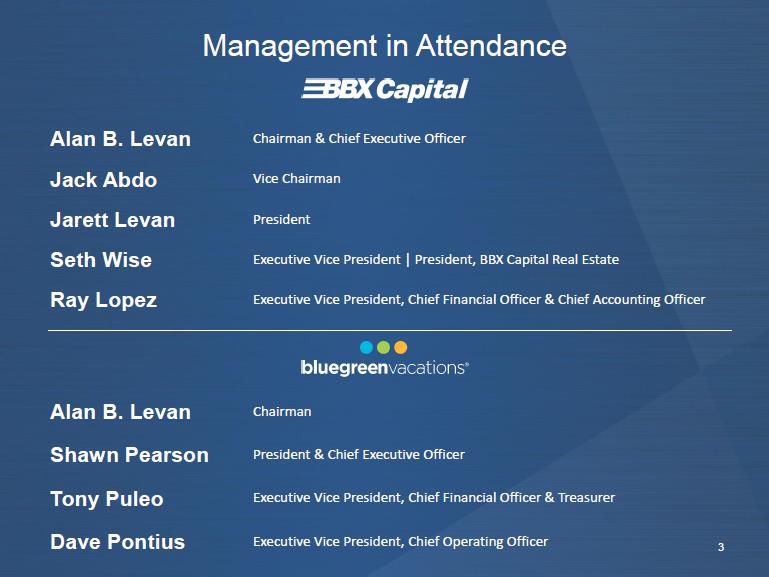
Management in Attendance BBX Capital Alan B. Levan Chairman & Chief Executive Officer Jack Abdo Vice Chairman Jarett Levan President Seth Wise Executive Vice President | President, BBX Capital Real Estate Ray Lopez Executive Vice President, Chief Financial Officer & Chief Accounting Officer bluegreen vacations Alan B. Levan Chairman Shawn Pearson President & Chief Executive Officer Tony Puleo Executive Vice President, Chief Financial Officer & Treasurer Dave Pontius Executive Vice President, Chief Operating Officer 3
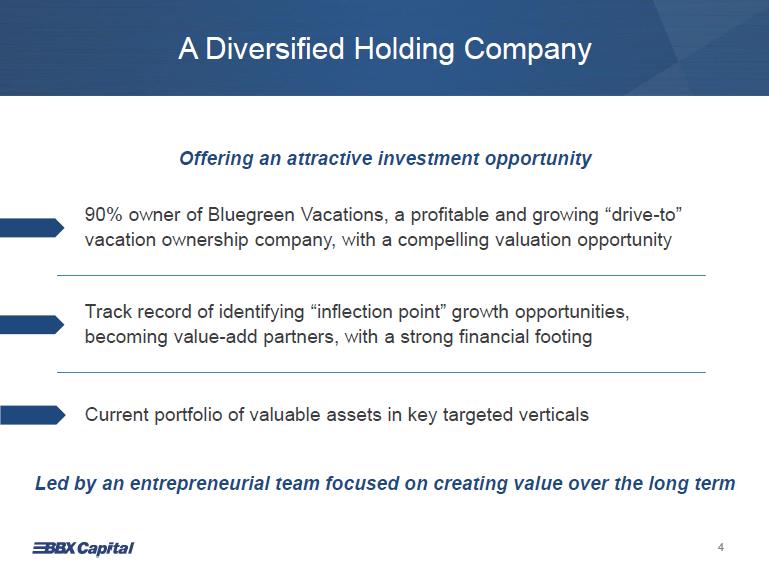
A Diversified Holding Company Offering an attractive investment opportunity 90% owner of Bluegreen Vacations, a profitable and growing “drive-to” vacation ownership company, with a compelling valuation opportunity Track record of identifying “inflection point” growth opportunities, becoming value-add partners, with a strong financial footing Current portfolio of valuable assets in key targeted verticals Led by an entrepreneurial team focused on creating value over the long term 4
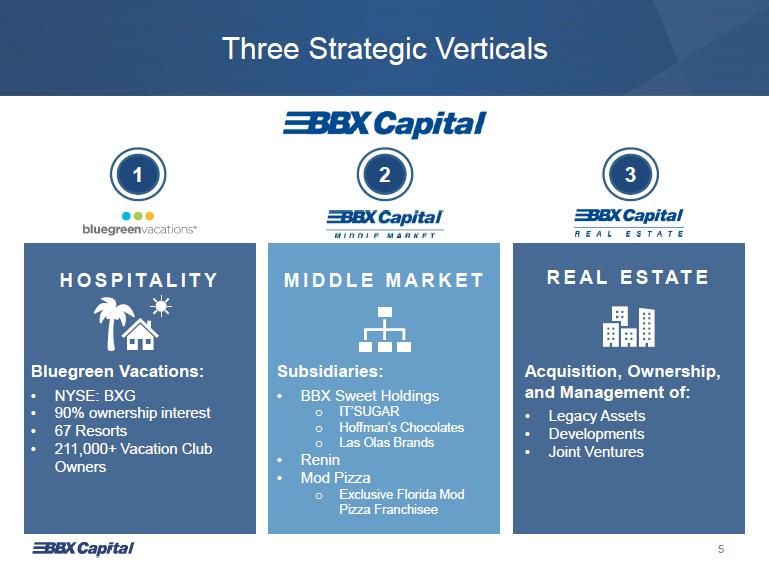
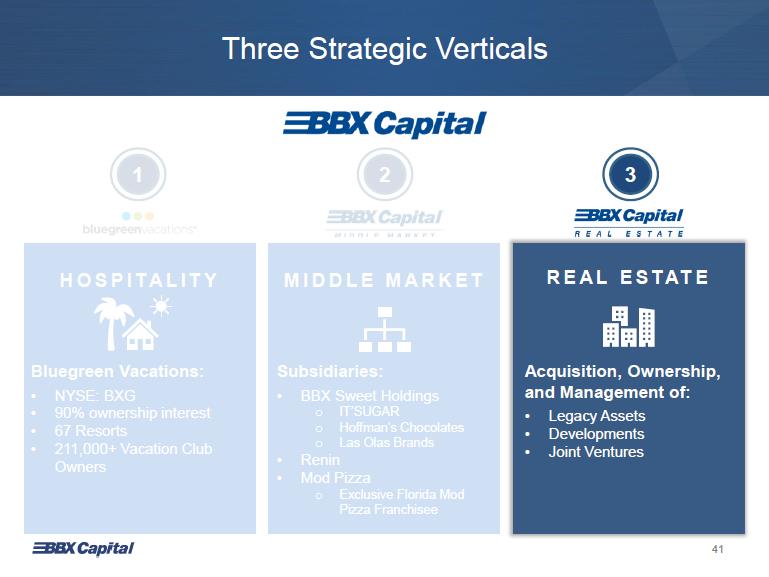
Three Strategic Verticals bluegreen vacations HOSPITALITY Bluegreen Vacations: • NYSE: BXG • 90% ownership interest • 67 Resorts • 211,000+ Vacation Club Owners BBX Capital MIDDLE MARKET Subsidiaries: • BBX Sweet Holdings o IT’SUGAR o Hoffman’s Chocolates o Las Olas Brands • Renin • Mod Pizza o Exclusive Florida Mod Pizza Franchisee BBX Capital REAL ESTATE REAL ESTATE Acquisition, Ownership, and Management of: • Legacy Assets • Developments • Joint Ventures 5
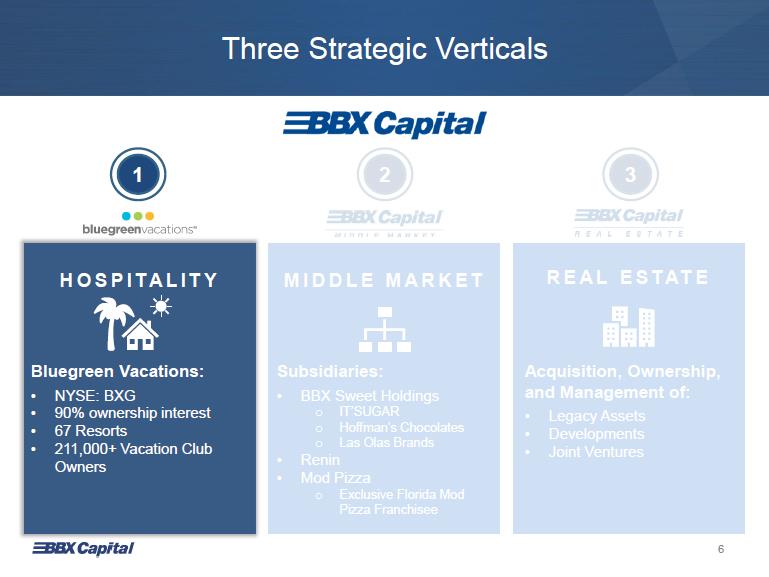
Three Strategic Verticals bluegreen vacations HOSPITALITY Bluegreen Vacations: • NYSE: BXG • 90% ownership interest • 67 Resorts • 211,000+ Vacation Club Owners BBX Capital MIDDLE MARKET Subsidiaries: • BBX Sweet Holdings o IT’SUGAR o Hoffman’s Chocolates o Las Olas Brands • Renin • Mod Pizza o Exclusive Florida Mod Pizza Franchisee BBX Capital REAL ESTATE REAL ESTATE Acquisition, Ownership, and Management of: • Legacy Assets • Developments • Joint Ventures 6

bluegreenvacations Please welcome, Shawn Pearson, President and Chief Executive Officer 7
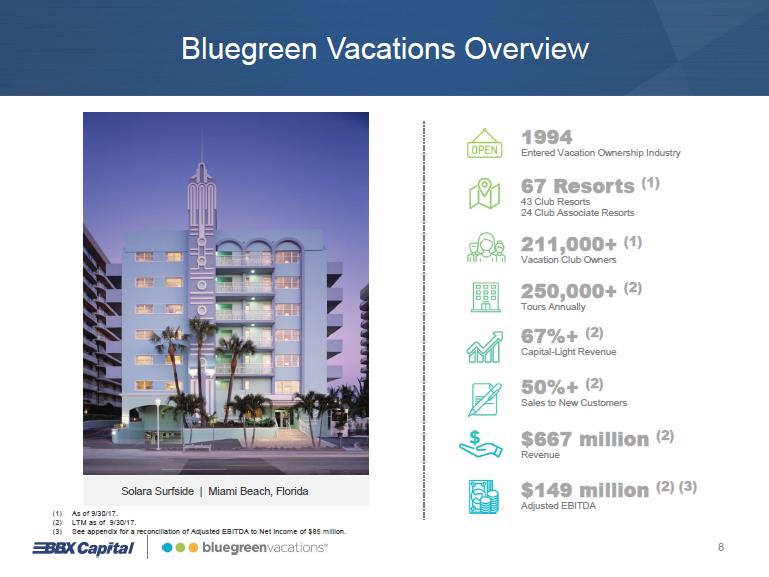
Bluegreen Vacations Overview Solara Surfside | Miami Beach, Florida (1) As of 9/30/17. (2) LTM as of 9/30/17. (3) See appendix for a reconciliation of Adjusted EBITDA to Net Income of $85 million. 1994 Entered Vacation Ownership Industry 67 Resorts (1) 43 Club Resorts 24 Club Associate Resorts 211,000+ (1) Vacation Club Owners 250,000+(2) Tours Annually 67%+ (2) Capital-Light Revenue 50%+ (2) Sales to New Customers $667 million (2) Revenue $149 million (2) (3) Adjusted EBITDA 8
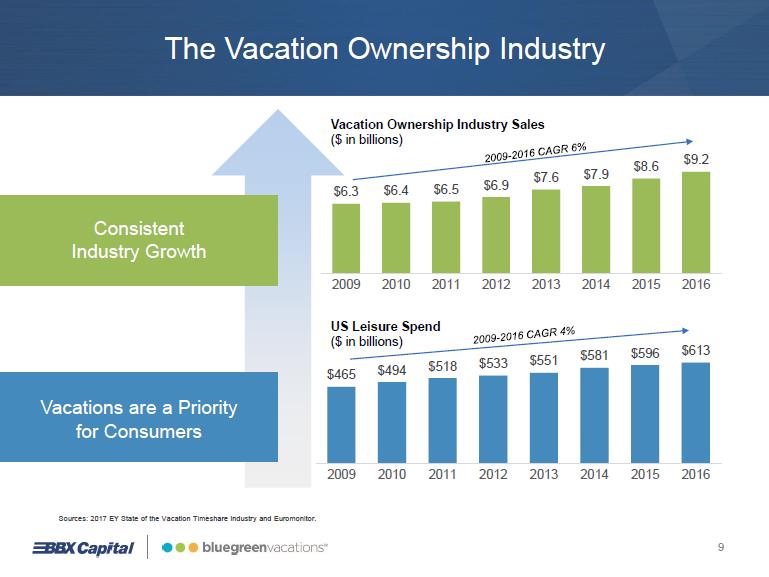
The Vacation Ownership Industry Consistent Industry Growth Vacations are a Priority for Consumers
Vacation Ownership Industry Sales ($ in billions) 2009 - 2016 CAGR 6% $6.3 $6.4 $6.5 $6.9 $7.6 $7.9 $8.6 $9.2 2009 2010 2011 2012 2013 2014 2015 2016 US Leisure Spend ($ in billions) 2009 - 2016 CAGR 4% $465 $494 $518 $533 $551 $581 $596 $613 2009 2010 2011 2012 2013 2014 2015 2016 Sources: 2017 EY State of the Vacation Timeshare Industry and Euromonitor. 9
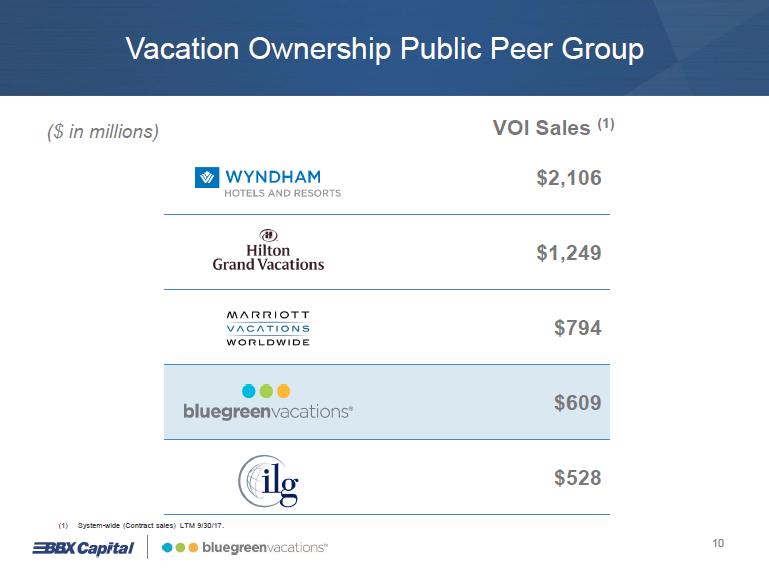
Vacation Ownership Public Peer Group ($ in millions) VOI Sales (1) WYNDHAM HOTELS AND RESORTS $2,106
Hilton Grand Vacations $1,249 MARRIOTT VACATIONS WORLDWIDE $794 bluegreen vacations $609 ilg $528 (1) System-wide (Contract sales) LTM 9/30/17. 10
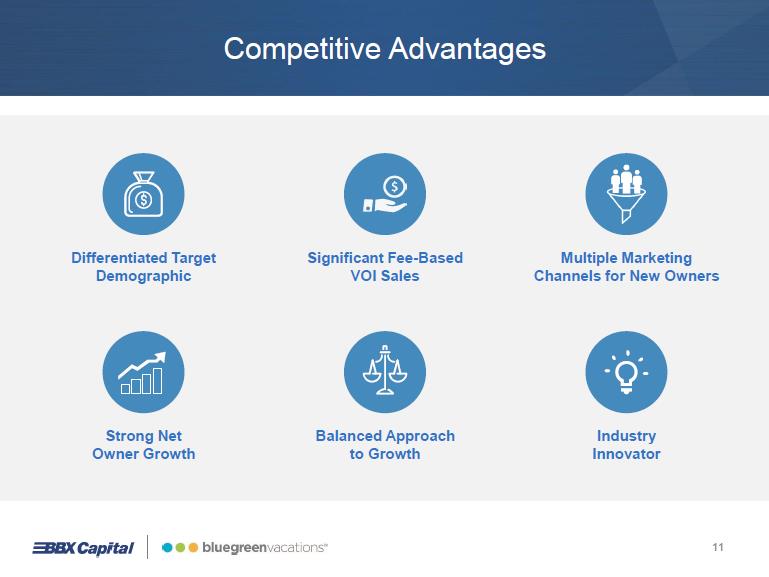
Competitive Advantages Differentiated Target Demographic Significant Fee-Based VOI Sales Multiple Marketing Channels for New Owners Strong Net Owner Growth Balanced Approach to Growth Industry Innovator 11
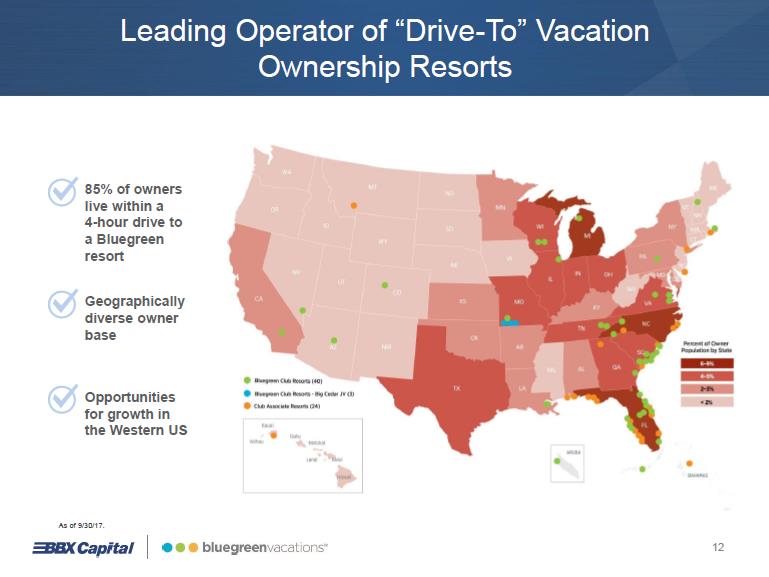
Leading Operator of “Drive-To” Vacation Ownership Resorts 85% of owners live within a 4-hour drive to a Bluegreen resort Geographically diverse owner base Opportunities for growth in the Western US As of 9/30/17. Bluegreen Club Resorts (40) Bluegreen Club Resorts – Big Cedar JV (3) Club Associate Resorts (24) Percent of Owner Population by State 6-9% 4-5% 2-3% < 2%
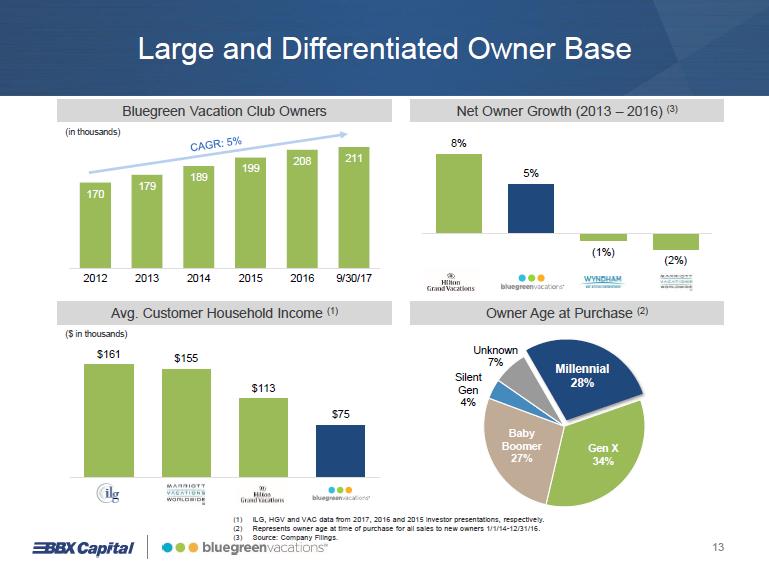
Large and Differentiated Owner Base Bluegreen Vacation Club Owners (in thousands) CAGR: 5% 170 179 189 199 208 211 2012 2013 2014 2015 2016 9/30/17 Net Owner Growth (2013 – 2016) (3) 8% 5% (1%) (2%) Avg. Customer Household Income (1) ($ in thousands) $161 $155 $113 $75 Owner Age at Purchase (2) Millennial 28% Gen X 34% Baby Boomer 27% Silent Gen 4% Unknown 7% (1) ILG, HGV and VAC data from 2017, 2016 and 2015 investor presentations, respectively. (2) Represents owner age at time of purchase for all sales to new owners 1/1/14 - 12/31/16. (3) Source: Company Filings. 13
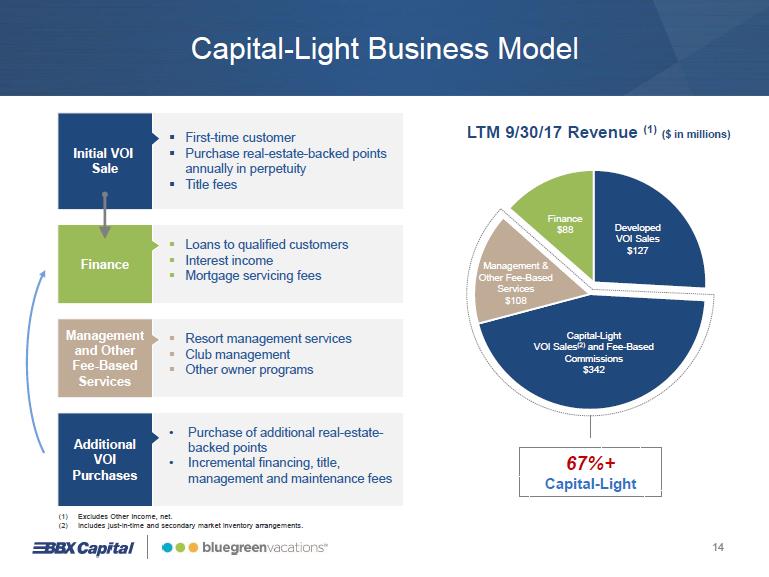
Capital-Light Business Model Initial VOI Sale . First-time customer . Purchase real-estate-backed points annually in perpetuity .Title fees Finance . Loans to qualified customers . Interest income . Mortgage servicing fees Management and Other Fee-Based Services . Resort management services . Club management . Other owner programs Additional VOI Purchases • Purchase of additional real-estate-backed points • Incremental financing, title, management and maintenance fees (1) Excludes Other Income, net. (2) Includes just-in-time and secondary market inventory arrangements. LTM 9/30/17 Revenue (1) ($ in millions) Finance $88 Developed VOI Sales $127 Management & Other Fee-Based Services $108 Capital-Light VOI Sales (2) and Fee-Based Commissions $342 67%+ Capital-Light 14
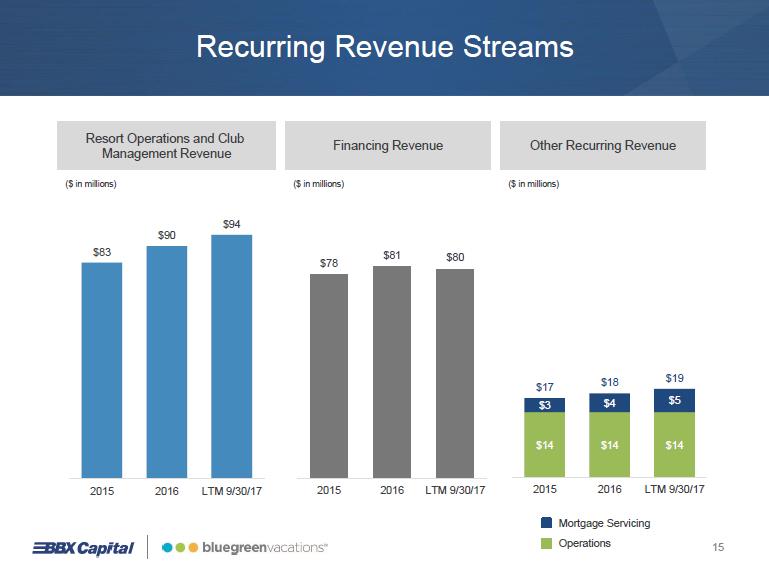
Recurring Revenue Streams Resort Operations and Club Management Revenue ($ in millions) $83 $90 $94 2015 2016 LTM 9/30/17 Financing Revenue ($ in millions) $78 $81 $80 2015 2016 LTM 9/30/17 Other Recurring Revenue ($ in millions) $14 $14 $14 $3 $4 $5 $17 $18 $19 2015 2016 LTM 9/30/17 Mortgage Servicing Operations 15
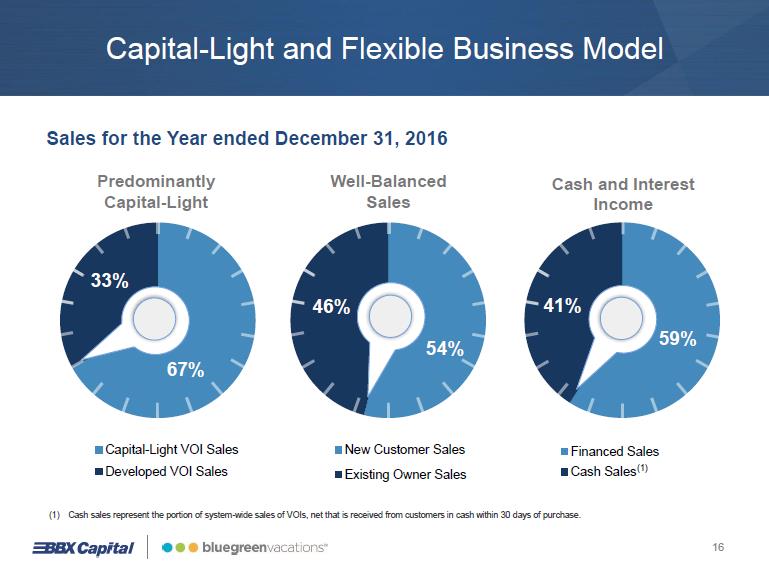
Capital-Light and Flexible Business Model Sales for the Year ended December 31, 2016 Predominantly Capital-Light 67% 33% Capital-Light VOI Sales Developed VOI Sales Well-Balanced Sales 54% 46% New Customer Sales Existing Owner Sales Cash and Interest Income 59% 41% Financed Sales Cash Sales (1) (1) Cash sales represent the portion of system-wide sales of VOIs, net that is received from customers in cash within 30 days of purchase. 16
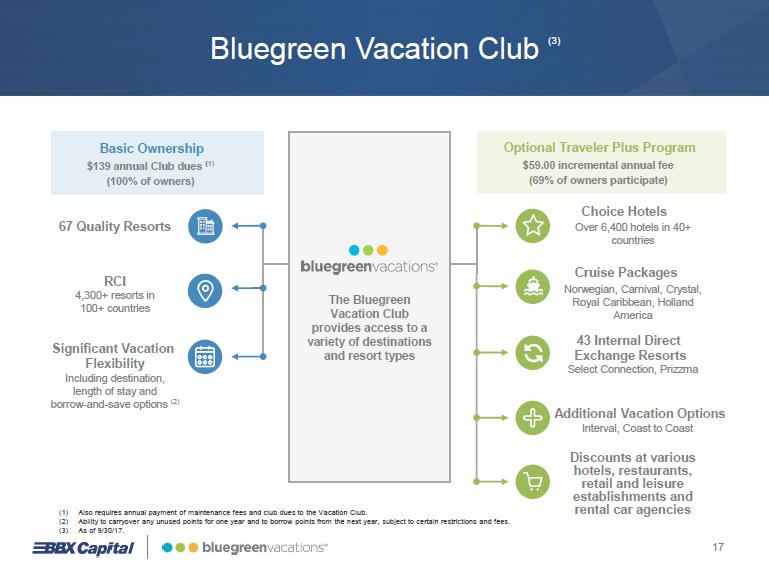
Bluegreen Vacation Club (3) Basic Ownership $139 annual Club dues ( 1) (100% of owners) 67 Quality Resorts RCI 4,300+ resorts in 100+ countries Significant Vacation Flexibility Including destination, length of stay and borrow-and -save options (2) bluegreen vacations The Bluegreen Vacation Club provides access to a variety of destinations and resort types Optional Traveler Plus Program $59.00 incremental annual fee (69% of owners participate) Choice Hotels Over 6,400 hotels in 40+ countries Cruise Packages Norwegian, Carnival, Crystal, Royal Caribbean, Holland America 43 Internal Direct Exchange Resorts Select Connection, Prizzma Additional Vacation Options Interval, Coast to Coast Discounts at various hotels, restaurants, retail and leisure establishments and rental car agencies (1) Also requires annual payment of maintenance fees and club dues to the Vacation Club. (2) Ability to carryover any unused points for one year and to borrow points from the next year, subject to certain restrictions and fees. (3) As of 9/30/17. 17

Vacation Package Marketing Process (1) 1 Package Sales Vacation Packages >260,000 2 Activation Campaign Management >7 million Emails 3 Reservation, Activation & Confirmation >900,000 Inbound Calls and more than 475,000 Outbound calls 4 Preview Centers >144,000 Previews 5 VOI Sales Over $300 million (1) Year ended December 31, 2016. 18
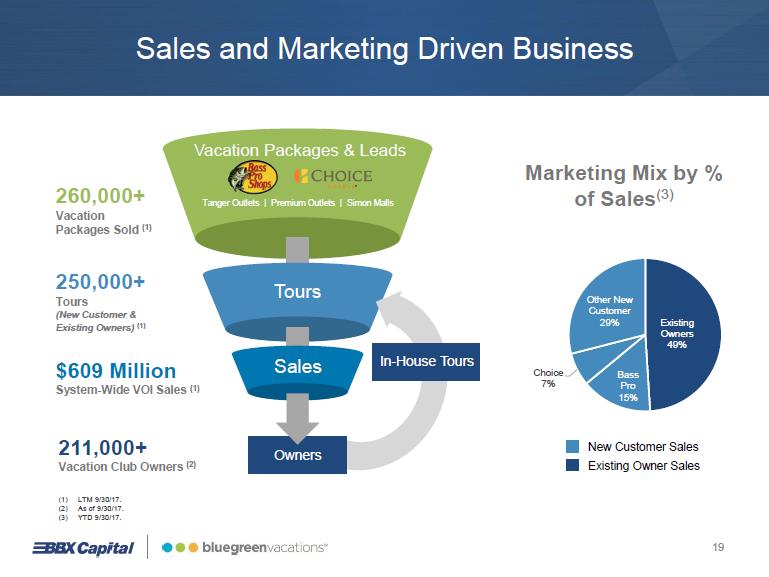
Sales and Marketing Driven Business Vacation Packages & Leads Tanger Outlets | Premium Outlets | Simon Malls Tours Sales In -House Tours Owners 260,000+ Vacation Packages Sold (1) 250,000+ Tours (New Customer & Existing Owners) (1) $609 Million System -Wide VOI Sales (1) 211,000+ Vacation Club Owners (2) Marketing Mix by % of Sales (3) New Customer Sales Existing Owner Sales Other New Customer 29% Existing Owners 49% Bass Pro 15% Choice 7% (1) LTM 9/30/17. (2) As of 9/30/17. (3) YTD 9/30/17. 19
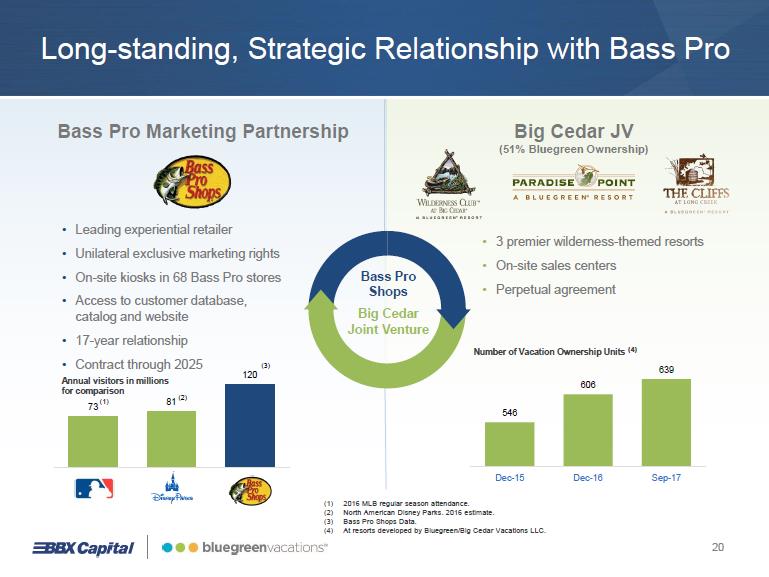
Long -standing, Strategic Relationship with Bass Pro Bass Pro Shops Big Cedar Joint Venture Bass Pro Marketing Partnership • Leading experiential retailer • Unilateral exclusive marketing rights • On-site kiosks in 68 Bass Pro stores • Access to customer database, catalog and website • 17-year relationship • Contract through 2025 Annual visitors in millions for comparison 73 (1) 81 (2) 120 (3) Big Cedar JV (51% Bluegreen Ownership) • 3 premier wilderness -themed resorts • On-site sales centers • Perpetual agreement Number of Vacation Ownership Units (4) 546 606 639 Dec-15 Dec-16 Sep-17 (1) 2016 MLB regular season attendance. (2) North American Disney Parks. 2016 estimate. (3) Bass Pro Shops Data. (4) At resorts developed by Bluegreen/Big Cedar Vacations LLC. 20
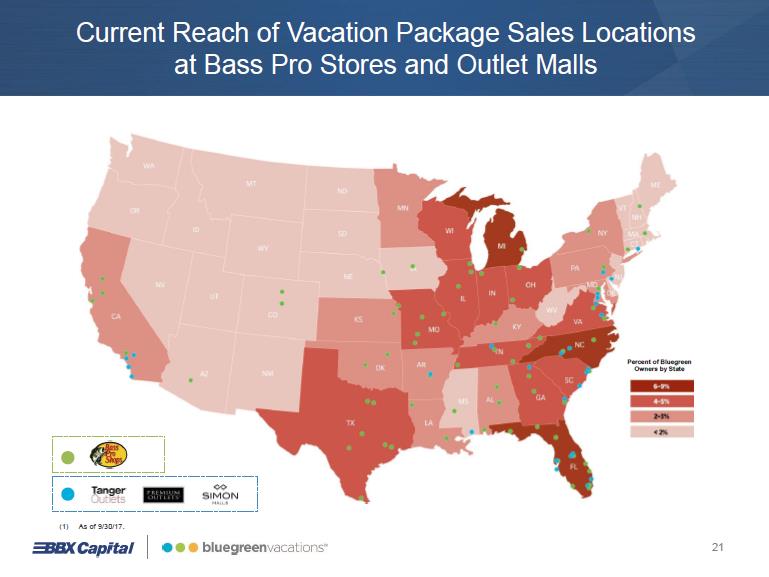
Current Reach of Vacation Package Sales Locations at Bass Pro Stores and Outlet Malls Percent of Bluegreen Owners by State (1) As of 9/30/17. 21
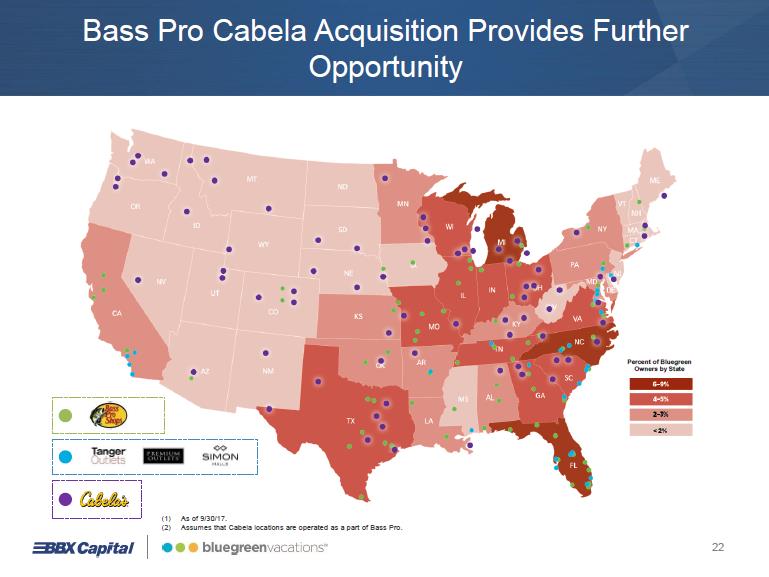
Bass Pro Cabela Acquisition Provides Further Opportunity Percent of Bluegreen Owners by State (1) As of 9/30/17. (2) Assumes that Cabela locations are operated as a part of Bass Pro. 22
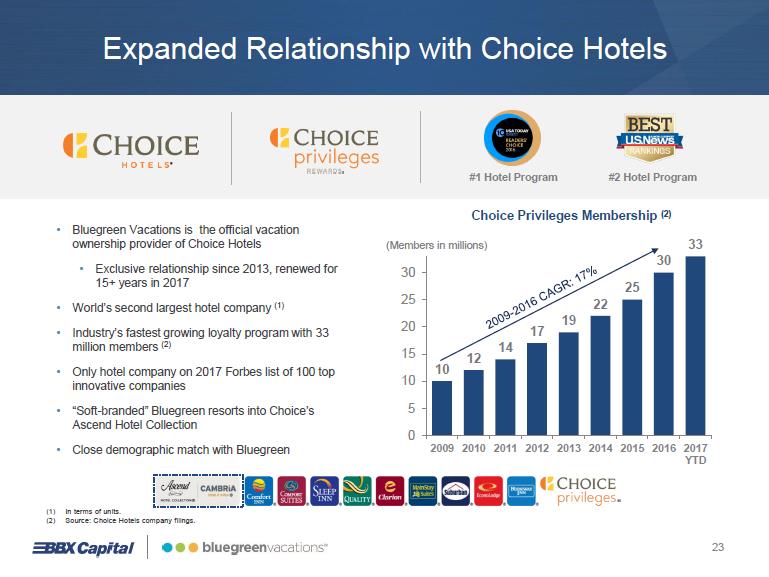
Expanded Relationship with Choice Hotels #1 Hotel Program #2 Hotel Program • Bluegreen Vacations is the official vacation ownership provider of Choice Hotels • Exclusive relationship since 2013, renewed for 15+ years in 2017 • World’s second largest hotel company (1) • Industry’s fastest growing loyalty program with 33 million members (2) • Only hotel company on 2017 Forbes list of 100 top innovative companies • “Soft-branded” Bluegreen resorts into Choice’s Ascend Hotel Collection • Close demographic match with Bluegreen Choice Privileges Membership (2) (Members in millions) 2009 - 2016 CAGR: 17% 10 12 14 17 19 22 25 30 33 0 5 10 15 20 25 30 2009 2010 2011 2012 2013 2014 2015 2016 2017 YTD (1) In terms of units. (2) Source: Choice Hotels company filings. 23
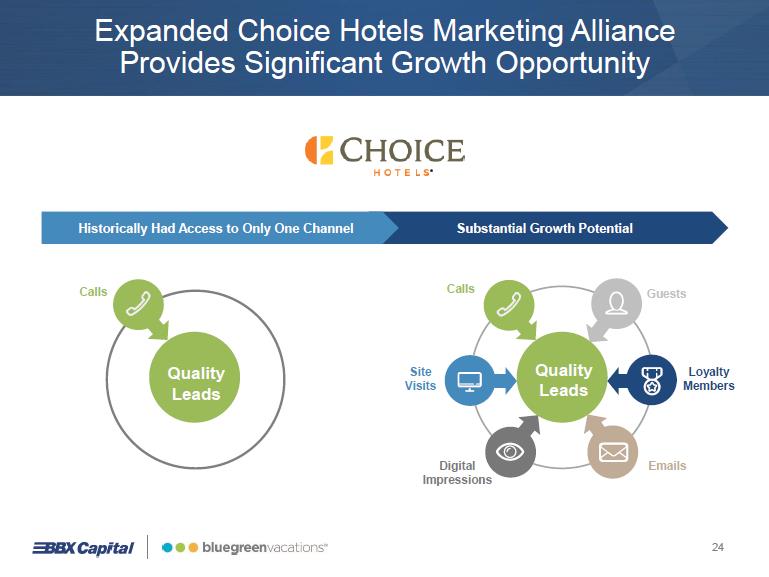
Expanded Choice Hotels Marketing Alliance Provides Significant Growth Opportunity Historically Had Access to Only One Channel Quality Leads Calls Substantial Growth Potential Quality Leads Calls Site Visits Digital Impressions Guests Loyalty Members Emails 24
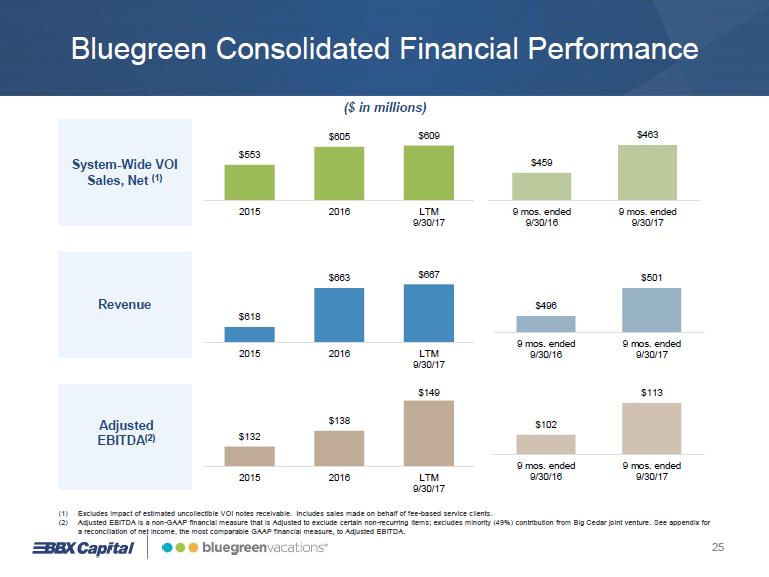
Bluegreen Consolidated Financial Performance ($ in millions) System-Wide VOI Sales, Net (1) $553 $605 $609 2015 2016 LTM 9/30/17 $459 $463 9 mos. ended 9/30/16 9 mos. ended 9/30/17 Revenue $618 $663 $667 2015 2016 LTM 9/30/17 $496 $501 9 mos. ended 9/30/16 9 mos. ended 9/30/17 Adjusted EBITDA (2) $132 $138 $149 2015 2016 LTM 9/30/17 $102 $113 9 mos. ended 9/30/16 9 mos. ended 9/30/17 (1) Excludes impact of estimated uncollectible VOI notes receivable. Includes sales made on behalf of fee-based service clients. (2) Adjusted EBITDA is a non-GAAP financial measure that is Adjusted to exclude certain non-recurring items; excludes minority (49%) contribution from Big Cedar joint venture. See appendix for a reconciliation of net income, the most comparable GAAP financial measure, to Adjusted EBITDA. 25
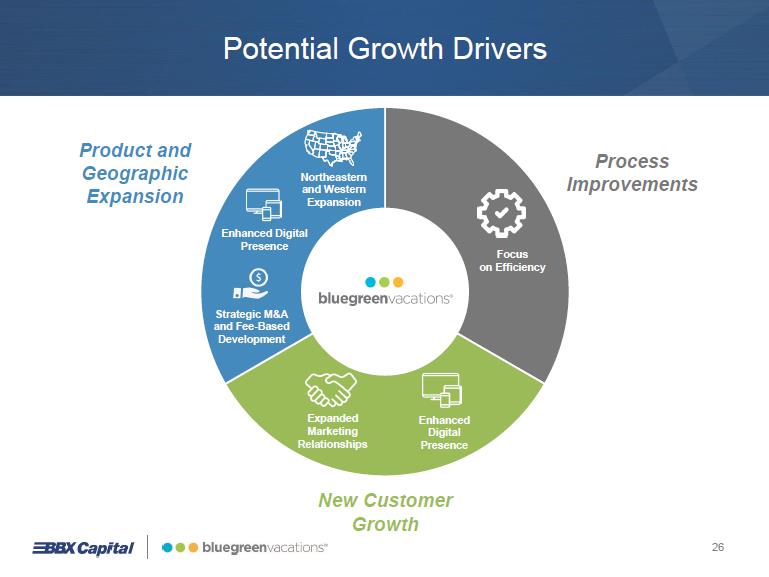
Potential Growth Drivers Product and Geographic Expansion Northeastern and Western Expansion Enhanced Digital Presence Strategic M&A and Fee-Based Development Process Improvements Focus on Efficiency New Customer Growth Expanded Marketing Relationships Enhanced Digital Presence 26
BBX Capital Alan B. Levan, Chairman and Chief Executive Officer 27
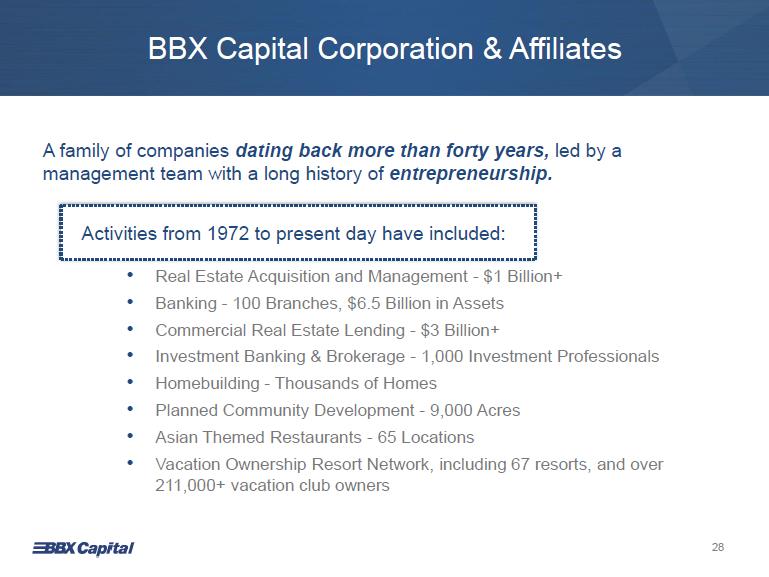
BBX Capital Corporation & Affiliates A family of companies dating back more than forty years, led by a management team with a long history of entrepreneurship. Activities from 1972 to present day have included: • Real Estate Acquisition and Management - $1 Billion+ • Banking - 100 Branches, $6.5 Billion in Assets • Commercial Real Estate Lending - $3 Billion+ • Investment Banking & Brokerage - 1,000 Investment Professionals • Homebuilding - Thousands of Homes • Planned Community Development - 9,000 Acres • Asian Themed Restaurants - 65 Locations • Vacation Ownership Resort Network, including 67 resorts, and over 211,000+ vacation club owners 28
Past Activities Seeking to invest in companies at the right time and optimize BBX’s value add BFCFinancial BankAtlantic Levitt and Sons LEVITT CORPORATION ST. LUCIE WEST Ryan Beck & Co. BENIHANA 29
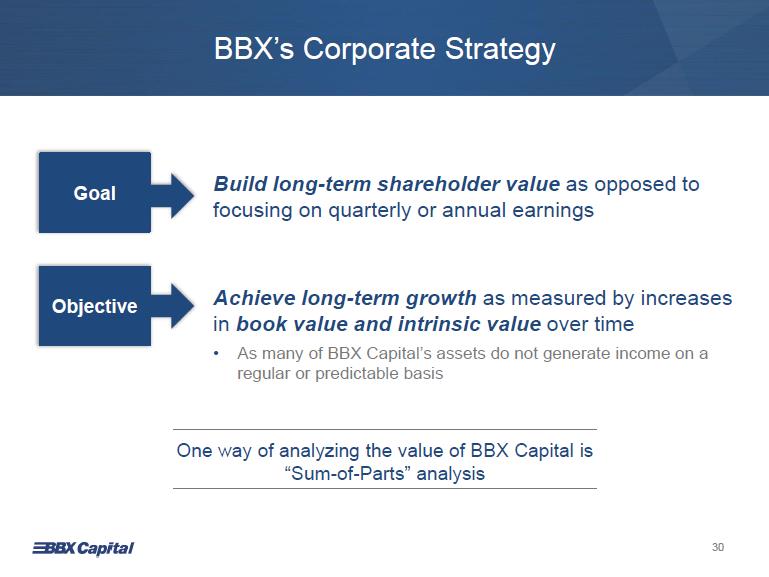
BBX’s Corporate Strategy Goal Build long-term shareholder value as opposed to focusing on quarterly or annual earnings Objective Achieve long-term growth as measured by increases in book value and intrinsic value over time • As many of BBX Capital’s assets do not generate income on a regular or predictable basis One way of analyzing the value of BBX Capital is “Sum-of-Parts” analysis 30
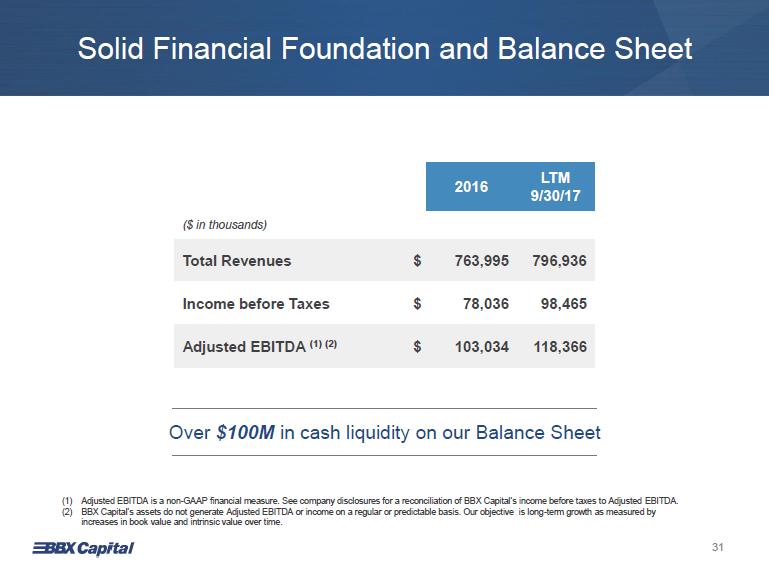
Solid Financial Foundation and Balance Sheet ($ in thousands) 2016 LTM 9/30/17 Total Revenues $ 763,995 796,936 Income before Taxes $ 78,036 98,465 Adjusted EBITDA (1) (2) $ 103,034 118,366 Over $100M in cash liquidity on our Balance Sheet (1) Adjusted EBITDA is a non-GAAP financial measure. See company disclosures for a reconciliation of BBX Capital’s income before taxes to Adjusted EBITDA. (2) BBX Capital’s assets do not generate Adjusted EBITDA or income on a regular or predictable basis. Our objective is long-term growth as measured by increases in book value and intrinsic value over time. 31
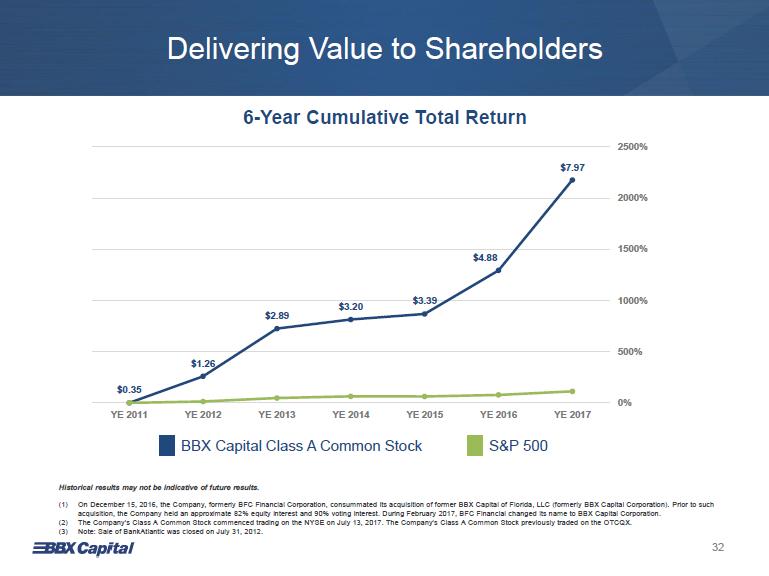
Delivering Value to Shareholders 6-Year Cumulative Total Return $0.35 $1.26 $2.89 $3.20 $3.39 $4.88 $7.97 0% 500% 1000% 1500% 2000% 2500% YE 2011 YE 2012 YE 2013 YE 2014 YE 2015 YE 2016 YE 2017 BBX Capital Class A Common Stock S&P 500 Historical results may not be indicative of future results. (1) On December 15, 2016, the Company, formerly BFC Financial Corporation, consummated its acquisition of former BBX Capital of Florida, LLC (formerly BBX Capital Corporation). Prior to such acquisition, the Company held an approximate 82% equity interest and 90% voting interest. During February 2017, BFC Financial changed its name to BBX Capital Corporation. (2) The Company’s Class A Common Stock commenced trading on the NYSE on July 13, 2017. The Company’s Class A Common Stock previously traded on the OTCQX. (3) Note: Sale of BankAtlantic was closed on July 31, 2012. 32
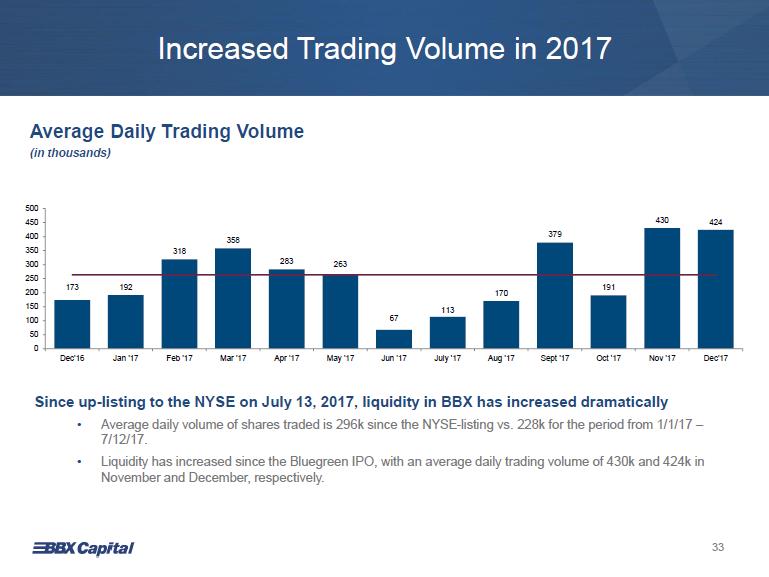
Increased Trading Volume in 2017 Average Daily Trading Volume (in thousands) 173 192 318 358 283 263 67 113 170 379 191 430 424 0 50 100 150 200 250 300 350 400 450 500 Dec'16 Jan '17 Feb '17 Mar '17 Apr '17 May '17 Jun '17 July '17 Aug '17 Sept '17 Oct '17 Nov '17 Dec'17 Since up-listing to the NYSE on July 13, 2017, liquidity in BBX has increased dramatically • Average daily volume of shares traded is 296k since the NYSE-listing vs. 228k for the period from 1/1/17 – 7/12/17. • Liquidity has increased since the Bluegreen IPO, with an average daily trading volume of 430k and 424k in November and December, respectively. 33
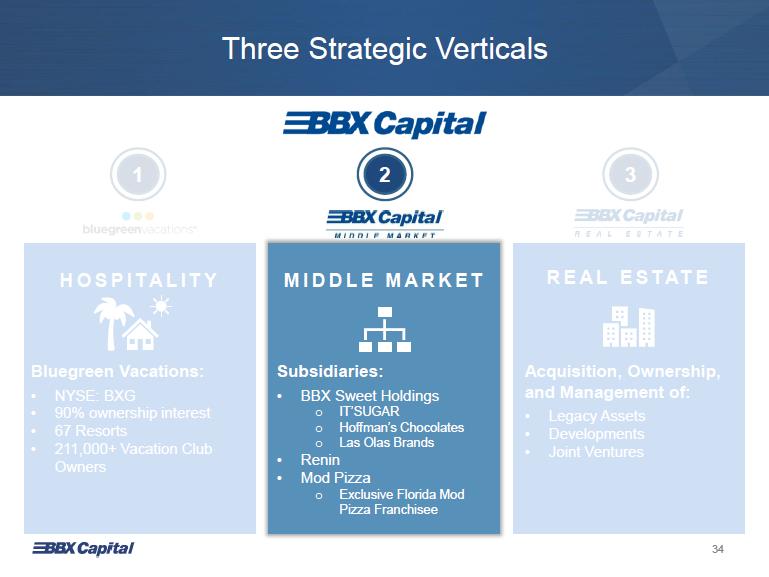
Three Strategic Verticals bluegreen vacations HOSPITALITY Bluegreen Vacations: • NYSE: BXG • 90% ownership interest • 67 Resorts • 211,000+ Vacation Club Owners BBX Capital MIDDLE MARKET Subsidiaries: • BBX Sweet Holdings o IT’SUGAR o Hoffman’s Chocolates o Las Olas Brands • Renin • Mod Pizza o Exclusive Florida Mod Pizza Franchisee BBX Capital REAL ESTATE REAL ESTATE Acquisition, Ownership, and Management of: • Legacy Assets • Developments • Joint Ventures 34
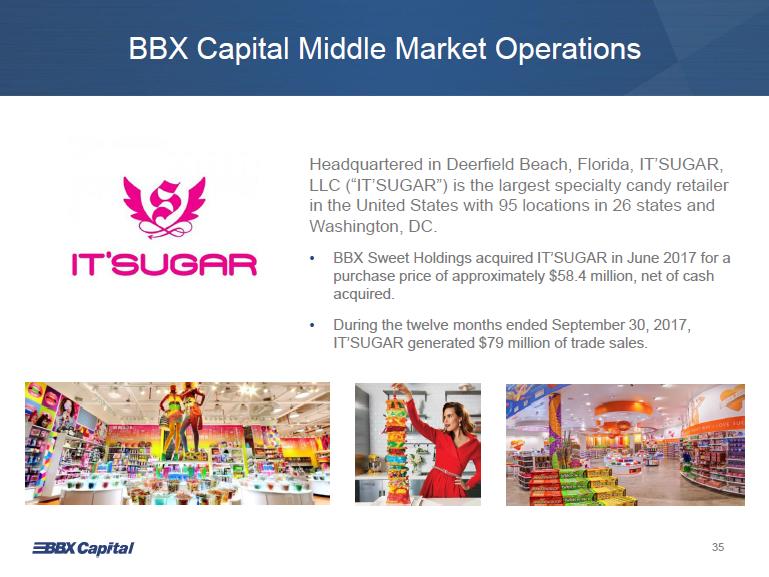
BBX Capital Middle Market Operations IT’SUGAR Headquartered in Deerfield Beach, Florida, IT’SUGAR, LLC (“IT’SUGAR”) is the largest specialty candy retailer in the United States with 95 locations in 26 states and Washington, DC. • BBX Sweet Holdings acquired IT’SUGAR in June 2017 for a purchase price of approximately $58.4 million, net of cash acquired. • During the twelve months ended September 30, 2017, IT’SUGAR generated $79 million of trade sales. 35
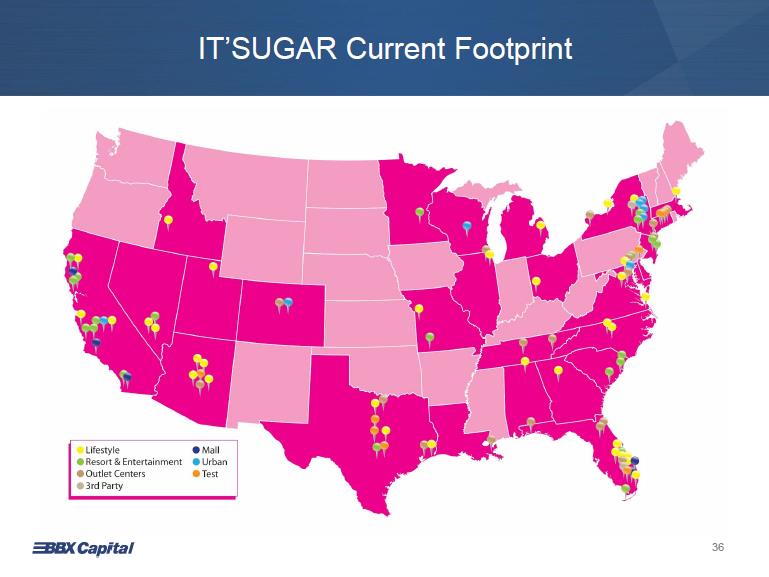
IT’SUGAR Current Footprint Lifestyle Resort & Entertainment Outlet Centers 3rd Party Mail Urban Test 36
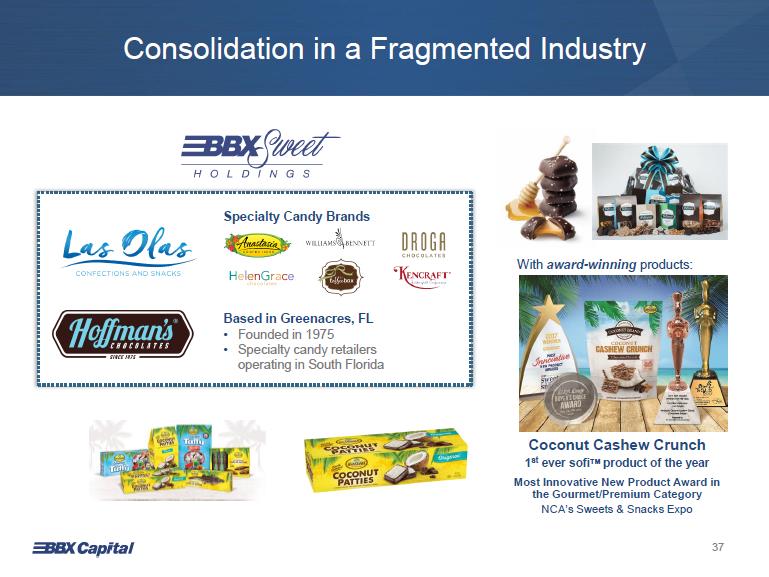
Consolidation in a Fragmented Industry BBX Sweet Holdings Specialty Candy Brands Anastasia Confections The Toffee Box Kencraft Candy Williams and Bennett Droga Chocolates Helen Grace Chocolates Based in Greenacres, FL • Founded in 1975 • Specialty candy retailers operating in South Florida With award-winning products: Coconut Cashew Crunch 1st ever sofi TM product of the year Most Innovative New Product Award in the Gourmet/Premium Category NCA’s Sweets & Snacks Expo 37
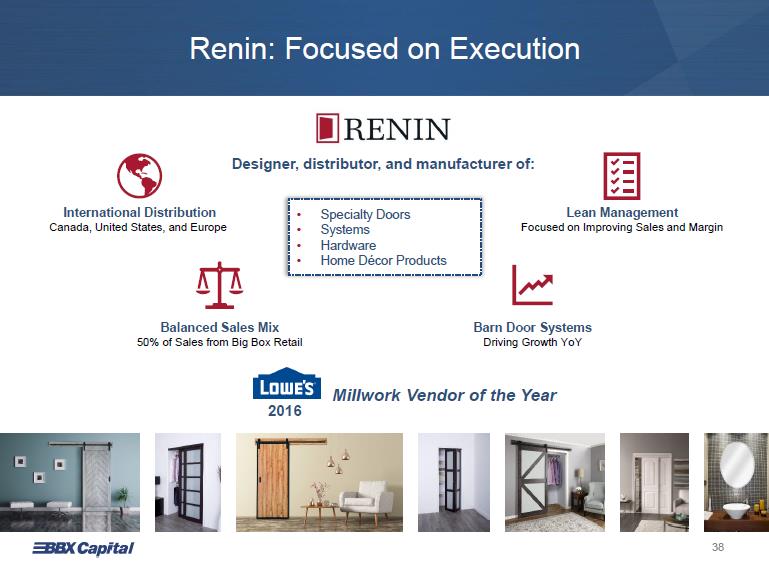
Renin: Focused on Execution Designer, distributor, and manufacturer of: • Specialty Doors • Systems • Hardware • Home Décor Products International Distribution Canada, United States, and Europe Lean Management Focused on Improving Sales and Margin Balanced Sales Mix 50% of Sales from Big Box Retail Barn Door Systems Driving Growth YoY LOWE’S 2016 Millwork Vendor of the Year 38
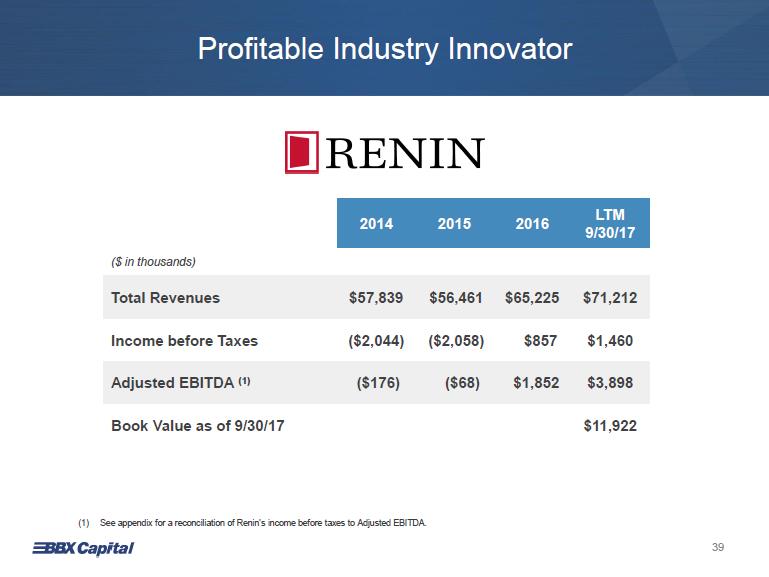
Profitable Industry Innovator RENIN ($ in thousands) 2014 2015 2016 LTM 9/30/17 Total Revenues $57,839 $56,461 $65,225 $71,212 Income before Taxes ($2,044) ($2,058) $857 $1,460 Adjusted EBITDA (1) ($176) ($68) $1,852 $3,898 Book Value as of 9/30/17 $11,922 (1) See appendix for a reconciliation of Renin’s income before taxes to Adjusted EBITDA. 39

Mod Pizza: Pipeline for Future Growth In 2016, Mod Pizza was named America’s fastest growing chain restaurant by Technomic MOD FAST CASUAL PIZZA Franchisor is headquartered in Seattle, WA • Currently over 295 locations in 26 states BBX is the exclusive franchisee in Florida Goal of developing 50+ locations over the next 6 years Target markets include: • Ft. Lauderdale • Jacksonville • Miami • Orlando • Tampa • West Palm Peach Poised to deliver growth in markets that capitalize on BBX’s expertise 40
Three Strategic Verticals bluegreen vacations HOSPITALITY Bluegreen Vacations: • NYSE: BXG • 90% ownership interest • 67 Resorts • 211,000+ Vacation Club Owners BBX Capital MIDDLE MARKET Subsidiaries: • BBX Sweet Holdings o IT’SUGAR o Hoffman’s Chocolates o Las Olas Brands • Renin • Mod Pizza o Exclusive Florida Mod Pizza Franchisee BBX Capital REAL ESTATE REAL ESTATE Acquisition, Ownership, and Management of: • Legacy Assets • Developments • Joint Ventures 41

Single and Multifamily Homes Bonterra – CC Homes | Hialeah, Florida • Approximately 50 acres • 394 single-family homes • With CC Homes, a Codina-Carr Company Altis at Bonterra | Hialeah, Florida • Approximately 14 acres under construction • 314 rental apartment units • With Altman Development 42

PGA Station Project PGA Station | Palm Beach Gardens, Florida • Adjacent to PGA Design Center • BBX is marketing the land parcel and is seeking joint venture partners or third parties for the development phases • Obtained approvals for 122 room limited-service suite hotel, 9,100 sf of medical offices, and approximately 188,000 sf of office buildings on vacant tracts of land • 122 room hotel pad sold to third party • 9,100 sf medical pad sold to third party 43
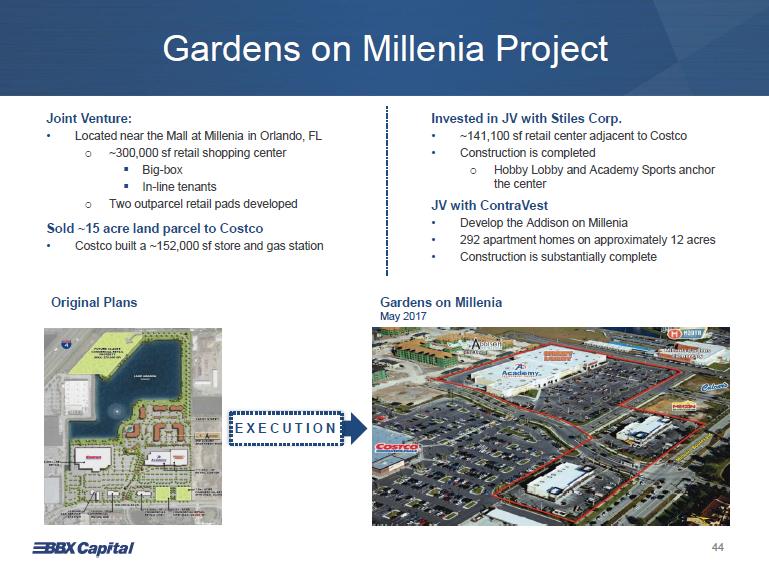
Gardens on Millenia Project Joint Venture: • Located near the Mall at Millenia in Orlando, FL o ~300,000 sf retail shopping center . Big-box . In-line tenants o Two outparcel retail pads developed Sold ~15 acre land parcel to Costco • Costco built a ~152,000 sf store and gas station Original Plans Invested in JV with Stiles Corp. • ~141,100 sf retail center adjacent to Costco • Construction is completed o Hobby Lobby and Academy Sports anchor the center JV with ContraVest • Develop the Addison on Millenia • 292 apartment homes on approximately 12 acres • Construction is substantially complete Gardens on Millenia May 2017 EXECUTION 44
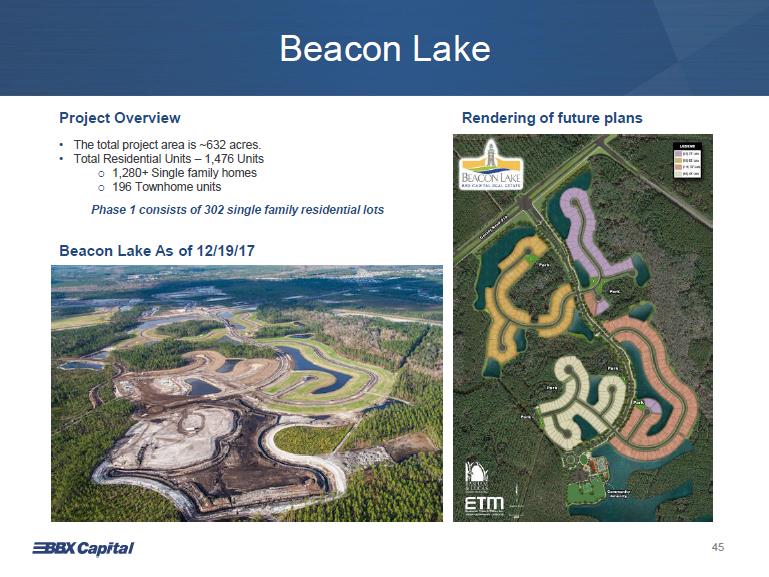
Beacon Lake Project Overview• The total project area is ~632 acres. • Total Residential Units – 1,476 Units o 1,280+ Single family homes o 196 Townhome units Phase 1 consists of 302 single family residential lots Beacon Lake As of 12/19/17 Rendering of future plans 45
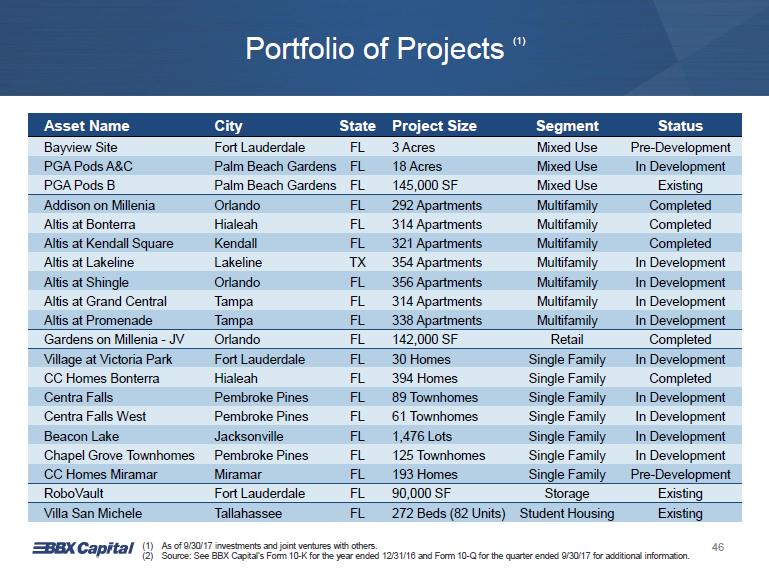
Portfolio of Projects (1) Asset Name City State Project Size Segment Status Bayview Site Fort Lauderdale FL 3 Acres Mixed Use Pre-Development PGA Pods A&C Palm Beach Gardens FL 18 Acres Mixed Use In Development PGA Pods B Palm Beach Gardens FL 145,000 SF Mixed Use Existing Addison on Millenia Orlando FL 292 Apartments Multifamily Completed Altis at Bonterra Hialeah FL 314 Apartments Multifamily Completed Altis at Kendall Square Kendall FL 321 Apartments Multifamily Completed Altis at Lakeline Lakeline TX 354 Apartments Multifamily In Development Altis at Shingle Orlando FL 356 Apartments Multifamily In Development Altis at Grand Central Tampa FL 314 Apartments Multifamily In Development Altis at Promenade Tampa FL 338 Apartments Multifamily In Development Gardens on Millenia - JV Orlando FL 142,000 SF Retail Completed Village at Victoria Park Fort Lauderdale FL 30 Homes Single Family In Development CC Homes Bonterra Hialeah FL 394 Homes Single Family Completed Centra Falls Pembroke Pines FL 89 Townhomes Single Family In Development Centra Falls West Pembroke Pines FL 61 Townhomes Single Family In Development Beacon Lake Jacksonville FL 1,476 Lots Single Family In Development Chapel Grove Townhomes Pembroke Pines FL 125 Townhomes Single Family In Development CC Homes Miramar Miramar FL 193 Homes Single Family Pre-Development RoboVault Fort Lauderdale FL 90,000 SF Storage Existing Villa San Michele Tallahassee FL 272 Beds (82 Units) Student Housing Existing (1) As of 9/30/17 investments and joint ventures with others. (2) Source: See BBX Capital’s Form 10-K for the year ended 12/31/16 and Form 10-Q for the quarter ended 9/30/17 for additional information. 46
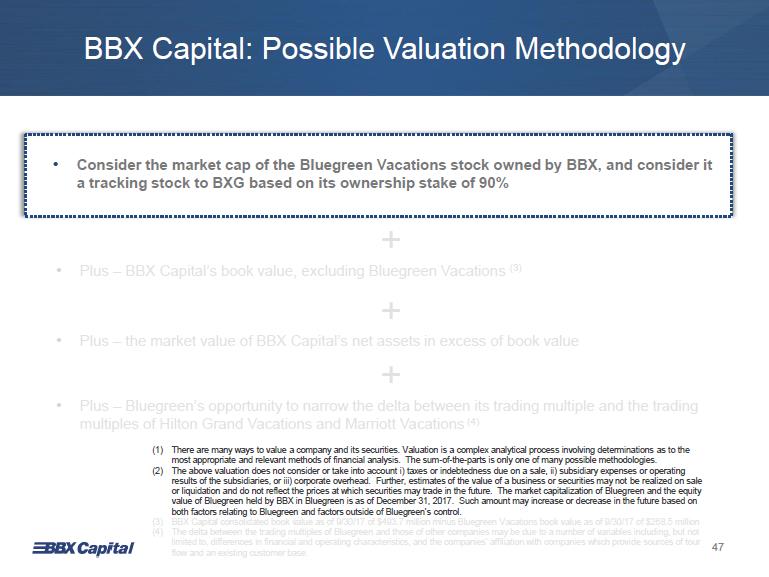
BBX Capital: Possible Valuation Methodology • Consider the market cap of the Bluegreen Vacations stock owned by BBX, and consider it a tracking stock to BXG based on its ownership stake of 90% + • Plus – BBX Capital’s book value, excluding Bluegreen Vacations (3) + • Plus – the market value of BBX Capital’s net assets in excess of book value + • Plus – Bluegreen’s opportunity to narrow the delta between its trading multiple and the trading multiples of Hilton Grand Vacations and Marriott Vacations (4) (1) There are many ways to value a company and its securities. Valuation is a complex analytical process involving determinations as to the most appropriate and relevant methods of financial analysis. The sum-of-the-parts is only one of many possible methodologies. (2) The above valuation does not consider or take into account i) taxes or indebtedness due on a sale, ii) subsidiary expenses or operating results of the subsidiaries, or iii) corporate overhead. Further, estimates of the value of a business or securities may not be realized on sale or liquidation and do not reflect the prices at which securities may trade in the future. The market capitalization of Bluegreen and the equity value of Bluegreen held by BBX in Bluegreen is as of December 31, 2017. Such amount may increase or decrease in the future based on both factors relating to Bluegreen and factors outside of Bluegreen’s control. (3) BBX Capital consolidated book value as of 9/30/17 of $493.7 million minus Bluegreen Vacations book value as of 9/30/17 of $26 8.5 million (4) The delta between the trading multiples of Bluegreen and those of other companies may be due to a number of variables including, but not limited to, differences in financial and operating characteristics, and the companies’ affiliation with companies which provide sources of tour flow and an existing customer base. 47
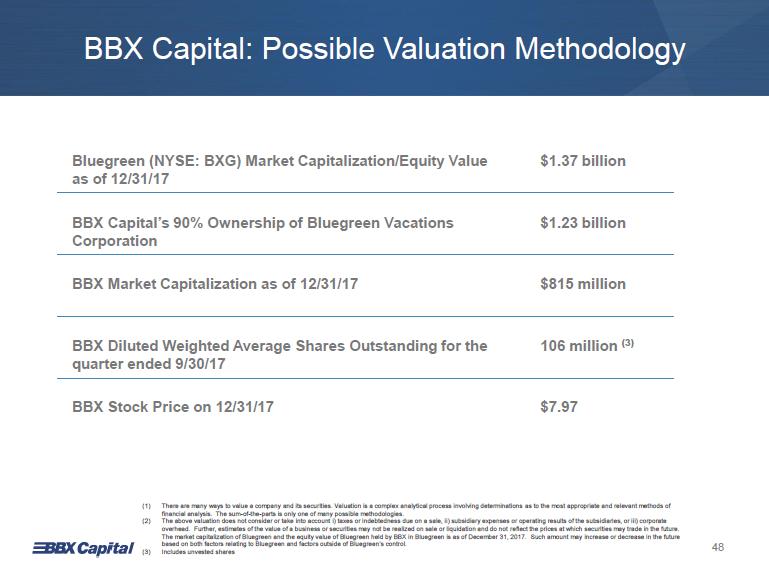
BBX Capital: Possible Valuation Methodology Bluegreen (NYSE: BXG) Market Capitalization/Equity Value as of 12/31/17 $1.37 billion BBX Capital’s 90% Ownership of Bluegreen Vacations Corporation $1.23 billion BBX Market Capitalization as of 12/31/17 $815 million BBX Diluted Weighted Average Shares Outstanding for the quarter ended 9/30/17 106 million (3) BBX Stock Price on 12/31/17 $7.97 (1) There are many ways to value a company and its securities. Valuation is a complex analytical process involving determinations as to the most appropriate and relevant methods of financial analysis. The sum-of-the-parts is only one of many possible methodologies. (2) The above valuation does not consider or take into account i) taxes or indebtedness due on a sale, ii) subsidiary expenses or operating results of the subsidiaries, or iii) corporate overhead. Further, estimates of the value of a business or securities may not be realized on sale or liquidation and do not reflect the prices at which securities may trade in the future. The market capitalization of Bluegreen and the equity value of Bluegreen held by BBX in Bluegreen is as of December 31, 2017. Such amount may increase or decrease in the future based on both factors relating to Bluegreen and factors outside of Bluegreen’s control. (3) Includes unvested shares 48
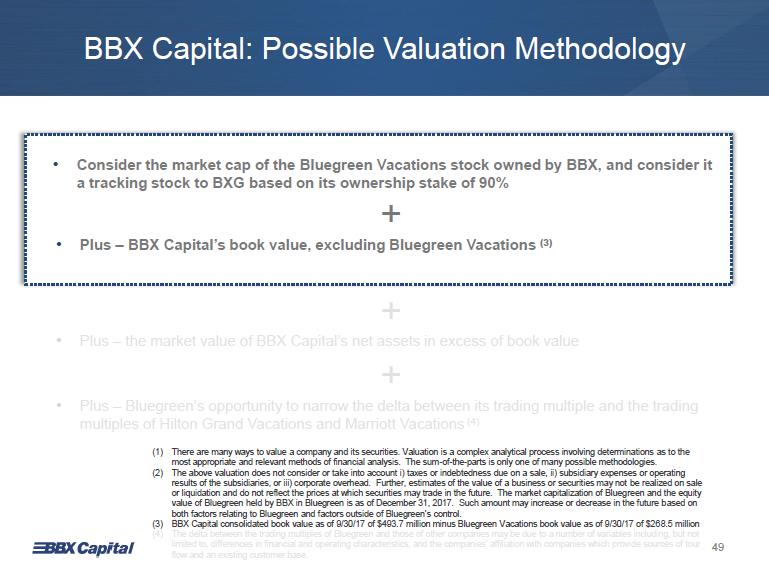
BBX Capital: Possible Valuation Methodology • Consider the market cap of the Bluegreen Vacations stock owned by BBX, and consider it a tracking stock to BXG based on its ownership stake of 90% + • Plus – BBX Capital’s book value, excluding Bluegreen Vacations (3) + • Plus – the market value of BBX Capital’s net assets in excess of book value + • Plus – Bluegreen’s opportunity to narrow the delta between its trading multiple and the trading multiples of Hilton Grand Vacations and Marriott Vacations (4) (1) There are many ways to value a company and its securities. Valuation is a complex analytical process involving determinations as to the most appropriate and relevant methods of financial analysis. The sum-of-the-parts is only one of many possible methodologies. (2) The above valuation does not consider or take into account i) taxes or indebtedness due on a sale, ii) subsidiary expenses or operating results of the subsidiaries, or iii) corporate overhead. Further, estimates of the value of a business or securities may not be realized on sale or liquidation and do not reflect the prices at which securities may trade in the future. The market capitalization of Bluegreen and the equity value of Bluegreen held by BBX in Bluegreen is as of December 31, 2017. Such amount may increase or decrease in the future based on both factors relating to Bluegreen and factors outside of Bluegreen’s control. (3) BBX Capital consolidated book value as of 9/30/17 of $493.7 million minus Bluegreen Vacations book value as of 9/30/17 of $26 8.5 million (4) The delta between the trading multiples of Bluegreen and those of other companies may be due to a number of variables including, but not limited to, differences in financial and operating characteristics, and the companies’ affiliation with companies which provide sources of tour flow and an existing customer base. 49
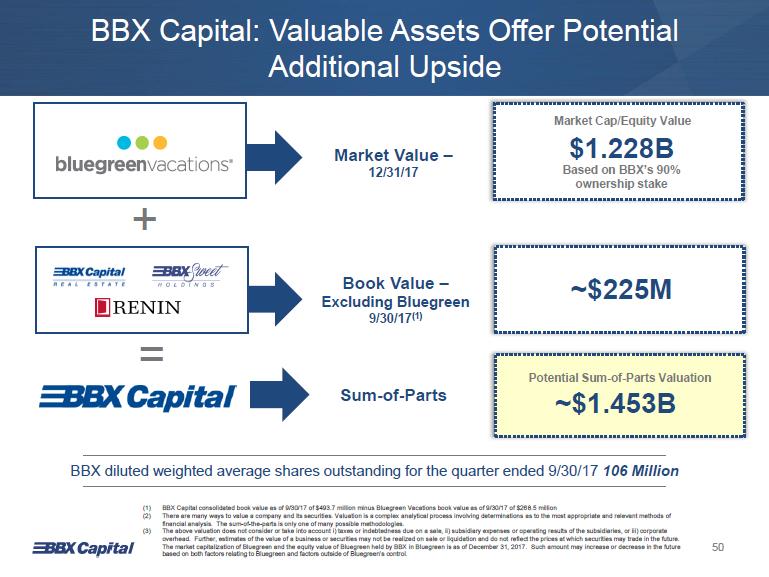
BBX Capital: Valuable Assets Offer Potential Additional Upside bluegreen vacations Market Value 12/31/17 Market Cap/Equity Value $1.228B Based on BBX’s 90% ownership stake +BBX Capital Real Estate BBX Sweet Holdings Renin Book Value – Excluding Bluegreen 9/30/17 (1) ~$225M = Sum-of-Parts Potential Sum-of-Parts Valuation ~$1.453B BBX diluted weighted average shares outstanding for the quarter ended 9/30/17 106 Million (1) BBX Capital consolidated book value as of 9/30/17 of $493.7 million minus Bluegreen Vacations book value as of 9/30/17 of $26 8.5 million (2) There are many ways to value a company and its securities. Valuation is a complex analytical process involving determinations as to the most appropriate and relevant methods of financial analysis. The sum-of-the-parts is only one of many possible methodologies. (3) The above valuation does not consider or take into account i) taxes or indebtedness due on a sale, ii) subsidiary expenses or operating results of the subsidiaries, or iii) corporate overhead. Further, estimates of the value of a business or securities may not be realized on sale or liquidation and do not reflect the prices at which securities may trade in the future. The market capitalization of Bluegreen and the equity value of Bluegreen held by BBX in Bluegreen is as of December 31, 2017. Such amount may increase or decrease in the future based on both factors relating to Bluegreen and factors outside of Bluegreen’s control 50
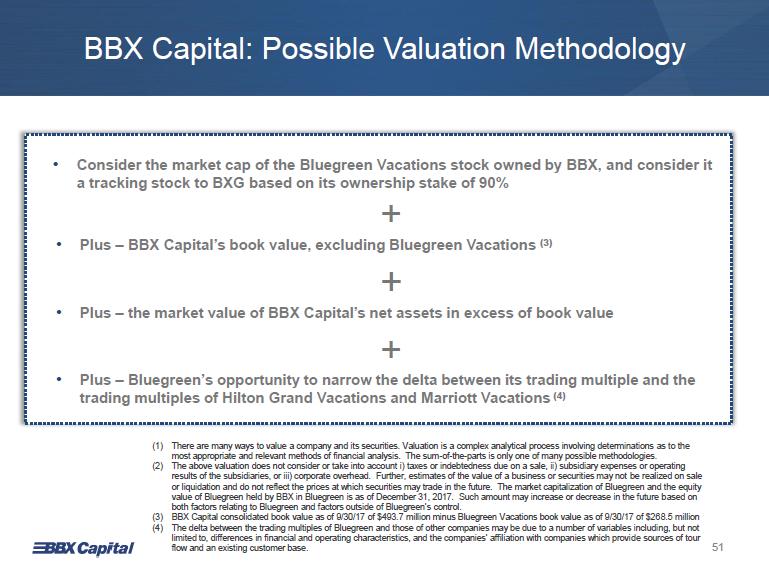
BBX Capital: Possible Valuation Methodology • Consider the market cap of the Bluegreen Vacations stock owned by BBX, and consider it a tracking stock to BXG based on its ownership stake of 90% + • Plus – BBX Capital’s book value, excluding Bluegreen Vacations (3) + • Plus – the market value of BBX Capital’s net assets in excess of book value + • Plus – Bluegreen’s opportunity to narrow the delta between its trading multiple and the trading multiples of Hilton Grand Vacations and Marriott Vacations (4) (1) There are many ways to value a company and its securities. Valuation is a complex analytical process involving determinations as to the most appropriate and relevant methods of financial analysis. The sum-of-the-parts is only one of many possible methodologies. (2) The above valuation does not consider or take into account i) taxes or indebtedness due on a sale, ii) subsidiary expenses or operating results of the subsidiaries, or iii) corporate overhead. Further, estimates of the value of a business or securities may not be realized on sale or liquidation and do not reflect the prices at which securities may trade in the future. The market capitalization of Bluegreen and the equity value of Bluegreen held by BBX in Bluegreen is as of December 31, 2017. Such amount may increase or decrease in the future based on both factors relating to Bluegreen and factors outside of Bluegreen’s control. (3) BBX Capital consolidated book value as of 9/30/17 of $493.7 million minus Bluegreen Vacations book value as of 9/30/17 of $26 8.5 million (4) The delta between the trading multiples of Bluegreen and those of other companies may be due to a number of variables including, but not limited to, differences in financial and operating characteristics, and the companies’ affiliation with companies which provide sources of tour flow and an existing customer base. 51

A Diversified Holding Company Offering an attractive investment opportunity 90% owner of Bluegreen Vacations, a profitable and growing “drive-to” vacation ownership company, with a compelling valuation opportunity Track record of identifying “inflection point” growth opportunities, becoming value-add partners, with a strong financial footing Current portfolio of valuable assets in key targeted verticals Led by an entrepreneurial team focused on creating value over the long term 52

APPENDIX The Club at Big Bear Village BIG BEAR LAKE, CALIFORNIA
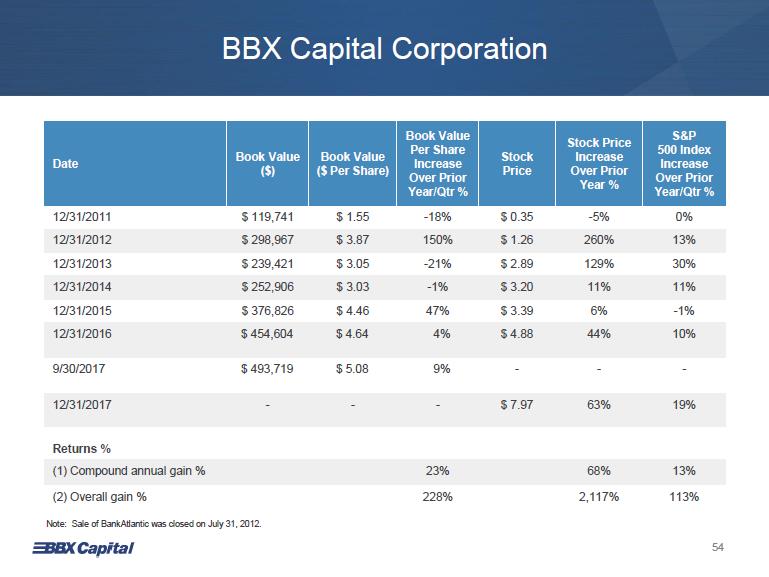
BBX Capital Corporation Date Book Value ($) Book Value ($ Per Share) Book Value Per Share Increase Over Prior Year/Qtr % Stock Price Stock Price Increase Over Prior Year % S&P 500 Index Increase Over Prior Year/Qtr % 12/31/2011 $ 119,741 $ 1.55 -18% $ 0.35 -5% 0% 12/31/2012 $ 298,967 $ 3.87 150% $ 1.26 260% 13% 12/31/2013 $ 239,421 $ 3.05 -21% $ 2.89 129% 30% 12/31/2014 $ 252,906 $ 3.03 -1% $ 3.20 11% 11% 12/31/2015 $ 376,826 $ 4.46 47% $ 3.39 6% -1% 12/31/2016 $ 454,604 $ 4.64 4% $ 4.88 44% 10% 9/30/2017 $ 493,719 $ 5.08 9% - - - 12/31/2017 - - - $ 7.97 63% 19% Returns % (1) Compound annual gain % 23% 68% 13% (2) Overall gain % 228% 2,117% 113% Note: Sale of BankAtlantic was closed on July 31, 2012. 54
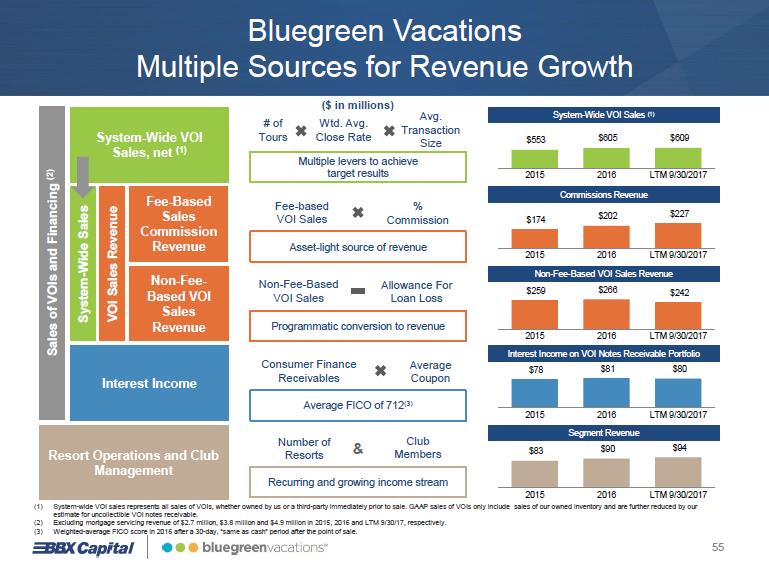
Bluegreen Vacations Multiple Sources for Revenue Growth ($ in millions) Sales of VOIs and Financing (2) System-Wide VOI Sales, net (1) System-Wide Sales VOI Sales Revenue Fee-Based Sales Commission Revenue Non-Fee-Based VOI Sales Revenue Interest Income Resort Operations and Club Management # of Tours x Wtd. Avg. Close Rate x Avg. Transaction Size Multiple levers to achieve target results System-Wide VOI Sales (1) $553 $605 $609 2015 2016 LTM 9/30/2017 Fee-based VOI Sales x % Commission Asset-light source of revenue Commissions Revenue $174 $202 $227 2015 2016 LTM 9/30/2017 Non-Fee-Based VOI Sales - Allowance For Loan Loss Programmatic conversion to revenue Non-Fee-Based VOI Sales Revenue $259 $266 $242 2015 2016 LTM 9/30/17 Consumer Finance Receivables x Average Coupon Average FICO of 712 (3) Interest Income on VOI Notes Receivable Portfolio $78 $81 $80 2015 2016 LTM 9/30/17 Number of Resorts & Club Members Recurring and growing income stream Segment Revenue $83 $90 $94 2015 2016 LTM 9/30/17 (1) System-wide VOI sales represents all sales of VOIs, whether owned by us or a third-party immediately prior to sale. GAAP sales of VOIs only include sales of our owned inventory and are further reduced by our estimate for uncollectible VOI notes receivable. (2) Excluding mortgage servicing revenue of $2.7 million, $3.8 million and $4.9 million in 2015, 2016 and LTM 9/30/17, respectively. (3) Weighted-average FICO score in 2016 after a 30-day, “same as cash” period after the point of sale. 55
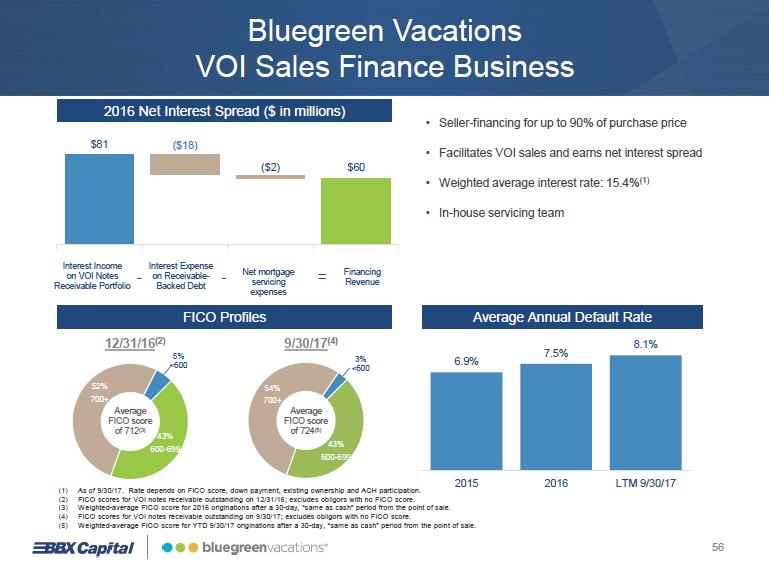
Bluegreen Vacations VOI Sales Finance Business 2016 Net Interest Spread ($ in millions) $81 ($2) $60 ($18) Interest Income on VOI Notes Receivable Portfolio - Interest Expense on Receivable-Backed Debt - Net mortgage servicing expenses = Financing Revenue • Seller-financing for up to 90% of purchase price • Facilitates VOI sales and earns net interest spread • Weighted average interest rate: 15.4% (1) • In-house servicing team FICO Profiles 12/31/16 (2) 9/30/17 (4) 43% 600 - 699 52% 700+ 5% <600 Average FICO score of 712 (3) Average FICO score of 724 (5) 54% 700+ 43% 600 - 699 3% <600 Average Annual Default Rate 6.9% 7.5% 8.1% 2015 2016 LTM 9/30/17 (1) As of 9/30/17. Rate depends on FICO score, down payment, existing ownership and ACH participation. (2) FICO scores for VOI notes receivable outstanding on 12/31/16; excludes obligors with no FICO score. (3) Weighted-average FICO score for 2016 originations after a 30-day, “same as cash” period from the point of sale. (4) FICO scores for VOI notes receivable outstanding on 9/30/17; excludes obligors with no FICO score. (5) Weighted-average FICO score for YTD 9/30/17 originations after a 30-day, “same as cash” period from the point of sale. 56
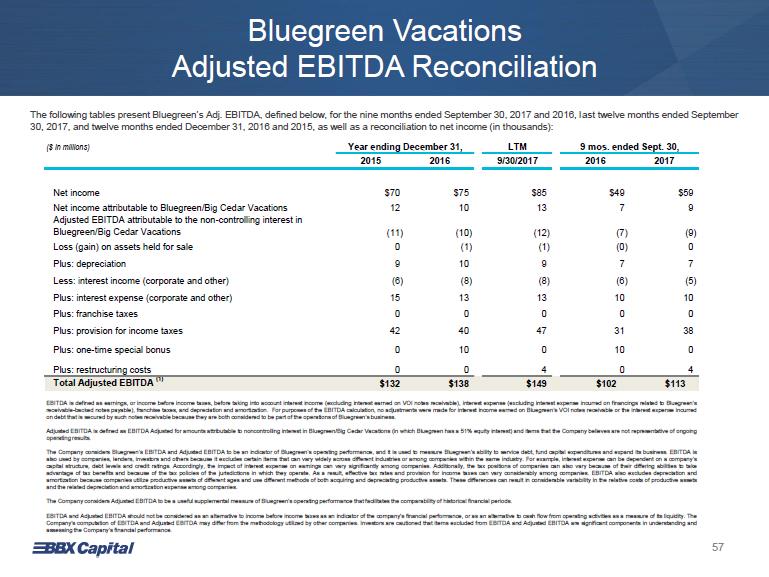
Bluegreen Vacations Adjusted EBITDA Reconciliation The following tables present Bluegreen’s Adj. EBITDA, defined below, for the nine months ended September 30, 2017 and 2016, last twelve months ended September 30, 2017, and twelve months ended December 31, 2016 and 2015, as well as a reconciliation to net income (in thousands):
($ in millions)Year ending December 31, LTM 9 mos. ended Sept. 30, 2015 2016 9/30/2017 2016 2017 Net income $70 $75 $85 $49 $59 Net income attributable to Bluegreen/Big Cedar Vacations 12 10 13 7 9 Adjusted EBITDA attributable to the non-controlling interest in Bluegreen/Big Cedar Vacations (11) (10) (12) (7) (9) Loss (gain) on assets held for sale 0 (1) (1) (0) 0 Plus: depreciation 9 10 9 7 7 Less: interest income (corporate and other) (6) (8) (8) (6) (5) Plus: interest expense (corporate and other) 15 13 13 10 10 Plus: franchise taxes 0 0 0 0 0 Plus: provision for income taxes 42 40 47 31 38 Plus: one-time special bonus 0 10 0 10 0 Plus: restructuring costs 0 0 4 0 4 Total Adjusted EBITDA (1) $132 $138 $149 $102 $113 EBITDA is defined as earnings, or income before income taxes, before taking into account interest income (excluding interest earned on VOI notes receivable), interest expense (excluding interest expense incurred on financings related to Bluegreen’s receivable-backed notes payable), franchise taxes, and depreciation and amortization . For purposes of the EBITDA calculation, no adjustments were made for interest income earned on Bluegreen’s VOI notes receivable or the interest expense incurred on debt that is secured by such notes receivable because they are both considered to be part of the operations of Bluegreen’s business . Adjusted EBITDA is defined as EBITDA Adjusted for amounts attributable to noncontrolling interest in Bluegreen/Big Cedar Vacations (in which Bluegreen has a 51 % equity interest) and items that the Company believes are not representative of ongoing operating results . The Company considers Bluegreen’s EBITDA and Adjusted EBITDA to be an indicator of Bluegreen’s operating performance, and it is used to measure Bluegreen’s ability to service debt, fund capital expenditures and expand its business . EBITDA is also used by companies, lenders, investors and others because it excludes certain items that can vary widely across different industries or among companies within the same industry . For example, interest expense can be dependent on a company’s capital structure, debt levels and credit ratings . Accordingly, the impact of interest expense on earnings can vary significantly among companies . Additionally, the tax positions of companies can also vary because of their differing abilities to take advantage of tax benefits and because of the tax policies of the jurisdictions in which they operate . As a result, effective tax rates and provision for income taxes can vary considerably among companies . EBITDA also excludes depreciation and amortization because companies utilize productive assets of different ages and use different methods of both acquiring and depreciating productive assets . These differences can result in considerable variability in the relative costs of productive assets and the related depreciation and amortization expense among companies . The Company considers Adjusted EBITDA to be a useful supplemental measure of Bluegreen’s operating performance that facilitates the comparability of historical financial periods . EBITDA and Adjusted EBITDA should not be considered as an alternative to income before income taxes as an indicator of the company's financial performance, or as an alternative to cash flow from operating activities as a measure of its liquidity . The Company's computation of EBITDA and Adjusted EBITDA may differ from the methodology utilized by other companies . Investors are cautioned that items excluded from EBITDA and Adjusted EBITDA are significant components in understanding and assessing the Company’s financial performance . 57
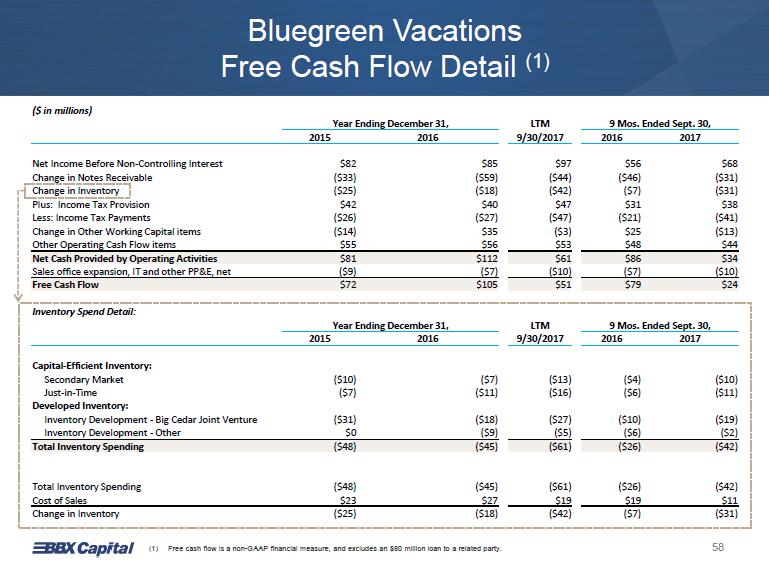
Bluegreen Vacations Free Cash Flow Detail (1) ($ in millions) Year Ending December 31, LTM 9 Mos. Ended Sept. 30, 2015 2016 9/30/2017 2016 2017 Net Income Before Non-Controlling Interest $82 $85 $97 $56 $68 Change in Notes Receivable ($33) ($59) ($44) ($46) ($31) Change in Inventory ($25) ($18) ($42) ($7) ($31) Plus: Income Tax Provision $42 $40 $47 $31 $38 Less: Income Tax Payments ($26) ($27) ($47) ($21) ($41) Change in Other Working Capital items ($14) $35 ($3) $25 ($13) Other Operating Cash Flow items $55 $56 $53 $48 $44 Net Cash Provided by Operating Activities $81 $112 $61 $86 $34 Sales office expansion, IT and other PP&E, net ($9) ($7) ($10) ($7) ($10) Free Cash Flow $72 $105 $51 $79 $24 Inventory Spend Detail: Year Ending December 31, LTM 9 Mos. Ended Sept. 30, 2015 2016 9/30/2017 2016 2017 Capital-Efficient Inventory: Secondary Market ($10) ($7) ($13) ($4) ($10) Just-in-Time ($7) ($11) ($16) ($6) ($11) Developed Inventory: Inventory Development-Big Cedar Joint Venture ($31) ($18) ($27) ($10) ($19) Inventory Development-Other $0 ($9) ($5) ($6) ($2) Total Inventory Spending ($48) ($45) ($61) ($26) ($42) Total Inventory Spending ($48) ($45) ($61) ($26) ($42) Cost of Sales $23 $27 $19 $19 $11 Change in Inventory ($25) ($18) ($42) ($7) ($31)
(1) Free cash flow is a non-GAAP financial measure, and excludes an $80 million loan to a related party. 58
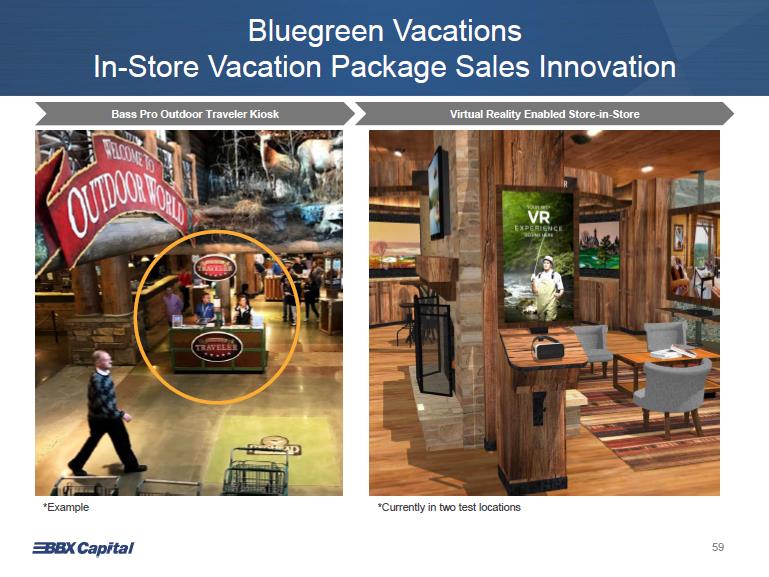
Bluegreen Vacations In-Store Vacation Package Sales Innovation Bass Pro Outdoor Traveler Kiosk Virtual Reality Enabled Store-in-Store *Currently in two test locations *Example 59
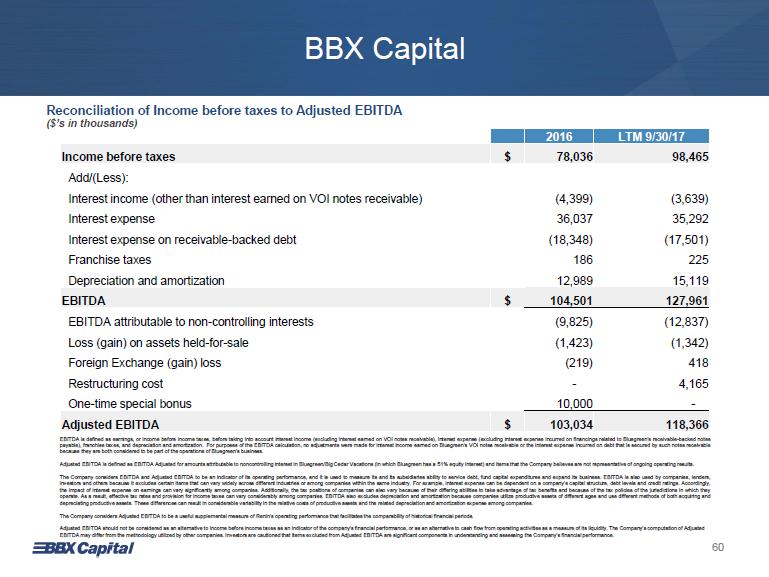
BBX Capital Reconciliation of Income before taxes to Adjusted EBITDA ($’s in thousands) 2016 LTM 9/30/17 Income before taxes $ 78,036 98,465 Add/(Less): Interest income (other than interest earned on VOI notes receivable) (4,399) (3,639) Interest expense 36,037 35,292 Interest expense on receivable-backed debt (18,348) (17,501) Franchise taxes 186 225 Depreciation and amortization 12,989 15,119 EBITDA $ 104,501 127,961 EBITDA attributable to non-controlling interests (9,825) (12,837) Loss (gain) on assets held-for-sale (1,423) (1,342) Foreign Exchange (gain) loss (219) 418 Restructuring cost - 4,165 One-time special bonus 10,000 - Adjusted EBITDA $ 103,034 118,366 EBITDA is defined as earnings, or income before income taxes, before taking into account interest income (excluding interest earned on VOI notes receivable), interest expense (excluding interest expense incurred on financings related to Bluegreen’s receivable-backed notes payable), franchise taxes, and depreciation and amortization . For purposes of the EBITDA calculation, no adjustments were made for interest income earned on Bluegreen’s VOI notes receivable or the interest expense incurred on debt that is secured by such notes receivable because they are both considered to be part of the operations of Bluegreen’s business. Adjusted EBITDA is defined as EBITDA Adjusted for amounts attributable to noncontrolling interest in Bluegreen/Big Cedar Vacations (in which Bluegreen has a 51 % equity interest) and items that the Company believes are not representative of ongoing operating results. The Company considers EBITDA and Adjusted EBITDA to be an indicator of its operating performance, and it is used to measure its and its subsidiaries ability to service debt, fund capital expenditures and expand its business . EBITDA is also used by companies, lenders, investors and others because it excludes certain items that can vary widely across different industries or among companies within the same industry . For example, interest expense can be dependent on a company’s capital structure, debt levels and credit ratings . Accordingly, the impact of interest expense on earnings can vary significantly among companies . Additionally, the tax positions of companies can also vary because of their differing abilities to take advantage of tax benefits and because of the tax policies of the jurisdictions in which they operate . As a result, effective tax rates and provision for income taxes can vary considerably among companies . EBITDA also excludes depreciation and amortization because companies utilize productive assets of different ages and use different methods of both acquiring and depreciating productive assets. These differences can result in considerable variability in the relative costs of productive assets and the related depreciation and amortization expense among companies. The Company considers Adjusted EBITDA to be a useful supplemental measure of Renin’s operating performance that facilitates the comparability of historical financial periods. Adjusted EBITDA should not be considered as an alternative to income before income taxes as an indicator of the company's financial performance, or as an alternative to cash flow from operating activities as a measure of its liquidity. The Company's computation of Adjusted EBITDA may differ from the methodology utilized by other companies. Investors are cautioned that items excluded from Adjusted EBITDA are significant components in understanding and assessing the Company’s financial performance. 60
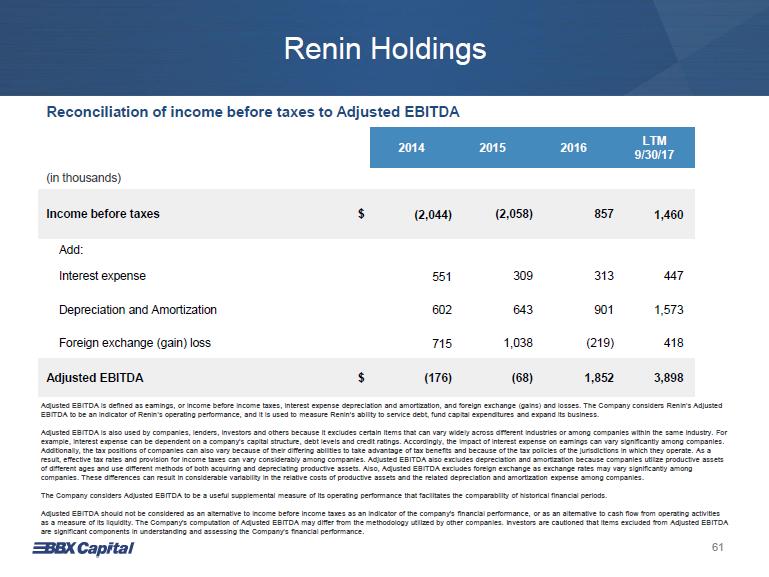
Renin Holdings Reconciliation of income before taxes to Adjusted EBITDA 2014 2015 2016 LTM 9/30/17 (in thousands) Income before taxes $ (2,044) (2,058) 857 1,460 Add: Interest expense 551 309 313 447 Depreciation and Amortization 602 643 901 1,573 Foreign exchange (gain) loss 715 1,038 (219) 418 Adjusted EBITDA $ (176) (68) 1,852 3,898 Adjusted EBITDA is defined as earnings, or income before income taxes, interest expense depreciation and amortization, and foreign exchange (gains) and losses. The Company considers Renin’s Adjusted EBITDA to be an indicator of Renin’s operating performance, and it is used to measure Renin’s ability to service debt, fund capital expenditures and expand its business. Adjusted EBITDA is also used by companies, lenders, investors and others because it excludes certain items that can vary widely across different industries or among companies within the same industry. For example, interest expense can be dependent on a company’s capital structure, debt levels and credit ratings. Accordingly, the impact of interest expense on earnings can vary significantly among companies. Additionally, the tax positions of companies can also vary because of their differing abilities to take advantage of tax bene fit s and because of the tax policies of the jurisdictions in which they operate. As a result, effective tax rates and provision for income taxes can vary considerably among companies. Adjusted EBITDA also exclud es depreciation and amortization because companies utilize productive assets of different ages and use different methods of both acquiring and depreciating productive assets. Also, Adjusted EBITDA exclu des foreign exchange as exchange rates may vary significantly among companies. These differences can result in considerable variability in the relative costs of productive assets and the relate d d epreciation and amortization expense among companies. The Company considers Adjusted EBITDA to be a useful supplemental measure of its operating performance that facilitates the c omp arability of historical financial periods. Adjusted EBITDA should not be considered as an alternative to income before income taxes as an indicator of the company's fin anc ial performance, or as an alternative to cash flow from operating activities as a measure of its liquidity. The Company's computation of Adjusted EBITDA may differ from the methodology utilized by other co mpanies. Investors are cautioned that items excluded from Adjusted EBITDA are significant components in understanding and assessing the Company’s financial performance. 61

Thank You Christmas Mountain VillageTM WISCONSIN DELLS< WISCONSIN