Attached files
| file | filename |
|---|---|
| EX-99.1 - EX-99.1 - TUESDAY MORNING CORP/DE | a18-2370_1ex99d1.htm |
| 8-K - 8-K - TUESDAY MORNING CORP/DE | a18-2370_18k.htm |
Safe Harbor Statement Cautionary Statement Regarding Forward-Looking Statements This presentation contains forward-looking statements, which are based on management's current expectations, estimates and projections and are not guarantees of future performance. Forward looking statements include statements regarding the Company’s real estate, merchandise, marketing and distribution strategies, projected economics for relocated stores, outlook for sales and gross margin, anticipated capital investments and liquidity. Reference is hereby made to the Company's filings with the Securities and Exchange Commission, including, but not limited to, "Cautionary Statement Regarding Forward-Looking Statements" and "Item 1A. Risk Factors" of the Company's Annual Report on Form 10-K for the fiscal year ended June 30, 2016, for examples of risks, uncertainties and events that could cause our actual results to differ materially from the expectations expressed in our forward-looking statements. These risks, uncertainties and events include, but are not limited to, the following: our ability to successfully implement our long-term business strategy; changes in economic and political conditions which may adversely affect consumer spending; our failure to identify and respond to changes in consumer trends and preferences; our ability to continuously attract buying opportunities for off-price merchandise and anticipate consumer demand; our ability to successfully manage our inventory balances profitably; our ability to effectively manage our supply chain operations; loss of, disruption in operations, or increased costs in the operation of our distribution center facilities; loss or departure of one or more members of our senior management or other key management employees; increased or new competition; our ability to successfully execute our strategy of opening new stores and relocating and expanding existing stores; increases in fuel prices and changes in transportation industry regulations or conditions; our ability to generate strong cash flows from operations and to continue to access credit markets; increases in the cost or a disruption in the flow of our imported products; the success of our marketing, advertising and promotional efforts; our ability to attract, train and retain quality employees in appropriate numbers, including key employees and management; seasonal and quarterly fluctuations; our ability to maintain and protect our information technology systems and technologies and related improvements to support our growth; our ability to protect the security of information about our business and our customers, suppliers, business partners and employees; our ability to comply with existing, changing, and new government regulations; our ability to manage litigation risks from our customers, employees and other third parties; our ability to manage risks associated with product liability claims and product recalls; the impact of adverse local conditions, weather, natural disasters and other events; and our ability to manage the negative effects of inventory shrinkage. The Company's filings with the SEC are available at the SEC's web site at www.sec.gov. The forward-looking statements made in this presentation relate only to events as of the date on which the statements were made. Except as may be required by law, the Company disclaims obligations to update its forward-looking statements to reflect events and circumstances after the date on which the statements were made or to reflect the occurrence of unanticipated events. Investors are cautioned not to place undue reliance on any forward-looking statements. 2
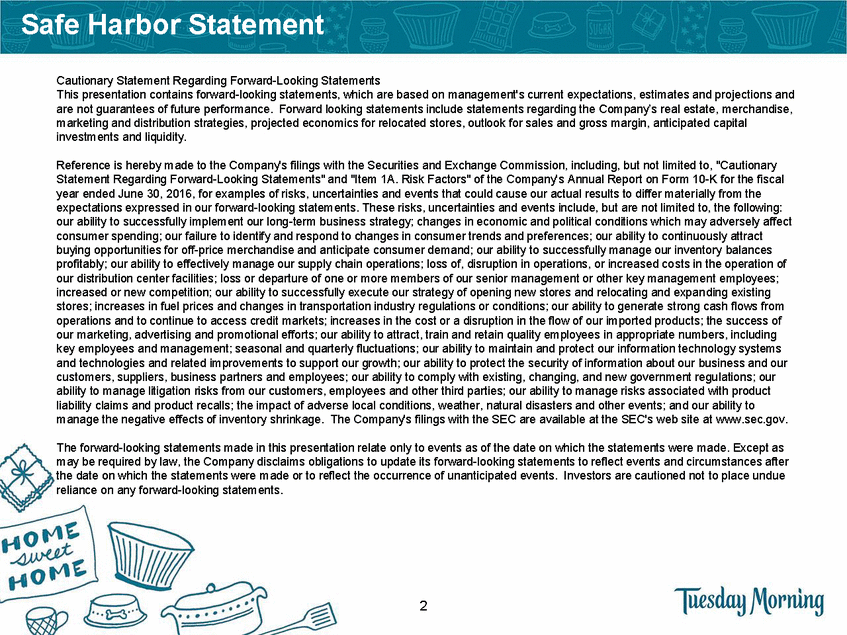
Introduction Cautionary Statement Regarding Forward-Looking Statements This presentation contains forward-looking statements, which are based on management's current expectations, estimates and projections and are not guarantees of future performance. Forward looking statements include statements regarding the Company’s real estate, merchandise, marketing and distribution strategies, projected economics for relocated stores, outlook for sales and gross margin, anticipated capital Steve Becker, CEO investments and liquidity. Reference is hereby made to th•e ComCpaEnyO's filsinigns wciteh thDe Seecueritmies baned rEx2ch0an1ge5Commission, including, but not limited to, "Cautionary Statement Regarding Forward-L•ookinAg cSttaitvemeenBts"oanadr"dItemm1Ae. mRiskbFeacrtosrsi"nofcthee C2om0p1an2y's Annual Report on Form 10-K for the fiscal year ended June 30, 2016, for examples of risks, uncertainties and events that could cause our actual results to differ materially from the expectations expressed in our forward-looking statements. These risks, uncertainties and events include, but are not limited to, the following: our ability to successfully implement our long-term business strategy; changes in economic and political conditions which may adversely affect consumer spending; our failure to identify and respond to changes in consumer trends and preferences; our ability to continuously attract buying opportunities for off-price merchandise and anticipate consumer demand; our ability to successfully manage our inventory balances profitably; our ability to effectively manage our supply chain operations; loss of, disruption in operations, or increased costs in the operation of our distribution center facilities; loss or departure of one or more members of our senior management or other key management employees; increased or new competition; oSur taabilcityieto sSuchceisrslfeully,exEecuVtePou,r CstraFteOgy o&f opTenrineg aneswustroerers and relocating and expanding existing stores; increases in fuel prices and changes in transportation industry regulations or conditions; our ability to generate strong cash flows from operations and to continue to ac•cessCcreFdiOt masrkients;cinecreJasaesninutahercyost2o0r a1d6isruption in the flow of our imported products; the success of our marketing, advertising and promotional efforts; our ability to attract, train and retain quality employees in appropriate numbers, including key employees and managemen•t; sePasornioal ranEd qxuaprterlryifelunctucateio:nsS; ouVr aPb,ilityFtoinmaainacineanad pnrodtecTt oruer ianfosrmuartieonrteachtnoNlogeyismystaemns and technologies and related improveMmeantrsctoususppGortroourugrpowth; our ability to protect the security of information about our business and our customers, suppliers, business partners and employees; our ability to comply with existing, changing, and new government regulations; our ability to manage litigation risks from our customers, employees and other third parties; our ability to manage risks associated with product liability claims and product recalls; the impact of adverse local conditions, weather, natural disasters and other events; and our ability to manage the negative effects of inventory shrinkage. The Company's filings with the SEC are available at the SEC's web site at www.sec.gov. The forward-looking statements made in this presentation relate only to events as of the date on which the statements were made. Except as may be required by law, the Company disclaims obligations to update its forward-looking statements to reflect events and circumstances after the date on which the statements were made or to reflect the occurrence of unanticipated events. Investors are cautioned not to place undue reliance on any forward-looking statements. 3 3
Agenda Cautionary Statement Regarding Forward-Looking Statements This presentation contains forward-looking statements, which are based on management's current expectations, estimates and projections and are not guarantees of future performance. Forward looking statements include statements regarding the Company’s real estate, merchandise, marketing and distribution strategies, projected economics for relocated stores, outlook for sales and gross margin, anticipated capital investments and liquidity. •Tuesday Morning – Who We Were Reference is hereby made to the Company's filings with the Securities and Exchange Commission, including, but not limited to, "Cautionary Statement Regarding Forward-Looking Statements" and "Item 1A. Risk Factors" of the Company's Annual Report on Form 10-K for the fiscal year ended June 30, 2016, for examples of risks, uncertainties and events that could cause our actual results to differ materially from the expectations expressed in our forward-looking statements. These risks, uncertainties and events include, but are not limited to, the following: our abilit•y to suTcceussefullsy imdpleameynt oMur loong-rtenrm ibnusigness–stratWegy; chhaongesWin eceonoAmic raned poTlitiocal dconadityions which may adversely affect consumer spending; our failure to identify and respond to changes in consumer trends and preferences; our ability to continuously attract buying opportunities for off-price merchandise and anticipate consumer demand; our ability to successfully manage our inventory balances profitably; our ability to effectively manage our supply chain operations; loss of, disruption in operations, or increased costs in the operation of our distribution center facilities; loss or departure of one or more members of our senior management or other key management employees; increase•d or neRw ceomvpeitietionw; our oabilfity Oto suuccerssfSullyterxeacuteeougr stiractegyIonf oipteinaingtnievw setorses and relocating and expanding existing stores; increases in fuel prices and changes in transportation industry regulations or conditions; our ability to generate strong cash flows from operations and to continue to access credit markets; increases in the cost or a disruption in the flow of our imported products; the success of our marketing, advertising and promotional efforts; our ability to attract, train and retain quality employees in appropriate numbers, including key employees and management; seasonal and quarterly fluctuations; our ability to maintain and protect our information technology systems and tech•nologiRes aendvreliaetedwimproovemfeFnts itonsuapponrt courigarowlsth; oaur anbildity toCprotuectrthreesencurtity Oof infuormtaltoionoabkout our business and our customers, suppliers, business partners and employees; our ability to comply with existing, changing, and new government regulations; our ability to manage litigation risks from our customers, employees and other third parties; our ability to manage risks associated with product liability claims and product recalls; the impact of adverse local conditions, weather, natural disasters and other events; and our ability to manage the negative effects of inventory shrinkage. The Company's filings with the SEC are available at the SEC's web site at www.sec.gov. The forward-looking statements made in this presentation relate only to events as of the date on which the statements were made. Except as may be required by law, the Company disclaims obligations to update its forward-looking statements to reflect events and circumstances after the date on which the statements were made or to reflect the occurrence of unanticipated events. Investors are cautioned not to place undue reliance on any forward-looking statements. 4 4
Tuesday Morning: Who We Were Founded:1974 in Dallas, TX “Pop-Up” shop format 2017 1974 Evolved Concept: Open year-round/7x per week 5 5 • Event driven • 4 warehouse sales/year • Public with 57 stores in 1984 • Private with 315 stores in 1997 • Public again with 354 stores in 1999
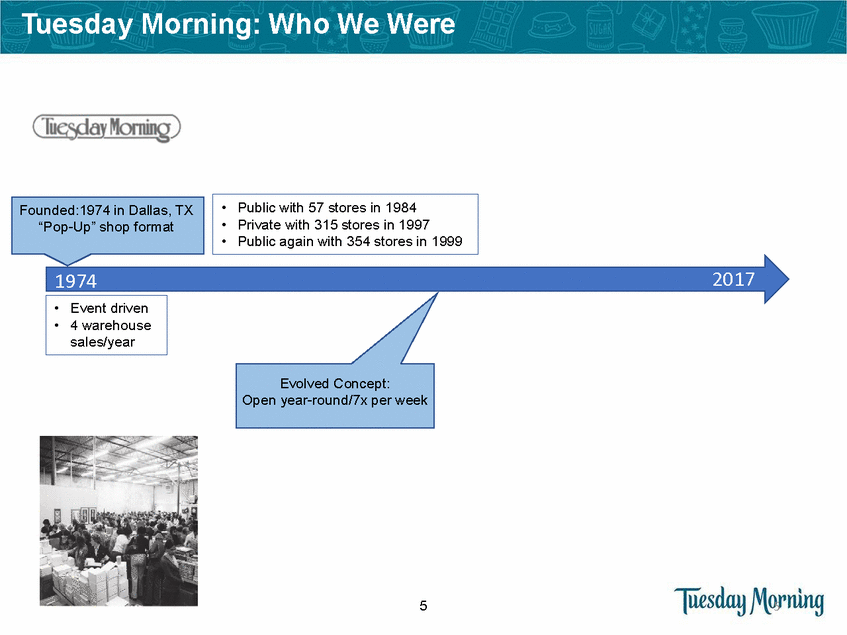
Tuesday Morning: Who We Were Founded: 1974 / Dallas, TX “Pop-Up” Shop Format 2017 1974 • • Event Driven 4 Warehouse Sales/Year Evolved Concept: Open year-round/7x per week 6 6 • Rapid store growth into low-cost locations • Expanded into non-core categories • Period of underinvestment in IT/Supply Chain
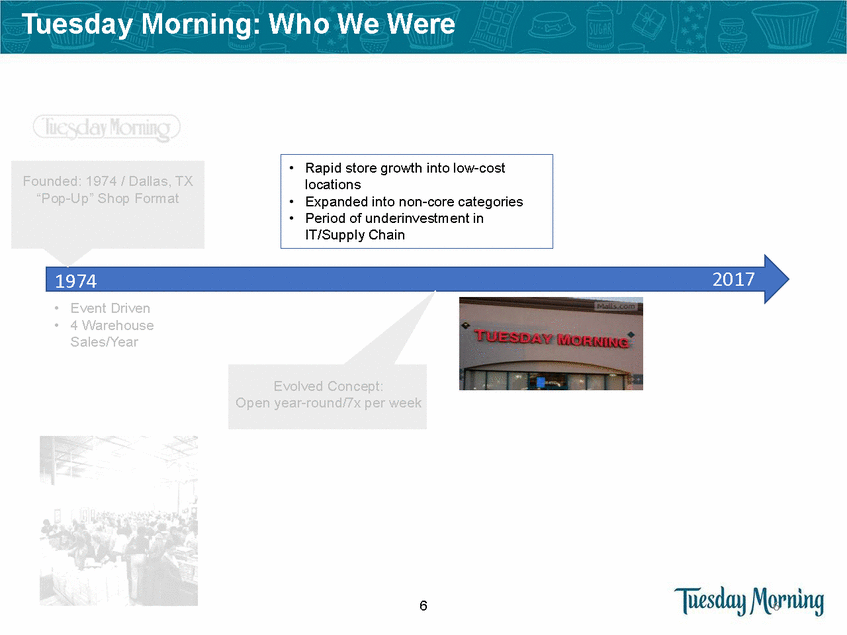
Tuesday Morning: Who We Were Merchandise Sales Contribution FY12 7
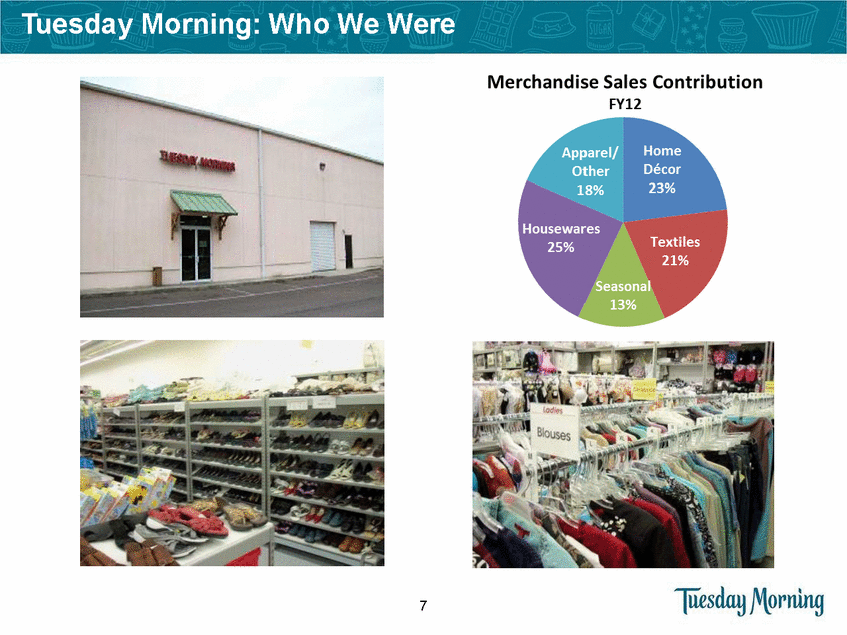
Tuesday Morning: Who We Are Today Today: Actively positioning Tuesday Morning for Success • Rapid store growth into low-cost locations Expanded into non-core categories Period of underinvestment in IT/supply chain Founded: 1974 / Dallas, TX “Pop-Up” Shop Format • • 2017 1974 • • Event Driven 4 Warehouse Sales/Year 8 • Active period of investment including 2nd DC in Phoenix • Focused on improved real estate, merchandising and marketing initiatives
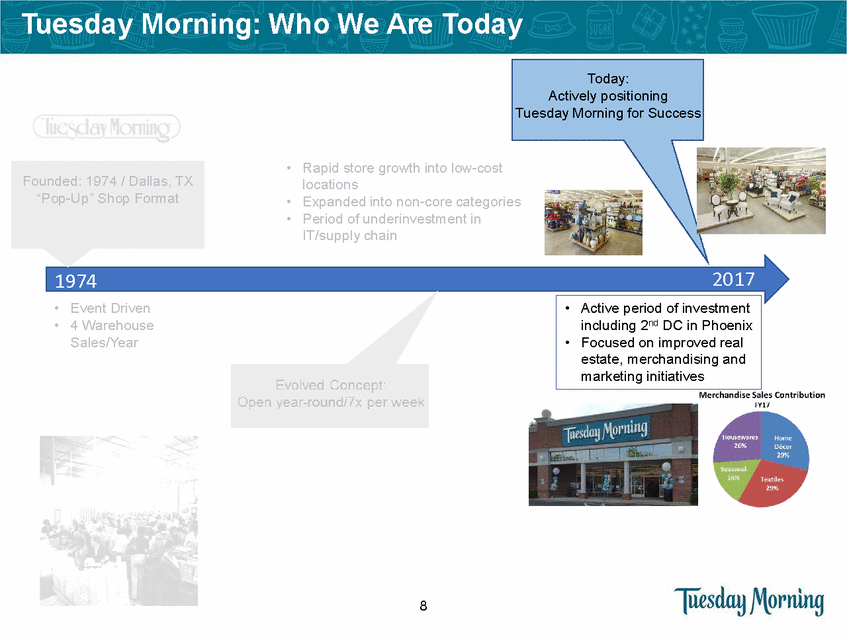
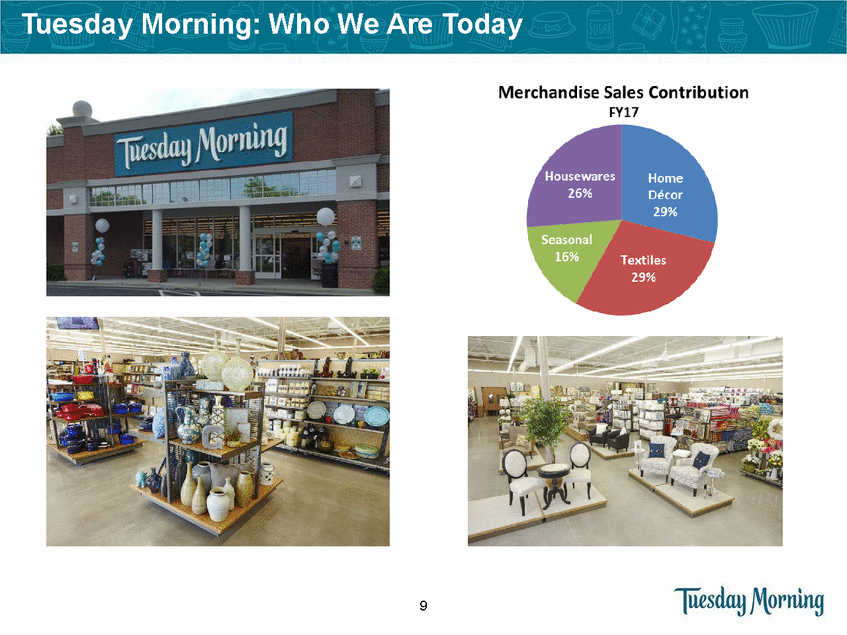
Tuesday Morning: Who We Are Today Merchandise Sales Contribution FY17 9
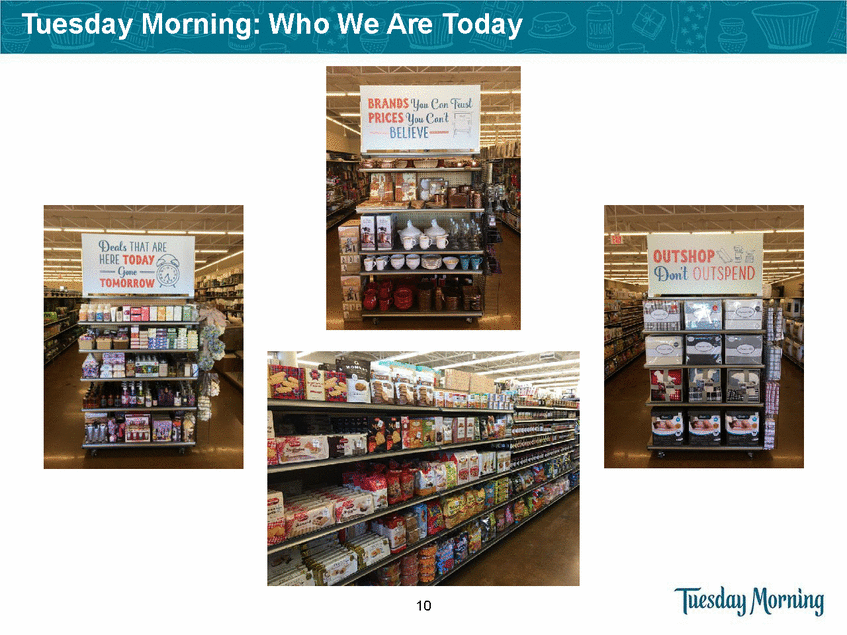
Tuesday Morning: Who We Are Today 10
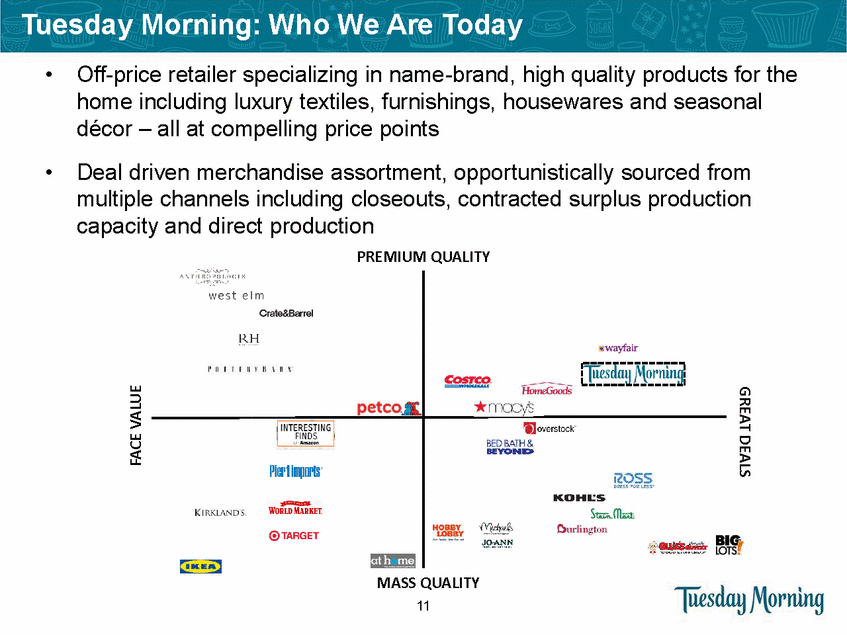
Tuesday Morning: Who We Are Today • Off-price retailer specializing in name-brand, high quality products for the home including luxury textiles, furnishings, housewares and seasonal décor – all at compelling price points Deal driven merchandise assortment, opportunistically sourced from • multiple channels including closeouts, contracted surplus production capacity and direct production PREMIUM QUALITY MASS QUALITY 11 GREAT DEALS FACE VALUE
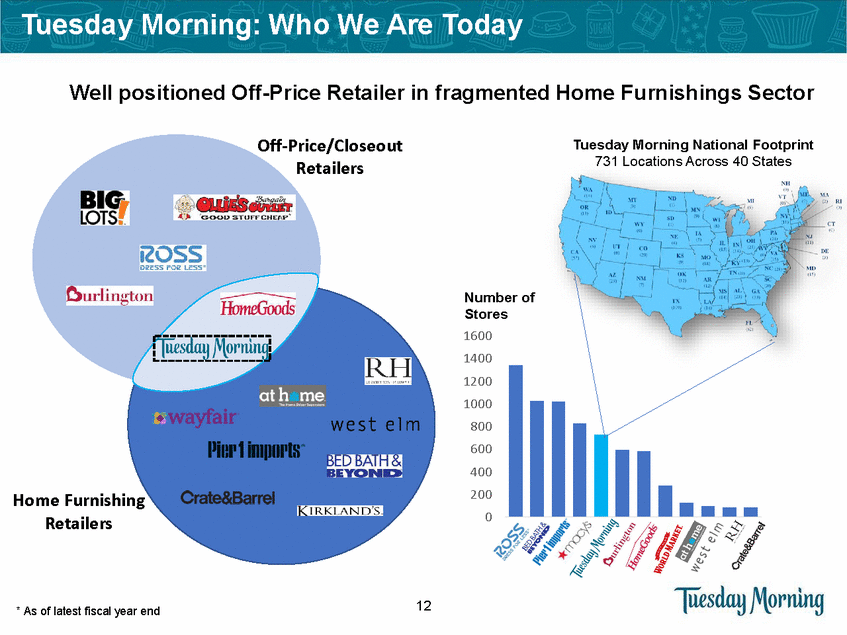
Tuesday Morning: Who We Are Today Well positioned Off-Price Retailer in fragmented Home Furnishings Sector Off-Price/Closeout Retailers Tuesday Morning National Footprint 731 Locations Across 40 States Number of Stores 1600 1400 1200 1000 800 600 400 200 0 Home Furnishing Retailers 12 * As of latest fiscal year end
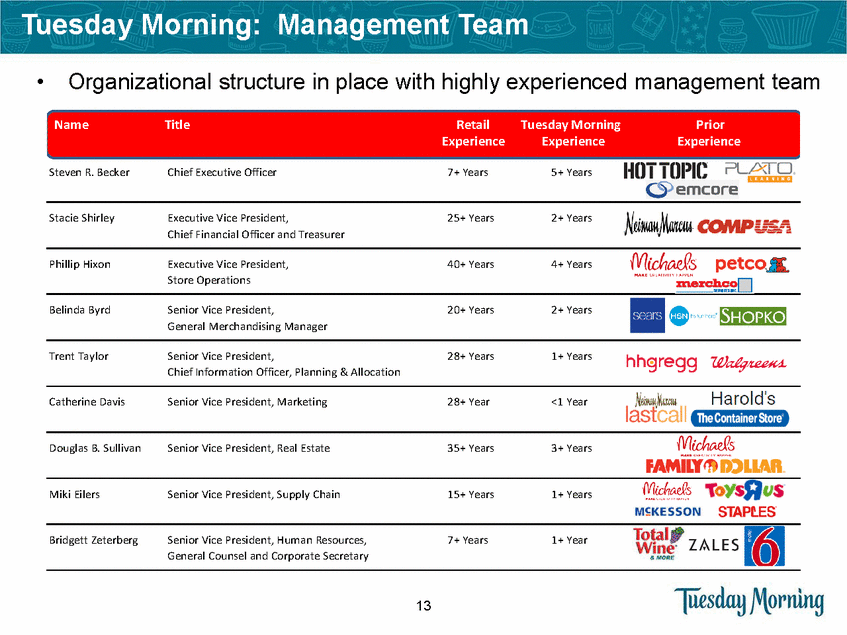
Tuesday Morning: Management Team •Organizational structure in place with highly experienced management team Name Title Retail Experience Tuesday Morning Experience Prior Experience Steven R. Becker Chief Executive Officer 7+ Years 5+ Years Stacie Shirley Executive Vice President, 25+ Years 2+ Years Chief Financial Officer and Treasurer Phillip Hixon Executive Vice President, 40+ Years 4+ Years Store Operations Belinda Byrd Senior Vice President, 20+ Years 2+ Years General Merchandising Manager Trent Taylor Senior Vice President, 28+ Years 1+ Years Chief Information Officer, Planning & Allocation Catherine Davis Senior Vice President, Marketing 28+ Year <1 Year Douglas B. Sullivan Senior Vice President, Real Estate 35+ Years 3+ Years Miki Eilers Senior Vice President, Supply Chain 15+ Years 1+ Years Bridgett Zeterberg Senior Vice President, Human Resources, 7+ Years 1+ Year General Counsel and Corporate Secretary 13
Review of Strategic Initiatives 14
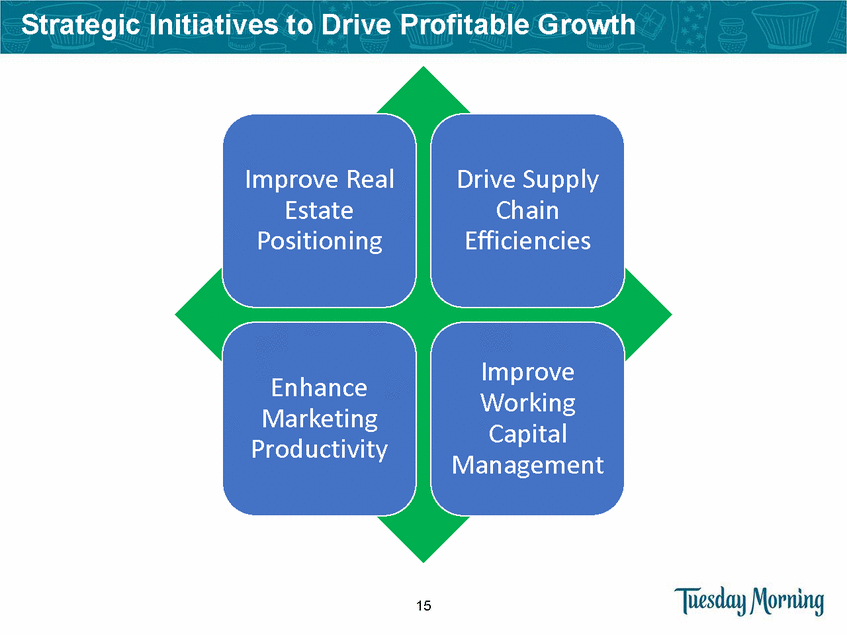
Strategic Initiatives to Drive Profitable Growth Improve Real Estate Positioning Drive Supply Chain Efficiencies Improve Working Capital Management Enhance Marketing Productivity 15
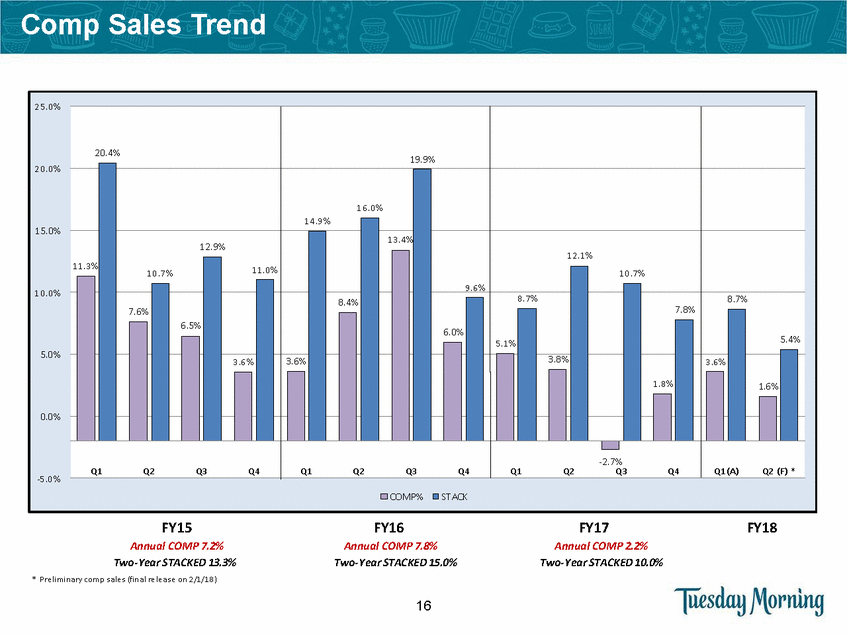
Comp Sales Trend -5.0% FY15 Annual COMP 7.2% Two-Year STACKED 13.3% FY16 Annual COMP 7.8% Two-Year STACKED 15.0% FY17 FY18 Annual COMP 2.2% Two-Year STACKED 10.0% * Prelimina ry comp s a les (fina l relea s e on 2/1/18) 16 25.0% 20.0% 15.0% 10.0% 5.0% 0.0% Q1 Q2 Q3 Q4 COMP% STACK 20.4% 19.9% 16.0% 14.9% 11.3% 12.9% 9.6% 12.1% 13.4% 10.7% 11.0% 10.7% 7.6% 6.5% 8.4% 8.7% 7.8% 8.7% 6.0% 5.1% 5.4% 3.6% 3.6% 3.8% 1.8% 3.6% 1.6% Q1 Q2 Q3 Q4 Q1 Q2 Q3 Q4 Q1(A) Q2 (F) * -2.7%
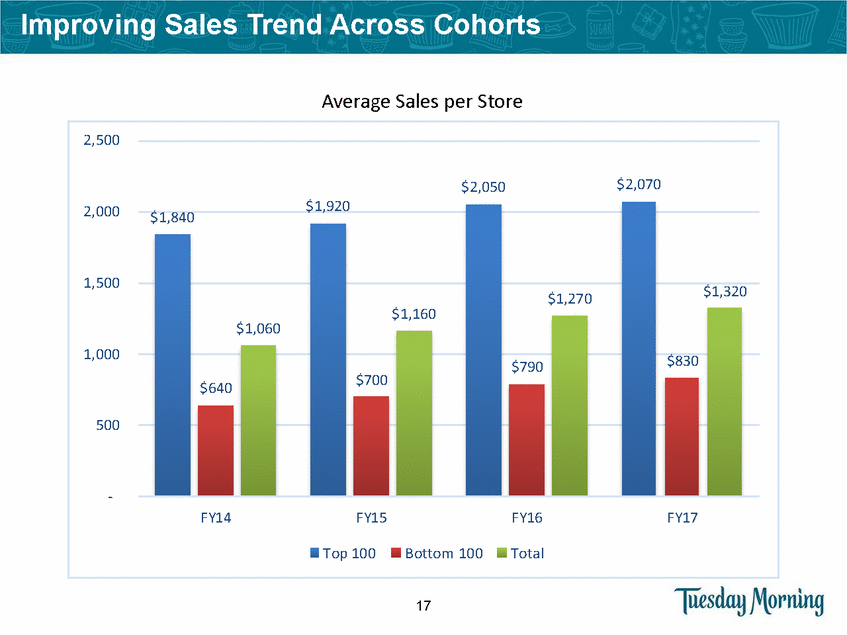
Improving Sales Trend Across Cohorts Average Sales per Store $1,840 $1,320 $1,270 $1,060 $700 $640 17 2,500 $2,050 $2,070 2,000 $1,920 1,500 $1,160 1,000 $790 $830 500 - FY14 FY15 FY16 FY17 Top 100 Bottom 100 Total
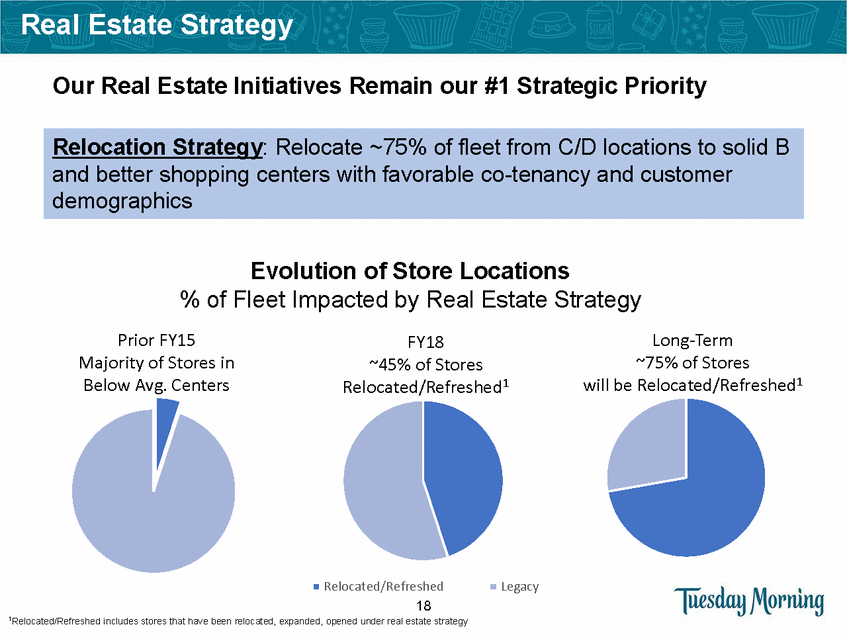
Real Estate Strategy Our Real Estate Initiatives Remain our #1 Strategic Priority Evolution of Store Locations % Prior FY15 of Fleet Impacted by Real Estate FY18 Strategy Long-Term ~75% of Stores will be Relocated/Refreshed1 Majority of Stores in Below Avg. Centers ~45% of Stores Relocated/Refreshed1 Relocated/Refreshed 18 Legacy 1Relocated/Refreshed includes stores that have been relocated, expanded, opened under real estate strategy Relocation Strategy: Relocate ~75% of fleet from C/D locations to solid B and better shopping centers with favorable co-tenancy and customer demographics
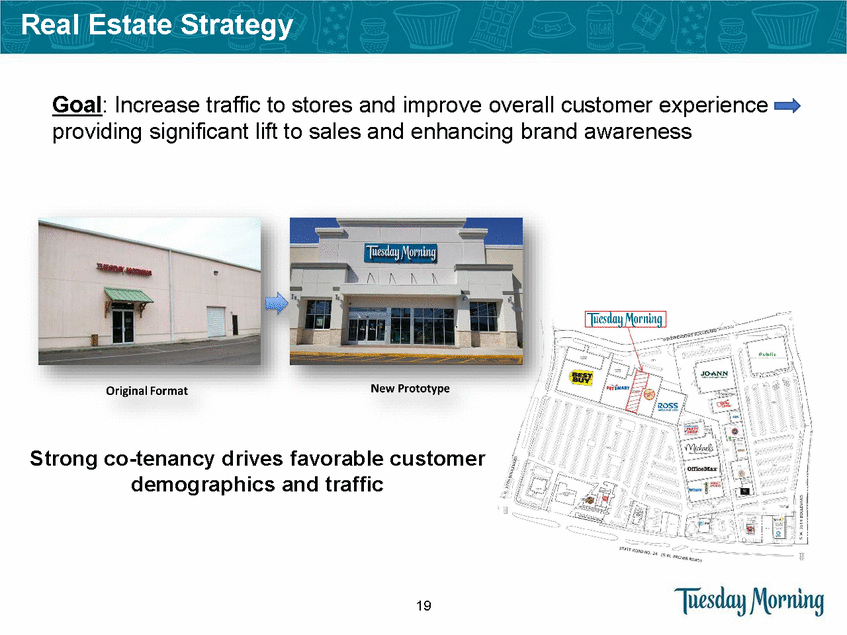
Real Estate Strategy Goal: Increase traffic to stores and improve overall customer experience providing significant lift to sales and enhancing brand awareness Strong co-tenancy drives favorable customer demographics and traffic 19
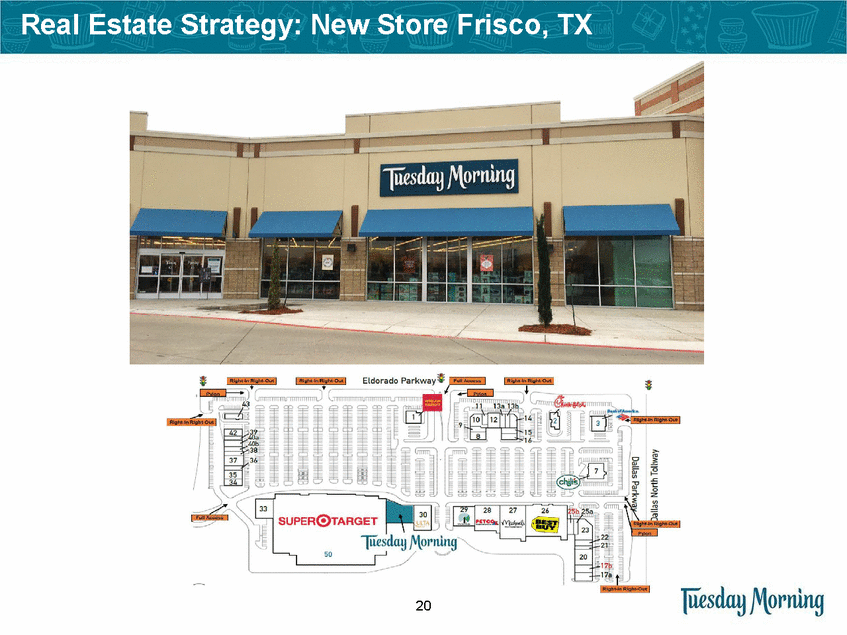
Real Estate Strategy: New Store Frisco, TX 20
Real Estate Strategy: Relocation Economics 1 Targeted store size is 10K – 12K, but actual results vary based upon real estate opportunities 2 Represents 1) average annual sales volume for the first year post-relocation for stores relocated in calendar 2015 and 2) estimated annual sales volume for the first year post-relocation for stores relocated in calendar 2016 Calculated using the estimated store contribution before tax, depreciation and excluding pre-opening costs Includes capital spend net of tenant allowances and net working capital. Amounts are approximations based on an average store size. 3 4 21 Store Size 1 10K – 12K sq/ft Year 1 Sales 2 ~$1.6 million Store Contribution Margin 3 ~15% Net Investment 4 ~$400K Payback Period ~2 years
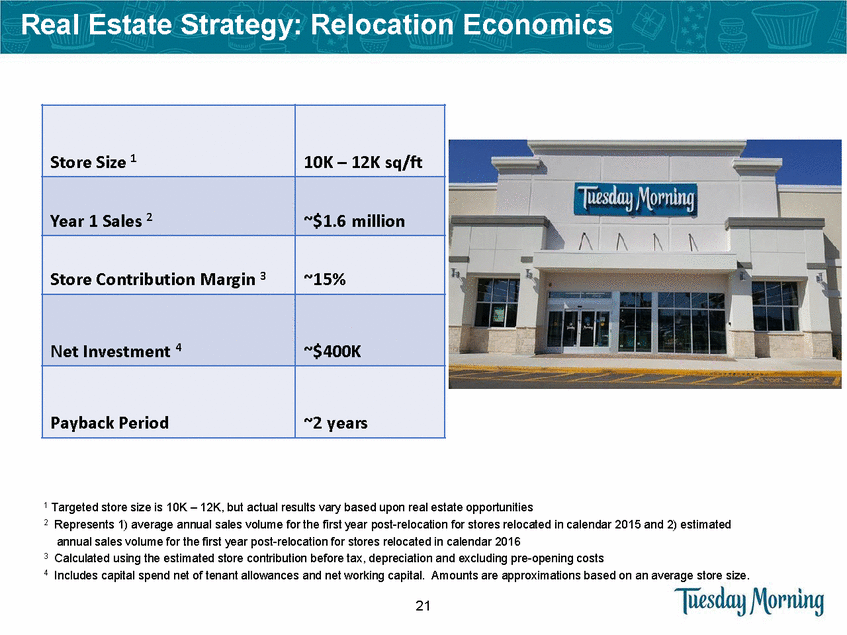
Real Estate Strategy: Development Roadmap FY15 FY16 FY17 FY18 1 FY15 - FY18 1 Relocation & Expansions 30 relocations 7 Expansions 46 Relocations 7 Expansions 52 Relocations 13 Expansions 45 Relocations 8 Expansions 173 Relocations 35 Expansions New Store Growth 5 New Stores 16 New Stores 21 New Stores 15 New Stores 57 New Stores Portfolio Close 46 Stores Close 34 Stores Close 41 Stores Close 20 Stores Close 141 Stores Improvement Portfolio Improvement Total # of Stores Touched 88 Stores 103 Stores 127 Stores 88 Stores 406 Stores Ending Store Count 769 Stores 751 Stores 731 Stores 726 Stores 1 Represents current estimated real estate activity plan in FY18 22
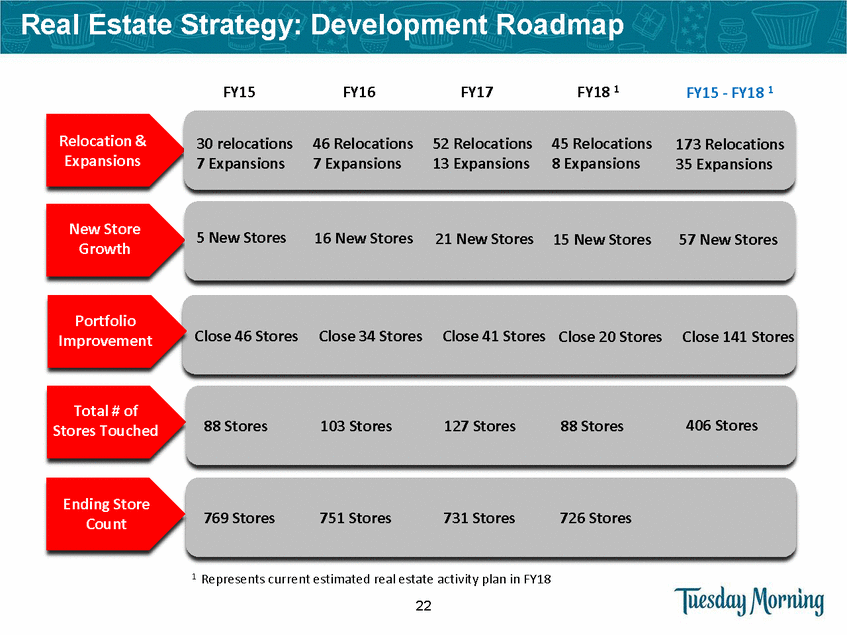
Supply Chain: Build Efficiencies & Improve Productivity • Prior to 2016: Operated one distribution center in Dallas, consisting of 5 non-contiguous buildings. Very inefficient and expensive process due to multiple touches required • FY 2017: Began operating new 600K square foot DC in Phoenix to handle West Coast stores chain leadership and support growing sales volume. Hired new supply 23
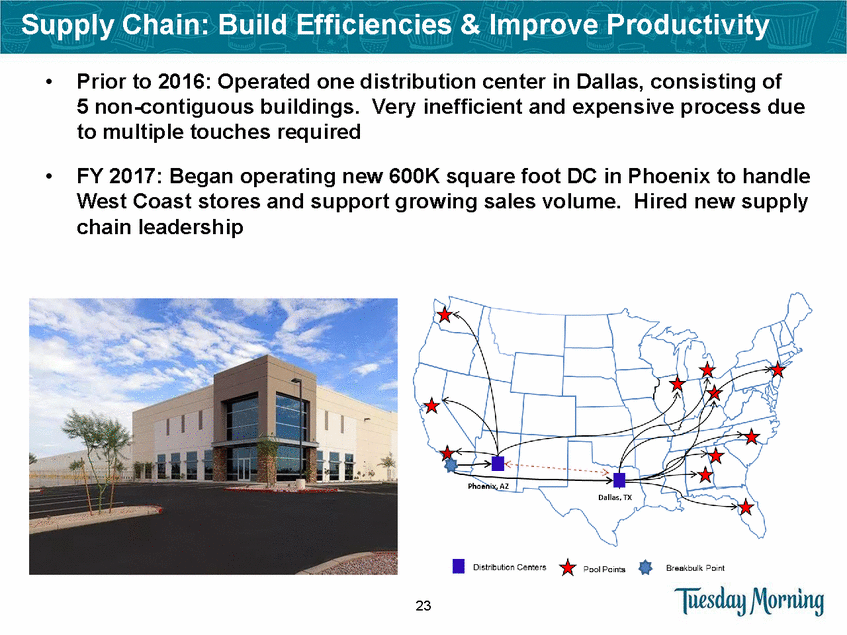
Marketing Prior Marketing: • • Program entirely focused on monthly promotional ad events with limited brand messaging Events were supported through traditional media (newspaper inserts/direct mail), targeting an older customer base Limited customer recognition through an ineffective loyalty program • 24
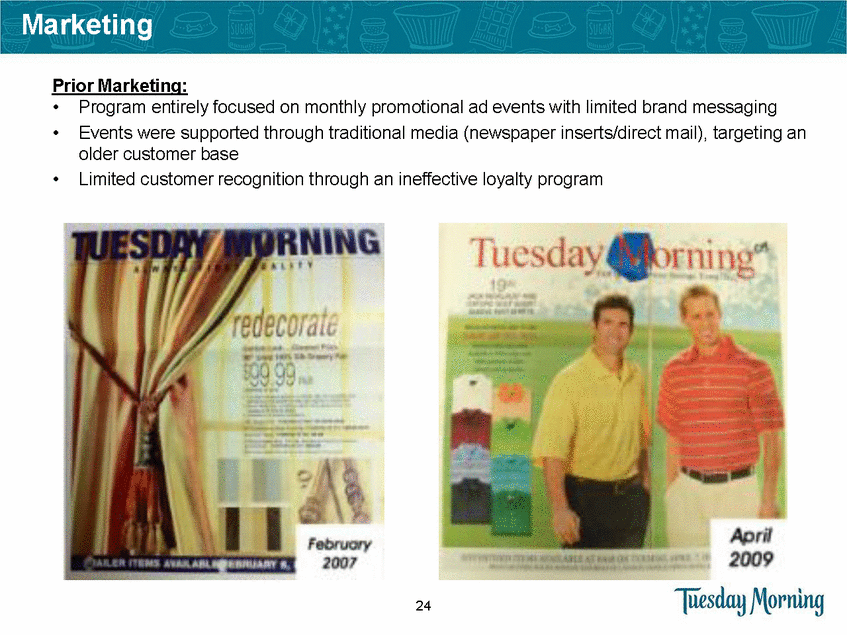
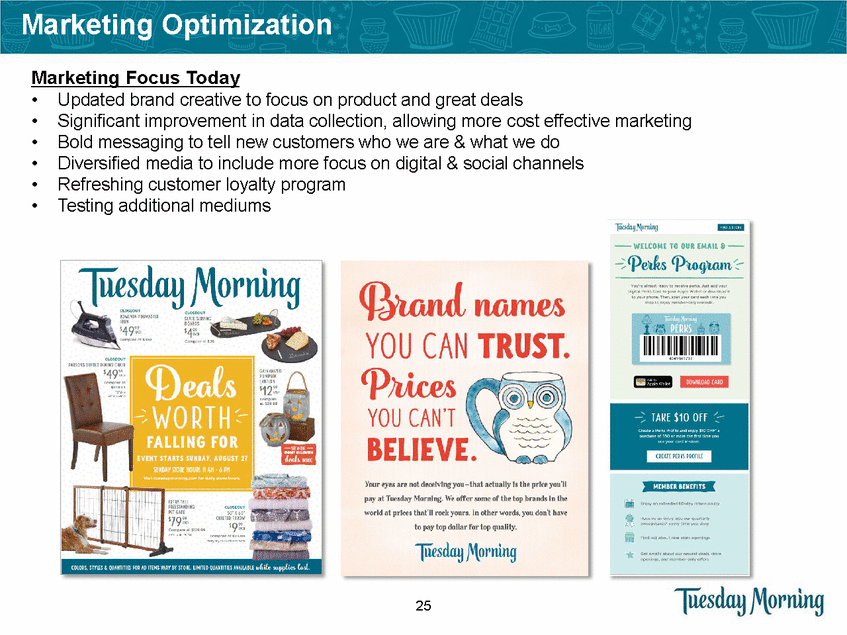
Marketing Optimization Marketing Focus Today • • • • • • Updated brand creative to focus on product and great deals Significant improvement in data collection, allowing more cost effective marketing Bold messaging to tell new customers who we are & what we do Diversified media to include more focus on digital & social channels Refreshing customer loyalty program Testing additional mediums 25
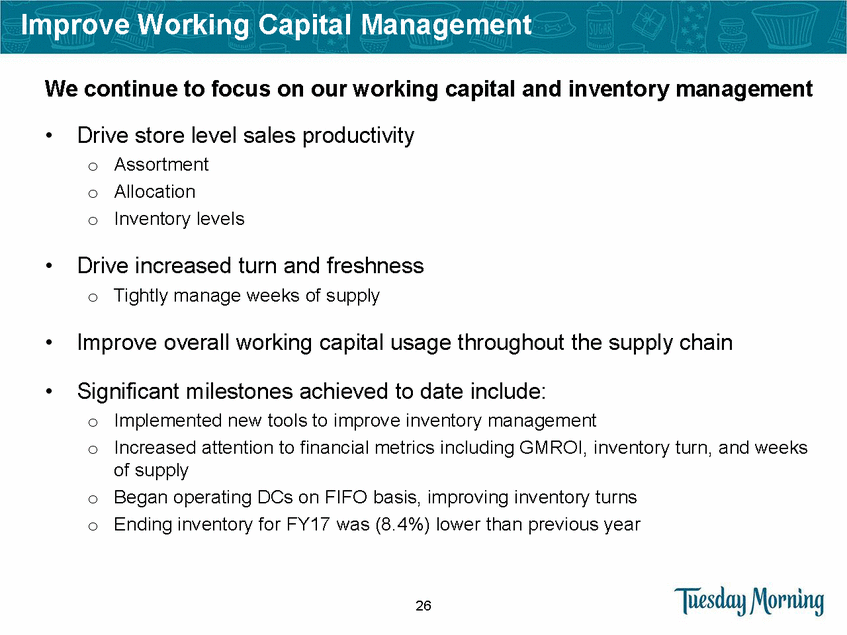
Improve Working Capital Management We continue to focus on our working capital and inventory management • Drive store level sales productivity Assortment Allocation Inventory levels o o o • Drive increased turn and freshness Tightly manage weeks of supply o • Improve overall working capital usage throughout the supply chain • Significant milestones achieved to date include: Implemented new tools to improve inventory management Increased attention to financial metrics including GMROI, inventory turn, and weeks of supply Began operating DCs on FIFO basis, improving inventory turns Ending inventory for FY17 was (8.4%) lower than previous year o o o o 26
Financial Review 27

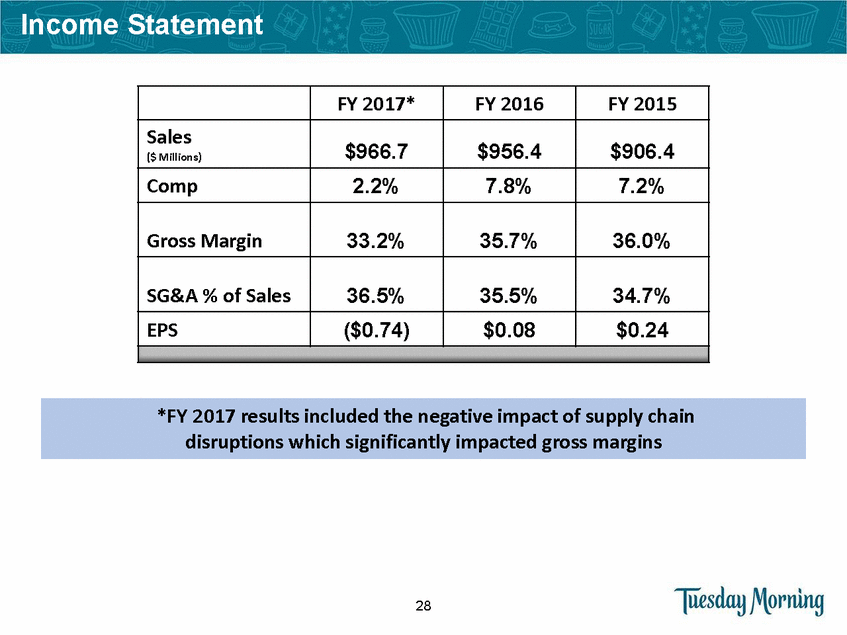
Income Statement 28 *FY 2017 results included the negative impact of supply chain disruptions which significantly impacted gross margins FY 2017* FY 2016 FY 2015 Sales ($ Millions) $966.7 $956.4 $906.4 Comp 2.2% 7.8% 7.2% Gross Margin 33.2% 35.7% 36.0% SG&A % of Sales 36.5% 35.5% 34.7% EPS ($0.74) $0.08 $0.24
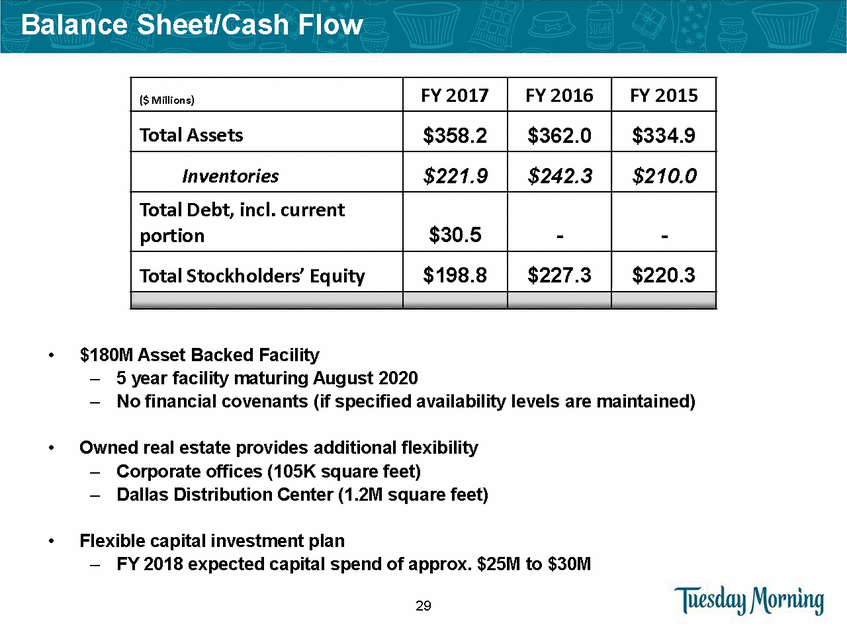
Balance Sheet/Cash Flow • $180M Asset Backed Facility – – 5 year facility maturing August 2020 No financial covenants (if specified availability levels are maintained) • Owned real estate provides additional flexibility – – Corporate offices (105K square feet) Dallas Distribution Center (1.2M square feet) • Flexible capital investment plan – FY 2018 expected capital spend of approx. $25M to $30M 29 ($ Millions) FY 2017 FY 2016 FY 2015 Total Assets $358.2 $362.0 $334.9 Inventories $221.9 $242.3 $210.0 Total Debt, incl. current portion $30.5 - - Total Stockholders’ Equity $198.8 $227.3 $220.3
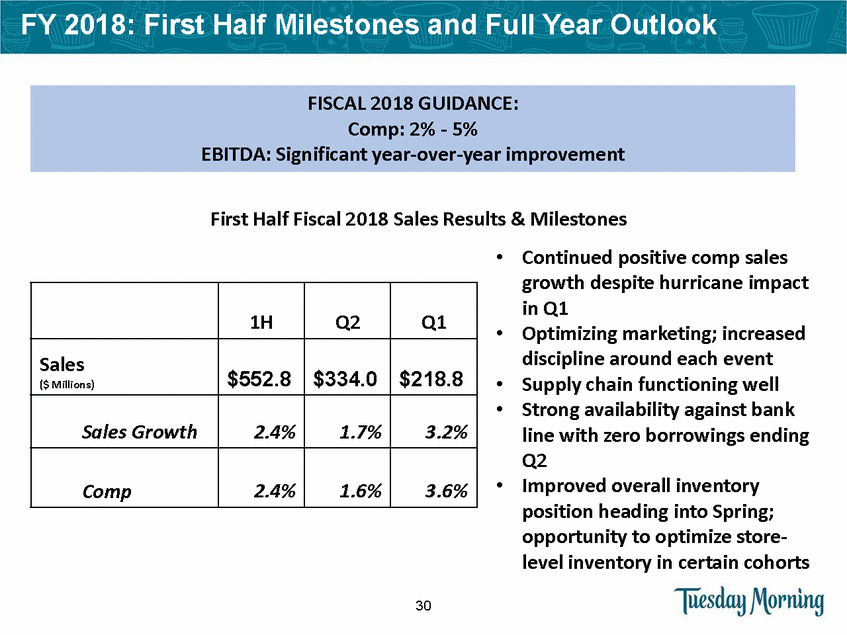
FY 2018: First Half Milestones and Full Year Outlook First Half Fiscal 2018 Sales Results & Milestones • Continued positive comp sales growth despite hurricane impact in Q1 Optimizing marketing; increased discipline around each event Supply chain functioning well Strong availability against bank line with zero borrowings ending Q2 Improved overall inventory position heading into Spring; opportunity to optimize store-level inventory in certain cohorts • • • • 30 1H Q2 Q1 Sales ($ Millions) $552.8 $334.0 $218.8 Sales Growth 2.4% 1.7% 3.2% Comp 2.4% 1.6% 3.6% FISCAL 2018 GUIDANCE: Comp: 2% - 5% EBITDA: Significant year-over-year improvement
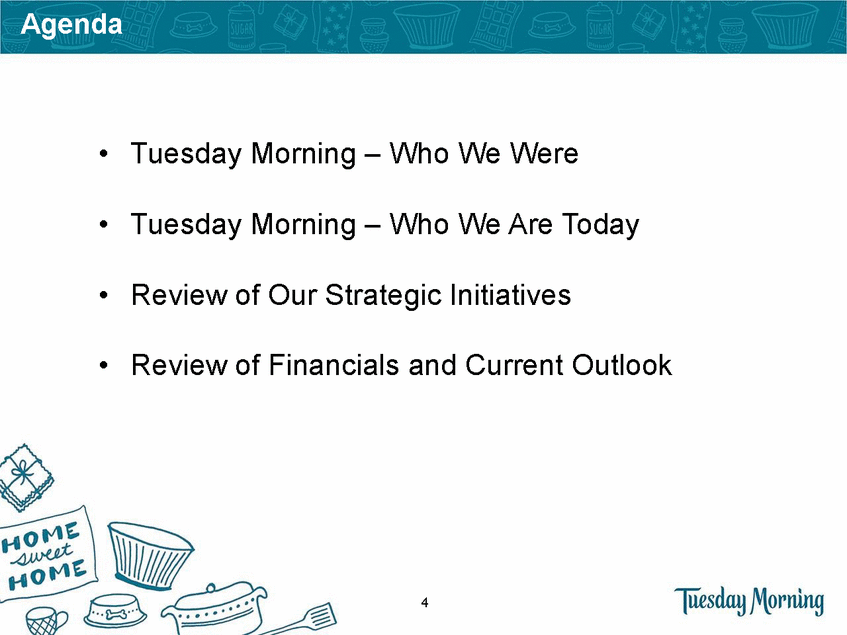
Tuesday Morning: Long Term Outlook Real Estate Repositioning Sales Supply Chain Efficiencies and Productivity Gross Margin Sales Gross Merchandise and Inventory Optimization Margin Sales Marketing Productivity 31
