Attached files
| file | filename |
|---|---|
| EX-10.31 - EX-10.31 - TUESDAY MORNING CORP/DE | a2221194zex-10_31.htm |
| EX-23.1 - EX-23.1 - TUESDAY MORNING CORP/DE | a2221194zex-23_1.htm |
| EX-31.1 - EX-31.1 - TUESDAY MORNING CORP/DE | a2221194zex-31_1.htm |
| EX-31.2 - EX-31.2 - TUESDAY MORNING CORP/DE | a2221194zex-31_2.htm |
| EX-32.2 - EX-32.2 - TUESDAY MORNING CORP/DE | a2221194zex-32_2.htm |
| EX-32.1 - EX-32.1 - TUESDAY MORNING CORP/DE | a2221194zex-32_1.htm |
| EXCEL - IDEA: XBRL DOCUMENT - TUESDAY MORNING CORP/DE | Financial_Report.xls |
Use these links to rapidly review the document
Table of Contents
Item 8. Financial Statements and Supplementary Data
INDEX TO CONSOLIDATED FINANCIAL STATEMENTS
UNITED STATES
SECURITIES AND EXCHANGE COMMISSION
Washington, D.C. 20549
FORM 10-K
| (Mark One) | ||
ý |
ANNUAL REPORT PURSUANT TO SECTION 13 OR 15(d) OF THE SECURITIES EXCHANGE ACT OF 1934 |
|
For the fiscal year ended June 30, 2014 |
||
or |
||
o |
TRANSITION REPORT PURSUANT TO SECTION 13 OR 15(d) OF THE SECURITIES EXCHANGE ACT OF 1934 |
|
Commission File Number 0-19658
Tuesday Morning Corporation
(Exact name of registrant as specified in its charter)
| Delaware (State or other jurisdiction of incorporation or organization) |
75-2398532 (I.R.S. Employer Identification No.) |
|
6250 LBJ Freeway Dallas, Texas 75240 (972) 387-3562 (Address, zip code and telephone number, including area code, of registrant's principal executive offices) |
||
Securities registered pursuant to Section 12(b) of the Act:
| Title of each class | Name of each exchange on which registered | |
|---|---|---|
| Common Stock, $0.01 par value per share | The NASDAQ Stock Market LLC |
Securities registered pursuant to Section 12(g) of the Act: None
Indicate by check mark if the registrant is a well-known seasoned issuer, as defined in Rule 405 of the Securities Act. Yes o No ý
Indicate by check mark if the registrant is not required to file reports pursuant to Section 13 or Section 15(d) of the Act. Yes o No ý
Indicate by check mark whether the registrant (1) has filed all reports required to be filed by Section 13 or 15(d) of the Securities Exchange Act of 1934 during the preceding 12 months (or for such shorter period that the registrant was required to file such reports), and (2) has been subject to such filing requirements for the past 90 days. Yes ý No o
Indicate by check mark whether the registrant has submitted electronically and posted on its corporate Web site, if any, every Interactive Data File required to be submitted and posted pursuant to Rule 405 Regulation S-T during the preceding 12 months (or for such shorter period that the registrant was required to submit and post such files). Yes ý No o
Indicate by check mark if disclosure of delinquent filers pursuant to Item 405 of Regulation S-K is not contained herein, and will not be contained, to the best of registrant's knowledge, in definitive proxy or information statements incorporated by reference in Part III of this Form 10-K or any amendment of this Form 10-K. ý
Indicate by check mark whether the registrant is a large accelerated filer, an accelerated filer, a non-accelerated filer, or a smaller reporting company. See definitions of "large accelerated filer," "accelerated filer," and "smaller reporting company" in Rule 12b-2 of the Exchange Act.
| Large accelerated filer o | Accelerated filer ý | Non-accelerated filer o (Do not check if a smaller reporting company) |
Smaller reporting company o |
Indicate by check mark whether the registrant is a shell company (as defined in Rule 12b-2 of the Act). Yes o No ý
The aggregate market value of shares of the registrant's common stock held by non-affiliates of the registrant at December 31, 2013 was approximately $374,324,946 based upon the closing sale price on the Nasdaq Global Select Market reported for such date.
As of the close of business on August 19, 2014, there were 43,663,091 outstanding shares of the registrant's common stock.
Documents Incorporated By Reference:
Portions of the Registrant's Definitive Proxy Statement to be filed in connection with the 2014 Annual Meeting of Stockholders are incorporated herein by reference (to the extent indicated) into Part III of this Form 10-K.
2
3
Cautionary Statement Regarding Forward-Looking Statements
This Form 10-K contains forward-looking statements within the meaning of the federal securities laws and the Private Securities Litigation Reform Act of 1995, which are based on management's current expectations, estimates and projections. These statements may be found throughout this Form 10-K, particularly under the headings "Business" and "Management's Discussion and Analysis of Financial Condition and Results of Operations," among others. Forward-looking statements typically are identified by the use of terms such as "may," "will," "should," "expect," "anticipate," "believe," "estimate," "intend" and similar words, although some forward-looking statements are expressed differently. You should consider statements that contain these words carefully because they describe our expectations, plans, strategies and goals and our beliefs concerning future business conditions, our future results of operations, our future financial positions, and our business outlook or state other "forward-looking" information.
The factors listed below under the heading "Risk Factors" and in other sections of this Form 10-K provide examples of risks, uncertainties and events that could cause our actual results to differ materially from the expectations expressed in our forward-looking statements. These risks, uncertainties and events also include, but are not limited to, the following:
- •
- our ability to successfully implement our long-term business strategy;
- •
- changes in economic and political conditions which may adversely affect consumer spending;
- •
- our failure to identify and respond to changes in consumer trends and preferences;
- •
- our ability to continuously attract buying opportunities for off-price merchandise and anticipate
consumer demand;
- •
- our ability to successfully manage our inventory balances;
- •
- loss of or disruption in our centralized distribution center;
- •
- loss or departure of one or more members of our senior management or other key management
employees;
- •
- increased or new competition;
- •
- our ability to successfully execute our strategy of opening new stores and relocating or
expanding existing stores;
- •
- increases in fuel prices and changes in transportation industry regulations or conditions;
- •
- our ability to generate strong cash flows from operations and to continue to access credit
markets;
- •
- increases in the cost or a disruption in the flow of our imported products;
- •
- the success of our marketing, advertising and promotional efforts;
- •
- our ability to attract and retain quality sales, distribution center and other associates in
large numbers, as well as, experienced buying and management personnel;
- •
- seasonal and quarterly fluctuations;
- •
- our ability to maintain and protect our information technology systems and technologies;
- •
- our ability to comply with various government regulations;
- •
- our ability to manage litigation risks from our customers, employees and other third
parties;
- •
- our ability to manage risks associated with product liability claims and product recalls;
- •
- the impact of adverse local conditions, natural disasters and other events; and
4
- •
- our ability to manage the negative effects of inventory shrinkage.
The forward-looking statements made in this Form 10-K relate only to events as of the date on which the statements are made. Except as may be required by law, we undertake no obligation to update any forward-looking statements to reflect events or circumstances after the date on which the statements were made or to reflect the occurrence of unanticipated events. Investors are cautioned not to place undue reliance on any forward-looking statements.
The terms "Tuesday Morning," "the Company," "we," "us," and "our" as used in this Form 10-K refer to Tuesday Morning Corporation and its subsidiaries.
5
Business Overview
We are a leading retailer of off-price, upscale decorative home accessories, housewares, seasonal goods and famous-maker gifts that we generally sell below retail prices charged by department stores and specialty and on-line retailers in the United States. We opened our first store in 1974 and operated 810 stores in 41 states as of June 30, 2014. Our strong everyday value proposition is also supported with promotional sales events that create a sense of urgency and excitement for our customer base.
We sell first quality, upscale home furnishings, housewares, gifts and other related items. We do not sell seconds, irregulars, or refurbished products. Our merchandise primarily consists of home décor, furniture, bed and bath, kitchen, electrics, luggage, toys, crafts, pets, and seasonal goods. We focus on well-recognized, first quality, brand name merchandise, which has included Le Creuset and Calphalon cookware, Cuisinart and Kitchenaid appliances, Sferra and Peacock Alley linens, Kenneth Cole and Michael Kors fashion accessories, Hartmann and Samsonite luggage, Lenox tabletop, Waterford crystal, Hunter and Casablanca fans, and many others.
We believe that our well recognized, first quality brand name merchandise and value-based pricing have enabled us to establish and maintain strong customer loyalty. We differ from other discount retailers in that we do not stock continuing lines of merchandise. Because we offer a continuity of merchandise categories with ever-changing individual product offerings, we provide our customers a higher proportion of new merchandise items than general merchandisers. We are continually looking to add new complementary merchandise categories that appeal to our customers. Our customers, who are predominantly women from middle to upper-income households, are brand savvy, value-conscious customers seeking quality products at discount pricing. While we offer our customers consistent merchandise categories, our offerings include limited quantities of new and appealing products within these categories, creating a "treasure hunt" atmosphere in our stores.
We believe that our customers are attracted to our stores primarily because of our limited quantities of first quality, brand name merchandise which we offer at attractive prices. Our stores operate in both primary and secondary locations of major suburban markets, such as strip malls, near our middle and upper-income customers. We are generally able to obtain favorable lease terms because of our flexibility regarding site selection and our "no frills" format, allowing us to use a wide variety of space configurations. We operate our business as a single operating segment.
Business Strategy
During the latter part of the 2012 calendar year, we began a transformation in our Company in order to regain our position as a leader in off-price retail. The Company has executed a number of critical steps under its business turnaround strategy. These steps include changes in senior management and board composition, exiting certain categories, cleaning up and reorganizing stores, structurally reducing the level of clearance merchandise, modifying company policies, and eliminating assets no longer needed. During the initial stages of our business turnaround strategy, we took specific steps to improve our inventory management process, sourcing of inventory and our customer's in store experience. Further stages of our business turnaround strategy have focused on store operations, merchandise offerings, sales productivity and profitability. During the fourth quarter of fiscal year 2014, we continued work on the final phase of our turnaround strategy which includes the sell-off of exited categories, expansion of replacement categories, a further reduction of our clearance merchandise, and enhancements to our store layouts. As a result of these programs, the Company has incurred additional costs and expenses. As we move forward, our focus will be continued improvement of merchandise assortment, efficient supply chain, store demographics and an improved infrastructure. We believe that
6
we can build on our strong brand name and solid history to provide an improved value proposition to our customers.
Competition & Seasonality
We believe the principal factors by which we compete are brand names, price and breadth of product offerings. Our prices are generally below department stores and specialty and on-line retailer prices and we offer a broad assortment of high-end, first quality, brand name merchandise. We currently compete against a diverse group of retailers, including department and discount stores, specialty, e-commerce and catalog retailers and mass merchants, which sell, among other products, home furnishings, housewares and related products. We also compete in particular markets with a substantial number of retailers that specialize in one or more types of home furnishing and houseware products that we sell. Some of these competitors have substantially greater financial resources that may, among other things, increase their ability to purchase inventory at lower costs or to initiate and sustain aggressive price competition.
Our business is subject to seasonality, with a higher level of our net sales and operating income generated during the quarter ending December 31, which includes the holiday shopping season. Net sales in the quarters ended December 31, 2013, 2012, and 2011 accounted for approximately 33%, 34%, and 34% of our annual net sales for the 2014, 2013 and 2012 fiscal years, respectively.
Working Capital Items
Because of the seasonal nature of our business, our working capital needs are greater in the months leading up to our peak sales period from Thanksgiving to the end of December. The increase in working capital needs during this time is typically financed with cash flow provided by operations and short-term borrowings. Additional details are provided in the Liquidity and Capital Resources section in Item 7, Management's Discussion and Analysis of Financial Condition and Results of Operations.
Inventory is the largest asset on our balance sheet. Efficient inventory management is a key component of our business success and profitability. To be successful, we must maintain sufficient inventory levels to meet our customers' demands while keeping the inventory productive and turning the inventory appropriately to optimize profitability.
Purchasing
We provide an outlet for manufacturers and other sources looking for effective ways to reduce excess inventory resulting from order cancellations by retailers, manufacturing overruns, bankruptcies and excess capacity. Since our inception, we have not experienced significant difficulty in obtaining first quality, brand name off-price merchandise in adequate volumes and at competitive prices. We utilize a mix of both domestic and international suppliers. We pay our suppliers timely and generally do not request special consideration for markdowns, advertising or returns. During fiscal 2014, our top ten vendors accounted for approximately 12% of total purchases, with no single vendor accounting for more than 2.1% of total purchases.
Low Cost Operations
Our Company operates with a low cost structure in comparison to many other retailers. We place great emphasis on expense management throughout the Company. Our stores have a "no frills" format and we are flexible in our site selection in order to maintain favorable lease terms.
7
Customer Shopping Experience
While we offer a "no frills" format in our stores, we have made progress in reorganizing and cleaning our stores to enhance our appearance. We have upgraded our cash registers to facilitate a quicker and easier customer experience at checkout. We offer a flexible return policy and we accept all major payment methods including cash, checks and all major credit cards. We continue to work on initiatives we believe will enhance our customer's shopping experience.
Distribution
We operate a 1.4 million square foot distribution center in Dallas, Texas which services all of our stores throughout the United States. We shipped approximately 100 million units to our stores during fiscal year 2014.
Pricing
Our pricing policy is to sell merchandise generally below retail prices charged by department stores and specialty and on-line retailers. Prices are determined centrally and are uniform at all of our stores. Once a price is determined for a particular item, labels displaying two-tiered pricing are affixed to the product. A typical price tag displays a "Compare At" price, and "Our Price". Our buyers determine and verify retail "Compare At" prices by reviewing prices published in advertisements, catalogues, on-line and manufacturers' suggested retail price lists and by visiting department or specialty stores selling similar merchandise. Our information systems provide daily sales and inventory information, which enables us to evaluate our prices and inventory levels and to adjust prices on unsold merchandise in a timely manner and on a periodic basis as dictated by sales volumes and incoming purchases, thereby managing our inventory levels and competitive pricing.
Employees
As of June 30, 2014, we employed 1,537 persons on a full-time basis and 6,961 persons on a part-time basis. Our employees are not represented by any labor unions. We have not experienced any work stoppage due to labor disagreements, and we believe that our employee relations are strong.
Trademarks and Tradenames
The tradename "Tuesday Morning" is material to our business. We have registered the name "Tuesday Morning" as a service mark with the United States Patent and Trademark office. We have also registered other trademarks including but not limited to "Tuesday Morning Perks®". Solely for convenience, trademarks and trade names referred to in this Form 10-K may appear without the ® or tm symbols, but such references are not intended to indicate, in any way, that we will not assert, to the fullest extend under applicable law, our rights, or the rights of the applicable licensor to these trademarks and trade names.
Corporate Information
Tuesday Morning Corporation is a Delaware corporation incorporated in 1991. Our principal executive offices are located at 6250 LBJ Freeway, Dallas, Texas 75240, and our telephone number is (972) 387-3562.
We maintain a website at www.tuesdaymorning.com. Copies of our Annual Reports on Form 10-K, Quarterly Reports on Form 10-Q, Current Reports on Form 8-K and any amendments to such reports filed with, or furnished to, the Securities and Exchange Commission (the "SEC") are available free of charge on our internet website under the Investor Relations section as soon as reasonably practicable after we electronically file such reports and amendments with, or furnish them to, the SEC.
8
The reports we file or furnish to the SEC may be read and copied at the SEC's Public Reference Room at 100 F Street, NE, Washington, D.C. 20549. Information on the operation of the Public Reference Room may be obtained by calling the SEC at 1-800-SEC-0330. In addition, the SEC maintains a website, www.sec.gov, which contains the reports, proxy and information statements and other information which we file with, or furnish to, the SEC.
Stores and Store Operations
Store Locations. As of June 30, 2014, we operated 810 stores in the following 41 states:
State
|
# of Stores | State
|
# of Stores | ||||||
|---|---|---|---|---|---|---|---|---|---|
Alabama |
23 | Nebraska | 4 | ||||||
Arizona |
22 | Nevada | 7 | ||||||
Arkansas |
14 | New Hampshire | 1 | ||||||
California |
79 | New Jersey | 10 | ||||||
Colorado |
23 | New Mexico | 7 | ||||||
Delaware |
2 | New York | 14 | ||||||
Florida |
65 | North Carolina | 33 | ||||||
Georgia |
35 | North Dakota | 1 | ||||||
Idaho |
5 | Ohio | 26 | ||||||
Illinois |
27 | Oklahoma | 12 | ||||||
Indiana |
15 | Oregon | 13 | ||||||
Iowa |
5 | Pennsylvania | 23 | ||||||
Kansas |
12 | South Carolina | 22 | ||||||
Kentucky |
13 | South Dakota | 1 | ||||||
Louisiana |
20 | Tennessee | 22 | ||||||
Maryland |
20 | Texas | 108 | ||||||
Massachusetts |
4 | Utah | 8 | ||||||
Michigan |
11 | Virginia | 37 | ||||||
Minnesota |
10 | Washington | 15 | ||||||
Mississippi |
15 | Wisconsin | 9 | ||||||
Missouri |
17 | ||||||||
Site Selection. We continually evaluate our current store base for potential enhancement or relocation of our store locations. As a result of this ongoing evaluation, we intend to pursue attractive relocation opportunities in our existing store base, close certain stores by allowing leases to expire for underperforming stores or where alternative locations in similar trade areas are not available at acceptable lease rates, and, when appropriate, open new stores. For both new stores and relocations, we negotiate for upgraded sites. We believe that this strategy will better position us for long-term profitable growth. We expect to upgrade both the appearance and operation of our new and relocated stores compared to our existing stores and do not anticipate difficulty in locating additional store locations in areas with our target customer demographics.
Store Leases. Except for one store adjacent to our distribution center, we lease our store locations under non-cancelable operating leases that include optional renewal periods. Some of our leases also provide for contingent rent based upon store sales exceeding stipulated amounts.
Our store leases typically include "kick clauses," which allow us, at our option, to exit the lease with no penalty 24 to 60 months after entering into the lease if store sales do not reach a stipulated amount stated in the lease. These kick clauses, when combined with our inexpensive and portable store fixtures provide us with flexibility in opening new stores and relocating existing stores by allowing us to quickly and cost-effectively vacate a site that does not meet our sales expectations. As a result, we generally do not operate locations with continued store-level operating losses.
9
Store Layout. Our site selection process and "no frills" approach to presenting merchandise allow us to use a wide variety of space configurations. The size of our stores ranges from approximately 5,000 to 31,800 square feet, averaging on a per store basis approximately 10,700 square feet as of June 30, 2014. We have designed our stores to be functional, with less emphasis placed upon fixtures and leasehold aesthetics. We display all merchandise on counters, shelves, or racks while maintaining minimum inventory in our stockrooms.
Store Operations. Our stores are generally open seven days a week, excluding certain holidays. We continue to maintain the frequency of shipments of merchandise which results in improved efficiency of receiving and restocking activities at our stores. We attempt to align our part-time associates' labor hours with anticipated workload and with current customer sales. We conduct physical counts of our merchandise throughout the year, except for during the holiday selling season of November and December, primarily when stores are closed.
Store Management. Each store has a manager who is responsible for recruiting, training and supervising store personnel and assuring that the store is managed in accordance with our established guidelines and procedures. Store managers are full-time employees. Our store managers are supported by district and regional level support. Store managers are responsible for store disciplines and routines. The store manager is assisted primarily by part-time employees who generally serve as assistant managers, cashiers, and help with merchandise stocking efforts. Members of our management visit selected stores during sales event and non-sales event periods to review inventory levels and presentation, personnel performance, expense controls, security and adherence to our policies and procedures. In addition, district and regional field managers periodically meet with senior management to review store policies and discuss purchasing, merchandising, advertising and other operational issues.
Our business is subject to significant risks, including the risks and uncertainties described below. These risks and uncertainties and the other information in this Form 10-K, including our consolidated financial statements and the notes to those statements, should be carefully considered. If any of the events described below actually occur, our business, financial condition or results of operations could be adversely affected in a material way.
We may not be successful in the implementation of our long-term business rebuilding, which could adversely affect our business and our results of operations.
Our success depends, to a significant degree, on our ability to successfully implement our long-term business strategy. Our ability to successfully implement our business strategies depends upon a significant number of factors, including but not limited to:
- •
- our ability to successfully execute our long-term business strategy;
- •
- our ability to access an adequate supply of top-quality merchandise from suppliers at a competitive price;
- •
- our ability to achieve profitable sales and to make adjustments as market conditions change;
- •
- customer acceptance of our marketing and merchandise strategies;
- •
- our ability to respond to competitive pressures in our industry;
- •
- the extent to which our management team can properly respond to the dynamics and demands of our market;
10
- •
- our ability to achieve positive cash flow, particularly during our peak inventory build-ups in advance of the holiday
selling season; and
- •
- our employees' ability to adapt to our new strategic initiatives and organizational structure.
Changes in economic and political conditions may adversely affect consumer spending, which could significantly harm our business, results of operations, cash flows and financial condition.
The success of our business depends, to a significant extent, upon the level of consumer spending. A number of factors beyond our control affect the level of consumer spending on merchandise that we offer, including, among other things:
- •
- general economic and industry conditions;
- •
- unemployment;
- •
- the housing market;
- •
- deterioration in consumer confidence;
- •
- crude oil prices that affect gasoline and diesel fuel, as well as, increases in other fuels used to support utilities;
- •
- food prices and their effect on consumer discretionary spending;
- •
- efforts by our customers to reduce personal debt levels;
- •
- interest rates;
- •
- fluctuations in the financial markets;
- •
- tax rates and policies;
- •
- war, terrorism and other hostilities; and
- •
- consumer confidence in future economic conditions.
The merchandise we sell generally consists of discretionary items. Reduced consumer confidence and spending cut backs may result in reduced demand for our merchandise, including discretionary items, and may force us to take significant inventory markdowns. Reduced demand also may require increased selling and promotional expenses. Adverse economic conditions and any related decrease in consumer demand for our merchandise could have a material adverse effect on our business, results of operations, cash flows and financial condition.
Any failure to identify and respond to changes in consumer trends and preferences could significantly harm our business.
The retail home furnishings and housewares industry is subject to sudden shifts in consumer trends and consumer spending. Our sales and results of operations depend in part on our ability to predict or respond to changes in trends and consumer preferences in a timely manner. Although our business model allows us greater flexibility than many traditional retailers to meet consumer preferences and trends, we may not successfully do so. Any sustained failure to anticipate, identify and respond to emerging trends in consumer preferences could negatively affect our business and results of operations.
We must continuously attract buying opportunities for off-price merchandise and anticipate consumer demand as off-price merchandise becomes available, and our failure to do so could adversely affect our performance.
By its nature, specific off-price merchandise items are available from manufacturers or vendors generally on a non-recurring basis. As a result, we do not have long-term contracts with our vendors
11
for supply, pricing or access to products, but make individual purchase decisions, which may be for large quantities. Due to economic uncertainties, some of our manufacturers and suppliers may cease operations or may otherwise become unable to continue supplying off-price merchandise on terms acceptable to us. We further cannot assure that manufacturers or vendors will continue to make off-price merchandise available to us in quantities acceptable to us or that our buyers will continue to identify and take advantage of appropriate buying opportunities. In addition, if we misjudge consumer demand for products, we may significantly overstock unpopular products and be forced to take significant markdowns and miss opportunities to sell more popular products. An inability to acquire suitable off-price merchandise in the future or to accurately anticipate consumer demand for such merchandise would have an adverse effect on our business, results of operations, cash flows and financial condition.
Our results of operations will be negatively affected if we are not successful in managing our inventory.
Inventory is the largest asset on our balance sheet and represented approximately 62%, 66% and 67% of our total assets at June 30, 2014, 2013 and 2012, respectively. Efficient inventory management is a key component of our business success and profitability. To be successful, we must maintain sufficient inventory levels to meet our customers' demands without allowing those levels to increase to such an extent that the costs to store and hold the goods unduly impact our financial results. If our buying decisions do not accurately predict customer trends or purchasing actions, we may have to take unanticipated markdowns to dispose of the excess inventory, which also can adversely impact our financial results. We continue to focus on ways to reduce these risks, but we cannot assure that we will be successful in our inventory management. If we are not successful in managing our inventory balances, our results of operations may be negatively affected. In the second quarter of fiscal 2013, we made a strategic decision to accelerate the sell off of certain inventory by the end of the 2013 calendar year. In connection with this decision, we recorded a pre-tax $41.8 million inventory write-down in cost of sales during the second quarter of fiscal 2013, and we recorded a pre-tax $43.7 million inventory write-down in cost of sales during the full fiscal 2013 year. As part of our business turnaround strategic decision to exit certain categories of merchandise, we recorded a pre-tax $5.3 million charge in cost of sales during fiscal 2014 and there can be no assurances that we will not record additional inventory charges in the future.
The loss of, or disruption in the operations of, our centralized distribution center would have a material adverse effect on our business and operations.
With few exceptions, all inventory is shipped directly from suppliers to our centralized distribution center in the Dallas, Texas metropolitan area, where the inventory is then processed, sorted and shipped to our stores. We depend in large part on the orderly operation of this receiving and distribution process, which depends, in turn, on adherence to shipping schedules and effective management of the distribution center. We may not anticipate all of the changing demands which our expanding operations will impose on our receiving and distribution system. In addition, events beyond our control, such as disruptions in operations due to fire or other catastrophic events, labor disagreements or shipping problems, may result in delays in the delivery of merchandise to our stores. We also cannot assure that our insurance will be sufficient, or that insurance proceeds will be timely paid to us, in the event our distribution center is shut down for any reason.
The loss or departure of one or more members of our senior management or other key employees could have a material adverse effect on our business.
Our future performance will depend in large part upon the efforts and abilities of our senior management and our other key employees. The loss of service of these persons could have a material adverse effect on our business and future prospects. We do not maintain key person life insurance for
12
our senior management. In addition, we have recently experienced turnover of a number of members of senior management. We cannot provide any assurance that we will not experience future turnover related to our senior management team.
Our business is intensely competitive, and a number of different competitive factors could have a material adverse effect on our business, results of operations, cash flows and financial condition.
The retail home furnishings and housewares industry is intensely competitive. As an off-price retailer of home furnishings and housewares, we currently compete against a diverse group of retailers, including department stores and discount stores, specialty, on-line, and catalog retailers and mass merchants, which sell, among other products, home furnishing, houseware and related products similar and often identical to those we sell. We also compete in particular markets with a substantial number of retailers that specialize in one or more types of home furnishing and houseware products that we sell. Many of these competitors have substantially greater financial resources that may, among other things, increase their ability to purchase inventory at lower costs or to initiate and sustain aggressive price competition.
A number of different competitive factors could have a material adverse effect on our business, results of operations, cash flows and financial condition, including:
- •
- increased operational efficiencies of competitors;
- •
- competitive pricing strategies, including deep discount pricing by a broad range of retailers during periods of poor
consumer confidence or economic uncertainty;
- •
- continued and prolonged promotional activity by competitors;
- •
- liquidation sales by a number of our competitors who have filed or may file in the future for bankruptcy;
- •
- expansion by existing competitors;
- •
- entry by new competitors into markets in which we currently operate; and
- •
- adoption by existing competitors of innovative store formats or retail sales methods.
We cannot assure that we will be able to continue to compete successfully with our existing or new competitors, or that prolonged periods of deep discount pricing by our competitors will not materially harm our business. We compete for customers, associates, locations, merchandise, services and other important aspects of our business with many other local, regional, national and international retailers. We also face competition from alternative retail distribution channels such as catalogues and, increasingly, e-commerce websites. Changes in the merchandising, pricing and promotional activities of those competitors, and in the retail industry, in general, may adversely affect our performance.
If we are unable to successfully execute our strategy of relocating or expanding existing stores and when appropriate, opening new stores, our operating performance could be adversely impacted.
As part of our business strategy, we intend to pursue relocation opportunities to improve our existing store base as well as open new stores that will offset the closing of lower performing stores as they come up for renewal. However, we cannot assure that we will be able to achieve our relocation goals or that we will be able to operate any new or relocated stores profitably. Further, we cannot assure that any new or relocated store will achieve similar operating results to those of our existing stores or that new, relocated or expanded stores opened in markets in which we operate will not have a material adverse effect on the net sales and profitability of our existing store base.
13
The success of our store development strategy will be dependent upon numerous factors, many of which are beyond our control, including the following:
- •
- the ability of our personnel to adequately analyze and identify suitable markets and individual store sites within those
markets;
- •
- the competition for suitable store sites;
- •
- our ability to negotiate favorable lease terms with landlords;
- •
- our ability to obtain governmental and other third-party consents, permits and licenses needed to operate our stores;
- •
- the availability of employees to staff new stores and our ability to hire, train, motivate and retain store personnel;
- •
- the availability of adequate management and financial resources to properly manage a large volume of stores;
- •
- our ability to adapt our distribution and other operational and management systems to a changing network of stores; and
- •
- our ability to attract customers and generate sales sufficient to operate new, relocated or expanded stores profitably.
We opened stores in new markets during the fiscal years ended June 30, 2014, 2013, and 2012. These markets may have different competitive conditions, consumer trends and discretionary spending patterns than our existing markets, which may cause our new stores in these markets to be less successful than stores in our existing markets.
Increases in fuel prices and changes in transportation industry regulations or conditions may increase our freight costs and thus our cost of sales, which could have a material adverse effect on our business and operations.
Our freight cost is impacted by changes in fuel prices through surcharges. Fuel prices and surcharges affect freight cost both on inbound freight from vendors to our distribution center and outbound freight from our distribution center to our stores. In addition, the U.S. government requires drivers of over-the-road trucks to take certain rest periods which reduce the available amount of time they can drive during a 24-hour period. Changes in trucking industry conditions, such as truck driver shortages and highway congestion, could increase freight costs. High fuel prices or surcharges, as well as stringent driver regulations and changes in transportation industry conditions, may increase freight costs and thereby increase our cost of sales.
If we are not able to generate strong cash flows from our operations or to continue to access credit markets, we will not be able to support capital expansion, operations and debt repayment.
Our business is dependent upon our operations generating strong cash flows to support capital expansion requirements and general operating activities. In addition, we have a credit agreement providing for a revolving credit facility in the amount of up to $180.0 million. The revolving credit facility contains certain restrictive covenants, and if borrowings and letters of credit exceed a specified amount, financial covenants. If we are unable to comply with the revolving credit facility, we may not be able to obtain an alternate source of funding on satisfactory terms, if at all. Our inability to continue to generate sufficient cash flows to support these activities or the lack of availability of financing in adequate amounts and on appropriate terms could adversely affect our financial performance.
14
An increase in the cost or a disruption in the flow of our imported products may significantly decrease our sales and profits.
Merchandise manufactured and imported from overseas represents the majority of our total product purchases acquired both domestically and internationally. A disruption in the shipping of imported merchandise or an increase in the cost of those products may significantly decrease our sales and profits. In addition, if imported merchandise becomes more expensive or unavailable, the transition to alternative sources may not occur in time to meet our demands. Products from alternative sources may also be of lesser quality and more expensive than those we currently import.
Risks associated with our reliance on imported products include disruptions in the shipping and importation or increases in the costs of imported products because of factors such as:
- •
- raw material shortages;
- •
- work stoppages;
- •
- strikes and political unrest;
- •
- problems with oceanic shipping, including shipping container shortages;
- •
- increased customs inspections of import shipments or other factors causing delays in shipments;
- •
- economic crises;
- •
- international disputes and wars; loss of "most favored nation" trading status by the United States in relation to a
particular foreign country;
- •
- import duties;
- •
- import quotas and other trade sanctions; and
- •
- increases in shipping rates.
The products we buy abroad are sometimes priced in foreign currencies and, therefore, we are affected by fluctuating exchange rates. In the past, we have entered into foreign currency exchange contracts with major financial institutions to hedge these fluctuations. We might not be able to successfully protect ourselves in the future against currency rate fluctuations, and our financial performance could suffer as a result. You should read Item 7 "Management's Discussion and Analysis of Financial Condition and Results of Operations" and Item 7A "Quantitative and Qualitative Disclosures About Market Risk" for more information about our foreign currency exchange rate exposure and hedging activities.
Our success depends upon our marketing, advertising and promotional efforts. If we are unable to implement them successfully, or if our competitors are more effective than we are, our results of operations may be adversely affected.
We use marketing and promotional programs to attract customers to our stores and to encourage purchases by our customers. We use various media for our promotional efforts, including print, database marketing, email, direct marketing, and other electronic communications such as online social networks. In addition, we plan and implement an advertising program for each of our "sales events." If we fail to choose the appropriate medium for our efforts, or fail to implement and execute new marketing opportunities, our competitors may be able to attract some of our customers and cause them to decrease purchases from us and increase purchases elsewhere, which would negatively impact our net sales. Changes in the amount and degree of promotional intensity or merchandising strategy by our competitors could cause us to have some difficulties in retaining existing customers and attracting new customers.
15
If we do not attract and retain quality sales, distribution center and other associates in large numbers, as well as, experienced buying and management personnel, our performance could be adversely affected.
Our performance is dependent on recruiting, developing, training and retaining quality sales, distribution center and other associates in large numbers, as well as, experienced buying and management personnel. Many of our associates are in entry level or part-time positions with historically high rates of turnover. Our ability to meet our labor needs while controlling costs is subject to external factors, such as unemployment levels, prevailing wage rates, minimum wage legislation and changing demographics. In the event of increasing wage rates, if we do not increase our wages competitively, our customer service could suffer because of a declining quality of our workforce, or our earnings would decrease if we increase our wage rates. Changes that adversely impact our ability to attract and retain quality associates and management personnel could adversely affect our performance.
Our results of operations are subject to seasonal and quarterly fluctuations, which could have a material adverse effect on our operating results or the market price of our common stock.
Our business is subject to seasonality with a higher level of net sales and operating income generated during the quarter ended December 31, which includes the holiday shopping season. Net sales in the quarters ended December 31, 2013, 2012, and 2011, accounted for approximately 33%, 34%, and 34%, respectively, of our annual net sales for such years. For more information about our seasonality, please read Item 7 "Management's Discussion and Analysis of Financial Condition and Results of Operations—Quarterly Results and Seasonality."
Because a significant percentage of our net sales and operating income are generated in the quarter ending December 31, we have limited ability to compensate for shortfalls in December quarter sales or earnings by changes in our operations or strategies in other quarters. A significant shortfall in results for the quarter ending December 31 of any year could have a material adverse effect on our annual results of operations and on the market price of our common stock. In addition, in anticipation of higher sales during this period, we purchase substantial amounts of seasonal inventory and hire many temporary employees. An excess of seasonal merchandise inventory could result if our net sales during this principal selling season were to fall below either seasonal norms or expectations. If our December quarter sales results were substantially below expectations, our financial performance and operating results could be adversely affected by unanticipated markdowns, particularly in seasonal merchandise. Lower than anticipated sales in the principal selling season would also negatively affect our ability to absorb the increased seasonal labor costs.
Our quarterly results of operations may also fluctuate significantly based on additional factors, such as:
- •
- the timing of new store openings;
- •
- the amount of net sales contributed by new and existing stores;
- •
- the success of our store expansion and relocation program;
- •
- the timing of certain holidays and sales events;
- •
- changes in our merchandise mix;
- •
- general economic, industry and weather conditions that affect consumer spending; and
- •
- actions of competitors, including promotional activity.
These factors could also have a material adverse effect on our annual results of operations and on the market price of our common stock.
16
If we are unable to maintain and protect our information technology systems and technologies, we could suffer disruptions in our business, damage to our reputation with customers, and incur substantial costs and liability.
The operation of business is heavily dependent upon the implementation, integrity, security, and successful functioning of our computer networks and information systems, including the point-of-sale systems in our stores, data centers that process transactions, and various software applications used in our operations. In the ordinary course of our business, we also collect and store sensitive data, including intellectual property, our proprietary business information and that of our customers, supplier and business partners, and personally identifiable information of our customers and employees, our computer networks and information systems. A failure of our systems to operate effectively as a result of a cyber attack, damage to, interruption, or failure of any of these systems could result in a failure to meet our reporting obligations, or result in material misstatements in our consolidated financial statements, or cause losses due to disruption of our business operations. These adverse situations could also lead to loss of sales or profits or cause us to incur additional development costs. In addition, despite our efforts to secure our computer networks and information systems, security could be compromised or confidential information could be misappropriated resulting in a loss of customers' or employees' personal information, negative publicity, harm to our business and reputation, and potentially causing us to incur costs to reimburse third parties for damages and potentially subjecting us to government investigations and enforcement actions.
We are subject to various government regulations, which may adversely affect our operations and financial performance.
The development and operation of our stores are subject to various federal, state and local laws and regulations in many areas of our business, including, but not limited to, those that impose restrictions, levy a fee or tax, or require a permit or license, or other regulatory approval, and building and zoning requirements. Difficulties or failures in obtaining required permits, licenses or other regulatory approvals could delay or prevent the opening of a new store, and the suspension of, or inability to renew, a license or permit could interrupt operations at an existing store. We are also subject to laws governing our relationship with employees, including minimum wage requirements, overtime, health insurance mandates, working and safety conditions, and immigration status requirements. Additionally, potential changes in federal labor laws, including "card check" regulations, could result in portions of our workforce being subjected to greater organized labor influence. This could result in an increase to our labor costs. A significant portion of our store personnel are paid at rates related to the minimum wage established by federal, state and municipal law. Additionally, we are subject to certain laws and regulations that govern our handling of customers' personal information. A failure to protect the integrity and security of our customers' personal information could expose us to private litigation and government investigations and enforcement actions, as well as materially damage our reputation with our customers. While we endeavor to comply with all applicable laws and regulations, governmental and regulatory bodies may change such laws and regulations in the future which may require us to incur substantial cost increases. If we fail to comply with applicable laws and regulations, we may be subject to various sanctions, penalties or fines and may be required to cease operations until we achieve compliance which could have a material adverse effect on our consolidated financial results and operations.
We face litigation risks from customers, employees, and other third parties in the ordinary course of business.
Our business is subject to the risk of litigation by customers, current and former employees, suppliers, stockholders and others through private actions, class actions, administrative proceedings, regulatory actions, or other litigation. The outcome of litigation, particularly class action lawsuits and regulatory actions, is difficult to assess or quantify. Plaintiffs in these types of lawsuits may seek
17
recovery of very large or indeterminate amounts, and the magnitude of the potential loss relating to such lawsuits may remain unknown for substantial periods of time. The cost to defend future litigation may be significant. There may also be adverse publicity associated with litigation that could decrease customer acceptance of merchandise offerings, regardless of whether the allegations are valid or whether we are ultimately found liable.
We face risks with respect to product liability claims and product recalls, which could adversely affect our reputation, our business, and our consolidated results of operations.
We purchase merchandise from third parties and offer this merchandise to customers for sale. This merchandise could be subject to recalls and other actions by regulatory authorities. Changes in laws and regulations could also impact the type of merchandise we offer to customers. We have experienced, and may in the future experience, issues that result in recalls of merchandise. In addition, individuals have asserted claims, and may in the future assert claims, that they have sustained injuries from third-party merchandise offered by us, and we may be subject to future lawsuits relating to these claims. There is a risk that these claims or liabilities may exceed, or fall outside the scope of, our insurance coverage. Any of the issues mentioned above could result in damage to our reputation, diversion of development and management resources, or reduced sales and increased costs, any of which could harm our business.
Our stores may be adversely affected by local conditions, natural disasters, and other events.
Certain regions in which our stores are located may be subject to adverse local conditions, natural disasters, and other events. If severe weather, such as heavy snowfall or extreme temperatures, discourages or restricts customers in a particular region from traveling to our stores, our sales could be adversely affected. If severe weather conditions occur during the second quarter of the year, the adverse impact to our sales and profitability could be even greater than at other times during the year because we generate a significant portion of our sales and profits during these periods. Natural disasters including tornados, hurricanes, floods, and earthquakes may damage our stores or other operations, which may adversely affect our consolidated financial results. Additionally, demographic shifts in the areas where our stores are located could adversely impact our consolidated financial results and operations.
Our results of operations may be negatively affected by inventory shrinkage.
We are subject to the risk of inventory loss and theft. Although our inventory shrinkage rates have not fluctuated significantly in recent years, we cannot assure you that actual rates of inventory loss and theft in the future will be within our estimates or that the measures we are taking will effectively reduce the problem of inventory shrinkage. Although some level of inventory shrinkage is an unavoidable cost of doing business, if we were to experience higher rates of inventory shrinkage or incur increased security costs to combat inventory theft, our results of operations could be affected adversely.
Risks Related to Our Common Stock
Our certificate of incorporation, and bylaws and Delaware law contain provisions that could make it more difficult for a third party to acquire us without the consent of our Board of Directors.
Provisions in our certificate of incorporation and bylaws will have the effect of delaying or preventing a change of control or changes in our management. These provisions include the following:
- •
- the ability of our Board of Directors to issue shares of our common stock and preferred stock without stockholder approval (subject to applicable NASDAQ requirements);
18
- •
- a requirement that stockholder meetings may only be called by our President and Chief Executive Officer, the Chairman of
the Board or at the written request of a majority of the directors then in office and not our stockholders;
- •
- a prohibition of cumulative voting in the election of directors, which would otherwise allow less than a majority of
stockholders to elect director candidates;
- •
- the ability of our Board of Directors to make, alter or repeal our bylaws without further stockholder approval; and
- •
- the requirement for advance notice for nominations for directors to our Board of Directors and for proposing matters that can be acted upon by stockholders at stockholder meetings.
Because we do not presently have plans to pay dividends on our common stock, stockholders must look solely to appreciation of our common stock to realize a gain on their investment.
On February 1, 2008, our Board of Directors voted to terminate the declaration of an annual cash dividend. The Board of Directors will consider the full range of alternatives with regard to the use of any excess cash flow in the future. Our future dividend policy is within the discretion of our Board of Directors and will depend upon various factors, including our business, financial condition, results of operations, capital requirements and investment opportunities. Accordingly, stockholders must look solely to appreciation of our common stock to realize a gain on their investment. This appreciation may not occur.
The price of our common stock has fluctuated substantially over the past several years and may continue to fluctuate substantially in the future.
From June 30, 2013 to June 30, 2014, the trading prices of our common stock ranged from a low of $10.31 per share to a high of $19.25 per share. We expect our stock to continue to be subject to fluctuations as a result of a variety of factors, including factors beyond our control, which have been included throughout this Annual Report on Form 10-K. We may fail to meet the expectations of our stockholders or securities analysts at some time in the future, and our stock price could decline as well.
Item 1B. Unresolved Staff Comments
None.
Stores. We lease all of our stores from unaffiliated third parties through non-cancelable leases, except one company-owned store located adjacent to our distribution facility. A description of the location of our stores is provided in Item 1, "Business—Stores and Store Operations." At June 30, 2014, the remaining terms of the majority of our store leases range from one month to five years. The average initial term of a store lease is approximately five years with options available for renewal. We intend to continue to lease all of our new stores from unaffiliated third parties. Leases may contain renewal clauses, which are often executed, and may contain additional terms regarding percentage of rent payments. Our store leases typically include "kick clauses," which allow us, at our option, to exit the lease 24 to 60 months after entering the lease if sales at the store do not reach a stipulated amount stated in the lease.
Distribution Facilities and Corporate Headquarters. We own approximately 1.4 million square feet of distribution facilities and a 105,000 square foot building which houses our corporate office in Dallas, Texas.
19
We lease from unaffiliated third parties three parcels of land of approximately 444,000 square feet, two of which are for trailer storage and the third parcel is for a 30,000 square foot building. The leases for trailer storage expire in February 2019 and December 2023 and the lease for the third parcel and building expires in February 2016. We are continuing to evaluate the reorganization of our distribution network and facilities to accommodate our distribution requirements for our existing store base as well as for future growth.
The Company is defending against a class action lawsuit filed in California Superior Court, Los Angeles County, on December 5, 2008—Julia Randell, et. al., v. Tuesday Morning, Inc., No. BC403298 (Cal. Super. Ct.)—in which the original complaint alleged violations of California's meal and rest period laws. The two named plaintiffs, who are former employees of the Company, subsequently amended the complaint three times. Narrowing their class allegations, the plaintiffs moved on March 14, 2012 to certify a class on the issue of whether the Company's alleged practice of providing "on-duty" meal periods to Senior Sales Associates violates the California Labor Code. The Court granted that motion on June 20, 2012, certifying a class comprised of current and former Senior Sales Associates who worked for the Company in California, and who were required to take meal breaks "on duty" at any point from April 1, 2005 to the present. The Company filed motions to decertify the class and for summary judgment on January 4, 2013, which the Court denied on March 29, 2013. On March 20, 2014, the parties executed a settlement agreement and release which, subject to Court approval, resolves the matter on a class basis. On April 16, 2014, the Court granted preliminary approval of the settlement and authorized the parties to provide notice of the settlement and its terms to class members. The hearing on the motion for final approval of the settlement is scheduled for October 9, 2014. The terms of the settlement are not expected to have a material adverse effect on the Company's financial condition or results of operations.
Item 4. Mine Safety Disclosures
Not applicable.
20
Item 5. Market For Registrant's Common Equity, Related Stockholder Matters and Issuer Purchases of Equity Securities
Our common stock is listed on the NASDAQ Global Select Market under the symbol "TUES." The following table sets forth for the periods indicated the high and low sales prices per share as reported on the NASDAQ Select Global Market:
| |
High | Low | |||||
|---|---|---|---|---|---|---|---|
Fiscal Year Ended June 30, 2014 |
|||||||
First quarter |
$ | 15.74 | $ | 10.31 | |||
Second quarter |
$ | 16.44 | $ | 11.53 | |||
Third quarter |
$ | 16.60 | $ | 11.82 | |||
Fourth quarter |
$ | 19.25 | $ | 12.84 | |||
Fiscal Year Ended June 30, 2013 |
|||||||
First quarter |
$ | 6.86 | $ | 4.27 | |||
Second quarter |
$ | 6.75 | $ | 4.82 | |||
Third quarter |
$ | 9.65 | $ | 6.26 | |||
Fourth quarter |
$ | 10.60 | $ | 7.25 | |||
As of August 19, 2014, there were approximately 123 holders of record of our common stock.
Dividend Policy
During the fiscal years ended June 30, 2014 and 2013, we did not declare or pay any cash dividends on our common stock. On February 1, 2008, our Board of Directors voted to terminate our then existing annual cash dividend. We do not presently have plans to pay dividends on our common stock. The Board of Directors considers a full range of alternatives with regard to the use of any excess cash flow. Our revolving credit facility may, in some instances, limit payment of cash dividends and repurchases of the Company's common stock. Additional details are provided in Item 7, "Management's Discussion and Analysis of Financial Condition and Results of Operations—Liquidity and Capital Resources—Secured Credit Facility."
Repurchases of Common Equity
On August 22, 2011, the Company's Board of Directors adopted a share repurchase program pursuant to which the Company is authorized to repurchase from time to time shares of Common Stock, up to a maximum of $5.0 million in aggregate purchase price for all such shares (the "Repurchase Program"). On January 20, 2012, the Company's Board of Directors increased the authorization for stock repurchases under the Repurchase Program from $5.0 million to a maximum of $10.0 million. The Repurchase Program does not have an expiration date and may be amended, suspended or discontinued at any time. The Board will periodically evaluate the Repurchase Program and there can be no assurances as to the number of shares of Common Stock the Company will repurchase. During the twelve month period ended June 30, 2014, 22,553 shares were repurchased under the Repurchase Program at an average cost of $14.21 per share and for a total cost (excluding commissions) of approximately $320,000. All of such shares were purchased by the Company in connection with the vesting of equity awards under the Company's equity incentive plans.
21
Repurchases of equity securities during the three months ended June 30, 2014 are listed in the following table:
Period
|
Total Number of Shares Repurchased |
Average Price Paid per Share |
Total Number of Shares Purchased as Part of Publicly Announced Plans or Programs |
Approximate Dollar Value of Shares That May Yet Be Purchased Under the Plans or Programs(1) |
|||||||||
|---|---|---|---|---|---|---|---|---|---|---|---|---|---|
April 1 through April 30 |
— | $ | — | — | $ | 3,482,030 | |||||||
May 1 through May 31 |
— | $ | — | — | $ | 3,482,030 | |||||||
June 1 through June 30 |
— | $ | — | — | $ | 3,482,030 | |||||||
| | | | | | | | | | | | | | |
Total |
— | $ | — | — | $ | 3,482,030 | |||||||
| | | | | | | | | | | | | | |
| | | | | | | | | | | | | | |
- (1)
- As of June 30, 2014, 1.8 million shares have been repurchased under the Repurchase Program for a total cost (excluding commissions) of approximately $6.5 million. All shares were withheld by the Company in connection with the vesting of equity awards under the Company's equity incentive plans or purchased in an open market transaction.
Stock Price Performance
The following graph illustrates a comparison of the cumulative total stockholder return (change in stock price plus reinvested dividends) for the fiscal years ended June 30, 2014, 2013, 2012, 2011 and 2010, of (1) our common stock, (2) the S&P 500 Index, and (3) the S&P 500 retailing index, a pre-established industry index. The chart assumes that $100 was invested on June 30, 2009, in our common stock and each of the comparison indices, and assumes that all dividends were reinvested.
COMPARISON OF 5 YEAR CUMULATIVE TOTAL RETURN*
Among Tuesday Morning, the S&P 500 Index,
Old Peer Group, New Peer Group and S&P 500 Retailing Index
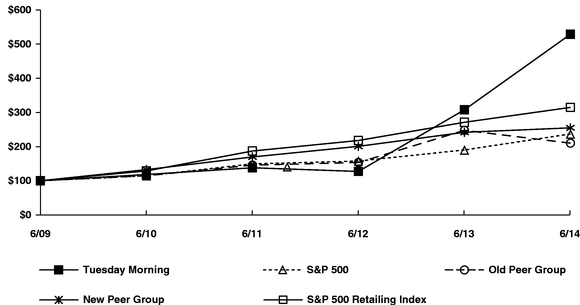
- *
- $100
invested on 6/30/09 in stock or index, including reinvestment of dividends.
Fiscal year ending June 30.Copyright© 2014 S&P, a division of The McGraw-Hill Companies Inc. All rights reserved.
22
These indices are included for comparative purposes only and do not necessarily reflect management's opinion that such indices are an appropriate measure of the relative performance of the stock involved, and are not intended to forecast or be indicative of possible future performance of the Company's common stock.
The performance graph and related text are being furnished to and not filed with the SEC, and will not be deemed to be "soliciting material" under Regulation 14A or 14C under the Securities Exchange Act of 1934 or subject to the liabilities of Section 18 of the Securities Exchange Act of 1934, and will not be deemed to be incorporated by reference into any filings under the Securities Act of 1933 or the Securities Exchange Act of 1934, except to the extent we specifically incorporate such information by reference into such a filing.
Item 6. Selected Financial Data
The following table sets forth the selected consolidated financial and operating data for the fiscal years ended June 30, 2014, 2013, 2012, 2011, and 2010.
The selected consolidated financial and operating data should be read in conjunction with "Management's Discussion and Analysis of Financial Condition and Results of Operations" and our consolidated financial statements and related notes thereto included elsewhere in this Form 10-K.
| |
Fiscal Year Ended June 30, | |||||||||||||||
|---|---|---|---|---|---|---|---|---|---|---|---|---|---|---|---|---|
| |
2014 | 2013 | 2012 | 2011 | 2010 | |||||||||||
| |
(in thousands, except per share, per square foot, and square foot per store amounts) |
|||||||||||||||
Statement of Operations Data: |
||||||||||||||||
Net sales |
$ | 864,844 | $ | 838,314 | $ | 812,782 | $ | 821,150 | $ | 828,265 | ||||||
Cost of sales |
562,692 | 578,876 | 503,918 | 507,834 | 514,270 | |||||||||||
| | | | | | | | | | | | | | | | | |
Gross profit |
302,152 | 259,438 | 308,864 | 313,316 | 313,995 | |||||||||||
Selling, general and administrative expenses |
310,205 | 315,933 | 301,427 | 295,273 | 293,850 | |||||||||||
| | | | | | | | | | | | | | | | | |
Operating income/(loss) |
(8,053 | ) | (56,495 | ) | 7,437 | 18,043 | 20,145 | |||||||||
Net interest and other expense |
(2,082 | ) | (6,913 | ) | (2,030 | ) | (2,496 | ) | (3,476 | ) | ||||||
| | | | | | | | | | | | | | | | | |
Income/(loss) before income taxes |
(10,135 | ) | (63,408 | ) | 5,407 | 15,547 | 16,669 | |||||||||
Income tax provision/(benefit) |
41 | (7,032 | ) | 1,494 | 5,968 | 5,921 | ||||||||||
| | | | | | | | | | | | | | | | | |
Net income/(loss) |
$ | (10,176 | ) | $ | (56,376 | ) | $ | 3,913 | $ | 9,579 | $ | 10,748 | ||||
| | | | | | | | | | | | | | | | | |
| | | | | | | | | | | | | | | | | |
Earnings per share: |
||||||||||||||||
Basic |
$ | (0.24 | ) | $ | (1.33 | ) | $ | 0.09 | $ | 0.22 | $ | 0.25 | ||||
Diluted |
$ | (0.24 | ) | $ | (1.33 | ) | $ | 0.09 | $ | 0.22 | $ | 0.25 | ||||
Weighted average shares outstanding: |
||||||||||||||||
Basic |
42,943 | 42,248 | 41,986 | 42,493 | 41,920 | |||||||||||
Diluted |
42,943 | 42,248 | 42,536 | 43,078 | 42,483 | |||||||||||
Dividends per common share |
$ | — | $ | — | $ | — | $ | — | $ | — | ||||||
Operating Data: |
||||||||||||||||
Number of stores: |
||||||||||||||||
Beginning of period |
828 | 852 | 861 | 852 | 857 | |||||||||||
Opened during period |
9 | 10 | 24 | 44 | 26 | |||||||||||
Closed during period |
(27 | ) | (34 | ) | (33 | ) | (35 | ) | (31 | ) | ||||||
| | | | | | | | | | | | | | | | | |
Open at end of period |
810 | 828 | 852 | 861 | 852 | |||||||||||
| | | | | | | | | | | | | | | | | |
| | | | | | | | | | | | | | | | | |
Comparable store sales increase/(decrease)(1) |
6.1 | % | 3.9 | % | (3.1 | )% | (1.2 | )% | 2.2 | % | ||||||
Average sales per store(2) |
$ | 1,058 | $ | 1,000 | $ | 950 | $ | 972 | $ | 972 | ||||||
Inventory turnover(3) |
2.6 | 2.2 | 1.9 | 1.9 | 2.0 | |||||||||||
Total square footage |
8,593 | 8,641 | 8,652 | 8,445 | 7,826 | |||||||||||
Net Sales per square foot |
$ | 100 | $ | 97 | $ | 95 | $ | 101 | $ | 106 | ||||||
Average square feet per store |
10,700 | 10,500 | 10,200 | 9,800 | 9,400 | |||||||||||
23
| |
As of June 30, | |||||||||||||||
|---|---|---|---|---|---|---|---|---|---|---|---|---|---|---|---|---|
| |
2014 | 2013 | 2012 | 2011 | 2010 | |||||||||||
| |
(In thousands) |
|||||||||||||||
Balance Sheet Data: |
||||||||||||||||
Working capital |
$ | 138,404 | $ | 142,025 | $ | 188,939 | $ | 188,020 | $ | 174,855 | ||||||
Inventories |
207,663 | 211,981 | 265,630 | 264,361 | 239,194 | |||||||||||
Total assets |
332,386 | 321,880 | 397,167 | 379,156 | 350,536 | |||||||||||
Total debt, including current portion |
— | — | — | — | — | |||||||||||
Total stockholders' equity |
203,310 | 207,457 | 260,191 | 260,134 | 247,892 | |||||||||||
- (1)
- Stores
are included in the same store sales calculation at the beginning of the quarter following the anniversary date of the store opening. A store that
relocates within the same geographic market or modifies its available retail space is still considered the same store for purposes of this computation. The number of days our stores are open may
fluctuate from period to period.
- (2)
- Average
sales per store is the sum of the average sales per store for each quarter.
- (3)
- Inventory turnover is the ratio of cost of sales to average inventory. Average inventory is calculated by taking the average of the previous year-end and quarter-end inventory levels throughout the year. Inventory turnover for fiscal 2014 and 2013 is unadjusted for the inventory charges recorded during those fiscal years as part of our business turnaround strategy.
Non-GAAP Financial Measures
We report our financial information in accordance with United States generally accepted accounting principles (GAAP). However, we present certain financial measures identified as non-GAAP under the rules of the SEC to assess our results. We believe that the non-GAAP financial measures presented below provide useful information to the Company's management, investors, and other interested parties because they allow them to understand and compare our core operating results during the 2014 fiscal year to the prior year periods in a more consistent manner. We believe this also facilitates the comparison of our results to the results of our peer companies. The non-GAAP financial measures presented in the tables below should not be viewed as an alternative or substitute for our reported GAAP results, but in addition to our GAAP results.
The following non-GAAP financial measures are adjusted to exclude the impact of the following business turnaround related charges and adjustments: our inventory write-down and merchandise category exits, management and board transition charges (including severance costs and consulting, legal, search and recruiting costs related to the transition), e-commerce discontinuation charges, store reorganization costs, and a vacation policy change. We believe it is useful for investors to understand the impact of these items on our financial results and therefore are presenting the following non-GAAP financial measures: (1) adjusted operating income/(loss); (2) adjusted net income/(loss); and (3) adjusted earnings/(loss) per share (EPS).
24
Adjusted Operating Income/(Loss). The following table reconciles operating income/(loss), the most directly comparable GAAP financial measure, to adjusted operating income/(loss), a non-GAAP financial measure:
| ($ in thousands) |
2014 | 2013 | 2012 | 2011 | 2010 | |||||||||||
|---|---|---|---|---|---|---|---|---|---|---|---|---|---|---|---|---|
Operating income/(loss) (GAAP) |
$ | (8,053 | ) | $ | (56,495 | ) | $ | 7,437 | $ | 18,043 | $ | 20,145 | ||||
As a percent of net sales |
-0.9 | % | -6.7 | % | 0.9 | % | 2.2 | % | 2.4 | % | ||||||
Non-GAAP adjustments: |
||||||||||||||||
Inventory write-downs and merchandise category exit |
5,265 | 43,748 | — | — | — | |||||||||||
Store reorganization and cleanup |
983 | 2,082 | — | — | — | |||||||||||
Compensation |
2,630 | 4,523 | 2,671 | — | — | |||||||||||
Vacation policy change |
(1,843 | ) | — | — | — | — | ||||||||||
Legal, consulting, recruitment, and e-commerce obligations |
2,785 | 6,674 | — | — | — | |||||||||||
| | | | | | | | | | | | | | | | | |
Adjusted operating income (non-GAAP) |
$ | 1,767 | $ | 532 | $ | 10,108 | $ | 18,043 | $ | 20,145 | ||||||
As a percent of net sales |
0.2 | % | 0.1 | % | 1.2 | % | 2.2 | % | 2.4 | % | ||||||
Adjusted Net Income/(Loss) and Adjusted Diluted Income/(Loss) Per Common Share ("Diluted EPS") from Continuing Operations. The following table reconciles net income/(loss) and Diluted EPS from continuing operations, the most directly comparable GAAP financial measure, to adjusted net income/(loss) and adjusted Diluted EPS from continuing operations, a non-GAAP financial measure:
| ($ in thousands, except per share data) |
2014 | 2013 | 2012 | 2011 | 2010 | |||||||||||
|---|---|---|---|---|---|---|---|---|---|---|---|---|---|---|---|---|
Income/(loss) from continuing operations (GAAP) |
$ | (10,176 | ) | $ | (56,376 | ) | $ | 3,913 | $ | 9,579 | $ | 10,748 | ||||
Diluted EPS from continuing operations (GAAP) |
$ | (0.24 | ) | $ | (1.33 | ) | $ | 0.09 | $ | 0.22 | $ | 0.25 | ||||
Non-GAAP adjustments: |
||||||||||||||||
Inventory write-downs and merchandise category exit, net of tax of $1,977, $16,279, $0, $0, and $0(1) |
3,288 | 27,469 | — | — | — | |||||||||||
Store reorganization, cleanup, net of tax of $369, $775, $0, $0, and $0(1) |
614 | 1,307 | — | — | — | |||||||||||
Compensation, net of tax of $988, $1,683, $1,371, $0, and $0(1) |
1,642 | 2,840 | 1,300 | — | — | |||||||||||
Vacation policy change, net of tax of ($692), $0, $0, $0, and $0(1) |
(1,151 | ) | — | — | — | — | ||||||||||
Legal, consulting, recruitment, and e-commerce obligations, net of tax of $1,046, $2,481, $0, $0, and $0(1) |
1,740 | 4,193 | — | — | — | |||||||||||
Disposal of systems, net of tax of $259, $2,076, $0, $0, and $0(1) |
430 | 3,504 | — | — | — | |||||||||||
Deferred tax asset valuation allowance |
3,946 | 16,222 | — | — | — | |||||||||||
| | | | | | | | | | | | | | | | | |
Adjusted income/(loss) from continuing operations (non-GAAP) |
$ | 333 | $ | (841 | ) | $ | 5,213 | $ | 9,579 | $ | 10,748 | |||||
Adjusted diluted EPS from continuing operations (non-GAAP) |
$ | 0.01 | $ | (0.02 | ) | $ | 0.12 | $ | 0.22 | $ | 0.25 | |||||
- (1)
- The effective tax rate utilized in this non-GAAP adjusted net income/(loss) reconciliation is 37.6% for the twelve months ended June 30, 2014 and 37.2% for the twelve months ended June 30, 2013. This rate is inclusive of a deferred tax asset valuation allowance of $20.2 million as of June 30, 2014 and $16.2 million as of June 30, 2013.
25
Item 7. Management's Discussion and Analysis of Financial Condition and Results of Operations
The following discussion and analysis should be read in conjunction with "Selected Financial Data" and our consolidated financial statements and related notes thereto included elsewhere in this Form 10-K.
Overview
- •
- During fiscal 2013, we began a transformation of our Company in order to re-establish our position as a leader in the
off-price retail space. In fiscal 2014, we continued executing our business turnaround strategy. In connection with our business turnaround strategy, we have executed a number of critical programs,
including changes in senior management and board composition, exiting certain categories of merchandise, cleaning up and reorganizing stores, structurally reducing the level of clearance merchandise,
modifying company policies, and eliminating assets no longer needed. As a result of these programs, we have incurred additional costs and expenses.
- •
- We sell off-price, upscale decorative home accessories, housewares, seasonal goods and famous-maker gifts generally below
retail prices charged by department stores and specialty and on-line retailers. Our strong everyday value proposition is also supported with promotional sales events that create a sense of urgency and
excitement for our customer base.
- •
- We operate 810 stores in 41 states. Our store base decreased by 18 stores in fiscal 2014, decreased by 24 stores in
fiscal 2013, and decreased by nine stores in fiscal 2012. We relocated 13 stores in fiscal 2014, 38 stores in fiscal 2013, and 45 stores in fiscal 2012.
- •
- For fiscal 2014, net sales were $864.8 million, an increase of 3.2% compared to fiscal 2013, primarily due to an
increase in sales from comparable stores (stores open at least one year) of 6.1%. The increase in comparable store sales was comprised of an increase in customer transactions of 9.5%, partially offset
by a decrease in average ticket of 3.1%. Since the second quarter of fiscal 2013, the Company has exited a number of non-core categories such as women's apparel and footwear. Comparable sales for our
ongoing core categories increased 12.3% for the twelve months ended June 30, 2014 compared to the same period last year.
- •
- The Company's operating loss for fiscal 2014 was $8.1 million compared to an operating loss of
$56.5 million for the twelve months ended June 30, 2013. The net loss for fiscal 2014 year was $10.2 million, or $0.24 per share, compared to a net loss of
$56.4 million, or $1.33 per share, for the twelve months ended June 30, 2013.
- •
- Excluding business turnaround related charges, the Company's operating income on a non-GAAP adjusted basis for fiscal
2014 was $1.8 million compared to operating income of $0.5 million for the twelve months ended June 30, 2013. Net income on a non-GAAP adjusted basis for the fiscal 2014 period
was $0.3 million, or $0.01 per share, compared to a net loss of $0.8 million, or $0.02 per share, for the twelve months ended June 30, 2013.
- •
- We have a credit agreement providing for an asset-based, five-year senior secured revolving credit facility (the "Revolving Credit Facility") in the amount of up to $180.0 million which matures on November 17, 2016. Our indebtedness under the credit facility is secured by a lien on substantially all of our assets. The Revolving Credit Facility contains certain restrictive covenants, which affect, among others, our ability to incur liens or incur additional indebtedness, sell assets or merge or consolidate with any other entity, or make investments or acquisitions unless they meet certain requirements. Our financial covenant requires that we maintain availability of 10% of our calculated borrowing base, but never less than $15 million. As of June 30, 2014, we were in compliance with all required covenants. As of June 30, 2014 and June 30, 2013, we did not have any outstanding borrowings on our Revolving Credit Facility.
26
Critical Accounting Policies and Estimates
Management's Discussion and Analysis is based upon our consolidated financial statements, which have been prepared in accordance with accounting principles generally accepted in the United States. The preparation of these financial statements requires us to make estimates and judgments that affect the reported amounts of certain assets, liabilities, sales and expenses, and related disclosure of contingent assets and liabilities. On a recurring basis, we evaluate our significant estimates which are based on historical experience and on various other assumptions that we believe are reasonable under the circumstances. Actual results may differ from these estimates.
We believe the following critical accounting policies affect our more significant judgments and estimates used in the preparation of our consolidated financial statements.
Inventory—Our inventories consist of finished goods and are stated at the lower of cost or market using the retail inventory method for store inventory and the specific identification method for warehouse inventory. We have a perpetual inventory system that tracks on hand inventory and inventory sold at a SKU level. Inventory is relieved and cost of goods sold is recorded based on the current cost of the item sold. Buying, distribution, freight and certain other costs are capitalized as part of inventory and are charged to cost of sales as the related inventory is sold. The retail inventory method, which is used by a number of our competitors, involves management estimates with regard to items such as markdowns. Such estimates may significantly impact the ending inventory valuation at cost as well as the amount of gross margin recognized.
Our stores conduct annual physical inventories, staggered throughout the year. During periods in which physical inventory observations do not occur, we utilize an estimate for recording inventory shrink based on the historical results of our previous physical inventories. This estimate may require a favorable or unfavorable adjustment to actual results to the extent that our subsequent actual physical inventory results yield a different result. We have loss prevention and inventory controls programs that we believe minimize shrink. Although inventory shrink rates have not fluctuated significantly in recent years, if the actual rate were to differ from our estimates, then an adjustment to inventory shrink would be required.
Inventory is the largest asset on our balance sheet and represented approximately 62%, 66%, and 67% of total assets at June 30, 2014, 2013, and 2012, respectively. Inventory decreased 2.0%, or $4.3 million, from June 30, 2013 to June 30, 2014. Inventory decreased 20.2%, or $53.6 million, from June 30, 2012 to June 30, 2013. On a per store basis, inventory increased 0.1% from June 30, 2013 to June 30, 2014 and decreased 17.9% from June 30, 2012 to June 30, 2013, primarily due to the inventory write-down recorded in fiscal 2013.
Markdowns—We utilize markdowns to promote the effective and timely sale of merchandise which allows us to consistently provide fresher merchandise to our customers. We also utilize markdowns coupled with promotional events to drive traffic and stimulate sales. Markdowns may be temporary or permanent. Temporary markdowns are for a designated period of time with markdowns recorded to cost of sales based on quantities sold during the period. Permanent markdowns are charged to cost of sales immediately based on the total quantities on hand at the time of the markdown. Permanent markdowns may vary throughout the quarter or year in timing, with higher markdowns traditionally recorded in the quarters ending December 31 and June 30, primarily due to seasonal merchandise.
The effect of a 1.0% markdown in the value of our inventory at June 30, 2014 would result in a decline in gross profit and increase our loss per share for the fiscal year ended June 30, 2014 of $2.1 million and $0.05, respectively.
Insurance and Self-Insurance Reserves—We use a combination of insurance and self-insurance plans to provide for the potential liabilities associated with workers' compensation, general liability,
27
property insurance, director and officers' liability insurance, vehicle liability and employee health care benefits. Our stop loss limits per claim are $500,000 for workers' compensation, $250,000 for general liability, and $150,000 for medical. Liabilities associated with the risks that are retained by us are estimated, in part, by historical claims experience, severity factors and the use of loss development factors.
The insurance liabilities we record are primarily influenced by the frequency and severity of claims and include a reserve for claims incurred but not yet reported. Our estimated reserves may be materially different from our future actual claim costs, and, when required adjustments to our estimated reserves are identified, the liability will be adjusted accordingly in that period. Our self-insurance reserves for workers' compensation, general liability and medical were $7.8 million, $3.1 million, and $1.0 million, respectively, at June 30, 2014; $6.0 million, $2.6 million, and $0.8 million, respectively, at June 30, 2013; and $5.9 million, $3.1 million, and $0.9 million, respectively, at June 30, 2012.
We recognize insurance expenses based on the date of an occurrence of a loss including the actual and estimated ultimate costs of our claims. Claims are paid from our reserves and our current period insurance expense is adjusted for the difference in prior period recorded reserves and actual payments. Current period insurance expenses also include the amortization of our premiums paid to our insurance carriers. Expenses for workers' compensation, general liability and medical insurance were $5.6 million, $3.8 million and $8.4 million, respectively, for the fiscal year ended June 30, 2014; $4.0 million, $2.1 million and $8.5 million, respectively, for the fiscal year ended June 30, 2013; and $3.4 million, $2.8 million and $9.5 million, respectively, for the fiscal year ended June 30, 2012.
Share-based compensation—The Compensation Committee of our Board of Directors and, through express consent of the Compensation Committee, our CEO, are authorized to grant stock options and restricted stock awards from time to time to eligible employees and directors. Those awards may be service or performance based. We grant options with exercise prices equal to the market price of our common stock on the date of the option grant as determined in accordance with the terms of our equity incentive plans. The majority of the options granted prior to June 30, 2008 have a vesting period of three to five years and expire ten years from the date of grant. Options granted after June 30, 2008, typically vest over periods of one to four years with equal portions of the grant vesting on an annual basis and expire ten years from the date of grant. In accordance with U.S. generally accepted accounting principles, we recognize compensation expense at an amount equal to the fair value of share-based payments granted under compensation arrangements. We calculate the fair value of stock options using the Black-Scholes option pricing model. Determining the fair value of share-based awards at the grant date requires judgment in developing assumptions, which involve a number of variables. These variables include, but are not limited to, the expected stock price volatility over the term of the awards, the expected dividend yield, the risk free rate, the expected term and expected stock option exercise behavior. In addition, we also use judgment in estimating the number of share-based awards that are expected to be forfeited. Amortization for share-based compensation expense was $3.0 million for the fiscal year ended June 30, 2014 and $1.9 million for the fiscal year ended June 30, 2013.
Income taxes—We account for income taxes using the asset and liability method. Under this method, deferred tax assets and liabilities are determined based on differences between financial reporting and income tax bases of assets and liabilities and are measured using the enacted tax rates and laws that will be in effect when the differences are expected to reverse. Deferred tax assets and liabilities are recorded in our consolidated balance sheets and are classified as current or non-current based on the classification of the related assets or liabilities for financial reporting purposes. A valuation allowance is recorded to reduce the carrying amounts of deferred tax assets unless it is more likely than not that such assets will be realized. In assessing the need for a valuation allowance, all available evidence is considered including past operating results, future reversals of taxable temporary
28
differences, estimates of future income and tax planning strategies. We are subject to income tax in many jurisdictions, including the United States, various states and localities. At any point in time, we are not subject to audit by any of the various jurisdictions, however, we record estimated reserves for uncertain tax benefits for potential domestic tax audits. The timing of these audits and negotiations with taxing authorities may affect the ultimate settlement of these issues. If different assumptions had been used, our tax expense or benefit, assets and liabilities could have varied from recorded amounts. If actual results differ from estimated results or if we adjust these assumptions in the future, we may need to adjust our reserves for uncertain tax benefits or our deferred tax assets or liabilities, which could impact our effective tax rate.
Results of Operations
The following table sets forth, for the periods indicated, selected statement of operations data, expressed as a percentage of net sales, as well as the number of stores open at the end of each period. There can be no assurance that the trends in sales or operating results will continue in the future.
| |
Fiscal Year Ended June 30, |
|||||||||
|---|---|---|---|---|---|---|---|---|---|---|
| |
2014 | 2013 | 2012 | |||||||
Net sales |
100.0 | % | 100.0 | % | 100.0 | % | ||||
Cost of sales |
65.1 | 69.1 | 62.0 | |||||||
| | | | | | | | | | | |
Gross margin |
34.9 | 30.9 | 38.0 | |||||||
Selling, general and administrative expenses |
35.9 | 37.6 | 37.1 | |||||||
| | | | | | | | | | | |
Operating income/(loss) |
(1.0 | ) | (6.7 | ) | 0.9 | |||||
Net interest and other expense |
(0.2 | ) | (0.8 | ) | (0.2 | ) | ||||
Income tax provision/(benefit) |
(0.0 | ) | (0.7 | ) | 0.2 | |||||
| | | | | | | | | | | |
Net income(loss) |
(1.2 | ) | (6.8 | ) | 0.5 | |||||
| | | | | | | | | | | |
Number of stores open at end of period |
810 | 828 | 852 | |||||||
Selling, general and administrative expenses are comprised of wages and benefits, rent and occupancy costs, depreciation, advertising, store operating expenses and corporate office costs. Selling, general and administrative increases and decreases are generally attributable to changes in variable expenses. Variable expenses include payroll and related benefits, advertising expense and other expenses such as credit card fees.
Fiscal Year Ended June 30, 2014 Compared to Fiscal Year Ended June 30, 2013
Net sales increased $26.5 million, or 3.2%, to $864.8 million in fiscal 2014 from $838.3 million in fiscal 2013, primarily due to an increase in sales from comparable stores (stores open at least one year) of 6.1%. The increase in comparable store sales was comprised of an increase in customer transactions of 9.5%, partially offset by a decrease in average ticket of 3.1%.
Gross profit for fiscal 2014 was $302.2 million, an increase of 16.5% compared to $259.4 million in gross profit for fiscal 2013. As a percentage of net sales, gross margin increased to 34.9% in fiscal 2014 compared with 30.9% in the same period last year. This increase in gross margin rate of 400 basis points was primarily driven by the strategic decision in the prior year period to accelerate the sell off of certain non-core categories such as women's apparel and footwear in preparation for fresh new products and brands as part of our transformation. This decision resulted in an inventory write-down charge recorded in the second quarter of fiscal 2013 in the amount of $41.8 million along with an additional $1.9 million of accelerated markdowns recorded in the fourth quarter of fiscal 2013. The effect of this charge was a 500 basis point decrease in gross margin rate in fiscal 2013. In fiscal 2014, the Company recorded a $5.3 million markdown charge as a result of the strategic decision to
29
accelerate the sell-off of merchandise categories. Compared to fiscal 2013, gross margin for fiscal 2014 was also affected by a lower initial mark-up, partially offset by lower distribution and buying costs.
Selling, general and administrative expenses decreased $5.7 million, or 1.8%, to $310.2 million in fiscal 2014 from $315.9 million in the prior fiscal year. As a percentage of net sales, selling, general and administrative expenses decreased to 35.9% in fiscal 2014 from 37.6% in fiscal 2013 due to higher expenses incurred as part of our strategic company turnaround in the prior year. These expenses, primarily legal, consulting, recruiting, store reorganization and cleanup, and employee severance totaled $4.6 million in the current year and $13.3 million in the prior year and are not considered to be indicative of our on-going expense structure.
Net interest and other expense decreased $4.8 million to $2.1 million in fiscal 2014 compared to $6.9 million in fiscal 2013. This decrease was primarily attributable to the expenses incurred in the prior year relating to disposal of assets related to the replacement of our store point of sale hardware, discontinuing our e-commerce platform and elimination of our crossdock facilities.
Income tax expense for fiscal 2014 was $41,000 compared to an income tax benefit of $7.0 million in 2013 . As a result, our effective tax rate decreased from 11.1% in fiscal 2013 to (0.4%) in fiscal 2014 in large part, due to recording an additional $3.9 million valuation allowance against our deferred tax assets in fiscal 2014. The total valuation allowance at the end of fiscal year 2014 was $20.2 million.
Fiscal Year Ended June 30, 2013 Compared to Fiscal Year Ended June 30, 2012
Net sales increased $25.5 million, or 3.1%, to $838.3 million in fiscal 2013 from $812.8 million in fiscal 2012, primarily due to an increase in sales from comparable stores (stores open at least one year) of 3.9%. The increase in comparable store sales was comprised of an increase in customer traffic of 1.4% and an increase in comparable average transaction of 2.5%.
Gross profit for fiscal 2013 was $259.4 million, a decrease of 16.0% compared to $308.9 million in gross profit for fiscal 2012. As a percentage of net sales, gross margin decreased to 30.9% in fiscal 2013 compared with 38.0% in the same period last year. This decrease in gross margin rate of 710 basis points was primarily driven by a strategic decision to accelerate the sell off of certain inventory in preparation for fresh new products and brands as part of our transformation. This decision resulted in an inventory write-down and accelerated markdown charge recorded in fiscal 2013 in the amount of $43.7 million. The effect of this charge was a 500 basis point decrease in gross margin rate. The remaining 210 basis point decrease in gross margin rate is due to higher markdowns on clearance inventory and the flow-through of buying, distribution and freight costs resulting from the significant decrease in inventory levels year over year.
Selling, general and administrative expenses increased $14.5 million, or 4.8%, to $315.9 million in fiscal 2013 from $301.4 million in the prior fiscal year. As a percentage of net sales, selling, general and administrative expenses increased to 37.6% in fiscal 2013 from 37.1% in fiscal 2012 due to expenses incurred as part of our strategic company turnaround. These expenses, primarily legal, consulting, recruiting, store reorganization and cleanup, and employee severance totaled $13.3 million and are not considered to be indicative of our on-going expense structure.
Net interest and other expense increased $4.9 million to $6.9 million in fiscal 2013 compared to $2.0 million in fiscal 2012. This increase was primarily attributable to the disposal of assets related to the replacement of our store point of sale hardware, discontinuing our e-commerce platform and elimination of our crossdock facilities approximating $5.6 million, offset by slightly lower interest expense due to improved terms of our credit facility.
30
Income tax benefit for fiscal 2013 was $7.0 million compared to income tax expense of $1.5 million in the prior fiscal year. As a result, our effective tax rate decreased from 27.6% in fiscal 2012 to 11.1% in fiscal 2013 in large part, due to recording a $16.2 million valuation allowance against our deferred tax assets in fiscal 2013.
Liquidity and Capital Resources
Cash Flows from Operating Activities
In fiscal year 2014, cash provided by operating activities was $31.2 million, compared to cash used by operating activities of $3.2 million in the prior year. The $31.2 million of cash provided by operating activities for fiscal 2014 was primarily due to depreciation of $12.2 million, a decrease in inventory of $4.4 million due to our continued efforts to optimize inventory levels and increase inventory productivity, decreased deferred income taxes of $2.9 million, a loss on disposal of assets of $1.3 million due to the write-off of assets related to the exit of certain merchandise categories as part of our business transformation strategy, an increase in accounts payable of $13.3 million driven primarily by the timing of merchandise receipts, an increase in accrued liabilities of $3.9 million primarily due to increased reserve requirements for our self-insurance programs and increased liability at year-end for accrued freight costs, and share based compensation expense of $3.0 million, partially offset by a net loss of $10.2 million. Our fiscal year 2014 loss of $10.2 million includes $10.5 million in expenses associated with the implementation of our strategic business turnaround strategy. There were no significant changes to our vendor payment policy during fiscal 2014. In fiscal year 2013, cash used in operating activities was primarily due to a net loss of $56.4 million combined with a decrease in accounts payable of $25.1 million primarily due to timing of inventory receipts and payments and a decrease in deferred income tax of $7.1 million, partially offset by a decrease in inventory of $53.5 million largely due to the write-down recorded within the fiscal year, a loss on disposal of assets of $6.2 million related to the replacement of our point of sale hardware, the upgrade of our planning and allocation system and the disposal of software associated with discontinuing our e-commerce platform, and an adjustment for depreciation expense of $13.5 million. Our fiscal year 2013 loss of $56.4 million includes a significant non-cash charge related to our inventory write-down and accelerated markdown charge of $43.7 million and $10.8 million in expenses associated with our strategic company turn-around plan. In fiscal year 2012 cash flow from operating activities was $59.5 million primarily driven by net income of $3.9 million, and an increase in accounts payable of $35.8 million due to the timing of inventory receipts and an adjustment for depreciation expense of $14.5 million.
Cash Flows from Investing Activities
Net cash used in investing activities was due to capital expenditures of $13.4 million, $9.6 million and $13.8 million for the fiscal years ended June 30, 2014, 2013, and 2012, respectively. We currently expect to incur capital expenditures in the range of $15 million to $20 million in fiscal year 2015. Capital expenditures are primarily associated with new store openings or relocations, capital improvements to existing stores, or enhancements to our distribution center facility, equipment, and systems along with improvements related to our corporate office and equipment.
Cash Flows from Financing Activities
Net cash provided by financing activities for fiscal year 2014 of $3.0 million was primarily due to the proceeds from employee common stock transactions. Net cash provided by financing activities for fiscal year 2013 was primarily due to the proceeds from employee common stock transactions of $1.7 million. Net cash used in financing activities of $25.4 million in fiscal 2012 was due to a change in cash overdraft of $18.8 million and the purchase of treasury shares of $6.1 million.
31
Secured Credit Facility
We have a credit agreement providing for an asset-based, five-year senior secured revolving credit facility in the amount of up to $180.0 million which matures on November 17, 2016 (the "Revolving Credit Facility"). Our indebtedness under the Revolving Credit Facility is secured by a lien on substantially all of our assets. The Revolving Credit Facility contains certain restrictive covenants, which affect, among others, our ability to incur liens or incur additional indebtedness, change the nature of our business, sell assets or merge or consolidate with any other entity, or make investments or acquisitions unless they meet certain requirements. Our financial covenant requires that we maintain availability of 10% of our calculated borrowing base, but never less than $15 million. Our Revolving Credit Facility may, in some instances, limit payment of cash dividends and repurchases of the Company's common stock. In order to make a restricted payment, including payment of a dividend or a repurchase of shares, we must maintain availability of 17.5% of our lenders' aggregate commitments under the Revolving Credit Facility for three months prior to, and on a pro forma basis for the six months immediately following, and after giving effect to, the restricted payment and we must satisfy a fixed charge coverage ratio requirement.
At June 30, 2014, we had no amounts outstanding under the Revolving Credit Facility, $6.4 million of outstanding letters of credit and availability of $98.7 million under the Revolving Credit Facility. Letters of credit under the Revolving Credit Facility are primarily for self insurance purposes. We incur commitment fees of up to 0.375% on the unused portion of the Revolving Credit Facility. Any borrowing under the Revolving Credit Facility incurs interest at LIBOR or the prime rate, plus an applicable margin, at our election (except with respect to swing loans, which incur interest solely at the prime rate plus the applicable margin). These rates are increased or reduced as our average daily availability changes. Interest expense of $1.5 million for fiscal 2014 was due to commitment fees of $0.8 million and the amortization of financing fees of $0.7 million. As of June 30, 2014, we were in compliance with all required covenants.
Liquidity
We have financed our operations with funds generated from operating activities, available cash and cash equivalents and borrowings under our Revolving Credit Facility. Cash and cash equivalents as of June 30, 2014, 2013, and 2012, were $49.7 million, $28.9 million, and $39.7 million, respectively. Our cash flows will continue to be utilized for the operation of our business and the use of any excess cash will be determined by the Board of Directors. Our borrowings have historically peaked during October as we build inventory levels prior to the holiday selling season. Given the seasonality of our business, the amount of borrowings under our Revolving Credit Facility may fluctuate materially depending on various factors, including the time of year, our needs and the opportunity to acquire merchandise inventory. Our primary uses for cash provided by operating activities relate to funding our ongoing business activities and planned capital expenditures. We may also use available cash to repurchase shares of our common stock. We believe funds generated from our operations, available cash and cash equivalents and borrowings under our Revolving Credit Facility will be sufficient to fund our operations for the next year. If our capital resources are not sufficient to fund our operations, we may seek additional debt or equity financing. However, we can offer no assurances that we will be able to obtain additional debt or equity financing on reasonable terms.
Off-Balance Sheet Arrangements
We had no off-balance sheet arrangements as of June 30, 2014.
32
Contractual Obligations
The following table summarizes our contractual obligations at June 30, 2014 and the effects such obligations are expected to have on our liquidity and cash flow in future periods (in thousands):
| |
Payments Due by Period | |||||||||||||||
|---|---|---|---|---|---|---|---|---|---|---|---|---|---|---|---|---|
Contractual Obligations
|
Total | 1 Year or Less |
2 - 3 Years |
4 - 5 Years |
More than 5 Years |
|||||||||||
Non-cancelable operating leases |
$ | 208,962 | $ | 64,932 | $ | 92,187 | $ | 38,594 | $ | 13,249 | ||||||
Maintenance, insurance and taxes on operating leases |
32,122 | 9,981 | 14,171 | 5,933 | 2,037 | |||||||||||
Commitment fees on Revolving Credit Facility |
1,416 | 596 | 820 | — | — | |||||||||||
| | | | | | | | | | | | | | | | | |
Total |
$ | 242,500 | $ | 75,509 | $ | 107,178 | $ | 44,527 | $ | 15,286 | ||||||
We do not consider merchandise purchase orders to be contractual obligations due to designated cancellation dates on the face of the purchase order. Contractually required payments for maintenance, insurance and taxes on our leased properties are estimated above as a percentage of rent based on historical trends. These amounts can vary based on multiple factors including inflation, macroeconomic conditions, various local tax rates and appraised values of our rental properties. Commitment fees on our Revolving Credit Facility are calculated based on contractual commitment fees and standby letter of credit fees assuming our current balances of zero on the Revolving Credit Facility and letters of credit totaling $6.4 million. It is likely we will incur additional interest expense than that calculated above as we may borrow amounts, from time to time, under our Revolving Credit Facility.
Quarterly Results and Seasonality
The following tables set forth some of our quarterly financial data for the eight quarters ended June 30, 2014. The quarterly information is unaudited, but has been prepared on the same basis as the audited financial statements included elsewhere in this Form 10-K. We believe that all necessary adjustments (consisting only of normal recurring adjustments) have been included to present fairly the unaudited quarterly results when read in conjunction with our consolidated financial statements and related notes included elsewhere in this Form 10-K. The results of operations for any quarter are not necessarily indicative of the results for any future period. (In thousands, except for per share data and comparable store sales.)
| |
Quarters Ended | ||||||||||||
|---|---|---|---|---|---|---|---|---|---|---|---|---|---|
| |
Sept. 30, 2013 |
Dec. 31, 2013 |
March 31, 2014 |
June 30, 2014 |
|||||||||
Net sales |
$ | 183,678 | $ | 285,771 | $ | 182,765 | $ | 212,630 | |||||
Gross profit(1) |
63,427 | 99,338 | 68,101 | 71,287 | |||||||||
Operating income/(loss) |
(12,467 | ) | 18,285 | (7,629 | ) | (6,242 | ) | ||||||
Net income/(loss)(1) |
(12,009 | ) | 17,674 | (8,428 | ) | (7,414 | ) | ||||||
Basic income/(loss) per share(2) |
(0.28 | ) | 0.41 | (0.20 | ) | (0.17 | ) | ||||||
Diluted income/(loss) per share(2) |
(0.28 | ) | 0.41 | (0.20 | ) | (0.17 | ) | ||||||
Comparable store sales increase |
9.1 | % | 3.1 | % | 6.4 | % | 7.4 | % | |||||
33
| |
Quarters Ended | ||||||||||||
|---|---|---|---|---|---|---|---|---|---|---|---|---|---|
| |
Sept. 30, 2012 |
Dec. 31, 2012 |
March 31, 2013 |
June 30, 2013 |
|||||||||
Net sales |
$ | 172,795 | $ | 285,312 | $ | 178,073 | $ | 202,134 | |||||
Gross profit |
64,906 | 61,601 | 66,157 | 66,774 | |||||||||
Operating loss(3) |
(10,884 | ) | (22,593 | ) | (11,734 | ) | (11,284 | ) | |||||
Net loss(4) |
(6,961 | ) | (21,466 | ) | (12,366 | ) | (15,583 | ) | |||||
Basic loss per share(2) |
(0.17 | ) | (0.51 | ) | (0.29 | ) | (0.37 | ) | |||||
Diluted loss per share(2) |
(0.17 | ) | (0.51 | ) | (0.29 | ) | (0.37 | ) | |||||
Comparable store sales decrease |
1.3 | % | 5.6 | % | 2.8 | % | 4.6 | % | |||||
- (1)
- Our
results are computed independently for each of the quarters presented. Therefore, the sum of the quarterly amounts presented may not equal the total
computed for the year due to rounding.
- (2)
- Net
income/(loss) per share amounts are computed independently for each of the quarters presented. Therefore, the sum of the quarterly net income/(loss) per
share in fiscal years 2014 and 2013 may not equal the total computed for the year.
- (3)
- Our
results for the quarter ended December 31, 2012 were impacted by a pretax loss of $41.8 million associated with the inventory write-down
charge.
- (4)
- Our results for the quarter ended June 30, 2013 were impacted by the disposal of assets including the e-commerce platform and the point of sale hardware.
Our quarterly results of operations may fluctuate based upon such factors as the number and timing of store openings, the amount of net sales contributed by new and existing stores, the mix of merchandise sold, pricing, store closings or relocations, competitive factors and general economic and weather-related conditions. The timing of sales events could impact the weighting of sales between quarters. We expect to continue to experience seasonal fluctuations in our business, with a significant percentage of our net sales and operating income being generated in the quarter ending December 31, which includes the holiday selling season.
Inflation
In our opinion, the overall effect of inflation has not had a material effect on our results of operations in any of the fiscal years of 2014, 2013, or 2012. We cannot assure that inflation will not materially affect our results of operations in the future.
Recent Accounting Pronouncements
In June 2014, the Financial Accounting Standards Board ("FASB") issued Accounting Standards Update ("ASU") 2014-12, Compensation—Stock Compensation (Topic 718): Accounting for Share-Based Payments When the Terms of an Award Provide That a Performance Target Could Be Achieved after the Requisite Service Period ("ASU 2014-12"). ASU 2014-12 requires that a performance target that affects vesting and that could be achieved after the requisite service period, be treated as a performance condition. ASU 2014-12 is effective for annual periods, and interim periods within those annual periods, beginning after December 15, 2015, with early adoption permitted. The Company is currently in compliance with this requirement.
In May 2014, FASB issued ASU 2014-09, Revenue from Contracts with Customers (Topic 606) ("ASU 2014-09"). ASU 2014-09 affects any entity that either enters into contracts with customers to transfer goods or services or enters into contracts for the transfer of nonfinancial assets, unless those contracts are within the scope of other standards (for example, insurance contracts or lease contracts). The core principle of the guidance is that an entity should recognize revenue to depict the transfer of
34
promised goods or services to customers in an amount that reflects the consideration to which the entity expects to be entitled in exchange for those goods or services. ASU 2014-09 provides alternative methods of retrospective adoption and is effective for fiscal years, and interim periods within those years, beginning after December 15, 2016. Early adoption is not permitted. The Company is evaluating the effect of adopting ASU 2014-09, but does not expect adoption will have a material impact on the Company's consolidated results of operations or financial position.
Item 7A. Quantitative and Qualitative Disclosures About Market Risk
We are exposed to various market risks, including changes in foreign currency exchange rates and interest rates. Market risk is the potential loss arising from adverse changes in market prices and rates, such as foreign currency exchange and interest rates. Based on our market risk sensitive instruments outstanding as of June 30, 2014, as described below, we have determined that there was no material market risk exposure to our consolidated financial position, results of operations or cash flows as of such date. We do not enter into derivatives or other financial instruments for trading or speculative purposes.
Foreign Currency Exchange Rates. We enter into foreign currency forward contracts with a major financial institution, which participates in our Revolving Credit Facility, to manage and reduce the impact of changes in foreign currency exchange rates on contractual merchandise purchases with certain international vendors, primarily in Euros. During the fiscal year ended June 30, 2014, the only transactions we hedged were for inventory purchase orders placed with foreign vendors for which the purchase order had to be settled in the vendor's foreign currency. The periods for the forward foreign exchange contracts correspond to the periods of the hedged transactions. Gains and losses on forward foreign exchange contracts are reflected in the statement of operations and were immaterial to us as a whole in the fiscal year ended June 30, 2014.
The estimated fair value of foreign currency contracts represents the amount required to enter into offsetting contracts with similar remaining maturities based on quoted market prices. At June 30, 2014, fair value of all outstanding contracts was immaterial. A large fluctuation in exchange rates for these currencies could have a material effect on their fair value; however, because we only use these forward foreign currency contracts to hedge future inventory purchases at a fixed price in the vendor's foreign currency at the time the purchase order is made and such hedging activities have been immaterial, any fluctuations in the exchange rate should not materially affect us.
You can find more information about the accounting policies for our forward foreign currency contracts and our financial instruments in Note 1 of the notes to our consolidated financial statements included in this Form 10-K.
Interest Rates. The Company's Revolving Credit Facility is a variable interest rate agreement, and therefore affected by fluctuations in market interest rates. Borrowings may incur interest at either LIBOR or the prime rate, plus the applicable margin, at our election (except with respect to swing loans, which incur interest solely at the prime rate plus the applicable margin). In fiscal 2014, the Company incurred $21,000 in interest expense on borrowings. Due to the minimal period of time the Company sustains its outstanding borrowings, it considers its exposure to adverse market interest rate fluctuations to be minimal. As of June 30, 2014, the Company did not have any long-term debt outstanding. More information about debt held by the Company is available in Note 3 of the notes to our consolidated financial statements included in this Form 10-K.
35
Item 8. Financial Statements and Supplementary Data
The following consolidated financial statements of Tuesday Morning Corporation and its subsidiaries and Report of Independent Registered Public Accounting Firm are included in this Form 10-K and incorporated herein by reference.
Item 9. Changes in and Disagreements With Accountants on Accounting and Financial Disclosure
None.
Item 9A. Controls and Procedures
Disclosure Controls and Procedures
Based on our management's evaluation (with participation of our principal executive officer and our principal financial officer), our principal executive officer and our principal financial officer have concluded that our disclosure controls and procedures (as defined in Rule 13a-15(e) under the Securities Exchange Act of 1934, as amended (the "Exchange Act")) were effective as of June 30, 2014 to provide reasonable assurance that information required to be disclosed by us in this Report on Form 10-K was (1) recorded, processed, summarized and reported within the time periods specified in the Securities and Exchange Commission's rules and forms and (2) accumulated and communicated to our management, including our principal executive and principal financial officers, as appropriate, to allow timely decisions regarding required disclosure.
A control system, no matter how well conceived and operated, can provide only reasonable, not absolute, assurance that the objectives of the control system are met. Because of inherent limitations in all control systems, no evaluation of controls can provide absolute assurance that all control issues, if any, within a company have been detected. Accordingly, our disclosure controls and procedures are designed to provide reasonable, not absolute, assurance that their objectives are met and, as set forth above, our chief executive officer and chief financial officer have concluded, based on their evaluation as of the end of the period covered by this report, that our disclosure controls and procedures were effective to provide reasonable assurance that their objectives were met.
Management's Annual Report on Internal Control Over Financial Reporting
Management of Tuesday Morning is responsible for establishing and maintaining adequate internal control over financial reporting as defined in Rule 13a-15(f) or Rule 15(d)-15(f) under the Exchange Act. Tuesday Morning's internal control over financial reporting is designed to provide reasonable
36
assurance regarding the reliability of financial reporting and the preparation of financial statements for external purposes in accordance with generally accepted accounting principles.
Because of its inherent limitations, internal control over financial reporting may not prevent or detect misstatements. Therefore, even those systems determined to be effective can provide only reasonable assurance with respect to financial statement preparation and presentation.
Our management (with the participation of our principal executive officer and our principal financial officer) assessed the effectiveness of Tuesday Morning's internal control over financial reporting as of June 30, 2014. In making this assessment, management used the criteria set forth by the Committee of Sponsoring Organizations of the Treadway Commission (COSO) in Internal Control—Integrated Framework (1992 Framework). Based on this assessment, management concluded that, as of June 30, 2014, Tuesday Morning's internal control over financial reporting is effective based on those criteria.
The Company's independent registered public accounting firm has issued an attestation report on the effectiveness of the Company's internal control over financial reporting as of June 30, 2014. The report follows on the next page.
37
Report of Independent Registered Public Accounting Firm On Internal Control Over Financial Reporting
The Board of Directors and Stockholders of Tuesday Morning Corporation
We have audited Tuesday Morning Corporation's internal control over financial reporting as of June 30, 2014, based on criteria established in Internal Control—Integrated Framework issued by the Committee of Sponsoring Organizations of the Treadway Commission (1992 Framework) (the COSO criteria). Tuesday Morning Corporation's management is responsible for maintaining effective internal control over financial reporting, and for its assessment of the effectiveness of internal control over financial reporting included in the accompanying Management's Annual Report on Internal Control Over Financial Reporting. Our responsibility is to express an opinion on the Company's internal control over financial reporting based on our audit.
We conducted our audit in accordance with the standards of the Public Company Accounting Oversight Board (United States). Those standards require that we plan and perform the audit to obtain reasonable assurance about whether effective internal control over financial reporting was maintained in all material respects. Our audit included obtaining an understanding of internal control over financial reporting, assessing the risk that a material weakness exists, testing and evaluating the design and operating effectiveness of internal control based on the assessed risk, and performing such other procedures as we considered necessary in the circumstances. We believe that our audit provides a reasonable basis for our opinion.
A company's internal control over financial reporting is a process designed to provide reasonable assurance regarding the reliability of financial reporting and the preparation of financial statements for external purposes in accordance with generally accepted accounting principles. A company's internal control over financial reporting includes those policies and procedures that (1) pertain to the maintenance of records that, in reasonable detail, accurately and fairly reflect the transactions and dispositions of the assets of the Company; (2) provide reasonable assurance that transactions are recorded as necessary to permit preparation of financial statements in accordance with generally accepted accounting principles, and that receipts and expenditures of the Company are being made only in accordance with authorizations of management and directors of the Company; and (3) provide reasonable assurance regarding prevention or timely detection of unauthorized acquisition, use, or disposition of the Company's assets that could have a material effect on the financial statements.
Because of its inherent limitations, internal control over financial reporting may not prevent or detect misstatements. Also, projections of any evaluation of effectiveness to future periods are subject to the risk that controls may become inadequate because of changes in conditions, or that the degree of compliance with the policies or procedures may deteriorate.
In our opinion, Tuesday Morning Corporation maintained, in all material respects, effective internal control over financial reporting as of June 30, 2014, based on the COSO criteria.
We also have audited, in accordance with the standards of the Public Company Accounting Oversight Board (United States), the consolidated balance sheets of Tuesday Morning Corporation as of June 30, 2014 and 2013, and the related consolidated statements of operations, comprehensive income/(loss), stockholders' equity, and cash flows for each of the three years in the period ended June 30, 2014, of Tuesday Morning Corporation and our report dated August 21, 2014 expressed an unqualified opinion thereon.
/s/ ERNST & YOUNG LLP
Dallas,
Texas
August 21, 2014
38
Report of Independent Registered Public Accounting Firm on Consolidated Financial Statements
The report of Independent Registered Public Accounting Firm on the consolidated financial statements is included in page F-2 of this Form 10-K.
Changes in Internal Control Over Financial Reporting
There were no changes in our internal control over financial reporting that occurred during our fourth fiscal quarter that have materially affected or are reasonably likely to materially affect our internal control over financial reporting.
None.
39
Item 10. Directors, Executive Officers and Corporate Governance
The information required by this Item 10 is incorporated herein by reference to the disclosure found in our definitive proxy statement to be filed with the SEC pursuant to Regulation 14A of the Exchange Act in connection with Tuesday Morning's 2014 Annual Meeting of Stockholders under the captions "Proposal 1—Election of Directors", "Corporate Governance", "Executive Officers", "Meetings and Committees of the Board of Directors", and "Section 16(a) Beneficial Ownership Reporting Compliance.".
We have adopted a "Code of Conduct" that establishes the business conduct to be followed by all of our officers, employees and members of our Board of Directors, which is available on our website at www.tuesdaymorning.com under "Investor Relations—Corporate Governance." Any amendment of our Code of Conduct or waiver to our Code of Conduct with respect to our directors and executive officers, will be posted on the Company's website.
There have been no changes to the procedures by which stockholders may recommend candidates for our Board of Directors.
Item 11. Executive Compensation
The information required by this Item 11 is incorporated herein by reference to the applicable disclosure found in our definitive proxy statement to be filed with the SEC pursuant to Regulation 14A of the Exchange Act in connection with Tuesday Morning's 2014 Annual Meeting of Stockholders under the captions "Compensation Committee Report", "Executive Compensation", and "Director Compensation."
Item 12. Security Ownership of Certain Beneficial Owners and Management and Related Stockholder Matters
The information required by this Item 12 is incorporated herein by reference to the applicable disclosure found in our definitive proxy statement to be filed with the SEC pursuant to Regulation 14A of the Exchange Act in connection with Tuesday Morning's 2014 Annual Meeting of Stockholders under the caption "Security Ownership of Certain Beneficial Owners and Management."
Equity Compensation Plan Information
The following table provides information about our common stock that may be issued upon the exercise of options under equity compensation plans approved by stockholders as of the fiscal year ended June 30, 2014. We do not have any equity compensation plans that were not approved by our stockholders.
Plan Category
|
Number of Securities to be Issued Upon Exercise of Outstanding Options, Warrants and Rights (thousands) |
Weighted-Average Exercise Price of Outstanding Options, Warrants and Rights |
Number of Securities Remaining Available for Future Issuance Under Equity Compensation Plans (excluding securities reflected in column) (thousands) |
|||||||
|---|---|---|---|---|---|---|---|---|---|---|
Equity Compensation Plans Approved by Security Holders |
1,732 | $ | 12.00 | 1,906 | ||||||
Equity Compensation Plans Not Approved by Security Holders |
— | — | — | |||||||
| | | | | | | | | | | |
Total |
1,732 | $ | 12.00 | 1,906 | ||||||
| | | | | | | | | | | |
| | | | | | | | | | | |
40
Item 13. Certain Relationships and Related Transactions, Director Independence
The information required by this Item 13 is incorporated herein by reference to the applicable disclosure found in our definitive proxy statement to be filed with the SEC pursuant to Regulation 14A of the Exchange Act in connection with Tuesday Morning's 2014 Annual Meeting of Stockholders under the captions "Certain Relationships and Related Transactions" and "Corporate Governance."
Item 14. Principal Accountant Fees and Services
The information required by this Item 14 is incorporated herein by reference to the applicable disclosure found in our definitive proxy statement to be filed with the SEC pursuant to Regulation 14A of the Exchange Act in connection with Tuesday Morning's 2014 Annual Meeting of Stockholders under the caption "Independent Registered Public Accounting Firm."
41
Item 15. Exhibits, Financial Statement Schedules
- (a)
- The following documents are filed as part of this Form 10-K.
- (1)
- Financial Statements:
- (2)
- Financial Statement Schedules:
The list of financial statements required by this Item is set forth in Item 8.
- (3)
- Exhibits:
All financial statement schedules called for under Regulation S-X are not required under the related instructions and/or are not material and, therefore, have been omitted or are included in the consolidated financial statements or notes thereto included elsewhere in this Form 10-K.
See the list of exhibits in the "Exhibits Index" to this Form 10-K, which are incorporated herein by reference. The exhibits include agreements to which the Company is a party or has a beneficial interest. The agreements have been filed to provide investors with information regarding their respective terms. The agreements are not intended to provide any other actual information about the Company or its business or operations. In particular, the assertions embodied in any representations, warranties, and covenants contained in the agreements may be subject to qualifications with respect to knowledge and materiality different from those applicable to investors and may be qualified by information in confidential disclosure schedules not included with the exhibits. These disclosure schedules may contain information that modifies, qualifies and creates exceptions to the representations, warranties and covenants set forth in the agreements. Moreover, certain representations, warranties, and covenants in the agreements may have been used for the purpose of allocating risk between parties, rather than establishing matters as facts. In addition, information concerning the subject matter of the representations, warranties and covenants may have changed after the date of the respective agreement, which subsequent information may or may not be fully reflected in the Company's public disclosures. Accordingly, investors should not rely on the representations, warranties and covenants in the agreements as characterizations of the actual state of facts about the Company or its business or operations on the date hereof.
42
Pursuant to the requirements of Section 13 or 15(d) of the Securities Exchange Act of 1934, the registrant has duly caused this report to be signed on its behalf by the undersigned, thereunto duly authorized.
| TUESDAY MORNING CORPORATION | ||||
Date: August 21, 2014 |
||||
By: |
/s/ R. MICHAEL ROULEAU R. Michael Rouleau Chief Executive Officer |
|||
Pursuant to the requirements of the Securities Exchange Act of 1934, this report has been signed below by the following persons on behalf of the registrant and in the capacities and on the dates indicated.
Name
|
Title
|
Date
|
||
|---|---|---|---|---|
| /s/ R. MICHAEL ROULEAU R. Michael Rouleau |
Chief Executive Officer (Principal Executive Officer) and Director | August 21, 2014 | ||
/s/ JEFFREY N. BOYER Jeffrey N. Boyer |
Executive Vice President, Chief Administrative Officer and Chief Financial Officer (Principal Financial and Accounting Officer) |
August 21, 2014 |
||
/s/ STEVEN R. BECKER Steven R. Becker |
Chairman of the Board |
August 21, 2014 |
||
/s/ TERRY BURMAN Terry Burman |
Director |
August 21, 2014 |
||
/s/ FRANK M. HAMLIN Frank M. Hamlin |
Director |
August 21, 2014 |
||
/s/ WILLIAM MONTALTO William Montalto |
Director |
August 21, 2014 |
||
/s/ SHERRY M. SMITH Sherry M. Smith |
Director |
August 21, 2014 |
43
Name
|
Title
|
Date
|
||
|---|---|---|---|---|
| /s/ JIMMIE L. WADE Jimmie L. Wade |
Director | August 21, 2014 | ||
/s/ RICHARD S. WILLIS Richard S. Willis |
Director |
August 21, 2014 |
44
INDEX TO CONSOLIDATED FINANCIAL STATEMENTS
F-1
Report of Independent Registered Public Accounting Firm
The Board of Directors and Stockholders of Tuesday Morning Corporation
We have audited the accompanying consolidated balance sheets of Tuesday Morning Corporation as of June 30, 2014 and 2013, and the related consolidated statements of operations, comprehensive income/(loss), stockholders' equity, and cash flows for each of the three years in the period ended June 30, 2014. These financial statements are the responsibility of the Company's management. Our responsibility is to express an opinion on these financial statements based on our audits.
We conducted our audits in accordance with the standards of the Public Company Accounting Oversight Board (United States). Those standards require that we plan and perform the audit to obtain reasonable assurance about whether the financial statements are free of material misstatement. An audit includes examining, on a test basis, evidence supporting the amounts and disclosures in the financial statements. An audit also includes assessing the accounting principles used and significant estimates made by management, as well as evaluating the overall financial statement presentation. We believe that our audits provide a reasonable basis for our opinion.
In our opinion, the financial statements referred to above present fairly, in all material respects, the consolidated financial position of Tuesday Morning Corporation at June 30, 2014 and 2013, and the consolidated results of its operations and its cash flows for each of the three years in the period ended June 30, 2014, in conformity with U.S. generally accepted accounting principles.
We also have audited, in accordance with the standards of the Public Company Accounting Oversight Board (United States), Tuesday Morning Corporation's internal control over financial reporting as of June 30, 2014, based on criteria established in Internal Control—Integrated Framework issued by the Committee of Sponsoring Organizations of the Treadway Commission (1992 Framework) and our report dated August 21, 2014 expressed an unqualified opinion thereon.
/s/ ERNST & YOUNG LLP
Dallas,
Texas
August 21, 2014
F-2
Tuesday Morning Corporation
Consolidated Balance Sheets
(In thousands, except for per share data)
| |
June 30, | ||||||
|---|---|---|---|---|---|---|---|
| |
2014 | 2013 | |||||
ASSETS |
|||||||
Current assets: |
|||||||
Cash and cash equivalents |
$ | 49,686 | $ | 28,896 | |||
Inventories |
207,663 | 211,981 | |||||
Prepaid expenses |
5,822 | 6,609 | |||||
Deferred income taxes |
42 | 991 | |||||
Other current assets |
1,094 | 2,310 | |||||
| | | | | | | | |
Total Current Assets |
264,307 | 250,787 | |||||
Property and equipment, net |
65,939 | 66,009 | |||||
Deferred financing costs |
1,416 | 2,011 | |||||
Other assets |
724 | 1,203 | |||||
Deferred income tax—non-current |
— | 1,870 | |||||
| | | | | | | | |
Total Assets |
$ | 332,386 | $ | 321,880 | |||
| | | | | | | | |
| | | | | | | | |
LIABILITIES AND STOCKHOLDERS' EQUITY |
|||||||
Current liabilities: |
|||||||
Accounts payable |
$ | 86,284 | $ | 72,958 | |||
Accrued liabilities |
39,618 | 35,719 | |||||
Income taxes payable |
1 | 85 | |||||
| | | | | | | | |
Total Current Liabilities |
125,903 | 108,762 | |||||
Deferred rent |
2,721 | 2,885 | |||||
Other liabilities—non-current |
410 | 2,776 | |||||
Deferred income taxes |
42 | — | |||||
| | | | | | | | |
Total Liabilities |
129,076 | 114,423 | |||||
Commitments and contingencies |
|||||||
Stockholders' equity: |
|||||||
Preferred stock, par value $0.01 per share, authorized 10,000,000 shares; none issued or outstanding |
— | — | |||||
Common stock, par value $0.01 per share, authorized 100,000,000 shares; 45,417,397 shares issued and 43,663,091 shares outstanding at June 30, 2014 and 44,517,731 shares issued and 42,785,978 shares outstanding at June 30, 2013 |
454 | 445 | |||||
Additional paid-in capital |
220,352 | 214,012 | |||||
Retained deficit |
(10,978 | ) | (802 | ) | |||
Less: 1,754,306 common shares in treasury, at cost, at June 30, 2014 and 1,731,753 common shares in treasury, at cost, at June 30, 2013 |
(6,518 | ) | (6,198 | ) | |||
| | | | | | | | |
Total Stockholders' Equity |
203,310 | 207,457 | |||||
| | | | | | | | |
Total Liabilities and Stockholders' Equity |
$ | 332,386 | $ | 321,880 | |||
| | | | | | | | |
| | | | | | | | |
The accompanying notes are an integral part of these consolidated financial statements.
F-3
Tuesday Morning Corporation
Consolidated Statements of Operations
(In thousands, except per share data)
| |
Fiscal Years Ended June 30, | |||||||||
|---|---|---|---|---|---|---|---|---|---|---|
| |
2014 | 2013 | 2012 | |||||||
Net sales |
$ | 864,844 | $ | 838,314 | $ | 812,782 | ||||
Cost of sales |
562,692 | 578,876 | 503,918 | |||||||
| | | | | | | | | | | |
Gross profit |
302,152 | 259,438 | 308,864 | |||||||
Selling, general and administrative expenses |
310,205 | 315,933 | 301,427 | |||||||
| | | | | | | | | | | |
Operating income/(loss) |
(8,053 | ) | (56,495 | ) | 7,437 | |||||
Other income/(expense): |
||||||||||
Interest expense |
(1,500 | ) | (1,677 | ) | (2,254 | ) | ||||
Other income/(expense), net |
(582 | ) | (5,236 | ) | 224 | |||||
| | | | | | | | | | | |
Income/(loss) before income taxes |
(10,135 | ) | (63,408 | ) | 5,407 | |||||
Income tax provision/(benefit) |
41 | (7,032 | ) | 1,494 | ||||||
| | | | | | | | | | | |
Net income/(loss) |
$ | (10,176 | ) | $ | (56,376 | ) | $ | 3,913 | ||
| | | | | | | | | | | |
| | | | | | | | | | | |
Earnings Per Share |
||||||||||
Net income/(loss) per common share: |
||||||||||
Basic |
$ | (0.24 | ) | $ | (1.33 | ) | $ | 0.09 | ||
Diluted |
$ | (0.24 | ) | $ | (1.33 | ) | $ | 0.09 | ||
Weighted average number of common shares: |
||||||||||
Basic |
42,943 | 42,248 | 41,986 | |||||||
Diluted |
42,943 | 42,248 | 42,536 | |||||||
The accompanying notes are an integral part of these consolidated financial statements.
F-4
Tuesday Morning Corporation
Consolidated Statements of Comprehensive Income/(Loss)
(In thousands)
| |
Years Ended June 30, | |||||||||
|---|---|---|---|---|---|---|---|---|---|---|
| |
2014 | 2013 | 2012 | |||||||
Net income/(loss) |
$ | (10,176 | ) | $ | (56,376 | ) | $ | 3,913 | ||
Other Comprehensive Income/(Loss): |
||||||||||
Foreign currency translation adjustments |
— | 55 | 35 | |||||||
Less: Reclassification adjustment for losses included in net income |
— | (1 | ) | — | ||||||
| | | | | | | | | | | |
Other Comprehensive Income/(Loss), before tax |
— | 54 | 35 | |||||||
Less: Income tax provision/(benefit) related to items of other comprehensive income/(loss) |
— | 20 | 14 | |||||||
| | | | | | | | | | | |
Comprehensive Income/(Loss) |
$ | (10,176 | ) | $ | (56,302 | ) | $ | 3,962 | ||
| | | | | | | | | | | |
| | | | | | | | | | | |
The accompanying notes are an integral part of these consolidated financial statements.
F-5
Tuesday Morning Corporation
Consolidated Statements of Stockholders' Equity
(In thousands)
| |
|
|
|
|
Accumulated Other Comprehensive Income/ (Loss) |
|
|
|||||||||||||||
|---|---|---|---|---|---|---|---|---|---|---|---|---|---|---|---|---|---|---|---|---|---|---|
| |
Common Stock | |
|
|
|
|||||||||||||||||
| |
Additional Paid-In Capital |
Retained (Deficit) Earnings |
Treasury Stock |
Total Stockholders' Equity |
||||||||||||||||||
| |
Shares | Amount | ||||||||||||||||||||
Balance at June 30, 2011 |
43,185 | $ | 432 | $ | 208,130 | $ | 51,661 | $ | (89 | ) | $ | — | $ | 260,134 | ||||||||
Comprehensive income: |
||||||||||||||||||||||
Net income |
— | — | — | 3,913 | — | — | 3,913 | |||||||||||||||
Other comprehensive income |
— | — | — | — | 35 | — | 35 | |||||||||||||||
Shares issued or canceled in connection with employee stock incentive plan and related tax effect |
192 | 2 | — | — | — | — | 2 | |||||||||||||||
Shares issued in connection with exercises of employee stock options |
58 | — | 77 | — | — | — | 77 | |||||||||||||||
Excess tax benefit |
— | — | 288 | — | — | — | 288 | |||||||||||||||
Treasury Stock |
(1,715 | ) | — | — | — | — | (6,092 | ) | (6,092 | ) | ||||||||||||
Amortization of share-based compensation expense |
— | — | 1,834 | — | — | — | 1,834 | |||||||||||||||
| | | | | | | | | | | | | | | | | | | | | | | |
Balance at June 30, 2012 |
41,722 | $ | 434 | $ | 210,329 | $ | 55,574 | $ | (54 | ) | (6,092 | ) | $ | 260,191 | ||||||||
Comprehensive loss: |
||||||||||||||||||||||
Net loss |
— | — | — | (56,376 | ) | — | — | (56,376 | ) | |||||||||||||
Other comprehensive income |
— | — | — | — | 54 | — | 54 | |||||||||||||||
Shares issued or canceled in connection with employee stock incentive plan and related tax effect |
139 | — | — | — | — | — | — | |||||||||||||||
Shares issued in connection with exercises of employee stock options |
942 | 11 | 1,797 | — | — | — | 1,808 | |||||||||||||||
Excess tax benefit |
— | — | — | — | — | — | — | |||||||||||||||
Treasury stock |
(17 | ) | — | — | — | — | (106 | ) | (106 | ) | ||||||||||||
Amortization of share-based compensation expense |
— | — | 1,886 | — | — | — | 1,886 | |||||||||||||||
| | | | | | | | | | | | | | | | | | | | | | | |
Balance at June 30, 2013 |
42,786 | $ | 445 | $ | 214,012 | $ | (802 | ) | $ | — | $ | (6,198 | ) | $ | 207,457 | |||||||
Comprehensive loss: |
||||||||||||||||||||||
Net loss |
— | — | — | (10,176 | ) | — | — | (10,176 | ) | |||||||||||||
Other comprehensive income |
— | — | — | — | — | — | ||||||||||||||||
Shares issued or canceled in connection with employee stock incentive plan and related tax effect |
234 | 2 | — | — | — | — | 2 | |||||||||||||||
Shares issued in connection with exercises of employee stock options |
666 | 7 | 3,292 | — | — | — | 3,299 | |||||||||||||||
Excess tax benefit |
— | — | — | — | — | — | — | |||||||||||||||
Treasury stock |
(23 | ) | — | — | — | — | (320 | ) | (320 | ) | ||||||||||||
Amortization of share-based compensation expense |
— | — | 3,048 | — | — | — | 3,048 | |||||||||||||||
| | | | | | | | | | | | | | | | | | | | | | | |
Balance at June 30, 2014 |
43,663 | $ | 454 | $ | 220,352 | $ | (10,978 | ) | $ | — | $ | (6,518 | ) | $ | 203,310 | |||||||
| | | | | | | | | | | | | | | | | | | | | | | |
The accompanying notes are an integral part of these consolidated financial statements.
F-6
Tuesday Morning Corporation
Consolidated Statements of Cash Flows
(In thousands)
| |
Years Ended June 30, | |||||||||
|---|---|---|---|---|---|---|---|---|---|---|
| |
2014 | 2013 | 2012 | |||||||
Cash flows from operating activities: |
||||||||||
Net income/(loss) |
$ | (10,176 | ) | $ | (56,376 | ) | $ | 3,913 | ||
Adjustments to reconcile net income/(loss) to net cash provided by/(used in) operating activities: |
||||||||||
Depreciation |
12,188 | 13,452 | 14,516 | |||||||
Amortization of financing fees |
595 | 592 | 760 | |||||||
Share-based compensation expense |
2,975 | 1,988 | 1,987 | |||||||
Loss on disposal of assets |
1,271 | 6,161 | 460 | |||||||
Deferred income taxes |
2,861 | (7,139 | ) | (572 | ) | |||||
Other non-cash items |
— | 54 | 35 | |||||||
Change in operating assets and liabilities: |
||||||||||
Inventories |
4,391 | 53,548 | (1,422 | ) | ||||||
Prepaid and other current assets |
2,003 | 2,438 | 2,327 | |||||||
Other assets |
479 | 328 | 247 | |||||||
Accounts payable |
13,326 | (25,051 | ) | 35,753 | ||||||
Accrued liabilities |
3,899 | 4,930 | 1,536 | |||||||
Other liabilities—non-current |
(2,289 | ) | 2,289 | — | ||||||
Deferred rent |
(164 | ) | (377 | ) | 64 | |||||
Income taxes payable |
(161 | ) | (25 | ) | (123 | ) | ||||
| | | | | | | | | | | |
Net cash provided by/(used in) operating activities |
31,198 | (3,188 | ) | 59,481 | ||||||
| | | | | | | | | | | |
Cash flows from investing activities: |
||||||||||
Capital expenditures |
(13,434 | ) | (9,608 | ) | (13,765 | ) | ||||
Proceeds from sale of assets |
45 | 250 | — | |||||||
| | | | | | | | | | | |
Net cash used in investing activities |
(13,389 | ) | (9,358 | ) | (13,765 | ) | ||||
| | | | | | | | | | | |
Cash flows from financing activities: |
||||||||||
Borrowings under revolving credit facility |
25,100 | 94,655 | 92,338 | |||||||
Repayments under revolving credit facility |
(25,100 | ) | (94,655 | ) | (92,338 | ) | ||||
Change in cash overdraft |
— | — | (18,791 | ) | ||||||
Proceeds from the exercise of employee stock options |
3,301 | 1,808 | 77 | |||||||
Excess tax benefit related to exercise of stock options |
— | — | 288 | |||||||
Purchase of treasury stock |
(320 | ) | (106 | ) | (6,092 | ) | ||||
Payment of financing fees |
— | — | (858 | ) | ||||||
| | | | | | | | | | | |
Net cash provided by/(used in) financing activities |
2,981 | 1,702 | (25,376 | ) | ||||||
| | | | | | | | | | | |
Net increase/(decrease) in cash and cash equivalents |
20,790 | (10,844 | ) | 20,340 | ||||||
Cash and cash equivalents, beginning of period |
28,896 | 39,740 | 19,400 | |||||||
| | | | | | | | | | | |
Cash and cash equivalents, end of period |
$ | 49,686 | $ | 28,896 | $ | 39,740 | ||||
| | | | | | | | | | | |
| | | | | | | | | | | |
Supplemental cash flow information: |
||||||||||
Interest paid |
$ | 844 | $ | 1,016 | $ | 1,422 | ||||
Income taxes (refunds received) paid |
(4,819 | ) | 73 | (392 | ) | |||||
The accompanying notes are an integral part of these consolidated financial statements.
F-7
TUESDAY MORNING CORPORATION
NOTES TO CONSOLIDATED FINANCIAL STATEMENTS
(1) NATURE OF OPERATIONS AND SUMMARY OF SIGNIFICANT ACCOUNTING POLICIES
We are a leading retailer of off-price, upscale decorative home accessories, housewares, seasonal goods and famous-maker gifts that we generally sell below retail prices charged by department stores and specialty and on-line retailers in the United States. We operated 810 discount retail stores in 41 states as of June 30, 2014 (828 and 852 stores at June 30, 2013 and 2012, respectively). We have promotional sales events that create a sense of urgency and excitement for our customer base.
- (a)
- Basis of Presentation—The accompanying consolidated financial statements include the accounts of
Tuesday Morning Corporation, a Delaware corporation, and its wholly-owned subsidiaries. All intercompany balances and transactions have been eliminated in consolidation. We operate our business as a
single operating segment. Certain reclassifications were made to prior period amounts to conform to the current period presentation. None of the reclassifications affected our net income/(loss) in any
period.
- (b)
- Cash and Cash Equivalents—Cash and cash equivalents are comprised of credit card receivables and
all highly liquid instruments with original maturities of three months or less. Cash equivalents are carried at cost, which approximates fair value. At June 30, 2014 and 2013, credit card
receivables from third party consumer credit card providers were $3.8 million and $7.4 million, respectively.
- (c)
- Inventories—Inventories, consisting of finished goods, are stated at the lower of cost or market
using the retail inventory method for store inventory and the specific identification method for warehouse inventory. We have a perpetual inventory system that tracks on hand inventory and inventory
sold at a SKU level. Inventory is relieved and cost of goods sold is recorded based on the current cost of the item sold. Buying, distribution, freight and certain other costs are capitalized as part
of inventory and are charged to cost of sales as the related inventory is sold. We charged $70.5 million, $79.1 million, and $67.3 million, of such capitalized inventory costs to
cost of sales for the fiscal years ended June 30, 2014, 2013, and 2012, respectively.
Stores conduct annual physical inventories, staggered throughout the year. We make adjustments to our financial statements based on the results of the physical inventories. During periods where no physical inventories occur, we utilize an estimate for recording shrinkage reserves, based on historical trends of physical inventory results. These shrinkage reserves may require a favorable or unfavorable adjustment to actual results to the extent our subsequent actual physical inventories yield a different result. We review our inventory during and at the end of each quarter to ensure that all necessary pricing actions are taken to adequately value our inventory at the lower of cost or market by recording permanent markdowns to our on hand inventory. Management believes these markdowns result in the appropriate prices necessary to stimulate demand of the merchandise. Actual required permanent markdowns could differ materially from management's initial estimates based on future customer demand or economic conditions.
F-8
TUESDAY MORNING CORPORATION
NOTES TO CONSOLIDATED FINANCIAL STATEMENTS (Continued)
(1) NATURE OF OPERATIONS AND SUMMARY OF SIGNIFICANT ACCOUNTING POLICIES (Continued)
- (d)
- Property and Equipment—Property and equipment are stated at cost. Buildings, furniture, fixtures, leasehold improvements and equipment are depreciated on a straight-line basis over the estimated useful lives of the assets as follows:
Buildings |
30 years | |
Furniture and fixtures |
3 to 7 years | |
Leasehold improvements |
Shorter of lease life or life of improvement | |
Equipment |
5 to 10 years |
Upon sale or retirement of an asset, the related cost and accumulated depreciation are removed from our accounts and any gain or loss is recognized in the statement of operations. Expenditures for maintenance, minor renewals and repairs are expensed as incurred, while major replacements and improvements are capitalized. For the fiscal year ended June 30, 2014 we disposed of assets with a net book value of approximately $1.3 million, primarily related to the exit of certain merchandise categories as part of our business transformation strategy, which is presented in other income/(expense) on the Consolidated Statement of Operations.
- (e)
- Deferred Financing Costs—Deferred financing costs represent fees paid in connection with
obtaining bank and other long-term financing. These fees are amortized over the term of the related financing using the effective interest method.
- (f)
- Income Taxes—Income taxes are accounted for under the asset and liability method. Deferred tax
assets and liabilities are recognized for the future tax consequences attributable to differences between the financial statement carrying amounts of existing assets and liabilities and their
respective tax bases. Deferred tax assets and liabilities are measured using statutory tax rates expected to apply to taxable income in the years in which those temporary differences are expected to
be recovered or settled. The effect on deferred tax assets and liabilities of a change in tax rates is recognized in income in the period that includes the date of enactment. We file our annual
federal income tax return on a consolidated basis. Furthermore, we recognize uncertain tax positions when we have determined it is more likely than not that a tax position will be sustained upon
examination. However, new information may become available or applicable laws or regulations may change thereby resulting in a favorable or unfavorable adjustment to amounts recorded. Valuation
allowances are established against deferred tax assets when it is more likely than not that the realization of those deferred tax assets will not occur. Valuation allowances are released as positive
evidence of future taxable income sufficient to realize the underlying deferred tax assets becomes available.
- (g)
- Self Insurance Reserves—We use a combination of insurance and self-insurance plans to provide for the potential liabilities associated with workers' compensation, general liability, property insurance, director and officers' liability insurance, vehicle liability and employee health care benefits. Our stop loss limits per claim are $500,000 for workers' compensation, $250,000 for general liability, and $150,000 for medical. Liabilities associated with the risks that are retained by us are estimated, in part, by historical claims experience, severity factors and the use of loss development factors.
F-9
TUESDAY MORNING CORPORATION
NOTES TO CONSOLIDATED FINANCIAL STATEMENTS (Continued)
(1) NATURE OF OPERATIONS AND SUMMARY OF SIGNIFICANT ACCOUNTING POLICIES (Continued)
The insurance liabilities we record are primarily influenced by the frequency and severity of claims, and include a reserve for claims incurred but not yet reported. Our estimated reserves may be materially different from our future actual claim costs, and, when required adjustments to our estimate reserves are identified, the liability will be adjusted accordingly in that period. Our self-insurance reserves for workers' compensation, general liability and medical were $7.9 million, $3.1 million, and $1.0 million, respectively, at June 30, 2014; $6.0 million, $2.6 million, and $0.8 million, respectively, at June 30, 2013; and $5.9 million, $3.1 million, and $0.9 million, respectively, at June 30, 2012.
We recognize insurance expenses based on the date of an occurrence of a loss including the actual and estimated ultimate costs of our claims. Claims are paid from our reserves and our current period insurance expense is adjusted for the difference in prior period recorded reserves and actual payments. Current period insurance expenses also include the amortization of our premiums paid to our insurance carriers. Expenses for workers' compensation, general liability and medical insurance were $5.6 million, $3.8 million and $8.4 million, respectively, for the fiscal year ended June 30, 2014; $4.0 million, $2.1 million and $8.5 million, respectively, for the fiscal year ended June 30, 2013; and $3.4 million, $2.8 million and $9.5 million, respectively, for the fiscal year ended June 30, 2012.
- (h)
- Revenue Recognition—Sales are recorded at the point of sale and conveyance of merchandise to
customers. Sales are net of returns and exclude sales tax.
- (i)
- Advertising—Costs for direct mail, television, radio, newspaper, and other media are expensed as
the advertised events take place. Advertising expenses for the fiscal years ended June 30, 2014, 2013, and 2012 were $26.2 million, $27.5 million, and $28.9 million,
respectively. We do not receive money from vendors to support our advertising expenditures. As of June 30, 2014, there was prepaid advertising of $113,000 compared to prepaid advertising of
$121,000 at June 30, 2013.
- (j)
- Use of Estimates—The preparation of the consolidated financial statements in conformity with
U.S. generally accepted accounting principles requires management to make estimates and assumptions that affect the reported amounts of assets and liabilities and disclosure of contingent assets and
liabilities at the date of the consolidated financial statements, and the reported amounts of net sales and expenses during the reporting period. Actual results could differ from those estimates.
- (k)
- Financial Instruments—The fair value of financial instruments is determined by reference to
various market data and other valuation techniques as appropriate. The only financial instruments we carry are our revolving credit facility and foreign currency exchange contracts for merchandise
purchases denominated in foreign currency.
We enter into foreign currency forward exchange contracts with a major financial institution that participates in our revolving credit facility to manage and reduce the impact of fluctuations in foreign currency exchange rates on certain contractual merchandise purchases with international vendors between the order and payment dates, which generally approximate 2 to 6 months. We do not utilize derivative financial instruments for trading or speculative purposes.
We account for our foreign currency forward contracts as cash flow hedges in accordance with generally accepted accounting principles of the United States. Changes in the fair value of the contracts that are considered to be effective are recorded in other comprehensive income/(loss)
F-10
TUESDAY MORNING CORPORATION
NOTES TO CONSOLIDATED FINANCIAL STATEMENTS (Continued)
(1) NATURE OF OPERATIONS AND SUMMARY OF SIGNIFICANT ACCOUNTING POLICIES (Continued)
until the hedged item is recorded in earnings. Effective cash flow hedges are reclassified out of other comprehensive income/(loss) and into cost of sales when the hedged inventory is sold. The ineffective portion of cash flow hedges are recorded in other income or loss and were not material for the periods presented. The effect of foreign exchange contracts on our financial position or results of operations historically and for the periods presented is and has been immaterial.
- (l)
- Share-Based Compensation—We recognized share-based compensation costs under the requirements of U.S. generally accepted accounting principles as follows (in thousands):
| |
Fiscal Years Ended June 30, | |||||||||
|---|---|---|---|---|---|---|---|---|---|---|
| |
2014 | 2013 | 2012 | |||||||
Amortization of share-based compensation during the period |
$ | 3,048 | $ | 1,886 | $ | 1,834 | ||||
Amounts capitalized in inventory |
(867 | ) | (497 | ) | (625 | ) | ||||
Amount recognized and charged to cost of sales |
794 | 599 | 778 | |||||||
| | | | | | | | | | | |
Amounts charged against income for the period before tax |
$ | 2,975 | $ | 1,988 | $ | 1,987 | ||||
| | | | | | | | | | | |
| | | | | | | | | | | |
Consistent with prior years, the fair value of each stock option granted during the fiscal year ended June 30, 2014 was estimated at the date of grant using a Black-Scholes option pricing model. The expected term of an option is based on our historical review of employee exercise behavior based on the employee class (executive or non-executive) and based on our consideration of the remaining contractual term if limited exercise activity existed for a certain employee class.
The risk-free interest rate is the constant maturity risk free interest rate for U.S. Treasury instruments with terms consistent with the expected lives of the awards. The expected volatility is based on both the historical volatility of our stock based on our historical stock prices and implied volatility of our traded stock options.
These factors were as follows:
| |
Fiscal Years Ended June 30, | |||||
|---|---|---|---|---|---|---|
| |
2014 | 2013 | 2012 | |||
Weighted average risk-free interest rate |
0.5 - 1.6% | 0.3 - 0.7% | 0.4 - 1.6% | |||
Expected life of options (years) |
3.1 - 6.2 | 2.9 - 5.6 | 3.2 - 4.8 | |||
Expected stock volatility |
48.8 - 69.6% | 53.7 - 75.3% | 68.4 - 83.5% | |||
Expected dividend yield |
0.0% | 0.0% | 0.0% | |||
- (m)
- Net Income/(Loss) Per Common Share—Basic net income/(loss) per common share for the fiscal years ended June 30, 2014, 2013, and 2012, was calculated by dividing net income/(loss) by the weighted average number of common shares outstanding for each period. Diluted net income/(loss) per common share for the fiscal years ended June 30, 2014, 2013, and 2012, was calculated by dividing net income by the weighted average number of common shares including the impact of dilutive common stock equivalents. See Note 10.
F-11
TUESDAY MORNING CORPORATION
NOTES TO CONSOLIDATED FINANCIAL STATEMENTS (Continued)
(1) NATURE OF OPERATIONS AND SUMMARY OF SIGNIFICANT ACCOUNTING POLICIES (Continued)
- (n)
- Impairment of Long-Lived Assets and Long-Lived Assets to Be Disposed Of—Long-lived assets, principally property and equipment and leasehold improvements, are reviewed for impairment when circumstances indicate the carrying value of an asset may not be recoverable. For assets that are to be held and used, an impairment is recognized when the estimated undiscounted cash flows associated with the asset or group of assets is less than their carrying value. If impairment exists, an adjustment is made to write the asset down to its fair value, and a loss is recorded as the difference between the carrying value and fair value. Fair values are determined based on quoted market values, discounted cash flows or internal appraisals, as applicable. Assets to be disposed of are reported at the lower of the carrying amount or fair value less costs to sell. Impairment of long-lived assets has not had a material impact on our financial position, results of operations or liquidity for the periods presented.
(2) PROPERTY AND EQUIPMENT
Property and equipment, net of accumulated depreciation, consisted of the following at (in thousands):
| |
June 30, | ||||||
|---|---|---|---|---|---|---|---|
| |
2014 | 2013 | |||||
Land |
$ | 8,504 | $ | 8,504 | |||
Buildings |
46,096 | 44,565 | |||||
Furniture and fixtures |
74,579 | 76,404 | |||||
Equipment |
31,620 | 32,157 | |||||
Leasehold improvements |
19,802 | 16,627 | |||||
| | | | | | | | |
|
180,601 | 178,257 | |||||
Less accumulated depreciation |
(114,662 | ) | (112,248 | ) | |||
| | | | | | | | |
Net property and equipment |
$ | 65,939 | 66,009 | ||||
| | | | | | | | |
| | | | | | | | |
(3) DEBT
We have a credit agreement providing for an asset-based, five-year senior secured revolving credit facility in the amount of up to $180.0 million which matures on November 17, 2016 (the "Revolving Credit Facility"). Our indebtedness under the Revolving Credit Facility is secured by a lien on substantially all of our assets. The Revolving Credit Facility contains certain restrictive covenants, which affect, among others, our ability to incur liens or incur additional indebtedness, change the nature of our business, sell assets or merge or consolidate with any other entity, or make investments or acquisitions unless they meet certain requirements. Our financial covenant requires that we maintain availability of 10% of our calculated borrowing base, but never less than $15 million. Our Revolving Credit Facility may, in some instances, limit payment of cash dividends and repurchases of the Company's common stock. In order to make a restricted payment, including payment of a dividend or a repurchase of shares, we must maintain availability of 17.5% of our lenders' aggregate commitments under the Revolving Credit Facility for three months prior to, and on a pro forma basis for the six months immediately following, and after giving effect to, the restricted payment and we must satisfy a fixed charge coverage ratio requirement.
F-12
TUESDAY MORNING CORPORATION
NOTES TO CONSOLIDATED FINANCIAL STATEMENTS (Continued)
(3) DEBT (Continued)
At June 30, 2014, we had no amounts outstanding under the Revolving Credit Facility, $6.4 million of outstanding letters of credit and availability of $98.7 million under the Revolving Credit Facility. Letters of credit under the Revolving Credit Facility are primarily for self insurance purposes. We incur commitment fees of up to 0.375% on the unused portion of the Revolving Credit Facility. Any borrowing under the Revolving Credit Facility incurs interest at LIBOR or the prime rate, plus an applicable margin, at our election (except with respect to swing loans, which incur interest solely at the prime rate plus the applicable margin). These rates are increased or reduced as our average daily availability changes. Interest expense of $1.5 million for fiscal 2014 was due to commitment fees of $0.8 million and the amortization of financing fees of $0.7 million. Interest expense of $1.7 million for fiscal 2013 was due primarily to commitment fees of $0.8 million, the amortization of financing fees of $0.7 million and $0.2 million in interest expense on borrowings. Interest expense of $2.3 million for fiscal 2012 was due primarily to commitment fees of $1.1 million, the amortization of financing fees of $0.9 million and $0.3 million in interest expense on borrowings. As of June 30, 2014, we were in compliance with all required covenants.
(4) ACCRUED LIABILITIES
Accrued liabilities consist of the following (in thousands):
| |
June 30, | ||||||
|---|---|---|---|---|---|---|---|
| |
2014 | 2013 | |||||
Sales tax |
$ | 2,740 | $ | 2,612 | |||
Self-insurance reserves |
11,860 | 9,437 | |||||
Wages & benefits |
6,922 | 7,510 | |||||
Property taxes |
1,506 | 1,383 | |||||
Freight expense |
6,380 | 2,958 | |||||
Other expenses |
10,210 | 11,819 | |||||
| | | | | | | | |
Total accrued liabilities |
$ | 39,618 | $ | 35,719 | |||
| | | | | | | | |
| | | | | | | | |
F-13
TUESDAY MORNING CORPORATION
NOTES TO CONSOLIDATED FINANCIAL STATEMENTS (Continued)
(5) INCOME TAXES
Income tax provision/(benefit) consists of (in thousands):
| |
Current | Deferred | Total | |||||||
|---|---|---|---|---|---|---|---|---|---|---|
Fiscal Year Ended June 30, 2014 |
||||||||||
Federal |
$ | (2,981 | ) | $ | 2,861 | $ | (120 | ) | ||
State and local |
161 | — | 161 | |||||||
| | | | | | | | | | | |
Total |
$ | (2,820 | ) | $ | 2,861 | $ | 41 | |||
| | | | | | | | | | | |
| | | | | | | | | | | |
Fiscal Year Ended June 30, 2013 |
||||||||||
Federal |
$ | (135 | ) | $ | (6,827 | ) | $ | (6,962 | ) | |
State and local |
242 | (312 | ) | (70 | ) | |||||
| | | | | | | | | | | |
Total |
$ | 107 | $ | (7,139 | ) | $ | (7,032 | ) | ||
| | | | | | | | | | | |
| | | | | | | | | | | |
Fiscal Year Ended June 30, 2012 |
||||||||||
Federal |
$ | 1,505 | $ | (391 | ) | $ | 1,114 | |||
State and local |
561 | (181 | ) | 380 | ||||||
| | | | | | | | | | | |
Total |
$ | 2,066 | $ | (572 | ) | $ | 1,494 | |||
| | | | | | | | | | | |
| | | | | | | | | | | |
During fiscal 2013, the Company established a valuation allowance related to deferred tax assets. In assessing whether a deferred tax asset would be realized, the Company considered whether it is more likely than not that some portion or all of the deferred tax assets would not be realized. The Company considered the reversal of existing taxable temporary differences, projected future taxable income, tax planning strategies and loss carry back potential in making this assessment. In evaluating the likelihood that sufficient future earnings would be available in the near future to realize the deferred tax assets, the Company considered its cumulative losses over three years including the current year. Based on the foregoing, the Company concluded that a valuation allowance was necessary. In fiscal 2014, the deferred tax asset valuation allowance was increased $3.9 million. The Company was able to carry back $11.1 million in allowable federal net operating losses in fiscal 2014 and received a $2.9 million refund in fiscal 2014 as a result of the carryback. Also in fiscal 2014, the Company received a $2.0 million refund from overpayment of its federal tax return for fiscal 2013.
The difference between income taxes at the statutory federal income tax rate of 34% in each of fiscal 2014 and 2013 and 35% in fiscal 2012, and income tax reported in continuing operations in the consolidated statements of operations is as follows (in thousands):
| |
Fiscal Year Ended June 30, |
|||||||||
|---|---|---|---|---|---|---|---|---|---|---|
| |
2014 | 2013 | 2012 | |||||||
Expected federal income tax provision/(benefit) |
$ | (3,446 | ) | $ | (21,559 | ) | $ | 1,892 | ||
State income taxes, net of related federal tax benefit |
157 | 12 | 214 | |||||||
Increase in federal valuation allowance |
3,946 | 16,222 | — | |||||||
Federal tax credits |
(575 | ) | (589 | ) | (787 | ) | ||||
Tax rate changes |
(154 | ) | (382 | ) | — | |||||
Other, net |
113 | (736 | ) | 175 | ||||||
| | | | | | | | | | | |
Provision/(benefit) for income taxes |
$ | 41 | $ | (7,032 | ) | $ | 1,494 | |||
| | | | | | | | | | | |
| | | | | | | | | | | |
F-14
TUESDAY MORNING CORPORATION
NOTES TO CONSOLIDATED FINANCIAL STATEMENTS (Continued)
(5) INCOME TAXES (Continued)
At the end of fiscal 2014, net deferred tax assets totaled $20.2 million, with an offsetting valuation allowance of $20.2 million. Deferred tax assets and liabilities for the fiscal years ended June 30, 2014, 2013, and 2012 were comprised of the following (in thousands):
| |
June 30, | |||||||||
|---|---|---|---|---|---|---|---|---|---|---|
| |
2014 | 2013 | 2012 | |||||||
Deferred tax assets: |
||||||||||
Current: |
||||||||||
Other payroll and benefits |
$ | 1,090 | $ | 947 | $ | 1,847 | ||||
Inventory reserves |
427 | 4,764 | 895 | |||||||
Self-insurance reserves |
4,428 | 3,495 | 3,738 | |||||||
Share-based compensation |
3,020 | 2,770 | 4,261 | |||||||
Net operating loss and tax credits |
7,500 | 2,861 | — | |||||||
Other current assets |
2,463 | 3,263 | 1,020 | |||||||
Noncurrent: |
||||||||||
Other noncurrent assets |
33 | 849 | — | |||||||
Net operating loss and tax credits |
12,502 | 13,358 | — | |||||||
Deferred rent |
1,050 | 1,084 | 1,262 | |||||||
| | | | | | | | | | | |
Total gross deferred tax assets |
$ | 32,513 | $ | 33,391 | $ | 13,023 | ||||
| | | | | | | | | | | |
| | | | | | | | | | | |
Deferred tax liabilities: |
||||||||||
Current: |
||||||||||
Inventory costs |
$ | 5,451 | $ | 6,215 | $ | 7,951 | ||||
Prepaid supplies |
2,064 | 2,470 | 3,275 | |||||||
Non-current: |
||||||||||
Property and equipment |
4,829 | 5,623 | 6,075 | |||||||
| | | | | | | | | | | |
Total gross deferred tax liabilities |
12,344 | 14,308 | 17,301 | |||||||
Valuation allowance |
(20,169 | ) | (16,222 | ) | — | |||||
| | | | | | | | | | | |
Net deferred tax asset/(liability) |
$ | — | $ | 2,861 | $ | (4,278 | ) | |||
| | | | | | | | | | | |
| | | | | | | | | | | |
The Company has federal net operating loss carryforwards of $46.2 million. These losses can only be carried forward and utilized to offset future income, but will expire in fiscal year 2034 if not utilized before then. Additionally, the Company has state net operating loss carryforwards of $58.4 million, which will expire throughout the years 2015 through 2034, if not utilized before then.
Accounting for Uncertainty in Income Taxes—The Company or one of its subsidiaries files income tax returns in the U.S. federal jurisdiction, and various state jurisdictions. With few exceptions, the Company is no longer subject to U.S. federal, state and local income tax examinations by tax authorities for years before 2009. The Internal Revenue Service has concluded an examination of the Company for years ending on or before June 30, 2010.
F-15
TUESDAY MORNING CORPORATION
NOTES TO CONSOLIDATED FINANCIAL STATEMENTS (Continued)
(5) INCOME TAXES (Continued)
A reconciliation of the beginning and ending amount of unrecognized tax benefits is as follows (in thousands):
Balance at June 30, 2011 |
$ | 480 | ||
Additions for tax positions of prior years |
— | |||
Reductions for lapse of statute of limitations |
(82 | ) | ||
| | | | | |
Balance at June 30, 2012 |
$ | 398 | ||
Additions for tax positions of prior years |
— | |||
Reductions for lapse of statute of limitations |
(88 | ) | ||
| | | | | |
Balance at June 30, 2013 |
$ | 310 | ||
Additions for tax positions of prior years |
— | |||
Reductions for lapse of statute of limitations |
(90 | ) | ||
| | | | | |
Balance at June 30, 2014 |
$ | 220 | ||
| | | | | |
| | | | | |
The balance of taxes, interest, and penalties at June 30, 2014, that, if recognized, would affect the effective tax rate is $410,000. The Company classifies and recognizes interest and penalties accrued related to unrecognized tax benefits in income tax expense. During the fiscal years ended June 30, 2014, 2013, and 2012, we recognized $36,000, $23,000, and $28,000 in interest, respectively. No interest or penalties were paid in the tax years ended June 30, 2014, 2013 and 2012.
We anticipate that the total amount of unrecognized tax benefits will decrease an amount immaterial to our results of operations within 12 months ending of June 30, 2015.
(6) SHARE-BASED INCENTIVE PLANS
We have established the Tuesday Morning Corporation 1997 Long-Term Equity Incentive Plan, as amended (the "1997 Plan"), the Tuesday Morning Corporation 2004 Long-Term Equity Incentive Plan, as amended (the "2004 Plan"), and the Tuesday Morning Corporation 2008 Long-Term Equity Incentive Plan, as amended (the "2008 Plan"), which were established to allow for the granting of certain awards to directors, officers and key employees of, and certain other key individuals who perform services for us and our subsidiaries. Equity awards may no longer be granted under the 1997 Plan and 2004 Plan, but there are equity awards granted under the 1997 Plan and the 2004 Plan that are still outstanding.
Performance Shares and Performance Units. As of June 30, 2014, there were 10,000 performance shares outstanding under the 2004 Plan and 135,000 performance shares outstanding under the 2008 Plan.
Stock Option Awards—The 1997 Plan, 2004 Plan, and 2008 Plan authorized grants of options to purchase up to 4.8 million, 2.0 million, and 5.4 million shares of authorized, but unissued, common stock, respectively. The 2008 Plan has 1.9 million shares remaining to be granted of authorized, but unissued, common stock. Stock options may be granted to directors, officers, and key employees of, and certain other key individuals who perform services for us and our subsidiaries.
Stock options are awarded with a strike price at a fair market value equal to the average of the high and low trading prices of our common stock on the date of grant under the 1997 Plan and the
F-16
TUESDAY MORNING CORPORATION
NOTES TO CONSOLIDATED FINANCIAL STATEMENTS (Continued)
(6) SHARE-BASED INCENTIVE PLANS (Continued)
2004 Plan. Stock options are awarded with a strike price at a fair market value equal to the closing price of our common stock on the date of the grant under the 2008 Plan.
Options granted under the 1997 Plan and the 2004 Plan typically vest over periods of one to five years and expire ten years from the date of grant while options granted under the 2008 Plan typically vest over periods of one to four years and expire ten years from the date of grant. Options granted under the 2004 Plan and the 2008 Plan may have certain performance requirements in addition to service terms. If the performance conditions are not satisfied, the options are forfeited. As of June 30, 2014, there were 0, 10,000 and 135,000 performance shares outstanding under the 1997 Plan, the 2004 Plan and the 2008 Plan, respectively. The exercise prices of stock options outstanding on June 30, 2014, range between $1.24 per share and $35.23 per share, which represents the fair market value of our common stock on the date the options were granted. At June 30, 2014, all shares available under the 1997 Plan and 2004 Plan had been granted. The 1997 Plan and the 2004 Plan terminated pursuant to their terms as of December 29, 2007 and May 17, 2014 respectively. There are 1.9 million shares available for grant under the 2008 Plan at June 30, 2014.
Following is a summary of transactions relating to the 1997 Plan, 2004 Plan and 2008 Plan options for the fiscal years ended June 30, 2014, 2013, and 2012 (share amounts and aggregate intrinsic value in thousands):
| |
Number of Shares |
Weighted-Average Exercise Price |
Weighted-Average Remaining Contractual Term (Years) |
Aggregate Intrinsic Value |
|||||||||
|---|---|---|---|---|---|---|---|---|---|---|---|---|---|
Options Outstanding at June 30, 2011 (vested or expected to vest) |
2,795 | $ | 10.68 | 5.09 | $ | 3,943 | |||||||
Granted during year |
373 | 3.57 | |||||||||||
Exercised during the year |
(59 | ) | 1.32 | ||||||||||
Forfeited or expired during year |
(214 | ) | 20.19 | ||||||||||
| | | | | | | | | | | | | | |
Options Outstanding at June 30, 2012 |
2,895 | 9.25 | 2.53 | $ | 3,484 | ||||||||
Granted during year |
1,665 | 6.66 | |||||||||||
Exercised during the year |
(942 | ) | 1.92 | ||||||||||
Forfeited or expired during year |
(2,000 | ) | 10.62 | ||||||||||
| | | | | | | | | | | | | | |
Options Outstanding at June 30, 2013 |
1,618 | 9.17 | 7.14 | $ | 6,177 | ||||||||
| | | | | | | | | | | | | | |
Granted during year |
1,221 | 13.37 | |||||||||||
Exercised during the year |
(666 | ) | 4.96 | ||||||||||
Forfeited or expired during year |
(442 | ) | 16.00 | ||||||||||
| | | | | | | | | | | | | | |
Options Outstanding at June 30, 2014 |
1,731 | 12.00 | 8.75 | $ | 10,689 | ||||||||
| | | | | | | | | | | | | | |
Exercisable at June 30, 2014 |
588 | $ | 10.47 | 7.63 | $ | 4,929 | |||||||
| | | | | | | | | | | | | | |
| | | | | | | | | | | | | | |
The weighted average grant date fair value of stock options granted during the fiscal years ended June 30, 2014, 2013, and 2012, was $5.48 per share, $2.90 per share, and $2.02 per share, respectively. The intrinsic value of vested unexercised options at June 30, 2014 is $4.9 million.
F-17
TUESDAY MORNING CORPORATION
NOTES TO CONSOLIDATED FINANCIAL STATEMENTS (Continued)
(6) SHARE-BASED INCENTIVE PLANS (Continued)
There were options to purchase 666,001, 942,710 and 58,703 shares of our common stock, which were exercised during the fiscal years ended June 30, 2014, 2013, and 2012, respectively. The aggregate intrinsic value of stock options exercised was $6.4 million, $2.4 million, and $152,000 during the fiscal years ended June 30, 2014, 2013, and 2012, respectively. At June 30, 2014, we had $4.3 million of total unrecognized share-based compensation expense related to stock options that is expected to be recognized over a weighted average period of 2.51 years.
The following table summarizes information about stock options outstanding at June 30, 2014:
| |
Options Outstanding | Options Exercisable | ||||||||||||||
|---|---|---|---|---|---|---|---|---|---|---|---|---|---|---|---|---|
Range of Exercise Prices
|
Number Outstanding |
Weighted Average Remaining Contractual Life (Years) |
Weighted Average Exercise Price Per Share |
Number Exercisable |
Weighted Average Exercise Price Per Share |
|||||||||||
$1.24 - $6.29 |
244,540 | 7.81 | $ | 4.98 | 178,200 | $ | 4.93 | |||||||||
$7.00 - $10.46 |
230,000 | 8.77 | 8.39 | 186,667 | 8.29 | |||||||||||
$12.39 - $12.39 |
276,500 | 9.19 | 12.39 | — | — | |||||||||||
$12.68 - $12.68 |
350,000 | 9.16 | 12.68 | 150,000 | 12.68 | |||||||||||
$12.82 - $14.19 |
276,795 | 9.20 | 14.02 | 15,000 | 13.84 | |||||||||||
$14.34 - $14.72 |
296,036 | 9.68 | 14.41 | — | — | |||||||||||
$15.31 - $35.23 |
57,912 | 1.14 | 27.93 | 57,912 | 27.93 | |||||||||||
| | | | | | | | | | | | | | | | | |
|
1,731,783 | 8.75 | $ | 12.00 | 587,779 | $ | 10.47 | |||||||||
| | | | | | | | | | | | | | | | | |
| | | | | | | | | | | | | | | | | |
Restricted Stock Awards—The 1997 Plan, the 2004 Plan, and the 2008 Plan authorize the grant of restricted stock awards to directors, officers, key employees and certain other key individuals who perform services for us and our subsidiaries. Equity awards may no longer be granted under the 1997 Plan and the 2004 Plan, but restricted stock awards granted under the 2004 Plan and the 2008 Plan are still outstanding. Restricted stock awards are not transferable, but bear certain rights of common stock ownership including voting and dividend rights. Shares are valued at the fair market value of our common stock at the date of award. The weighted average grant date fair value of restricted stock awards granted during the fiscal years ended June 30, 2014, 2013, and 2012, was $13.95 per share, $7.90 per share, and $3.57 per share, respectively. Shares may be subject to certain performance requirements. If the performance requirements are not met, the restricted shares are forfeited. At December 31, 2007, all shares under the 1997 Plan had been granted and the 1997 Plan terminated pursuant to its terms as of December 29, 2007. Under the 2004 Plan and the 2008 Plan, as of June 30, 2014, there were 356,223 shares of restricted stock outstanding with award vesting periods of one to four years and a weighted average fair value of $12.67 per share. Compensation expense related to restricted shares is recognized ratably over the requisite service period. Expense recorded for all restricted stock awards totaled $1.6 million, $908,000, and $668,000 for the fiscal years ended June 30, 2014, 2013, and 2012, respectively. At June 30, 2014, we had $3.0 million of total unrecognized share-based compensation expense related to restricted stock awards that is expected to be recognized over a weighted average period of 2.26 years.
F-18
TUESDAY MORNING CORPORATION
NOTES TO CONSOLIDATED FINANCIAL STATEMENTS (Continued)
(6) SHARE-BASED INCENTIVE PLANS (Continued)
The following table summarizes information about restricted stock awards outstanding for the fiscal years ended June 30, 2014, 2013, and 2012 (share amounts in thousands):
| |
Number of Shares |
Weighted- Average Fair Value at Date of Grant |
|||||
|---|---|---|---|---|---|---|---|
Outstanding at June 30, 2011 |
410 | $ | 2.31 | ||||
Granted during year |
162 | 3.57 | |||||
Vested during year |
(352 | ) | 1.96 | ||||
Forfeited during year |
(29 | ) | 3.83 | ||||
| | | | | | | | |
Outstanding at June 30, 2012 |
191 | $ | 3.79 | ||||
Granted during year |
325 | 7.90 | |||||
Vested during year |
(128 | ) | 3.81 | ||||
Forfeited during year |
(127 | ) | 5.75 | ||||
| | | | | | | | |
Outstanding at June 30, 2013 |
261 | $ | 7.95 | ||||
Granted during year |
301 | 13.94 | |||||
Vested during year |
(138 | ) | 8.32 | ||||
Forfeited during year |
(68 | ) | 9.12 | ||||
| | | | | | | | |
Outstanding at June 30, 2014 |
356 | $ | 12.66 | ||||
| | | | | | | | |
| | | | | | | | |
(7) OPERATING LEASES
We lease substantially all store locations under non-cancelable operating leases. Our leases generally are for a five-year period with two five-year renewal options and, in very limited circumstances, our leases involve a tenant allowance for leasehold improvements. We record rent expense ratably over the life of the lease beginning with the date we take possession of or have the right to use the premises, and if our leases provide for a tenant allowance, we record the landlord reimbursement as a liability and ratably amortize the liability as a reduction to rent expense over the lease term beginning with the date we take possession of or control the physical access to the premises. Leases for new stores also typically allow us the ability to terminate a lease after 24 to 60 months if the store does not achieve sales expectations. Future minimum rental payments under leases are as follows (in thousands):
Fiscal Years Ending June 30,
|
|
|||
|---|---|---|---|---|
2015 |
$ | 64,932 | ||
2016 |
53,038 | |||
2017 |
39,149 | |||
2018 |
25,841 | |||
2019 |
12,753 | |||
Thereafter |
13,249 | |||
| | | | | |
Total minimum rental payments |
$ | 208,962 | ||
| | | | | |
| | | | | |
F-19
TUESDAY MORNING CORPORATION
NOTES TO CONSOLIDATED FINANCIAL STATEMENTS (Continued)
(7) OPERATING LEASES (Continued)
Rent expense for the fiscal years ended June 30, 2014, 2013, and 2012 was $83.1 million, $82.7 million, and $82.5 million, respectively. Rent expense includes rent for store locations and our distribution center. Rent based on sales is not material to our financial statements.
(8) 401(K) PROFIT SHARING PLAN
We have a 401(k) profit sharing plan for the benefit of our full-time, eligible employees after six months of service. Under the plan, eligible employees may request us to deduct and contribute from 1% to 20% of their salary to the plan, subject to Internal Revenue Service Regulations. We match each participant's contribution up to 4% of participant's compensation. We expensed contributions of $1.0 million, $1.1 million, and $1.1 million for the fiscal years ended June 30, 2014, 2013, and 2012, respectively.
(9) LEGAL PROCEEDINGS
The Company is defending against a class action lawsuit filed in California Superior Court, Los Angeles County, on December 5, 2008—Julia Randell, et. al., v. Tuesday Morning, Inc., No. BC403298 (Cal. Super. Ct.)—in which the original complaint alleged violations of California's meal and rest period laws. The two named plaintiffs, who are former employees of the Company, subsequently amended the complaint three times. Narrowing their class allegations, the plaintiffs moved on March 14, 2012 to certify a class on the issue of whether the Company's alleged practice of providing "on-duty" meal periods to Senior Sales Associates violates the California Labor Code. The Court granted that motion on June 20, 2012, certifying a class comprised of current and former Senior Sales Associates who worked for the Company in California, and who were required to take meal breaks "on duty" at any point from April 1, 2005 to the present. The Company filed motions to decertify the class and for summary judgment on January 4, 2013, which the Court denied on March 29, 2013. On March 20, 2014, the parties executed a settlement agreement and release which, subject to Court approval, resolves the matter on a class basis. On April 16, 2014, the Court granted preliminary approval of the settlement and authorized the parties to provide notice of the settlement and its terms to class members. The hearing on the motion for final approval of the settlement is scheduled for October 9, 2014. The terms of the settlement are not expected to have a material adverse effect on the Company's financial condition or results of operations.
F-20
TUESDAY MORNING CORPORATION
NOTES TO CONSOLIDATED FINANCIAL STATEMENTS (Continued)
(10) EARNINGS PER COMMON SHARE
The following table sets forth the computation of basic and diluted (loss) earnings per common share (in thousands, except per share amounts):
| |
Fiscal Year Ended June 30, | |||||||||
|---|---|---|---|---|---|---|---|---|---|---|
| |
2014 | 2013 | 2012 | |||||||
Net income/(loss) |
$ | (10,176 | ) | $ | (56,376 | ) | $ | 3,913 | ||
Less: Income to participating securities |
— | — | 30 | |||||||
| | | | | | | | | | | |
Net income/(loss) attributable to common shares |
$ | (10,176 | ) | $ | (56,376 | ) | $ | 3,883 | ||
| | | | | | | | | | | |
| | | | | | | | | | | |
Weighted average common shares outstanding—basic |
42,943 | 42,248 | 41,986 | |||||||
Effect of dilutive stock equivalents |
— | — | 550 | |||||||
| | | | | | | | | | | |
Weighted average common shares outstanding—dilutive |
42,943 | 42,248 | 42,536 | |||||||
| | | | | | | | | | | |
| | | | | | | | | | | |
Net income/(loss) per common share—basic |
$ | (0.24 | ) | $ | (1.33 | ) | $ | 0.09 | ||
Net income/(loss) per common share—diluted |
$ | (0.24 | ) | $ | (1.33 | ) | $ | 0.09 | ||
Options representing rights to purchase shares of common stock of 0.9 million at June 30, 2014, 1.0 million at June 30, 2013 and 1.9 million at June 30, 2012 were not included in the diluted earnings per share calculation because the assumed exercise of such options would have been anti-dilutive.
(11) QUARTERLY RESULTS OF OPERATIONS (UNAUDITED)
A summary of the unaudited quarterly results is as follows for the years ended June 30, 2014 and 2013 (in thousands, except per share amounts):
| |
Quarters Ended | ||||||||||||
|---|---|---|---|---|---|---|---|---|---|---|---|---|---|
| |
Sept. 30, 2013 |
Dec. 31, 2013 |
March 31, 2014 |
June 30, 2014 |
|||||||||
Net sales |
$ | 183,678 | $ | 285,771 | $ | 182,765 | $ | 212,630 | |||||
Gross profit(1) |
63,427 | 99,338 | 68,101 | 71,287 | |||||||||
Operating income/(loss) |
(12,467 | ) | 18,285 | (7,629 | ) | (6,242 | ) | ||||||
Net income/(loss)(1) |
(12,009 | ) | 17,674 | (8,428 | ) | (7,414 | ) | ||||||
Basic income/(loss) per share(2) |
$ | (0.28 | ) | $ | 0.41 | $ | (0.20 | ) | $ | (0.17 | ) | ||
Diluted income/(loss) per share(2) |
$ | (0.28 | ) | $ | 0.41 | $ | (0.20 | ) | $ | (0.17 | ) | ||
F-21
TUESDAY MORNING CORPORATION
NOTES TO CONSOLIDATED FINANCIAL STATEMENTS (Continued)
(11) QUARTERLY RESULTS OF OPERATIONS (UNAUDITED) (Continued)
| |
Quarters Ended | ||||||||||||
|---|---|---|---|---|---|---|---|---|---|---|---|---|---|
| |
Sept. 30, 2012 |
Dec. 31, 2012 |
March 31, 2013 |
June 30, 2013 |
|||||||||
Net sales |
$ | 172,795 | $ | 285,312 | $ | 178,073 | $ | 202,134 | |||||
Gross profit |
64,906 | 61,601 | 66,157 | 66,774 | |||||||||
Operating loss(3) |
(10,884 | ) | (22,593 | ) | (11,734 | ) | (11,284 | ) | |||||
Net loss(4) |
(6,961 | ) | (21,466 | ) | (12,366 | ) | (15,583 | ) | |||||
Basic loss per share(2) |
$ | (0.17 | ) | $ | (0.51 | ) | $ | (0.29 | ) | $ | (0.37 | ) | |
Diluted loss per share(2) |
$ | (0.17 | ) | $ | (0.51 | ) | $ | (0.29 | ) | $ | (0.37 | ) | |
- (1)
- A
significant portion of our net sales and net earnings are realized during the period from October through December while the increase in merchandise
purchases in preparation for this holiday selling season occurs in prior months.
- (2)
- Net
income/(loss) per share amounts are computed independently for each of the quarters presented. Therefore, the sum of the quarterly net income/(loss) per
share in fiscal years 2014 and 2013 may not equal the total computed for the year.
- (3)
- Our
results for the quarter ended December 31, 2012 were impacted by a pretax loss of $41.8 million associated with the inventory write-down
charge.
- (4)
- Our results for the quarter ended June 30, 2013 were impacted by the disposal of assets including the e-commerce platform and the point of sale hardware.
F-22
| Exhibit No. | Description | ||
|---|---|---|---|
| 3.1.1 | Certificate of Incorporation of Tuesday Morning Corporation (the "Company") (incorporated by reference to Exhibit 3.1 to the Company's Registration Statement on Form S-4 (File No. 333-46017) filed with the Securities and Exchange Commission (the "Commission") on February 10, 1998) | ||
3.1.2 |
Certificate of Amendment to the Certificate of Incorporation of the Company dated March 25, 1999 (incorporated by reference to Exhibit 3.3 to the Company's Registration Statement on Form S-1/A (File No. 333-74365) filed with the Commission on March 29, 1999) |
||
3.1.3 |
Certificate of Amendment to the Certificate of Incorporation of the Company dated May 7, 1999 (incorporated by reference to Exhibit 3.1.3 to the Company's Form 10-Q (File No. 000-19658) filed with the Commission on May 2, 2005) |
||
3.2 |
Amended and Restated By-laws of the Company effective as of February 6, 2013 (incorporated by reference to Exhibit 3.1 to the Company's Form 8-K (File No. 000-19658) filed with the Commission on February 12, 2013) |
||
10.1.1 |
Credit Agreement, dated December 15, 2008, by and among the Company, Bank of America, N.A., as administrative agent, Swing Line Lender, L/C Issuer, Banc of America Securities LLC and Wells Fargo Retail Finance, LLC, as Joint Lead Arrangers and Joint Bookrunners, Wells Fargo Retail Finance, LLC, as Syndication Agent, and the several banks and other financial institutions or entities from time to time parties thereto (incorporated by reference to Exhibit 10.1 to the Company's Form 8-K/A (File No. 000-19658) filed with the Commission on December 23, 2008) |
||
10.1.2 |
Joinder and First Amendment to Credit Agreement, dated January 28, 2009, by and among the Company, Bank of America, N.A., Wells Fargo Retail Finance, LLC and Regions Bank (incorporated by reference to Exhibit 10.1 to the Company's Form 8-K (File No. 000-19658) filed with the Commission on January 30, 2009) |
||
10.1.3 |
Second Amendment to Credit Agreement, dated January 29, 2010, by and among the Company, Bank of America, N.A., Wells Fargo Retail Finance, LLC, and Regions Bank (incorporated by reference to Exhibit 10.1 to the Company's Form 8-K (File No. 000-19658) filed with the Commission on February 4, 2010) |
||
10.1.4 |
Third Amendment to Credit Agreement, dated November 17, 2011, by and among the Company, Bank of America, N.A., Wells Fargo Retail Finance, LLC, and Regions Bank (incorporated by reference to Exhibit 10.4 to the Company's Form 8-K (File No. 000-19658) filed with the Commission on November 23, 2011) |
||
10.2 |
Tuesday Morning Corporation Corporate Executive Annual Incentive Plan (incorporated by reference to Exhibit 10.1 to the Company's Form 8-K (File No. 000-19658) filed with the Commission on November 8, 2013)† |
||
10.3 |
Employment Agreement dated August 19, 2013 by and between the Company and R. Michael Rouleau (incorporated by reference to Exhibit 10.1 to the Company's Form 8-K (File No. 000-19658) filed with the Commission on August 20, 2013)† |
||
10.4.1 |
Tuesday Morning Corporation 1997 Long-Term Equity Incentive Plan (incorporated by reference to Exhibit 10.9 to the Company's Registration Statement on Form S-4 (File No. 333-46017) filed with the Commission on February 10, 1998)† |
||
45
| Exhibit No. | Description | ||
|---|---|---|---|
| 10.4.2 | Amendment No. 1 to the Tuesday Morning Corporation 1997 Long-Term Equity Incentive Plan (incorporated by reference to Exhibit 10.10 to the Company's Registration Statement on Form S-1/A (File No. 333-74365) filed with the Commission on March 29, 1999)† | ||
10.4.3 |
First Amendment to the Tuesday Morning Corporation 1997 Long-Term Equity Incentive Plan (incorporated by reference to Exhibit 10.3 to the Company's Form 10-Q (File No. 000-19658) filed with the Commission on August 1, 2005)† |
||
10.5.1 |
Tuesday Morning Corporation 2004 Long-Term Equity Incentive Plan (incorporated by reference to Appendix B to the Company's Definitive 14A Proxy Statement (File No. 000-19658) filed with the Commission on April 19, 2004)† |
||
10.5.2 |
First Amendment to the Tuesday Morning Corporation 2004 Long-Term Equity Incentive Plan (incorporated by reference to Exhibit 10.4 to the Company's Form 10-Q as filed with the Commission on August 1, 2005)† |
||
10.5.3 |
Second Amendment to the Tuesday Morning Corporation 2004 Long-Term Equity Incentive Plan (incorporated by reference to Exhibit 10.1 to the Company's Form 8-K (File No. 000-19658) filed with the Commission on November 8, 2007)† |
||
10.6 |
Form of Restricted Stock Award Agreement for directors under the Tuesday Morning Corporation 2004 Long-Term Equity Incentive Plan (incorporated by reference to Exhibit 10.1 to the Company's Form 8-K (File No. 000-19658) filed with the Commission on November 6, 2007)† |
||
10.7 |
Form of Restricted Stock Award Agreement for directors under the Tuesday Morning Corporation 1997 Long-Term Equity Incentive Plan (incorporated by reference to Exhibit 10.2 to the Company's Form 8-K (File No. 000-19658) filed with the Commission on December 19, 2007)† |
||
10.8 |
Form of Restricted Stock Award Agreement for employees under the Tuesday Morning Corporation 1997 Long-Term Equity Incentive Plan (incorporated by reference to Exhibit 10.3 to the Company's Form 8-K (File No. 000-19658) filed with the Commission on December 19, 2007)† |
||
10.9 |
Form of Restricted Stock Award Agreement for employees under the Tuesday Morning Corporation 2004 Long-Term Equity Incentive Plan (incorporated by reference to Exhibit 10.4 to the Company's Form 8-K (File No. 000-19658) filed with the Commission on December 19, 2007)† |
||
10.10.1 |
Employment Agreement dated October 2, 2008, between the Company and Michael J. Marchetti (incorporated by reference to Exhibit 10.2 to the Company's Form 8-K (File No. 000-19658) filed with the Commission on October 3, 2008)† |
||
10.10.2 |
First Amendment to the Employment Agreement, dated January 28, 2009, by and between Tuesday Morning Corporation and Michael Marchetti (incorporated by reference to Exhibit 10.10 to the Company's Form 10-Q (File No. 000-19658) filed with the Commission on January 30, 2009)† |
||
10.10.3 |
Second Amendment to Employment Agreement, dated February 16, 2012, by and between Tuesday Morning Corporation and Michael Marchetti (incorporated by reference to Exhibit 10.4 to the Company's Form 8-K (File No. 000-19658) filed with the Commission on February 17, 2012)† |
||
46
| Exhibit No. | Description | ||
|---|---|---|---|
| 10.11 | Form of Restricted Stock Award Agreement under the Tuesday Morning Corporation 2004 Long-Term Equity Incentive Plan (incorporated by reference to Exhibit 10.2 to the Company's Form 8-K (File No. 000-19658) filed with the Commission on October 10, 2008)† | ||
10.12 |
Form of Nonqualified Stock Option Agreement for Employees under the Tuesday Morning Corporation 2004 Long-Term Incentive Plan (incorporated by reference to Exhibit 10.3 to the Company's Form 8-K (File No. 000-19658) filed with the Commission on October 10, 2008)† |
||
10.13 |
Form of NonQualified Stock Option Agreement for Employees under the Tuesday Morning Corporation 2004 Long-Term Equity Incentive Plan (incorporated by reference to Exhibit 10.1 to the Company's Form 10-Q (File No. 000-19658) filed with the Commission on May 8, 2014)† |
||
10.14 |
Form of Restricted Stock Award Agreement for Employees under the Tuesday Morning Corporation 2004 Long-Term Equity Incentive Plan (incorporated by reference to Exhibit 10.3 to the Company's Form 10-Q (File No. 000-19658) filed with the Commission on May 8, 2014)† |
||
10.15 |
Form of Performance Based Restricted Stock Award Agreement for Employees under the Tuesday Morning Corporation 2004 Long-Term Equity Incentive Plan (incorporated by reference to Exhibit 10.6 to the Company's Form 10-Q (File No. 000-19658) filed with the Commission on May 8, 2014)† |
||
10.16.1 |
Tuesday Morning Corporation 2008 Long-Term Equity Incentive Plan (incorporated by reference to Exhibit 10.1 to the Company's Form 8-K (File No. 000-19658) filed with the Commission on November 19, 2008.)† |
||
10.16.2 |
First Amendment to Tuesday Morning Corporation 2008 Long-Term Equity Incentive Plan (incorporated by reference to Exhibit 10.1 to the Company's Form 8-K (File No. 000-19658) filed with the Commission on November 9, 2012)† |
||
10.16.3 |
Second Amendment to Tuesday Morning Corporation 2008 Long-Term Equity Incentive Plan (incorporated by reference to Exhibit 10.1 to the Company's Form 8-K (File No. 000-19658) filed with the Commission on October 23, 2012)† |
||
10.17 |
Form of Nonqualified Stock Option with Service Award Agreement under the Tuesday Morning Corporation 2004 Long-Term Equity Incentive Plan (incorporated by reference to Exhibit 10.1 to the Company's Form 8-K (File No. 000-19658) filed with the Commission on March 3, 2009)† |
||
10.18 |
Form of Incentive Stock Option Award Agreement for Employees under the Tuesday Morning Corporation 2008 Long-Term Equity Incentive Plan (incorporated by reference to Exhibit 10.2 to the Company's Form 8-K (File No. 000-19658) filed with the Commission on March 3, 2009)† |
||
10.19 |
Form of Nonqualified Stock Option Award Agreement for Employees under the Tuesday Morning Corporation 2008 Long-Term Equity Incentive Plan (incorporated by reference to Exhibit 10.3 to the Company's Form 8-K (File No. 000-19658) filed with the Commission on March 3, 2009)† |
||
10.20 |
Form of Restricted Stock Award Agreement under the Tuesday Morning Corporation 2008 Long-Term Equity Incentive Plan (incorporated by reference to Exhibit 10.4 to the Company's Form 8-K (File No. 000-19658) filed with the Commission on March 3, 2009)† |
||
47
| Exhibit No. | Description | ||
|---|---|---|---|
| 10.21 | Form of Nonqualified Stock Option Award Agreement for Directors under the Tuesday Morning Corporation 2008 Long-Term Equity Incentive Plan (incorporated by reference to Exhibit 10.17 to the Company's Form 10-K (File No. 000-19658) as filed with the Commission on August 28, 2013)† | ||
10.22 |
Form of NonQualified Stock Option Agreement for Employees under the Tuesday Morning Corporation 2008 Long-Term Equity Incentive Plan (incorporated by reference to Exhibit 10.2 to the Company's Form 10-Q (File No. 000-19658) filed with the Commission on May 8, 2014)† |
||
10.23 |
Form of Restricted Stock Award Agreement for Employees under the Tuesday Morning Corporation 2008 Long-Term Equity Incentive Plan (incorporated by reference to Exhibit 10.4 to the Company's Form 10-Q (File No. 000-19658) filed with the Commission on May 8, 2014)† |
||
10.24 |
Form of Performance Based NonQualified Stock Option Award Agreement for Employees under the Tuesday Morning Corporation 2008 Long-Term Equity Incentive Plan (incorporated by reference to Exhibit 10.5 to the Company's Form 10-Q (File No. 000-19658) filed with the Commission on May 8, 2014)† |
||
10.25 |
Form of Retention Bonus Agreement, dated as of June 5, 2012, by and between Tuesday Morning Corporation and the Executive Officers named therein (incorporated by reference to Exhibit 10.26 to the Company's Form 10-K (File No. 000-19658) filed with the Commission on August 30, 2012)† |
||
10.26 |
Churches Separation Agreement and Release dated as of March 3, 2013 between the Company and Brady Churches (incorporated by reference to Exhibit 10.1 to the Company's Form 8-K (File No. 000-19658) filed with the Commission on March 7, 2013)† |
||
10.27 |
Consulting Services Agreement dated as of March 3, 2013 by and between the Company and Brady Churches (incorporated by reference to Exhibit 10.2 of the Company's Form 8-K (File No. 000-19658) filed with the Commission on March 7, 2013)† |
||
10.28 |
Consulting Agreement dated as of August 6, 2013 by and between the Company and William Montalto (incorporated by reference to Exhibit 10.1 to the Company's Form 10-Q (File No. 000-19658) filed with the Commission on October 30, 2013)† |
||
10.29 |
Severance Agreement and Release dated as of August 29, 2013 by and between the Company and John Rossler (incorporated by reference to Exhibit 10.3 to the Company's Form 10-Q (File No. 000-19658) filed with the Commission on October 30, 2013)† |
||
10.30 |
Consulting Agreement and Release dated as of September 7, 2013 by and between the Company and Stephanie Bowman (incorporated by reference to Exhibit 10.1 to the Company's Form 8-K (File No. 000-19658) filed with the Commission on September 9, 2013)† |
||
10.31 |
Severance Agreement and Release dated as of July 14, 2014 by and between Tuesday Morning, Inc. and Ross Manning† |
||
21.1 |
Subsidiaries of the Company (incorporated by reference to Exhibit 21.1 to the Company's Form 10-K (File No. 000-19658) filed with the Commission on March 9, 2005) |
||
23.1 |
Consent of Independent Registered Public Accounting Firm |
||
31.1 |
Certification by the Chief Executive Officer of the Company Pursuant to Section 302 of the Sarbanes-Oxley Act of 2002 |
||
48
| Exhibit No. | Description | ||
|---|---|---|---|
| 31.2 | Certification by the Chief Financial Officer of the Company Pursuant to Section 302 of the Sarbanes-Oxley Act of 2002 | ||
32.1 |
Certification of the Chief Executive Officer of the Company Pursuant to 18 U.S.C. § 1350, adopted pursuant to Section 906 of the Sarbanes-Oxley Act of 2002 |
||
32.2 |
Certification of the Chief Financial Officer of the Company Pursuant to 18 U.S.C. § 1350, adopted pursuant to Section 906 of the Sarbanes-Oxley Act of 2002 |
||
101.INS |
XBRL Instance Document |
||
101.SCH |
XBRL Taxonomy Schema Document |
||
101.CAL |
XBRL Taxonomy Calculation Linkbase Document |
||
101.DEF |
XBRL Taxonomy Definition Linkbase Document |
||
101.LAB |
XBRL Taxonomy Label Linkbase Document |
||
101.PRE |
XBRL Taxonomy Presentation Linkbase Document |
||
- †
- Management contract or compensatory plan or arrangement
49