Attached files
| file | filename |
|---|---|
| EX-99.1 - EXHIBIT 99.1 - WEX Inc. | a51738219ex99_1.htm |
| 8-K - WEX INC. 8-K - WEX Inc. | a51738219.htm |
Exhibit 99.2
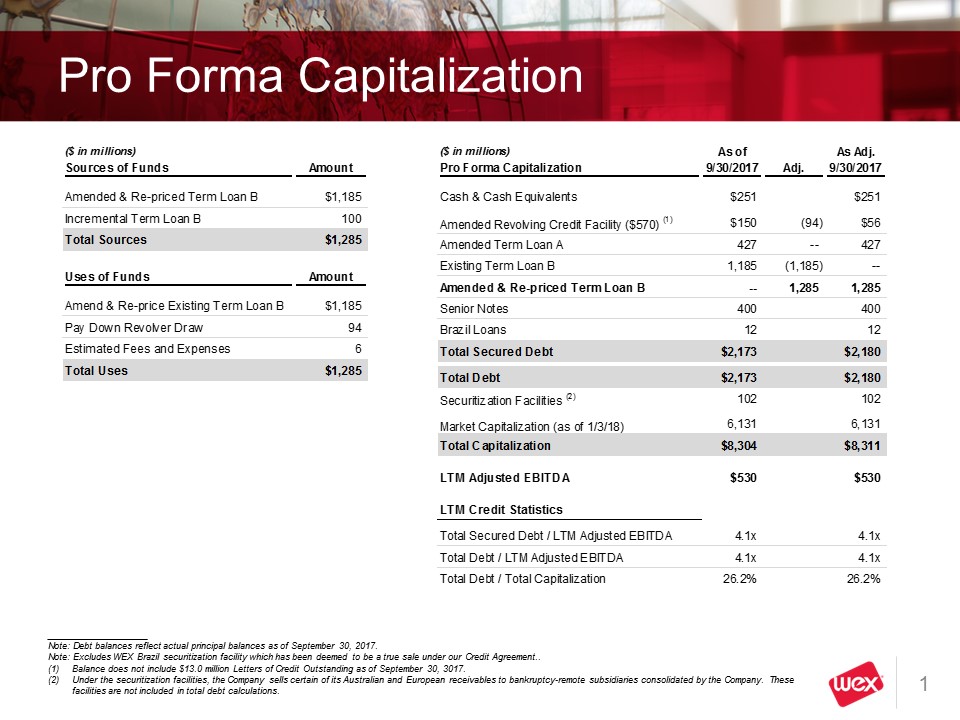
Pro Forma Capitalization 1 ($ in millions) As of As Adj. Pro Forma Capitalization 9/30/2017 Adj. 9/30/2017 Cash & Cash Equivalents $251 $251 Amended Revolving Credit Facility ($570) (1) $150 (94) $56 Amended Term Loan A 427 – 427 Existing Term Loan B 1,185 (1,185) -- Amended & Re-priced Term Loan B -- 1,285 1,285 Senior Notes 400 400 Brazil Loans 12 12 Total Secured Debt $2,173 $2,180 Total Debt $2,173 $2,180 Securitization Facilities (2) 102 102 Market Capitalization (as of 1/3/18) 6,131 6,131 Total Capitalization $8,304 $8,311 LTM Adjusted EBITDA $530 $530 LTM Credit Statistics Total Secured Debt / LTM Adjusted EBITDA 4.1x 4.1x Total Debt / LTM Adjusted EBITDA 4.1x 4.1x Total Debt / Total Capitalization 26.2% 26.2% Note: Debt balances reflect actual principal balances as of September 30, 2017. Note: Excludes WEX Brazil securitization facility which has been deemed to be a true sale under our Credit Agreement.. (1) Balance does not include $13.0 million Letters of Credit Outstanding as of September 30, 3017. (2) Under the securitization facilities, the Company sells certain of its Australian and European receivables to bankruptcy-remote subsidiaries consolidated by the Company. These facilities are not included in total debt calculations. ($ in millions) Sources of Funds Amount Amended & Re-priced Term Loan B $1,185 Incremental Term Loan B 100 Total Sources $1,285 Uses of Funds Amount Amend & Re-price Existing Term Loan B $1,185 Pay Down Revolver Draw 94 Estimated Fees and Expenses 6 Total Uses $1,285
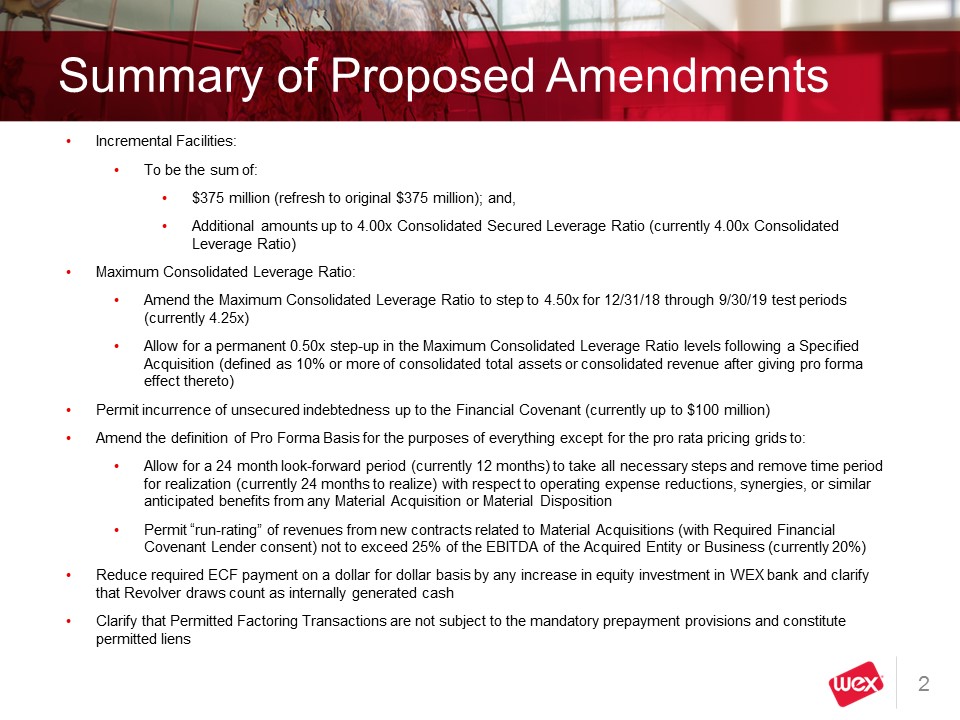
2 Summary of Proposed Amendments Incremental Facilities:To be the sum of:$375 million (refresh to original $375 million); and,Additional amounts up to 4.00x Consolidated Secured Leverage Ratio (currently 4.00x Consolidated Leverage Ratio)Maximum Consolidated Leverage Ratio:Amend the Maximum Consolidated Leverage Ratio to step to 4.50x for 12/31/18 through 9/30/19 test periods (currently 4.25x)Allow for a permanent 0.50x step-up in the Maximum Consolidated Leverage Ratio levels following a Specified Acquisition (defined as 10% or more of consolidated total assets or consolidated revenue after giving pro forma effect thereto)Permit incurrence of unsecured indebtedness up to the Financial Covenant (currently up to $100 million)Amend the definition of Pro Forma Basis for the purposes of everything except for the pro rata pricing grids to:Allow for a 24 month look-forward period (currently 12 months) to take all necessary steps and remove time period for realization (currently 24 months to realize) with respect to operating expense reductions, synergies, or similar anticipated benefits from any Material Acquisition or Material Disposition Permit “run-rating” of revenues from new contracts related to Material Acquisitions (with Required Financial Covenant Lender consent) not to exceed 25% of the EBITDA of the Acquired Entity or Business (currently 20%)Reduce required ECF payment on a dollar for dollar basis by any increase in equity investment in WEX bank and clarify that Revolver draws count as internally generated cashClarify that Permitted Factoring Transactions are not subject to the mandatory prepayment provisions and constitute permitted liens
3 EFS Integration & Synergies Update 3 WEX originally planned to reach synergies of $25 million over a 3 year periodWEX remains on track with its synergy plans and expects to meet or exceed the $25 million targetSynergies are tracking ahead of schedule
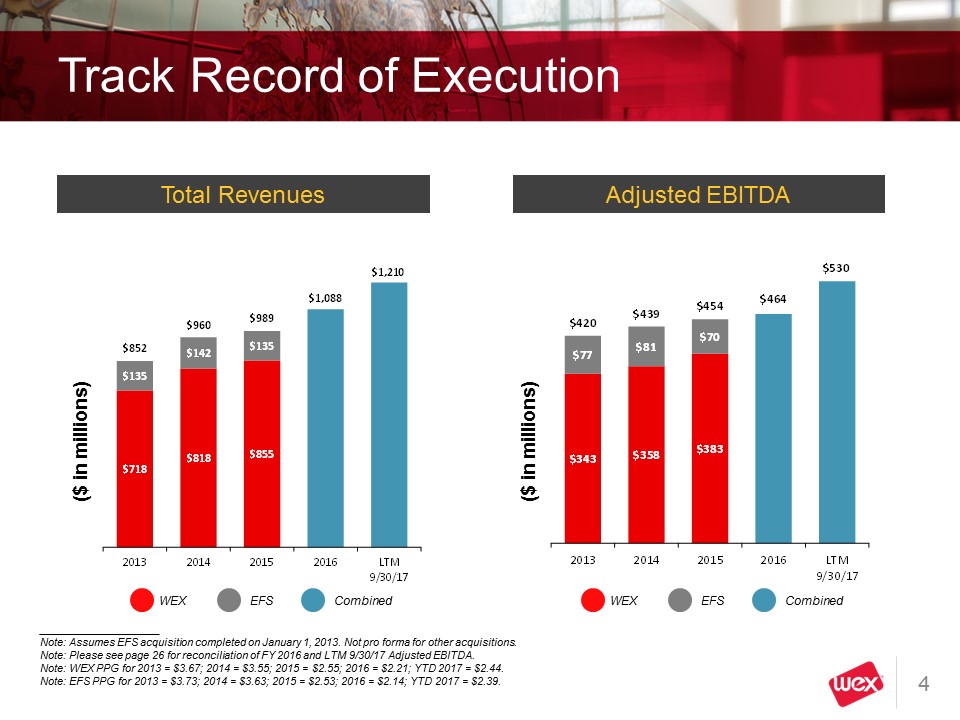
2013 2014 2015 2016 LTM 9/30/17 $343 $358 $383 $464 $530 $77 $81 $70 $420 $439 $454 2013 2014 2015 2016 LTM 9/30/17 Track Record of Execution 4 ($ in millions) Note: Assumes EFS acquisition completed on January 1, 2013. Not pro forma for other acquisitions. Note: Please see page 26 for reconciliation of FY 2016 and LTM 9/30/17 Adjusted EBITDA. Note: WEX PPG for 2013 = $3.67; 2014 = $3.55; 2015 = $2.55; 2016 = $2.21; YTD 2017 = $2.44. Note: EFS PPG for 2013 = $3.73; 2014 = $3.63; 2015 = $2.53; 2016 = $2.14; YTD 2017 = $2.39. ($ in millions) Total Revenues Adjusted EBITDA
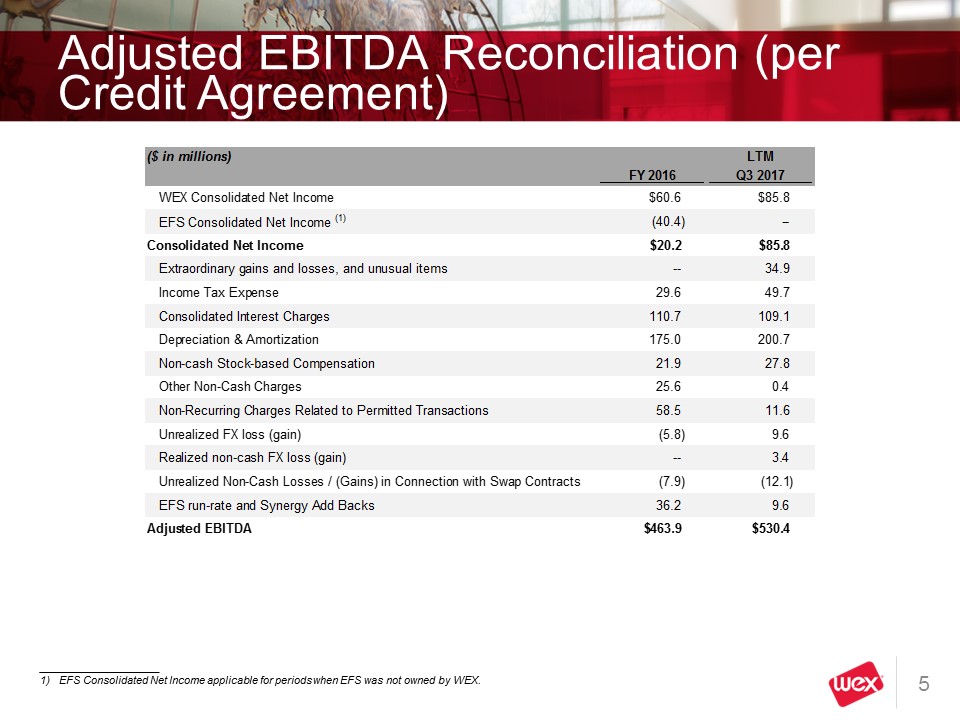
5 ($ in millions) LTM FY 2016 Q3 2017 WEX Consolidated Net Income $60.6 $85.8 EFS Consolidated Net Income (1) (40.4) -- Consolidated Net Income $20.2 $85.8 Extraordinary gains and losses, and unusual items -- 34.9 Income Tax Expense 29.6 49.7 Consolidated Interest Charges 110.7 109.1 Depreciation & Amortization 175.0 200.7 Non-cash Stock-based Compensation 21.9 27.8 Other Non-Cash Charges 25.6 0.4 Non-Recurring Charges Related to Permitted Transactions 58.5 11.6 Unrealized FX loss (gain) (5.8) 9.6 Realized non-cash FX loss (gain) -- 3.4 Unrealized Non-Cash Losses / (Gains) in Connection with Swap Contracts (7.9) (12.1) EFS run-rate and Synergy Add Backs 36.2 9.6 Adjusted EBITDA $463.9 $530.4 1) EFS Consolidated Net Income applicable for periods when EFS was not owned by WEX. Adjusted EBITDA Reconciliation (per Credit Agreement)
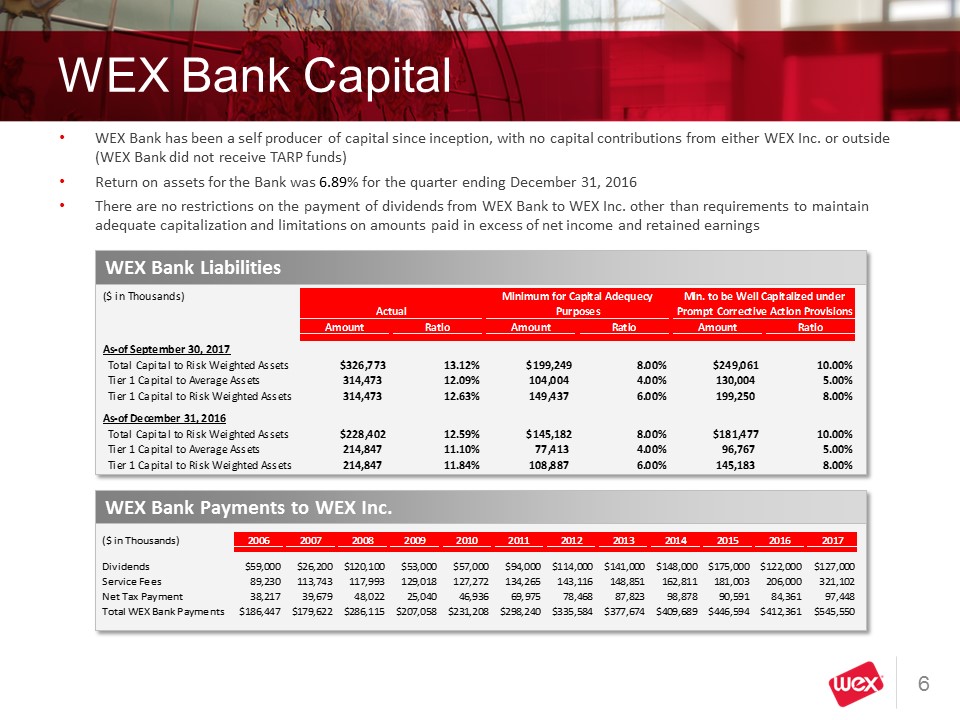
6 • WEX Bank has been a self producer of capital since inception, with no capital contributions from either WEX Inc. or outside (WEX Bank did not receive TARP funds) • Return on assets for the Bank was 6.89% for the quarter ending December 31, 2016 • There are no restrictions on the payment of dividends from WEX Bank to WEX Inc. other than requirements to maintain adequate capitalization and limitations on amounts paid in excess of net income and retained earnings WEX Bank Liabilities WEX Bank Payments to WEX Inc. WEX Bank Capital ($ in Thousands) Amount Ratio Amount Ratio Amount Ratio As‐of September 30, 2017 Total Capital to Risk Weighted Assets $326,773 13.12% $199,249 8.00% $249,061 10.00% Tier 1 Capital to Average Assets 314,473 12.09% 104,004 4.00% 130,004 5.00% Tier 1 Capital to Risk Weighted Assets 314,473 12.63% 149,437 6.00% 199,250 8.00% As‐of December 31, 2016 Total Capital to Risk Weighted Assets $228,402 12.59% $145,182 8.00% $181,477 10.00% Tier 1 Capital to Average Assets 214,847 11.10% 77,413 4.00% 96,767 5.00% Tier 1 Capital to Risk Weighted Assets 214,847 11.84% 108,887 6.00% 145,183 8.00% Actual Minimum for Capital Adequecy Min. to be Well Capitalized under Purposes Prompt Corrective Action Provisions ($ in Thousands) 2006 2007 2008 2009 2010 2011 2012 2013 2014 2015 2016 2017 Dividends $59,000 $26,200 $120,100 $53,000 $57,000 $94,000 $114,000 $141,000 $148,000 $175,000 $122,000 $127,000 Service Fees 89,230 113,743 117,993 129,018 127,272 134,265 143,116 148,851 162,811 181,003 206,000 321,102 Net Tax Payment 38,217 39,679 48,022 25,040 46,936 69,975 78,468 87,823 98,878 90,591 84,361 97,448 Total WEX Bank Payments $186,447 $179,622 $286,115 $207,058 $231,208 $298,240 $335,584 $377,674 $409,689 $446,594 $412,361 $545,550