Attached files
| file | filename |
|---|---|
| EX-99.1 - EX-99.1 - Chaparral Energy, Inc. | cpr-ex991_68.htm |
| EX-10.1 - EX-10.1 - Chaparral Energy, Inc. | cpr-ex101_56.htm |
| EX-2.2 - EX-2.2 - Chaparral Energy, Inc. | cpr-ex22_70.htm |
| EX-2.1 - EX-2.1 - Chaparral Energy, Inc. | cpr-ex21_71.htm |
| 8-K - 8-K - Chaparral Energy, Inc. | cpr-8k_20171221.htm |
STACK Play Bolt-on Acreage Acquisition Overview December 2017 Exhibit 99.2
Statements made in these presentation slides and by representatives of Chaparral Energy (“Chaparral” or the “company”) during the course of this presentation that are not historical facts are “forward-looking statements.” These statements are based on certain assumptions and expectations made by the company, which reflect management’s experience, estimates and perception of historical trends, current conditions and anticipated future developments. Such statements are subject to a number of assumptions, risks and uncertainties, many of which are beyond the control of the company, which may cause actual results to differ materially from those implied or anticipated in the forward-looking statements. These include risks relating to financial performance and results, ability to improve our financial results and profitability following emergence from bankruptcy, availability of sufficient cash flow to execute our business plan, continued low or further declining commodity prices and demand for oil, natural gas and natural gas liquids, ability to hedge future production, ability to replace reserves and efficiently develop current reserves and the regulatory environment and other important factors that could cause actual results to differ materially from those anticipated or implied in the forward-looking statements. Initial production (“IP”) rates are discreet data points in each well’s productive history. These rates are sometimes actual rates and sometimes extrapolated or normalized rates. As such, the rates for a particular well may decline over time and change as additional data becomes available. Peak production rates are not necessarily indicative or predictive of future production rates or economic rates of return from such wells and should not be relied upon for such purpose. The ability of the company or the relevant operator to maintain expected levels of production from a well is subject to numerous risks and uncertainties, including those referenced and discussed in this paragraph. In addition, methodology the company and other industry participants utilize to calculate peak IP rates may not be consistent and, as a result, the values reported may not be directly and meaningfully comparable. These and other important factors could cause actual results to differ materially from those anticipated or implied in the forward-looking statements. Please read “risk factors” in the company’s annual reports on form 10-K, quarterly reports on form 10-Q and other public filings. We undertake no obligation to publicly update any forward-looking statements, whether as a result of new information or future events. Forward-Looking Statements and Risk Factors
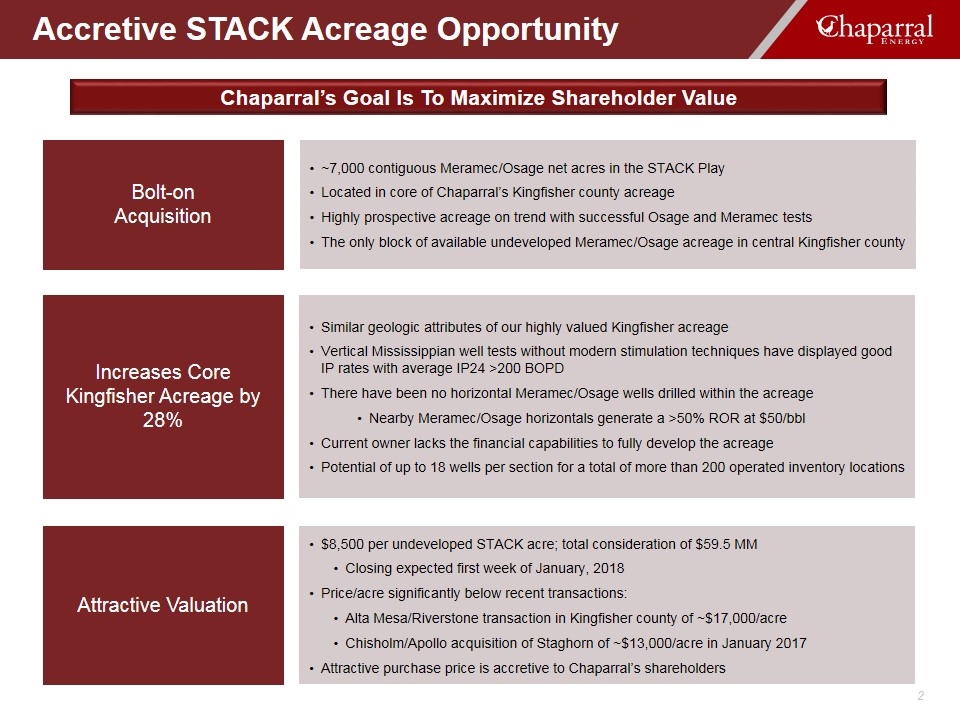
Accretive STACK Acreage Opportunity Bolt-on Acquisition ~7,000 contiguous Meramec/Osage net acres in the STACK Play Located in core of Chaparral’s Kingfisher county acreage Highly prospective acreage on trend with successful Osage and Meramec tests The only block of available undeveloped Meramec/Osage acreage in central Kingfisher county Increases Core Kingfisher Acreage by 28% Similar geologic attributes of our highly valued Kingfisher acreage Vertical Mississippian well tests without modern stimulation techniques have displayed good IP rates with average IP24 >200 BOPD There have been no horizontal Meramec/Osage wells drilled within the acreage Nearby Meramec/Osage horizontals generate a >50% ROR at $50/bbl Current owner lacks the financial capabilities to fully develop the acreage Potential of up to 18 wells per section for a total of more than 200 operated inventory locations Attractive Valuation $8,500 per undeveloped STACK acre; total consideration of $59.5 MM Closing expected first week of January, 2018 Price/acre significantly below recent transactions: Alta Mesa/Riverstone transaction in Kingfisher county of ~$17,000/acre Chisholm/Apollo acquisition of Staghorn of ~$13,000/acre in January 2017 Attractive purchase price is accretive to Chaparral’s shareholders Chaparral’s Goal Is To Maximize Shareholder Value
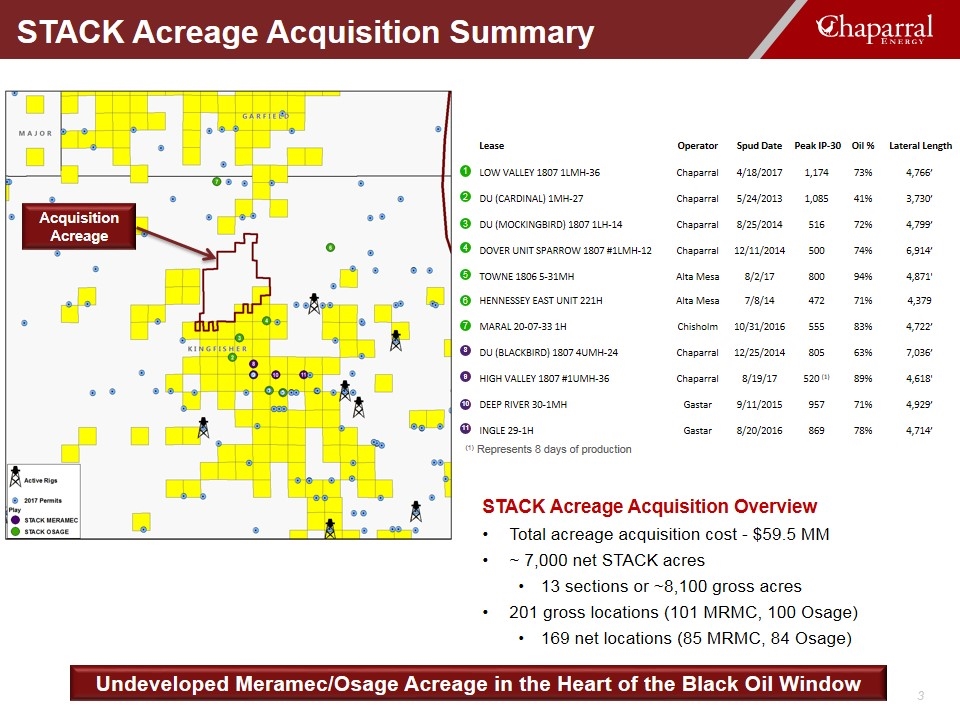
STACK Acreage Acquisition Summary STACK Acreage Acquisition Overview Total acreage acquisition cost - $59.5 MM ~ 7,000 net STACK acres 13 sections or ~8,100 gross acres 201 gross locations (101 MRMC, 100 Osage) 169 net locations (85 MRMC, 84 Osage) Lease Operator Spud Date Peak IP-30 Oil % Lateral Length LOW VALLEY 1807 1LMH-36 Chaparral 4/18/2017 1,174 73% 4,766’ DU (CARDINAL) 1MH-27 Chaparral 5/24/2013 1,085 41% 3,730’ DU (MOCKINGBIRD) 1807 1LH-14 Chaparral 8/25/2014 516 72% 4,799’ DOVER UNIT SPARROW 1807 #1LMH-12 Chaparral 12/11/2014 500 74% 6,914’ TOWNE 1806 5-31MH Alta Mesa 8/2/17 800 94% 4,871' HENNESSEY EAST UNIT 221H Alta Mesa 7/8/14 472 71% 4,379 MARAL 20-07-33 1H Chisholm 10/31/2016 555 83% 4,722’ DU (BLACKBIRD) 1807 4UMH-24 Chaparral 12/25/2014 805 63% 7,036’ HIGH VALLEY 1807 #1UMH-36 Chaparral 8/19/17 520 (1) 89% 4,618' DEEP RIVER 30-1MH Gastar 9/11/2015 957 71% 4,929’ INGLE 29-1H Gastar 8/20/2016 869 78% 4,714’ 1 2 3 4 5 6 7 9 8 10 11 (1) Represents 8 days of production Undeveloped Meramec/Osage Acreage in the Heart of the Black Oil Window Acquisition Acreage
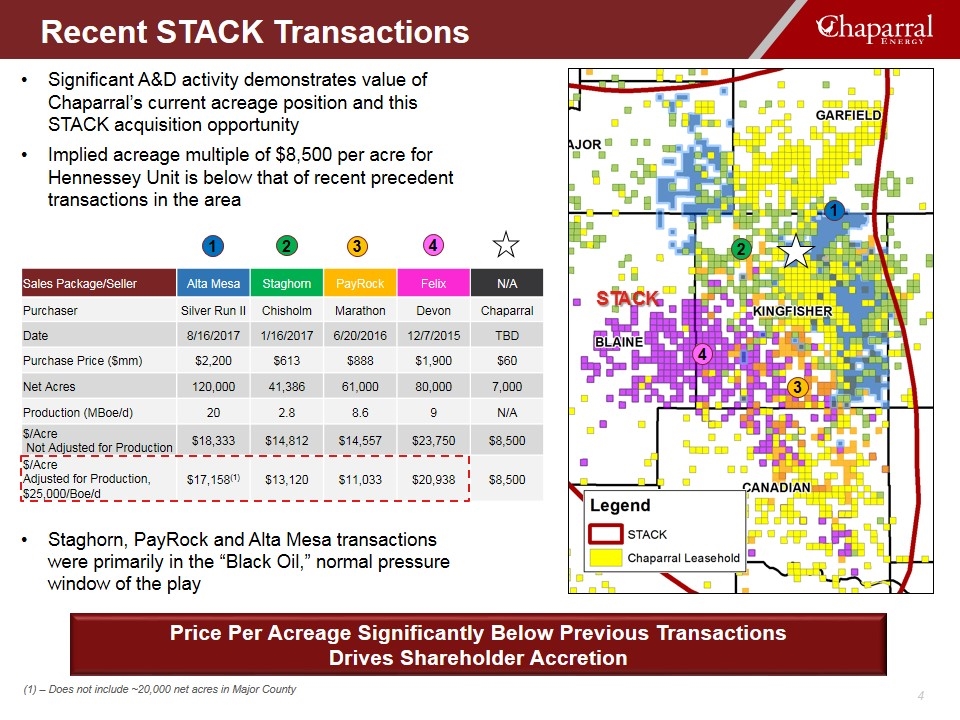
Significant A&D activity demonstrates value of Chaparral’s current acreage position and this STACK acquisition opportunity Implied acreage multiple of $8,500 per acre for Hennessey Unit is below that of recent precedent transactions in the area Staghorn, PayRock and Alta Mesa transactions were primarily in the “Black Oil,” normal pressure window of the play 2 3 4 4 3 2 Recent STACK Transactions 1 1 (1) – Does not include ~20,000 net acres in Major County Sales Package/Seller Alta Mesa Staghorn PayRock Felix N/A Purchaser Silver Run II Chisholm Marathon Devon Chaparral Date 8/16/2017 1/16/2017 6/20/2016 12/7/2015 TBD Purchase Price ($mm) $2,200 $613 $888 $1,900 $60 Net Acres 120,000 41,386 61,000 80,000 7,000 Production (MBoe/d) 20 2.8 8.6 9 N/A $/Acre Not Adjusted for Production $18,333 $14,812 $14,557 $23,750 $8,500 $/Acre Adjusted for Production, $25,000/Boe/d $17,158(1) $13,120 $11,033 $20,938 $8,500 STACK Price Per Acreage Significantly Below Previous Transactions Drives Shareholder Accretion
