Attached files
| file | filename |
|---|---|
| EX-10.F - EXHIBIT 10.F - RGC RESOURCES INC | ex10f-columbiagastransmiss.htm |
| EX-13 - EXHIBIT 13 - RGC RESOURCES INC | ex132017annualreportfina.htm |
| EX-10.II - EXHIBIT 10.II - RGC RESOURCES INC | ex10ii-amendedandrestatedr.htm |
| EX-32.1 - EXHIBIT 32.1 - RGC RESOURCES INC | rgco-ex321x9302017xq4.htm |
| EX-32.2 - EXHIBIT 32.2 - RGC RESOURCES INC | rgco-ex322x9302017xq4.htm |
| EX-23 - EXHIBIT 23 - RGC RESOURCES INC | rgco-ex23x9302017xq4.htm |
| EX-31.2 - EXHIBIT 31.2 - RGC RESOURCES INC | rgco-ex312x9302017xq4.htm |
| EX-21 - EXHIBIT 21 - RGC RESOURCES INC | rgco-ex21x9302017xq4.htm |
| EX-10.O - EXHIBIT 10.O - RGC RESOURCES INC | ex10o-saltvillegasstoragec.htm |
| EX-31.1 - EXHIBIT 31.1 - RGC RESOURCES INC | rgco-ex311x9302017xq4.htm |
UNITED STATES
SECURITIES AND EXCHANGE COMMISSION
Washington, D.C. 20549
FORM 10-K
ANNUAL REPORT PURSUANT TO SECTION 13 or 15(d)
OF THE SECURITIES EXCHANGE ACT OF 1934
For the fiscal year ended September 30, 2017
Commission file number 000-26591
RGC RESOURCES, INC.
(Exact name of registrant as specified in its charter)
Virginia | 54-1909697 | |
(State or other jurisdiction of incorporation or organization) | (I.R.S. Employer Identification No.) | |
519 Kimball Avenue, N.E., Roanoke, VA | 24016 | |
(Address of principal executive offices) | (Zip Code) | |
Registrant’s telephone number, including area code (540) 777-4427
Securities registered pursuant to Section 12(b) of the Act:
Title of Each Class | Name of Each Exchange on Which Registered | |
Common Stock, $5 Par Value | NASDAQ Global Market | |
Securities registered pursuant to Section 12(g) of the Act: None
Indicate by check mark if the registrant is a well-known seasoned issuer as defined in Rule 405 of the Securities Act. Yes ¨ No x
Indicate by check mark if the registrant is not required to file reports pursuant to Section 13 or Section 15(d) of the Act. Yes ¨ No x
Indicate by check mark whether the registrant (1) has filed all reports required to be filed by Section 13 or 15(d) of the Securities Exchange Act of 1934 during the preceding 12 months (or for such shorter period that the registrant was required to file such reports), and (2) has been subject to such filing requirements for the past 90 days. Yes x No ¨
Indicate by check mark whether the registrant has submitted electronically and posted on its corporate Web site, if any, every Interactive Data File required to be submitted and posted pursuant to Rule 405 of Regulation S-T (§ 232.405 of this chapter) during the preceding 12 months (or for such shorter period that the registrant was required to submit and post such files). Yes x No ¨
Indicate by check mark if disclosure of delinquent filers pursuant to Item 405 of Regulation S-K (Section 229.405 of this chapter) is not contained herein, and will not be contained, to the best of registrant’s knowledge, in definitive proxy or information statements incorporated by reference in Part III of this Form 10-K or any amendment to this Form 10-K. x
Indicate by check mark whether the registrant is a large accelerated filer, an accelerated filer, a non-accelerated filer, or a smaller reporting company. See definition of “large accelerated filer”, “accelerated filer” and “smaller reporting company” in Rule 12b-2 of the Exchange Act. (Check one).
Large accelerated filer | ¨ | Accelerated filer | x | |||
Non-accelerated filer | ¨ (Do not check if smaller reporting company) | Smaller reporting company | ¨ | |||
Indicate by check mark whether the registrant is a shell company (as defined in Rule 12b-2 of the Act). Yes ¨ No x
State the aggregate market value of the voting and non voting common equity held by non-affiliates computed by reference to the price at which the common equity was last sold, or the average bid and asked price of such common equity as of the last business day of the registrant’s most recently completed second fiscal quarter: March 31, 2017. $147,136,528
Indicate the number of shares outstanding of each of the issuer’s classes of common stock, as of the last practicable date.
Class | Outstanding at November 30, 2017 | |
COMMON STOCK, $5 PAR VALUE | 7,250,093 SHARES | |
DOCUMENTS INCORPORATED BY REFERENCE:
Portions of the RGC Resources, Inc. Proxy Statement for the 2018 Annual Meeting of Shareholders are incorporated by reference into Part III hereof.
TABLE OF CONTENTS | ||||
Page Number | ||||
Item 1. | ||||
Item 1A. | ||||
Item 1B. | ||||
Item 2. | ||||
Item 3. | ||||
Item 4. | ||||
Item 5. | ||||
Item 6. | ||||
Item 7. | ||||
Item 7A. | ||||
Item 8. | ||||
Item 9. | ||||
Item 9A. | ||||
Item 9B. | ||||
Item 10. | ||||
Item 11. | ||||
Item 12. | ||||
Item 13. | ||||
Item 14. | ||||
Item 15. | ||||
Item 16. | ||||
Cautionary Note Regarding Forward Looking Statements
This report contains forward-looking statements that relate to future transactions, events or expectations. In addition, RGC Resources, Inc. (“Resources” or the “Company”) may announce or publish forward-looking statements relating to such matters as anticipated financial performance, business prospects, technological developments, new products, research and development activities and similar matters. These statements are based on management’s current expectations and information available at the time of such statements and are believed to be reasonable and are made in good faith. The Private Securities Litigation Reform Act of 1995 provides a safe harbor for forward-looking statements. In order to comply with the terms of the safe harbor, the Company notes that a variety of factors could cause the Company’s actual results and experience to differ materially from the anticipated results or expectations expressed in the Company’s forward-looking statements. The risks and uncertainties that may affect the operations, performance, development and results of the Company’s business include, but are not limited to those set forth in the following discussion and within Item 1A “Risk Factors” of this Annual Report on Form 10-K. All of these factors are difficult to predict and many are beyond the Company’s control. Accordingly, while the Company believes its forward-looking statements to be reasonable, there can be no assurance that they will approximate actual experience or that the expectations derived from them will be realized. When used in the Company’s documents or news releases, the words “anticipate,” “believe,” “intend,” “plan,” “estimate,” “expect,” “objective,” “projection,” “forecast,” “budget,” “assume,” “indicate” or similar words or future or conditional verbs such as “will,” “would,” “should,” “can,” “could” or “may” are intended to identify forward-looking statements.
Forward-looking statements reflect the Company’s current expectations only as of the date they are made. The Company assumes no duty to update these statements should expectations change or actual results differ from current expectations except as required by applicable laws and regulations.
2
PART I
Item 1. | Business. |
General and Historical Development
RGC Resources, Inc. ("Resources" or the "Company") was incorporated in the state of Virginia on July 31, 1998, for the primary purpose of becoming the holding company for Roanoke Gas Company (“Roanoke Gas”) and its subsidiaries. Effective July 1, 1999, Roanoke Gas and its subsidiaries were reorganized into the holding company structure. Resources is currently composed of the following subsidiaries: Roanoke Gas, Diversified Energy Company and RGC Midstream, LLC.
Roanoke Gas was organized as a public service corporation under the laws of the Commonwealth of Virginia in 1912. The principal service of Roanoke Gas is the distribution and sale of natural gas to residential, commercial and industrial customers within its service territory in Roanoke, Virginia and the surrounding localities. Roanoke Gas also provides certain non-regulated services which account for less than 2% of consolidated revenues.
In July 2015, the Company formed RGC Midstream, LLC, a limited liability company established for the purpose of becoming a 1% investor in Mountain Valley Pipeline, LLC. Mountain Valley Pipeline, LLC was created for the purpose of constructing a natural gas pipeline in West Virginia and Virginia. Additional information regarding this investment is provided under Note 4 of the Company's annual consolidated financial statements and under the Equity Investment in Mountain Valley Pipeline section of Item 7.
In March 2016, Resources dissolved its subsidiary, RGC Ventures of Virginia, Inc. ("Ventures"). Ventures contained the operations of Application Resources, Inc., which provided information technology consulting services, and The Utility Consultants, which provided utility and regulatory consulting services to other utilities. Both of these operations were insignificant when compared to the overall activities of Resources and represented less than 0.2% of total revenues and less than 6% of other non-utility revenues.
Diversified Energy Company currently has no active operations.
Services
Roanoke Gas maintains an integrated natural gas distribution system to deliver natural gas purchased from suppliers to residential, commercial and industrial users in its service territory. The schedule below is a summary of customers, delivered volumes (expressed in decatherms), revenues and margin as a percentage of the total for each category:
2017 | ||||||||||||||
Customers | Volume | Revenue | Margin | |||||||||||
Residential | 91.2 | % | 37 | % | 57 | % | 61 | % | ||||||
Commercial | 8.7 | % | 31 | % | 33 | % | 25 | % | ||||||
Industrial | 0.1 | % | 32 | % | 7 | % | 10 | % | ||||||
Other Utility | 0.0 | % | 0 | % | 1 | % | 2 | % | ||||||
Other Non-Utility | 0.0 | % | 0 | % | 2 | % | 2 | % | ||||||
Total Percent | 100.0 | % | 100 | % | 100 | % | 100 | % | ||||||
Total Value | 59,847 | 8,562,582 | $ | 62,296,870 | $ | 32,809,157 | ||||||||
2016 | ||||||||||||||
Customers | Volume | Revenue | Margin | |||||||||||
Residential | 91.2 | % | 38 | % | 57 | % | 60 | % | ||||||
Commercial | 8.7 | % | 31 | % | 33 | % | 25 | % | ||||||
Industrial | 0.1 | % | 31 | % | 7 | % | 11 | % | ||||||
Other Utility | 0.0 | % | 0 | % | 1 | % | 2 | % | ||||||
Other Non-Utility | 0.0 | % | 0 | % | 2 | % | 2 | % | ||||||
Total Percent | 100.0 | % | 100 | % | 100 | % | 100 | % | ||||||
Total Value | 59,635 | 8,842,605 | $ | 59,063,291 | $ | 31,564,914 | ||||||||
3
2015 | ||||||||||||||
Customers | Volume | Revenue | Margin | |||||||||||
Residential | 91.2 | % | 40 | % | 58 | % | 58 | % | ||||||
Commercial | 8.7 | % | 30 | % | 33 | % | 26 | % | ||||||
Industrial | 0.1 | % | 30 | % | 6 | % | 11 | % | ||||||
Other Utility | 0.0 | % | 0 | % | 1 | % | 3 | % | ||||||
Other Non-Utility | 0.0 | % | 0 | % | 2 | % | 2 | % | ||||||
Total Percent | 100.0 | % | 100 | % | 100 | % | 100 | % | ||||||
Total Value | 59,080 | 9,875,007 | $ | 68,189,607 | $ | 30,206,433 | ||||||||
Roanoke Gas’ regulated natural gas distribution business accounted for approximately 98% of Resources total revenues for fiscal years ending September 30, 2017, 2016 and 2015. The tables above indicates that residential customers represent over 91% of the Company’s customer total; however, they represent less than 50% of the total gas volumes delivered and more than half of the Company’s consolidated revenues and margin. Industrial customers include primarily transportation customers that purchase their natural gas requirements directly from a supplier other than the Company and utilize Roanoke Gas’ natural gas distribution system for delivery to their operations. Most of the revenue billed for these customers relates only to transportation service, and not to the purchase of natural gas, causing total revenues generated by these deliveries to be approximately 7% of total revenues, even though they represent 32% of total natural gas deliveries for the year ended September 30, 2017 and approximately 10% to 11% of gross margin for each of the years presented.
The Company’s revenues are affected by changes in gas costs as well as by changes in consumption volume due to weather and economic conditions and changes in the non gas portion of customer billing rates. Increases or decreases in the cost of natural gas are passed on to customers through the purchased gas adjustment mechanism as explained in further detail in Note 1 of the Company’s annual consolidated financial statements. Significant increases in gas costs may cause customers to conserve or, in the case of industrial customers, to switch to alternative energy sources.
The Company’s residential and commercial sales are seasonal and temperature-sensitive as the majority of the gas sold by Roanoke Gas to these customers is used for heating. For the fiscal year ended September 30, 2017, approximately 65% of the Company’s total DTH of natural gas deliveries and 73% of the residential and commercial deliveries were made in the five-month period of November through March. These percentages are comparable to the prior year but lower than fiscal 2015 due to lower volumes attributable to a much warmer heating season in fiscal 2016 and 2017. Total natural gas deliveries were 8.6 million DTH, 8.8 million DTH and 9.9 million DTH in fiscal 2017, 2016 and 2015, respectively.
Suppliers
Roanoke Gas relies on multiple interstate pipelines including those operated by Columbia Gas Transmission Corporation, LLC and Columbia Gulf Transmission Corporation, LLC (together “Columbia”), and East Tennessee Natural Gas, LLC (“East Tennessee”), Tennessee Gas Pipeline, Midwestern Gas Transmission Company and Saltville Gas Storage Company, LLC to transport natural gas from the production and storage fields to Roanoke Gas’ distribution system. Roanoke Gas is directly served by two pipelines, Columbia and East Tennessee. Columbia historically has delivered approximately 60% of the Company’s gas supply, while East Tennessee delivers the balance of the Company’s requirements. The rates paid for natural gas transportation and storage services purchased from the interstate pipeline companies are established by tariffs approved by the Federal Energy Regulatory Commission ("FERC"). These tariffs contain flexible pricing provisions, which, in some instances, authorize these transporters to reduce rates and charges to meet price competition. The current pipeline contracts expire at various times from 2018 to 2027. The Company anticipates being able to renew these contracts or enter into other contracts to meet customers’ continued demand for natural gas.
The Company manages its pipeline contracts and liquefied natural gas storage (“LNG”) facility in order to provide for sufficient capacity to meet the natural gas demands of its customers. The maximum daily winter capacity for delivery into Roanoke Gas’ distribution system under the interstate pipelines is 78,606 DTH per day. The LNG facility, which is capable of storing up to 200,000 DTH of natural gas in a liquid state for use during peak demand, has the capability of providing an additional 27,000 DTH per day. Combined, the pipelines and LNG facility can provide more than 105,000 DTH on a single winter day.
4
The Company uses multi-year contracts to meet its natural gas supply needs. The Company currently contracts with Sequent Energy Management, L.P. to manage its pipeline transportation, storage rights, gas supply inventories and deliveries and serve as the primary supplier of natural gas for Roanoke Gas. Natural gas purchased under the asset management agreement is priced at indexed-based market prices as reported in major industry pricing publications. The Company is currently in the process of soliciting proposals for a new asset management agreement to replace the current agreement which expires March 31, 2018.
The Company uses summer storage programs to supplement gas supply requirements during the winter months. During the summer months, the Company injects gas into its LNG facility. In addition, the Company has contracted for storage capacity from Columbia, Tennessee Gas Pipeline and Saltville Gas Storage Company, LLC for a combined total of more than 2.4 million DTH of storage capacity. The balance of the Company’s annual natural gas requirements are met primarily through market purchases made by its asset manager.
Competition
The Company’s natural gas utility operates in a regulated, monopolistic environment. Roanoke Gas currently holds the only franchises and/or certificates of public convenience and necessity to distribute natural gas in its Virginia service areas. These franchises generally extend for multi-year periods and are renewable by the municipalities, including exclusive franchises in the cities of Roanoke and Salem and the Town of Vinton, Virginia. All three franchise agreements were recently renewed for a term of 20 years and will expire December 31, 2035.
Management anticipates that the Company will be able to renew all of its franchises when they expire. There can be no assurance, however, that a given jurisdiction will not refuse to renew a franchise or will not, in connection with the renewal of a franchise, attempt to impose restrictions or conditions that could adversely affect the Company’s business operations or financial condition. Certificates of public convenience and necessity, issued by the Virginia State Corporation Commission (the “SCC”), are of perpetual duration and subject to compliance with regulatory standards.
Although Roanoke Gas has exclusive rights for the distribution of natural gas in its service area, the Company competes with suppliers of other forms of energy such as fuel oil, electricity, propane, coal and solar. Competition can be intense among the other energy sources with the primary driver being price in most instances. This is particularly true for those industrial applications that have the ability to switch to alternative fuels. The relationship between supply and demand has the greatest impact on the price of natural gas. Greater demand for natural gas for electric generation and other uses can provide upward pressure on the price of natural gas. Currently, a plentiful supply of natural gas, mostly due to improved drilling and extraction processes in shale formations, has served to maintain prices at lower levels. The Company continues to see a demand for its product. New construction activity has remained steady over the last few years and the Company continues to grow its customer base through a combination of extending service to new construction and converting existing alternative energy source users to natural gas.
Regulation
In addition to the regulatory requirements generally applicable to all companies, Roanoke Gas is also subject to additional regulation at the federal, state and local levels. At the federal level, the Company is subject to pipeline safety regulations issued by the Department of Transportation and the Pipeline and Hazardous Materials Safety Administration.
At the state level, the SCC performs regulatory oversight including the approval of rates and other charges for natural gas sold to customers, the approval of agreements between or among affiliated companies involving the provision of goods and services, pipeline safety, and certain other corporate activities of the Company, including mergers and acquisitions related to utility operations.
At the local level, Roanoke Gas is further regulated by the municipalities and localities that grant franchises for the placement of gas distribution pipelines and the operation of gas distribution networks within their jurisdictions.
Employees
At September 30, 2017, Resources had 106 full-time employees and 109 total employees. As of that date, 30 employees, or 28% of the Company’s full-time employees, belonged to the United Steel, Paper and Forestry, Rubber, Manufacturing, Energy, Allied-Industrial International Union, Local No. 515 and were represented under a collective bargaining agreement. The union has been in place at the Company since 1952. The current collective bargaining agreement will expire on July 31, 2020. Management maintains an amicable relationship with the union.
5
Website Access to Reports
The Company’s website address is www.rgcresources.com. Information appearing on this website is not incorporated by reference in and is not a part of this annual report. The Company files reports with the Securities and Exchange Commission ("SEC"). A copy of this annual report, as well as other recent annual and quarterly reports are available on the Company's website. You may read and copy these filings with the SEC at the SEC public reference room at 100 F Street, NE, Washington, D.C. 20549. Information on the operation of the Public Reference Room can be obtained by calling the SEC at 1-800-SEC-0330. The SEC maintains an Internet site that contains reports, proxy and information statements, and other information regarding the Company’s filings at www.sec.gov, which is hyper-linked on the Company's website and is where you may obtain other Company filings with the SEC.
Item 1A. | Risk Factors |
Please carefully consider the risks described below regarding the Company. These risks are not the only ones faced by the Company. Additional risks not presently known to the Company or that the Company currently believes are immaterial may also impair business operations and financial results. If any of the following risks actually occur, the Company’s business, financial condition or results of operations could be adversely affected. In such case, the trading price of the Company’s common stock could decline and investors could lose all or part of their investment. The risk factors below are categorized by operational, regulatory and financial:
OPERATIONAL RISKS
Availability of adequate and reliable pipeline capacity.
The Company is currently served directly by two interstate pipelines. These two pipelines carry 100% of the natural gas transported to the Company’s distribution system. Depending on weather conditions and the level of customer demand, failure of one or both of these interstate transmission pipelines could have a major impact on the Company’s ability to meet customer demand for natural gas and adversely affect the Company’s earnings as a result of lost revenue and the cost of service restoration and, if sufficiently frequent or prolonged, could lead customers to turn to alternative energy sources.
Risks associated with the operation of a natural gas distribution pipeline and LNG storage facility.
Numerous potential risks are inherent in the operation of a natural gas distribution system and LNG storage facility, including unanticipated or unforeseen events that are beyond the control of the Company. Examples of such events include adverse weather conditions, acts of terrorism or sabotage, accidents and damage caused by third parties, equipment failure, failure of upstream pipelines and storage facilities, as well as catastrophic events such as explosions, fires, earthquakes, floods, or other similar events. These risks could result in injury or loss of life, property damage, pollution and customer service disruption resulting in potentially significant financial losses. The Company maintains insurance policies with financially sound carriers to protect against many of these risks. If losses result from an event that is not fully covered by insurance, the Company’s financial condition could be significantly impacted if it were unable to recover such losses from customers through the regulatory rate making process. Even if the Company did not incur a direct financial loss as a result of any of the events noted above, it could encounter significant reputational damage from a reliability, safety, integrity or similar viewpoint, potentially resulting in a longer-term negative earnings impact.
Investment in Mountain Valley Pipeline.
The success of the Company's investment in Mountain Valley Pipeline, LLC (the "LLC") is predicated on several key factors including but not limited to the ability of all investors to meet their capital calls when due, the timely state and federal approvals and completing the construction of the pipeline within the targeted time frame and budget. Any significant delay, cost over-run or the failure to receive the requisite approvals on a timely basis, or at all, could have a significant effect on the Company's earnings and financial position.
In addition, there are also numerous risks facing the LLC over time, which in turn could adversely affect the Company's earnings and financial performance through its 1% investment. The LLC's ability to complete construction of, and capital improvement to, facilities on schedule and within budget may be adversely affected by escalating costs for materials and labor and regulatory compliance, inability to obtain or renew necessary licenses,
6
rights-of-way, permits or other approvals on acceptable terms or on schedule, disputes involving contractors, labor organizations, land owners, governmental entities, environmental groups, Native American and aboriginal groups, and other third parties, negative publicity, transmission interconnection issues, and other factors. If any development project or construction or capital improvement project is not completed, is delayed or is subject to cost overruns, certain associated costs may not be approved for recovery or be recovered through regulatory mechanisms that may otherwise be available, and the LLC could become obligated to make delay or termination payments or become obligated for other contractual damages, could experience the loss of tax credits or tax incentives, or delayed or diminished returns, and could be required to write-off all or a portion of its investment in the project. Any of these events could have a material adverse effect on the LLC’s business, financial condition, results of operations and prospects. The LLC may face risks related to project siting, financing, construction, permitting, governmental approvals and the negotiation of project development agreements that may impede its development and operating activities. The LLC must periodically apply for licenses and permits from various local, state, federal and other regulatory authorities and abide by their respective conditions. Should the LLC be unsuccessful in obtaining necessary licenses or permits on acceptable terms, should there be a delay in obtaining or renewing necessary licenses or permits or should regulatory authorities initiate any associated investigations or enforcement actions or impose related penalties or disallowances on the LLC, the LLC’s business, financial condition, results of operations and prospects could be materially adversely affected. Any failure to negotiate successful project development agreements for new facilities with third parties could have similar results.
The LLC’s gas infrastructure facilities and other facilities are subject to many operational risks. Operational risks could result in, among other things, lost revenues due to prolonged outages, increased expenses due to monetary penalties or fines for compliance failures, liability to third parties for property and personal injury damage, a failure to perform under applicable sales agreements and associated loss of revenues from terminated agreements or liability for liquidated damages under continuing agreements. The consequences of these risks could have a material adverse effect on the LLC’s business, financial condition, results of operations and prospects. Uncertainties and risks inherent in operating and maintaining the LLC's facilities include, but are not limited to, risks associated with facility start-up operations, such as whether the facility will achieve projected operating performance on schedule and otherwise as planned. The LLC’s business, financial condition, results of operations and prospects can be materially adversely affected by weather conditions, including, but not limited to, the impact of severe weather. Threats of terrorism and catastrophic events that could result from terrorism, cyber-attacks, or individuals and/or groups attempting to disrupt the LLC’s business, or the businesses of third parties, may materially adversely affect the LLC’s business, financial condition, results of operations and prospects.
Supply disruptions due to weather or other forces.
Hurricanes, floods and other natural or man-made disasters could damage or inhibit production and/or pipeline transportation facilities, which could result in decreased supplies of natural gas. Decreased supplies could result in an inability to meet customer demand or lead to higher prices or service disruptions. Disasters could also lead to additional governmental regulations that may limit production activity or increase production and transportation costs.
Security incident or cyber-attacks on the Company’s computer or information systems.
A cyber-security incident on the Company’s information systems could result in corruption of the Company’s financial information or the unauthorized release of confidential customer, employee or vendor information or result in the interruption of our ability to provide natural gas to our customer or compromise the safety of our distribution, transmission and storage systems. The Company takes reasonable precautions to safeguard its computer systems from attack; however, there are no guarantees that Company processes will adequately protect against unauthorized access to data. In the event of a successful attack, the Company could be exposed to material financial and reputational risks, possible disruptions in natural gas deliveries or a compromise of the safety of the natural gas distribution system, as well as be exposed to claims by persons harmed by such an attack and the attack could also materially increase the costs we incur to protect against such risks.
General downturn in the economy or prolonged period of slow economic recovery.
A weak or poorly performing economy can negatively affect the Company’s profitability. An economic downturn can result in loss of commercial and industrial customers due to plant closings, a loss of residential customers as well as slow or declining growth in new customer additions, all of which would result in reduced sales volumes and lower revenues. An economic downturn could also result in rising unemployment and other factors that could lead to a loss of customers and an increase in customer delinquencies and bad debt expense.
7
Inability to attract and retain professional and technical employees.
The ability to implement the Company’s business strategy and serve customers is dependent upon employing talented professionals and attracting, training, developing and retaining a skilled workforce. As the Company will be facing retirements of key personnel over the next several years, the failure to replace those departing employees with skilled and qualified employees could increase operating costs and expose the Company to other operational and financial risks.
Geographic concentration of business activities.
The Company's business activities are concentrated in the Roanoke Valley. Changes in the local economy, politics, regulations and weather patterns could negatively impact the Company's existing customer base, leading to declining usage patterns and financial condition of customers, both of which could adversely affect earnings.
Volatility in the price and availability of natural gas.
Natural gas purchases represent the single largest expense of the Company. Even with increasing demand from other areas, including electric generation, natural gas prices are currently expected to remain stable in the near term, although there can be no guarantee to that effect. If demand for natural gas increases at a rate in excess of current expectations, natural gas prices could face upward pressure. Increasing natural gas prices could result in declining sales as well as increases in bad debt expense.
Impact of varying weather conditions.
The Company’s revenues and earnings are dependent upon weather conditions, specifically winter weather. The Company’s rate structure currently has a weather normalization adjustment factor that results in either a recovery or refund of revenues due to any variation from the 30-year average for heating degree-days. If the provision for the weather normalization adjustment were removed from its rate structure, the Company would be exposed to a much greater risk related to weather variability resulting in earnings volatility. A colder than normal winter could cause the Company to incur higher than normal operating and maintenance costs.
Competition from other energy providers.
The Company competes with other energy providers in its service territory, including those that provide electricity, propane, coal, fuel oil and solar. Price is a significant competitive factor. Higher natural gas costs or decreases in the price of other energy sources may enhance competition and encourage customers to convert their gas-fired equipment to systems that use alternative energy sources, thus lowering natural gas deliveries and earnings. Price considerations could also inhibit customer and revenue growth if builders and developers do not perceive natural gas to be a better value than other energy options and elect to install heating systems that use an energy source other than natural gas.
Inability to complete necessary or desirable pipeline expansion or infrastructure development projects.
In order to serve new customers or expand service to existing customers, the Company needs to maintain, expand or upgrade its distribution, transmission and/or storage infrastructure, including new pipeline installation. Various factors may prevent or delay the completion of such projects or make them more costly, such as the inability to obtain required approval from local, state and/or federal regulatory and governmental bodies, public opposition to the projects, inability to obtain adequate financing, competition for labor and materials, construction delays, cost overruns, and an inability to negotiate acceptable agreements relating to rights-of-way, construction or other material development components. As a result, the Company may not be able to adequately serve existing customers or expand its distribution system to support customer growth, including any potential customer growth as a result of the construction of the MVP, which would negatively impact earnings.
REGULATORY RISKS
Increased compliance and pipeline safety requirements and fines.
The Company is committed to the safe and reliable delivery of natural gas to its customers. Working in concert with this commitment are numerous federal and state laws and regulations. Failure to comply with these laws and
8
regulations could result in the levy of significant fines. There are inherent risks that may be beyond the Company’s control, including third party actions, which could result in damage to pipeline facilities, injury and even death. Such incidents could subject the Company to lawsuits, large fines, increased scrutiny and loss of customers, all of which could have a significant effect on the Company’s financial position and results of operations.
Environmental laws or regulations.
The combustion of natural gas results in carbon related emissions. Passage of new environmental legislation or implementation of regulations that mandate reductions in greenhouse gas emissions or other similar restrictions could have a negative effect on the Company’s core operations and its investment in the LLC. Such legislation could impose limitations on greenhouse gas emissions, require funding of new energy efficiency objectives, impose new operational requirements or lead to other additional costs to the Company. Regulations restricting or prohibiting the use of coal as a fuel for electric power generation has increased the demand for natural gas, and could at some point potentially result in natural gas supply concerns and higher costs for natural gas. Legislation or regulations could limit the exploration and development of natural gas reserves, making the price of natural gas less competitive and less attractive as a fuel source for consumers, resulting in reduced deliveries and earnings.
Regulatory actions or failure to obtain timely rate relief.
The Company’s natural gas distribution operations are regulated by the SCC. The SCC approves the rates that the Company charges its customers. If the SCC did not allow rates that provided for the timely recovery of costs or a reasonable rate of return on investment in natural gas distribution facilities, earnings could be negatively impacted. Issuance of debt and equity by our subsidiaries are also subject to SCC regulation and approval. Delays or lack of approvals could inhibit the ability to access capital markets and negatively impact liquidity or earnings.
FINANCIAL RISKS
Access to capital to maintain liquidity.
The Company relies on a variety of capital sources to operate its business and fund capital expenditures, including internally generated cash from operations, short-term borrowings under its line-of-credit, proceeds from the issuance of additional shares of its common stock and other sources. Access to a line-of-credit is essential to provide seasonal funding of natural gas operations and provide capital budget bridge financing. Access to capital markets and other long-term funding sources is important for capital outlays and funding of the LLC investment. The ability of the Company to maintain and renew its line-of-credit and to secure longer-term financing is critical to operations. Adverse market trends, market disruptions or deterioration in the financial condition of the Company could increase the cost of borrowing, restrict the Company's ability to issue additional shares of its common stock or otherwise limit the Company’s ability to secure adequate funding.
Insurance coverage may not be sufficient.
The Company currently has liability and property insurance to cover a variety of exposures and perils. Although management considers the level of coverage to be appropriate, the insurance policies are subject to certain limits and deductibles. Insurance coverage for risks against which the Company and its industry peers typically insure may not be offered in the future or such policies may expand exclusions that limit the amount of coverage or remove certain risks completely as insured events. Furthermore, litigation awards continue to increase significantly and the limits of insurance may not keep pace accordingly. The proceeds received from any such insurance may not be paid in a timely manner. The occurrence of any of the foregoing could have a material adverse effect on the Company’s financial position, results of operations and cash flows.
Post-retirement benefits and related funding of obligations.
The costs of providing defined benefit pension and retiree medical plans are dependent on a number of factors such as the rates of return on plan assets, discount rates used in determining plan liabilities, the level of interest rates used to measure the required minimum funding levels of the plan, future government regulation, changes in life expectancy, and required or voluntary contributions made to the plan. Changes in actuarial assumptions and differences between the assumptions and actual results, as well as a significant decline in the value of investments that fund these plans, if not offset or mitigated by a decline in plan liabilities, could increase the expense of these plans and require significant
9
additional funding. Both funding obligations and increased expense could have a material impact on the Company's financial position, results of operation and cash flows.
Failure to comply with debt covenant requirements.
The Company's long-term debt obligations and bank line of credit contain financial covenants. Noncompliance with any of these covenants could result in an event of default which, if not cured or waived, could accelerate payment on outstanding debt obligations or cause prepayment penalties. In such an event, the Company may not be able to refinance or repay all of its indebtedness, pay dividends or have sufficient liquidity to meet operating and capital expenditure requirements. Any such acceleration would cause a material adverse change in our financial condition.
Item 1B. | Unresolved Staff Comments. |
Not applicable.
Item 2. | Properties. |
Included in “Utility Plant” on the Company’s consolidated balance sheet are storage plant, transmission plant, distribution plant and general plant of Roanoke Gas as categorized by natural gas utilities. The Company has approximately 1,135 miles of transmission and distribution pipeline with transmission and distribution plant representing more than 87% of the total investment in plant. The transmission and distribution pipelines are located on or under public roads and highways or private property for which the Company has obtained the legal authorization and rights to operate.
Roanoke Gas owns and operates eight metering stations through which it measures and regulates the gas being delivered by its suppliers. These stations are located at various points throughout the Company’s distribution system.
Roanoke Gas also owns a liquefied natural gas storage facility located in Botetourt County that has the capacity to store up to 220,000 DTH of natural gas.
The Company’s executive, accounting and business offices, along with its maintenance and service departments, are located on Kimball Avenue in Roanoke, Virginia.
Although the Company considers its present properties to be adequate, management continues to evaluate the adequacy of its current facilities as additional needs arise.
Item 3. | Legal Proceedings. |
The Company is not known to be a party to any pending legal proceedings.
Item 4. | Mine Safety Disclosures. |
Not applicable.
10
PART II
Item 5. | Market for Registrant’s Common Equity, Related Stockholder Matters and Issuer Purchases of Equity Securities. |
Market Information
Resources' common stock is listed on the NASDAQ Global Market under the trading symbol RGCO. Payment of dividends is within the discretion of the Board of Directors and depends on, among other factors, earnings, capital requirements, and the operating and financial condition of the Company.
Range of Bid Prices | Cash Dividends | |||||||||||
Year Ending September 30, 2017 | High | Low | Declared | |||||||||
First Quarter | $ | 20.04 | $ | 15.81 | $ | 0.1450 | ||||||
Second Quarter | 22.51 | 16.60 | 0.1450 | |||||||||
Third Quarter | 31.99 | 21.00 | 0.1450 | |||||||||
Fourth Quarter | 29.95 | 23.65 | 0.1450 | |||||||||
Year Ending September 30, 2016 | ||||||||||||
First Quarter | $ | 15.96 | $ | 13.37 | $ | 0.1350 | ||||||
Second Quarter | 15.59 | 13.77 | 0.1350 | |||||||||
Third Quarter | 17.33 | 14.30 | 0.1350 | |||||||||
Fourth Quarter | 16.73 | 14.88 | 0.1350 | |||||||||
As of November 24, 2017, there were 1,159 holders of record of the Company’s common stock. This number does not include all beneficial owners of common stock who hold their shares in “street name.”
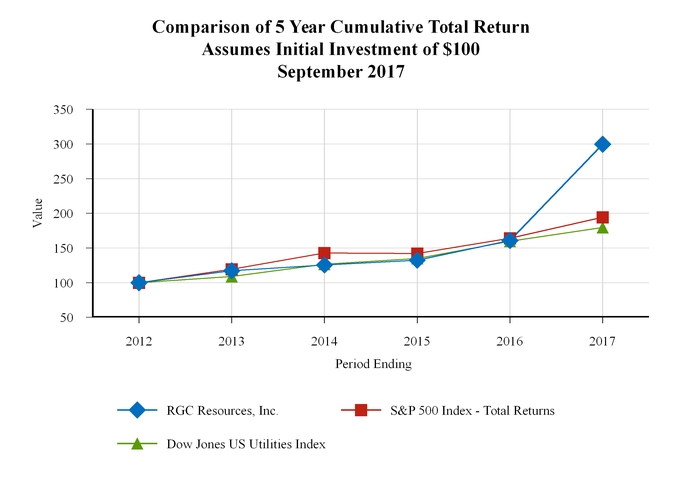
Comparisons of Cumulative Total Shareholder Returns
The following performance graph compares the Company’s total shareholder return from September 30, 2012 through September 30, 2017 with the Dow Jones US Utility Index, a utility based index, and the Standard & Poor’s 500 Stock Index (S&P 500 Index), a broad market index.
The graph below reflects the value of a hypothetical investment of $100 made September 30, 2012 in the Company’s common stock and in each index as of September 30, 2017, assuming the reinvestment of all dividends. Historical stock price performance as reflected on the graph is not indicative of future price performance. The total value at the end of the five years was $300 for the Company’s common stock, $180 for the Dow Jones US Utilities Index and $194 for the S&P 500 Index.
11
A summary of the Company’s equity compensation plans follows as of September 30, 2017:
(a) | (b) | (c) | |||||||
Plan category | Number of securities to be issued upon exercise of outstanding options, warrants and rights | Weighted-average exercise price of outstanding options, warrants and rights | Number of securities remaining available for future issuance under equity compensation plans (excluding securities reflected in column (a)) | ||||||
Equity compensation plans approved by security holders | 101,575 | $14.31 | 576,018 | ||||||
Equity compensation plans not approved by security holders | — | — | — | ||||||
Total | 101,575 | $14.31 | 576,018 | ||||||
12
Item 6. | Selected Financial Data. |
Year Ending September 30, | ||||||||||||||||||||
2017 | 2016 | 2015 | 2014 | 2013 | ||||||||||||||||
Operating Revenues | $ | 62,296,870 | $ | 59,063,291 | $ | 68,189,607 | $ | 75,016,134 | $ | 63,205,666 | ||||||||||
Gross Margin | 32,809,157 | 31,564,914 | 30,206,433 | 29,337,089 | 27,602,891 | |||||||||||||||
Operating Income | 11,666,309 | 11,212,092 | 10,006,192 | 9,681,868 | 8,795,055 | |||||||||||||||
Net Income | 6,232,865 | 5,806,866 | 5,094,415 | 4,708,440 | 4,262,052 | |||||||||||||||
Basic Earnings Per Share (1) | $ | 0.86 | $ | 0.81 | $ | 0.72 | $ | 0.67 | $ | 0.60 | ||||||||||
Cash Dividends Declared Per Share (1) | $ | 0.58 | $ | 0.54 | $ | 0.51 | $ | 0.49 | $ | 1.15 | ||||||||||
Book Value Per Share (1) | $ | 8.29 | $ | 7.75 | $ | 7.43 | $ | 7.35 | $ | 7.01 | ||||||||||
Average Shares Outstanding (1) | 7,218,686 | 7,149,906 | 7,092,315 | 7,073,218 | 7,048,091 | |||||||||||||||
Total Assets | $ | 183,135,071 | $ | 165,552,849 | $ | 145,847,194 | $ | 137,423,321 | $ | 121,658,797 | ||||||||||
Long-Term Debt (Less Unamortized Debt Expense) | $ | 61,312,011 | $ | 33,636,051 | $ | 30,316,573 | $ | 30,306,919 | $ | 12,984,169 | ||||||||||
Stockholders' Equity | 60,040,472 | 55,667,072 | 52,840,991 | 52,020,847 | 49,502,422 | |||||||||||||||
Shares Outstanding at Sept. 30(1) | 7,240,846 | 7,182,434 | 7,112,247 | 7,080,567 | 7,063,989 | |||||||||||||||
(1)Total shares and per share amounts for the prior years were revised to reflect the three-for-two stock split.
Item 7. | Management’s Discussion and Analysis of Financial Condition and Results of Operations. |
Forward-Looking Statements
This report contains forward-looking statements that relate to future transactions, events or expectations. RGC Resources, Inc. (“Resources” or the “Company”) may publish forward-looking statements relating to such matters as anticipated financial performance, business prospects, technological developments, new products, research and development activities and similar matters. These statements are based on management’s current expectations and information available at the time of such statements and are believed to be reasonable and are made in good faith. The Private Securities Litigation Reform Act of 1995 provides a safe harbor for forward-looking statements. In order to comply with the terms of the safe harbor, the Company notes that a variety of factors could cause the Company’s actual results and experience to differ materially from the anticipated results or expectations expressed in the Company’s forward-looking statements. The risks and uncertainties that may affect the operations, performance, development and results of the Company’s business include, but are not limited to, those set forth in the following discussion and within Item 1A “Risk Factors” of this Annual Report on Form 10-K. All of these factors are difficult to predict and many are beyond the Company’s control. Accordingly, while the Company believes its forward-looking statements to be reasonable, there can be no assurance that they will approximate actual experience or that the expectations derived from them will be realized. When used in the Company’s documents or news releases, the words “anticipate,” “believe,” “intend,” “plan,” “estimate,” “expect,” “objective,” “projection,” “forecast,” “budget,” “assume,” “indicate” or similar words or future or conditional verbs such as “will,” “would,” “should,” “can,” “could” or “may” are intended to identify forward-looking statements.
Forward-looking statements reflect the Company’s current expectations only as of the date they are made. The Company assumes no duty to update these statements should expectations change or actual results differ from current expectations except as required by applicable laws and regulations.
13
Overview
Resources is an energy services company primarily engaged in the regulated sale and distribution of natural gas to approximately 59,800 residential, commercial and industrial customers in Roanoke, Virginia, and the surrounding localities, through its Roanoke Gas Company (“Roanoke Gas”) subsidiary. Roanoke Gas also provides certain unregulated services. Resources formed a wholly-owned subsidiary, RGC Midstream, LLC ("Midstream"), to invest in the Mountain Valley Pipeline, LLC (the "LLC"). Midstream is a 1% member in the LLC. More information is provided under the Equity Investment in Mountain Valley Pipeline section below. The unregulated operations represent less than 2% of revenues and margins of Resources.
The utility operations of Roanoke Gas are regulated by the Virginia State Corporation Commission (“SCC”), which oversees the terms, conditions, and rates to be charged to customers for natural gas service, safety standards, extension of service, accounting and depreciation. The Company is also subject to federal regulation from the Department of Transportation in regard to the construction, operation, maintenance, safety and integrity of its transmission and distribution pipelines. The Federal Energy Regulatory Commission ("FERC") regulates prices for the transportation and delivery of natural gas to the Company’s distribution system and underground storage services. The Company is also subject to other regulations which are not necessarily industry specific.
The Company is committed to the safe and reliable delivery of natural gas to its customers. Since 1991, the Company has placed an emphasis on the modernization of its distribution system through the renewal and replacement of its cast iron and bare steel natural gas distribution pipelines and other system improvements. The Company completed the replacement of all cast iron and bare steel pipe in the first quarter of fiscal 2017 and is continuing its renewal program with the replacement of first generation, pre-1973 plastic pipe to be completed over the next few years.
The Company is also dedicated to the safeguarding of its information technology systems. These systems contain confidential customer, vendor and employee information as well as important financial data. There is risk associated with the unauthorized access of this information with a malicious intent to corrupt data, cause operational disruptions, or compromise information. Management believes it has taken reasonable security measures to protect these systems from cyber attacks and other types of incidents; however, there can be no guarantee that an incident will not occur. In the event of a cyber incident, the Company will execute its Security Incident Response Plan to assist with managing the incident. The Company also maintains cyber-insurance coverage to mitigate financial implications resulting from a cyber incident.
More than 98% of the Company’s revenues are derived from the sale and delivery of natural gas to Roanoke Gas customers. The SCC authorizes the rates and fees the Company charges its customers for these services. These rates are designed to provide the Company with the opportunity to recover its gas and non-gas expenses and to earn a reasonable rate of return for shareholders based on normal weather. Normal weather refers to the average number of heating degree days (an industry measure by which the average daily temperature falls below 65 degrees Fahrenheit) over the most recent 30-year period.
As the Company’s business is seasonal in nature, volatility in winter weather and the commodity price of natural gas, can impact the effectiveness of the Company’s rates in recovering its costs and providing a reasonable return for its shareholders. In order to mitigate the effect of weather variations, the Company has certain approved rate mechanisms in place that help provide stability in earnings, adjust for volatility in the price of natural gas and provide a return on qualified infrastructure investment. These mechanisms include a purchased gas adjustment factor ("PGA"), weather normalization adjustment factor ("WNA"), inventory carrying cost revenue ("ICC") and a Steps to Advance Virginia Energy ("SAVE") adjustment rider.
The Company's approved billing rates include a component designed to allow for the recovery of the cost of natural gas used by its customers. The cost of natural gas is considered a pass-through cost and is independent of the non-gas rates of the Company. This rate component, referred to as the PGA clause, allows the Company to pass along to its customers increases and decreases in natural gas costs incurred by its regulated operations. On a quarterly basis, the Company files a PGA rate adjustment request with the SCC to adjust the gas cost component of its rates up or down depending on projected price and activity. Once administrative approval is received, the Company adjusts the gas cost component of its rates to reflect the approved amount. As actual costs will differ from the projections used in establishing the PGA rate, the Company will either over-recover or under-recover its actual gas costs during the period. The difference between actual costs incurred and costs recovered through the application of the PGA is recorded as a regulatory asset or liability. At the end of the annual deferral period, the balance is amortized over an ensuing 12-month period as amounts are reflected in customer billings.
14
The WNA reduces the volatility in earnings due to the variability in temperatures during the heating season. The WNA is based on the most recent 30-year temperature average and provides the Company with a level of earnings protection when weather is warmer than normal and provides its customers with price protection when the weather is colder than normal. The WNA allows the Company to recover from its customers the lost margin (excluding gas costs) from the impact of weather that is warmer than normal and correspondingly requires the Company to refund the excess margin earned for weather that is colder than normal. The WNA year runs from April through March. Any billings or refunds related to the WNA are completed following the end of the WNA year. For the fiscal year ended September 30, 2017, the Company recorded $1,839,000 in additional revenue from the WNA for weather that was approximately 18% warmer than normal. During the fiscal year ended September 30, 2016, the Company recorded $1,318,000 in additional revenue for the WNA for weather that was approximately 13% warmer than normal. During the fiscal year ended September 30, 2015, the Company reduced revenue by $609,000 due to the WNA for weather that was approximately 6.5% colder than normal. As normal weather is based on the most recent 30-year temperature average, the heating degree days used to determine normal will change each year as a new year is added to the 30-year period and the oldest year is removed. As a result of two consecutive years of significantly warmer winters, the number of heating degree days that defines normal has declined from 4,000 in fiscal 2013 to 3,959 in fiscal 2017. The Company's rates are designed on 4,000 heating degree days from its last non-gas rate filing; however, the WNA model is recovering on the current normal of 3,959 heating degree days, or about 1% less than for what the rates were designed to recover. The 30-year normal will not be reset in base rates until the next time the Company files for a non-gas rate increase, so until such time as normal is reset, the WNA may slightly under-recover for warmer weather.
The Company also has an approved rate structure in place that mitigates the impact of financing costs of its natural gas inventory. Under this rate structure, Roanoke Gas recognizes revenue for the financing costs, or “carrying costs”, of its investment in natural gas inventory. The ICC factor applied to average inventory is based on the Company’s weighted-average cost of capital including interest rates on short-term and long-term debt and the Company’s authorized return on equity.
During times of rising gas costs and rising inventory levels, the Company recognizes ICC revenues to offset higher financing costs associated with higher inventory balances. Conversely, during times of decreasing gas costs and declining inventory balances, the Company recognizes less carrying cost revenue as financing costs are lower. In addition, ICC revenues are impacted by changes in the weighted-average cost of capital. Although, the cost balance of storage gas at September 30, 2017 was higher than last year due to higher prices during the summer storage refill, the average balance during the year, which is the base used to calculate ICC revenues, was lower by 5%. Furthermore, increased borrowing levels in fiscal 2017 reduced the overall weighted average cost of capital, or ICC factor, as the debt to equity ratio increased. The combination of lower average storage balances and a reduction in the ICC factor resulted in a nearly $63,000 decline in ICC revenues. This trend in lower average storage balances and ICC factor in fiscal 2016 resulted in a $182,000 decline in ICC revenues from fiscal 2015. Based on the current storage balances and natural gas futures, the average dollar balance of gas in storage may increase next year; however, an expected increase in debt will potentially reduce the ICC factor and corresponding ICC revenues.
Generally, as investment in natural gas inventory increases so does the level of borrowing under the Company’s line-of-credit. However, as the carrying cost factor used in determining carrying cost revenues is based on the Company’s weighted-average cost of capital, carrying cost revenues do not directly correspond with incremental financing costs generally provided by the line-of-credit. Therefore, when inventory cost balances decline due to a reduction in commodity prices, net income will decline as carrying cost revenues decrease by a greater amount than the line-of-credit costs decrease. The inverse occurs when inventory costs increase.
The Company’s non-gas rates are designed to allow for the recovery of non-gas related expenses and provide a reasonable return to shareholders. These rates are determined based on the filing of a formal rate application with the SCC utilizing historical information including investment in natural gas facilities. Generally, investments related to extending service to new customers are recovered through the additional revenues generated by the non-gas rates currently in place. The investment in replacing and upgrading existing infrastructure is not recoverable until a formal rate application is made to include the additional investment, and new non-gas rates are approved. The SAVE Plan and Rider provides the Company with the ability to recover costs related to these investments on a prospective basis rather than on a historical basis. The SAVE Plan provides a mechanism to recover the related depreciation and expenses and provide a return on rate base of the additional capital investments related to improving the Company's infrastructure until such time a formal rate application is filed to incorporate this investment in the Company's non-gas rates. As the Company has not filed for an increase in non-gas rates since 2013, SAVE Plan revenues have increased each year corresponding to the level of SAVE qualifying capital investment. The Company recognized approximately $3,813,000,
15
$2,538,000 and $1,308,000 in SAVE Plan revenues for years ended September 30, 2017, 2016 and 2015, respectively. SAVE revenues will be included as part of the non-gas base rates the next time the Company files for a non-gas rate increase. Additional information regarding the SAVE Rider is provided under the Regulatory Affairs section.
The economic environment has a direct correlation with business and industrial production, customer growth and natural gas utilization. The local economy appears relatively stable and should continue to improve absent a major economic setback on a local, regional or national level.
Results of Operations
Fiscal Year 2017 Compared with Fiscal Year 2016
The table below reflects operating revenues, volume activity and heating degree-days.
Operating Revenues | ||||||||||||||
Year Ended September 30, | 2017 | 2016 | Increase | Percentage | ||||||||||
Gas Utilities | $ | 61,252,015 | $ | 58,079,990 | $ | 3,172,025 | 5 | % | ||||||
Other | 1,044,855 | 983,301 | 61,554 | 6 | % | |||||||||
Total Operating Revenues | $ | 62,296,870 | $ | 59,063,291 | $ | 3,233,579 | 5 | % | ||||||
Delivered Volumes | |||||||||||
Year Ended September 30, | 2017 | 2016 | Decrease | Percentage | |||||||
Regulated Natural Gas (DTH) | |||||||||||
Residential and Commercial | 5,840,883 | 6,088,108 | (247,225 | ) | (4 | )% | |||||
Transportation and Interruptible | 2,721,699 | 2,754,497 | (32,798 | ) | (1 | )% | |||||
Total Delivered Volumes | 8,562,582 | 8,842,605 | (280,023 | ) | (3 | )% | |||||
Heating Degree Days (Unofficial) | 3,250 | 3,484 | (234 | ) | (7 | )% | |||||
Total gas utility operating revenues for the year ended September 30, 2017 increased by 5% from the year ended September 30, 2016 primarily due to higher gas costs and increased SAVE Plan revenues more than offsetting a reduction in natural gas deliveries. The average commodity price of natural gas increased by 11% per decatherm sold due to higher commodity prices. Delivered volumes declined primarily due to weather, as reflected in the lower residential and commercial volumes. Industrial consumption was nearly unchanged. Residential and commercial deliveries tend to be more weather sensitive as reflected by a 4% decline in volumes on 7% fewer heating degree days. Transportation and interruptible volumes, which are primarily driven by production activities rather than weather, decreased by 1%. Other revenues experienced a 6% increase.
Gross Margin | ||||||||||||||
Year Ended September 30, | 2017 | 2016 | Increase / (Decrease) | Percentage | ||||||||||
Gas Utility | $ | 32,332,390 | $ | 31,070,660 | $ | 1,261,730 | 4 | % | ||||||
Other | 476,767 | 494,254 | (17,487 | ) | (4 | )% | ||||||||
Total Gross Margin | $ | 32,809,157 | $ | 31,564,914 | $ | 1,244,243 | 4 | % | ||||||
Regulated natural gas margins from utility operations increased by 4% from fiscal 2016, primarily as a result of increasing SAVE Plan revenues. Total SAVE Plan revenues increased by $1,275,000 as the Company continues to invest in qualified infrastructure projects. Since January 2014, the Company has invested more than $32,000,000 in qualified SAVE projects with fiscal 2018 projected to add an additional $8,000,000 in SAVE investment. Volumetric
16
margin declined by nearly $526,000 due to a reduction in total volumes delivered. Residential and commercial volumes declined due to warmer weather compared to the prior year. Interruptible and transportation volumes were nearly unchanged reflecting only a small decline. The impact of the warmer weather on volumetric margin was offset by the WNA, which provided approximately $522,000 in revenues. As discussed in more detail above, the WNA allowed the Company to recognize margin related to those natural gas volumes not delivered due to the warmer weather. ICC revenues declined by $63,000 due to lower average gas storage balance and a lower ICC factor.
Other margins, consisting of non-utility related services, decreased by $17,487 despite higher revenues. Higher operating costs made margin tighter in the non-utility services part of operations. The service contracts which generate the majority of the non-utility related revenues are subject to annual or semi-annual renewal provisions and the potential exists that these contracts may not be renewed or extended, which could negatively impact future revenues and margins.
The changes in the components of the gas utility margin are summarized below:
Twelve Months Ended September 30, | |||||||||||
2017 | 2016 | Increase / (Decrease) | |||||||||
Customer Base Charge | $ | 12,412,753 | $ | 12,364,811 | $ | 47,942 | |||||
SAVE Plan | 3,813,043 | 2,538,055 | 1,274,988 | ||||||||
Volumetric | 13,573,704 | 14,099,214 | (525,510 | ) | |||||||
WNA | 1,839,454 | 1,317,800 | 521,654 | ||||||||
Carrying Cost | 588,624 | 651,492 | (62,868 | ) | |||||||
Other | 104,812 | 99,288 | 5,524 | ||||||||
Total | $ | 32,332,390 | $ | 31,070,660 | $ | 1,261,730 | |||||
Operations and Maintenance Expense - Operations and maintenance expenses, in total, were nearly unchanged reflecting a net increase of $1,955 for the year. Expense declines in certain areas were offset by higher expenses in other categories. The most significant offsets pertain to labor, contracted services, employee benefit costs, corporate insurance, capitalized overheads and bad debt expense. Total operation and maintenance labor declined by $158,000 primarily as a result of the outsourcing of the Company's customer service, billing and credit and collection functions. Management made a strategic decision to transfer these operations to a provider that has significant experience in serving utility clients. In July 2017, the Company transitioned to the service provider, resulting in a reduction of 18 employees. The personnel savings from this work force reduction was offset by the fees paid to the service provider. Employee benefit costs increased by $195,000 due to higher health insurance premiums and higher actuarial determined costs on the post-retirement medical plan. The Company realized a $251,000 reduction in corporate property and liability insurance premiums due to favorable insurance renewals. Capitalized overheads, which include general and administrative, payroll and engineering costs, decreased by $179,000 from fiscal 2016 primarily due to a reduction in the general and administrative overhead rate and less LNG overheads due to a 46% reduction in the amount of LNG produced. The reduction in the LNG production was timing related as the facility was at near full capacity at September 30, 2016, while the balance at September 30, 2017 was at 79% capacity. Legal and other professional expenses were also lower due to reduced activity in those areas.
General Taxes - General taxes increased $122,944, or 7%, primarily due to higher property taxes associated with increases in utility property.
Depreciation - Depreciation expense increased by $665,127, or 12%, corresponding to 10% increase in utility plant investment.
Equity in Earnings of Unconsolidated Affiliate - The equity in earnings of the Mountain Valley Pipeline investment increased by $268,782 primarily consisting of the allowance for funds used during construction ("AFUDC") related to the increasing investment in the project. The investment in Mountain Valley Pipeline and the related AFUDC earnings are discussed further under the Equity Investment in Mountain Valley Pipeline section below.
Other Expense - Other expense, net, decreased by $123,139, or 48%, primarily due to lower pipeline assessments and charitable commitments.
17
Interest Expense - Total interest expense increased by $280,933, or 17%, due to a 24% increase in the average total debt outstanding. The combination of Mountain Valley Pipeline investments and the level of capital expenditures during fiscal 2017 generated the higher debt balances. The average interest rate declined during the current year from 3.76% to 3.56%. The $7,000,000 unsecured note issued on November 1, 2016 had a variable rate that ranged from 1.43% to 2.14% during the year, which was lower than the average rate on the outstanding debt during fiscal 2016.
Income Taxes - Income tax expense increased by $139,206, or 4%, on higher pre-tax earnings. The effective tax rate was 37.9% for fiscal 2017 compared to 38.7% for fiscal 2016. The lower effective tax rate was attributable to the exercise of stock options during the year, which resulted in additional tax deductions above the amount recorded at grant date due to the significant appreciation in stock price over the grant price.
Net Income and Dividends - Net income for fiscal 2017 was $6,232,865 compared to $5,806,866 for fiscal 2016. Basic and diluted earnings per share were $0.86 in fiscal 2017 compared to $0.81 in fiscal 2016. Dividends declared per share of common stock were $0.58 in fiscal 2017 compared to $0.54 in fiscal 2016. All per share amounts were restated for the three-for-two stock split effective March 1, 2017 as described in Note 2 to the Consolidated Financial Statements.
Fiscal Year 2016 Compared with Fiscal Year 2015
The table below reflects operating revenues, volume activity and heating degree-days.
Operating Revenues | ||||||||||||||
Year Ended September 30, | 2016 | 2015 | Decrease | Percentage | ||||||||||
Gas Utilities | $ | 58,079,990 | $ | 67,094,290 | $ | (9,014,300 | ) | (13 | )% | |||||
Other | 983,301 | 1,095,317 | (112,016 | ) | (10 | )% | ||||||||
Total Operating Revenues | $ | 59,063,291 | $ | 68,189,607 | $ | (9,126,316 | ) | (13 | )% | |||||
Delivered Volumes | |||||||||||
Year Ended September 30, | 2016 | 2015 | Decrease | Percentage | |||||||
Regulated Natural Gas (DTH) | |||||||||||
Residential and Commercial | 6,088,108 | 6,955,594 | (867,486 | ) | (12 | )% | |||||
Transportation and Interruptible | 2,754,497 | 2,919,413 | (164,916 | ) | (6 | )% | |||||
Total Delivered Volumes | 8,842,605 | 9,875,007 | (1,032,402 | ) | (10 | )% | |||||
Heating Degree Days (Unofficial) | 3,484 | 4,253 | (769 | ) | (18 | )% | |||||
Total gas utility operating revenues for the year ended September 30, 2016 declined by 13% from the year ended September 30, 2015 primarily due to a combination of lower gas costs and a reduction in natural gas deliveries more than offsetting revenues from the SAVE plan rider and WNA. The average commodity price of natural gas declined by 28% per decatherm sold. Delivered volumes declined primarily due to warmer weather, as reflected in the lower residential and commercial volumes. Industrial consumption also declined, causing a reduction in transportation and interruptible volumes. The more weather sensative residential and commercial deliveries declined by 12% on 18% fewer heating degree days. Transportation and interruptible volumes decreased by 6%. Other revenues experienced a 10% decrease. Approximately half of the decrease in other revenues was attributable to the cessation of operations for Utility Consultants during fiscal 2015 and Application Resources during fiscal 2016.
18
Gross Margin | ||||||||||||||
Year Ended September 30, | 2016 | 2015 | Increase / (Decrease) | Percentage | ||||||||||
Gas Utility | $ | 31,070,660 | $ | 29,656,975 | $ | 1,413,685 | 5 | % | ||||||
Other | 494,254 | 549,458 | (55,204 | ) | (10 | )% | ||||||||
Total Gross Margin | $ | 31,564,914 | $ | 30,206,433 | $ | 1,358,481 | 4 | % | ||||||
Regulated natural gas margins from utility operations increased by 5% from fiscal 2015, primarily as a result of WNA revenues, increasing SAVE Plan revenues and customer base charges related to customer growth more than offsetting lower volumetric margins and ICC revenues. SAVE Plan revenues increased by $1,230,000 as the Company was in the third year of the current SAVE Plan. The growth in SAVE Plan revenues has been fueled by the Company's pipeline renewal program and investment in eligible SAVE Plan infrastructure projects. As noted above, volumetric margin declined due to a reduction in total volumes delivered. Residential and commercial volumes declined due to much warmer weather compared to the prior year. Interruptible and transportation volumes declined due to a combination of reduced activity at one large customer, the closing of another industrial customer's operations during the prior fiscal year and a significant decrease in usage by another industrial customer that uses natural gas as its back up fuel source. The impact of the warmer weather on volumetric margin was offset by the WNA mechanism. ICC revenues continued to decline with a $182,000 reduction in fiscal 2016 compared to fiscal 2015 due to lower commodity prices and a lower ICC factor.
Other margins, consisting of non-utility related services, decreased by $55,204 on comparable activity. The Utility Consultants, which ceased activity in fiscal 2015, and Application Resources, which terminated in fiscal 2016, accounted for approximately $25,000 of the reduction in non-utility related margin. The remainder of the decrease in other margins is attributable to the level of activity under these contracts which fluctuates based on customer requirements.
The changes in the components of the gas utility margin are summarized below:
Twelve Months Ended September 30, | |||||||||||
2016 | 2015 | Increase / (Decrease) | |||||||||
Customer Base Charge | $ | 12,364,811 | $ | 12,240,580 | $ | 124,231 | |||||
SAVE Plan | 2,538,055 | 1,307,795 | 1,230,260 | ||||||||
Volumetric | 14,099,214 | 15,757,907 | (1,658,693 | ) | |||||||
WNA | 1,317,800 | (608,560 | ) | 1,926,360 | |||||||
Carrying Cost | 651,492 | 833,291 | (181,799 | ) | |||||||
Other | 99,288 | 125,962 | (26,674 | ) | |||||||
Total | $ | 31,070,660 | $ | 29,656,975 | $ | 1,413,685 | |||||
Operations and Maintenance Expense - Operations and maintenance expenses declined by $388,799, or 3%, from fiscal 2015 due to much higher overhead capitalization and lower bad debt expenses more than offsetting higher benefit and labor costs. Capitalized overheads increased by 30%, or nearly $873,000, over fiscal 2015 due to higher benefit costs, a 30% increase in capital expenditures and a 38% increase in the amount of LNG produced. In addition, bad debt expense declined by $77,000 due to the combination of reduced sales related to much warmer weather, lower gas costs and level of collections on previously written off accounts. Total benefit costs increased by $456,000 due to increased pension and postretirement medical costs related to the amortization of higher actuarial losses attributable to the adoption of a new mortality table that reflects extended life expectancies. Operating and maintenance labor costs increased by $141,000, or 2%, due to normal wage adjustments. The remaining decrease relates to a variety of areas, including the level of contracted and professional services, as the prior year included expenses related to the union contract negotiations and due diligence work related to the investment in the LLC.
General Taxes - General taxes increased $56,705, or 4%, primarily due to higher property taxes associated with increases in utility property.
19
Depreciation - Depreciation expense increased by $484,675, or more than 9%, corresponding to a similar increase in utility plant investment.
Equity in Earnings of Unconsolidated Affiliate - The investment in Mountain Valley Pipeline began in fiscal 2016 and the $152,864 equity in earnings is primarily attributed to AFUDC income. More information regarding the investment in Mountain Valley Pipeline is located under the Equity Investment in Mountain Valley Pipeline section below.
Other Expense - Other expense, net, increased by $26,789, or 12%, primarily due to higher pipeline assessments and multi-year charitable commitments.
Interest Expense - Total interest expense increased by $123,902, or 8%, due to a 15% increase in the average debt outstanding. The increase in average debt levels was attributable to financing the investments in Mountain Valley Pipeline and SAVE related projects and other capital improvements.
Income Taxes - Income tax expense increased by $495,622, or 16%, on higher pre-tax earnings. The effective tax rate was 38.7% for fiscal 2016 compared to 38.4% for fiscal 2015.
Net Income and Dividends - Net income for fiscal 2016 was $5,806,866 compared to $5,094,415 for fiscal 2015. Basic and diluted earnings per share were $0.81 in fiscal 2016 compared to $0.72 in fiscal 2015. Dividends declared per share of common stock were $0.54 in fiscal 2016 compared to $0.51 in fiscal 2015. All per share amounts were restated for the three-for-two stock split effective March 1, 2017.
Capital Resources and Liquidity
Due to the capital intensive nature of the utility business, as well as the related weather sensitivity, the Company’s primary capital needs are for the funding of its continuing construction program, the seasonal funding of its natural gas inventories and accounts receivables and payment of dividends. To meet these needs, the Company relies on its operating cash flows, line-of-credit agreement, long-term debt and capital raised through the Company’s stock plans.
Cash and cash equivalents decreased by $573,612 in fiscal 2017 and $341,982 in fiscal 2016 compared to an increase of $135,477 in fiscal 2015. The following table summarizes the categories of sources and uses of cash:
Cash Flow Summary | Year Ended September 30, | ||||||||||
2017 | 2016 | 2,015 | |||||||||
Net cash provided by operating activities | $ | 12,980,978 | $ | 14,921,640 | $ | 16,760,827 | |||||
Net cash used in investing activities | (23,492,555 | ) | (20,996,501 | ) | (13,750,274 | ) | |||||
Net cash provided by (used in) financing activities | 9,937,965 | 5,732,879 | (2,875,076 | ) | |||||||
Increase (decrease) in cash and cash equivalents | $ | (573,612 | ) | $ | (341,982 | ) | $ | 135,477 | |||
Cash Flows Provided by Operating Activities:
The seasonal nature of the natural gas business causes operating cash flows to fluctuate significantly during the year as well as from year to year. Factors, including weather, energy prices, natural gas storage levels and customer collections, all contribute to working capital levels and related cash flows. Generally, operating cash flows are positive during the second and third quarters as a combination of earnings, declining storage gas levels and collections on customer accounts all contribute to higher cash levels. During the first and fourth quarters, operating cash flows generally decrease due to the combination of increasing natural gas storage levels and rising customer receivable balances.
Cash provided by operating activities was $12,981,000 in fiscal 2017, $14,922,000 in fiscal 2016 and $16,761,000 in fiscal 2015. Cash provided by operating activities decreased by more than $1,900,000 from last year primarily as a result of natural gas commodity prices ending their steady price decline and a smaller increase in deferred tax liabilities associated with the continuation of bonus depreciation. Commodity prices had been declining since 2014, resulting in lower natural gas storage costs. During fiscal 2017, natural gas prices reversed this trend and increased, resulting in higher cost of gas in storage. The Company continues to benefit from the application of bonus depreciation for federal
20
income tax purposes with much higher first year tax deductions on assets placed in service; however, the growth in the tax benefit has been at a smaller rate. The Company has been claiming an initial tax deduction each year on 50% of the cost of most of the utility assets placed in service since 2008 with 100% bonus depreciation in effect during 2011. As a result of the bonus depreciation claimed during this time, the federal tax depreciation base is considerably smaller on these assets for all years following the year in which bonus depreciation deduction was claimed. Deferred tax has continued to increase due to the growth in capital expenditures by the Company. However, 50% bonus depreciation declines to 40% in 2018 and 30% in 2019. Absent any changes to current tax law, bonus depreciation will end after 2019. With projected capital expenditures expected to remain near fiscal 2017 levels and the scheduled phase out of bonus depreciation, deferred taxes are expected to reverse in the near future resulting in cash outflows as these taxes are paid. A summary of the key components of the cash flows from operating activities is provided below:
Twelve Months Ended September 30, | |||||||||||
Cash Flows From Operating Activities: | 2017 | 2016 | Increase (Decrease) | ||||||||
Net income | $ | 6,232,865 | $ | 5,806,866 | $ | 425,999 | |||||
Depreciation | 6,378,368 | 5,709,525 | 668,843 | ||||||||
Decrease in gas in storage | (265,109 | ) | 723,713 | (988,822 | ) | ||||||
Increase in deferred taxes | 3,325,379 | 4,466,954 | (1,141,575 | ) | |||||||
Accounts payable and accrued expenses | (989,683 | ) | 15,046 | (1,004,729 | ) | ||||||
Other | (1,700,842 | ) | (1,800,464 | ) | 99,622 | ||||||
Net cash provided by operating activities | $ | 12,980,978 | $ | 14,921,640 | $ | (1,940,662 | ) | ||||
Cash Flows Used in Investing Activities:
Investing activities primarily consist of expenditures under the Company’s construction program, which involves a combination of replacing aging natural gas pipe with new plastic or coated steel pipe, making improvements to the LNG plant and distribution facilities, expanding its natural gas system to meet the demands of customer growth, as well as the continued investment in the MVP. The Company’s expenditures related to its pipeline renewal program and other system and infrastructure improvements increased to more than $20,700,000 in fiscal 2017 from $18,000,000 in fiscal 2016 and $13,800,000 in fiscal 2015. The Company renewed 9 miles of natural gas distribution main and replaced 459 services in fiscal 2017. This compares to 14.9 miles of main and 684 services in fiscal 2016 and 10 miles of main and 594 services in fiscal 2015. The Company completed the replacement of its cast iron and bare steel pipe in late 2016. In addition, the Company’s capital expenditures included costs to extend natural gas distribution mains and services to 499 new customers in fiscal 2017 compared to 495 new customers in fiscal 2016 and 609 in fiscal 2015. Although the level of expenditures under the pipeline renewal program declined in fiscal 2017 as the Company transitioned from cast iron and bare steel to first generation plastic pipe replacement, the Company exceeded last year's capital spending with the completion of the automated meter reading ("AMR") project. The AMR project involved the retrofitting of all customer meters with transmitters to allow consumption data to be collected remotely. The AMR system provides the Company with an efficient data collection process for more reliable and accurate measure of natural gas usage by its customers. Depreciation covered approximately 31% of the current year's capital expenditures compared to 32% for 2016 and 38% for 2015, with the balance provided from other operating cash flows and borrowings.
Capital expenditures are expected to remain at elevated levels over the next few years. The Company is now focused on replacing the remaining pre-1973 first generation plastic pipe with polyethylene pipe. This renewal project is expected to be completed by 2021. The current capital budget for fiscal 2018 is projected at more than $20,000,000, consistent with fiscal 2017 levels. In addition to the replacement of pre-1973 plastic pipe, the Company plans to invest approximately $3,000,000 for customer growth, replace a natural gas transfer station and reinforce sections of the distribution system to meet increasing demand and ensure reliability of gas service. The Company expects to increase its borrowing activity to meet the funding requirements of these planned expenditures.
Investing cash flows also reflect the Company's $2,759,346 funding of its participation in the LLC. The Company expects to invest a total of $35 million in the project. Funding for the investment in the LLC is provided through a combination of a $25 million credit facility, which matures in 2020, and equity capital. The Company may consider issuing additional common stock in 2018 to supplement the debt financing. When the $25 million credit facility matures, the Company will consider its financing options, which may included longer-term debt financing. More
21
information regarding the credit facility is provided in Note 6 of the Consolidated Financial Statements and under the Equity Investment in Mountain Valley Pipeline section below.
Cash Flows Provided by (Used in) Financing Activities:
Financing activities generally consist of borrowings and repayments under debt agreements, issuance of stock and the payment of dividends. As mentioned above, the Company uses its line-of-credit to fund seasonal working capital and provide temporary financing for capital projects, which is then converted into longer-term debt or equity financing. Cash flows provided by financing activities were $9,938,000 in fiscal 2017 and $5,733,000 in fiscal 2016 compared to cash used in financing activities of $2,875,000 in fiscal 2015. The combination of greater capital investment related to the pipeline renewal program and other projects, including the Mountain Valley Pipeline, and lower cash flows from operating activities increased net borrowing. As noted above, the Company's operating cash flows have declined since 2015 as the benefits from declining natural gas prices and bonus depreciation have lessened. The Company increased the net utilization of its line-of-credit by $3,235,000 to provide bridge financing for its capital budget. The Company also entered into a 5-year unsecured note in the principal amount of $7,000,000 on November 1, 2016. The proceeds from this note were used to convert a portion of the line-of-credit balance supporting Roanoke Gas' capital expenditures into a longer-term financing instrument. The remaining $2,916,000 increase in unsecured notes payable is attributable to the borrowing under Midstream's credit facility to finance the investment in MVP. Proceeds from the issuance of stock were $968,000 under the Company's stock plans. Dividends increased as the annualized dividend rate per share went from $0.51 in fiscal 2015 to $0.54 in fiscal 2016 and $0.58 in fiscal 2017. The Company’s consolidated capitalization was 49.4% equity and 50.6% long-term debt at September 30, 2017. This compares to 62.2% equity and 37.8% long-term debt at September 30, 2016. The long-term debt as a percent of long-term capitalization increased significantly over last year due to the extension of the line-of-credit term to more than one year resulting in its transition to a non-current debt as noted below.
On March 27, 2017, Roanoke Gas entered into a new revolving line-of-credit note agreement. The new line-of-credit agreement is for a two-year term expiring March 31, 2019, replacing the one-year agreement that expired on March 31, 2017. As the new agreement is for a two-year term, amounts drawn against the new agreement are considered to be non-current as the balance outstanding under the line-of-credit will not be subject to repayment within the next 12-month period. Therefore, the balance sheet at September 30, 2017 reflects the line-of-credit balance as part of long-term debt while the prior year's balance is classified as a current liability. The new agreement maintains the same variable interest rate based on 30-day LIBOR plus 100 basis points and availability fee of 15 basis points applied to the unused balance. The new agreement also maintains the multi-tiered borrowing limits to accommodate seasonal borrowing demands and minimize borrowing costs. The total available borrowing limits during the term of the new agreement range from $10,000,000 to $30,000,000. The Company intends to request an extension of the agreement by one year prior to next March when the outstanding debt would become a current liability; however, there is no guarantee that the line-of-credit agreement will be extended or replaced on terms comparable to those currently in place.
On October 2, 2017, the Company issued two 10-year unsecured notes in the aggregate principal amount of $8,000,000 with a fixed interest rate of 3.58% per annum. Interest is paid semi-annually on these notes in April and October of each year until the notes mature. The proceeds from these notes were used to refinance a portion of the line-of-credit balance outstanding at September 30, 2017 into longer-term financing.
Off-Balance Sheet Arrangements
The Company has no off-balance sheet arrangements as defined in Regulation S-K, Item 303(a)(4)(ii).
Contractual Obligations and Commitments
The Company has incurred various contractual obligations and commitments in the normal course of business. As of September 30, 2017, the estimated recorded and unrecorded obligations are as follows:
22
Recorded contractual obligations: | Less than 1 year | 1-3 Years | 4-5 Years | After 5 Years | Total | ||||||||||||||
Long-Term Debt - Notes Payable (1) | $ | — | $ | — | $ | 13,312,200 | $ | 30,500,000 | $ | 43,812,200 | |||||||||
Long-Term Debt - Line of Credit (2) | — | 17,791,760 | — | — | 17,791,760 | ||||||||||||||
Total | $ | — | $ | 17,791,760 | $ | 13,312,200 | $ | 30,500,000 | $ | 61,603,960 | |||||||||
(1) See Note 6 to the consolidated financial statements. Does not include scheduled debt payments for the unsecured notes issued on October 2, 2017. | |||||||||||||||||||
(2) See Note 5 to the consolidated financial statements. New line-of-credit agreement executed for a 2-year term, expiring March 31, 2019. Amounts drawn against agreement are considered non-current as they are not subject to repayment within 12-months. | |||||||||||||||||||
Unrecorded contractual obligations, not reflected in consolidated balance sheets in accordance with US GAAP: | Less than 1 year | 1-3 Years | 4-5 Years | After 5 Years | Total | ||||||||||||||
Pipeline and Storage Capacity (3) | $ | 11,232,436 | $ | 17,746,270 | $ | 9,787,494 | $ | 3,067,053 | $ | 41,833,253 | |||||||||
Gas Supply (4) | — | — | — | — | — | ||||||||||||||
Interest on Line-of-Credit (5) | 58,338 | 25,800 | — | — | 84,138 | ||||||||||||||
Interest on Notes Payable (6) | 1,641,613 | 3,283,226 | 2,819,856 | 15,541,764 | 23,286,459 | ||||||||||||||
Pension Plan Funding (7) | — | — | — | — | — | ||||||||||||||
Investment in MVP (8) | 25,560,133 | 4,741,780 | — | — | 30,301,913 | ||||||||||||||
Other Obligations (9) | 146,787 | 10,087 | 4,661 | 25,540 | 187,075 | ||||||||||||||
Total | $ | 38,639,307 | $ | 25,807,163 | $ | 12,612,011 | $ | 18,634,357 | $ | 95,692,838 | |||||||||
(3) Recoverable through the PGA process. | |||||||||||||||||||
(4) Volumetric obligation is for the purchase of contracted decatherms of natural gas at market prices in effect at the time of purchase. Unable to estimate related payment obligation until time of purchase. See Note 11 to the consolidated financial statements. | |||||||||||||||||||
(5) Accrued interest on line-of-credit balance at September 30, 2017, including minimum facility fee on unused line-of-credit. See Note 5 to the consolidated financial statements. | |||||||||||||||||||
(6) Calculated interest payments on 20-year $30.5 million Roanoke Gas Co. Prudential note payable due September 18, 2034, 5-year $7 million Roanoke Gas Co. BB&T note payable due November 01, 2021 and on the 09/30/2017 balance on Midstream notes due December 29, 2020. See Note 6 to the consolidated financial statements. Does not include scheduled interest payments on the unsecured notes issued on October 2, 2017. | |||||||||||||||||||
(7) Estimated minimum funding assuming application of credit balances in plan to offset funding. Minimum funding requirements beyond five years is not available. See Note 8 to the consolidated financial statements for the planned funding in fiscal 2018. | |||||||||||||||||||
(8) Projected remaining funding of the Company's 1% interest in MVP as entered into on October 1, 2015. | |||||||||||||||||||
(9) Various lease, maintenance, equipment and service contracts. | |||||||||||||||||||
Equity Investment in Mountain Valley Pipeline
On October 1, 2015, the Company, through its wholly-owned subsidiary Midstream, entered into an agreement to become a 1% member in the LLC. The purpose of the LLC is to construct and operate the Mountain Valley Pipeline ("MVP"), a natural gas pipeline connecting the Equitrans gathering and transmission system in northern West Virginia to the Transco interstate pipeline in south central Virginia. This project falls under the jurisdiction of FERC and is subject to its approval prior to beginning construction. On October 13, 2017, FERC issued the MVP Certificate of Public Convenience and Necessity ("CPCN"). Pending Virginia and West Virginia state environmental agency permits and other federal agency permits, it is expected that FERC will issue a construction Notice-to-Proceed ("NTP") in late 2017 or early 2018. If the NTP is received on this schedule, the MVP targeted in-service date is late fourth quarter of 2018.
Management believes the investment in the LLC will be beneficial for the Company, its shareholders and southwest Virginia. In addition to the potential returns from the investment in the LLC, Roanoke Gas will benefit from access to another source of natural gas to its distribution system. Currently, Roanoke Gas is served by two pipelines and a liquefied natural gas storage facility. Damage to or interruption in supply from any of these sources, especially during
23
the winter heating season, could have a significant impact on the Company's ability to serve its customers. A third pipeline would reduce the impact from such an event. In addition, the proposed pipeline path would provide the Company with a more economically feasible opportunity to provide natural gas service to previously unserved areas in southwest Virginia.
The total project cost is anticipated to be $3.5 billion. As a 1% member in the LLC, Midstream's cash contribution is expected to be approximately $35 million. The agreement provides for a schedule of cash draws to fund the project. The initial payments are related to pre-construction activities including the acquisition of land, easements and materials. Once the NTP is received and construction begins, more significant cash draws will be required. Initial funding for the investment in the LLC is provided through the Midstream credit facility under which Midstream may borrow up to a total of $25 million, through 2020 with the balance coming from equity capital. The Company regularly assesses its overall capital needs and capital structure. Based on these assessments and market conditions during 2018, the Company may fund the LLC investment with proceeds from an equity offering of the Company's common stock.
A majority of the current earnings from the investment in MVP relates to the AFUDC income generated by the deployment of capital in the design, engineering, materials procurement, project management and ultimately construction phases of the pipeline. AFUDC is an accounting method whereby the costs of debt and equity funds used to finance facility infrastructure are credited to income and charged to the cost of the project. The level of investment in MVP will continue to grow at a steady pace until such time FERC issues their decision on the project. When the NTP is received, construction on the pipeline should begin in earnest and both the investment in MVP and the AFUDC will increase at a much greater rate until the pipeline is placed in service. Earnings after the pipeline is operational would be derived from the fees charged for transporting natural gas through the pipeline.
Regulatory Affairs
The Company continues to recover the costs of its infrastructure replacement program through its SAVE Plan. On June 30, 2017, the Company filed its 2018 SAVE Plan application with the SCC. The original SAVE Plan and Rider were approved by the SCC through an order issued on August 29, 2012 and has been modified, amended or updated each year since. The original SAVE Plan was designed to facilitate the accelerated replacement of the remaining bare steel and cast iron natural gas pipe by providing a mechanism for the Company to recover the related depreciation and expenses and return on rate base of the additional capital investment without the filing of a formal application for an increase in non-gas base rates. The projects included under the SAVE Plan will enhance the safety and reliability of the Company’s gas distribution system and reduce greenhouse emissions. The amendments in 2013 and 2014 added projects related to the replacement of bare steel and cast iron natural gas pipe in addition to two other major projects and the investment for related meter and regulator installations located on customer premises. In 2015, the SCC approved the Company's request to expand the authorized annual spending variance from 10% to 20% and set a 5% cumulative SAVE spending variance. This allows the Company to recover it's investment up to the new variance limits. The 2016 and 2017 applications included provisions to continue the ongoing pipeline renewal project with a focus on pre-1973 plastic pipe, replacement of natural gas custody transfer stations and the replacement of coated steel tubing services and related meter installations. The 2018 SAVE Plan continues the focus on the replacement of the pre-1973 plastic pipe and the replacement of one custody transfer station. On September 28, 2017, the Company received SCC approval to implement the new 2018 SAVE rates related to the proposed qualifying SAVE investments in calendar 2018. The new rates are designed to provide approximately $5,000,000 in revenue, representing an increase of $1,000,000 over the estimated 2017 SAVE Plan year. The additional SAVE Plan revenue as approved by the SCC will allow the Company to forgo a formal non-gas rate increase application at this time.
The Company currently holds the only franchises and certificates of public convenience and necessity to distribute natural gas in its service area. Certificates of public convenience and necessity are issued by the SCC to provide service in the cities and counties in the Company's service territory. These certificates are intended for perpetual duration subject to compliance and regulatory standards. Franchises are granted by the local cities and towns served by the Company and are generally granted for a defined period of time. The current franchise agreements with the City of Roanoke, the City of Salem and the Town of Vinton will expire December 31, 2035.
On March 25, 2015, the Company filed an application for approval of a Certificate of Public Convenience and Necessity with the SCC to include the remaining uncertificated portions of Franklin County into its authorized natural gas service territory. On July 30, 2015, the Company filed a Motion to Stay Proceeding requesting the SCC stay the application request pending further progress in the review of the MVP project by FERC and reconsider the application at a later date. The SCC granted the stay on July 31, 2015, which permitted the Company to continue its application
24
request at a later date. As FERC has issued the CPCN on the MVP project, the Company intends to request removal of the stay and complete the Franklin County application in fiscal 2018.
Critical Accounting Policies and Estimates
The consolidated financial statements of Resources are prepared in accordance with accounting principles generally accepted in the United States of America. The amounts of assets, liabilities, revenues and expenses reported in the Company’s financial statements are affected by accounting policies, estimates and assumptions that are necessary to comply with generally accepted accounting principles. Estimates used in the financial statements are derived from prior experience, statistical analysis and professional judgments. Actual results may differ significantly from these estimates and assumptions.
The Company considers an estimate to be critical if it is material to the financial statements and requires assumptions to be made that were uncertain at the time the estimate was made and changes in the estimate are reasonably likely to occur from period to period. The Company considers the following accounting policies and estimates to be critical.
Regulatory accounting - The Company’s regulated operations follow the accounting and reporting requirements of FASB ASC No. 980, Regulated Operations. The economic effects of regulation can result in a regulated company deferring costs that have been or are expected to be recovered from customers in a period different from the period in which the costs would be charged to expense by an unregulated enterprise. When this occurs, costs are deferred as assets in the consolidated balance sheet (regulatory assets) and recorded as expenses when such amounts are reflected in rates. Additionally, regulators can impose liabilities upon a regulated company for amounts previously collected from customers and for current collection in rates of costs that are expected to be incurred in the future (regulatory liabilities).
If, for any reason, the Company ceases to meet the criteria for application of regulatory accounting treatment for all or part of its operations, the Company would remove the applicable regulatory assets or liabilities from the balance sheet and include them in the consolidated statements of income and comprehensive income for the period in which the discontinuance occurred.
Revenue recognition - Regulated utility sales and transportation revenues are based upon rates approved by the SCC. The non-gas cost component of rates may not be changed without a formal rate application and corresponding authorization by the SCC in the form of a Commission order; however, the gas cost component of rates may be adjusted quarterly through the PGA mechanism. When the Company files a request for a non-gas rate increase, the SCC may allow the Company to place such rates into effect subject to refund pending a final order. Under these circumstances, the Company estimates the amount of increase it anticipates will be approved based on the best available information. The Company also bills customers through a SAVE Rider that provides a mechanism to recover on a prospective basis the costs associated with the Company’s expected investment related to the replacement of natural gas distribution pipe and other qualifying projects. As authorized by the SCC, the Company adjusts billed revenues monthly through the application of the WNA model. As the Company's non-gas rates are established based on the 30-year temperature average, monthly fluctuations in temperature from the 30-year average could result in the recognition of more or less revenue than for what the non-gas rates were designed. The WNA authorizes the Company to adjust monthly revenues for the effects of variation in weather from the 30-year average with a corresponding entry to a WNA receivable or WNA payable. At the end of each WNA year, the Company will refund excess revenue collected for weather that was colder than the 30-year average or bill the customer for revenue short-fall for weather that was warmer than normal. As required under the provisions of FASB ASC No. 980, Regulated Operations, the Company recognizes billed revenue related to the SAVE projects and from the WNA to the extent such revenues have been earned under the provisions approved by the SCC.
The Company bills its regulated natural gas customers on a monthly cycle. The billing cycle for most customers does not coincide with the accounting periods used for financial reporting. The Company accrues estimated revenue for natural gas delivered to customers but not yet billed during the accounting period based on weather during the period and current and historical data. The financial statements include unbilled revenue of $965,683 and $1,004,061 as of September 30, 2017 and 2016, respectively.
Allowance for Doubtful Accounts - The Company evaluates the collectability of its accounts receivable balances based upon a variety of factors including loss history, level of delinquent account balances, collections on previously written off accounts and general economic conditions. The Company recently outsourced its credit and collections function as part of its strategic decision to move the call center, billing and other customer service functions to a third
25
party provider with significant utility experience. These changes will impact the current valuation model for accounts receivable, which used historical information based on collection functions previously handled by Company personnel.
Pension and Postretirement Benefits - The Company offers a defined benefit pension plan (“pension plan”) and a postretirement medical and life insurance plan (“postretirement plan”) to eligible employees. The expenses and liabilities associated with these plans, as disclosed in Note 8 to the consolidated financial statements, are based on numerous assumptions and factors, including provisions of the plans, employee demographics, contributions made to the plan, return on plan assets and various actuarial calculations, assumptions and accounting requirements. In regard to the pension plan, specific factors include assumptions regarding the discount rate used in determining future benefit obligations, expected long-term rate of return on plan assets, compensation increases and life expectancies. Similarly, the postretirement medical plan also requires the estimation of many of the same factors as the pension plan in addition to assumptions regarding the rate of medical inflation and Medicare availability. Actual results may differ materially from the results expected from the actuarial assumptions due to changing economic conditions, differences in actual returns on plan assets, different rates of medical inflation, volatility in interest rates and changes in life expectancy. Such differences may result in a material impact on the amount of expense recorded in future periods or the value of the obligations on the balance sheet.
In selecting the discount rate to be used in determining the benefit liability, the Company utilized the Citigroup yield curves which incorporate the rates of return on high-quality, fixed-income investments that corresponded to the length and timing of benefit streams expected under both the pension plan and postretirement plan. The Company used a discount rate of 3.72% and 3.69%, respectively, for valuing its pension plan liability and postretirement plan liability at September 30, 2017. These rates increased over the prior year by 0.30% and 0.36%, respectively. The rise in the discount rate is evidenced by the 30-year Treasury rate, which increased from 2.32% to 2.86%. However, corporate bond rates increased but to a lesser degree indicating that credit spreads among high quality investments narrowed resulting in a smaller discount rate increase. This increase in the discount rates was the primary driver in the reduction of the accumulated benefit obligation on the postretirement plan. The rise in the discount rate for the pension plan nearly offset the increase in liabilities associated with additional credited service and salary increases resulting in small increases in both the accumulated benefit obligation and the projected benefit obligation. The Company used the RP-2014 Mortality Table, adjusted to 2006, with generational mortality improvements under Projection Scale MP-2016 for the current year valuation.
The benefit plans' assets benefited from strong market returns and Company funding. Following lower than expected returns in fiscal 2015, the returns on the related pension and postretirement assets for fiscal 2016 and 2017 exceeded the corresponding long-term rate of return assumptions for both plans. Furthermore, in fiscal 2017, the Company contributed $1,000,000 to each of the plans, which well exceeded the cash outflows for benefit payments. The combination of better than expected returns, higher funding levels and increase in the discount rate improved the funded status of the pension and postretirement plans by $3,143,000 and $2,406,000, respectively. The combination of higher asset totals and higher discount rate also served to reduce pension and postretirement expense in fiscal 2018.
Funded status - September 30, 2017 | Pension | Postretirement | Total | ||||||||
Benefit Obligation | $ | 29,657,347 | $ | 17,666,812 | $ | 47,324,159 | |||||
Fair value of assets | 26,418,671 | 12,691,162 | 39,109,833 | ||||||||
Funded status | $ | (3,238,676 | ) | $ | (4,975,650 | ) | $ | (8,214,326 | ) | ||
Funded status - September 30, 2016 | Pension | Postretirement | Total | ||||||||
Benefit Obligation | $ | 29,494,950 | $ | 18,504,710 | $ | 47,999,660 | |||||
Fair value of assets | 23,113,057 | 11,122,783 | 34,235,840 | ||||||||
Funded status | $ | (6,381,893 | ) | $ | (7,381,927 | ) | $ | (13,763,820 | ) | ||
Accurately forecasting future interest rates and investment returns is nearly impossible. Interest rates have been low for several years and just recently began to move higher. Investment returns from the equity market have been strong the last two years; however, concern exists that current market valuations may be too high, which could be a prelude to a market correction. The variability in interest rates and investment returns create the potential for volatility in the Company's benefit plan liabilities, asset values, funded status and expense. Increasing interest rates would serve to reduce the benefit liabilities but may negatively impact returns on fixed income investments in the short-term, while a decline in interest rates would increase benefit liabilities and provide a short-term boost to fixed income returns. Equity
26
markets could experience a decline in the next year, which would reduce plan assets and negatively affect the funded status of the plans, or equities could continue their strong performance and improve the funded status of the plans. The Company cannot control the direction of interest rates or asset returns. However the Company annually evaluates the returns on its targeted investment allocation model as well as the overall asset allocation of its benefit plans. The investment policy as of the measurement date in September reflected a targeted allocation of 60% equity and 40% fixed income on the pension plan and a targeted allocation of 50% equity and 50% fixed income for the postretirement plan. Understanding the volatility in the markets, the Company reviews both plans potential long-term rate of return with their investment advisors in determining the rates used in assumptions. As a result of this evaluation, the Company set its expected long-term annual return on pension assets at 7.00% and postretirement assets at 4.84% (net of income taxes) for fiscal 2018. These rates are consistent with the expected long-term rates used in fiscal 2017 and appear reasonable based on a long-term investment horizon. Management will continue to re-evaluate the return assumptions and asset allocation and adjust both as market conditions warrant.
With the inherent volatility associated with defined benefit plans, the Company continues to seek opportunities to reduce risk and variability related to these plans. The Company implemented a freeze on the postretirement plan effective January 1, 2000, whereby no employees hired on or after that date would participate. Employees and retirees that were eligible at the time of the freeze continued to participate and accrue benefits. With regard to the pension plan, the Company implemented a two-part risk reduction strategy. The first part included a one-time, lump sum pension benefit pay out in fiscal 2016 to vested, terminated employees who were not receiving payments under the pension plan at the time. Approximately 63% of those vested, terminated employees elected to receive their lump sum payment, resulting in a payout of $1,242,000 from plan assets in September 2016. These lump sum payments removed approximately $1,500,000 in pension plan liabilities and reduced the number of participants on which the Pension Benefit Guaranty Corporation ("PBGC") premiums are determined. The second part was to take action on the pension plan similar to what was done with the postretirement plan back in 2000 by closing the pension plan to new employees effective January 1, 2017. Employees hired prior to that date will continue to accrue benefits. This "soft freeze" of the pension plan will not provide immediate relief to the Plan in the form of reduced liabilities and lower expenses; but, absent changes in other variables, pension liability growth will slow and eventually decline as no new participants will enter the pension plan. Likewise, pension expense will reflect this change in the future as less service cost is accrued due to fewer active employees in the pension plan. Furthermore, as the funded status of the plans improve, the Company will evaluate the possibility of revising its asset allocation targets to more closely correlate to the corresponding plan liabilities. Essentially, the goal would be to match investment maturities to the timing of payment of benefits under the plans. During the current fiscal year, the Company transitioned the fixed income portion of its pension assets into liability driven investing ("LDI"). Under the LDI approach, the fixed income portion of the investments are allocated to one of three separate fixed income investments that corresponded to the duration of the liabilities of the pension plan; a short duration investment, a middle duration investment and a longer-term duration investment. No fundamental change has been made to the overall asset allocation between fixed income and equity other than adjusting the duration of the fixed income portion. The matching of the asset and liability durations should ultimately reduce some of the volatility in these plans.
In August 2014, the Highway and Transportation Funding Act of 2014 (“HATFA”) was signed into law, which included a provision to extend the interest rate corridors introduced in 2012 under the Moving Ahead for Progress in the 21st Century Act (“MAP-21”). MAP-21 provided temporary funding relief for defined benefit pension plans. The requirements of the Employee Retirement Income Security Act of 1974 (ERISA) and the Pension Protection Act of 2006 (PPA) subject defined benefit plans to minimum funding rules. As a result, when interest rates are low, pension plan liabilities increase thereby resulting in higher mandatory contributions to meet minimum funding obligations. MAP-21 provided funding relief by allowing pension plans to adjust the interest rates used in determining funding requirements so that they are within 10% of the average of interest rates for the 25-year period preceding the current year for funding calculations for 2013 to within 30% for funding periods beginning in 2016. HATFA extended the period of time that the 10% corridor instituted by MAP-21 may be used for funding calculations. Under HATFA, the 10% corridor extends through plan years that begin in 2017 and phases out to a 30% corridor in 2021 and later. HATFA significantly increases the effective interest rates used in determining funding requirements and could result in a deterioration of the pension plan funded status resulting in much greater funding requirements in the future as well as higher PBGC premiums paid by sponsors of pension plans to protect participants in the event of default by the employer. Management estimates that, under the provisions of HATFA, the Company will have no minimum funding requirements next year. Although HATFA and MAP-21 allow the Company some funding relief, management expects to continue its pension funding plan by contributing at least the minimum annual pension contribution requirement or its expense level for subsequent years. The Company currently expects to contribute approximately $1,600,000 to its pension plan and $600,000 to its postretirement plan in fiscal 2018 with a continuing goal to improve both plans' funded status. The Company will continue to evaluate its benefit plan funding levels in light of funding requirements
27
and ongoing investment returns and make adjustments, as necessary, to avoid benefit restrictions and minimize PBGC premiums.
The following schedule reflects the sensitivity of pension costs to changes in certain actuarial assumptions, assuming that the other components of the calculation remain constant.
Actuarial Assumptions - Pension Plan | Change in Assumption | Increase in Pension Cost | Increase in Projected Benefit Obligation | |||||||
Discount rate | -0.25 | % | $ | 123,000 | $ | 1,225,000 | ||||
Rate of return on plan assets | -0.25 | % | 66,000 | N/A | ||||||
Rate of increase in compensation | 0.25 | % | 53,000 | 292,000 | ||||||
The following schedule reflects the sensitivity of postretirement benefit costs from changes in certain actuarial assumptions, while the other components of the calculation remain constant.
Actuarial Assumptions - Postretirement Plan | Change in Assumption | Increase in Postretirement Benefit Cost | Increase in Accumulated Postretirement Benefit Obligation | |||||||
Discount rate | -0.25 | % | $ | 1,000 | $ | 747,000 | ||||
Rate of return on plan assets | -0.25 | % | 29,000 | N/A | ||||||
Medical claim cost increase | 0.25 | % | 45,000 | 723,000 | ||||||
Derivatives - The Company may hedge certain risks incurred in its operation through the use of derivative instruments. The Company applies the requirements of FASB ASC No. 815, Derivatives and Hedging, which requires the recognition of derivative instruments as assets or liabilities in the Company’s balance sheet at fair value. In most instances, fair value is based upon quoted futures prices for natural gas commodities and interest rate futures for interest rate swaps. Changes in the commodity and futures markets will impact the estimates of fair value in the future. Furthermore, the actual market value at the point of realization of the derivative may be significantly different from the values used in determining fair value in prior financial statements. The Company had one interest-rate swap outstanding at September 30, 2017 related to the 5-year $7,000,000 variable-rate note. This swap agreement, which was entered into on November 1, 2016, becomes effective November 1, 2017.
Tax Reform
Federal corporate tax reform is currently a major legislative agenda item. There continues to be discussion regarding tax legislation and improving the corporate tax environment in the United States in an effort to encourage domestic business development. The key proposal is a reduction in corporate income tax rates. In general, a change in corporate income tax rates would not only reduce current income tax expense but also result in an adjustment to the value of deferred income tax balances. According to ASC 740-10, deferred tax assets and liabilities shall be adjusted for the effect of a change in tax laws and rates and the effect of such change shall be included in income from continuing operations for the period that includes the date of enactment. If lower federal corporate tax rates are passed, deferred income taxes at the date of enactment would be reduced and the net benefit or expense would flow through income tax expense. However, for Roanoke Gas, any adjustment to deferred taxes would not be reflected in the income statement. Instead, under the requirements of regulatory accounting, those excess deferred taxes would be reclassified to a regulatory liability to be refunded to the utility's customers, as the Company's non gas rates provided for the recovery of income taxes at a federal tax rate of 34%. As of September 30, 2017, the Company has a net deferred tax liability of approximately $23,100,000 of which Roanoke Gas represented approximately $23,900,000 of that balance while the unregulated operations of Resources had a net deferred tax asset of $800,000. If a corporate tax rate decrease becomes law, then for every one percent decrease in the federal corporate tax rate, approximately $600,000 would be transferred to a regulatory liability and $20,000 would be reflected as additional income tax expense in comprehensive income. Other proposed tax law changes may have impacts, both favorable or unfavorable, to the Company's tax expense and deferred tax balances. No adjustment will be made to deferred taxes or income tax expense until such time as any proposed tax legislation is signed into law.
28
Item 7A. | Quantitative and Qualitative Disclosures About Market Risk. |
The Company is exposed to market risks associated with interest rates and commodity prices. Interest rate risk is related to the Company’s outstanding variable rate debt. Commodity price risk is experienced by the Company’s regulated natural gas operations. The Company’s risk management policy, as authorized by the Company’s Board of Directors, allows management to enter into derivatives for the purpose of managing commodity and financial market risks of its business operations.
Interest Rate Risk
The Company is exposed to market risk related to changes in interest rates associated with its borrowing activities. As of September 30, 2017, the Company has $17,791,760 outstanding under its variable-rate line-of-credit with an average balance outstanding during the year of $10,936,114. The Company also had $6,312,200 outstanding under a 5-year variable rate term loan and $7,000,000 outstanding on a another 5-year variable-rate which has a fixed rate swap effective November 1, 2017. A hypothetical 100 basis point increase in market interest rates applicable to the Company’s variable-rate debt outstanding during the year would have resulted in an increase in interest expense for the current year of approximately $223,000. The Company’s remaining debt is at a fixed rate.
Commodity Price Risk
The Company is also exposed to market risks through its natural gas operations associated with commodity prices. The Company’s hedging and derivatives policy, as authorized by the Company’s Board of Directors, allows management to enter into both physical and financial transactions for the purpose of managing the commodity risk of its business operations. The policy also specifies that the combination of all commodity hedging contracts for any 12-month period shall not exceed a total hedged volume of 90% of projected volumes. The policy specifically prohibits the use of derivatives for the purposes of speculation.
The Company manages the price risk associated with purchases of natural gas by using a combination of liquefied natural gas (LNG) storage, underground storage gas, fixed price contracts, spot market purchases and derivative commodity instruments including futures, price caps, swaps and collars.
At September 30, 2017, the Company had no outstanding derivative instruments to hedge the price of natural gas. The Company had approximately 2,388,000 decatherms of gas in storage, including LNG, at an average price of $3.23 per decatherm compared to 2,537,000 decatherms at an average price of $2.93 per decatherm last year. The SCC currently allows for full recovery of prudent costs associated with natural gas purchases, and any additional costs or benefits associated with the settlement of derivative contracts and other price hedging techniques are passed through to customers when realized through the regulated natural gas PGA mechanism.
Item 8. | Financial Statements and Supplementary Data. |
29
RGC Resources, Inc.
and Subsidiaries
Consolidated Financial Statements
for the Years Ended September 30, 2017, 2016
and 2015, and Report of Independent
Registered Public Accounting Firm
30
RGC RESOURCES, INC. AND SUBSIDIARIES
TABLE OF CONTENTS
Page | |
Consolidated Financial Statements for the Years Ended September 30, 2017, 2016 and 2015: | |
31

REPORT OF INDEPENDENT REGISTERED PUBLIC ACCOUNTING FIRM
Board of Directors and Stockholders
RGC Resources, Inc.
Roanoke, Virginia
We have audited the accompanying consolidated balance sheets of RGC Resources, Inc. and Subsidiaries (“the Company”) as of September 30, 2017 and 2016, and the related consolidated statements of income, comprehensive income, stockholders' equity, and cash flows for each of the years in the three-year period ended September 30, 2017. RGC Resources, Inc.’s management is responsible for these financial statements. Our responsibility is to express an opinion on these consolidated financial statements based on our audits.
We conducted our audits in accordance with the standards of the Public Company Accounting Oversight Board (United States). Those standards require that we plan and perform the audit to obtain reasonable assurance about whether the financial statements are free of material misstatement. An audit includes examining, on a test basis, evidence supporting the amounts and disclosures in the financial statements. An audit also includes assessing the accounting principles used and significant estimates made by management, as well as evaluating the overall financial statement presentation. We believe that our audits provide a reasonable basis for our opinion.
In our opinion, the consolidated financial statements referred to above present fairly, in all material respects, the financial position of RGC Resources, Inc. and Subsidiaries as of September 30, 2017 and 2016, and the consolidated results of its operations and its cash flows for each of the years in the three-year period ended September 30, 2017, in conformity with accounting principles generally accepted in the United States of America.
We have also audited, in accordance with the standards of the Public Company Accounting Oversight Board (United States), RGC Resources, Inc. and Subsidiaries’ internal control over financial reporting as of September 30, 2017, based on criteria established in Internal Control-Integrated Framework - 2013 issued by the Committee of Sponsoring Organizations of the Treadway Commission (COSO), and our report dated December 8, 2017 expressed an unqualified opinion.
 |
CERTIFIED PUBLIC ACCOUNTANTS |
Blacksburg, Virginia
December 8, 2017
32
RGC RESOURCES, INC. AND SUBSIDIARIES
CONSOLIDATED BALANCE SHEETS
AS OF SEPTEMBER 30, 2017 AND 2016
2017 | 2016 | ||||||
ASSETS | |||||||
CURRENT ASSETS: | |||||||
Cash and cash equivalents | $ | 69,640 | $ | 643,252 | |||
Accounts receivable, net | 3,492,703 | 3,478,983 | |||||
Materials and supplies | 1,021,191 | 824,139 | |||||
Gas in storage | 7,701,894 | 7,436,785 | |||||
Prepaid income taxes | 1,796,825 | 1,550,836 | |||||
Interest rate swap | 26,777 | — | |||||
Other | 1,576,574 | 1,548,329 | |||||
Total current assets | 15,685,604 | 15,482,324 | |||||
UTILITY PROPERTY: | |||||||
In service | 204,223,714 | 185,577,286 | |||||
Accumulated depreciation and amortization | (59,765,987 | ) | (56,156,287 | ) | |||
In service, net | 144,457,727 | 129,420,999 | |||||
Construction work in progress | 3,470,244 | 2,707,139 | |||||
Utility plant, net | 147,927,971 | 132,128,138 | |||||
OTHER ASSETS: | |||||||
Regulatory assets | 11,796,260 | 14,332,451 | |||||
Investment in unconsolidated affiliate | 7,445,106 | 3,496,404 | |||||
Interest rate swap | 90,066 | — | |||||
Other | 190,064 | 113,532 | |||||
Total other assets | 19,521,496 | 17,942,387 | |||||
TOTAL ASSETS | $ | 183,135,071 | $ | 165,552,849 | |||
(Continued)
33
RGC RESOURCES, INC. AND SUBSIDIARIES
CONSOLIDATED BALANCE SHEETS
AS OF SEPTEMBER 30, 2017 AND 2016
2017 | 2016 | ||||||
LIABILITIES AND STOCKHOLDERS’ EQUITY | |||||||
CURRENT LIABILITIES: | |||||||
Line-of-credit | $ | — | $ | 14,556,785 | |||
Dividends payable | 1,050,281 | 970,244 | |||||
Accounts payable | 5,122,899 | 5,345,575 | |||||
Capital contributions payable | 1,055,504 | 287,794 | |||||
Customer credit balances | 1,220,578 | 1,605,608 | |||||
Customer deposits | 1,471,960 | 1,627,105 | |||||
Accrued expenses | 3,006,936 | 3,194,255 | |||||
Over-recovery of gas costs | 1,438,074 | 909,687 | |||||
Total current liabilities | 14,366,232 | 28,497,053 | |||||
LONG-TERM DEBT: | |||||||
Notes payable | 43,812,200 | 33,896,200 | |||||
Line-of-credit | 17,791,760 | — | |||||
Less unamortized debt issuance costs | (291,949 | ) | (260,149 | ) | |||
Long-term debt net of unamortized debt issuance costs | 61,312,011 | 33,636,051 | |||||
DEFERRED CREDITS AND OTHER LIABILITIES: | |||||||
Asset retirement obligations | 6,069,993 | 5,682,556 | |||||
Regulatory cost of retirement obligations | 10,055,189 | 9,348,443 | |||||
Benefit plan liabilities | 8,214,326 | 13,763,820 | |||||
Deferred income taxes | 23,076,848 | 18,957,854 | |||||
Total deferred credits and other liabilities | 47,416,356 | 47,752,673 | |||||
COMMITMENTS AND CONTINGENCIES (Note 11) | |||||||
CAPITALIZATION: | |||||||
Stockholders’ Equity: | |||||||
Common Stock, $5 par value; authorized 10,000,000 shares; issued and outstanding 7,240,846 and 7,182,434 shares in 2017 and 2016, respectively | 36,204,230 | 23,941,445 | |||||
Preferred stock, no par; authorized 5,000,000 shares; no shares issued and outstanding in 2017 and 2016 | — | — | |||||
Capital in excess of par value | 292,485 | 9,509,548 | |||||
Retained earnings | 24,746,021 | 24,713,310 | |||||
Accumulated other comprehensive loss | (1,202,264 | ) | (2,497,231 | ) | |||
Total stockholders’ equity | 60,040,472 | 55,667,072 | |||||
TOTAL LIABILITIES AND STOCKHOLDERS’ EQUITY | $ | 183,135,071 | $ | 165,552,849 | |||
(Concluded)
See notes to consolidated financial statements.
34
RGC RESOURCES, INC. AND SUBSIDIARIES
CONSOLIDATED STATEMENTS OF INCOME
YEARS ENDED SEPTEMBER 30, 2017, 2016 AND 2015
2017 | 2016 | 2015 | |||||||||
OPERATING REVENUES: | |||||||||||
Gas utilities | $ | 61,252,015 | $ | 58,079,990 | $ | 67,094,290 | |||||
Other | 1,044,855 | 983,301 | 1,095,317 | ||||||||
Total operating revenues | 62,296,870 | 59,063,291 | 68,189,607 | ||||||||
COST OF SALES: | |||||||||||
Gas utilities | 28,919,625 | 27,009,330 | 37,437,315 | ||||||||
Other | 568,088 | 489,047 | 545,859 | ||||||||
Total cost of sales | 29,487,713 | 27,498,377 | 37,983,174 | ||||||||
GROSS MARGIN | 32,809,157 | 31,564,914 | 30,206,433 | ||||||||
OTHER OPERATING EXPENSES: | |||||||||||
Operations and maintenance | 13,100,041 | 13,098,086 | 13,486,885 | ||||||||
General taxes | 1,786,070 | 1,663,126 | 1,606,421 | ||||||||
Depreciation and amortization | 6,256,737 | 5,591,610 | 5,106,935 | ||||||||
Total other operating expenses | 21,142,848 | 20,352,822 | 20,200,241 | ||||||||
OPERATING INCOME | 11,666,309 | 11,212,092 | 10,006,192 | ||||||||
Equity in earnings of unconsolidated affiliate | 421,646 | 152,864 | — | ||||||||
Other expense, net | 132,446 | 255,585 | 228,796 | ||||||||
Interest expense | 1,917,254 | 1,636,321 | 1,512,419 | ||||||||
INCOME BEFORE INCOME TAXES | 10,038,255 | 9,473,050 | 8,264,977 | ||||||||
INCOME TAX EXPENSE | 3,805,390 | 3,666,184 | 3,170,562 | ||||||||
NET INCOME | $ | 6,232,865 | $ | 5,806,866 | $ | 5,094,415 | |||||
EARNINGS PER COMMON SHARE: | |||||||||||
Basic | $ | 0.86 | $ | 0.81 | $ | 0.72 | |||||
Diluted | $ | 0.86 | $ | 0.81 | $ | 0.72 | |||||
WEIGHTED AVERAGE SHARES OUTSTANDING: | |||||||||||
Basic | 7,218,686 | 7,149,906 | 7,092,315 | ||||||||
Diluted | 7,256,046 | 7,159,763 | 7,097,514 | ||||||||
See notes to consolidated financial statements.
35
RGC RESOURCES, INC. AND SUBSIDIARIES
CONSOLIDATED STATEMENTS OF COMPREHENSIVE INCOME
YEARS ENDED SEPTEMBER 30, 2017, 2016 AND 2015
2017 | 2016 | 2015 | |||||||||
NET INCOME | $ | 6,232,865 | $ | 5,806,866 | $ | 5,094,415 | |||||
Other comprehensive income, net of tax: | |||||||||||
Interest rate swaps | 72,489 | — | — | ||||||||
Defined benefit plans | 1,222,478 | (210,686 | ) | (1,147,219 | ) | ||||||
OTHER COMPREHENSIVE INCOME (LOSS), NET OF TAX | 1,294,967 | (210,686 | ) | (1,147,219 | ) | ||||||
COMPREHENSIVE INCOME | $ | 7,527,832 | $ | 5,596,180 | $ | 3,947,196 | |||||
See notes to consolidated financial statements.
36
RGC RESOURCES, INC. AND SUBSIDIARIES
CONSOLIDATED STATEMENTS OF STOCKHOLDERS’ EQUITY
YEARS ENDED SEPTEMBER 30, 2017, 2016 AND 2015
Common Stock | Capital in Excess of Par Value | Retained Earnings | Accumulated Other Comprehensive Income (Loss) | Total Stockholders’ Equity | |||||||||||||||
Balance - September 30, 2014 | $ | 23,601,890 | $ | 8,237,228 | $ | 21,321,055 | $ | (1,139,326 | ) | $ | 52,020,847 | ||||||||
Net income | — | — | 5,094,415 | — | 5,094,415 | ||||||||||||||
Other comprehensive loss | — | — | — | (1,147,219 | ) | (1,147,219 | ) | ||||||||||||
Exercise of stock options (3,900 shares) | 13,000 | 36,366 | — | — | 49,366 | ||||||||||||||
Stock option grants | — | 83,640 | — | — | 83,640 | ||||||||||||||
Cash dividends declared ($0.51 per share) | — | — | (3,643,093 | ) | — | (3,643,093 | ) | ||||||||||||
Issuance of common stock (27,780 shares) | 92,600 | 290,435 | — | — | 383,035 | ||||||||||||||
Balance - September 30, 2015 | $ | 23,707,490 | $ | 8,647,669 | $ | 22,772,377 | $ | (2,286,545 | ) | $ | 52,840,991 | ||||||||
Net income | — | — | 5,806,866 | — | 5,806,866 | ||||||||||||||
Other comprehensive loss | — | — | — | (210,686 | ) | (210,686 | ) | ||||||||||||
Exercise of stock options (3,300 shares) | 11,000 | 30,762 | — | — | 41,762 | ||||||||||||||
Stock option grants | — | 64,640 | — | — | 64,640 | ||||||||||||||
Cash dividends declared ($0.54 per share) | — | — | (3,865,933 | ) | — | (3,865,933 | ) | ||||||||||||
Issuance of common stock (66,887 shares) | 222,955 | 766,477 | — | — | 989,432 | ||||||||||||||
Balance - September 30, 2016 | $ | 23,941,445 | $ | 9,509,548 | $ | 24,713,310 | $ | (2,497,231 | ) | $ | 55,667,072 | ||||||||
Net income | — | — | 6,232,865 | — | 6,232,865 | ||||||||||||||
Other comprehensive income | — | — | — | 1,294,967 | 1,294,967 | ||||||||||||||
Exercise of stock options (11,225 shares) | 50,250 | 91,991 | — | — | 142,241 | ||||||||||||||
Stock option grants | — | 73,780 | — | — | 73,780 | ||||||||||||||
Cash dividends declared ($0.58 per share) | — | — | (4,195,910 | ) | — | (4,195,910 | ) | ||||||||||||
Stock split | 12,029,790 | (10,025,546 | ) | (2,004,244 | ) | — | — | ||||||||||||
Issuance costs | — | (96,508 | ) | — | — | (96,508 | ) | ||||||||||||
Issuance of common stock (47,187 shares) | 182,745 | 739,220 | — | — | 921,965 | ||||||||||||||
Balance - September 30, 2017 | $ | 36,204,230 | $ | 292,485 | $ | 24,746,021 | $ | (1,202,264 | ) | $ | 60,040,472 | ||||||||
See notes to consolidated financial statements.
37
RGC RESOURCES, INC. AND SUBSIDIARIES
CONSOLIDATED STATEMENTS OF CASH FLOWS
YEARS ENDED SEPTEMBER 30, 2017, 2016 AND 2015
2017 | 2016 | 2015 | |||||||||
CASH FLOWS FROM OPERATING ACTIVITIES: | |||||||||||
Net income | $ | 6,232,865 | $ | 5,806,866 | $ | 5,094,415 | |||||
Adjustments to reconcile net income to net cash provided by operations: | |||||||||||
Depreciation and amortization | 6,378,368 | 5,709,525 | 5,219,893 | ||||||||
Cost of retirement of utility plant, net | (354,744 | ) | (449,201 | ) | (406,731 | ) | |||||
Stock option grants | 73,780 | 64,640 | 83,640 | ||||||||
Equity in earnings of unconsolidated affiliate | (421,646 | ) | (152,864 | ) | — | ||||||
Deferred income taxes | 3,325,379 | 4,466,954 | 2,416,841 | ||||||||
Other noncash items, net | 203,743 | 197,298 | 105,815 | ||||||||
Changes in assets and liabilities which provided (used) cash: | |||||||||||
Accounts receivable and customer deposits, net | (191,386 | ) | (258,960 | ) | 638,917 | ||||||
Inventories and gas in storage | (462,161 | ) | 867,682 | 3,168,056 | |||||||
Over/under recovery of gas costs | 528,387 | (991,739 | ) | 2,082,257 | |||||||
Other assets | (956,894 | ) | (398,864 | ) | (768,922 | ) | |||||
Accounts payable, customer credit balances and accrued expenses, net | (1,374,713 | ) | 60,303 | (873,354 | ) | ||||||
Total adjustments | 6,748,113 | 9,114,774 | 11,666,412 | ||||||||
Net cash provided by operating activities | 12,980,978 | 14,921,640 | 16,760,827 | ||||||||
CASH FLOWS FROM INVESTING ACTIVITIES: | |||||||||||
Expenditures for utility property | (20,750,181 | ) | (17,945,719 | ) | (13,780,356 | ) | |||||
Investment in unconsolidated affiliate | (2,759,346 | ) | (3,055,746 | ) | — | ||||||
Proceeds from disposal of utility property | 16,972 | 4,964 | 30,082 | ||||||||
Net cash used in investing activities | (23,492,555 | ) | (20,996,501 | ) | (13,750,274 | ) | |||||
CASH FLOWS FROM FINANCING ACTIVITIES: | |||||||||||
Borrowings under line-of-credit | 42,569,303 | 38,310,326 | 34,698,924 | ||||||||
Repayments under line-of-credit | (39,334,328 | ) | (33,094,539 | ) | (34,402,977 | ) | |||||
Proceeds from issuance of unsecured notes | 9,916,000 | 3,396,200 | — | ||||||||
Debt issuance expenses | (64,835 | ) | (101,619 | ) | — | ||||||
Proceeds from issuance of stock | 967,698 | 1,031,194 | 432,401 | ||||||||
Cash dividends paid | (4,115,873 | ) | (3,808,683 | ) | (3,603,424 | ) | |||||
Net cash provided by (used in) financing activities | 9,937,965 | 5,732,879 | (2,875,076 | ) | |||||||
NET INCREASE (DECREASE) IN CASH AND CASH EQUIVALENTS | (573,612 | ) | (341,982 | ) | 135,477 | ||||||
CASH AND CASH EQUIVALENTS AT BEGINNING OF YEAR | 643,252 | 985,234 | 849,757 | ||||||||
CASH AND CASH EQUIVALENTS AT END OF YEAR | $ | 69,640 | $ | 643,252 | $ | 985,234 | |||||
SUPPLEMENTAL DISCLOSURE OF CASH FLOW INFORMATION: | |||||||||||
Cash paid (refunded) during the year for: | |||||||||||
Interest | $ | 1,734,178 | $ | 1,480,665 | $ | 1,002,462 | |||||
Income taxes | 726,000 | (907,000 | ) | 1,266,573 | |||||||
See notes to consolidated financial statements.
38
RGC RESOURCES, INC. AND SUBSIDIARIES
NOTES TO CONSOLIDATED FINANCIAL STATEMENTS
YEARS ENDED SEPTEMBER 30, 2017, 2016 AND 2015
1. | SUMMARY OF SIGNIFICANT ACCOUNTING POLICIES |
Principles of Consolidation—RGC Resources, Inc. is an energy services company primarily engaged in the sale and distribution of natural gas. The consolidated financial statements include the accounts of RGC Resources, Inc. and its wholly owned subsidiaries (“Resources” or the “Company”): Roanoke Gas Company (“Roanoke Gas”); Diversified Energy Company; RGC Ventures of Virginia, Inc., operating as Application Resources and The Utility Consultants; and RGC Midstream, LLC. Roanoke Gas is a natural gas utility, which distributes and sells natural gas to approximately 59,800 residential, commercial and industrial customers within its service areas in Roanoke, Virginia and the surrounding localities. The Company’s business is seasonal in nature as a majority of natural gas sales are for space heating during the winter season. Roanoke Gas is regulated by the Virginia State Corporation Commission (“SCC” or “Virginia Commission”). RGC Ventures of Virginia, Inc. was dissolved in 2016 after Application Resources, which provided information system services to software providers in the utility industry, ceased operations in 2016, and The Utility Consultants, which provided regulatory consulting services to other utilities, ceased operations in 2015. RGC Midstream, LLC is a wholly-owned subsidiary created in 2015 to invest in the Mountain Valley pipeline project. Diversified Energy Company is currently inactive.
The Company follows accounting and reporting standards established by the Financial Accounting Standards Board (“FASB”) and the Securities and Exchange Commission (“SEC”).
Resources has only one reportable segment as defined under FASB ASC No. 280 – Segment Reporting. All intercompany transactions have been eliminated in consolidation.
Rate Regulated Basis of Accounting—The Company’s regulated operations follow the accounting and reporting requirements of FASB ASC No. 980, Regulated Operations. The economic effects of regulation can result in a regulated company deferring costs that have been or are expected to be recovered from customers in a period different from the period in which the costs would be charged to expense by an unregulated enterprise. When this situation occurs, costs are deferred as assets in the consolidated balance sheet (regulatory assets) and recorded as expenses when such amounts are reflected in rates. Additionally, regulators can impose liabilities upon a regulated company for amounts previously collected from customers and for current collection in rates of costs that are expected to be incurred in the future (regulatory liabilities). In the event the provisions of FASB ASC No. 980 no longer apply to any or all regulatory assets or liabilities, the Company would write off such amounts and include them in the consolidated statements of income and comprehensive income in the period for which FASB ASC No. 980 no longer applied.
39
Regulatory assets and liabilities included in the Company’s consolidated balance sheets as of September 30, 2017 and 2016 are as follows:
September 30 | ||||||||
2017 | 2016 | |||||||
Regulatory Assets: | ||||||||
Current Assets: | ||||||||
Accounts receivable: | ||||||||
Accrued WNA revenues | $ | 248,840 | $ | 148,663 | ||||
Other: | ||||||||
Accrued pension and postretirement medical | 658,786 | 835,704 | ||||||
Utility Property: | ||||||||
In service: | ||||||||
Other | 11,945 | 11,945 | ||||||
Other Assets: | ||||||||
Regulatory assets: | ||||||||
Premium on early retirement of debt | 1,941,182 | 2,055,369 | ||||||
Accrued pension and postretirement medical | 8,643,524 | 11,460,738 | ||||||
Other | 1,211,554 | 816,344 | ||||||
Total regulatory assets | $ | 12,715,831 | $ | 15,328,763 | ||||
Regulatory Liabilities: | ||||||||
Current Liabilities: | ||||||||
Over-recovery of gas costs | $ | 1,438,074 | $ | 909,687 | ||||
Accrued expenses: | ||||||||
Over-recovery of SAVE Plan revenues | 215,514 | 238,694 | ||||||
Deferred Credits and Other Liabilities: | ||||||||
Asset retirement obligations | 6,069,993 | 5,682,556 | ||||||
Regulatory cost of retirement obligations | 10,055,189 | 9,348,443 | ||||||
Total regulatory liabilities | $ | 17,778,770 | $ | 16,179,380 | ||||
As of September 30, 2017, the Company had regulatory assets in the amount of $12,703,886 on which the Company did not earn a return during the recovery period. These assets primarily pertain to the net funded position of the Company’s benefit plans related to its regulated operations. As such, the amortization period is not specifically defined.
Utility Plant and Depreciation—Utility plant is stated at original cost and includes direct labor and materials, contractor costs, and all allocable overhead charges. The Company applies the group method of accounting, where the costs of like assets are aggregated and depreciated by applying a rate based on the average expected useful life of the assets. In accordance with Company policy, expenditures for depreciable assets with a life greater than one year are capitalized, along with any upgrades or improvements to existing assets, when they significantly improve or extend the original expected useful life of an asset. Expenditures for maintenance, repairs, and minor renewals and betterments are expensed as incurred. The original cost of depreciable property retired is removed from utility plant and charged to accumulated depreciation. The cost of asset removals, less salvage, is charged to “regulatory cost of retirement obligations” or “asset retirement obligations” as explained under Asset Retirement Obligations below.
Utility plant is composed of the following major classes of assets:
Years Ended September 30 | ||||||||
2017 | 2016 | |||||||
Distribution and transmission | $ | 177,845,619 | $ | 160,354,300 | ||||
LNG storage | 13,299,288 | 12,594,294 | ||||||
General and miscellaneous | 13,078,807 | 12,628,692 | ||||||
Total utility plant in service | $ | 204,223,714 | $ | 185,577,286 | ||||
40
Provisions for depreciation are computed principally at composite straight-line rates over periods ranging from 5 to 76 years. Rates are determined by depreciation studies which are required to be performed at least every 5 years on the regulated utility assets of Roanoke Gas. The Company completed its last depreciation study in June 2014. The composite weighted-average depreciation rate realized using the most recently completed depreciation study was 3.29% for the fiscal year ended September 30, 2017 and 3.25% for the fiscal years ended September 30, 2016 and 2015.
The composite rates are composed of two components, one based on average service life and one based on cost of retirement. As a result, the Company accrues the estimated cost of retirement of long-lived assets through depreciation expense. Retirement costs are not a legal obligation but rather the result of cost-based regulation and are accounted for under the provisions of FASB ASC No. 980. Such amounts are classified as a regulatory liability.
The Company reviews long-lived assets and certain identifiable intangibles for impairment whenever events or changes in circumstances indicate that the carrying amount of an asset may not be recoverable. These reviews have not identified any impairments which would have a material effect on the results of operations or financial condition.
Asset Retirement Obligations—FASB ASC No. 410, Asset Retirement and Environmental Obligations, requires entities to record the fair value of a liability for an asset retirement obligation when there exists a legal obligation for the retirement of the asset. When the liability is initially recorded, the entity capitalizes the cost, thereby increasing the carrying amount of the underlying asset. In subsequent periods, the liability is accreted, and the capitalized cost is depreciated over the useful life of the underlying asset. The Company has recorded asset retirement obligations for its future legal obligations related to purging and capping its distribution mains and services upon retirement, although the timing of such retirements is uncertain.
The Company’s composite depreciation rates include a component to provide for the cost of retirement of assets. As a result, the Company accrues the estimated cost of retirement of its utility plant through depreciation expense and creates a corresponding regulatory liability. The costs of retirement considered in the development of the depreciation component include those costs associated with the legal liability. Therefore, the asset retirement obligation is reclassified from the regulatory cost of retirement obligation. If the legal obligations were to exceed the regulatory liability provided for in the depreciation rates, the Company would establish a regulatory asset for such difference with the anticipation of future recovery through rates charged to customers. In 2017, the Company increased its asset retirement obligation to reflect revisions to the estimated cash flows for asset retirements.
The following is a summary of the asset retirement obligation:
Years Ended September 30 | ||||||||
2017 | 2016 | |||||||
Beginning balance | $ | 5,682,556 | $ | 5,295,868 | ||||
Liabilities incurred | 65,556 | 85,263 | ||||||
Liabilities settled | (137,304 | ) | (176,090 | ) | ||||
Accretion | 312,503 | 310,568 | ||||||
Revisions to estimated cash flows | 146,682 | 166,947 | ||||||
Ending balance | $ | 6,069,993 | $ | 5,682,556 | ||||
Cash, Cash Equivalents and Short-Term Investments—From time to time, the Company will have balances on deposit at banks in excess of the amount insured by the Federal Deposit Insurance Corporation (“FDIC”). The Company has not experienced any losses on these accounts and does not consider these amounts to be at credit risk. As of September 30, 2017, the Company did not have any bank deposits in excess of the FDIC insurance limits. For purposes of the consolidated statements of cash flows, the Company considers all highly liquid debt instruments purchased with an original maturity of three months or less to be cash equivalents.
Customer Receivables and Allowance for Doubtful Accounts—Accounts receivable include amounts billed to customers for natural gas sales and related services and gas sales occurring subsequent to normal billing cycles but before the end of the period. The Company provides an estimate for losses on these receivables by utilizing historical information, current account balances, account aging and current economic conditions. Customer accounts are charged off annually when deemed uncollectible or when turned over to a collection agency for action.
41
A reconciliation of changes in the allowance for doubtful accounts is as follows:
Years Ended September 30 | ||||||||||||
2017 | 2016 | 2015 | ||||||||||
Beginning balance | $ | 76,934 | $ | 52,721 | $ | 70,747 | ||||||
Provision for doubtful accounts | 84,587 | 14,074 | 87,908 | |||||||||
Recoveries of accounts written off | 110,725 | 137,055 | 139,282 | |||||||||
Accounts written off | (172,790 | ) | (126,916 | ) | (245,216 | ) | ||||||
Ending balance | $ | 99,456 | $ | 76,934 | $ | 52,721 | ||||||
Financing Receivables—Financing receivables represent a contractual right to receive money either on demand or on fixed or determinable dates and are recognized as assets on the entity’s balance sheet. Trade receivables are the Company's one primary type of financing receivables, resulting from the sale of natural gas and other services to its customers. These receivables are short-term in nature with a provision for uncollectible balances included in the financial statements.
Inventories—Inventories, consisting of natural gas in storage and materials and supplies, are recorded at average cost. Injections into storage are priced at the purchase cost at the time of injection and withdrawals from storage are priced at the weighted average price in storage. Materials and supplies are removed from inventory at average cost.
Unbilled Revenues—The Company bills its natural gas customers on a monthly cycle; however, the billing cycle period for most customers does not coincide with the accounting periods used for financial reporting. As the Company recognizes revenue when gas is delivered, an accrual is made to estimate revenues for natural gas delivered to customers but not billed during the accounting period. The amounts of unbilled revenue receivable included in accounts receivable on the consolidated balance sheets at September 30, 2017 and 2016 were $965,683 and $1,004,061, respectively.
Income Taxes—Income taxes are accounted for using the asset and liability method. Under the asset and liability method, deferred tax assets and liabilities are recognized for the estimated future tax consequences attributable to differences between the financial statement carrying amounts of existing assets and liabilities and their respective tax bases. Deferred tax assets and liabilities are measured using enacted tax rates in effect for the years in which those temporary differences are expected to be recovered or settled. A valuation allowance against deferred tax assets is provided if it is more likely than not the deferred tax asset will not be realized. The Company and its subsidiaries file state and federal consolidated income tax returns.
Debt Expenses—Debt issuance expenses are deferred and amortized over the lives of the debt instruments. The unamortized balances are offset against the carrying value of long-term debt.
Over/Under-Recovery of Natural Gas Costs—Pursuant to the provisions of the Company’s Purchased Gas Adjustment (“PGA”) clause, the SCC provides the Company with a method of passing along to its customers increases or decreases in natural gas costs incurred by its regulated operations, including gains and losses on natural gas derivative hedging instruments. On a quarterly basis, the Company files a PGA rate adjustment request with the SCC to adjust the gas cost component of its rates up or down depending on projected price and activity. Once administrative approval is received, the Company adjusts the gas cost component of its rates to reflect the approved amount. As actual costs will differ from the projections used in establishing the PGA rate, the Company may either over-recover or under-recover its actual gas costs during the period. Any difference between actual costs incurred and costs recovered through the application of the PGA is recorded as a regulatory asset or liability. At the end of the deferral period, the balance of the net deferred charge or credit is amortized over an ensuing 12-month period as amounts are reflected in customer billings.
Fair Value—Fair value is defined as the price that would be received to sell an asset or paid to transfer a liability in an orderly transaction between market participants at the measurement date. The Company determines fair value based on the following fair value hierarchy which prioritizes each input to the valuation methods into one of the following three broad levels:
• | Level 1 – Unadjusted quoted prices in active markets for identical assets or liabilities that the Company has the ability to access at the measurement date. |
• | Level 2 – Inputs other than quoted prices in Level 1 that are either for similar assets or liabilities in active markets, quoted prices for identical or similar assets or liabilities in |
42
markets that are not active, inputs other than quoted prices that are observable for the asset or liability, or inputs that are derived principally from or corroborated by observable market data by correlation or other means.
• | Level 3 – Unobservable inputs for the asset or liability where there is little, if any, market activity which require the Company to develop its own assumptions. |
The fair value hierarchy gives the highest priority to unadjusted quoted prices in active markets (Level 1) and the lowest priority to unobservable inputs (Level 3). All fair value disclosures are categorized within one of the three categories in the hierarchy. See fair value disclosures below and in Notes 8 and 12.
Use of Estimates—The preparation of financial statements in conformity with Generally Accepted Accounting Principles in the United States of America requires management to make estimates and assumptions that affect the reported amounts of assets and liabilities, disclosure of contingent liabilities at the date of the financial statements and the reported amounts of revenues and expenses during the reporting period. Actual results could differ from those estimates.
Excise and Sales Taxes—Certain excise and sales taxes imposed by the state and local governments in the Company’s service territory are collected by the Company from its customers. These taxes are accounted for on a net basis and therefore are not included as revenues in the Company’s Consolidated Statements of Income.
Earnings Per Share—Basic earnings per share and diluted earnings per share are calculated by dividing net income by the weighted-average common shares outstanding during the period and the weighted-average common shares outstanding during the period plus dilutive potential common shares, respectively. Dilutive potential common shares are calculated in accordance with the treasury stock method, which assumes that proceeds from the exercise of all options are used to repurchase common stock at market value. The amount of shares remaining after the proceeds are exhausted represents the potentially dilutive effect of the securities. A reconciliation of basic and diluted earnings per share is presented below:
Years Ended September 30 | ||||||||||||
2017 | 2016 | 2015 | ||||||||||
Net Income | $ | 6,232,865 | $ | 5,806,866 | $ | 5,094,415 | ||||||
Weighted-average common shares | 7,218,686 | 7,149,906 | 7,092,315 | |||||||||
Effect of dilutive securities: | ||||||||||||
Options to purchase common stock | 37,360 | 9,857 | 5,199 | |||||||||
Diluted average common shares | 7,256,046 | 7,159,763 | 7,097,514 | |||||||||
Earnings Per Share of Common Stock: | ||||||||||||
Basic | $ | 0.86 | $ | 0.81 | $ | 0.72 | ||||||
Diluted | $ | 0.86 | $ | 0.81 | $ | 0.72 | ||||||
Business and Credit Concentrations—The primary business of the Company is the distribution of natural gas to residential, commercial and industrial customers in its service territories.
No sales to individual customers accounted for more than 5% of total revenue in any period or amounted to more than 5% of total accounts receivable.
Roanoke Gas currently holds the only franchises and certificates of public convenience and necessity to distribute natural gas in its service area. These franchises are effective through January 1, 2036. The Company's current certificates of public convenience and necessity in Virginia are exclusive and are intended for perpetual duration.
Roanoke Gas is served directly by two primary pipelines that provide all of the natural gas supplied to the Company’s customers. Depending upon weather conditions and the level of customer demand, failure of one or both of these transmission pipelines could have a major adverse impact on the Company.
Derivative and Hedging Activities—FASB ASC No. 815, Derivatives and Hedging, requires the recognition of all derivative instruments as assets or liabilities in the Company’s balance sheet and measurement of those instruments at fair value.
43
The Company’s hedging and derivatives policy allows management to enter into derivatives for the purpose of managing the commodity and financial market risks of its business operations. The Company’s hedging and derivatives policy specifically prohibits the use of derivatives for speculative purposes. The key market risks that RGC Resources, Inc. hedges against include the price of natural gas and the cost of borrowed funds.
The Company historically has entered into collars, swaps and caps for the purpose of hedging the price of natural gas in order to provide price stability during the winter months. The fair value of these instruments is recorded in the balance sheet with the offsetting entry to either under-recovery of gas costs or over-recovery of gas costs. Net income and other comprehensive income are not affected by the change in market value as any cost incurred or benefit received from these instruments is recoverable or refunded through the PGA as the SCC allows for full recovery of prudent costs associated with natural gas purchases. At September 30, 2017 and 2016, the Company had no outstanding derivative instruments for the purchase of natural gas.
The Company had one interest rate swap associated with its $7,000,000 term note with Branch Banking & Trust as discussed in Note 6. Effective November 1, 2017, the swap agreement converts the floating rate note based on LIBOR into a fixed rate debt with a 2.30% effective interest rate. The swap qualifies as a cash flow hedge with changes in fair value reported in other comprehensive income. No portion of the swap was deemed ineffective during the period.
The table below reflects the fair value of the derivative instrument and its corresponding classification in the consolidated balance sheets.
September 30 | |||||||
2017 | 2016 | ||||||
Derivatives designated as hedging instruments: | |||||||
Current assets: | |||||||
Interest rate swap | $ | 26,777 | $ | — | |||
Other assets: | |||||||
Interest rate swap | $ | 90,066 | $ | — | |||
Total derivatives designated as hedging instruments | $ | 116,843 | $ | — | |||
The fair value of the interest rate swap is determined by using the counter party's proprietary models and certain assumptions regarding past, present and future market conditions. See Note 12 for additional information on fair value.
Non-Cash Activity — A non-cash increase in investment in unconsolidated affiliate and corresponding increase in capital contributions payable of $767,710 and $287,794 occurred for the fiscal years ended September 30, 2017 and 2016, respectively.
44
Other Comprehensive Income (Loss)—A summary of other comprehensive income is provided below:
Before Tax Amount | Tax (Expense) or Benefit | Net of Tax Amount | ||||||||||
Year Ended September 30, 2017: | ||||||||||||
Interest rate swap: | ||||||||||||
Unrealized gains | $ | 116,843 | $ | (44,354 | ) | $ | 72,489 | |||||
Net interest rate swap | 116,843 | (44,354 | ) | 72,489 | ||||||||
Defined benefit plans: | ||||||||||||
Net gain arising during period | $ | 1,715,505 | $ | (651,892 | ) | $ | 1,063,613 | |||||
Amortization of actuarial losses | 256,234 | (97,369 | ) | 158,865 | ||||||||
Net defined benefit plans | 1,971,739 | (749,261 | ) | 1,222,478 | ||||||||
Other comprehensive income | $ | 2,088,582 | $ | (793,615 | ) | $ | 1,294,967 | |||||
Year Ended September 30, 2016: | ||||||||||||
Defined benefit plans: | ||||||||||||
Net loss arising during period | $ | (560,887 | ) | $ | 213,137 | $ | (347,750 | ) | ||||
Amortization of actuarial losses | 221,070 | (84,006 | ) | 137,064 | ||||||||
Net defined benefit plans | (339,817 | ) | 129,131 | (210,686 | ) | |||||||
Other comprehensive loss | $ | (339,817 | ) | $ | 129,131 | $ | (210,686 | ) | ||||
Year Ended September 30, 2015: | ||||||||||||
Defined benefit plans: | ||||||||||||
Net loss arising during period | (1,910,573 | ) | 726,017 | (1,184,556 | ) | |||||||
Amortization of actuarial losses | 60,221 | (22,884 | ) | 37,337 | ||||||||
Net defined benefit plans | (1,850,352 | ) | 703,133 | (1,147,219 | ) | |||||||
Other comprehensive loss | $ | (1,850,352 | ) | $ | 703,133 | $ | (1,147,219 | ) | ||||
The amortization of actuarial losses is included as a component of net periodic pension and postretirement benefit costs in operations and maintenance expense.
Composition of Accumulated Other Comprehensive Income (Loss):
Interest Rate Swaps | Defined Benefit Plans | Accumulated Other Comprehensive Income (Loss) | ||||||||||
Balance September 30, 2014 | $ | — | $ | (1,139,326 | ) | $ | (1,139,326 | ) | ||||
Other comprehensive income (loss) | — | (1,147,219 | ) | (1,147,219 | ) | |||||||
Balance September 30, 2015 | — | (2,286,545 | ) | (2,286,545 | ) | |||||||
Other comprehensive income (loss) | — | (210,686 | ) | (210,686 | ) | |||||||
Balance September 30, 2016 | — | (2,497,231 | ) | (2,497,231 | ) | |||||||
Other comprehensive income (loss) | 72,489 | 1,222,478 | 1,294,967 | |||||||||
Balance September 30, 2017 | $ | 72,489 | $ | (1,274,753 | ) | $ | (1,202,264 | ) | ||||
45
Recently Adopted Accounting Standards—In November 2015, the FASB issued ASU 2015-17, Income Taxes: Balance Sheet Classification of Deferred Taxes. The ASU requires that all deferred tax assets and liabilities be presented as noncurrent and eliminates prior guidance to classify and present deferred tax assets and liabilities as current and noncurrent. This ASU is effective for the Company for the annual reporting period ended September 30, 2018 and interim periods within that annual period. Early application is permitted. The Company adopted this ASU for the quarter ended December 31, 2015.
In March 2016, the FASB issued ASU 2016-09, Compensation - Stock Compensation: Improvements to Employee Share-Based Payment Accounting. The guidance simplifies several aspects of the accounting for share-based payment award transactions, including income tax consequences, classification of awards as either equity or liabilities and classification on the statement of cash flows. The new guidance is effective for the Company for the annual reporting period ending September 30, 2018 and interim periods within that annual period. Early adoption is permitted. The Company adopted this ASU for the quarter ended September 30, 2016. Under the prior guidance, excess tax benefits were to be tracked in an APIC pool and not recognized in the income statement. Tax deficiencies were netted against the accumulated APIC pool and only recognized in the income statement starting at the time tax deficiencies exceeded the pool. Under ASU 2016-09, the APIC pool is eliminated with all excess tax benefits and deficiencies recognized in income tax expense on the income statement. Prior to the adoption of this ASU, stock option activity did not result in the accumulation of an APIC pool; therefore, adopting the ASU had minimal impact on the Company’s current financial position, results of operations or cash flows and no impact on prior results.
In January 2017, the FASB issued ASU 2017-03, Accounting Changes and Error Corrections and Investments - Equity Method and Joint Ventures. This update adds the text of the SEC Staff Announcement, Disclosure of the Impact That Recently Issued Accounting Standards Will Have on the Financial Statements of a Registrant When Such Standards Are Adopted in a Future Period (in accordance with Staff Accounting Bulletin Topic 11.M) as paragraph 250-10-S99-6. Related specifically to ASU 2014-09, ASU 2016-02 and ASU 2016-13, an SEC registrant should evaluate ASUs that have not yet been adopted to determine and include appropriate financial disclosures and MD&A discussions, including consideration of additional qualitative disclosures, to assist financial statement readers in assessing the significance of impact on adoption. The new guidance is effective immediately. The nature of this guidance relates to the effectiveness and quality of disclosures related to ASUs not yet adopted; however, there is no effect on the Company's financial position, results of operations or cash flows.
Recently Issued Accounting Standards—In May 2014, the FASB issued ASU 2014-09, Revenue from Contracts with Customers (Topic 606) that affects any entity that enters into contracts with customers for the transfer of goods or services or transfer of non-financial assets. This guidance supersedes the revenue recognition requirements in Topic 605, Revenue Recognition, and most industry-specific guidance. The core principle of the new guidance is that an entity should recognize revenue to depict the transfer of promised goods or services to customers in an amount that reflects the consideration to which the entity expects to be entitled in exchange for those goods or services. To achieve that core principle, an entity should apply the following steps: (1) identify the contract with the customer, (2) identify the performance obligations in the contract, (3) determine the transaction price, (4) allocate the transaction price to the performance obligations in the contract, and (5) recognize revenue when, or as, the entity satisfies the performance obligation. In August 2015, the FASB issued ASU 2015-14 that deferred the effective date of this guidance by one year making the standard effective for the Company's annual reporting period ending September 30, 2019 and interim periods within that annual period.
The FASB continues to issue subsequent guidance under ASC No. 606 to provide further clarification of the original ASU. In addition, the Company is also monitoring the activity of the Power and Utilities Task Force. The Task Force was formed by the American Institute of Certified Public Accountants ("AICPA") in an effort to provide industry-specific guidance. Implementation issues identified by the Task Force include accounting for contributions in aid of construction and assessing collectability of customer accounts when regulated mechanisms exist to allow recovery of uncollected accounts from ratepayers.
As of September 30, 2017, the Company continues identifying sources of revenue and evaluating the effect that the revenue guidance will have on financial results and disclosures. Though the evaluation is ongoing, based on the review of customer contracts to date, the Company is not anticipating a material impact to its financial position, results of operations or cash flows upon adoption; however, the Company does anticipate the potential for significant new disclosures as a result of the guidance. Because of ongoing internal analysis and the continued activities of the FASB and other related implementation efforts regarding the rate-regulated natural gas industry, early adoption is not expected. The Company will consider all current and future guidance, including the conclusions of the Task Force, before determining how best to implement the new revenue recognition standard.
46
In January 2016, the FASB issued ASU 2016-01, Financial Instruments - Overall: Recognition and Measurement of Financial Assets and Financial Liabilities. The ASU enhances the reporting model for financial instruments to provide users of the financial statements with more useful information through several provisions, including the following: (1) requires equity investments, excluding investments accounted for under the equity method, be measured at fair value with changes in fair value recognized in net income, (2) simplifies the impairment assessment of equity investments without readily determinable fair values, (3) eliminates the requirement to disclose the method(s) and significant assumptions used to estimate the fair value that is required to be disclosed for financial instruments measured at amortized cost on the balance sheet, (4) requires entities to use the exit price notion when measuring the fair value of financial instruments for disclosure purposes, and (5) requires separate presentation of financial assets and financial liabilities by measurement category and form of financial asset on the balance sheet or the accompanying notes to the financial statements. The new guidance is effective for the Company for the annual reporting period ending September 30, 2019 and interim periods within that annual period. Management has not completed its evaluation of the new guidance. However, the Company does not currently expect the new guidance to have a material effect on its financial position, results of operations or cash flows.
In February 2016, the FASB issued ASU 2016-02, Leases. The ASU leaves the accounting for leases mostly unchanged for lessors, with the exception of targeted improvements for consistency; however, the new guidance requires lessees to recognize assets and liabilities for leases with terms of more than 12 months. The ASU also revises the definition of a lease as a contract, or part of a contract, that conveys the right to control the use of identified property, plant or equipment for a period of time in exchange for consideration. Consistent with current GAAP, the presentation and cash flows arising from a lease by a lessee will primarily depend on its classification as a finance or operating lease. In contrast, the new ASU requires both types of leases to be recognized on the balance sheet. In addition, the new guidance includes quantitative and qualitative disclosure requirements to aid financial statement users in better understanding the amount, timing and uncertainty of cash flows arising from leases. The new guidance is effective for the Company for the annual reporting period ending September 30, 2020 and interim periods within that annual period. Early adoption is permitted. Management has not completed its evaluation of the new guidance. However, the Company has completed its inventory of leases and does not currently expect the new guidance to have a material effect on its financial position, results of operations or cash flows.
In March 2017, the FASB issued ASU 2017-07, Compensation - Retirement Benefits. The primary objective of this guidance is to improve the financial statement presentation of net periodic pension and postretirement benefit costs; however, it also changes which cost components are eligible for capitalization. The amendments in the ASU require that an employer report the service cost component in the same line item or items as other compensation costs arising from services rendered by the employees during the period. The other components of net benefit cost are required to be presented in the income statement separately from the service cost component and, if a subtotal for income from operations is presented, outside of income from operations. In addition, the ASU allows only the service cost component of periodic benefit cost to be eligible for capitalization when applicable. This change to capitalization eligibility differs from the treatment currently applied by the Company and from allowed regulatory accounting. The new guidance is effective for the Company for the annual reporting period ending September 30, 2019 and interim periods within that annual period. Early adoption is permitted. Management is in the process of evaluating the new guidance from this ASU. The regulatory body in the Company's service jurisdiction requires the capitalization of all cost components included in net benefit costs. As a result, the Company may have to establish regulatory assets for those costs now excluded from capitalization under this ASU. The Company has begun discussions with its regulatory body, the State Corporation Commission of Virginia, regarding the expected treatment of those costs. Although the ultimate disposition of these other components of net periodic benefit costs has not been determined, management expects the new guidance may have a material effect on the Company's consolidated financial statements when adopted.
In August 2017, the FASB issued ASU 2017-12, Derivatives and Hedging: Targeted Improvements to Accounting For Hedging Activities. The ASU is meant to simplify recognition and presentation guidance in an effort to improve financial reporting of cash flow and fair value hedging relationships to better portray the economic results of an entity's risk management activities. This is achieved through changes to both the designation and measurement guidance for qualifying hedging relationships, as well as changes to the presentation of hedge results. The new guidance is effective for the Company for the annual reporting period ending September 30, 2020 and interim periods within that annual period. Early adoption is permitted. Management has not completed its evaluation of the new guidance; however, it does not currently expect the new guidance to have a material effect on its financial position, results of operations or cash flows.
47
Other accounting standards that have been issued or proposed by the FASB or other standard–setting bodies are not currently applicable to the Company or are not expected to have a significant impact on the Company’s financial position, results of operations and cash flows.
2. | STOCK SPLIT |
On January 17, 2017, Resources Board of Directors approved a three-for-two stock split of the Company's issued and outstanding common stock. The stock split was effected in the form of a 50% stock dividend entitling each shareholder to receive one additional share of common stock for every two shares owned. The stock dividend was payable March 1, 2017 to shareholders of record on February 15, 2017. As the par value of the common stock remained at $5 per share, the Company reclassified $10,025,546 from "Capital in excess of par value" and $2,004,244 from "Retained earnings" to "Common stock" associated with the issuance of 2,405,958 shares. Corresponding prior year amounts of share and per share data have been restated retrospectively to reflect the 50% stock dividend.
3. | REGULATORY MATTERS |
The SCC exercises regulatory authority over the natural gas operations of Roanoke Gas. Such regulation encompasses terms, conditions and rates to be charged to customers for natural gas service, safety standards, service extension, accounting and depreciation.
On June 30, 2017, the Company filed with the SCC its most recent SAVE (Steps to Advance Virginia's Energy) Plan and Rider. The SAVE Plan provides a mechanism for the Company to recover the related depreciation and expenses and return on rate base of the additional capital investment without the filing of a formal application for an increase in non-gas base rates. Under the current application, the Company submitted its report for collecting the shortfall in SAVE revenues collected under the 2016 SAVE Plan and proposed new 2018 SAVE rates to be implemented for the ongoing investment in SAVE Plan projects. On September 28, 2017, the Company received approval of its application to implement the new 2018 SAVE rates related to proposed qualifying SAVE investments in calendar 2018. The SCC also approved the True-Up factor to provide collection on the remaining under-collected 2016 SAVE Plan for a modification to the SAVE Plan and Rider.
4. | OTHER INVESTMENTS |
In October 2015, the Company, through its wholly-owned subsidiary, RGC Midstream, LLC ("Midstream"), acquired a 1% equity interest in the Mountain Valley Pipeline, LLC (the “LLC”).
The LLC was established to construct and operate a natural gas pipeline originating in northern West Virginia and extending through south central Virginia. The proposed pipeline will have the capacity to transport approximately 2 million decatherms of natural gas per day. On October 13, 2017, the Federal Energy Regulatory Commission issued the Certificate of Public Convenience and Necessity subject to certain conditions and requirements. With FERC approval, the LLC will continue the process of obtaining the necessary approvals and permits from other federal and state government agencies. Assuming no significant delays in the permitting process, the pipeline is expected to be in service by late 2018.
The total project cost is estimated to be approximately $3.5 billion. The Company's 1% equity interest in the LLC will require a total estimated cash investment of approximately $35 million, provided by periodic capital contributions throughout the design and construction phases of the project. Midstream held an approximate $7.4 million equity method investment in the LLC at September 30, 2017. Initial funding for Midstream's investment in the LLC is provided through two unsecured Promissory Notes, each with a 5-year term, as further described in Note 6 below.
The Company will participate in the earnings generated from the transportation of natural gas through the pipeline in proportion to its level of investment.
The financial statement locations of the investment in the LLC are as follows:
48
September 30 | ||||||||||||
Balance Sheet Location of Other Investments: | 2017 | 2016 | ||||||||||
Other Assets: | ||||||||||||
Investment in unconsolidated affiliate | $ | 7,445,106 | $ | 3,496,404 | ||||||||
Current Liabilities: | ||||||||||||
Capital contributions payable | $ | 1,055,504 | $ | 287,794 | ||||||||
For the Years ended September 30 | ||||||||||||
Income Statement Location of Other Investments: | 2017 | 2016 | 2015 | |||||||||
Equity in earnings of unconsolidated affiliate | $ | 421,646 | $ | 152,864 | $ | — | ||||||
5. | LINE-OF-CREDIT |
On March 27, 2017, Roanoke Gas entered into a new unsecured line-of-credit agreement. This line-of-credit agreement replaced the agreement which expired on March 31, 2017. The expired agreement was for a term of one year and all amounts drawn against that agreement were considered to be current liabilities. The new line-of-credit agreement is for a two-year term expiring March 31, 2019. Amounts drawn against the new agreement are considered to be non-current as the balance under the line-of-credit is not subject to repayment within the next 12-month period.
Except for the two-year term, the new agreement maintains the same variable interest rate based on 30-day LIBOR plus 100 basis points and availability fee of 15 basis points as the expired agreement. The new agreement also maintains the multi-tiered borrowing limits to accommodate seasonal borrowing demands and minimize borrowing costs. Available limits under this agreement for the remaining term are as follows:
As of | Available Line-of-Credit | |||
September 30, 2017 | $ | 21,000,000 | ||
March 1, 2018 | 17,000,000 | |||
July 22, 2018 | 22,000,000 | |||
September 22, 2018 | 30,000,000 | |||
A summary of the line-of-credit follows:
September 30 | ||||||||||||
2017 | 2016 | 2015 | ||||||||||
Line-of-credit at year-end | $ | 21,000,000 | $ | 24,000,000 | $ | 24,000,000 | ||||||
Outstanding balance at year-end | 17,791,760 | 14,556,785 | 9,340,997 | |||||||||
Highest month-end balance outstanding | 17,791,760 | 15,246,089 | 17,366,052 | |||||||||
Average daily balance | 10,936,114 | 9,620,914 | 6,377,040 | |||||||||
Average rate of interest during year on outstanding balances | 1.92 | % | 1.40 | % | 1.17 | % | ||||||
Interest rate at year-end | 2.23 | % | 1.53 | % | 1.20 | % | ||||||
Interest rate on unused line-of-credit | 0.15 | % | 0.15 | % | 0.15 | % | ||||||
Associated with the line-of-credit is a credit agreement that contains various representations, warranties and covenants including a requirement that the Company maintain an interest coverage ratio of not less than 1.5 to 1 and a long-term debt to long-term capitalization ratio of less than 65%.
49
6. | LONG-TERM DEBT |
On November 1, 2016, Roanoke Gas entered into a 5-year unsecured note with Branch Banking & Trust in the principal amount of $7,000,000. The note is variable rate with interest based on 30-day LIBOR plus 90 basis points. In addition, Roanoke Gas also entered into a swap agreement with Branch Banking & Trust to convert the variable rate debt into a fixed-rate instrument with an annual interest rate of 2.30%. The swap agreement is not effective until November 1, 2017, with the monthly interest rate on the note floating until the swap period begins. The proceeds from the note were used to convert a portion of the Company's line-of-credit balance into longer-term financing.
Midstream has two unsecured Promissory Notes ("Notes") which provide up to a total of $25 million in borrowing limits over a period of 5 years, with an interest rate of 30-day LIBOR plus 160 basis points. Midstream issued the Notes in December 2015 to provide financing for capital investment in respect of its 1% interest in the LLC. In accordance with the terms of the debt, at such point in time as Midstream has borrowed $17.5 million under the Notes, Midstream is required to provide the next $5 million towards its capital contributions to the LLC. Once Midstream has completed its $5 million in contributions, it may resume borrowing under the Notes up to the $25 million limit.
Long-term debt consists of the following:
September 30 | ||||||||||||||||
2017 | 2016 | |||||||||||||||
Principal | Unamortized Debt Issuance Costs | Principal | Unamortized Debt Issuance Costs | |||||||||||||
Roanoke Gas Company: | ||||||||||||||||
Unsecured senior notes payable, at 4.26%, due on September 18, 2034 | $ | 30,500,000 | $ | 164,119 | $ | 30,500,000 | $ | 173,773 | ||||||||
Unsecured term note payable, at 30-day LIBOR plus 0.90%, November 1, 2021 | 7,000,000 | 13,618 | — | — | ||||||||||||
Pending unsecured note | — | 48,160 | — | — | ||||||||||||
RGC Midstream, LLC: | ||||||||||||||||
Unsecured term notes payable, at 30-day LIBOR plus 1.60% due December 29, 2020 | $ | 6,312,200 | $ | 66,052 | $ | 3,396,200 | $ | 86,376 | ||||||||
Total notes payable | $ | 43,812,200 | $ | 291,949 | $ | 33,896,200 | $ | 260,149 | ||||||||
Line-of-credit, at 30-day LIBOR plus 1.00%, due March 31, 2019 | 17,791,760 | — | — | — | ||||||||||||
Total long-term debt | $ | 61,603,960 | $ | 291,949 | $ | 33,896,200 | $ | 260,149 | ||||||||
Debt issuance costs are amortized over the life of the related debt. As of September 30, 2017 and 2016, the Company also had an unamortized loss on the early retirement of debt of $1,941,182 and $2,055,369, respectively, which has been deferred as a regulatory asset and is being amortized over a 20 year period.
All of the debt agreements set forth certain representations, warranties and covenants to which the Company is subject, including financial covenants that limit Consolidated Long-Term Indebtedness to not more than 65% of total capitalization. All of the debt agreements except for the line-of-credit provide for priority indebtedness to not exceed 15% of consolidated total assets.
On October 2, 2017, the Company issued 10-year unsecured notes in the principal amount of $8,000,000 with a fixed interest rate of 3.58% per annum. The proceeds from the note were used to convert a portion of the Company's line-of-credit balance into longer-term financing.
50
The aggregate annual maturities of long-term debt for the next five years ending after September 30, 2017 are as follows:
Year Ending September 30 | Maturities | ||
2018 | $ | — | |
2019 | 17,791,760 | ||
2020 | — | ||
2021 | 6,312,200 | ||
2022 | 7,000,000 | ||
Thereafter | 30,500,000 | ||
Total | $ | 61,603,960 | |
7. | INCOME TAXES |
The details of income tax expense are as follows:
Years Ended September 30 | ||||||||||||
2017 | 2016 | 2015 | ||||||||||
Current income taxes: | ||||||||||||
Federal | $ | 72,368 | $ | (1,216,745 | ) | $ | 379,180 | |||||
State | 407,643 | 415,975 | 374,541 | |||||||||
Total current income taxes | 480,011 | (800,770 | ) | 753,721 | ||||||||
Deferred income taxes: | ||||||||||||
Federal | 3,129,925 | 4,302,906 | 2,289,729 | |||||||||
State | 195,454 | 164,048 | 127,112 | |||||||||
Total deferred income taxes | 3,325,379 | 4,466,954 | 2,416,841 | |||||||||
Total income tax expense | $ | 3,805,390 | $ | 3,666,184 | $ | 3,170,562 | ||||||
Income tax expense for the years ended September 30, 2017, 2016 and 2015 differed from amounts computed by applying the U.S. Federal income tax rate of 34% to earnings before income taxes due to the following:
Years Ended September 30 | ||||||||||||
2017 | 2016 | 2015 | ||||||||||
Income before income taxes | $ | 10,038,255 | $ | 9,473,050 | $ | 8,264,977 | ||||||
Income tax expense computed at the federal statutory rate | $ | 3,413,007 | $ | 3,220,837 | $ | 2,810,092 | ||||||
State income taxes, net of federal income tax benefit | 398,044 | 382,815 | 331,091 | |||||||||
Other, net | (5,661 | ) | 62,532 | 29,379 | ||||||||
Total income tax expense | $ | 3,805,390 | $ | 3,666,184 | $ | 3,170,562 | ||||||
51
The tax effects of temporary differences that give rise to the deferred tax assets and deferred tax liabilities are as follows:
September 30 | ||||||||
2017 | 2016 | |||||||
Deferred tax assets: | ||||||||
Allowance for uncollectibles | $ | 37,752 | $ | 29,203 | ||||
Accrued pension and postretirement medical benefits | 1,747,429 | 2,532,672 | ||||||
Accrued vacation | 239,414 | 262,273 | ||||||
Over-recovery of gas costs | 545,894 | 345,318 | ||||||
Costs of gas held in storage | 1,009,206 | 1,077,849 | ||||||
Deferred compensation | 824,281 | 770,868 | ||||||
Other | 348,833 | 340,121 | ||||||
Total gross deferred tax assets | 4,752,809 | 5,358,304 | ||||||
Deferred tax liabilities: | ||||||||
Utility plant | 27,630,486 | 24,264,165 | ||||||
MVP investment | 154,817 | 40,776 | ||||||
Other | 44,354 | 11,217 | ||||||
Total gross deferred tax liabilities | 27,829,657 | 24,316,158 | ||||||
Net deferred tax liability | $ | 23,076,848 | $ | 18,957,854 | ||||
The current federal tax expense for fiscal 2016 reflected the effect of 50% bonus depreciation for the entire fiscal year 2016 as well as for nine months of fiscal 2015. The Protecting Americans from Tax Hikes (PATH Act), which extended 50% bonus depreciation for calendar 2015, was signed into law on December 18, 2015, subsequent to the issuance of the Company's September 30, 2015 annual report. As a result, $1,283,925 of deferred taxes that related to fiscal 2015 bonus depreciation were reflected in the fiscal 2016 tax provision, thereby reducing the current tax expense and increasing deferred tax expense by the same amount. The same situation occurred in fiscal 2014 when the extension of 50% bonus depreciation was not signed into law until December 19, 2014, following the issuance of the Company's financial statements for the year ended September 30, 2014. Correspondingly, fiscal 2015 income tax expense included the tax effect of the 50% bonus depreciation for fixed asset additions during the last nine months of fiscal 2014, which resulted in $1,442,211 in deferred tax expense related to fiscal 2014 being included in fiscal 2015. The recording of the effect of the adjustments for bonus depreciation had no effect on total income tax expense, net income or earnings per share. Only the current and deferred components of income tax expense and their corresponding assets and liabilities were affected.
Under the PATH Act, 50% bonus depreciation extends through December 31, 2017, 40% for calendar 2018 and 30% for calendar 2019 with no provision for bonus depreciation after 2019. Virginia tax law does not recognize bonus depreciation; therefore, state income taxes were not impacted by the delayed bonus depreciation extensions.
FASB ASC No. 740 - Income Taxes provides for the determination of whether tax benefits claimed or expected to be claimed on a tax return should be recognized in the financial statements. The Company has evaluated its tax positions and accordingly has not identified any significant uncertain tax positions. The Company’s policy is to classify interest associated with uncertain tax positions as interest expense in the financial statements. Penalties are classified under other expense.
The Company files a consolidated federal income tax return and state income tax returns in Virginia and West Virginia. The federal returns and the state returns for both Virginia and West Virginia for the tax years ended prior to September 30, 2014 are no longer subject to examination.
8. | EMPLOYEE BENEFIT PLANS |
The Company sponsors both a noncontributory defined benefit pension plan ("pension plan") and a postretirement benefit plan ("postretirement plan"). The pension plan covers substantially all employees and benefits fully vest after 5 years of credited service. Benefits paid to retirees are based on age at retirement, years of service and average compensation. In November 2016, the Board of Directors approved a "soft freeze" to the pension plan, whereby no employees hired on or after January 1, 2017 will be eligible to participate. Employees hired prior to January 1, 2017
52
will continue to participate in the plan and accrue benefits. The Board of Directors also approved an amendment to the 401(k) Plan which would allow for management to authorize a discretionary contribution to the 401(k) Plan for employees hired on or after January 1, 2017. This discretionary contribution would be determined each year, and if approved, would be applied to the eligible employees at the end of the calendar year. This Company contribution would be in addition to any employee elected deferrals and employer match as provided for under the 401(k) Plan.
The postretirement benefit plan provides certain health care, supplemental retirement and life insurance benefits to retired employees who meet specific age and service requirements. Employees hired prior to January 1, 2000 are eligible to participate in the postretirement benefit plan. Employees must have a minimum of 10 years of service and retire after attaining the age of 55 in order to vest in the postretirement plan. Retiree contributions to the plan are based on the number of years of service to the Company as determined under the defined benefit plan.
Employers who sponsor defined benefit plans must recognize the funded status of defined benefit pension and other postretirement plans as an asset or liability in their statements of financial position and recognize changes in that funded status in the year in which the changes occur through comprehensive income. For pension plans, the benefit obligation is the projected benefit obligation, and for other postretirement plans, the benefit obligation is the accumulated benefit obligation. The Company established a regulatory asset for the portion of the obligation expected to be recovered in rates in future periods. The regulatory asset is adjusted for the amortization of the transition obligation and recognition of actuarial gains and losses. The portion of the obligation attributable to the unregulated operations of the holding company is recognized in other comprehensive income.
The following tables set forth the benefit obligation, fair value of plan assets, the funded status of the benefit plans, amounts recognized in the Company’s financial statements and the assumptions used.
Pension Plan | Postretirement Plan | |||||||||||||||
2017 | 2016 | 2017 | 2016 | |||||||||||||
Accumulated benefit obligation | $ | 25,481,993 | $ | 25,090,968 | $ | 17,666,812 | $ | 18,504,710 | ||||||||
Change in benefit obligation: | ||||||||||||||||
Benefit obligation at beginning of year | $ | 29,494,950 | $ | 27,167,621 | $ | 18,504,710 | $ | 15,355,668 | ||||||||
Service cost | 706,677 | 694,375 | 183,267 | 148,018 | ||||||||||||
Interest cost | 995,598 | 1,132,776 | 626,822 | 624,579 | ||||||||||||
Actuarial (gain) loss | (824,361 | ) | 2,440,957 | (1,199,722 | ) | 2,812,516 | ||||||||||
Benefit payments, net of retiree contributions | (715,517 | ) | (1,940,779 | ) | (448,265 | ) | (436,071 | ) | ||||||||
Benefit obligation at end of year | $ | 29,657,347 | $ | 29,494,950 | $ | 17,666,812 | $ | 18,504,710 | ||||||||
Change in fair value of plan assets: | ||||||||||||||||
Fair value of plan assets at beginning of year | $ | 23,113,057 | $ | 21,394,399 | $ | 11,122,783 | $ | 10,443,629 | ||||||||
Actual return on plan assets, net of taxes | 3,021,131 | 2,159,437 | 1,016,644 | 615,225 | ||||||||||||
Employer contributions | 1,000,000 | 1,500,000 | 1,000,000 | 500,000 | ||||||||||||
Benefit payments, net of retiree contributions | (715,517 | ) | (1,940,779 | ) | (448,265 | ) | (436,071 | ) | ||||||||
Fair value of plan assets at end of year | $ | 26,418,671 | $ | 23,113,057 | $ | 12,691,162 | $ | 11,122,783 | ||||||||
Funded status | $ | (3,238,676 | ) | $ | (6,381,893 | ) | $ | (4,975,650 | ) | $ | (7,381,927 | ) | ||||
Amounts recognized in the balance sheets consist of: | ||||||||||||||||
Noncurrent liabilities | $ | (3,238,676 | ) | $ | (6,381,893 | ) | $ | (4,975,650 | ) | $ | (7,381,927 | ) | ||||
Amounts recognized in accumulated other comprehensive loss: | ||||||||||||||||
Net actuarial loss, net of tax | $ | 572,740 | $ | 1,583,345 | $ | 702,013 | $ | 913,886 | ||||||||
Total amounts included in other comprehensive loss, net of tax | $ | 572,740 | $ | 1,583,345 | $ | 702,013 | $ | 913,886 | ||||||||
Amounts deferred to a regulatory asset: | ||||||||||||||||
Net actuarial loss | $ | 5,471,547 | $ | 6,732,800 | $ | 3,830,763 | $ | 5,563,642 | ||||||||
Amounts recognized as regulatory assets | $ | 5,471,547 | $ | 6,732,800 | $ | 3,830,763 | $ | 5,563,642 | ||||||||
53
During 2016, the Company offered a one-time, lump sum pay out option for vested, terminated employees not currently receiving payments under the pension plan. The lump sum offer was accepted by 40 of the 63 eligible participants. In September 2016, the pension plan distributed $1,241,529 to the participants electing to receive the lump sum payments, which resulted in a corresponding reduction of approximately $1,500,000 in the projected pension obligation.
The Company expects that approximately $24,000 before tax, of accumulated other comprehensive income will be recognized as a reduction in net periodic benefit costs in fiscal 2018 and approximately $659,000 of amounts deferred as regulatory assets will be amortized and recognized in net periodic benefit costs in fiscal 2018.
The following table details the actuarial assumptions used in determining the projected benefit obligations and net benefit cost of the pension and the accumulated benefit obligations and net benefit cost of the postretirement plan for 2017, 2016 and 2015.
Pension Plan | Postretirement Plan | |||||||||||||||||
2017 | 2016 | 2015 | 2017 | 2016 | 2015 | |||||||||||||
Assumptions used to determine benefit obligations: | ||||||||||||||||||
Discount rate | 3.72 | % | 3.42 | % | 4.22 | % | 3.69 | % | 3.33 | % | 4.15 | % | ||||||
Expected rate of compensation increase | 4.00 | % | 4.00 | % | 4.00 | % | N/A | N/A | N/A | |||||||||
Assumptions used to determine benefit costs: | ||||||||||||||||||
Discount rate | 3.42 | % | 4.22 | % | 4.22 | % | 3.33 | % | 4.15 | % | 4.10 | % | ||||||
Expected long-term rate of return on plan assets | 7.00 | % | 7.00 | % | 7.00 | % | 4.84 | % | 4.89 | % | 4.90 | % | ||||||
Expected rate of compensation increase | 4.00 | % | 4.00 | % | 4.00 | % | N/A | N/A | N/A | |||||||||
To develop the expected long-term rate of return on assets assumption, the Company, with input from the plans' actuaries and investment advisors, considered the historical returns and the future expectations for returns for each asset class, as well as the target asset allocation of each plan’s portfolio.
Components of net periodic benefit cost are as follows:
Pension Plan | Postretirement Plan | |||||||||||||||||||||||
2017 | 2016 | 2015 | 2017 | 2016 | 2015 | |||||||||||||||||||
Service cost | $ | 706,677 | $ | 694,375 | $ | 654,782 | $ | 183,267 | $ | 148,018 | $ | 167,580 | ||||||||||||
Interest cost | 995,598 | 1,132,776 | 1,025,908 | 626,822 | 624,579 | 600,096 | ||||||||||||||||||
Expected return on plan assets | (1,616,412 | ) | (1,492,241 | ) | (1,440,846 | ) | (571,513 | ) | (507,858 | ) | (516,656 | ) | ||||||||||||
Recognized loss | 662,180 | 501,678 | 257,378 | 429,758 | 250,173 | 197,058 | ||||||||||||||||||
Net periodic benefit cost | $ | 748,043 | $ | 836,588 | $ | 497,222 | $ | 668,334 | $ | 514,912 | $ | 448,078 | ||||||||||||
The assumed health care cost trend rates used in measuring the accumulated benefit obligation for the postretirement medical plan as of September 30, 2017, 2016 and 2015 are presented below:
Pre 65 | Post 65 | |||||||||||||||||
2017 | 2016 | 2015 | 2017 | 2016 | 2015 | |||||||||||||
Health care cost trend rate assumed for next year | 7.00 | % | 7.50 | % | 8.00 | % | 5.00 | % | 5.00 | % | 5.00 | % | ||||||
Rate to which the cost trend is assumed to decline (the ultimate trend rate) | 5.00 | % | 5.00 | % | 5.00 | % | 5.00 | % | 5.00 | % | 5.00 | % | ||||||
Year that the rate reaches the ultimate trend rate | 2021 | 2021 | 2021 | 2017 | 2016 | 2015 | ||||||||||||
The health care cost trend rate assumptions could have a significant effect on the amounts reported. A change of 1% would have the following effects:
1% Increase | 1% Decrease | |||||||
Effect on total service and interest cost components | $ | 153,000 | $ | (121,000 | ) | |||
Effect on accumulated postretirement benefit obligation | 2,961,000 | (2,385,000 | ) | |||||
54
The primary objectives of the Plan’s investment policy are to maintain investment portfolios that diversify risk through prudent asset allocation parameters, achieve asset returns that meet or exceed the plans’ actuarial assumptions, achieve asset returns that are competitive with like institutions employing similar investment strategies and meet expected future benefits in both the short-term and long-term. The investment policy provides for a range of investment allocations to allow for flexibility in responding to market conditions. The investment policy is periodically reviewed by the Company and a third-party investment advisor.
The Company’s target and actual asset allocation in the pension and postretirement benefit plans as of September 30, 2017 and 2016 were:
Pension Plan | Postretirement Plan | |||||||||||||||||
Target | 2017 | 2016 | Target | 2017 | 2016 | |||||||||||||
Asset category: | ||||||||||||||||||
Equity securities | 60 | % | 63 | % | 63 | % | 50 | % | 51 | % | 52 | % | ||||||
Debt securities | 40 | % | 36 | % | 36 | % | 50 | % | 48 | % | 47 | % | ||||||
Cash | — | % | 1 | % | 1 | % | — | % | 1 | % | — | % | ||||||
Other | — | % | — | % | — | % | — | % | — | % | 1 | % | ||||||
The assets of the plans are invested in mutual funds. The Company uses the fair value hierarchy described in Note 1 to classify these assets. The mutual funds are included under Level 2 in the fair value hierarchy as their fair values are determined based on individual prices for each security that comprises the mutual funds. Most of the individual investments are determined based on quoted market prices for each security; however, certain fixed income securities and other investments are not actively traded and are valued based on similar investments. The following table contains the fair value classifications of the benefit plan assets:
Defined Benefit Pension Plan Fair Value Measurements - September 30, 2017 | ||||||||||||||||
Fair Value | Level 1 | Level 2 | Level 3 | |||||||||||||
Asset Class: | ||||||||||||||||
Cash | $ | 265,100 | $ | 265,100 | $ | — | $ | — | ||||||||
Common and Collective Trust and Pooled Funds: | ||||||||||||||||
Bonds | ||||||||||||||||
Liability Driven Investment | 9,635,998 | — | 9,635,998 | — | ||||||||||||
Equities | ||||||||||||||||
Domestic Large Cap Growth | 5,068,282 | — | 5,068,282 | — | ||||||||||||
Domestic Large Cap Value | 5,046,530 | — | 5,046,530 | — | ||||||||||||
Domestic Small/Mid Cap Core | 2,393,221 | — | 2,393,221 | — | ||||||||||||
Foreign Large Cap Value | 2,139,733 | — | 2,139,733 | — | ||||||||||||
Mutual Funds: | ||||||||||||||||
Bonds | ||||||||||||||||
Equities | ||||||||||||||||
Foreign Large Cap Growth | 399,909 | — | 399,909 | — | ||||||||||||
Foreign Large Cap Value | 398,995 | — | 398,995 | — | ||||||||||||
Foreign Large Cap Core | 1,070,903 | — | 1,070,903 | — | ||||||||||||
Total | $ | 26,418,671 | $ | 265,100 | $ | 26,153,571 | $ | — | ||||||||
55
Defined Benefit Pension Plan Fair Value Measurements - September 30, 2016 | ||||||||||||||||
Fair Value | Level 1 | Level 2 | Level 3 | |||||||||||||
Asset Class: | ||||||||||||||||
Cash | $ | 117,265 | $ | 117,265 | $ | — | $ | — | ||||||||
Common and Collective Trust and Pooled Funds: | ||||||||||||||||
Bonds | ||||||||||||||||
Domestic Fixed Income | 4,497,373 | — | 4,497,373 | — | ||||||||||||
Equities | ||||||||||||||||
Domestic Large Cap Growth | 3,426,041 | — | 3,426,041 | — | ||||||||||||
Domestic Large Cap Value | 4,543,385 | — | 4,543,385 | — | ||||||||||||
Domestic Small/Mid Cap Core | 2,149,566 | — | 2,149,566 | — | ||||||||||||
Foreign Large Cap Value | 1,795,897 | — | 1,795,897 | — | ||||||||||||
Mutual Funds: | ||||||||||||||||
Bonds | ||||||||||||||||
Domestic Fixed Income | 3,615,209 | — | 3,615,209 | — | ||||||||||||
Foreign Fixed Income | 234,622 | — | 234,622 | — | ||||||||||||
Equities | ||||||||||||||||
Domestic Large Cap Growth | 1,043,395 | — | 1,043,395 | — | ||||||||||||
Foreign Large Cap Growth | 366,420 | — | 366,420 | — | ||||||||||||
Foreign Large Cap Value | 373,480 | — | 373,480 | — | ||||||||||||
Foreign Large Cap Core | 950,404 | — | 950,404 | — | ||||||||||||
Total | $ | 23,113,057 | $ | 117,265 | $ | 22,995,792 | $ | — | ||||||||
Postretirement Benefit Plan Fair Value Measurements - September 30, 2017 | ||||||||||||||||
Fair Value | Level 1 | Level 2 | Level 3 | |||||||||||||
Asset Class: | ||||||||||||||||
Cash | $ | 64,616 | $ | 64,616 | $ | — | $ | — | ||||||||
Mutual Funds | ||||||||||||||||
Bonds | ||||||||||||||||
Domestic Fixed Income | 5,727,258 | — | 5,727,258 | — | ||||||||||||
Foreign Fixed Income | 359,460 | — | 359,460 | — | ||||||||||||
Equities | ||||||||||||||||
Domestic Large Cap Growth | 1,998,971 | — | 1,998,971 | — | ||||||||||||
Domestic Large Cap Value | 1,998,714 | — | 1,998,714 | — | ||||||||||||
Domestic Small/Mid Cap Growth | 209,332 | — | 209,332 | — | ||||||||||||
Domestic Small/Mid Cap Value | 209,630 | — | 209,630 | — | ||||||||||||
Domestic Small/Mid Cap Core | 455,867 | — | 455,867 | — | ||||||||||||
Foreign Large Cap Growth | 39,107 | — | 39,107 | — | ||||||||||||
Foreign Large Cap Value | 1,079,766 | — | 1,079,766 | — | ||||||||||||
Foreign Large Cap Core | 511,298 | — | 511,298 | — | ||||||||||||
Other | 37,143 | — | 37,143 | — | ||||||||||||
Total | $ | 12,691,162 | $ | 64,616 | $ | 12,626,546 | $ | — | ||||||||
56
Postretirement Benefit Plan Fair Value Measurements - September 30, 2016 | ||||||||||||||||
Fair Value | Level 1 | Level 2 | Level 3 | |||||||||||||
Asset Class: | ||||||||||||||||
Cash | $ | 43,455 | $ | 43,455 | $ | — | $ | — | ||||||||
Mutual Funds | ||||||||||||||||
Bonds | ||||||||||||||||
Domestic Fixed Income | 5,109,834 | — | 5,109,834 | — | ||||||||||||
Foreign Fixed Income | 87,821 | — | 87,821 | — | ||||||||||||
Equities | ||||||||||||||||
Domestic Large Cap Growth | 1,824,796 | — | 1,824,796 | — | ||||||||||||
Domestic Large Cap Value | 1,770,664 | — | 1,770,664 | — | ||||||||||||
Domestic Small/Mid Cap Growth | 195,319 | — | 195,319 | — | ||||||||||||
Domestic Small/Mid Cap Value | 198,884 | — | 198,884 | — | ||||||||||||
Domestic Small/Mid Cap Core | 427,409 | — | 427,409 | — | ||||||||||||
Foreign Large Cap Value | 964,827 | — | 964,827 | — | ||||||||||||
Foreign Large Cap Core | 456,100 | — | 456,100 | — | ||||||||||||
Other | 43,674 | — | 43,674 | — | ||||||||||||
Total | $ | 11,122,783 | $ | 43,455 | $ | 11,079,328 | $ | — | ||||||||
Each mutual fund has been categorized based on its primary investment strategy.
The Company expects to contribute $1,600,000 to its pension plan and $600,000 to its postretirement benefit plan in fiscal 2018.
The following table reflects expected future benefit payments:
Fiscal year ending September 30 | Pension Plan | Postretirement Plan | ||||||
2018 | $ | 817,861 | $ | 618,241 | ||||
2019 | 879,779 | 644,666 | ||||||
2020 | 966,930 | 671,228 | ||||||
2021 | 1,041,200 | 710,495 | ||||||
2022 | 1,139,637 | 749,674 | ||||||
2023-2027 | 6,981,849 | 4,148,403 | ||||||
The Company also sponsors a defined contribution plan (the “401k Plan”) covering all employees who elect to participate. Employees may contribute from 1% to 50% of their annual compensation to the 401k Plan, limited to a maximum annual amount as set periodically by the Internal Revenue Service. The Company matches 100% of the participant’s first 4% of contributions and 50% on the next 2% of contributions. Company matching contributions were $361,702, $353,793 and $338,896 for 2017, 2016 and 2015, respectively.
9. | COMMON STOCK OPTIONS |
The Company’s stockholders approved the RGC Resources, Inc. Key Employee Stock Option Plan (“KESOP”). The KESOP provides for the issuance of common stock options to officers and certain other full-time salaried employees to acquire shares of the Company’s common stock. As of September 30, 2017, the number of shares available for future grants was 36,000.
FASB ASC No. 718 - Compensation-Stock Compensation requires that compensation expense be recognized for the issuance of equity instruments to employees. During the fiscal years ended 2017, 2016 and 2015, the Board approved stock option grants to certain officers. As required by the KESOP, each option's exercise price per share equaled the
57
fair value of the Company's common stock on the grant date. Pursuant to the Plan, the options vest over a six-month period and are exercisable over a ten-year period from the date of issuance.
As the Company's stock options are not traded on the open market, the fair value of each grant is estimated on the date of grant using the Black-Scholes option pricing model including the following assumptions:
Years Ended September 30, | |||||
2017 | 2016 | 2015 | |||
Expected volatility | 26.09% | 28.78% | 34.34% | ||
Expected dividends | 3.81% | 3.99% | 4.11% | ||
Expected exercise term (years) | 7.00 | 7.00 | 7.00 | ||
Risk-free interest rate | 2.20% | 2.10% | 1.98% | ||
The underlying methods regarding each assumption are as follows:
Expected volatility is based on the historical volatilities of the daily closing price of the Company's common stock.
Expected dividend rate is based on historical dividend payout trends.
Expected exercise term is based on the average time historical option grants were outstanding before being exercised.
Risk-free interest rate is based on the 7-year Treasury rate on the date of option grant.
Forfeitures are recognized when they occur.
Stock option transactions under the Company's plans for the years ended September 30, 2017, 2016 and 2015 are summarized below. The information contained in the tables below have been restated to reflect the effect of the stock split:
Number of Shares | Weighted- Average Exercise Price | Weighted- Average Remaining Contractual Terms (years) | Aggregate Intrinsic Value 1 | ||||||||||
Options outstanding, September 30, 2014 | 57,000 | $ | 12.65 | 8.8 | $ | 34,840 | |||||||
Options granted | 25,500 | 14.40 | |||||||||||
Options exercised | (3,900 | ) | 12.66 | ||||||||||
Options expired | — | — | |||||||||||
Options forfeited | — | — | |||||||||||
Options outstanding, September 30, 2015 | 78,600 | 13.22 | 8.3 | 43,086 | |||||||||
Options granted | 24,000 | 14.15 | |||||||||||
Options exercised | (3,300 | ) | 12.65 | ||||||||||
Options expired | — | — | |||||||||||
Options forfeited | (12,000 | ) | 13.20 | ||||||||||
Options outstanding, September 30, 2016 | 87,300 | 13.50 | 7.8 | 200,211 | |||||||||
Options granted | 25,500 | 16.37 | |||||||||||
Options exercised | (11,225 | ) | 12.67 | ||||||||||
Options expired | — | — | |||||||||||
Options forfeited | — | — | |||||||||||
Options outstanding, September 30, 2017 | 101,575 | $ | 14.31 | 7.6 | $ | 1,448,338 | |||||||
Vested and exercisable at September 30, 2017 | 101,575 | $ | 14.31 | 7.6 | $ | 1,448,338 | |||||||
1Aggregate intrinsic value includes only those options where the exercise price is below the market price.
58
Years Ended September 30, | |||||||||||
2017 | 2016 | 2015 | |||||||||
Weighted-average grant date option fair value | $ | 2.89 | $ | 2.69 | $ | 3.28 | |||||
Stock option expense | 73,780 | 64,640 | 83,640 | ||||||||
Intrinsic value of options exercised | 99,929 | 8,418 | 5,624 | ||||||||
Proceeds from exercise of stock options | 142,241 | 41,762 | 49,366 | ||||||||
10. | OTHER STOCK PLANS |
Dividend Reinvestment and Stock Purchase Plan
The Company offers a Dividend Reinvestment and Stock Purchase Plan (the “DRIP”) to shareholders of record for the reinvestment of dividends and the purchase of up to $40,000 per year in additional shares of common stock of the Company. Under the DRIP, the Company issued 36,446, 52,146 and 12,647 shares in 2017, 2016 and 2015, respectively. As of September 30, 2017, the Company had 448,973 shares of stock available for issuance under the DRIP.
Restricted Stock Plan for Outside Directors
The Board of Directors of the Company implemented the Restricted Stock Plan for Outside Directors (the “Plan”) effective January 27, 1997. Under the Plan, a minimum of 40% of the monthly retainer fee paid to each non-employee director of Resources was paid in shares of common stock (“Restricted Stock”). The number of shares of Restricted Stock awarded each month is determined based on the closing sales price of Resources' common stock on the NASDAQ Global Market on the first business day of the month. The Restricted Stock issued under the Plan vests only in the case of a participant's death, disability, retirement, or in the event of a change in control of Resources. The Restricted Stock may not be sold, transferred, assigned or pledged by the participant until the shares have vested under the terms of the Plan. The shares of Restricted Stock will be forfeited to Resources by a participant's voluntary resignation during his or her term on the Board or removal for cause as a director. Effective October 1, 2016, the Board of Directors amended the Plan to remove the requirement that directors take a minimum 40% of their retainer in Restricted Stock for those directors who owned at least 10,000 shares of Resources stock.
The Company assumes all directors will complete their term and there will be no forfeiture of the Restricted Stock. Since the inception of the Plan, no director has forfeited any shares of Restricted Stock. The Company recognizes as compensation the market value of the Restricted Stock in the period it is issued.
The following table reflects the director compensation activity pursuant to the Plan:
2017 | 2016 | 2015 | ||||||||||||||||||
Shares | Weighted-Average Fair Value on Date of Grant | Shares | Weighted-Average Fair Value on Date of Grant | Shares | Weighted-Average Fair Value on Date of Grant | |||||||||||||||
Beginning of year balance | 107,023 | $ | 10.11 | 100,373 | $ | 9.80 | 94,267 | $ | 9.53 | |||||||||||
Granted | 4,870 | 16.77 | 6,650 | 14.79 | 6,106 | 13.92 | ||||||||||||||
Vested | — | — | — | — | — | — | ||||||||||||||
Forfeited | — | — | — | — | — | — | ||||||||||||||
End of year balance | 111,893 | $ | 10.56 | 107,023 | $ | 10.11 | 100,373 | $ | 9.80 | |||||||||||
The fair market value of the Restricted Stock issued as compensation during fiscal 2017, 2016 and 2015 was $99,400, $98,334 and $85,000. No Restricted Stock vested or was forfeited during fiscal 2017, 2016 and 2015.
As of September 30, 2017, the Company had 85,233 shares available for issuance under the Plan.
59
RGC Resources, Inc. Restricted Stock Plan
The Board of Directors of the Company implemented the RGC Resources, Inc. Restricted Stock Plan (the “Restricted Stock Plan”) in 2017 following approval by the shareholders at the Company's annual meeting held on February 6, 2017. Under the Restricted Stock Plan, the Compensation Committee of the Board of Directors may grant shares of restricted stock that vest over time to key employees and officers for the purpose of attracting and retaining those individuals essential to the operation and growth of the Company. The Restricted Stock Plan provides for certain restrictions and non-transferability requirements until minimum levels of ownership are obtained. Such restrictions may continue beyond the vesting period.
The Restricted Stock Plan originally authorized 300,000 shares to be available for issuance; however, following the three-for-two stock split on March 1, 2017, the total authorized shares increased to 450,000. As of September 30, 2017, no shares have been granted under the Restricted Stock Plan.
Stock Bonus Plan
Under the Stock Bonus Plan, executive officers are encouraged to own a position in the Company’s common stock of at least 50% of the value of their annual salary. To promote this policy, the Plan provides that all officers with stock ownership positions below 50% of the value of their annual salaries must, unless approved by the Committee, use no less than 50% of any performance bonus to purchase Company common stock. Shares from the Stock Bonus Plan may also be issued to certain employees and management personnel in recognition of their performance and service. Under the Stock Bonus Plan, the Company issued 1,628, 2,813 and 4,097 shares valued at $30,154, $39,819 and $59,332, respectively, in 2017, 2016 and 2015. As of September 30, 2017 the Company had 4,785 shares of stock available for issuance under the Stock Bonus Plan.
11. | COMMITMENTS AND CONTINGENCIES |
Long-Term Contracts
Due to the nature of the natural gas distribution business, the Company enters into agreements with both suppliers and pipelines to contract for natural gas commodity purchases, storage capacity and pipeline delivery capacity. The Company obtains most of its regulated natural gas supply through an asset management contract between Roanoke Gas and a third party asset manager. The Company utilizes an asset manager to optimize the use of its transportation, storage rights, and gas supply inventories which helps to ensure a secure and reliable source of natural gas. Under the current asset management contract, the Company has designated the asset manager to act as agent for the Company's storage capacity and all gas balances in storage. The Company retains ownership of gas in storage. Under provisions of this contract, the Company is obligated to purchase its winter storage requirements from the asset manager during the spring and summer injection periods at market price. The table below details the volumetric obligations as of September 30, 2017 for the remainder of the contract period. The current asset management contract will expire in March 2018.
Year | Natural Gas Contracts (In Decatherms) | ||
2017-2018 | 369,828 | ||
Total | 369,828 | ||
60
The Company also has contracts for pipeline and storage capacity which extend for various periods. These capacity costs and related fees are valued at tariff rates in place as of September 30, 2017. These rates may increase or decrease in the future based upon rate filings and rate orders granting a rate change to the pipeline or storage operator. Roanoke Gas expended approximately $28,496,000, $24,852,000 and $33,405,000 under the asset management, pipeline and storage contracts in fiscal years 2017, 2016 and 2015, respectively. The table below details the pipeline and storage capacity obligations as of September 30, 2017 for the remainder of the contract period.
Year | Pipeline and Storage Capacity | |||
2017-2018 | $ | 11,232,436 | ||
2018-2019 | 10,113,115 | |||
2019-2020 | 7,633,155 | |||
2020-2021 | 5,221,751 | |||
2021-2022 | 4,565,743 | |||
Thereafter | 3,067,053 | |||
Total | $ | 41,833,253 | ||
Other Contracts
The Company maintains other agreements in the ordinary course of business covering various lease, maintenance, equipment and service contracts. These agreements currently extend through December 2031 and are not material to the Company.
Legal
From time to time, the Company may become involved in litigation or claims arising out of its operations in the normal course of business. At the current time, the Company is not known to be a party to any legal proceedings that would be expected to have a materially adverse impact on its financial position, results of operations or cash flows.
Environmental Matters
Both Roanoke Gas and a previously owned gas subsidiary operated manufactured gas plants (MGPs) as a source of fuel for lighting and heating until the early 1950’s. A by-product of operating MGPs was coal tar, and the potential exists for tar waste contaminants at the former plant sites. While the Company does not currently recognize any commitments or contingencies related to environmental costs at either site, should the Company ever be required to remediate either site, it will pursue all prudent and reasonable means to recover any related costs, including the use of insurance claims and regulatory approval for rate case recognition of expenses associated with any work required.
12. | FAIR VALUE MEASUREMENTS |
The following table summarizes the Company’s financial assets and liabilities that are measured at fair value on a recurring basis and the fair value measurements by level within the fair value hierarchy as defined in Note 1 as of September 30, 2017 and 2016, respectively:
Fair Value Measurements - September 30, 2017 | ||||||||||||||||
Fair Value | Quoted Prices in Active Markets Level 1 | Significant Other Observable Inputs Level 2 | Significant Unobservable Inputs Level 3 | |||||||||||||
Assets: | ||||||||||||||||
Interest rate swaps | $ | 116,843 | $ | — | $ | 116,843 | $ | — | ||||||||
Total | $ | 116,843 | $ | — | $ | 116,843 | $ | — | ||||||||
Liabilities: | ||||||||||||||||
Natural gas purchases | $ | 805,159 | $ | — | $ | 805,159 | $ | — | ||||||||
Total | $ | 805,159 | $ | — | $ | 805,159 | $ | — | ||||||||
61
Fair Value Measurements - September 30, 2016 | ||||||||||||||||
Fair Value | Quoted Prices in Active Markets Level 1 | Significant Other Observable Inputs Level 2 | Significant Unobservable Inputs Level 3 | |||||||||||||
Liabilities: | ||||||||||||||||
Natural gas purchases | $ | 1,052,930 | $ | — | $ | 1,052,930 | $ | — | ||||||||
Total | $ | 1,052,930 | $ | — | $ | 1,052,930 | $ | — | ||||||||
Under the asset management contract, a timing difference can exist between the payment for natural gas purchases and the actual receipt of such purchases. Payments are made based on a predetermined monthly volume with the price based on the weighted average first of the month index prices corresponding to the month of the scheduled payment. At September 30, 2017 and 2016, the Company had recorded in accounts payable the estimated fair value of the liability determined on the corresponding first of month index prices for which the liability was expected to be settled.
The Company’s nonfinancial assets and liabilities that are measured at fair value on a nonrecurring basis consist of its asset retirement obligations. The asset retirement obligations are measured at fair value at initial recognition based on expected future cash flows to settle the obligation.
The carrying value of cash and cash equivalents, accounts receivable, borrowings under line-of-credit, accounts payable (with the exception of the timing difference under the asset management contract), customer credit balances and customer deposits is a reasonable estimate of fair value due to the shorter-term nature of these financial instruments. The following table summarizes the fair value of the Company’s financial assets and liabilities that are not adjusted to fair value in the financial statements as of September 30, 2017 and 2016.
Fair Value Measurements - September 30, 2017 | ||||||||||||||||
Carrying Amount | Quoted Prices in Active Markets Level 1 | Significant Other Observable Inputs Level 2 | Significant Unobservable Inputs Level 3 | |||||||||||||
Liabilities: | ||||||||||||||||
Long-term debt | $ | 43,812,200 | $ | — | $ | — | $ | 45,689,238 | ||||||||
Total | $ | 43,812,200 | $ | — | $ | — | $ | 45,689,238 | ||||||||
Fair Value Measurements - September 30, 2016 | ||||||||||||||||
Carrying Amount | Quoted Prices in Active Markets Level 1 | Significant Other Observable Inputs Level 2 | Significant Unobservable Inputs Level 3 | |||||||||||||
Liabilities: | ||||||||||||||||
Long-term debt | $ | 33,896,200 | $ | — | $ | — | $ | 36,163,523 | ||||||||
Total | $ | 33,896,200 | $ | — | $ | — | $ | 36,163,523 | ||||||||
The fair value of long-term debt for Roanoke Gas is estimated by discounting the future cash flows of the fixed rate debt based on the underlying 20-year Treasury rate and estimated credit spread extrapolated based on market conditions since the issuance of the debt. A 64 basis point increase in the 20-year Treasury in fiscal 2017 partially offset by a reduction in the assumed credit spreads accounted for the smaller differential between the fair value and the carrying amount of the notes payable at the end of the year. The fair value for the RGC Midstream debt is estimated by discounting the estimated credit spread extrapolated based on market conditions.
FASB ASC 825 – Financial Instruments requires disclosures regarding concentrations of credit risk from financial instruments. Cash equivalents are investments in high-grade, short-term securities (original maturity less than three months), placed with financially sound institutions. Accounts receivable are from a diverse group of customers including individuals and small and large companies in various industries. The Company maintains certain credit standards with its customers and requires a customer deposit if such evaluation warrants.
62
13. | QUARTERLY FINANCIAL INFORMATION (UNAUDITED) |
Quarterly financial data for the years ended September 30, 2017 and 2016 is summarized as follows:
2017 | First Quarter | Second Quarter | Third Quarter | Fourth Quarter | ||||||||||||
Operating revenues | $ | 18,788,585 | $ | 21,900,013 | $ | 11,435,824 | $ | 10,172,448 | ||||||||
Gross margin | $ | 9,390,905 | $ | 10,829,730 | $ | 6,634,402 | $ | 5,954,120 | ||||||||
Operating income | $ | 3,982,275 | $ | 5,589,207 | $ | 1,328,207 | $ | 766,620 | ||||||||
Net income | $ | 2,232,218 | $ | 3,225,199 | $ | 615,562 | $ | 159,886 | ||||||||
Earnings per share of common stock: | ||||||||||||||||
Basic | $ | 0.31 | $ | 0.45 | $ | 0.09 | $ | 0.02 | ||||||||
Diluted | $ | 0.31 | $ | 0.45 | $ | 0.08 | $ | 0.02 | ||||||||
2016 | First Quarter | Second Quarter | Third Quarter | Fourth Quarter | ||||||||||||
Operating revenues | $ | 16,010,056 | $ | 21,777,773 | $ | 11,295,197 | $ | 9,980,265 | ||||||||
Gross margin | $ | 8,738,116 | $ | 10,649,269 | $ | 6,312,340 | $ | 5,865,189 | ||||||||
Operating income | $ | 3,498,052 | $ | 5,444,314 | $ | 1,453,350 | $ | 816,376 | ||||||||
Net income | $ | 1,922,790 | $ | 3,111,447 | $ | 627,068 | $ | 145,561 | ||||||||
Earnings per share of common stock: | ||||||||||||||||
Basic | $ | 0.27 | $ | 0.44 | $ | 0.09 | $ | 0.02 | ||||||||
Diluted | $ | 0.27 | $ | 0.44 | $ | 0.09 | $ | 0.02 | ||||||||
14. | SUBSEQUENT EVENTS |
On October 2, 2017, Roanoke Gas entered into two 10-year unsecured notes with Prudential Investment Management in the total principal amount of $8,000,000. The notes have an annual interest rate of 3.58%. The proceeds from the note will be used to convert a portion of the Company's line-of-credit balance into longer-term financing.
The Company has evaluated subsequent events through the date the financial statements were issued. There were no other items not otherwise disclosed which would have materially impacted the Company’s consolidated financial statements.
* * * * * *
63
Item 9. | Changes in and Disagreements with Accountants on Accounting and Financial Disclosure. |
None.
Item 9A. | Controls and Procedures. |
The Company maintains disclosure controls and procedures (as defined in Rules 13a-15(e) and 15d-15(e) under the Securities Exchange Act of 1934, as amended (the “Exchange Act”)) that are designed to be effective in providing reasonable assurance that information required to be disclosed in reports under the Exchange Act are recorded, processed, summarized and reported within the time periods specified in the rules and forms of the Securities and Exchange Commission (the “SEC”), and that such information is accumulated and communicated to management to allow for timely decisions regarding required disclosure.
As of September 30, 2017, the Company completed an evaluation, under the supervision and with the participation of management, including the chief executive officer and the chief financial officer, of the effectiveness of the design and operation of the Company’s disclosure controls and procedures. Based upon that evaluation, the chief executive officer and chief financial officer concluded that the Company’s disclosure controls and procedures were effective at the reasonable assurance level as of September 30, 2017.
Management routinely reviews the Company’s internal control over financial reporting and makes changes, as necessary, to enhance the effectiveness of the internal controls over financial reporting. There were no changes in the internal controls over financial reporting during the fourth quarter of the fiscal year covered by this report that have materially affected, or are reasonably likely to materially affect, the Company’s internal control over financial reporting.
MANAGEMENT’S REPORT ON INTERNAL CONTROL OVER FINANCIAL REPORTING
The Company’s management is responsible for establishing and maintaining adequate internal control over financial reporting (as defined in Rules 13a-15(f) under the Securities and Exchange Act of 1934). Internal control over financial reporting is a process designed to provide reasonable assurance regarding the reliability of financial reporting and the preparation and fair presentation of financial statements for external purposes in accordance with accounting principles generally accepted in the United States of America and include those policies and procedures that: (i) pertain to the maintenance of records that, in reasonable detail, accurately and fairly reflect the transactions and dispositions of the assets of the Company; (ii) provide reasonable assurance that transactions are recorded as necessary to permit preparation of financial statements in accordance with generally accepted accounting principles, and that receipts and expenditures are being made only in accordance with authorizations of the management and directors of the Company; and (iii) provide reasonable assurance regarding prevention or timely detection of unauthorized acquisition, use, or disposition of the Company’s assets that could have a material effect on the financial statements.
Because of the inherent limitations, any system of internal control over financial reporting, no matter how well designed, may not prevent or detect misstatements due to the possibility that a control can be circumvented or overridden or that misstatements due to error or fraud may occur that are not detected. Projections of the effectiveness to future periods are subject to the risk that the internal controls may become inadequate because of changes in conditions, or that the degree of compliance with the policies and procedures included in such controls may deteriorate. The Company’s internal control system was designed to provide reasonable assurance regarding the reliability of financial reporting and the preparation of financial statements for external purposes in accordance with GAAP.
The Company has conducted an evaluation of the design and effectiveness of the Company’s system of internal control over financial reporting as of September 30, 2017, based on the framework set forth in ”Internal Control - Integrated Framework (2013)” issued by the Committee of Sponsoring Organizations of the Treadway Commission. Based upon such evaluation, the Company concluded that, as of September 30, 2017, the Company’s internal control over financial reporting was effective.
The Company’s independent registered public accounting firm, Brown, Edwards & Company, LLP, has issued its report on the effectiveness of the Company’s internal control over financial reporting as of September 30, 2017.
64
REPORT OF INDEPENDENT REGISTERED PUBLIC ACCOUNTING FIRM
Board of Directors and Stockholders
RGC Resources, Inc.
Roanoke, Virginia
We have audited RGC Resources, Inc. and Subsidiaries (“the Company”)’s internal control over financial reporting as of September 30, 2017, based on criteria established in Internal Control-Integrated Framework - 2013 issued by the Committee of Sponsoring Organizations of the Treadway Commission (COSO). RGC Resources, Inc. and Subsidiaries’ management is responsible for maintaining effective internal control over financial reporting and for its assessment of the effectiveness of internal control over financial reporting included in the accompanying Management's Report on Internal Control over Financial Reporting. Our responsibility is to express an opinion on the Company’s internal control over financial reporting based on our audit.
We conducted our audit in accordance with the standards of the Public Company Accounting Oversight Board (United States). Those standards require that we plan and perform the audit to obtain reasonable assurance about whether effective internal control over financial reporting was maintained in all material respects. Our audit of internal control over financial reporting included obtaining an understanding of internal control over financial reporting, assessing the risk that a material weakness exists, and testing and evaluating the design and operating effectiveness of internal control based on the assessed risk. Our audit also included performing such other procedures as we considered necessary in the circumstances. We believe that our audit provides a reasonable basis for our opinion.
A company’s internal control over financial reporting is a process designed to provide reasonable assurance regarding the reliability of financial reporting and the preparation of financial statements for external purposes in accordance with generally accepted accounting principles. A company’s internal control over financial reporting includes those policies and procedures that (1) pertain to the maintenance of records that, in reasonable detail, accurately and fairly reflect the transactions and dispositions of the assets of the company; (2) provide reasonable assurance that transactions are recorded as necessary to permit preparation of financial statements in accordance with generally accepted accounting principles, and that receipts and expenditures of the company are being made only in accordance with authorizations of management and directors of the company; and (3) provide reasonable assurance regarding prevention or timely detection of unauthorized acquisition, use, or disposition of the company’s assets that could have a material effect on the financial statements.
Because of its inherent limitations, internal control over financial reporting may not prevent or detect misstatements. Also, projections of any evaluation of effectiveness to future periods are subject to the risk that controls may become inadequate because of changes in conditions, or that the degree of compliance with the policies or procedures may deteriorate.
In our opinion, RGC Resources, Inc. and Subsidiaries (“the Company”) maintained, in all material respects, effective internal control over financial reporting as of September 30, 2017, based on criteria established in Internal Control-Integrated Framework - 2013 issued by the Committee of Sponsoring Organizations of the Treadway Commission (COSO).
We have also audited, in accordance with the standards of the Public Company Accounting Oversight Board (United States), the consolidated balance sheets as of September 30, 2017 and 2016 and the related consolidated statements of income, comprehensive income, stockholders’ equity, and cash flows of RGC Resources, Inc. and Subsidiaries for each of the years in the three year period ended September 30, 2017, and our report dated December 8, 2017 expressed an unqualified opinion.
|
CERTIFIED PUBLIC ACCOUNTANTS |
Blacksburg, Virginia
December 8, 2017
65
Item 9B. | Other Information. |
None
66
PART III
Item 10. | Directors, Executive Officers and Corporate Governance. |
For information with respect to the executive officers of the registrant, see “Executive Officers" section in the Proxy Statement for the 2018 Annual Meeting of Shareholders of Resources incorporated herein by reference. For information with respect to the Company’s directors and nominees and the Company’s Audit Committee, see Proposal 1 “Election of Directors of Resources” and “Report of the Audit Committee”, respectively, in the Proxy Statement for the 2018 Annual Meeting of Shareholders of Resources, which information is incorporated herein by reference. In addition, the Board of Directors has determined that Abney S. Boxley, III, George W. Logan and Raymond D. Smoot, Jr. are audit committee financial experts under applicable SEC rules.
For information regarding the process for identifying and evaluating candidates to be nominated as directors, see "Director Nominations" in the Proxy Statement for the 2018 Annual Meeting of Shareholders of Resources, which is incorporated herein by reference.
Information with respect to compliance with Section 16(a) of the Exchange Act, which is set forth under the caption "Section 16 (a) Beneficial Ownership Reporting Compliance" in the Proxy Statement for the 2018 Annual Meeting of Shareholders of Resources, is incorporated herein by reference.
The Company has adopted a Code of Ethics applicable to all of its officers, directors and employees. The Company has posted the text of its Code of Ethics on its website at www.rgcresources.com. The Board of Directors has adopted charters for the Audit, Compensation, and Corporate Governance and Nominating Committees of the Board of Directors. These documents may also be found on the Company’s website at www.rgcresources.com.
Item 11. | Executive Compensation. |
The information set forth under "Compensation of Directors", "Compensation Discussion and Analysis" and "Report of the Compensation Committee" in the Proxy Statement for the 2018 Annual Meeting of Shareholders of Resources is incorporated herein by reference.
Item 12. | Security Ownership of Certain Beneficial Owners and Management and Related Stockholder Matters. |
For information pertaining to securities authorized for issuance under equity compensation plans, see Part II, Item 5 above.
The information pertaining to shareholders beneficially owning more than five percent of the registrant’s common stock and the security ownership of management, which is set forth under the caption “Security Ownership of Certain Beneficial Owners and Management" in the Proxy Statement for the 2018 Annual Meeting of Shareholders of Resources, is incorporated herein by reference.
Item 13. | Certain Relationships and Related Transactions, and Director Independence. |
The information pertaining to director independence is set forth under the caption “Board of Directors and Committees of the Board of Directors” and pertaining to transactions with related persons is set forth under the caption "Transactions with Related Persons" in the Proxy Statement for the 2018 Annual Meeting of Shareholders of Resources, which information is incorporated herein by reference.
Item 14. | Principal Accounting Fees and Services. |
The information set forth under the caption "Report of the Audit Committee" in the Proxy Statement for the 2018 Annual Meeting of Shareholders of Resources is incorporated herein by reference.
67
PART IV
Item 15. | Exhibits and Financial Statement Schedules. |
(a) | List of documents filed as part of this report: |
1. | Financial statements filed as part of this report: |
All financial statements of the registrant as set forth under Item 8 of this Report on Form 10-K.
2. | Financial statement schedules filed as part of this report: |
All information is inapplicable or presented in the consolidated financial statements or related notes thereto.
3. | Exhibits to this Form 10-K filed as part of this report: |
10 (f) | ||
10 (o) | ||
10 (i)(i) | ||
13 | ||
21 | ||
23 | ||
31.1 | ||
31.2 | ||
32.1* | ||
32.2* | ||
101 | The following documents from the Registrant’s Annual Report on Form 10-K for the years ended September 30, 2017, 2016 and 2015, formatted in XBRL (eXtensible Business Reporting Language); Consolidated Balance Sheets at September 30, 2017 and 2016, (ii) Consolidated Statements of Income for the years ended September 30, 2017, 2016 and 2015, (iii) Consolidated Statements of Comprehensive Income for the years ended September 30, 2017, 2016 and 2015, (iv) Consolidated Statements of Stockholders’ Equity for the years ended September 30, 2017, 2016 and 2015, (v) Consolidated Statements of Cash Flows for the years ended September 30, 2017, 2016 and 2015, and (vi) Notes to Consolidated Financial Statements. | |
* | These certifications are being furnished solely to accompany this annual report pursuant to 18 U.S.C. Section 1350, and are not being filed for purposes of Section 18 of the Securities Exchange Act of 1934 and are not to be incorporated by reference into any filing of the registrant, whether made before or after the date hereof, regardless of any general incorporation language in such filing. |
Item 16. | Form 10-K Summary. |
Not applicable.
68
SIGNATURES
Pursuant to the requirements of Section 13 or 15(d) of the Securities Exchange Act of 1934, the Registrant has duly caused this Annual Report on Form 10-K to be signed on its behalf by the undersigned, thereunto duly authorized.
RGC RESOURCES, INC. | ||||
By: | /S/ PAUL W. NESTER | December 8, 2017 | ||
Paul W. Nester | Date | |||
Vice President, Secretary, Treasurer and CFO | ||||
(principal accounting and financial officer) | ||||
69
Pursuant to the requirements of the Securities Exchange Act of 1934, this Annual Report on Form 10-K has been signed below by the following persons on behalf of the Registrant and in the capacities and on the dates indicated.
/S/ JOHN S. D'ORAZIO | December 8, 2017 | President and Chief Executive Officer, Director | ||
John S. D'Orazio | Date | |||
/S/ PAUL W. NESTER | December 8, 2017 | Vice President, Treasurer and CFO (principal accounting and financial officer) | ||
Paul W. Nester | Date | |||
/S/ JOHN B. WILLIAMSON, III | December 8, 2017 | Chairman of the Board and Director | ||
John B. Williamson, III | Date | |||
/S/ NANCY H. AGEE | December 8, 2017 | Director | ||
Nancy H. Agee | Date | |||
/S/ ABNEY S. BOXLEY, III | December 8, 2017 | Director | ||
Abney S. Boxley, III | Date | |||
/S/ MARYELLEN F. GOODLATTE | December 8, 2017 | Director | ||
Maryellen F. Goodlatte | Date | |||
/S/ J. ALLEN LAYMAN | December 8, 2017 | Director | ||
J. Allen Layman | Date | |||
/S/ GEORGE W. LOGAN | December 8, 2017 | Director | ||
George W. Logan | Date | |||
/S/ S. FRANK SMITH | December 8, 2017 | Director | ||
S. Frank Smith | Date | |||
/S/ RAYMOND D. SMOOT, JR. | December 8, 2017 | Director | ||
Raymond D. Smoot, Jr. | Date | |||
70
EXHIBIT INDEX
Exhibit No. | Description | |
3 (a) | ||
3 (b) | ||
4 (a) | ||
4 (b) | ||
4 (c) | ||
10 (a) | P | Firm Transportation Agreement between East Tennessee Natural Gas Company and Roanoke Gas Company dated November 1, 1993 (incorporated herein by reference to Exhibit 10(a) of the Annual Report on Form 10-K for the fiscal year ended September 30, 1994 (SEC file number reference 0-367)) |
10 (b) | ||
10 (c) | ||
10 (d) | ||
10 (e) | ||
10 (f) | ||
10 (g) | ||
10 (h) | P | Gas Transportation Agreement, for use under FT-A rate schedule, between Tennessee Gas Pipeline Company and Roanoke Gas Company dated November 1, 1993 (incorporated herein by reference to Exhibit 10(k) of the Annual Report on Form 10-K for the fiscal year ended September 30, 1994 (SEC file number reference 0-367)) |
10 (i) | P | Gas Transportation Agreement, for use under IT rate schedule, between Tennessee Gas Pipeline Company and Roanoke Gas Company dated September 1, 1993 (incorporated herein by reference to Exhibit 10(l) of the Annual Report on Form 10-K for the fiscal year ended September 30, 1994 (SEC file number reference 0-367)) |
10 (j) | P | Gas Storage Contract under rate schedule FS (Market Area) Portland between Tennessee Gas Pipeline Company and Roanoke Gas Company dated November 1, 1993 (incorporated herein by reference to Exhibit 10(k)(k) of the Annual Report on Form 10-K for the fiscal year ended September 30, 1994 (SEC file number reference 0-367)) |
10 (k) | ||
10 (l) | ||
10 (m) | ||
10 (n) | ||
10(o) | ||
10 (p) | ||
10 (q) | ||
10 (r) | ||
10 (s) | ||
10 (t) | ||
10 (u) | ||
10 (v) | ||
10 (w) | P | Certificate of Public Convenience and Necessity for Bedford County dated February 21, 1966 (incorporated herein by reference to Exhibit 10(o) of Registration Statement No. 33-36605, on Form S-2, filed with the Commission on August 29, 1990, and amended by Amendment No. 1, filed with the Commission on September 19, 1990) |
10 (x) | P | Certificate of Public Convenience and Necessity for Roanoke County dated October 19, 1965 (incorporated herein by reference to Exhibit 10(p) of Registration Statement No. 33-36605, on Form S-2, filed with the Commission on August 29, 1990, and amended by Amendment No. 1, filed with the Commission on September 19, 1990) |
10 (y) | P | Certificate of Public Convenience and Necessity for Botetourt County dated August 30, 1966 (incorporated herein by reference to Exhibit 10(q) of Registration Statement No. 33-36605, on Form S-2, filed with the Commission on August 29, 1990, and amended by Amendment No. 1, filed with the Commission on September 19, 1990) |
10 (z) | P | Certificate of Public Convenience and Necessity for Montgomery County dated July 8, 1985 (incorporated herein by reference to Exhibit 10(r) of Registration Statement No. 33-36605, on Form S-2, filed with the Commission on August 29, 1990, and amended by Amendment No. 1, filed with the Commission on September 19, 1990) |
10 (a)(a) | P | Certificate of Public Convenience and Necessity for Franklin County dated September 8, 1964 (incorporated herein by reference to Exhibit 10(t) of Registration Statement No. 33-36605, on Form S-2, filed with the Commission on August 29, 1990, and amended by Amendment No. 1, filed with the Commission on September 19, 1990) |
10 (b)(b) | P | Resolution of the Council for the Town of Fincastle, Virginia dated June 8, 1970 (incorporated herein by reference to Exhibit 10(f) of Registration Statement No. 33-11383, on Form S-4, filed with the Commission on January 16, 1987) |
10 (c)(c) | P | Resolution of the Council for the Town of Troutville, Virginia dated November 4, 1968 (incorporated herein by reference to Exhibit 10(g) of Registration Statement No. 33-11383, on Form S-4, filed with the Commission on January 16, 1987) |
10 (d)(d) | ||
10 (e)(e) | ||
10 (f)(f) | ||
10 (g)(g) | ||
10 (h)(h) | ||
10 (i)(i) | ||
10 (j)(j) | ||
10 (k)(k) | ||
10 (l)(l) | ||
10 (m)(m) | ||
10 (n)(n) | ||
10 (o)(o) | ||
10 (p)(p) | ||
10 (q)(q) | ||
10 (r)(r) | ||
10 (s)(s) | ||
10 (t)(t) | ||
10 (u)(u) | ||
10 (v)(v) | ||
10 (w)(w) | ||
10 (x)(x) | ||
10 (y)(y) | ||
10 (z)(z) | ||
10 (a)(a)(a) | ||
10 (b)(b)(b) | ||
10 (c)(c)(c) | ||
10 (d)(d)(d) | ||
10 (e)(e)(e) | ||
10 (f)(f)(f) | ||
10 (g)(g)(g) | ||
10 (h)(h)(h) | ||
10 (i)(i)(i) | ||
10 (j)(j)(j) | ||
10 (k)(k)(k) | ||
10 (l)(l)(l) | ||
10 (m)(m)(m) | ** | |
10 (n)(n)(n) | ** | |
10 (o)(o)(o) | ** | |
10 (p)(p)(p) | ||
13 | ||
21 | ||
23 | ||
31.1 | ||
31.2 | ||
32.1* | ||
32.2* | ||
101 | The following documents from the Registrant’s Annual Report on Form 10-K for the years ended September 30, 2017, 2016 and 2015, formatted in XBRL (eXtensible Business Reporting Language); Consolidated Balance Sheets at September 30, 2017 and 2016, (ii) Consolidated Statements of Income for the years ended September 30, 2017, 2016 and 2015, (iii) Consolidated Statements of Comprehensive Income for the years ended September 30, 2017. 2016 and 2015, (iv) Consolidated Statements of Stockholders’ Equity for the years ended September 30, 2017, 2016 and 2015, (v) Consolidated Statements of Cash Flows for the years ended September 30, 2017, 2016 and 2015, and (vi) Notes to Consolidated Financial Statements. | |
* | These certifications are being furnished solely to accompany this annual report pursuant to 18 U.S.C. Section 1350, and are not being filed for purposes of Section 18 of the Securities Exchange Act of 1934 and are not to be incorporated by reference into any filing of the registrant, whether made before or after the date hereof, regardless of any general incorporation language in such filing. |
** | Confidential treatment has been granted with respect to portions of this exhibit, indicated by asterisks, which has been filed separately with the Securities and Exchange Commission. |
P | These original exhibits were filed with the SEC in paper form and therefore are not hyper-linked to the original filing. |