Attached files
| file | filename |
|---|---|
| EX-99.3 - EXHIBIT 99.3 - Easterly Acquisition Corp. | tv481058_ex99-3.htm |
| EX-99.1 - EXHIBIT 99.1 - Easterly Acquisition Corp. | tv481058_ex99-1.htm |
| 8-K - FORM 8-K - Easterly Acquisition Corp. | tv481058_8k.htm |
Exhibit 99.2

I NVESTOR P RESENTATION Citi Investment Banking | Financial Institutions Group December 2017

DISCLAIMER NO OFFER OR SOLICITATION This presentation is for informational purposes only and is neither an offer to sell or purchase, nor the solicitation of an off er to buy or sell any securities, nor is it a solicitation of any vote, consent, or approval in any jurisdiction pursuant to or in connection with the Proposed Transaction (as defined below) or otherwise, nor shall there be any sale, issuance or transfer o f s ecurities in any jurisdiction in contravention of applicable law. ADDITIONAL INFORMATION AND WHERE TO FIND IT This communication relates to a proposed business combination (the “Proposed Transaction”) between Easterly Acquisition Corp. (“ Easterly”) and JH Capital Group Holdings, LLC (“JH Capital” or “JHC”) and may be deemed to be solicitation material in respect of the Proposed Transaction. In connection with the Proposed Transaction, Easterly intends to file with t he SEC a preliminary proxy statement. When completed, Easterly will mail a definitive proxy statement to its stockholders in connection with Easterly’s solicitation of proxies for the special meeting of Easterly stockholders to be hel d t o approve the business combination and related transactions. This presentation does not contain all the information that should be considered concerning the Proposed Transaction, including relevant risk factors that may be included in the proxy s tat ements. It is not intended to provide the basis for any investment decision or any other decision in respect to the Proposed Transaction. Easterly stockholders and other interested persons are advised to read, when available, Easterly’s prel imi nary proxy statement, the amendments thereto, and the definitive proxy statement (including any documents incorporated by reference therein), as these materials will contain important information about JH Capital, Easterly, and the Pr oposed Transaction. A copy of the definitive proxy statement will be sent when available to all stockholders of Easterly seeking the required stockholder approvals. Investors and stockholders can obtain free copies of the preliminary pro xy statement once it is available and other documents filed with the SEC by Easterly through the web site maintained by the SEC at www.sec.gov. In addition, investors and stockholders can obtain free copies of the preliminary proxy statement onc e it is available from Easterly by accessing Easterly’s website at www.easterlyacquisition.com. CERTAIN INFORMATION This presentation includes information based on independent industry publications and other sources. Although we believe that th e data presented is reliable, we have not independently verified such information. You should not construe the contents of this presentation as legal, accounting, business or tax advice and you should consult your own professional advis ors as to the legal, accounting, business, tax, financial or other matters contained herein. None of Easterly, JHC, nor any of their respective affiliates, directors, officers, management, employees, representatives and advisors makes any repres ent ation or warranty, express or implied, as to the accuracy or completeness of any of the information contained herein, or any other information (whether communicated in written or oral form) transmitted or made available to you. Recipie nts of the this presentation will be deemed to expressly disclaim any and all liability of any of the foregoing persons relating to or resulting from the use of this presentation or such other information (including without limitation, any marke t a nalysis and financial projections that may be contained herein or provided in connection herewith) by you or any of your directors, partners, officers, employees, affiliates, agents and representatives. PARTICIPANTS IN SOLICITATION Easterly and JH Capital, and their respective directors and executive officers, may be deemed participants in the solicitation of proxies of Easterly stockholders in respect of the Proposed Transaction. Information about the directors and executive officers of Easterly and JH Capital and more detailed information regarding the identity of all potential participan ts, and their direct and indirect interests, by security holdings or otherwise, will be set forth in Easterly’s preliminary proxy statement, when available. Investors may obtain additional information about the interests of such participants by reading su ch proxy statement. FORWARD - LOOKING STATEMENTS This presentation contains “forward - looking statements” within the meaning of Section 21E of the Securities Exchange Act of 1934 , as amended, and the Private Securities Litigation Reform Act of 1995, known as the PSLRA. Forward - looking statements may relate to the proposed business combination between Easterly and JH Capital and any other statements relating to future results, strategy and plans of Easterly and JH Capital (including certain projections and business trends, and statements which may be identified by the use of the words “plans”, “expects” or “does not expect”, “estimated”, “is expec ted ”, “budget”, “scheduled”, “estimates”, “forecasts”, “intends”, “anticipates” or “does not anticipate”, or “believes”, or variations of such words and phrases or state that certain actions, events or results “may”, “could”, “would”, “might”, “proj ect s”, “will” or “will be taken”, “occur” or “be achieved”). Forward - looking statements are based on the opinions and estimates of management of Easterly or JHC, as the case may be, as of the date such statements are made, and they are subject to known and unknown risks, uncertainties, assumptions and other factors that may cause the actual results, level of activity, performance or achievements to be materially different from those expressed or implied by such forward - looking stat ements. For JH Capital, these risks and uncertainties include, but are not limited to, its revenues and operating performance, general economic conditions, industry trends, legislation or regulatory requirements affecting the business in w hic h it is engaged, management of growth, amount of redemptions, its business strategy and plans, fluctuations in debt purchasing, investigations or enforcement actions by governmental authorities; individual and class action lawsuits, the resu lt of future financing efforts and its dependence on key personnel. For Easterly, factors include, but are not limited to, the successful combination of Easterly with JH Capital’s business, the ability to retain key personnel and the ability to ach iev e stockholder and regulatory approvals and to successfully close the transaction. Additional information on these and other factors that may cause actual results and Easterly’s performance to differ materially is included in Easterly’s periodi c r eports filed with the SEC, including but not limited to Easterly’s Form 10 - K for the year ended December 31, 2016 and subsequent Forms 10 - Q. Copies may be obtained by contacting Easterly or the SEC. Readers are cautioned not to place undue relian ce upon any forward - looking statements, which speak only as of the date made. These forward - looking statements are made only as of the date hereof, and Easterly undertakes no obligations to update or revise the forward - looking s tatements, whether as a result of new information, future events or otherwise, except as required by law. PROJECTIONS Any estimates, forecasts or projections set forth in this presentation have been prepared by JH Capital and/or Easterly manag eme nt in good faith on a basis believed to be reasonable. Such estimates, forecasts and projections involve significant elements of subjective judgment and analysis as well as risks (many of which are beyond our control). As such, no representat ion can be made as to the attainability of our forecasts and projections. Investors are cautioned that such estimates, forecasts or projections have not been audited and have not been prepared in conformance with generally accepted accounting p rin ciples. For a listing of risks and other factors that could impact our ability to attain our projected results, please see “Forward - Looking Statements” above. USE OF NON - GAAP FINANCIAL MEASURES This communication includes non - GAAP financial measures. Definitions of these non - GAAP financial measures and reconciliations of th ese non - GAAP financial measures to the most directly comparable GAAP financial measures are included elsewhere in this communication. HISTORICAL FINANCIAL DATA The historical financial data of JH Capital included herein is preliminary and has not been audited by an independent registe red public accounting firm. There is a risk that this unaudited historical financial data of JH Capital may contain errors that might have been detected in an audit and such financial information may not be reflective of JH Capital’s historical res ult s for those periods. Any differences between the financial information presented for these unaudited periods and JH Capital’s actual historical results may be material. The combined company intends to file audited financial statements of JH Cap ital for the years ending December 31, 2015 and December 31, 2016 in a Current Report on Form 8 - K within four business days of the closing. Accordingly, you are cautioned not to place undue reliance on such information that may not ne ces sarily be indicative of JH Capital’s actual financial position or results of operations. 1
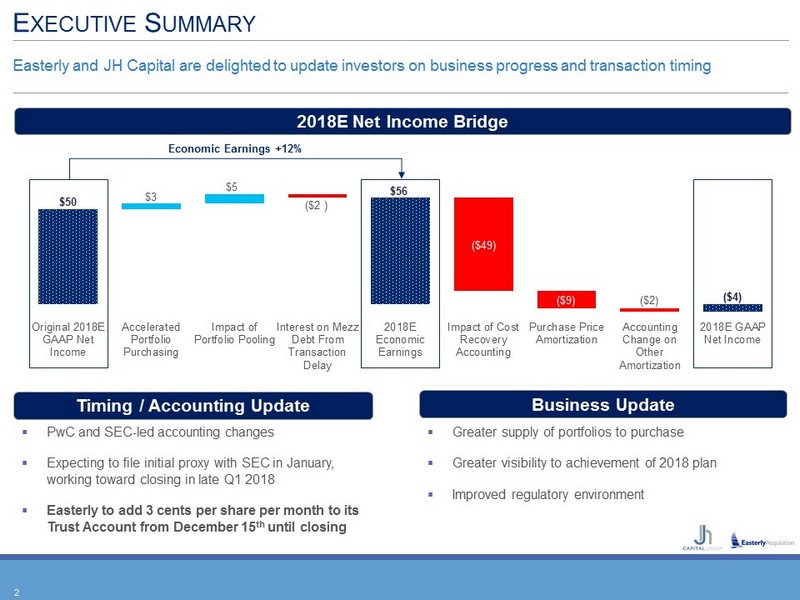
E XECUTIVE S UMMARY Easterly and JH Capital are delighted to update investors on business progress and transaction timing 2 Timing / Accounting Update Business Update ▪ PwC and SEC - led accounting changes ▪ Expecting to file initial proxy with SEC in January, working toward closing in late Q1 2018 ▪ Easterly to add 3 cents per share per month to its Trust Account from December 15 th until closing ▪ Greater supply of portfolios to purchase ▪ Greater visibility to achievement of 2018 plan ▪ Improved regulatory environment 2018E Net Income Bridge $50 $56 ($2) ($4) $3 $5 ( $2 ) ($49) ($9) Original 2018E GAAP Net Income Accelerated Portfolio Purchasing Impact of Portfolio Pooling Interest on Mezz Debt From Transaction Delay 2018E Economic Earnings Impact of Cost Recovery Accounting Purchase Price Amortization Accounting Change on Other Amortization 2018E GAAP Net Income Economic Earnings +12%

A CCOUNTING I MPACT ON F UTURE E ARNINGS Accounting treatment affects earnings though timing of revenue recognition, but does not affect total earnings over the life of a portfolio or cash collections $2 $50 $88 $125 ($25) ($4) $67 $86 ($2) $56 $73 $97 $111 $278 $433 $518 2017E 2018E 2019E 2020E Net Income (Old) Net Income (New) Economic Earnings Cash Collections Impact of New Accounting Methodology on Future Net Income ($ in millions) 3 Source: JH Capital provided materials.
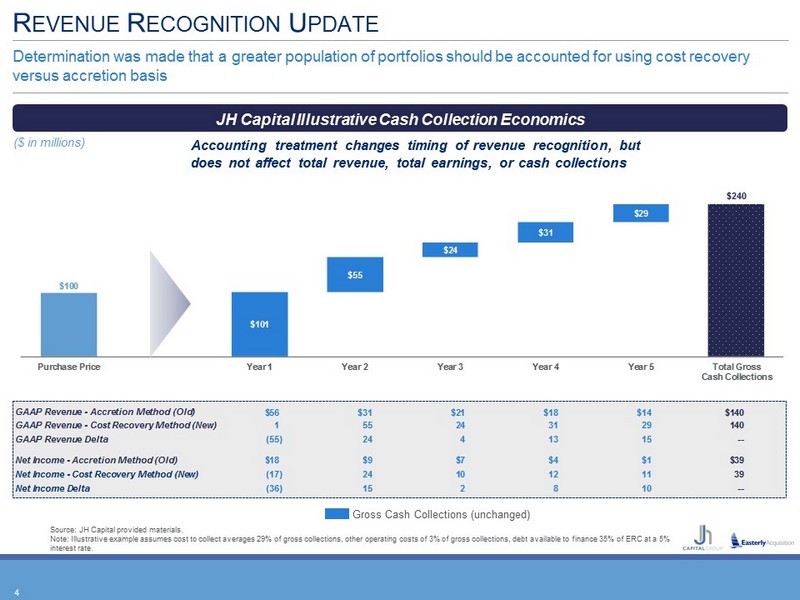
GAAP Revenue - Accretion Method (Old) $56 $31 $21 $18 $14 $140 GAAP Revenue - Cost Recovery Method (New) 1 55 24 31 29 140 GAAP Revenue Delta (55) 24 4 13 15 -- Net Income - Accretion Method (Old) $18 $9 $7 $4 $1 $39 Net Income - Cost Recovery Method (New) (17) 24 10 12 11 39 Net Income Delta (36) 15 2 8 10 -- $240 $100 $101 $55 $24 $31 $29 Purchase Price Year 1 Year 2 Year 3 Year 4 Year 5 Total Gross Cash Collections R EVENUE R ECOGNITION U PDATE Determination was made that a greater population of portfolios should be accounted for using cost recovery versus accretion basis Source: JH Capital provided materials. Note: Illustrative example assumes cost to collect averages 29% of gross collections, other operating costs of 3% of gross co lle ctions, debt available to finance 35% of ERC at a 5% interest rate. JH Capital Illustrative Cash Collection Economics ($ in millions) Gross Cash Collections (unchanged) 4 Accounting treatment changes timing of revenue recognition, but does not affect total revenue, total earnings, or cash collections

R ECONCILIATION OF GAAP TO E CONOMIC E ARNINGS Management believes that economic earnings provide a comparable metric to publicly traded industry peers ($ in millions) 5 2017E 2018E 2019E 2020E Economic Earnings ($2) $56 $73 $97 Impact of Cost Recovery Accounting (25) (49) 19 21 Purchase Price Amortization - (9) (12) (12) Implementation of DDB on Other Intangible Amortization 2 (2) (14) (20) Net Income – New (GAAP) ($25) ($4) $67 $86 Source: JH Capital provided materials.

T RADING L EVEL OF JH C APITAL P EERS Since June, the debt recovery industry has experienced strong tailwinds, driving public peers to trade at higher multiples Peer Trading: Price / 2018E 13.5x 21.7x 9.7x 11.1x June 29 December 7 June 29 December 7 EACQ $10.00 Stock Price Discount to (1) : PRA Group: 70% Encore Capital Group: 40% 6 Source: JH Capital provided materials, Factset , SNL Financial. Market data as of December 7, 2017. (1) Using comparable Economic Earnings (see page 5 for detail).
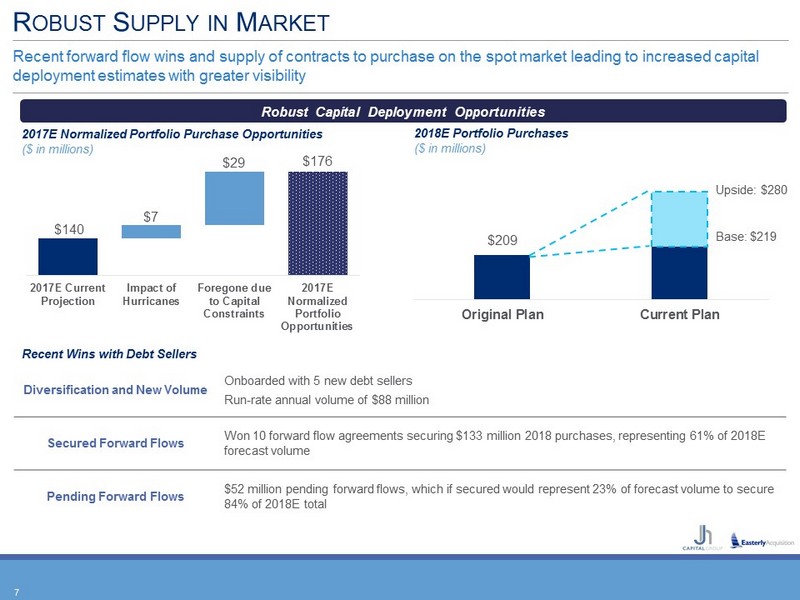
R OBUST S UPPLY IN M ARKET Robust Capital Deployment Opportunities Recent forward flow wins and supply of contracts to purchase on the spot market leading to increased capital deployment estimates with greater visibility 7 $209 Original Plan Current Plan 2018E Portfolio Purchases ($ in millions) Base: $219 Upside : $280 2017E Normalized Portfolio Purchase Opportunities ($ in millions) $7 $29 $140 $176 2017E Current Projection Impact of Hurricanes Foregone due to Capital Constraints 2017E Normalized Portfolio Opportunities Recent Wins with Debt Sellers Diversification and New Volume Onboarded with 5 new debt sellers Run - rate annual volume of $88 million Secured Forward Flows Won 10 forward flow agreements securing $133 million 2018 purchases, representing 61% of 2018E forecast volume Pending Forward Flows $52 million pending forward flows, which if secured would represent 23% of forecast volume to secure 84% of 2018E total

JH C APITAL D IFFERENTIATION 8 Data Philosophy Technology Operations JH Capital differentiates itself from competition through its proprietary data, technology architecture, operational scale, and philosophical approach to customers Value Driving Approach Proprietary, non - public data produced through purchased portfolios, rediscount lending operations, and its advocacy business has produced insights leading to collection results superior to peers Using the data in an automated way, scoring consumers based on data collected on calls to understand customer behavior At - scale operations can utilize different collection strategies for different consumers within each pool and adjust these in real time. The investment to develop this operational infrastructure is significant Consumer - friendly and human approach Differentiator
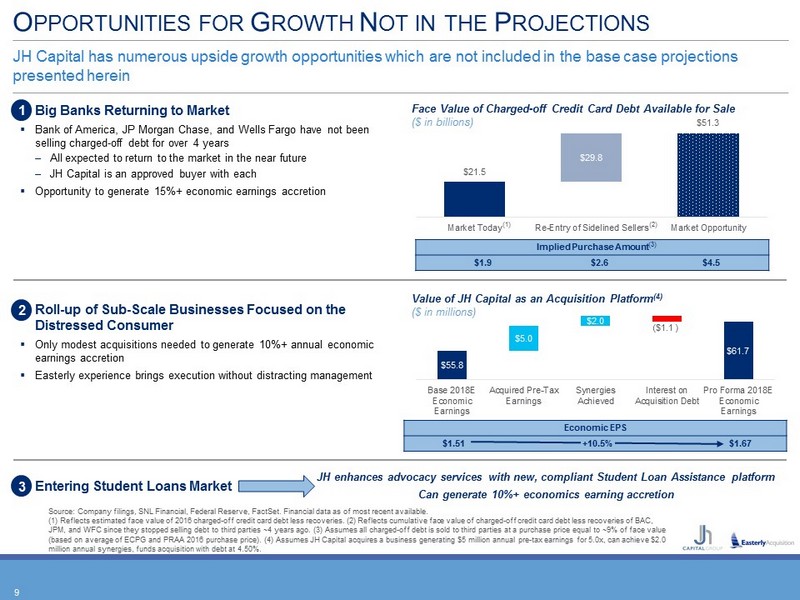
O PPORTUNITIES FOR G ROWTH N OT IN THE P ROJECTIONS 9 Big Banks Returning to Market ▪ Bank of America, JP Morgan Chase, and Wells Fargo have not been selling charged - off debt for over 4 years – All expected to return to the market in the near future – JH Capital is an approved buyer with each ▪ Opportunity to generate 15%+ economic earnings accretion JH Capital has numerous upside growth opportunities which are not included in the base case projections presented herein Roll - up of Sub - Scale Businesses Focused on the Distressed Consumer ▪ Only modest acquisitions needed to generate 10%+ annual economic earnings accretion ▪ Easterly experience brings execution without distracting management Entering Student Loans Market Face Value of Charged - off Credit Card Debt Available for Sale ($ in billions) $29.8 $21.5 $51.3 Market Today Re-Entry of Sidelined Sellers Market Opportunity Implied Purchase Amount $1.9 $2.6 $4.5 $55.8 $61.7 $5.0 $2.0 ( $1.1 ) Base 2018E Economic Earnings Acquired Pre-Tax Earnings Synergies Achieved Interest on Acquisition Debt Pro Forma 2018E Economic Earnings Value of JH Capital as an Acquisition Platform (4) ($ in millions) Economic EPS $1.51 $1.67 +10.5% 1 2 3 JH enhances advocacy services with new, compliant Student Loan Assistance platform Can generate 10%+ economics earning accretion (1) (2) (3) Source: Company filings, SNL Financial, Federal Reserve, FactSet . Financial data as of most recent available. (1) Reflects estimated face value of 2016 charged - off credit card debt less recoveries. (2) Reflects cumulative face value of ch arged - off credit card debt less recoveries of BAC, JPM, and WFC since they stopped selling debt to third parties ~4 years ago. (3) Assumes all charged - off debt is sold to third pa rties at a purchase price equal to ~9% of face value (based on average of ECPG and PRAA 2016 purchase price). (4) Assumes JH Capital acquires a business generating $5 million ann ual pre - tax earnings for 5.0x, can achieve $2.0 million annual synergies, funds acquisition with debt at 4.50%.
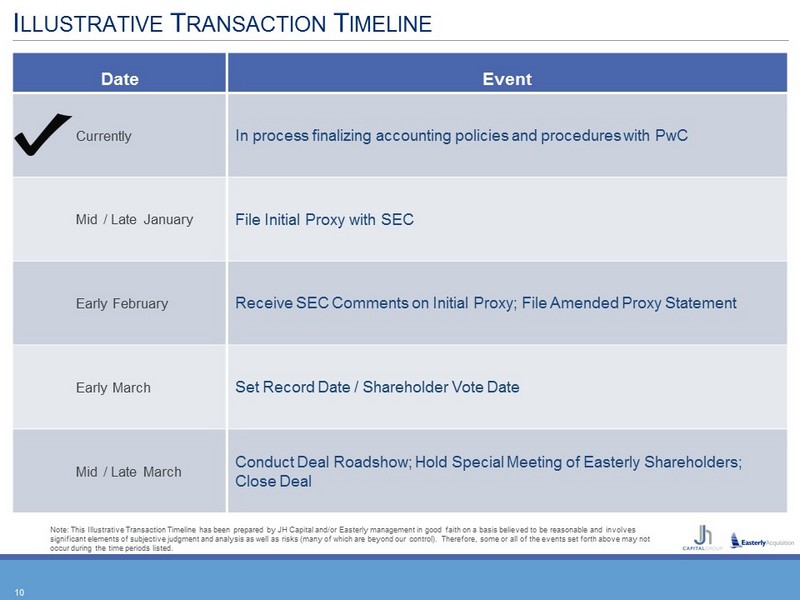
I LLUSTRATIVE T RANSACTION T IMELINE Date Event Currently In process finalizing accounting policies and procedures with PwC Mid / Late January File Initial Proxy with SEC Early February Receive SEC Comments on Initial Proxy; File Amended Proxy Statement Early March Set Record Date / Shareholder Vote Date Mid / Late March Conduct Deal Roadshow; Hold Special Meeting of Easterly Shareholders; Close Deal 10 Note: This Illustrative Transaction Timeline has been prepared by JH Capital and/or Easterly management in good faith on a ba sis believed to be reasonable and involves significant elements of subjective judgment and analysis as well as risks (many of which are beyond our control). Therefore, so me or all of the events set forth above may not occur during the time periods listed.

A PPENDIX : F INANCIAL P ROJECTIONS
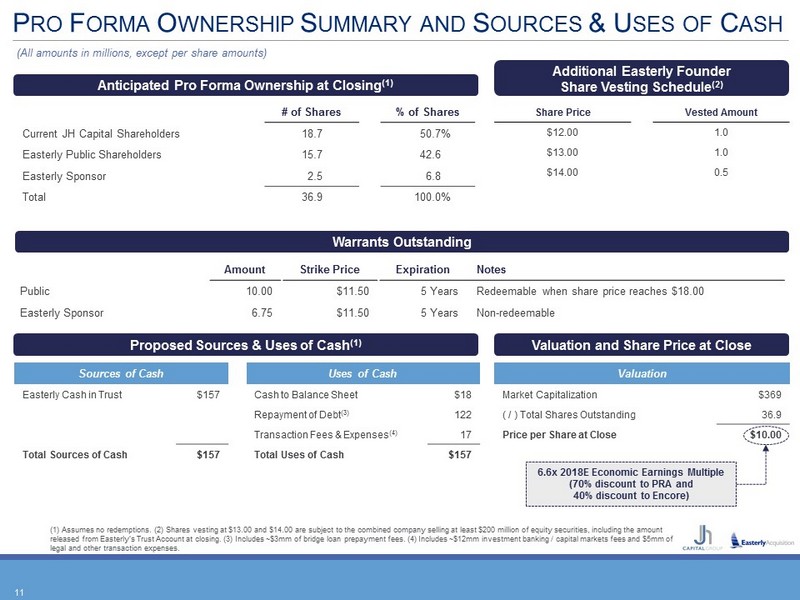
P RO F ORMA O WNERSHIP S UMMARY AND S OURCES & U SES OF C ASH Share Price Vested Amount $12.00 1.0 $13.00 1.0 $14.00 0.5 # of Shares % of Shares Current JH Capital Shareholders 18.7 50.7% Easterly Public Shareholders 15.7 42.6 Easterly Sponsor 2.5 6.8 Total 36.9 100.0% Anticipated Pro Forma Ownership at Closing (1) (All amounts in millions, except per share amounts) Amount Strike Price Expiration Notes Public 10.00 $11.50 5 Years Redeemable when share price reaches $18.00 Easterly Sponsor 6.75 $11.50 5 Years Non - redeemable Warrants Outstanding Additional Easterly Founder Share Vesting Schedule (2) Sources of Cash Uses of Cash Easterly Cash in Trust $157 Cash to Balance Sheet $18 Repayment of Debt (3) 122 Transaction Fees & Expenses (4) 17 Total Sources of Cash $157 Total Uses of Cash $157 Proposed Sources & Uses of Cash (1) Valuation Market Capitalization $369 ( / ) Total Shares Outstanding 36.9 Price per Share at Close $10.00 Valuation and Share Price at Close 6.6x 2018E Economic Earnings Multiple ( 70 % discount to PRA and 40% discount to Encore) (1) Assumes no redemptions. (2) Shares vesting at $13.00 and $14.00 are subject to the combined company selling at least $200 mi llion of equity securities, including the amount released from Easterly’s Trust Account at closing. (3) Includes ~$3mm of bridge loan prepayment fees. (4) Includes ~$12mm inv est ment banking / capital markets fees and $5mm of legal and other transaction expenses. 11
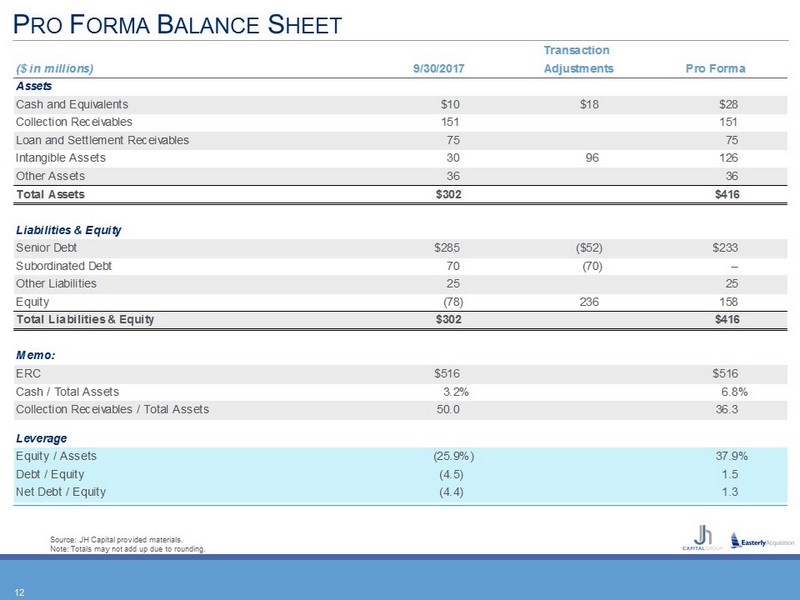
P RO F ORMA B ALANCE S HEET Source: JH Capital provided materials. Note: Totals may not add up due to rounding. Transaction ($ in millions) 9/30/2017 Adjustments Pro Forma Assets Cash and Equivalents $10 $18 $28 Collection Receivables 151 151 Loan and Settlement Receivables 75 75 Intangible Assets 30 96 126 Other Assets 36 36 Total Assets $302 $416 Liabilities & Equity Senior Debt $285 ($52) $233 Subordinated Debt 70 (70) -- Other Liabilities 25 25 Equity (78) 236 158 Total Liabilities & Equity $302 $416 Memo: ERC $516 $516 Cash / Total Assets 3.2% 6.8% Collection Receivables / Total Assets 50.0 36.3 Leverage Equity / Assets (25.9%) 37.9% Debt / Equity (4.5) 1.5 Net Debt / Equity (4.4) 1.3 12

% Change in Projections -- -- (13%) 5% 15% 15% $77 $89 $160 $209 $212 $233 $77 $89 $140 $219 $244 $269 2015A 2016A 2017E 2018E 2019E 2020E % Change in Projections -- -- (5%) (3%) (1%) (1%) $310 $431 $627 $827 $951 $1,058 $310 $431 $597 $806 $942 $1,045 2015A 2016A 2017E 2018E 2019E 2020E ERC AND D EPLOYMENTS G ROWING F ASTER THAN E XPECTED Given industry fundamentals, JH Capital has seen tremendous buying opportunities Estimated Remaining Collections Historical Forecasted ($ in millions) 13 Portfolio Purchases Historical Forecasted ($ in millions) Original Projection Current Projection Source: JH Capital provided materials.

Estimated Remaining Collections $431 $597 $806 $942 $1,045 Estimated Remaining Settlements $43 $52 $72 $84 $90 $120 $140 $228 $401 $478 $157 $197 $382 $568 $677 2016A 2017E 2018E 2019E 2020E ($25) ($4) $67 $86 ($10) ($2) $56 $73 $97 2016A 2017E 2018E 2019E 2020E $94 $186 $251 $332 $401 $53 $59 $102 $148 $186 $32 $37 $45 $53 $59 $178 $283 $398 $533 $647 2016A 2017E 2018E 2019E 2020E $89 $140 $219 $244 $269 $67 $79 $148 $184 $212 $156 $219 $367 $428 $481 2016A 2017E 2018E 2019E 2020E Loan Receivables (1) F INANCIAL H IGHLIGHTS Strong investment across platforms is driving balance sheet growth and robust top line performance with attractive returns for investors Strong Investment Across Platforms… …Driving Balance Sheet Growth… …and Robust Top Line Performance… …with Attractive Returns for Investors Originations (1) Purchases Collection Receivables Settlement Receivables GAAP Revenue Collection Method Revenue ($ in millions) Net Receivables ($ in millions) Net Income ($ in millions) Source: JH Capital provided materials. Note: Figures adjusted for assumed $157mm Easterly Acquisition investment. Cash earnings reflects net income plus depreciatio n a nd amortization. (1) Includes both consumer and commercial loans. (2) Reflects GAAP revenue CAGR. (3) See page 5 for detail. ($ in millions) 14 GAAP Earnings Economic Earnings (3)
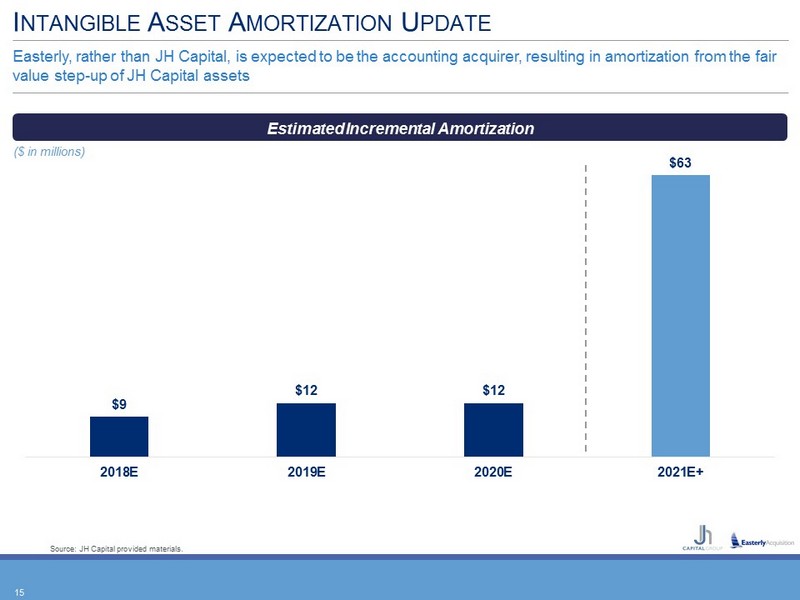
I NTANGIBLE A SSET A MORTIZATION U PDATE Easterly, rather than JH Capital, is expected to be the accounting acquirer, resulting in amortization from the fair value step - up of JH Capital assets 15 $9 $12 $12 $63 2018E 2019E 2020E 2021E+ Estimated Incremental Amortization ($ in millions) Source: JH Capital provided materials.

S UMMARY H ISTORICAL AND P ROJECTED F INANCIAL H IGHLIGHTS Source: JH Capital provided materials. (1) Primarily interest expense and amortization of acquired customer debt settlement contracts. (2) Reflects adjusted EBITDA / c ollection method revenue. ($ in millions) Historical Projected 2015A 2016A 2017E 2018E 2019E 2020E Revenue $76 $120 $140 $228 $401 $478 Operating Expenses 75 87 109 166 218 256 EBITDA (Accretion Method) 1 34 31 62 183 222 % Margin 1% 28% 22% 27% 46% 46% Other Expenses ($12) ($43) ($55) ($67) ($81) ($89) Taxes -- (0) (1) 2 (36) (46) Net Income ($12) ($10) ($25) ($4) $67 $86 Adjustments (4) -- 24 59 7 11 Economic Earnings ($16) ($10) ($2) $56 $73 $97 Adjusted EBITDA (Collection Method) $42 $71 $88 $215 $350 $421 % Margin 36% 45% 45% 56% 62% 62% ERC $310 $431 $597 $806 $942 $1,045 ERS 22 43 52 72 84 90 16 (2) (1)

P ROJECTED F INANCIAL H IGHLIGHTS - Q UARTERLY Source: JH Capital provided materials. (1) Primarily interest expense and amortization of acquired customer debt settlement contracts. (2) Reflects adjusted EBITDA / c ollection method revenue. 17 ($ in millions) Projected Q1'18 Q2'18 Q3'18 Q4'18 Q1'19 Q2'19 Q3'19 Q4'19 Revenue $48 $53 $60 $67 $88 $101 $105 $107 Operating Expenses 38 41 43 44 51 55 55 57 EBITDA (Accretion Method) 10 12 17 23 36 46 50 51 % Margin 21% 22% 29% 34% 41% 46% 47% 47% Other Expenses ($15) ($17) ($17) ($18) ($19) ($20) ($21) ($21) Taxes 2 2 (0) (2) (6) (9) (10) (10) Net Income ($3) ($3) $0 $3 $11 $17 $19 $19 Adjustments 10 17 16 16 5 (0) 0 2 Economic Earnings $7 $13 $16 $19 $16 $17 $19 $21 Adjusted EBITDA (Collection Method) $39 $52 $60 $66 $78 $87 $91 $94 % Margin 51% 56% 58% 60% 60% 61% 62% 62% ERC $662 $714 $757 $806 $843 $877 $902 $942 ERS 56 60 66 72 76 79 81 84 (2) (1)
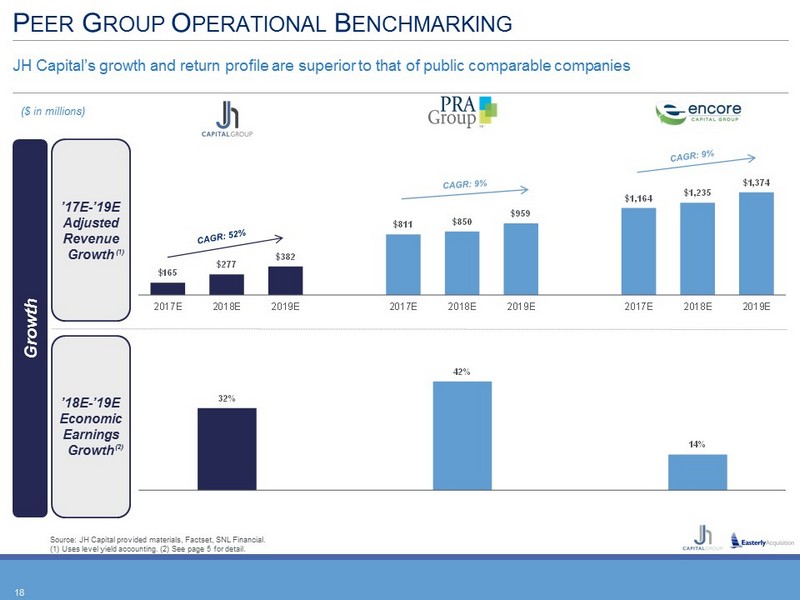
$165 $277 $382 $811 $850 $959 $1,164 $1,235 $1,374 2017E 2018E 2019E 2017E 2018E 2019E 2017E 2018E 2019E 32% 42% 14% JH Capital PRAA ECPG Growth P EER G ROUP O PERATIONAL B ENCHMARKING JH Capital’s growth and return profile are superior to that of public comparable companies ’17E - ’19E Adjusted Revenue Growth ($ in millions) Source: JH Capital provided materials, Factset, SNL Financial. (1) Uses level yield accounting. (2) See page 5 for detail. ’18E - ’19E Economic Earnings Growth 18 (1) (2)

2018E Adjusted EBITDA $264 $658 $842 2.9x 5.5x 5.1x $10 Easterly Stock equals a 48% discount to PRAA and a 44% discount to ECPG P EER G ROUP V ALUATION B ENCHMARKING PRA Group represents a more closely comparable company than Encore Capital ($ in millions) Source: Company filings, JH Capital provided materials, FactSet , SNL Financial. Market data as of December 7, 2017. (1) See page 5 for detail. Price / Earnings P / 2018E Economic Earnings Adj. EBITDA FV / 2018E Adjusted EBITDA 19 (1) (1) (1) 2018E Adjusted Earnings $56 $71 $109 6.6x 21.7x 11.1x $10 Easterly Stock equals a 70% discount to PRAA and a 40% discount to ECPG (1)
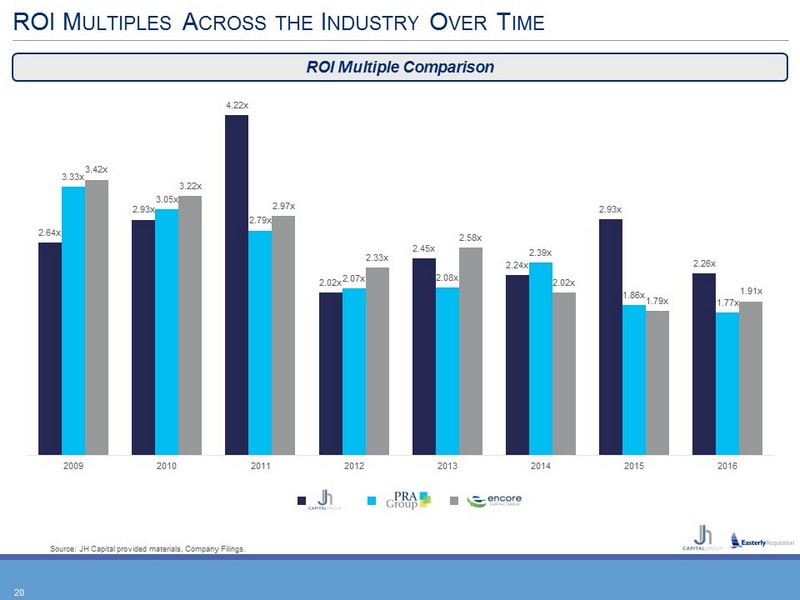
ROI M ULTIPLES A CROSS THE I NDUSTRY O VER T IME Source: JH Capital provided materials, Company Filings. ROI Multiple Comparison 20 2.64x 2.93x 4.22x 2.02x 2.45x 2.24x 2.93x 2.26x 3.33x 3.05x 2.79x 2.07x 2.08x 2.39x 1.86x 1.77x 3.42x 3.22x 2.97x 2.33x 2.58x 2.02x 1.79x 1.91x 2009 2010 2011 2012 2013 2014 2015 2016