Attached files
| file | filename |
|---|---|
| 8-K - 8-K - UNITED INSURANCE HOLDINGS CORP. | form8-kq32017investorprese.htm |
United Insurance Holdings Corp.
NASDAQ: UIHC
Company Presentation
December 2017
2DECEMBER 2017 INVESTOR PRESENTATION
Cautionary Statements
This presentation contains "forward-looking statements" within the meaning of the Private Securities Litigation Reform Act of 1995. These forward
looking statements include expectations regarding our diversification, growth opportunities, retention rates, liquidity, investment returns and our
ability to meet our investment objectives and to manage and mitigate market risk with respect to our investments. These statements are based on
current expectations, estimates and projections about the industry and market in which we operate, and management's beliefs and assumptions.
Without limiting the generality of the foregoing, words such as "may," "will," "expect," "endeavor," "project," "believe," "anticipate," "intend," "could,"
"would," "estimate," or "continue" or the negative variations thereof, or comparable terminology, are intended to identify forward-looking statements.
Forward-looking statements are not guarantees of future performance and involve certain known and unknown risks and uncertainties that could
cause actual results to differ materially from those expressed or implied by such statements. The risks and uncertainties include, without limitation:
the regulatory, economic and weather conditions in the states in which we operate; the impact of new federal or state regulations that affect the
property and casualty insurance market; the cost, variability and availability of reinsurance; assessments charged by various governmental agencies;
pricing competition and other initiatives by competitors; our ability to attract and retain the services of senior management; the outcome of litigation
pending against us, including the terms of any settlements; dependence on investment income and the composition of our investment portfolio and
related market risks; our exposure to catastrophic events and severe weather conditions; downgrades in our financial strength ratings; risks and
uncertainties relating to our acquisitions including our ability to successfully integrate the acquired companies; and other risks and uncertainties
described in the section entitled "Risk Factors" and elsewhere in our filings with the Securities and Exchange Commission (the "SEC"), including our
Annual Report on Form 10-K for the year ended December 31, 2016. We caution you not to place undue reliance on these forward looking statements,
which are valid only as of the date they were made. Except as may be required by applicable law, we undertake no obligation to update or revise any
forward-looking statements to reflect new information, the occurrence of unanticipated events, or otherwise.
This presentation contains certain non-GAAP financial measures. See the Appendix section of this presentation for further information regarding these
non-GAAP financial measures.
The Company has filed a registration statement (including a prospectus) and a preliminary prospectus supplement with the Securities Exchange
Commission ("SEC"). This presentation does not constitute an offer to sell or the solicitation of an offer to buy any securities. Any offering of
securities in the future will be made only by means of the prospectus in that registration statement and a related prospectus supplement, which will
be filed with the SEC. Before you invest in any potential offering, you should read the prospectus, the related prospectus supplement and other
documents the Company has filed with the SEC for more complete information about the Company and the potential offering. When available,
you may get these documents for free by visiting EDGAR on the SEC Web site at www.sec.gov. Alternatively, the Company will arrange to send you
the prospectus and the related prospectus supplement after filing if you request it.
The information in this presentation is confidential. Any photocopying, disclosure, reproduction or alteration of the contents of this presentation and
any forwarding of a copy of this presentation or any portion of this presentation to any person is prohibited.
3DECEMBER 2017 INVESTOR PRESENTATION
Management Overview
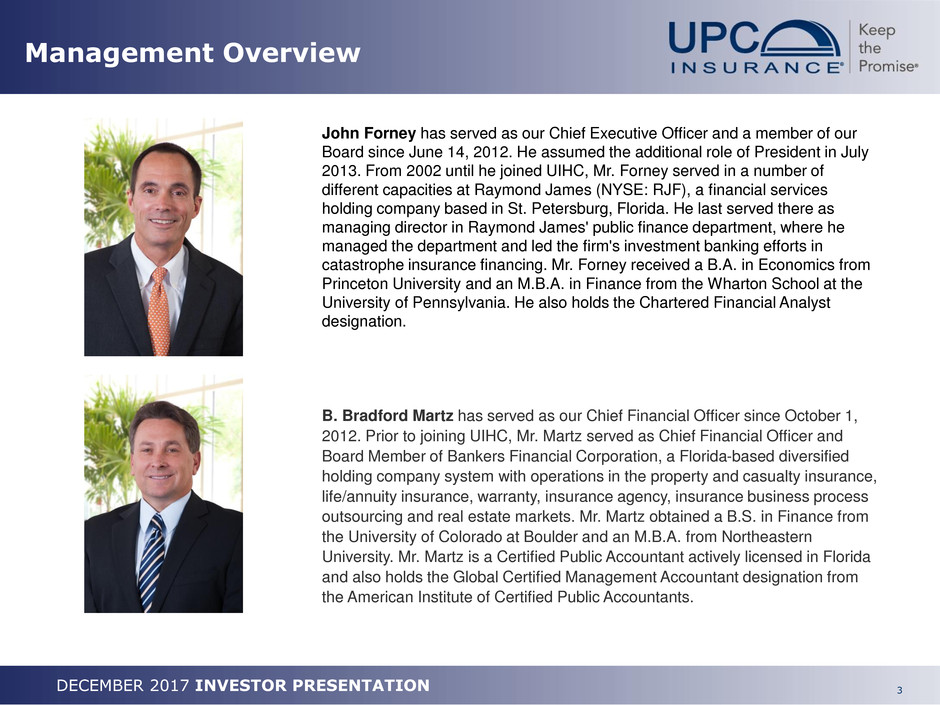
John Forney has served as our Chief Executive Officer and a member of our
Board since June 14, 2012. He assumed the additional role of President in July
2013. From 2002 until he joined UIHC, Mr. Forney served in a number of
different capacities at Raymond James (NYSE: RJF), a financial services
holding company based in St. Petersburg, Florida. He last served there as
managing director in Raymond James' public finance department, where he
managed the department and led the firm's investment banking efforts in
catastrophe insurance financing. Mr. Forney received a B.A. in Economics from
Princeton University and an M.B.A. in Finance from the Wharton School at the
University of Pennsylvania. He also holds the Chartered Financial Analyst
designation.
B. Bradford Martz has served as our Chief Financial Officer since October 1,
2012. Prior to joining UIHC, Mr. Martz served as Chief Financial Officer and
Board Member of Bankers Financial Corporation, a Florida-based diversified
holding company system with operations in the property and casualty insurance,
life/annuity insurance, warranty, insurance agency, insurance business process
outsourcing and real estate markets. Mr. Martz obtained a B.S. in Finance from
the University of Colorado at Boulder and an M.B.A. from Northeastern
University. Mr. Martz is a Certified Public Accountant actively licensed in Florida
and also holds the Global Certified Management Accountant designation from
the American Institute of Certified Public Accountants.
4DECEMBER 2017 INVESTOR PRESENTATION
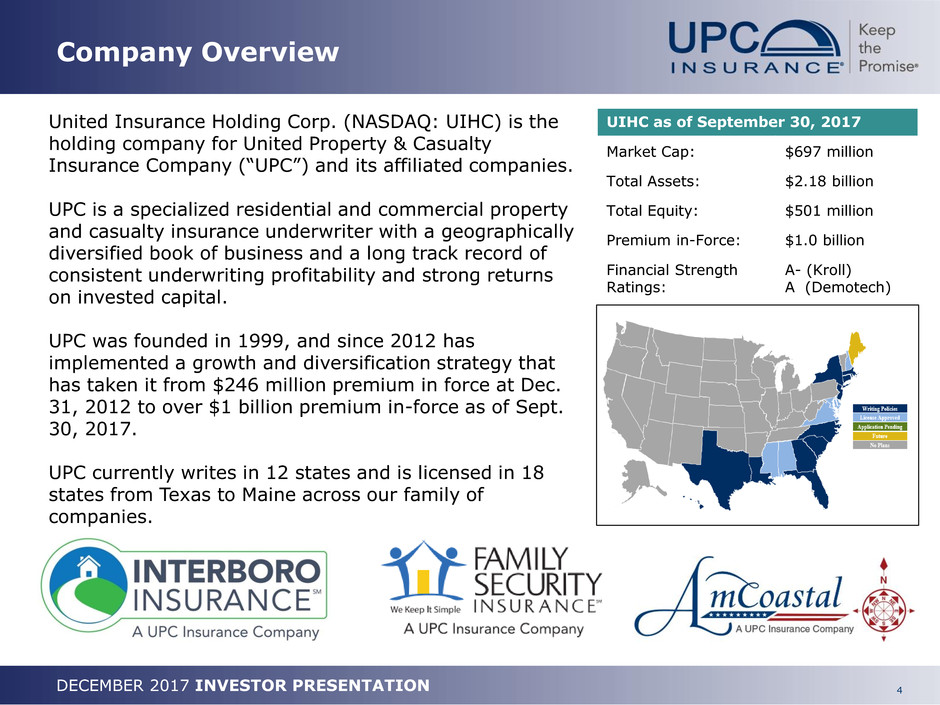
United Insurance Holding Corp. (NASDAQ: UIHC) is the
holding company for United Property & Casualty
Insurance Company (“UPC”) and its affiliated companies.
UPC is a specialized residential and commercial property
and casualty insurance underwriter with a geographically
diversified book of business and a long track record of
consistent underwriting profitability and strong returns
on invested capital.
UPC was founded in 1999, and since 2012 has
implemented a growth and diversification strategy that
has taken it from $246 million premium in force at Dec.
31, 2012 to over $1 billion premium in-force as of Sept.
30, 2017.
UPC currently writes in 12 states and is licensed in 18
states from Texas to Maine across our family of
companies.
Company Overview
UIHC as of September 30, 2017
Market Cap: $697 million
Total Assets: $2.18 billion
Total Equity: $501 million
Premium in-Force: $1.0 billion
Financial Strength
Ratings:
A- (Kroll)
A (Demotech)
5DECEMBER 2017 INVESTOR PRESENTATION
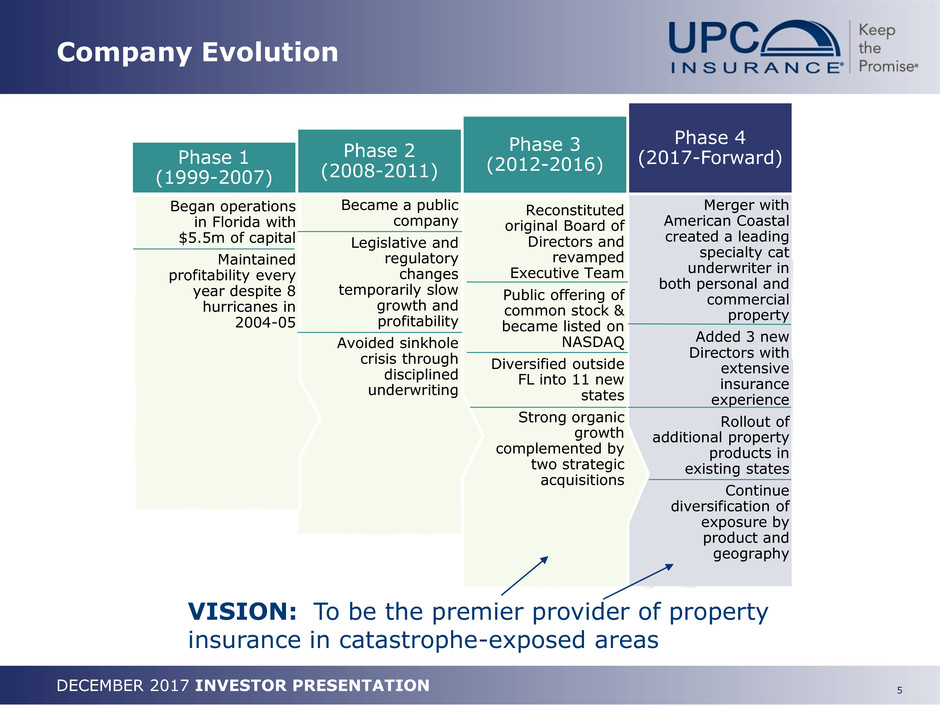
Company Evolution
Merger with
American Coastal
created a leading
specialty cat
underwriter in
both personal and
commercial
property
Added 3 new
Directors with
extensive
insurance
experience
Rollout of
additional property
products in
existing states
Continue
diversification of
exposure by
product and
geography
Phase 4
(2017-Forward)
Reconstituted
original Board of
Directors and
revamped
Executive Team
Public offering of
common stock &
became listed on
NASDAQ
Diversified outside
FL into 11 new
states
Strong organic
growth
complemented by
two strategic
acquisitions
Phase 3
(2012-2016)
Became a public
company
Legislative and
regulatory
changes
temporarily slow
growth and
profitability
Avoided sinkhole
crisis through
disciplined
underwriting
Phase 2
(2008-2011)
Began operations
in Florida with
$5.5m of capital
Maintained
profitability every
year despite 8
hurricanes in
2004-05
Phase 1
(1999-2007)
VISION: To be the premier provider of property
insurance in catastrophe-exposed areas
6DECEMBER 2017 INVESTOR PRESENTATION
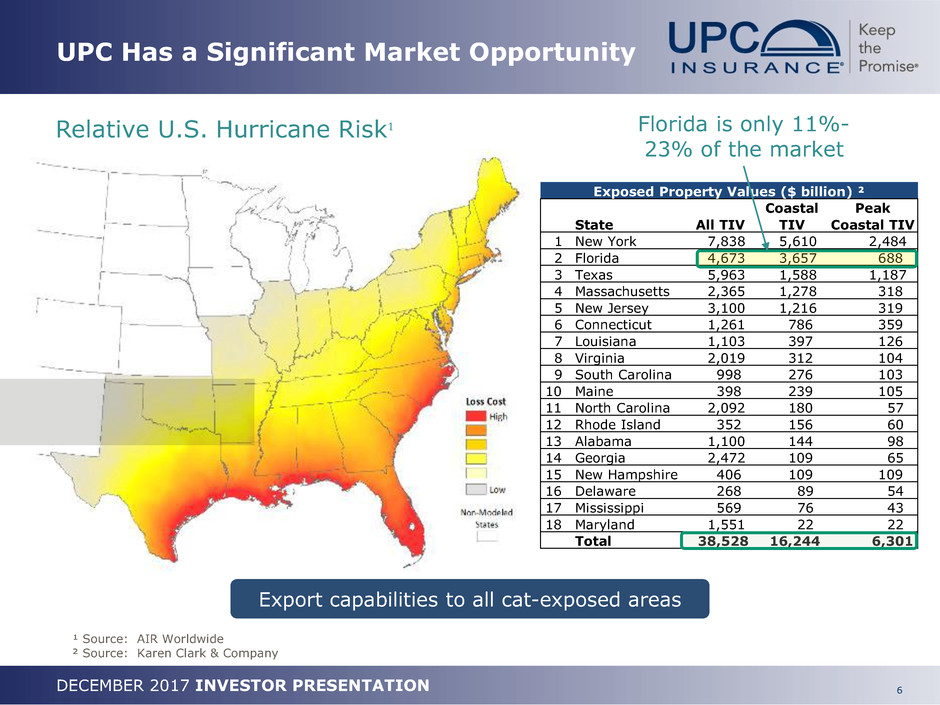
UPC Has a Significant Market Opportunity
Relative U.S. Hurricane Risk¹
¹ Source: AIR Worldwide
² Source: Karen Clark & Company
Export capabilities to all cat-exposed areas
Exposed Property Values ($ billion) ²
Coastal Peak
State All TIV TIV Coastal TIV
1 New York 7,838 5,610 2,484
2 Florida 4,673 3,657 688
3 Texas 5,963 1,588 1,187
4 Massachusetts 2,365 1,278 318
5 New Jersey 3,100 1,216 319
6 Connecticut 1,261 786 359
7 Louisiana 1,103 397 126
8 Virginia 2,019 312 104
9 South Carolina 998 276 103
10 Maine 398 239 105
11 North Carolina 2,092 180 57
12 Rhode Island 352 156 60
13 Alabama 1,100 144 98
14 Georgia 2,472 109 65
15 New Hampshire 406 109 109
16 Delaware 268 89 54
17 Mississippi 569 76 43
18 Maryland 1,551 22 22
Total 38,528 16,244 6,301
Florida is only 11%-
23% of the market
7DECEMBER 2017 INVESTOR PRESENTATION
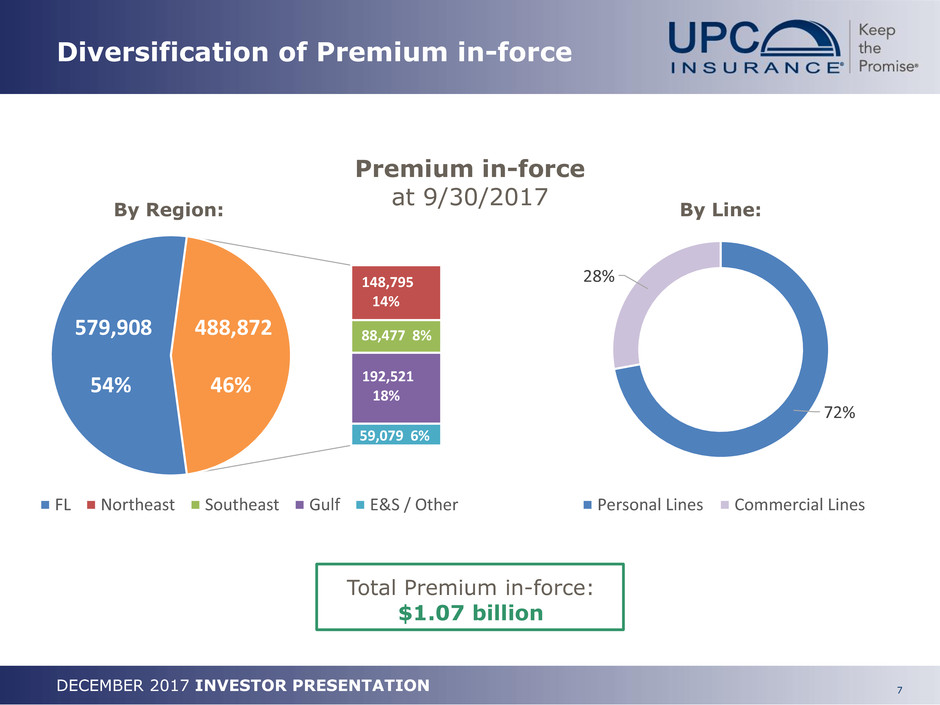
Diversification of Premium in-force
Premium in-force
at 9/30/2017
Total Premium in-force:
$1.07 billion
579,908
54%
148,795
14%
88,477 8%
192,521
18%
59,079 6%
488,872
46%
FL Northeast Southeast Gulf E&S / Other
72%
28%
Personal Lines Commercial Lines
By Region: By Line:
8DECEMBER 2017 INVESTOR PRESENTATION
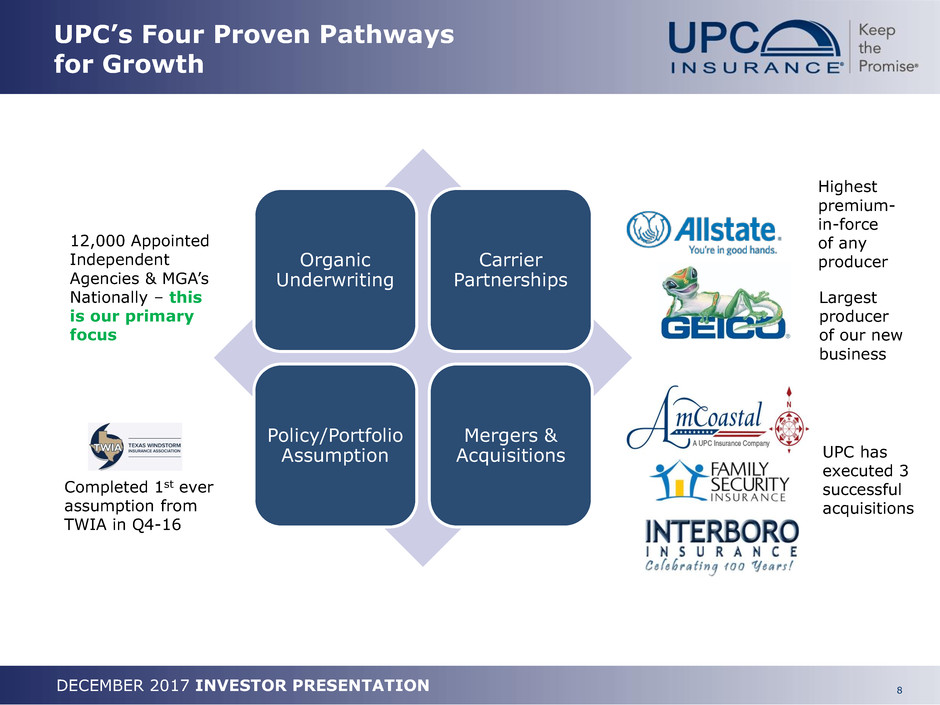
UPC’s Four Proven Pathways
for Growth
Organic
Underwriting
Carrier
Partnerships
Policy/Portfolio
Assumption
Mergers &
Acquisitions
12,000 Appointed
Independent
Agencies & MGA’s
Nationally – this
is our primary
focus
Highest
premium-
in-force
of any
producer
Largest
producer
of our new
business
UPC has
executed 3
successful
acquisitions
Completed 1st ever
assumption from
TWIA in Q4-16

9DECEMBER 2017 INVESTOR PRESENTATION
Strong Underwriting Performance
Underlying annual combined
ratio consistently below 90%
1 Catastrophe losses (CAT) include all events in excess of $1 million of incurred losses from 2 or more claims.
2 Underlying combined ratio, a measure that is not based on U.S. GAAP, is reconciled above to the combined ratio, the most directly comparable GAAP measure. Additional information
regarding non-GAAP measures can be found in the Appendix of this presentation
Loss ratio, net 54.5 % 65.3 % 70.0 %
Expense ratio, net 39.5 % 39.6 % 48.4 %
Combined ratio (CR) 94.0 % 104.9 % 118.4 %
Effect of current year catastrophe
losses on CR ¹
8.5 % 12.2 % 27.4 %
Effect of prior year (favorable)
development on CR
(0.7) % 3.7 % (0.7) %
Effect of ceding commission income
on CR
1.0 % 1.5 % 7.2 %
Underlying combined ratio ² 85.2 % 87.5 % 84.5 %
2015 2016 YTD 9/30/17
10DECEMBER 2017 INVESTOR PRESENTATION
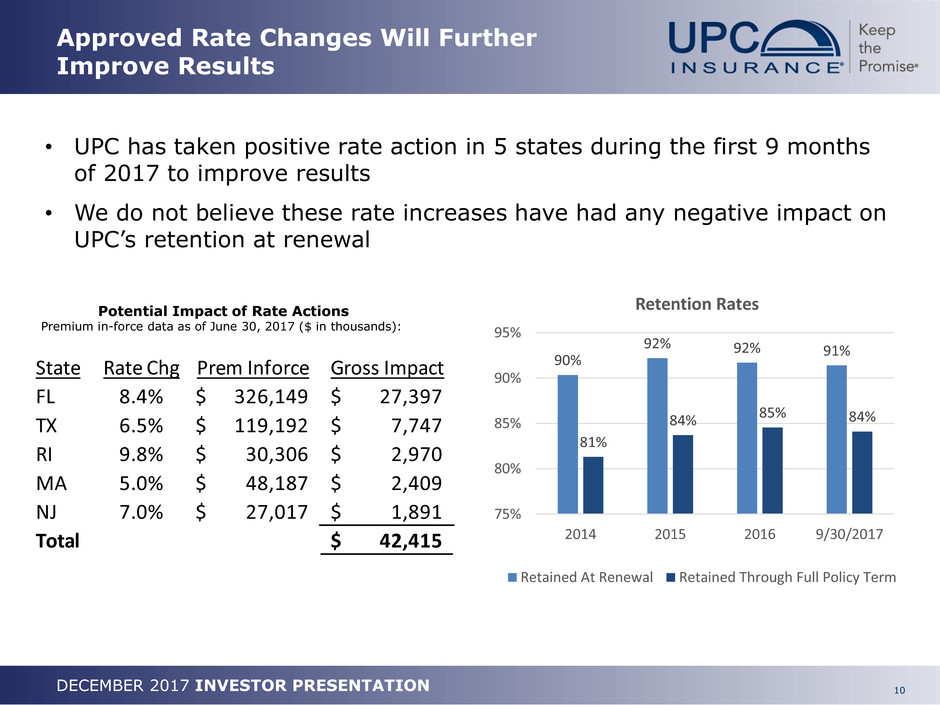
Approved Rate Changes Will Further
Improve Results
State Rate Chg Prem Inforce Gross Impact
FL 8.4% 326,149$ 27,397$
TX 6.5% 119,192$ 7,747$
RI 9.8% 30,306$ 2,970$
MA 5.0% 48,187$ 2,409$
NJ 7.0% 27,017$ 1,891$
Total 42,415$
• UPC has taken positive rate action in 5 states during the first 9 months
of 2017 to improve results
• We do not believe these rate increases have had any negative impact on
UPC’s retention at renewal
90%
92% 92% 91%
81%
84% 85% 84%
75%
80%
85%
90%
95%
2014 2015 2016 9/30/2017
Retention Rates
Retained At Renewal Retained Through Full Policy Term
Potential Impact of Rate Actions
Premium in-force data as of June 30, 2017 ($ in thousands):

11DECEMBER 2017 INVESTOR PRESENTATION
Q3 & YTD 2017 Results
Improvements Y/Y excluding CAT
Consolidated GAAP ($000) YTD as of September 30,
Q3-17 Q3-16 % Chg 2017 2016 % Chg
Revenue
Gross Earned 268,001$ 173,520$ 54.4% 711,650$ 484,607$ 46.9%
Ceded Earned (115,507) (53,299) 116.7% (292,355) (148,837) 96.4%
Net Earned 152,494 120,221 26.8% 419,295 335,770 24.9%
Investment Income 4,901 2,663 84.0% 12,489 7,786 60.3%
Realized gain(loss) (71) 106 -167.0% (554) 478 215.9%
Other revenue 13,804 4,212 227.7% 40,604 11,650 248.5%
Total Revenue 171,128 127,202 34.5% 471,834 355,684 32.7%
Expenses
Loss & LAE - NonCAT 60,512 67,637 -10.5% 178,373 175,730 1.5%
Loss & LAE - CAT 82,615 5,109 1517.0% 115,025 23,885 381.6%
Policy Acquisition 46,546 31,333 48.6% 125,302 84,086 48.8%
Operating & Admin 26,207 17,887 46.5% 77,845 47,085 65.3%
Interest Expense 771 206 274.3% 2,282 397 474.8%
Total Expense 216,651 122,172 77.3% 498,827 331,183 50.6%
Operating Income (45,523) 5,030 -1005.1% (26,993) 24,501 -210.1%
Other Inc (Exp) 36 11 94 80 100.0%
Income Tax (17,475) 1,618 -1180.0% (10,043) 8,366 -220.0%
Net Income (28,012) 3,423 -918.5% (16,856) 16,215 -204.0%
Combined Ratio (CR) 141.6% 101.4% 40.2% 118.4% 98.5% 19.9%
Underlying CR 81.5% 91.4% -9.9% 84.5% 87.7% -3.2%
Solid revenue
growth and
underlying
combined
ratios (CR)
impacted by
unusually high
catastrophe
(CAT) losses
during 2017
1 Underlying combined ratio, a measure that is not based on U.S. GAAP, removes the impact of catastrophe losses, prior year reserve development and ceding commission income on the combined ratio, which is the
most directly comparable GAAP measure. Additional information regarding non-GAAP financial measures can be found in Appendix of this presentation.
1
12DECEMBER 2017 INVESTOR PRESENTATION
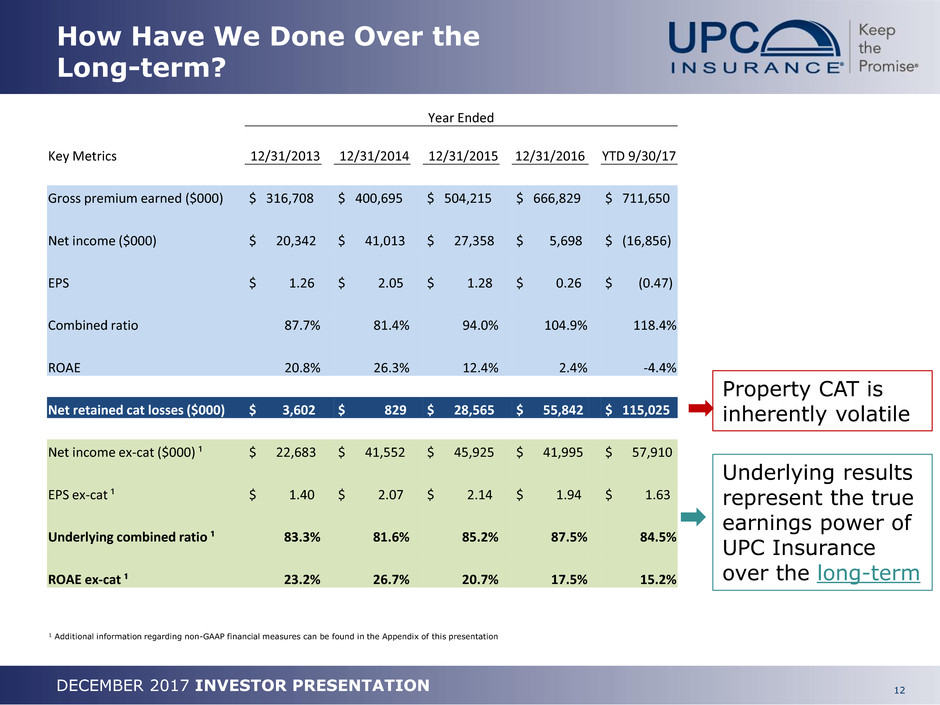
How Have We Done Over the
Long-term?
Underlying results
represent the true
earnings power of
UPC Insurance
over the long-term
Property CAT is
inherently volatile
Year Ended
Key Metrics 12/31/2013 12/31/2014 12/31/2015 12/31/2016 YTD 9/30/17
Gross premium earned ($000) $ 316,708 $ 400,695 $ 504,215 $ 666,829 $ 711,650
Net income ($000) $ 20,342 $ 41,013 $ 27,358 $ 5,698 $ (16,856)
EPS $ 1.26 $ 2.05 $ 1.28 $ 0.26 $ (0.47)
Combined ratio 87.7% 81.4% 94.0% 104.9% 118.4%
ROAE 20.8% 26.3% 12.4% 2.4% -4.4%
Net retained cat losses ($000) $ 3,602 $ 829 $ 28,565 $ 55,842 $ 115,025
Net income ex-cat ($000) ¹ $ 22,683 $ 41,552 $ 45,925 $ 41,995 $ 57,910
EPS ex-cat ¹ $ 1.40 $ 2.07 $ 2.14 $ 1.94 $ 1.63
Underlying combined ratio ¹ 83.3% 81.6% 85.2% 87.5% 84.5%
ROAE ex-cat ¹ 23.2% 26.7% 20.7% 17.5% 15.2%
1 Additional information regarding non-GAAP financial measures can be found in the Appendix of this presentation
13DECEMBER 2017 INVESTOR PRESENTATION
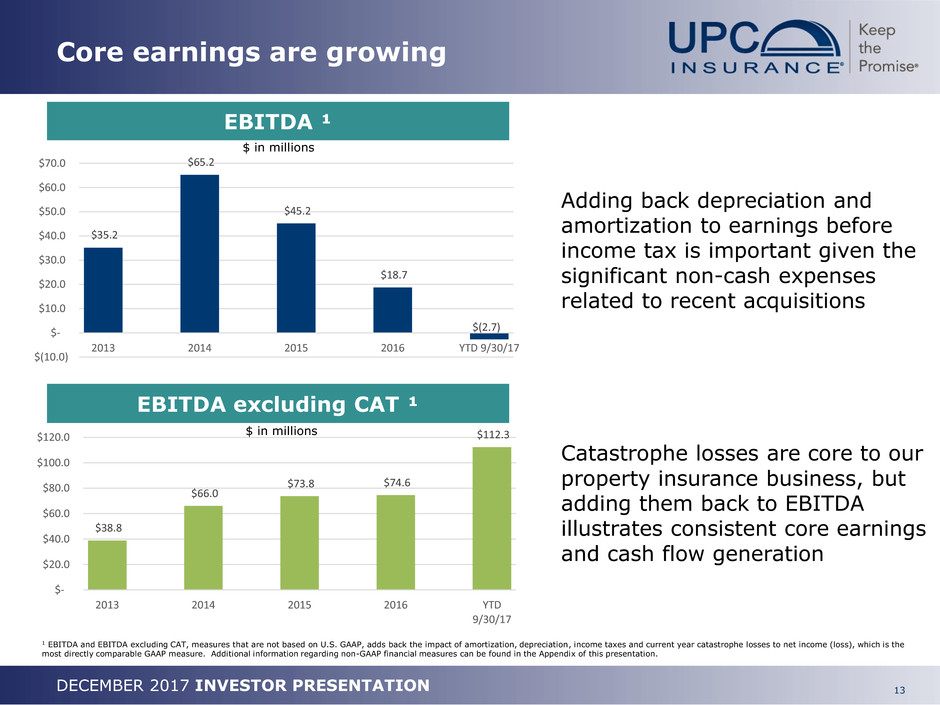
Core earnings are growing
EBITDA ¹
EBITDA excluding CAT ¹
Adding back depreciation and
amortization to earnings before
income tax is important given the
significant non-cash expenses
related to recent acquisitions
Catastrophe losses are core to our
property insurance business, but
adding them back to EBITDA
illustrates consistent core earnings
and cash flow generation
$35.2
$65.2
$45.2
$18.7
$(2.7)
$(10.0)
$-
$10.0
$20.0
$30.0
$40.0
$50.0
$60.0
$70.0
2013 2014 2015 2016 YTD 9/30/17
$ in millions
$ in millions
1 EBITDA and EBITDA excluding CAT, measures that are not based on U.S. GAAP, adds back the impact of amortization, depreciation, income taxes and current year catastrophe losses to net income (loss), which is the
most directly comparable GAAP measure. Additional information regarding non-GAAP financial measures can be found in the Appendix of this presentation.
$38.8
$66.0
$73.8 $74.6
$112.3
$-
$20.0
$40.0
$60.0
$80.0
$100.0
$120.0
2013 2014 2015 2016 YTD
9/30/17

14DECEMBER 2017 INVESTOR PRESENTATION
Strong Liquidity & Cash Generation
Holding Co. Liquidity
Debt-to-Capital Ratio
Cash Flow from Operations
$110
$69
$98
$66
$112
$-
$20
$40
$60
$80
$100
$120
2013 2014 2015 2016 Annualized Q3-17
12.0%
6.2%
4.9%
18.3%
9.6%
0.0%
2.0%
4.0%
6.0%
8.0%
10.0%
12.0%
14.0%
16.0%
18.0%
20.0%
2013 2014 2015 2016 Q3-
2017
• Strong dividend capacity from
insurance subsidiaries
• Consistent cash generation including
significant contribution from
unregulated sources, such as our
wholly-owned Mananging General
Agency (MGA)
• Conservative financial leverage profile
$ in millions $ in millions
$28.5
$52.3
$75.1
$36.5
$69.4
$-
$10.0
$20.0
$30.0
$40.0
$50.0
$60.0
$70.0
$80.0
2013 2014 2015 2016 Q3-2017
Dividend capacity of subsidiaries Unrestricted liquidity on hand
15DECEMBER 2017 INVESTOR PRESENTATION
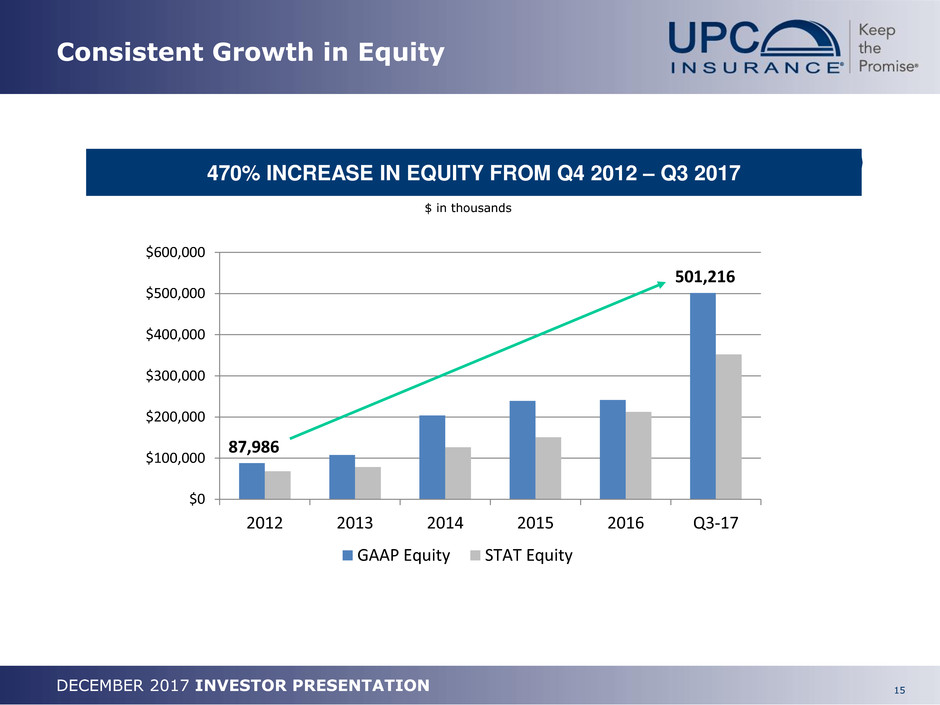
Consistent Growth in Equity
87,986
501,216
$0
$100,000
$200,000
$300,000
$400,000
$500,000
$600,000
2012 2013 2014 2015 2016 Q3-17
GAAP Equity STAT Equity
470% INCREASE IN EQUITY FROM Q4 2012 – Q3 2017
$ in thousands
16DECEMBER 2017 INVESTOR PRESENTATION
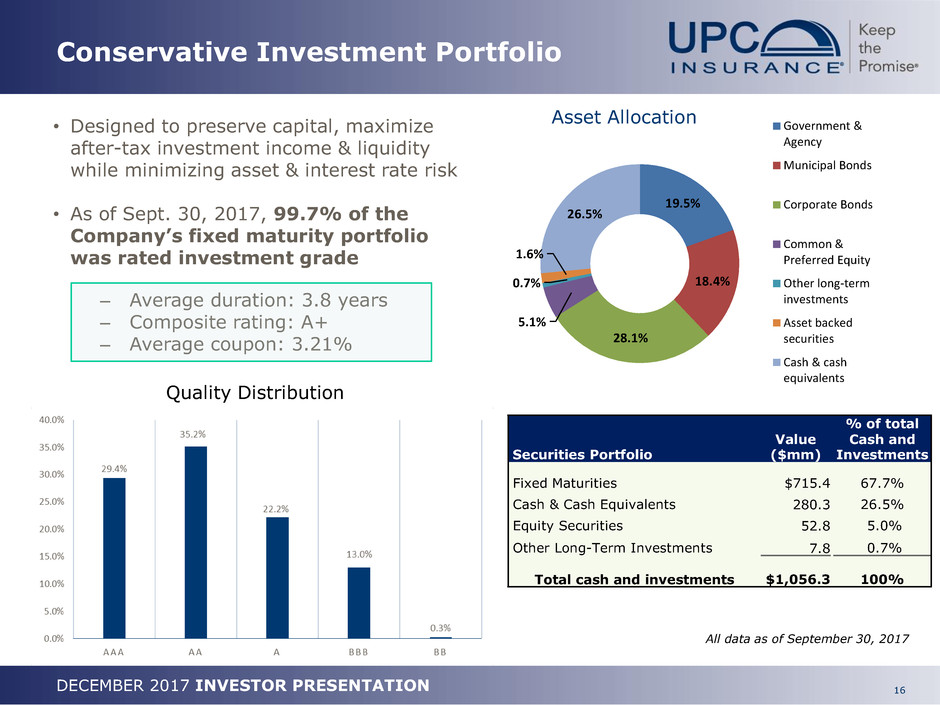
Conservative Investment Portfolio
• Designed to preserve capital, maximize
after-tax investment income & liquidity
while minimizing asset & interest rate risk
• As of Sept. 30, 2017, 99.7% of the
Company’s fixed maturity portfolio
was rated investment grade
– Average duration: 3.8 years
– Composite rating: A+
– Average coupon: 3.21%
All data as of September 30, 2017
Securities Portfolio
Value
($mm)
% of total
Cash and
Investments
Fixed Maturities $715.4 67.7%
Cash & Cash Equivalents 280.3 26.5%
Equity Securities 52.8 5.0%
Other Long-Term Investments 7.8 0.7%
Total cash and investments $1,056.3 100%
Quality Distribution
Asset Allocation
19.5%
18.4%
28.1%
5.1%
0.7%
1.6%
26.5%
Government &
Agency
Municipal Bonds
Corporate Bonds
Common &
Preferred Equity
Other long-term
investments
Asset backed
securities
Cash & cash
equivalents
17DECEMBER 2017 INVESTOR PRESENTATION
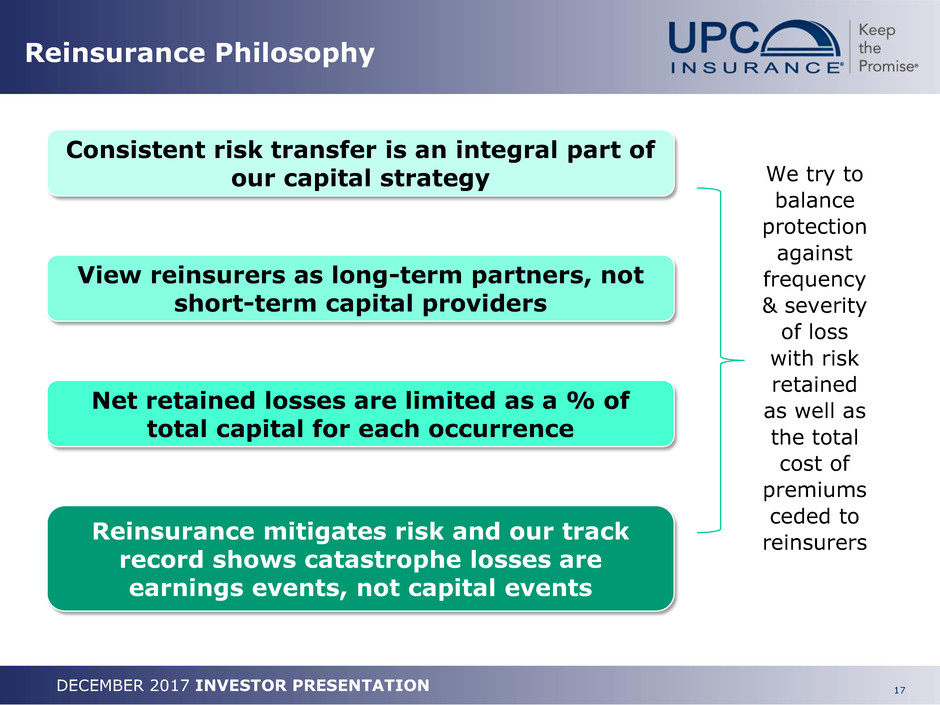
Reinsurance Philosophy
Reinsurance mitigates risk and our track
record shows catastrophe losses are
earnings events, not capital events
We try to
balance
protection
against
frequency
& severity
of loss
with risk
retained
as well as
the total
cost of
premiums
ceded to
reinsurers
Consistent risk transfer is an integral part of
our capital strategy
View reinsurers as long-term partners, not
short-term capital providers
Net retained losses are limited as a % of
total capital for each occurrence

18DECEMBER 2017 INVESTOR PRESENTATION
2017-18 Reinsurance Program
Layer 1
$200M xs $25M
NIL
$50M Retention
$56M
$256M
$570M
Layer 3
$400M xs
$25M
NIL
Public FHCF
45% of
$1.73B xs
$535M
NIL
$539M
$2.3B
$2.8B
100 YR$1.629B
$1.3B
Layer 4
$450M xs $25M
NIL
$2.1B
Layer 5
$578M xs $25M
NIL
Layer 2
$300M xs $25M
NIL
20% $6M
QS
¹ Return times and expected losses based on 9/30/17 projected
exposures using AIR v3.1 LT
$21M Retention
$25M
Public FHCF
45% of
$664M xs
$535M
NIL
Layer 4
$267M xs $25M
NIL
$539M
$1.140B
50 YR
$1.2B
Layer 5
$578M xs $25M
NIL
$292M
20% $4M
QS
1st Event: 100 YR ($1.629B FL
Only)
TOTAL RECOVERY: $1.629BM
NET RETAINED: $50.0M
REMAINING 2nd EVENT LIMIT: $1.148B
2nd Event: 50 YR ($1.14B FL
Only)
TOTAL RECOVERY: $1.115B
NET RETAINED: $21.0M
REMAINING LIMIT: $28.8M
The Loss Scenarios Depicted Assume Losses of $1.629B (100
YR) 1st Event, followed by a loss of $1.14B (50 YR) in a 2nd Event.
Should a Loss Be Less Than the Full 2nd Event Limit, Any
Remaining Limit Would Be Available For a 3rd Event. ²
Andrew$447M
2005 Season
(7 events)
$888M
² Excludes Blueline which has a
separate reinsurance program and a
$5 million retention for each event
400 YR
RT ¹
19DECEMBER 2017 INVESTOR PRESENTATION
Conclusion
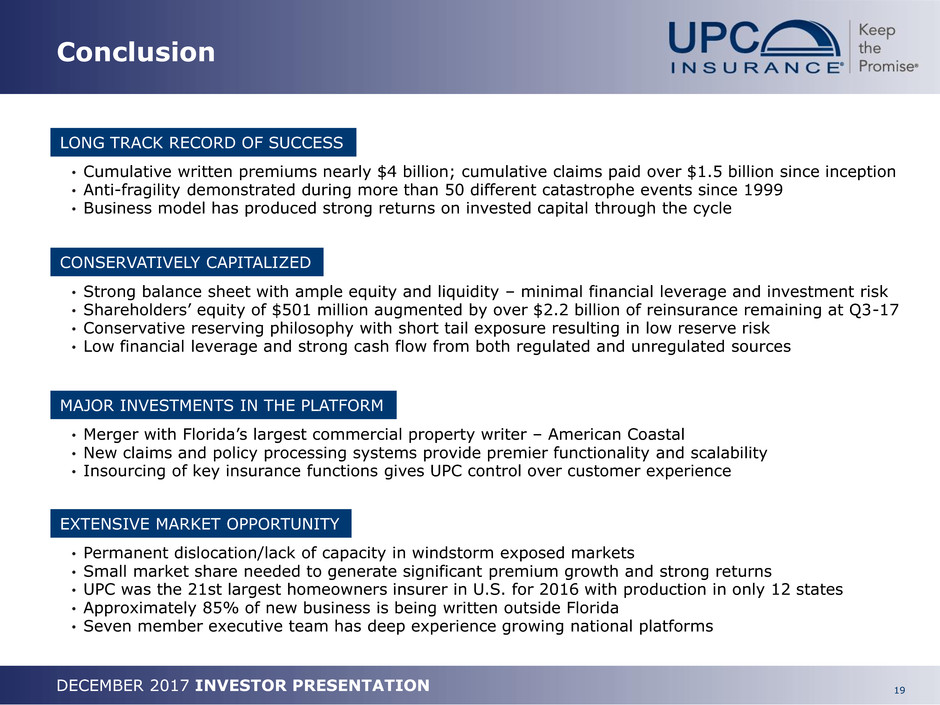
EXTENSIVE MARKET OPPORTUNITY
• Permanent dislocation/lack of capacity in windstorm exposed markets
• Small market share needed to generate significant premium growth and strong returns
• UPC was the 21st largest homeowners insurer in U.S. for 2016 with production in only 12 states
• Approximately 85% of new business is being written outside Florida
• Seven member executive team has deep experience growing national platforms
LONG TRACK RECORD OF SUCCESS
• Cumulative written premiums nearly $4 billion; cumulative claims paid over $1.5 billion since inception
• Anti-fragility demonstrated during more than 50 different catastrophe events since 1999
• Business model has produced strong returns on invested capital through the cycle
CONSERVATIVELY CAPITALIZED
• Strong balance sheet with ample equity and liquidity – minimal financial leverage and investment risk
• Shareholders’ equity of $501 million augmented by over $2.2 billion of reinsurance remaining at Q3-17
• Conservative reserving philosophy with short tail exposure resulting in low reserve risk
• Low financial leverage and strong cash flow from both regulated and unregulated sources
MAJOR INVESTMENTS IN THE PLATFORM
• Merger with Florida’s largest commercial property writer – American Coastal
• New claims and policy processing systems provide premier functionality and scalability
• Insourcing of key insurance functions gives UPC control over customer experience

20DECEMBER 2017 INVESTOR PRESENTATION
APPENDIX

21DECEMBER 2017 INVESTOR PRESENTATION
Definition & Reconciliation of
Underlying Combined Ratio
We believe that investors’ understanding of UPC Insurance’s performance is enhanced by our disclosure
of the following non-GAAP measures. Our methods for calculating these measures may differ from
those used by other companies and therefore comparability may be limited.
Combined ratio excluding the effects of current year catastrophe losses, prior year
development and ceding commission income (underlying combined ratio) is a non-GAAP ratio,
which is computed as the GAAP combined ratio less (plus) the effect of current year catastrophe losses,
prior year development and ceding commission income on the combined ratio. We believe that this
ratio is useful to investors and it is used by management to reveal the trends in our business that may
be obscured by current year catastrophe losses and prior year development. Current year catastrophe
losses cause our loss trends to vary significantly between periods as a result of their incidence of
occurrence and magnitude, and can have a significant impact on the combined ratio. Prior year
development is unexpected loss development on historical reserves. We believe it is useful for investors
to evaluate these components separately and in the aggregate when reviewing our performance. The
most direct comparable GAAP measure is the combined ratio. The underlying combined ratio should not
be considered as a substitute for the combined ratio and does not reflect the overall profitability of our
business.
2013 2014 2015 2016 YTD 9/30/17 YTD 9/30/16 Q3-17 Q3-16
Combined ratio (CR) 87.7 % 81.4 % 94.0 % 104.9 % 118.4 % 98.5 % 141.6 % 101.4 %
Effect of current year catastrophe
losses on CR
1.8 % 0.3 % 8.5 % 12.2 % 27.4 % 7.1 % 54.2 % 4.2 %
Effect of prior year (favorable)
development on CR
2.1 % (1.5) % (0.7) % 3.7 % (0.7) % 2.9 % (0.7) % 4.9 %
Effect of ceding commission income
on CR
0.5 % 1.0 % 1.0 % 1.5 % 7.2 % 0.8 % 6.6 % 0.9 %
Underlying combined ratio 83.3 % 81.6 % 85.2 % 87.5 % 84.5 % 87.7 % 81.5 % 91.4 %
22DECEMBER 2017 INVESTOR PRESENTATION
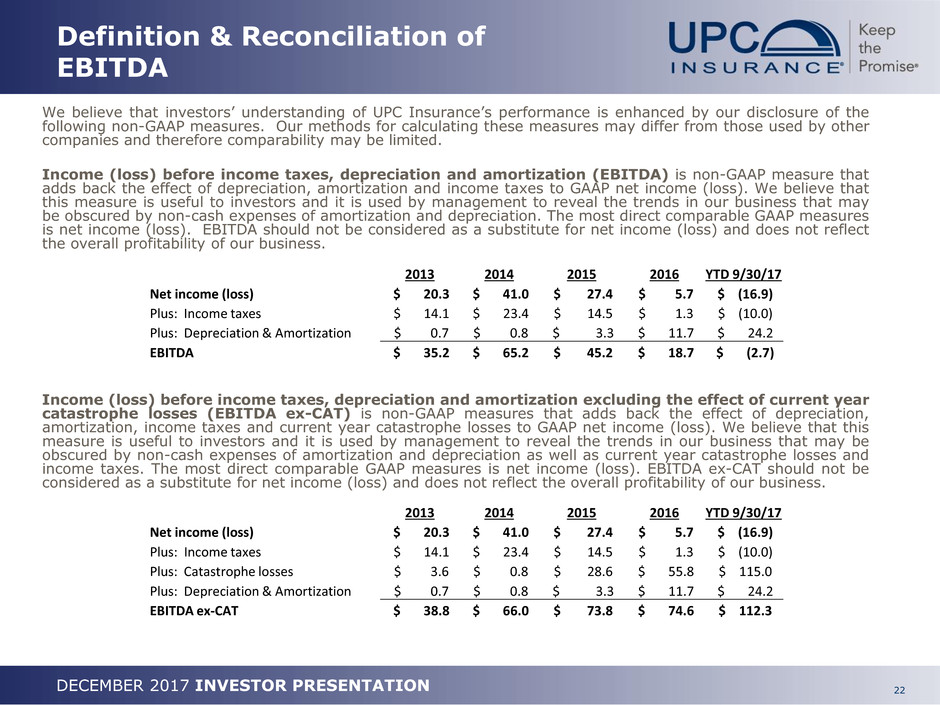
We believe that investors’ understanding of UPC Insurance’s performance is enhanced by our disclosure of the
following non-GAAP measures. Our methods for calculating these measures may differ from those used by other
companies and therefore comparability may be limited.
Income (loss) before income taxes, depreciation and amortization (EBITDA) is non-GAAP measure that
adds back the effect of depreciation, amortization and income taxes to GAAP net income (loss). We believe that
this measure is useful to investors and it is used by management to reveal the trends in our business that may
be obscured by non-cash expenses of amortization and depreciation. The most direct comparable GAAP measures
is net income (loss). EBITDA should not be considered as a substitute for net income (loss) and does not reflect
the overall profitability of our business.
Income (loss) before income taxes, depreciation and amortization excluding the effect of current year
catastrophe losses (EBITDA ex-CAT) is non-GAAP measures that adds back the effect of depreciation,
amortization, income taxes and current year catastrophe losses to GAAP net income (loss). We believe that this
measure is useful to investors and it is used by management to reveal the trends in our business that may be
obscured by non-cash expenses of amortization and depreciation as well as current year catastrophe losses and
income taxes. The most direct comparable GAAP measures is net income (loss). EBITDA ex-CAT should not be
considered as a substitute for net income (loss) and does not reflect the overall profitability of our business.
Definition & Reconciliation of
EBITDA
2013 2014 2015 2016 YTD 9/30/17
Net income (loss) $ 20.3 $ 41.0 $ 27.4 $ 5.7 $ (16.9)
Plus: Income taxes $ 14.1 $ 23.4 $ 14.5 $ 1.3 $ (10.0)
Plus: Depreciation & Amortization $ 0.7 $ 0.8 $ 3.3 $ 11.7 $ 24.2
EBITDA $ 35.2 $ 65.2 $ 45.2 $ 18.7 $ (2.7)
2013 2014 2015 2016 YTD 9/30/17
Net income (loss) $ 20.3 $ 41.0 $ 27.4 $ 5.7 $ (16.9)
Plus: Income taxes $ 14.1 $ 23.4 $ 14.5 $ 1.3 $ (10.0)
Plus: Catastrophe losses $ 3.6 $ 0.8 $ 28.6 $ 55.8 $ 115.0
Plus: Depreciation & Amortization $ 0.7 $ 0.8 $ 3.3 $ 11.7 $ 24.2
EBITDA ex-CAT $ 38.8 $ 66.0 $ 73.8 $ 74.6 $ 112.3
23DECEMBER 2017 INVESTOR PRESENTATION
Definition & Reconciliation of
Other non-GAAP Measures
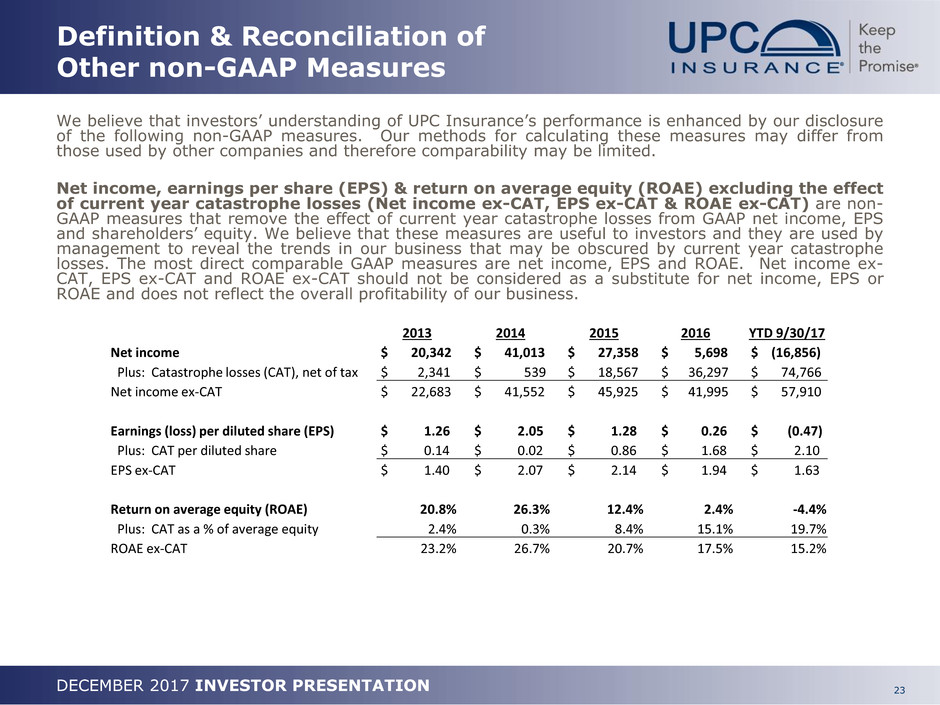
We believe that investors’ understanding of UPC Insurance’s performance is enhanced by our disclosure
of the following non-GAAP measures. Our methods for calculating these measures may differ from
those used by other companies and therefore comparability may be limited.
Net income, earnings per share (EPS) & return on average equity (ROAE) excluding the effect
of current year catastrophe losses (Net income ex-CAT, EPS ex-CAT & ROAE ex-CAT) are non-
GAAP measures that remove the effect of current year catastrophe losses from GAAP net income, EPS
and shareholders’ equity. We believe that these measures are useful to investors and they are used by
management to reveal the trends in our business that may be obscured by current year catastrophe
losses. The most direct comparable GAAP measures are net income, EPS and ROAE. Net income ex-
CAT, EPS ex-CAT and ROAE ex-CAT should not be considered as a substitute for net income, EPS or
ROAE and does not reflect the overall profitability of our business.
2013 2014 2015 2016 YTD 9/30/17
Net income $ 20,342 $ 41,013 $ 27,358 $ 5,698 $ (16,856)
Plus: Catastrophe losses (CAT), net of tax $ 2,341 $ 539 $ 18,567 $ 36,297 $ 74,766
Net income ex-CAT $ 22,683 $ 41,552 $ 45,925 $ 41,995 $ 57,910
Earnings (loss) per diluted share (EPS) $ 1.26 $ 2.05 $ 1.28 $ 0.26 $ (0.47)
Plus: CAT per diluted share $ 0.14 $ 0.02 $ 0.86 $ 1.68 $ 2.10
EPS ex-CAT $ 1.40 $ 2.07 $ 2.14 $ 1.94 $ 1.63
Return on average equity (ROAE) 20.8% 26.3% 12.4% 2.4% -4.4%
Plus: CAT as a % of average equity 2.4% 0.3% 8.4% 15.1% 19.7%
ROAE ex-CAT 23.2% 26.7% 20.7% 17.5% 15.2%
