Attached files
| file | filename |
|---|---|
| EX-99.1 - EXHIBIT 99.1 - FIRST BANCSHARES INC /MS/ | tv480938_ex99-1.htm |
| 8-K - FORM 8-K - FIRST BANCSHARES INC /MS/ | tv480938_8k.htm |
Exhibit 99.2

December 6 , 2017 Acquisition of Sunshine Financial, Inc. by The First Bancshares, Inc.

ABOUT THE FIRST BANCSHARES, INC.: The First Bancshares, Inc. (“FBMS” or the “Company”), headquartered in Hattiesburg, Mississippi, is the parent company of The First, A National Banking Association. Founded in 1996, The First has operations in Mississippi, Louisiana, Alabama and Florida. The Company’s stock is traded on NASDAQ Global Market under the symbol FBMS. Contact: Chandra Kidd, Corporate Secretary. NON - GAAP FINANCIAL MEASURES FBMS reports its results in accordance with United States generally accepted accounting principles (“GAAP”). However, management believes that certain non - GAAP performance measures used in managing the business may provide meaningful information about underlying trends in its business. Non - GAAP financial measures should be viewed in addition to, and not as an alternative for, FBMS’ reported results prepared in accordance with GAAP. ADDITIONAL INFORMATION ABOUT THE MERGER AND WHERE TO FIND IT In connection with the proposed merger of FBMS and Sunshine Financial, Inc. (“SSNF”), FBMS will file with the Securities and Exchange Commission (the “SEC”) a registration statement on Form S - 4 that will include a proxy statement of SSNF and a prospectus of FBMS, as well as other relevant documents concerning the proposed transaction. This communication does not constitute an offer to sell or the solicitation of an offer to buy any securities or a solicitation of any vote or approval. WE URGE INVESTORS AND SECURITY HOLDERS TO READ THE REGISTRATION STATEMENT ON FORM S - 4, THE PROXY STATEMENT/PROSPECTUS INCLUDED WITHIN THE REGISTRATION STATEMENT ON FORM S - 4 AND ANY OTHER RELEVANT DOCUMENTS WHEN FILED WITH THE SEC IN CONNECTION WITH THE PROPOSED MERGER BECAUSE THEY WILL CONTAIN IMPORTANT INFORMATION ABOUT FBMS, SSNF AND THE PROPOSED MERGER. The proxy statement/prospectus will be sent to the shareholders of SSNF seeking the required shareholder approvals. Investors and security holders will be able to obtain free copies of the registration statement on Form S - 4 and the related proxy statement/prospectus, when filed, as well as other documents filed with the SEC by FBMS through the web site maintained by the SEC at www.sec.gov. Documents filed with the SEC by FBMS will also be available free of charge by directing a written request to The First Bancshares, Inc., 6480 U.S. Highway 98 West, Hattiesburg, Mississippi 39402 Attn: Chandra Kidd, Corporate Secretary. FBMS’ telephone number is (601) 268 - 8998. 2 Safe Harbor PARTICIPANTS IN THE TRANSACTION FBMS, SSNF and certain of their respective directors and executive officers may be deemed to be participants in the solicitation of proxies from the shareholders of SSNF in connection with the proposed transaction. Information about these participants may be found in the definitive proxy statement of FBMS filed with the SEC on April 12, 2017 and the definitive proxy statement of SSNF filed with the SEC on April 18, 2017. Additional information regarding the interests of these participants will also be included in the proxy statement/prospectus regarding the proposed transaction when it becomes available. The definitive proxy statement can be obtained free of charge from the sources described above. This communication does not constitute an offer to sell or the solicitation of an offer to buy any securities or a solicitation of any vote or approval.
3 This presentation contains “forward - looking statements” as defined in the Private Securities Litigation Reform Act of 1995, and is intended to be protected by the safe harbor provided by the same. These statements are subject to numerous risks and uncertainties. These risks and uncertainties include, but are not limited to, the following: competitive pressures among fina nci al institutions increasing significantly; economic conditions, either nationally or locally, in areas in which FBMS conducts operations being less favorable than expected; legislation or regulatory changes which adversely affect the ability of the consolidated company to conduct business combinations or new operations; and risks related to the proposed acquisition of Sunshine Financial, Inc. including the risk that the proposed transaction does not close when expected or at all because required regulatory or other approvals and other conditions to closing are not received or satisfied on a timely basis or at all, the ter ms of the proposed transaction may need to be modified to satisfy such approvals or conditions, and the risk that anticipated benef its from the proposed transaction are not realized in the time frame anticipated or at all as a result of changes in general econ omi c and market conditions. For additional information concerning factors that could cause actual conditions, events or results t o materially differ from those described in the forward - looking statements, please refer to the factors set forth under the headings “Risk Factors” and “Management’s Discussion and Analysis of Financial Condition and Results of Operations” in FBMS ’ Annual Report on Form 10 - K for the year ended December 31, 2016, which is available online at www.sec.gov. No assurances can be given that any of the events anticipated by the forward - looking statements will occur, or if any of them do so, what impact they will have on the results of operations or financial condition of FBMS or SSNF. FBMS disclaims any obligation to update any factors or to announce publicly the result of revisions to any forward - looking statements included herein to reflect future events or developments, except to the extent required by law. Forward Looking Statement
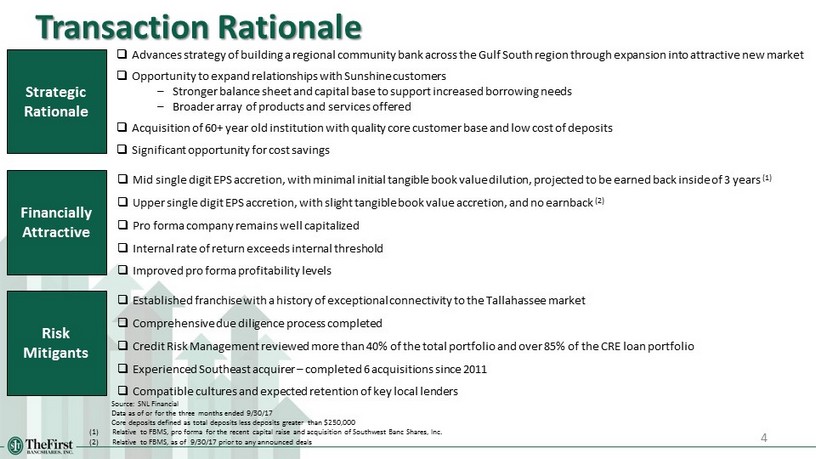
4 Transaction Rationale □ Advances strategy of building a regional community bank across the Gulf South region through expansion into attractive new ma rke t □ Opportunity to expand relationships with Sunshine customers – Stronger balance sheet and capital base to support increased borrowing needs – Broader array of products and services offered □ Acquisition of 60+ year old institution with quality core customer base and low cost of deposits □ Significant opportunity for cost savings Strategic Rationale Financially Attractive □ Mid single digit EPS accretion, with minimal initial tangible book value dilution, projected to be earned back inside of 3 years (1) □ Upper single digit EPS accretion, with slight tangible book value accretion, and no earnback (2) □ Pro forma company remains well capitalized □ Internal rate of return exceeds internal threshold □ Improved pro forma profitability levels Risk Mitigants □ Established franchise with a history of exceptional connectivity to the Tallahassee market □ Comprehensive due diligence process completed □ Credit Risk Management reviewed more than 40% of the total portfolio and over 85% of the CRE loan portfolio □ Experienced Southeast acquirer – completed 6 acquisitions since 2011 □ Compatible cultures and expected retention of key local lenders Source: SNL Financial Data as of or for the three months ended 9/30/17 Core deposits defined as total deposits less deposits greater than $250,000 (1) Relative to FBMS, pro forma for the recent capital raise and acquisition of Southwest Banc Shares, Inc. (2) Relative to FBMS, as of 9/30/17 prior to any announced deals

MISSISSIPPI FLORIDA ALABAMA LOUISIANA Huntsville Tuscaloosa Birmingham Tallahassee Pensacola Mobile Montgomery Hattiesburg Baton Rouge Jackson Shreveport Gulfport New Orleans Oxford 5 Executing on our Gulf South Growth Plan □ Consistent with expansion strategy first developed in 2009 – Focused on branch expansion and acquisitions in MS, AL, LA, and FL □ Compatible cultures and retention of key employees □ Strong credit quality □ Immediate and material EPS accretion □ Manageable initial tangible book value dilution with reasonable earnback period □ Conservative, achievable r esults M&A Rationale Gulf South Footprint FBMS Southwest SSNF LPO

First Bancshares, Inc. (Nasdaq: FBMS) Overview of Transaction Terms 6 Acquirer Fixed Consideration Mix (1) Cash Consideration Indicative Price Per Share (2) Aggregate Transaction Value (3) Price / Tangible Book Value Price / LTM Earnings (Incl. Cost Savings) 75% stock / 25% cash $27.00 for each share of SSNF $30.01 $32.1 million 145% 11.7x SSNF Pro Forma Ownership (4) 5.5% Financial Data as of 9/30/17 (1) S ubject to shareholder election, though consideration mix subject to limitation that total stock consideration will not exceed 75% and t ota l cash consideration will not exceed 25% (2) Blended per share price based on FBMS’ stock price of $33.35 as of 12/6/17, a fixed exchange ratio of 0.93x for 75% of SSNF shares and a cash payment of $27.00 per share for 25% of SSNF sha res (3) Inclusive of 80,000 in - the - money options with a weighted average strike price if $11.63, cashed out at $27.00 (4) Inclusive of shares issued in recent capital raise and pending acquisition of Southwest Banc Shares, Inc. Sunshine Lending Team Key personnel executed employment agreements Required Approvals Customary regulatory approvals and SSNF shareholder approval Expected Closing Second quarter 2018 Sunshine Financial, Inc. (OTC Pink: SSNF) Target Stock Consideration 0.93 of a share of FBMS stock for each share of SSNF

7 Overview of Sunshine Financial, Inc. □ Holding Company for Sunshine Community Bank □ Headquartered in Tallahassee, FL □ Founded in 1952; former credit union – Converted in 2007 to a mutual savings bank – Converted in 2009 to a mutual holding company – Converted in 2011 to public stock company □ All branches are in the Tallahassee, FL MSA □ 49 full time employees □ Core funded franchise Branch Locations Key Franchise Facts Financial Highlights Source: SNL Financial Data as of or for the three months ended 9/30/17 (1) Data bank level Balance Sheet Trends SSNF Annualized CAGRs Loans: 11.4% Deposits: 3.3% Assets: 6.0% $96 $97 $104 $114 $135 $161 $122 $122 $128 $130 $138 $142 $147 $147 $151 $158 $173 $194 2012 2013 2014 2015 2016 Q3 '17 Loans Deposits Assets Balance Sheet ($mm) Assets $194 Loans 161 Deposits 142 Common Equity 22 Loans / Deposits 113% % Core Deposits 100 Profitability ROAA 0.46% Net Interest Margin 4.04 Efficiency Ratio 81.8 Cost of Deposits 0.26 Asset Quality NPAs / Assets (1) 2.12% Reserves / Loans 0.68 Loan Concentration C&D / CRE Loan Concentration 44 / 337%

Healthcare 24% Professional, Scientific, & Technical Services 21% Retail Trade 10% Finance and Insurance 8% Wholesale Trade 7% Construction 7% Educational Services 7% Information 4% Other Services 2% Real Estate 2% Manufacturing 2% Transportation 1% Waste Management 1% Other 3% 8 Tallahassee Market Highlights Tallahassee - Leon County Economy Market Demographics Projected Population Growth (%) Projected Household Income Growth (%) Projected 2023 Household Income ($) □ Health services and higher education are large drivers of Tallahassee’s economic growth – Over 33% of the labor force works for the state or local government – Florida State University and Florida A&M attract over 90,000 students and provide 10,000+ jobs □ Visitors to Tallahassee created $ 771 million in economic impact during 2016 □ 18,398 businesses operating in the Tallahassee, FL MSA Deposit data as of 6/30/17 Source : SNL Financial, oevforbusiness.org, fred.stlouisfed.org (1) Small – mid sized businesses defined as businesses with $5 million - $25 million in projected annual sales 2.3% 4.9% 1.7% 6.7% 2.8% 0.8% 4.6% 3.8% 0.0% 2.0% 4.0% 6.0% 8.0% FBMS SSNF AL FL LA MS Southeast US $51,792 $52,401 $48,225 $53,508 $49,765 $44,328 $54,678 $61,642 $35,000 $45,000 $55,000 $65,000 FBMS SSNF AL FL LA MS Southeast US 5.7% 6.7% 5.2% 7.8% 5.5% 5.6% 6.5% 7.3% 0.0% 2.5% 5.0% 7.5% 10.0% FBMS SSNF AL FL LA MS Southeast US Small – Mid Sized Tallahassee Businesses (1)

Gulfport - Biloxi - Daphne - Fairhope - Tallahassee Pascagoula Hattiesburg Foley Mobile Baton Rouge MSA MSA MSA MSA MSA MSA Total Population 385,452 394,284 150,052 210,065 416,252 838,481 # of Small - Mid Sized Businesses (1) 1,561 1,190 574 808 1,939 3,278 2016 GDP ($bn) (2) $13.7 $16.3 $5.9 $6.2 $16.8 $51.5 2015-2016 GDP Growth 4.3% 0.5% 2.7% 10.4% 1.2% 0.7% Current Unemployment Rate (September 2017) 3.3% 4.9% 4.1% 3.0% 4.0% 4.5% Historical Population Growth '12 - '17 3.3% 5.5% 2.4% 10.6% 0.1% 3.3% Projected Population Growth '18 - '23 4.3 3.4 2.5 7.1 1.2 3.3 Median Household Income $47,380 $44,455 $44,966 $50,590 $46,395 $55,301 Colleges and Universities 3 3 2 0 4 6 9 Source : SNL Financial, fred.stlouisfed.org, citytowninfo.com Deposit data as of 6/30/17 (1) Small – mid sized businesses defined as businesses with $5 million - $25 million in projected annual sales (2) Real Gross Domestic Product as measured on January 1 of each year Major Metropolitan Markets of Operation Tallahassee, FL MSA Attractive New Market with Familiar Characteristics Deposits Deposit Rank Institution ($mm) Market Share 1 SunTrust Banks Inc. $1,269 16.7% 2 Wells Fargo & Co. 1198 15.8 3 Capital City Bank Group Inc. 1109 14.6 4 BB&T Corp. 861 11.3 5 Bank of America Corp. 830 10.9 6 Home BancShares Inc. 453 6.0 7 FMB Banking Corp. 347 4.6 8 Regions Financial Corp. 308 4.1 9 Prime Meridian Holding Co. 307 4.1 10 Synovus Financial Corp. 281 3.7 11 Hancock Holding Co. 279 3.7 12 Sunshine Financial, Inc. 145 1.9 13 Ameris Bancorp 113 1.5 14 American Commerce Bancshares Inc. 53 0.7 15 PeoplesSouth Bancshares Inc. 36 0.5 Market Total $7,588 100.0
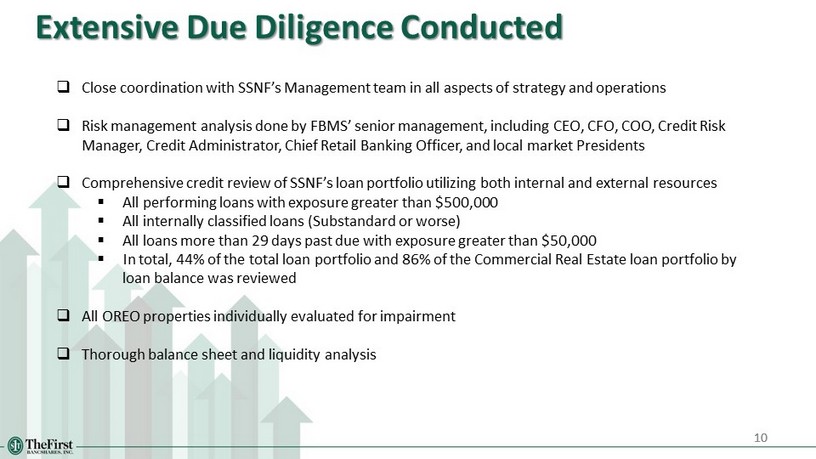
10 Extensive Due Diligence Conducted 10 □ Close coordination with SSNF’s Management team in all aspects of strategy and operations □ Risk management analysis done by FBMS’ senior management, including CEO, CFO, COO, Credit Risk Manager, Credit Administrator, Chief Retail Banking Officer, and local market Presidents □ Comprehensive credit review of SSNF’s loan portfolio utilizing both internal and external resources ▪ All performing loans with exposure greater than $500,000 ▪ All internally classified loans (Substandard or worse) ▪ All loans more than 29 days past due with exposure greater than $50,000 ▪ In total, 44% of the total loan portfolio and 86% of the Commercial Real Estate loan portfolio by loan balance was reviewed □ All OREO properties individually evaluated for impairment □ Thorough balance sheet and liquidity analysis
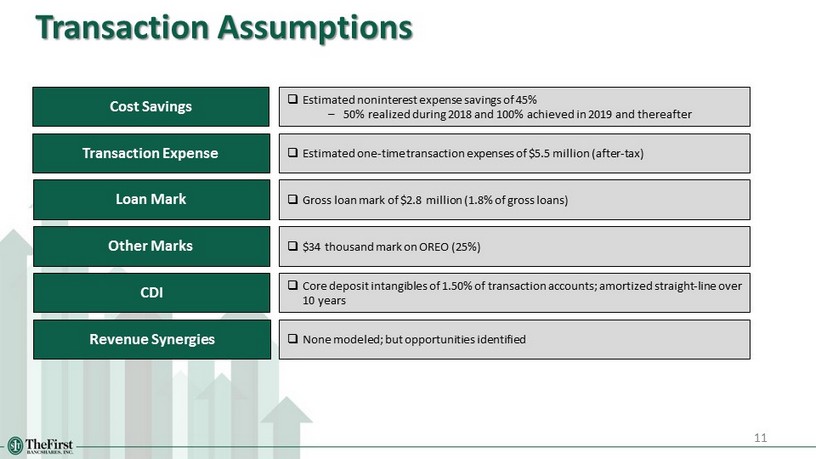
11 Cost Savings Transaction Expense Loan Mark Other Marks CDI □ Estimated noninterest expense savings of 45% – 50% realized during 2018 and 100% achieved in 2019 and thereafter □ Estimated one - time transaction expenses of $5.5 million (after - tax) □ Gross loan mark of $2.8 million (1.8% of gross loans) □ $34 thousand mark on OREO (25%) □ Core deposit intangibles of 1.50% of transaction accounts; amortized straight - line over 10 years Revenue Synergies □ None modeled; but opportunities identified Transaction Assumptions

12 Core Earnings Ability LTM Core Earnings Reconciliation ($000) Source: SNL Financial Data for the twelve months ended 9/30/17 (1) Based on SSNF’s reported LTM non interest expense of $7.4 million, inclusive of 100% realization for illustrative purposes $591 $557 $2,705 ($34) $2,148 $0 $500 $1,000 $1,500 $2,000 $2,500 $3,000 Net Income Less: After-Tax Non-Recurring Revenue Adjusted Net Income 45% After-Tax Expense Saves Adjusted After-Tax Net Income □ Baseline earnings of $2.7 million □ Excludes revenue synergies opportunities (1)

13 2019 EPS Impact IRR Initial Tangible Book Value Impact Tangible Book Value Earnback Period TCE / TA Leverage Ratio Common Equity Tier 1 Ratio Tier 1 Ratio Total Risk - Based Ratio C&D / Total Capital CRE / Total Capital Capital Ratios Loan Concentration (4) Upper Single - Digit Accretion Exceeds Internal Thresholds Slight Accretion None 8.0% 8.9% 8.4% 9.2% 10.0% 11.4% 10.7% 11.9% 11.3% 12.3% 101% 83% 244% 218% Scenarios: Scenarios: Standalone Estimated Pro Forma Financial Metrics 9.3% 9.7% 12.0% 12.6% 13.1% 85% 208% Capital Raise + Southwest Standalone data as of 9/30/17 (1) Estimated financial impact is presented solely for illustrative purposes. Includes acquired assets with corresponding purchas e a ccounting marks, deal related expenses and net proceeds from recent $58.4 million capital raise (2) Relative to FBMS, pro forma for the recent capital raise and acquisition of Southwest Banc Shares, Inc. (3) Relative to FBMS, as of 9/30/17 prior to any announced deals (4) Bank level total capital Pro Forma (1) Capital + Southwest + Sunshine Sunshine (3) Key Transaction Impacts to FBMS (1) Mid Single - Digit Accretion Exceeds Internal Thresholds Slight Dilution < 3 years Sunshine (2) Capital + Southwest + Balance Sheet and Liquidity ($ bn ) Assets Loans Deposits Loans / Deposits $1.8 $1.2 $1.5 79% $2.2 $1.5 $1.9 79% $2.4 $1.6 $2.0 80%

Mississippi 43% Lousiana 15% Alabama 30% Florida 12% 14 Overview of Our Combined Company Combined Company Footprint Pro Forma Highlights (1) Pro Forma Deposits by State (1) Pro Forma Loans by State (1) Source: SNL Financial Data as of or for the three months ended 9/30/17; deposit data as of 6/30/17 (1) Includes pending acquisition of Southwest Banc Shares, Inc. and SSNF; excludes purchase accounting adjustments FBMS Southwest SSNF Assets $2.4bn Loans 1.6bn Deposits 2.0bn Loans / Deposits 80% MISSISSIPPI FLORIDA ALABAMA LOUISIANA Huntsville Tuscaloosa Birmingham Tallahassee Pensacola Mobile Montgomery Hattiesburg Baton Rouge Jackson Shreveport Gulfport New Orleans Oxford Mississippi 38% Lousiana 16% Alabama 31% Florida 15%

15 Summary 15 □ B uilds upon M&A growth strategy in the Gulf South □ Expands the franchise into an attractive new market □ C reates significant growth opportunity through expected retention of experienced lending team □ Enhances growth and profitability outlook □ Positions company well for future

APPENDIX

C&D 14% 1 - 4 Family 26% Multifamily 3% Owner - Occupied CRE 22% Non Owner - Occupied CRE 16% C&I 14% Consumer & Other 4% Farmland 2% 17 Pro Forma Loan Composition SSNF FBMS (1) Pro Forma (2) Yield on Total Loans: 4.86% Yield on Total Loans: 4.82% Source: SNL Financial Dollars in thousands D ata as of or for the three months ended 9/30/17; SSNF data bank level Note: Pie charts may not total to 100% due to rounding (1) Pro forma for pending acquisition of Southwest Banc Shares, Inc. (2) Excludes purchase accounting adjustments C&D 5% 1 - 4 Family 44% Owner - Occupied CRE 9% Non Owner - Occupied CRE 34% C&I 3% Consumer & Other 6% C&D 13% 1 - 4 Family 28% Multifamily 3% Owner - Occupied CRE 21% Non Owner - Occupied CRE 18% C&I 12% Consumer & Other 4% Farmland 1% Loan Portfolio Amount % of Total C&D $202,782 13.7 % 1-4 Family 392,396 26.5 Multifamily 45,830 3.1 Owner-Occupied CRE 324,681 21.9 Non Owner-Occupied CRE 236,058 15.9 C&I 200,871 13.6 Consumer & Other 54,948 3.7 Farmland 23,907 1.6 Gross Loans & Leases $1,481,473 100.0 % Loan Portfolio Amount % of Total C&D $8,151 5.1 % 1-4 Family 69,925 43.5 Multifamily 0 0.0 Owner-Occupied CRE 13,695 8.5 Non Owner-Occupied CRE 54,496 33.9 C&I 4,325 2.7 Consumer & Other 10,046 6.3 Farmland 0 0.0 Gross Loans & Leases $160,638 100.0 % Loan Portfolio Amount % of Total C&D $210,933 12.8 % 1-4 Family 462,321 28.2 Multifamily 45,830 2.8 Owner-Occupied CRE 338,376 20.6 Non Owner-Occupied CRE 290,554 17.7 C&I 205,196 12.5 Consumer & Other 64,994 4.0 Farmland 23,907 1.5 Gross Loans & Leases $1,642,111 100.0 %
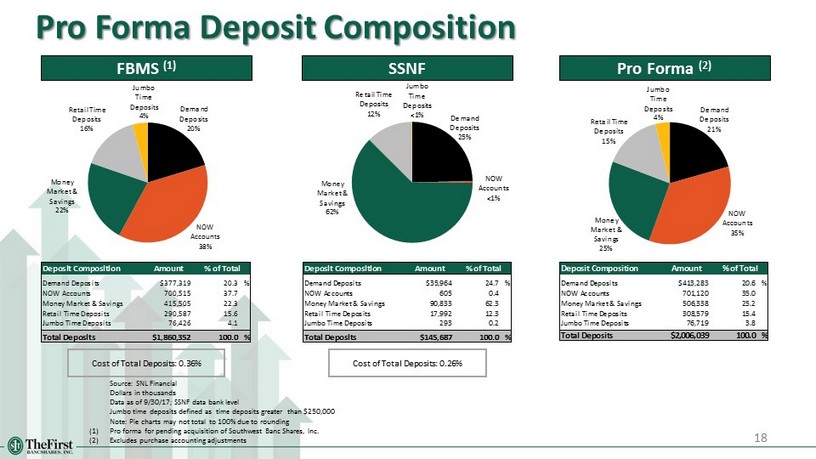
18 Pro Forma Deposit Composition SSNF FBMS (1) Pro Forma (2) Cost of Total Deposits: 0.36% Cost of Total Deposits: 0.26% Source: SNL Financial Dollars in thousands Data as of 9/30/17; SSNF data bank level Jumbo time deposits defined as time deposits greater than $250,000 Note: Pie charts may not total to 100% due to rounding (1) Pro forma for pending acquisition of Southwest Banc Shares, Inc. (2) Excludes purchase accounting adjustments Demand Deposits 20% NOW Accounts 38% Money Market & Savings 22% Retail Time Deposits 16% Jumbo Time Deposits 4% Demand Deposits 25% NOW Accounts <1% Money Market & Savings 62% Retail Time Deposits 12% Jumbo Time Deposits <1% Demand Deposits 21% NOW Accounts 35% Money Market & Savings 25% Retail Time Deposits 15% Jumbo Time Deposits 4% Deposit Composition Amount % of Total Demand Deposits $377,319 20.3 % NOW Accounts 700,515 37.7 Money Market & Savings 415,505 22.3 Retail Time Deposits 290,587 15.6 Jumbo Time Deposits 76,426 4.1 Total Deposits $1,860,352 100.0 % Deposit Composition Amount % of Total Demand Deposits $35,964 24.7 % NOW Accounts 605 0.4 Money Market & Savings 90,833 62.3 Retail Time Deposits 17,992 12.3 Jumbo Time Deposits 293 0.2 Total Deposits $145,687 100.0 % Deposit Composition Amount % of Total Demand Deposits $413,283 20.6 % NOW Accounts 701,120 35.0 Money Market & Savings 506,338 25.2 Retail Time Deposits 308,579 15.4 Jumbo Time Deposits 76,719 3.8 Total Deposits $2,006,039 100.0 %