Attached files
| file | filename |
|---|---|
| 8-K - 8-K - MALVERN BANCORP, INC. | s108325_8k.htm |
Exhibit 99.1

Investor Relations:
Joseph D. Gangemi
SVP & CFO
(610) 695-3676
Investor Contact:
Ronald Morales
(610) 695-3646
Malvern Bancorp, Inc. Reports Fourth Fiscal Quarter and Fiscal 2017 Results
Earnings Driven by Loan Growth and Higher Net Interest Income
PAOLI, PA., December 1, 2017 -- Malvern Bancorp, Inc. (NASDAQ: MLVF) (the "Company"), parent company of Malvern Federal Savings Bank (“Malvern” or the “Bank”), today reported operating results for the fourth fiscal quarter ended September 30, 2017. Net income amounted to $2.0 million, or $0.30 per fully diluted common share, for the quarter ended September 30, 2017, compared with net income of $8.0 million, or $1.24 per fully diluted common share, for the quarter ended September 30, 2016. For the twelve months ended September 30, 2017, net income amounted to $5.8 million, or $0.90 per fully diluted common share, compared with net income of $12.2 million, or $1.90 per fully diluted common share, for the twelve months ended September 30, 2016.
As previously disclosed in the Company’s Current Report on Form 8-K filed with the Securities and Exchange Commission (“SEC”) on November 28, 2017 (the “8-K”), the Company was advised by BDO USA, LLP (“BDO”), its independent registered public accounting firm, that BDO’s audit report on the Company’s consolidated financial statements as of September 30, 2016 and 2015, and for each of the years in the two year period ended September 30, 2016 and 2015, and BDO’s completed interim reviews of the Company’s consolidated interim financial statements as of and for the periods ended December 31, 2016, March 31, 2017 and June 30, 2017 (collectively, the “Specified Financial Statements”), should no longer be relied upon. The Company plans to restate the Specified Financial Statements, which will be included in amendments to the Company’s fiscal 2016 10-K and 10-Qs for the first three quarters of fiscal 2017. All numbers in this press release reflect such restatements.
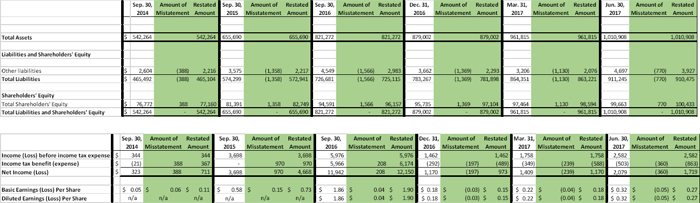
The matters described in the 8-K relate to the Company’s tax account balances. The effect of these matters is to increase net income for fiscal 2016 by approximately $208,000, fiscal 2015 by approximately $970,000 and fiscal 2014 by approximately $388,000. The effect of these matters as of and for the fiscal year ended September 30, 2017, is a decrease to net income of approximately $795,000 and a decrease in tax liability account of $795,000. These matters have no effect on the Company’s cash position, net interest margin, pre-tax income or the Company’s operating expenses.
The following table below shows the analysis of the impact on the consolidated balance sheets and income statements for the periods affected.
(in thousands, except per share data)
“Our results for the fourth quarter of fiscal 2017 were strong; top line revenue expanded and overall we continued to reflect the forward momentum of the Company. Our continued focus on client service continues to aid in gathering customer relationships, fueling the business model focus and resulting performance. We are excited by the sequential growth and the prospects for continued growth in fiscal 2018,” commented Anthony C. Weagley, President and Chief Executive Officer.
“Total loans increased $263.8 million, mostly in commercial and industrial and commercial real estate. We remain successful gathering deposits across the franchise as evidenced by the growth in deposits of $188.4 million to $790.4 million at September 30, 2017.”
Joe Gangemi, Chief Financial Officer of Malvern Bancorp, Inc., added, "Malvern continues to grow its capital position with growth in core earnings, and has produced yet another quarter of solid financial performance".
Highlights for the quarter include:
| ● | Return on average assets (“ROAA”) was 0.77 percent for the three months ended September 30, 2017, compared to 4.01 percent for the three months ended September 30, 2016, and return on average equity (“ROAE”) was 7.70 percent for the three months ended September 30, 2017, compared with 35.50 percent for the three months ended September 30, 2016. |
| ● | The Company originated $84.8 million in new loans in the fourth quarter of fiscal 2017, which was offset in part by $50.2 million in participations, payoffs, prepayments and maturities from its portfolio, resulting in net portfolio growth of $34.6 million over the third quarter of fiscal 2017; new loan originations in the fourth quarter of fiscal 2017 consisted of $13.9 million in residential mortgage loans, $57.4 million in commercial loans, $10.5 million in construction and development loans and $3.0 million in consumer loans. |
| -2- |
| ● | Non-performing assets (“NPAs”) were 0.12 percent of total assets at September 30, 2017, compared to 0.19 percent at June 30, 2017 and 0.28 percent at September 30, 2016. The allowance for loan losses as a percentage of total non-performing loans was 694.1 percent at September 30, 2017, compared to 421.8 percent at June 30, 2017 and 234.9 percent at September 30, 2016. |
| ● | The Company’s ratio of shareholders’ equity to total assets was 9.80 percent at September 30, 2017, compared to 9.93 percent at June 30, 2017, and 11.71 percent at September 30, 2016. |
| ● | Book value per common share amounted to $15.60 at September 30, 2017, compared to $15.28 at June 30, 2017 and $14.66 at September 30, 2016. The efficiency ratio, a non-GAAP measure, was 55.4 percent for the fourth quarter of fiscal 2017 on an annualized basis, compared to 57.0 percent in the third quarter of fiscal 2017 and 67.7 percent in the fourth quarter of fiscal 2016. |
| ● | The Company’s balance sheet reflected total asset growth of $224.7 million at September 30, 2017, compared to September 30, 2016, coupled with stable asset quality, and capital levels that exceeded regulatory standards for a well-capitalized institution. |
| Selected Financial Ratios (unaudited; annualized where applicable) | ||||||||||||||||||||
| Restated | Restated | Restated | Restated | |||||||||||||||||
| As of or for the quarter ended : | 9/30/17 | 6/30/17 | 3/31/17 | 12/31/16 | 9/30/16 | |||||||||||||||
| Return on average assets | 0.77 | % | 0.70 | % | 0.51 | % | 0.47 | % | 4.01 | % | ||||||||||
| Return on average equity | 7.70 | % | 6.90 | % | 4.77 | % | 4.03 | % | 35.50 | % | ||||||||||
| Net interest margin (tax equivalent basis) (1) | 2.76 | % | 2.72 | % | 2.75 | % | 2.64 | % | 2.65 | % | ||||||||||
| Loans / deposits ratio | 106.55 | % | 106.30 | % | 107.80 | % | 102.29 | % | 96.07 | % | ||||||||||
| Shareholders’ equity / total assets | 9.80 | % | 9.93 | % | 10.25 | % | 11.05 | % | 11.71 | % | ||||||||||
| Efficiency ratio (1) | 55.4 | % | 57.0 | % | 57.4 | % | 61.6 | % | 67.7 | % | ||||||||||
| Book value per common share | $ | 15.60 | $ | 15.28 | $ | 15.00 | $ | 14.80 | $ | 14.66 | ||||||||||
| (1) | Information reconciling non-GAAP measures to GAAP measures is presented elsewhere in this press release. |
Net Interest Income
For the three months ended September 30, 2017, total interest income on a fully tax-equivalent basis increased $2.7 million, or 38.8 percent, to $9.6 million, compared to the three months ended September 30, 2016. Interest income rose in the quarter ended September 30, 2017, compared to the comparable period in fiscal 2016, primarily due to a $255.8 million increase in the average balance of our loans. Total interest expense increased by $1.0 million, or 57.1 percent, to $2.8 million, for the three months ended September 30, 2017, compared to the same period in fiscal 2016 due to the increase of $187.6 million in average funding sources.
Net interest income on a fully tax-equivalent basis was $6.7 million for the three months ended September 30, 2017, increasing $1.6 million, or 32.4 percent, from $5.1 million for the comparable three-month period in fiscal 2016. The change for the three months ended September 30, 2017 primarily was the result of an increase in the average balance of interest earning assets, which increased $210.8 million. The net interest spread on an annualized tax-equivalent basis was at 2.59 percent and 2.51 percent for the three months ended September 30, 2017 and 2016, respectively. For the quarter ended September 30, 2017, the Company’s net interest margin on a tax-equivalent basis increased to 2.75 percent as compared to 2.65 percent for the same three-month period in fiscal 2016.
| -3- |
The 57.1 percent increase in interest expense for the fourth quarter of fiscal 2017 as compared to the fourth quarter of fiscal 2016 was primarily due to an increase in deposits, as well as the interest expense associated with the Company’s subordinated debt. The average cost of funds was 1.32 percent for the quarter ended September 30, 2017 compared to 1.08 percent for the same three-month period in fiscal 2016 and, on a linked sequential quarter basis, increased 7 basis points compared to the third quarter of fiscal 2017. The increase in cost was primarily related to the increase in average volume, coupled with the increased expense related to the issuance of subordinated debt.
For the twelve months ended September 30, 2017, total interest income on a fully tax equivalent basis increased $8.4 million, or 33.1 percent, to $33.9 million, compared to $25.5 million for the twelve months ended September 30, 2016. Total interest expense increased by $2.7 million, or 40.3 percent, to $9.4 million, for the twelve months ended September 30, 2017, compared from the comparable period in fiscal 2016. Interest income rose for the twelve months ended September 30, 2017, compared to the comparable period in fiscal 2016 primarily due to a $230.5 million increase in average loan balances. Compared to the same period in fiscal 2016, for the twelve months ended September 30, 2017, average interest earning assets increased $191.3 million, the net interest spread increased on an annualized tax-equivalent basis by four basis points and the net interest margin increased on an annualized tax-equivalent basis by seven basis points.
Earnings Summary for the Period Ended September 30, 2017
The following table presents condensed consolidated statements of income data for the periods indicated.
| (dollars in thousands, except per share data) | ||||||||||||||||||||
| Restated | Restated | Restated | Restated | |||||||||||||||||
| For the quarter ended: | 9/30/17 | 6/30/17 | 3/31/17 | 12/31/16 | 9/30/16 | |||||||||||||||
| Net interest income | $ | 6,707 | $ | 6,399 | $ | 5,991 | $ | 5,239 | $ | 5,021 | ||||||||||
| Provision for loan losses | 489 | 645 | 997 | 660 | 100 | |||||||||||||||
| Net interest income after provision for loan losses | 6,218 | 5,754 | 4,994 | 4,579 | 4,921 | |||||||||||||||
| Other income | 532 | 814 | 542 | 453 | 615 | |||||||||||||||
| Other expense | 3,813 | 3,986 | 3,778 | 3,570 | 3,759 | |||||||||||||||
| Income before income tax expense (benefit) | 2,937 | 2,582 | 1,758 | 1,462 | 1,777 | |||||||||||||||
| Income tax expense (benefit) | 982 | 863 | 588 | 489 | (6,174 | ) | ||||||||||||||
| Net income | $ | 1,955 | $ | 1,719 | $ | 1,170 | $ | 973 | $ | 7,951 | ||||||||||
| Earnings per common share | ||||||||||||||||||||
| Basic | $ | 0.30 | $ | 0.27 | $ | 0.18 | $ | 0.15 | $ | 1.24 | ||||||||||
| Diluted | $ | 0.30 | $ | 0.27 | $ | 0.18 | $ | 0.15 | $ | 1.24 | ||||||||||
| Weighted average common shares outstanding: | ||||||||||||||||||||
| Basic | 6,441,731 | 6,443,515 | 6,427,309 | 6,418,583 | 6,415,049 | |||||||||||||||
| Diluted | 6,445,151 | 6,445,288 | 6,427,932 | 6,419,012 | 6,415,207 | |||||||||||||||
| -4- |
Other Income
Other income decreased $83,000, or 13.5 percent, for the fourth quarter of fiscal 2017 compared with the same period in fiscal 2016. The decrease in other income was primarily a result of a $113,000 decrease in net gains on sales of investment securities. The decrease was offset in part by an increase in net gains on sale of loans of $22,000 and rental income of $10,000. Excluding net securities gains and losses, a non-GAAP measure, the Company would have recorded other income of $501,000 for the three months ended September 30, 2017 compared to $471,000 for the three months ended September 30, 2016, an increase of $30,000, or 6.4 percent.
For the twelve months ended September 30, 2017, total other income increased $8,000 compared to the same period in fiscal 2016, primarily a result of a $68,000 increase in service charges and other fees, a $16,000 increase in rental income and a $38,000 increase in net gains on sale of loans. The increase was partially offset by a $102,000 decrease in net gains on sales of investment securities and a $12,000 decrease in earnings on bank-owned insurance. Excluding net securities gains and losses, a non-GAAP measure, the Company recorded other income of $1.9 million for the twelve months ended September 30, 2017 compared to $1.8 million for the comparable period in fiscal 2016, an increase of $110,000, or 6.2 percent.
The following table presents the components of other income for the periods indicated.
| (in thousands, unaudited) | ||||||||||||||||||||
| For the quarter ended: | 9/30/17 | 6/30/17 | 3/31/17 | 12/31/16 | 9/30/16 | |||||||||||||||
| Service charges on deposit accounts | $ | 262 | $ | 233 | $ | 274 | $ | 223 | $ | 259 | ||||||||||
| Rental income – other | 66 | 51 | 55 | 55 | 56 | |||||||||||||||
| Net gains on sales of investments, net | 31 | 374 | 58 | — | 144 | |||||||||||||||
| Gain on sale of loans, net | 48 | 31 | 30 | 45 | 26 | |||||||||||||||
| Bank-owned life insurance | 125 | 125 | 125 | 130 | 130 | |||||||||||||||
| Total other income | $ | 532 | $ | 814 | $ | 542 | $ | 453 | $ | 615 | ||||||||||
Other Expense
Total other expense for the three months ended September 30, 2017, increased $54,000, or 1.4 percent, when compared to the quarter ended September 30, 2016. The increase primarily reflected increases in salaries and employee benefits of $56,000, a $71,000 increase in occupancy expense, and a $20,000 increase in other operating expense. The increase in occupancy expense was mainly due to expanded locations. Additionally, the increase in salaries and employee benefits primarily reflects higher compensation and related costs due to added staff to support overall franchise growth.
For the twelve months ended September 30, 2017, total other expense increased $1.2 million, or 8.8 percent, compared to the same period in fiscal 2016. The increase primarily reflected increases in salaries and employee benefits of $824,000, a $264,000 increase in occupancy expense, an $85,000 increase in advertising expense, a $67,000 increase in data processing expense, a $211,000 increase in professional fees and a $109,000 increase in other operating expense. These increases were partially offset by a decrease of $335,000 in the federal deposit insurance premium.
| -5- |
The following table presents the components of other expense for the periods indicated.
| (in thousands, unaudited) | ||||||||||||||||||||
| For the quarter ended: | 9/30/17 | 6/30/17 | 3/31/17 | 12/31/16 | 9/30/16 | |||||||||||||||
| Salaries and employee benefits | $ | 1,725 | $ | 1,873 | $ | 1,804 | $ | 1,712 | $ | 1,669 | ||||||||||
| Occupancy expense | 543 | 533 | 514 | 494 | 472 | |||||||||||||||
| Federal deposit insurance premium | 71 | 78 | 91 | 4 | 107 | |||||||||||||||
| Advertising | 25 | 67 | 73 | 51 | 50 | |||||||||||||||
| Data processing | 285 | 308 | 301 | 302 | 283 | |||||||||||||||
| Professional fees | 473 | 621 | 399 | 401 | 507 | |||||||||||||||
| Other operating expenses | 691 | 506 | 596 | 606 | 671 | |||||||||||||||
| Total other expense | $ | 3,813 | $ | 3,986 | $ | 3,778 | $ | 3,570 | $ | 3,759 | ||||||||||
| -6- |
Statement of Condition Highlights at September 30, 2017
Highlights as of September 30, 2017, included:
| ● | Balance sheet strength, with total assets amounting to $1.0 billion at September 30, 2017, increasing $224.7 million, or 27.4 percent, compared to September 30, 2016. |
| ● | The Company’s gross loans were $842.1 million at September 30, 2017, increasing $263.8 million, or 45.6 percent, from September 30, 2016. |
| ● | Total investments were $49.5 million at September 30, 2017, a decrease of $57.4 million, or 53.7 percent, compared to September 30, 2016. |
| ● | Deposits totaled $790.4 million at September 30, 2017, an increase of $188.4 million, or 31.3 percent, compared to September 30, 2016. |
| ● | Federal Home Loan Bank (FHLB) advances totaled $118.0 million at September 30, 2017 and at September 30, 2016. |
| ● | Subordinated debt totaled $24.3 million at September 30, 2017 and zero at September 30, 2016. On February 7, 2017, the Company completed a private placement of $25.0 million in aggregate principal amount of fixed-to-floating rate subordinated notes (the “Notes”) to certain institutional investors. The Notes are non-callable for five years, have a stated maturity of February 15, 2027, and bear interest at a fixed rate of 6.125% per year, from and including February 7, 2017 to, but excluding February 15, 2022. |
-7-
Condensed Consolidated Statements of Condition
The following table presents condensed consolidated statements of condition data as of the dates indicated.
| Condensed Consolidated Statements of Condition (unaudited) | ||||||||||||||||||||
| (in thousands) | Restated | Restated | Restated | Restated | ||||||||||||||||
| At quarter ended: | 9/30/17 | 6/30/17 | 3/31/17 | 12/31/16 | 9/30/16 | |||||||||||||||
| Cash and due from depository institutions | $ | 1,615 | $ | 1,622 | $ | 1,716 | $ | 1,598 | $ | 1,297 | ||||||||||
| Interest bearing deposits in depository institutions | 115,521 | 111,805 | 64,036 | 61,683 | 95,465 | |||||||||||||||
| Investment securities, available for sale, at fair value | 14,587 | 16,811 | 61,672 | 65,108 | 66,387 | |||||||||||||||
| Investment securities held to maturity | 34,915 | 36,027 | 37,060 | 38,160 | 40,551 | |||||||||||||||
| Restricted stock, at cost | 5,559 | 5,458 | 5,397 | 5,416 | 5,424 | |||||||||||||||
| Loans receivable, net of allowance for loan losses | 834,331 | 800,337 | 752,708 | 668,427 | 574,160 | |||||||||||||||
| Accrued interest receivable | 3,139 | 2,837 | 3,177 | 2,899 | 2,558 | |||||||||||||||
| Property and equipment, net | 7,507 | 7,182 | 6,896 | 6,769 | 6,637 | |||||||||||||||
| Deferred income taxes | 6,671 | 7,912 | 7,881 | 8,449 | 8,827 | |||||||||||||||
| Bank-owned life insurance | 18,923 | 18,798 | 18,673 | 18,548 | 18,418 | |||||||||||||||
| Other assets | 3,244 | 2,119 | 2,599 | 1,945 | 1,548 | |||||||||||||||
| Total assets | $ | 1,046,012 | $ | 1,010,908 | $ | 961,815 | $ | 879,002 | $ | 821,272 | ||||||||||
| Deposits | $ | 790,396 | $ | 759,679 | $ | 704,272 | $ | 658,623 | $ | 602,046 | ||||||||||
| FHLB advances | 118,000 | 118,000 | 118,000 | 118,000 | 118,000 | |||||||||||||||
| Other short-term borrowings | 5,000 | — | 10,000 | — | — | |||||||||||||||
| Subordinated debt | 24,303 | 24,263 | 25,000 | — | — | |||||||||||||||
| Other liabilities | 5,793 | 8,533 | 5,949 | 5,275 | 5,069 | |||||||||||||||
| Shareholders’ equity | 102,520 | 100,433 | 98,594 | 97,104 | 96,157 | |||||||||||||||
| Total liabilities and shareholders’ equity | $ | 1,046,012 | $ | 1,010,908 | $ | 961,815 | $ | 879,002 | $ | 821,272 | ||||||||||
The following table reflects the composition of the Company’s deposits as of the dates indicated.
| Deposits (unaudited) | ||||||||||||||||||||
| (in thousands) | ||||||||||||||||||||
| At quarter ended: | 9/30/17 | 6/30/17 | 3/31/17 | 12/31/16 | 9/30/16 | |||||||||||||||
| Demand: | ||||||||||||||||||||
| Non-interest bearing | $ | 42,121 | $ | 50,097 | $ | 45,303 | $ | 35,184 | $ | 34,547 | ||||||||||
| Interest-bearing | 155,579 | 105,439 | 102,525 | 101,759 | 95,041 | |||||||||||||||
| Savings | 44,526 | 43,709 | 43,913 | 42,699 | 44,714 | |||||||||||||||
| Money market | 276,404 | 274,018 | 251,671 | 217,260 | 177,486 | |||||||||||||||
| Time | 271,766 | 286,416 | 260,860 | 261,721 | 250,258 | |||||||||||||||
| Total deposits | $ | 790,396 | $ | 759,679 | $ | 704,272 | $ | 658,623 | $ | 602,046 | ||||||||||
-8-
Loans
Total net loans amounted to $834.3 million at September 30, 2017 compared to $574.2 million at September 30, 2016, for a net increase of $260.1 million or 45.3 percent for the period. The allowance for loan losses amounted to $8.4 million and $5.4 million at September 30, 2017 and September 30, 2016, respectively. Average loans during the fourth quarter of fiscal 2017 totaled $831.6 million as compared to $575.8 million during the fourth quarter of fiscal 2016, representing a 44.4 percent increase.
At the end of the fourth quarter of fiscal 2017, the loan portfolio remained weighted toward two primary components: commercial and the core residential portfolio, with commercial real estate accounting for 52.0 percent and single-family residential real estate loans accounting for 22.9 percent of the loan portfolio. Construction and development loans amounted to 6.4 percent and consumer loans represented 4.9 percent of the loan portfolio at such date. Total gross loans increased $263.8 million, to $842.1 million at September 30, 2017 compared to $578.4 million at September 30, 2016. The increase in the loan portfolio at September 30, 2017 compared to September 30, 2016, primarily reflected an increase of $264.4 million in commercial loans and a $25.4 million increase in construction and development loans. These increases were partially offset by a $16.7 million decrease in residential mortgage loans and a $9.3 million reduction in consumer loans at September 30, 2017 as compared to September 30, 2016.
For the quarter ended September 30, 2017, the Company originated total new loan volume of $84.8 million, which was offset in part by participations out, payoffs, prepayments and maturities totaling $50.2 million.
The following reflects the composition of the Company’s loan portfolio as of the dates indicated.
| Loans (unaudited) | ||||||||||||||||||||
| (in thousands) | ||||||||||||||||||||
| At quarter ended: | 9/30/17 | 6/30/17 | 3/31/17 | 12/31/16 | 9/30/16 | |||||||||||||||
| Residential mortgage | $ | 192,500 | $ | 190,788 | $ | 192,775 | $ | 205,668 | $ | 209,186 | ||||||||||
| Construction and Development: | ||||||||||||||||||||
| Residential and commercial | 35,622 | 36,530 | 46,721 | 28,296 | 18,579 | |||||||||||||||
| Land | 18,377 | 18,325 | 14,322 | 10,117 | 10,013 | |||||||||||||||
| Total construction and development | 53,999 | 54,855 | 61,043 | 38,413 | 28,592 | |||||||||||||||
| Commercial: | ||||||||||||||||||||
| Commercial real estate | 437,760 | 424,732 | 383,170 | 307,821 | 231,439 | |||||||||||||||
| Farmland | 1,723 | 1,734 | — | — | — | |||||||||||||||
| Multi-family | 39,768 | 21,547 | 12,838 | 19,805 | 19,515 | |||||||||||||||
| Other | 74,837 | 71,248 | 63,551 | 53,587 | 38,779 | |||||||||||||||
| Total commercial | 554,088 | 519,261 | 459,559 | 381,213 | 289,733 | |||||||||||||||
| Consumer: | ||||||||||||||||||||
| Home equity lines of credit | 16,509 | 17,602 | 19,214 | 19,729 | 19,757 | |||||||||||||||
| Second mortgages | 22,480 | 23,658 | 25,103 | 26,971 | 29,204 | |||||||||||||||
| Other | 2,570 | 1,403 | 1,512 | 1,697 | 1,914 | |||||||||||||||
| Total consumer | 41,559 | 42,663 | 45,829 | 48,397 | 50,875 | |||||||||||||||
| Total loans | 842,146 | 807,567 | 759,206 | 673,691 | 578,386 | |||||||||||||||
| Deferred loan costs, net | 590 | 687 | 683 | 913 | 1,208 | |||||||||||||||
| Allowance for loan losses | (8,405 | ) | (7,917 | ) | (7,181 | ) | (6,177 | ) | (5,434 | ) | ||||||||||
| Loans Receivable, net | $ | 834,331 | $ | 800,337 | $ | 752,708 | $ | 668,427 | $ | 574,160 | ||||||||||
At September 30, 2017, the Company had $120.2 million in overall undisbursed loan commitments, which consisted primarily of unused commercial lines of credit, home equity lines of credit and available usage from active construction facilities. Included in the overall undisbursed commitments are the Company’s “Approved, Accepted but Unfunded” pipeline, which includes approximately $9.2 million in construction and $56.7 million in commercial real estate loans, $7.3 million in commercial term loans and lines of credit and $7.0 million in residential mortgage loans expected to fund over the next 90 days.
-9-
Asset Quality
Non-accrual loans were $1.0 million at September 30, 2017 a decrease of $579,000 or 35.8 percent, as compared to $1.6 million at September 30, 2016. Other real estate owned (“OREO”) remained at zero at both September 30, 2017 and September 30, 2016. Total performing troubled debt restructured loans were $2.2 million at September 30, 2017 and $2.0 million at September 30, 2016.
At September 30, 2017, non-performing assets totaled $1.2 million, or 0.12 percent of total assets, as compared with $2.3 million, or 0.28 percent, at September 30, 2016. The portfolio of non-accrual loans at September 30, 2017 was comprised of nine residential real estate loans with an aggregate outstanding balance of approximately $826,000 and five consumer loans with an aggregate outstanding balance of approximately $212,000.
The following table presents the components of non-performing assets and other asset quality data for the periods indicated.
| (dollars in thousands, unaudited) | ||||||||||||||||||||
| As of or for the quarter ended: | 9/30/17 | 6/30/17 | 3/31/17 | 12/31/16 | 9/30/16 | |||||||||||||||
| Non-accrual loans(1) | $ | 1,038 | $ | 1,556 | $ | 1,566 | $ | 1,833 | $ | 1,617 | ||||||||||
| Loans 90 days or more past due and still accruing | 173 | 321 | 122 | 121 | 696 | |||||||||||||||
| Total non-performing loans | 1,211 | 1,877 | 1,688 | 1,954 | 2,313 | |||||||||||||||
| Other real estate owned | — | — | — | — | — | |||||||||||||||
| Total non-performing assets | $ | 1,211 | $ | 1,877 | $ | 1,688 | $ | 1,954 | $ | 2,313 | ||||||||||
| Performing troubled debt restructured loans | $ | 2,238 | $ | 1,603 | $ | 1,623 | $ | 1,418 | $ | 2,039 | ||||||||||
| Non-performing assets / total assets | 0.12 | % | 0.19 | % | 0.18 | % | 0.22 | % | 0.28 | % | ||||||||||
| Non-performing loans / total loans | 0.14 | % | 0.23 | % | 0.22 | % | 0.29 | % | 0.40 | % | ||||||||||
| Net charge-offs (recoveries) | $ | 1 | $ | (91 | ) | $ | (7 | ) | $ | (83 | ) | $ | 9 | |||||||
| Net charge-offs (recoveries) / average loans(2) | 0.00 | % | (0.05 | )% | 0.00 | % | (0.04 | )% | 0.01 | % | ||||||||||
| Allowance for loan losses / total loans | 1.00 | % | 0.98 | % | 0.95 | % | 0.92 | % | 0.94 | % | ||||||||||
| Allowance for loan losses / non-performing loans | 694.1 | % | 421.8 | % | 425.4 | % | 316.1 | % | 234.9 | % | ||||||||||
| Total assets | $ | 1,046,012 | $ | 1,010,908 | $ | 961,815 | $ | 879,002 | $ | 821,272 | ||||||||||
| Total gross loans | 842,146 | 807,567 | 759,206 | 673,691 | 578,386 | |||||||||||||||
| Average loans | 831,578 | 792,139 | 717,376 | 612,388 | 575,784 | |||||||||||||||
| Allowance for loan losses | 8,405 | 7,917 | 7,181 | 6,177 | 5,434 | |||||||||||||||
| (1) | 10 loans totaling approximately $554 thousand, or 53.4% of the total non-accrual loan balance, were making payments at September 30, 2017. |
| (2) | Annualized. |
The allowance for loan losses at September 30, 2017 amounted to approximately $8.4 million, or 1.00 percent of total loans, compared to $5.4 million, or 0.94 percent of total loans, at September 30, 2016. The Company had a $489,000 provision for loan losses during the quarter ended September 30, 2017 compared to $100,000 for the quarter ended September 30, 2016. For the twelve months ended September 30, 2017 and 2016, the Company had a $2.8 million and $947,000, respectively, provision for loan losses. Provision expense was higher during fiscal 2017 due to an increase in loan growth and level of reserves commensurate with the size of the loan portfolio overall.
-10-
Capital
At September 30, 2017, our total shareholders’ equity amounted to $102.5 million, or 9.80 percent of total assets, compared to $96.2 million at September 30, 2016. The Company’s book value per common share was $15.60 at September 30, 2017, compared to $14.66 at September 30, 2016. At September 30, 2017, the Bank’s common equity tier 1 ratio was 14.75 percent, tier 1 leverage ratio was 12.03 percent, tier 1 risk-based capital ratio was 14.75 percent and the total risk-based capital ratio was 15.79 percent. At September 30, 2016, the Bank’s common equity tier 1 ratio was 14.50 percent, tier 1 leverage ratio was 10.98 percent, tier 1 risk-based capital ratio was 14.50 percent and the total risk-based capital ratio was 15.42 percent. At September 30, 2017, the Bank was in compliance with all applicable regulatory capital requirements.
Non-GAAP Financial Measures
Reported amounts are presented in accordance with accounting principles generally accepted in the United States of America (“GAAP”). The Company’s management believes that the supplemental non-GAAP information provided in this press release is utilized by market analysts and others to evaluate a company’s financial condition and, therefore, that such information is useful to investors. These disclosures should not be viewed as a substitute for financial results determined in accordance with GAAP, nor are they necessarily comparable to non-GAAP performance measures presented by other companies.
The Company’s other income is presented in the table below including and excluding net investment securities gains. The Company’s management believes that many investors desire to evaluate other income without regard to such gains.
| (in thousands) | ||||||||||||||||||||
| For the quarter ended: | 6/30/17 | 6/30/17 | 3/31/17 | 12/31/16 | 9/30/16 | |||||||||||||||
| Other income | $ | 532 | $ | 814 | $ | 542 | $ | 453 | $ | 615 | ||||||||||
| Less: Net investment securities gains | 31 | 374 | 58 | — | 144 | |||||||||||||||
| Other
income, excluding net investment securities gains | $ | 501 | $ | 440 | $ | 484 | $ | 453 | $ | 471 | ||||||||||
-11-
“Efficiency ratio” is a non-GAAP financial measure and is defined as other expense, excluding certain non-core items, as a percentage of net interest income on a tax equivalent basis plus other income, excluding net securities gains, calculated as follows:
| (dollars in thousands) | ||||||||||||||||||||
| For the quarter ended: | 9/30/17 | 6/30/17 | 3/31/17 | 12/31/16 | 9/30/16 | |||||||||||||||
| Other expense | $ | 3,813 | $ | 3,986 | $ | 3,778 | $ | 3,570 | $ | 3,759 | ||||||||||
| Less: non-core items(1) | 29 | 72 | 29 | 29 | — | |||||||||||||||
| Other expense, excluding non-core items | $ | 3,784 | $ | 3,914 | $ | 3,749 | $ | 3,541 | $ | 3,759 | ||||||||||
| Net interest income (tax equivalent basis) | $ | 6,729 | $ | 6,433 | $ | 6,043 | $ | 5,292 | $ | 5,083 | ||||||||||
| Other income, excluding net investment securities gains | 501 | 440 | 484 | 453 | 471 | |||||||||||||||
| Total | $ | 7,230 | $ | 6,873 | $ | 6,527 | $ | 5,745 | $ | 5,554 | ||||||||||
| Efficiency ratio | 52.3 | % | 57.0 | % | 57.4 | % | 61.6 | % | 67.7 | % | ||||||||||
| (1) | Included in non-core items are costs which include expenses related to the Company’s corporate restructuring initiatives, such as professional fees, litigation and settlement costs, severance costs, and external payroll development costs related to such restructuring initiatives. The Company believes these adjustments are necessary to provide the most accurate measure of core operating results as a means to evaluate comparative results. |
The Company’s efficiency ratio, calculated on a GAAP basis without excluding net investment securities gains and without deducting non-core items from other expense, follows:
| For the quarter ended: | 9/30/17 | 6/30/17 | 3/31/17 | 12/31/16 | 9/30/16 | |||||||||||||||
| Efficiency ratio on a GAAP basis | 52.7 | % | 55.3 | % | 57.8 | % | 62.7 | % | 66.7 | % | ||||||||||
Net interest margin, which is non-interest income as a percentage of average interest-earning assets, is presented on a fully tax equivalent (“TE”) basis as we believe this non-GAAP measure is the preferred industry measurement for this item. The TE basis adjusts GAAP interest income and yields for the tax benefit of income on certain tax-exempt investments using the federal statutory rate of 34% for each period presented. Below is a reconciliation of GAAP net interest income to the TE basis and the related GAAP basis and TE net interest margins for the periods presented.
| (dollars in thousands) | ||||||||||||||||||||
| For the quarter ended: | 9/30/17 | 6/30/17 | 3/31/17 | 12/31/16 | 9/30/16 | |||||||||||||||
| Net interest income (GAAP) | $ | 6,707 | $ | 6,399 | $ | 5,991 | $ | 5,239 | $ | 5,021 | ||||||||||
| Tax-equivalent adjustment(1) | 22 | 34 | 52 | 53 | 62 | |||||||||||||||
| TE net interest income | $ | 6,729 | $ | 6,433 | $ | 6,043 | $ | 5,292 | $ | 5,083 | ||||||||||
| Net interest income margin (GAAP) | 2.75 | % | 2.71 | % | 2.72 | % | 2.61 | % | 2.62 | % | ||||||||||
| Tax-equivalent effect | 0.00 | 0.01 | 0.03 | 0.03 | 0.03 | |||||||||||||||
| Net interest margin (TE) | 2.75 | % | 2.72 | % | 2.75 | % | 2.64 | % | 2.65 | % | ||||||||||
| (1) Reflects tax-equivalent adjustment for tax exempt loans and investments. |
-12-
The following table sets forth the Company’s consolidated average statements of condition for the periods presented.
| Condensed Consolidated Average Statements of Condition (unaudited) | ||||||||||||||||||||
| (in thousands) | ||||||||||||||||||||
| Restated | Restated | Restated | Restated | |||||||||||||||||
| For the quarter ended: | 9/30/17 | 6/30/17 | 3/31/17 | 12/31/16 | 9/30/16 | |||||||||||||||
| Investment securities | $ | 50,899 | $ | 82,832 | $ | 102,090 | $ | 104,645 | $ | 115,366 | ||||||||||
| Loans | 832,205 | 792,139 | 717,376 | 612,388 | 575,784 | |||||||||||||||
| Allowance for loan losses | (8,120 | ) | (7,456 | ) | (6,489 | ) | (5,650 | ) | (5,424 | ) | ||||||||||
| All other assets | 134,500 | 110,456 | 101,804 | 124,062 | 107,655 | |||||||||||||||
| Total assets | 1,009,485 | 977,971 | $ | 914,781 | $ | 835,445 | $ | 793,381 | ||||||||||||
| Non-interest bearing deposits | $ | 45,969 | $ | 45,173 | $ | 38,565 | $ | 33,330 | $ | 33,242 | ||||||||||
| Interest-bearing deposits | 705,841 | 682,606 | 634,214 | 581,838 | 543,985 | |||||||||||||||
| FHLB advances | 118,000 | 118,000 | 118,000 | 118,245 | 123,319 | |||||||||||||||
| Other short-term borrowings | 6,033 | 220 | 5,389 | — | — | |||||||||||||||
| Subordinated debt | 24,282 | 24,992 | 14,722 | — | — | |||||||||||||||
| Other liabilities | 7,749 | 7,324 | 5,778 | 5,503 | 4,243 | |||||||||||||||
| Shareholders’ equity | 101,612 | 99,656 | 98,113 | 96,529 | 89,592 | |||||||||||||||
| Total liabilities and shareholders’ equity | $ | 1,009,485 | $ | 977,971 | $ | 914,781 | $ | 835,445 | $ | 793,381 | ||||||||||
About Malvern Bancorp, Inc.
Malvern Bancorp, Inc. is the holding company for Malvern Federal Savings Bank. Malvern Federal Savings Bank is a federally-chartered, FDIC-insured savings bank that was originally organized in 1887 and now serves as one of the oldest banks headquartered on the Philadelphia Main Line. For more than a century, Malvern has been committed to helping people build prosperous communities as a trusted financial partner, forging lasting relationships through teamwork, respect and integrity.
The Bank conducts business from its headquarters in Paoli, Pennsylvania, a suburb of Philadelphia and through its nine other banking locations in Chester, Delaware and Bucks counties, Pennsylvania and Morristown, N.J., its New Jersey regional headquarters. The Bank also recently announced new representative offices in Palm Beach Florida and Montchanin, Delaware. Its primary market niche is providing personalized service to its client base.
The Bank, through its Private Banking division and strategic partnership with Bell Rock Capital in Rehoboth Beach, DE, provides personalized wealth management and advisory services to high net worth individuals and families. Bel Rock Capital’s services include banking, liquidity management, investment services, 401(K) accounts and planning, custody, tailored lending, wealth planning, trust and fiduciary services, family wealth advisory services and philanthropic advisory services. The Bank offers insurance services though Malvern Insurance Associates, LLC, which provides clients a rich array of financial services, including commercial and personal insurance and commercial and personal lending.
For further information regarding Malvern Bancorp, Inc., please visit our web site at http://ir.malvernfederal.com. For information regarding Malvern Federal Savings Bank, please visit our web site at http://www.malvernfederal.com.
-13-
Forward-Looking Statements
This press release contains certain forward looking statements. Forward-looking statements can be identified by the fact that they do not relate strictly to historical or current facts. They often include words like “believe,” “expect,” “anticipate,” “estimate” and “intend” or future or conditional verbs such as “will,” “would,” “should,” “could” or “may.” Certain factors that could cause actual results to differ materially from expected results include changes in the interest rate environment, changes in general economic conditions, legislative and regulatory changes that adversely affect the business of Malvern Bancorp, Inc., and changes in the securities markets. Except as required by law, the Company does not undertake any obligation to update any forward-looking statements to reflect changes in beliefs, expectations or events.
-14-
MALVERN BANCORP, INC AND SUBSIDIARIES
CONSOLIDATED STATEMENTS OF CONDITION
| Restated | ||||||||
| (in thousands, except for share and per share data) | September 30, 2017 | September 30, 2016 | ||||||
| (unaudited) | ||||||||
| ASSETS | ||||||||
| Cash and due from depository institutions | $ | 1,615 | $ | 1,297 | ||||
| Interest bearing deposits in depository institutions | 115,521 | 95,465 | ||||||
| Total cash and cash equivalents | 117,136 | 96,762 | ||||||
| Investment securities available for sale, at fair value | 14,587 | 66,387 | ||||||
| Investment securities held to maturity (fair value of $34,566 and $40,817) | 34,915 | 40,551 | ||||||
| Restricted stock, at cost | 5,559 | 5,424 | ||||||
| Loans receivable, net of allowance for loan losses | 834,331 | 574,160 | ||||||
| Accrued interest receivable | 3,139 | 2,558 | ||||||
| Property and equipment, net | 7,507 | 6,637 | ||||||
| Deferred income taxes, net | 6,671 | 8,827 | ||||||
| Bank-owned life insurance | 18,923 | 18,418 | ||||||
| Other assets | 3,244 | 1,548 | ||||||
| Total assets | $ | 1,046,012 | $ | 821,272 | ||||
| LIABILITIES | ||||||||
| Deposits: | ||||||||
| Non-interest bearing | $ | 42,121 | $ | 34,547 | ||||
| Interest-bearing | 748,275 | 567,499 | ||||||
| Total deposits | 790,396 | 602,046 | ||||||
| FHLB advances | 118,000 | 118,000 | ||||||
| Other short-term borrowings | 5,000 | — | ||||||
| Subordinated debt | 24,303 | — | ||||||
| Advances from borrowers for taxes and insurance | 1,553 | 1,659 | ||||||
| Accrued interest payable | 694 | 427 | ||||||
| Other liabilities | 3,546 | 2,983 | ||||||
| Total liabilities | 943,492 | 725,115 | ||||||
| SHAREHOLDERS’ EQUITY | ||||||||
| Preferred stock, $0.01 par value, 10,000,000 shares, authorized, none issued | — | — | ||||||
| Common stock, $0.01 par value, 50,000,000 shares authorized, issued and outstanding: 6,572,684 shares at September 30, 2017 and 6,560,403 shares at September 30, 2016 | 66 | 66 | ||||||
| Additional paid in capital | 60,736 | 60,461 | ||||||
| Retained earnings | 43,139 | 37,322 | ||||||
| Unearned Employee Stock Ownership Plan (ESOP) shares | (1,483 | ) | (1,629 | ) | ||||
| Accumulated other comprehensive income (loss) | 62 | (63 | ) | |||||
| Total shareholders’ equity | 102,520 | 96,157 | ||||||
| Total liabilities and shareholders’ equity | $ | 1,046,012 | $ | 821,272 | ||||
-15-
MALVERN BANCORP, INC AND SUBSIDIARIES
CONSOLIDATED STATEMENTS OF INCOME
| Three Months Ended September 30, | Twelve Months Ended September 30, | |||||||||||||||
(in thousands, except for share and per share data) | 2017 | Restated 2016 | 2017 | Restated 2016 | ||||||||||||
| (unaudited) | ||||||||||||||||
| Interest and Dividend Income | ||||||||||||||||
| Loans, including fees | $ | 8,915 | $ | 5,980 | $ | 30,841 | $ | 21,206 | ||||||||
| Investment securities, taxable | 197 | 511 | 1,561 | 2,824 | ||||||||||||
| Investment securities, tax-exempt | 70 | 174 | 492 | 751 | ||||||||||||
| Dividends, restricted stock | 65 | 68 | 257 | 250 | ||||||||||||
| Interest-bearing cash accounts | 282 | 84 | 631 | 213 | ||||||||||||
| Total Interest and Dividend Income | 9,529 | 6,817 | 33,782 | 25,244 | ||||||||||||
| Interest Expense | ||||||||||||||||
| Deposits | 1,843 | 1,232 | 6,236 | 4,537 | ||||||||||||
| Short-term borrowings | 22 | — | 34 | — | ||||||||||||
| Long-term borrowings | 561 | 564 | 2,176 | 2,195 | ||||||||||||
| Subordinated debt | 396 | — | 1,000 | — | ||||||||||||
| Total Interest Expense | 2,822 | 1,796 | 9,446 | 6,732 | ||||||||||||
| Net interest income | 6,707 | 5,021 | 24,336 | 18,512 | ||||||||||||
| Provision for Loan Losses | 489 | 100 | 2,791 | 947 | ||||||||||||
Net Interest Income after Provision for Loan Losses | 6,218 | 4,921 | 21,545 | 17,565 | ||||||||||||
| Other Income | ||||||||||||||||
| Service charges and other fees | 262 | 259 | 992 | 924 | ||||||||||||
| Rental income-other | 66 | 56 | 227 | 211 | ||||||||||||
| Net gains on sales of investments, net | 31 | 144 | 463 | 565 | ||||||||||||
| Net gains on sale of loans, net | 48 | 26 | 154 | 116 | ||||||||||||
| Earnings on bank-owned life insurance | 125 | 130 | 505 | 517 | ||||||||||||
| Total Other Income | 532 | 615 | 2,341 | 2,333 | ||||||||||||
| Other Expense | ||||||||||||||||
| Salaries and employee benefits | 1,725 | 1,669 | 7,114 | 6,290 | ||||||||||||
| Occupancy expense | 543 | 472 | 2,084 | 1,820 | ||||||||||||
| Federal deposit insurance premium | 71 | 107 | 244 | 579 | ||||||||||||
| Advertising | 25 | 50 | 216 | 131 | ||||||||||||
| Data processing | 285 | 283 | 1,195 | 1,128 | ||||||||||||
| Professional fees | 473 | 507 | 1,894 | 1,683 | ||||||||||||
| Other operating expenses | 691 | 671 | 2,400 | 2,291 | ||||||||||||
| Total Other Expense | 3,813 | 3,759 | 15,147 | 13,922 | ||||||||||||
| Income before income tax expense | 2,937 | 1,777 | 8,739 | 5,976 | ||||||||||||
| Income tax expense (benefit) | 982 | (6,174 | ) | 2,922 | (6,174 | ) | ||||||||||
| Net Income | $ | 1,955 | $ | 7,951 | $ | 5,817 | $ | 12,150 | ||||||||
| Earnings per common share | ||||||||||||||||
| Basic | $ | 0.30 | $ | 1.24 | $ | 0.90 | $ | 1.90 | ||||||||
| Diluted | $ | 0.30 | $ | 1.24 | $ | 0.90 | $ | 1.90 | ||||||||
Weighted Average Common Shares Outstanding | ||||||||||||||||
| Basic | 6,441,731 | 6,415,049 | 6,431,445 | 6,409,265 | ||||||||||||
| Diluted | 6,445,151 | 6,415,207 | 6,432,137 | 6,409,325 | ||||||||||||
-16-
|
MALVERN BANCORP, INC AND SUBSIDIARIES SELECTED QUARTERLY FINANCIAL AND STATISTICAL DATA |
| Three Months Ended | ||||||||||||
(in thousands, except for share and per share data) (annualized where applicable) | 9/30/2017 | Restated 6/30/2017 | Restated 03/31/2017 | |||||||||
| (unaudited) | ||||||||||||
| Statements of Operations Data | ||||||||||||
| Interest income | $ | 9,529 | $ | 8,973 | $ | 8,175 | ||||||
| Interest expense | 2,822 | 2,574 | 2,184 | |||||||||
| Net interest income | 6,707 | 6,399 | 5,991 | |||||||||
| Provision for loan losses | 489 | 645 | 997 | |||||||||
| Net interest income after provision for loan losses | 6,218 | 5,754 | 4,994 | |||||||||
| Other income | 532 | 814 | 542 | |||||||||
| Other expense | 3,813 | 3,986 | 3,778 | |||||||||
| Income before income tax expense | 2,937 | 2,582 | 1,758 | |||||||||
| Income tax expense | 982 | 863 | 588 | |||||||||
| Net income | $ | 1,955 | $ | 1,719 | $ | 1,170 | ||||||
| Earnings (per Common Share) | ||||||||||||
| Basic | $ | 0.30 | $ | 0.27 | $ | 0.18 | ||||||
| Diluted | $ | 0.30 | $ | 0.27 | $ | 0.18 | ||||||
| Statements of Condition Data (Period-End) | ||||||||||||
| Investment securities available for sale, at fair value | $ | 14,587 | $ | 16,811 | $ | 61,672 | ||||||
| Investment securities held to maturity (fair value of $34,566, $35,625 and $36,441) | 34,915 | 36,027 | 37,060 | |||||||||
| Loans, net of allowance for loan losses | 834,331 | 800,337 | 752,708 | |||||||||
| Total assets | 1,046,012 | 1,010,908 | 961,815 | |||||||||
| Deposits | 790,396 | 759,679 | 704,272 | |||||||||
| FHLB advances | 118,000 | 118,000 | 118,000 | |||||||||
| Short-term borrowings | 5,000 | — | 10,000 | |||||||||
| Subordinated debt | 24,303 | 24,263 | 25,000 | |||||||||
| Shareholders’ equity | 102,520 | 100,433 | 98,594 | |||||||||
| Common Shares Dividend Data | ||||||||||||
| Cash dividends | $ | — | $ | — | $ | — | ||||||
| Weighted Average Common Shares Outstanding | ||||||||||||
| Basic | 6,441,731 | 6,443,515 | 6,427,309 | |||||||||
| Diluted | 6,445,151 | 6,445,288 | 6,427,932 | |||||||||
| Operating Ratios | ||||||||||||
| Return on average assets | 0.77 | % | 0.70 | % | 0.51 | % | ||||||
| Return on average equity | 7.70 | % | 6.90 | % | 4.77 | % | ||||||
| Average equity / average assets | 10.07 | % | 10.19 | % | 10.75 | % | ||||||
| Book value per common share (period-end) | $ | 15.60 | $ | 15.28 | $ | 15.00 | ||||||
| Non-Financial Information (Period-End) | ||||||||||||
| Common shareholders of record | 427 | 428 | 437 | |||||||||
| Full-time equivalent staff | 81 | 81 | 81 | |||||||||
-17-