Attached files
| file | filename |
|---|---|
| 8-K - 8-K - Hudson Pacific Properties, Inc. | hpp-x8xkinvestormeetings.htm |

Investor Presentation September 30, 2017
This document is not an offer to sell or solicitation of an offer to buy any securities. Any offers to sell or solicitations to buy securities shall be made by means
of a prospectus approved for that purpose.

2
Forward-Looking Statements and Non-GAAP Financial Measures
% of ABR
21
% of ABR
6
% of ABR
FORWARD-LOOKING STATEMENTS
This presentation contains forward-looking statements within the meaning of Section 27A of the Securities Act of 1933, as amended, and Section 21E of the Securities
Exchange Act of 1934, as amended. Such forward-looking statements relate to, without limitation, our future economic performance, plans and objectives for future
operations, and projections of revenue, net operating income, funds from operations, discounts to net asset values and other selected financial information. Forward-
looking statements can be identified by the use of words such as "may," "will," "plan," “could,” "should," "expect,” "anticipate," “outlook,” "estimate," “projected,”
“target,” "continue" “intend,” “believe,” “seek,” or “assume,” and variations of such words and similar expressions are intended to identify such forward-looking
statements. Future events and actual results, financial and otherwise, may differ materially from the results discussed in the forward-looking statements. You should not
rely on forward-looking statements as predictions of future events. Forward-looking statements involve numerous risks and uncertainties that could significantly affect
anticipated results in the future and, accordingly, such results may differ materially from those expressed in any forward-looking statement made by us. These risks and
uncertainties include, but are not limited to: adverse economic and real estate developments in Northern and Southern California and the Pacific Northwest; decreased
rental rates or increased tenant incentives and vacancy rates; defaults on, early terminations of, or non-renewal of leases by tenants; increased interest rates and
operating costs; failure to generate sufficient cash flows to service our outstanding indebtedness; difficulties in identifying properties to acquire and completing
acquisitions; failure to successfully integrate pending and recent acquisitions; failure to successfully operate acquired properties and operations; failure to maintain our
status as a REIT under the Internal Revenue Code of 1986, as amended; possible adverse changes in laws and regulations; environmental uncertainties; risks related to
natural disasters; lack or insufficient amount of insurance; inability to successfully expand into new markets or submarkets; risks associated with property development;
conflicts of interest with our officers; changes in real estate and zoning laws and increases in real property tax rates; and the consequences of any possible future
terrorist attacks. You are cautioned that the information contained herein speaks only as of the date hereof and we assume no obligation to update any forward-looking
information, whether as a result of new information, future events or otherwise. The risks described above are not exhaustive, and additional factors could adversely
affect our business and financial performance, including those discussed under the caption “Risk Factors” in our Annual Report on Form 10-K for the year ended December
31, 2016 filed with the Securities and Exchange Commission on February 21, 2017. In this presentation, we rely on and refer to information and statistical data regarding
the industry and the sectors in which we operate. This information and statistical data is based on information obtained from various third-party sources, and, in some
cases, on our own internal estimates. We believe that these sources and estimates are reliable, but have not independently verified them and cannot guarantee their
accuracy or completeness.
USE OF NON-GAAP FINANCIAL MEASURES AND OTHER DEFINITIONS
This presentation contains certain non-GAAP financial measures within the meaning Regulation G and other terms that have particular definitions when used by us. The definitions of
these non-GAAP financial measures and other terms may differ from those used by other REITs and, accordingly, may not be comparable. The definitions of these terms, the reasons for
their use, and reconciliations to the most directly comparable GAAP measure are either included in the Appendix hereto or in our Supplemental Operating and Financial Data report for the
quarter ended September 30, 2017.

ABR: ANNUALIZED BASE RENT
Annualized cash rents before abatements under commenced leases, excludes tenant reimbursements
RENT SPREADS
Initial rents on new and renewal leases compared to expiring rents for same space
NOI: NET OPERATING INCOME
Rental income less rental expenses1
STABILIZED YIELD
Quotient of NOI and property investment once project has reached stabilization
FFO: FUNDS FROM OPERATIONS
Typical measurement used to assess REIT performance, similar to EPS with adjustments for depreciation and other items1
FFO MULTIPLE
Share price divided by FFO per share
TOTAL CAPITALIZATION
Sum of total debt, Series A preferred units, Series B preferred stock and aggregate market value of outstanding common equity1
GROSS REAL ESTATE ASSETS
Book value of real estate assets, excluding depreciation and amortization, plus deferred leasing costs and acquired lease intangibles, net
NET DEBT
Total debt excluding unamortized loan premiums and deferred financing costs, less cash and cash equivalents
SECURED DEBT
Debt secured by first-priority deed of trust liens on properties
STABILIZED PROPERTIES
Office properties that have reached 92% occupancy since the date acquired or place under (re)development, excludes (re)development, held-for-sale and land assets
LEASE-UP PROPERTIES
Office properties that have not reached stabilization, excludes (re)development, held-for-sale and land assets
IN-SERVICE PROPERTIES
Stabilized and lease-up office properties
3
Glossary of Terms
1) See Appendix (p.36) for expanded definitions.

We Specialize in Owning and Enhancing High-Quality Office
and Studio Properties in Select West Coast Markets
+ We focus on unlocking value through leasing, redevelopment of operating assets and
development of ancillary sites
+ We invest in high-barrier office markets poised for outsized growth
+ Our portfolio largely consists of blue-chip and growth tenants, many in technology,
media and entertainment
+ Our strong balance sheet provides exceptional flexibility and access to capital sources
+ We offer investors an attractive valuation with a significant opportunity for growth
4
3

5
18.2M
SQUARE FEET2
101%
5-YEAR TOTAL
SHAREHOLDER RETURN3
1) As of 9/30/17. 2) Square footage includes office, studio and land assets. Land square footage represents management’s estimate of
developable square feet, which may be subject to entitlement approvals not yet been obtained. 3) Data provided by FactSet and as of 9/28/17 and
based on closing price of $33.05. 4) Market cap based on closing price of $33.53 and includes common stock and operating partnership units. 5)
Represents Q3 ‘17 total revenue annualized. 6) Debt includes pro-rata share of indebtedness for joint venture assets. 7) Dividend yield calculated
as Q3 ‘17 dividend of $0.25 annualized divided by the 9/30/17 closing price of $33.53.
2010
INITIAL PUBLIC OFFERING
2006
FOUNDED IN
OFFICE PROPERTIES
53
STUDI0 PROPERTIES
3
INVESTMENT GRADE COMPANY
NYSE:HPP
$8.0B
TOTAL MARKET CAP4
$760M
ANNUALIZED REVENUE5
33.4%
DEBT6 / TOTAL MARKET CAP4
3.0%
DIVIDEND YIELD7
Hudson Pacific
at a Glance

Our Business Model
Pg. 7: Section 1
Our Portfolio
Pg. 19: Section 2
Our Opportunity
Pg. 28: Section 3
Contents

Section 1:
Our Business Model

8
Our Portfolio Spans the Most Dynamic West Coast Office Markets
8.6
MILLION S.F. % of ABR
52
SILICON VALLEY
4.6
MILLION S.F. % of ABR
19
L O S A N G E L E S
3
STUDIOS
7
H O L L Y W O O D
1.5
MILLION S.F. % of ABR
6
S E A T T L E
2.3
MILLION S.F.
16
SAN FRANCISCO
WASHINGTON
OREGON
CALIFORNIA
% of ABR
% of ABR
1) As of 9/30/17. See Glossary of Terms (p.3) for definitions. Square footage includes office (both in-service and development and redevelopment
properties), studio and land assets.
9
Capital Discipline Facilitates Our Strategic Growth
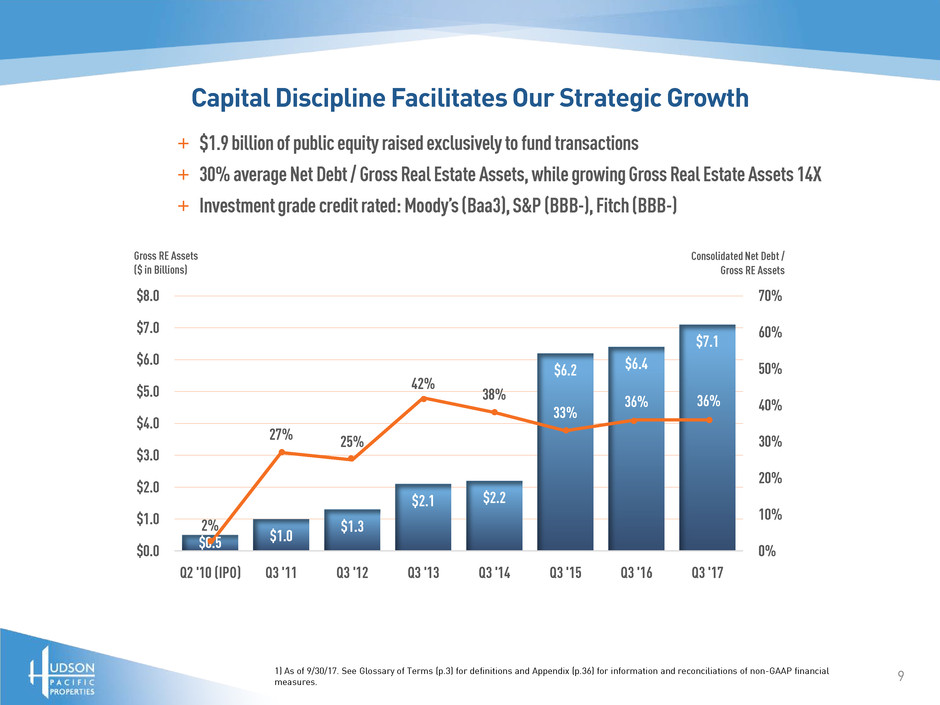
+ $1.9 billion of public equity raised exclusively to fund transactions
+ 30% average Net Debt / Gross Real Estate Assets, while growing Gross Real Estate Assets 14X
+ Investment grade credit rated: Moody’s (Baa3), S&P (BBB-), Fitch (BBB-)
1) As of 9/30/17. See Glossary of Terms (p.3) for definitions and Appendix (p.36) for information and reconciliations of non-GAAP financial
measures.
$0.5 $1.0
$1.3
$2.1 $2.2
$6.2 $6.4
$7.1
2%
27% 25%
42%
38%
33%
36% 36%
0%
10%
20%
30%
40%
50%
60%
70%
$0.0
$1.0
$2.0
$3.0
$4.0
$5.0
$6.0
$7.0
$8.0
Q2 '10 (IPO) Q3 '11 Q3 '12 Q3 '13 Q3 '14 Q3 '15 Q3 '16 Q3 '17
Gross RE Assets
($ in Billions)
Consolidated Net Debt /
Gross RE Assets

10
Our Balance Sheet Enables Excellent Capital Access and Liquidity
67%
33%
Total Equity Market Cap Total Debt
Low Leverage—33% Debt / Equity Market Cap2
77%
23%
Fixed Rate Debt Floating Rate Debt
Minimal Exposure to Interest Rate Volatility34
$400
$88
$200
Undrawn Cash Revolver Cash Sunset Gower/Bronson Loan
Nearly $700 Million of Untapped Liquidity
78%
22%
Unsecured Debt Secured Debt
Few Real Estate Assets Collateralize Debt3
1) As of 9/30/17. See Glossary of Terms (p.3) for definitions and Appendix (p.36) for information and reconciliations of non-GAAP financial
measures. 2) Market cap based on closing price of $33.53 and includes common stock and operating partnership units. 3) Debt includes pro-rata
share of indebtedness for joint venture assets. 4) Certain indebtedness is subject to interest rate contracts to swap floating rate interest to fixed
rate interest.
+

11
Our Leasing Expertise Drives Office Occupancy and Rents
+ 9.2 million square feet leased at 51% GAAP and 38% Cash Rent Spreads since 2010 IPO
+ Stabilized and In-Service Office Portfolios 95.9% and 91.5% leased, respectively
LOS ANGELES
SAN FRANCISCO
SILICON VALLEY
SEATTLE
% LEASED AT CHANGE (BPS) ANNUALIZED BASE RENT AT CHANGE (%)
Acquisition
Date (Various)
54% 95% 4,070
81% 98% 1,729
86% 87% 135
88% 97% 873
$35 $47 34%
$23 $44 92%
$40 $46 15%
$24 $28 18%
9/30/17 Acquisition
Date (Various)
9/30/17
1) As of 9/30/17 for in-service office properties only. Leased percentage and ABR at acquisition calculated as the weighted average as of the last
day of the first quarter following acquisition. See Glossary of Terms (p.3) for definitions.

$0.0
$5.0
$10.0
$15.0
$20.0
$25.0
12
Studio Same-Store Cash NOI Growth 2010-2016
38%
Our Operating Expertise Improves Studio Occupancy and Cash Flow
2010 2016
1) As of 9/30/17. Based on Same-Store Studios only—Sunset Gower and Sunset Bronson. See Glossary of Terms (p.3) for definitions and Appendix
(p.36) for information and reconciliations of non-GAAP financial measures. 2) Year-to-date growth compares Studio Same-Store Cash NOI for the
nine months ended 9/30/17 to Studio Same-Store Cash NOI for the nine months ended 9/30/16.
$14.3M
$19.8M
+ Full year Studio Same-Store Cash NOI increased 38% from 2010 to 2016—12% growth year-to-date2
+ 32% of stage/production office square footage now under long-term lease

$0.0
$1.0
$2.0
$3.0
$4.0
$5.0
$6.0
$7.0
$8.0
$9.0
Q4 '15 Q1 '16 Q2 '16 Q3 '16 Q4 '16 Q1 '17 Q2 '17 Q3 '17
Est. Project Costs Total Market Cap
Project Costs as % of
Total Market Cap
0.0
0.2
0.4
0.6
0.8
1.0
1.2
1.4
1.6
Q4 '15 Q1 '16 Q2 '16 Q3 '16 Q4 '16 Q1 '17 Q2 '17 Q3 '17
S.F. Pre-Leased Est. S.F. Under Construction
26%
60% 60% 60% 67% 72%
38% 23%
Pre-Leasing S.F. as % of
Construction S.F.
13
We Take a Conservative Approach to (Re)Development
7% 7% 7% 7% 5% 5% 4% 7%
1) As of 9/30/17. Estimated project costs based on management estimates as of the last day of the respective period and exclude capitalized
interest, personnel costs and operating expenses. Total market cap based on the closing stock price as of the last day of the respective period.
+ Focus on creating value through leasing, less capital intensive repositionings and redevelopment
+ Project costs consistently less than 10% of total market cap
+ Pipeline typically 50% pre-leased before new construction starts

$300+ Million Invested
8.2% Weighted Avg. Stabilized Yield
$198 Million of Estimated Value Creation
14
We Invest Strategically to Transform Underperforming Assets
Vacant warehouse redeveloped as Class A office;
100% leased to Github
Vacant warehouses redeveloped as Class A LEED
Gold office; 100% leased to Riot Games
Vacant warehouse redeveloped as Class A office;
100% leased to Deluxe Media
BRANNON
S A N F R A N C I S C O275 ELEMENT W E S T L . ALA 3401EXPOSITIONS A N T A M O N I C A
1) As of 9/30/17. See Glossary of Terms (p.3) for definitions. 2) Calculations are a weighted average for 275 Brannon, Element LA, 3401 Exposition
and 12655 Jefferson (sold). Value creation calculated by applying a 5% cap rate to stabilized cash NOI less total project cost as of stabilization.
Project costs exclude capitalized interest costs, capitalized personnel costs and capitalized operating expenses capitalized. Actual value creation
may differ materially from estimates. See Appendix (p.36) for additional calculation details.

15
We Develop Best-In-Class Office Environments for Leading Companies
Focus on Ancillary Sites Adjacent to Operating Assets Allows
for Lower Basis and Outsized Returns
9.7% Stabilized Yield
$137 Million of Estimated Value Creation
9.2% Stabilized Yield
$44 Million of Estimated Value Creation
115,000 S.F. of Class A office replaced dated, low-rise buildings
at Sunset Gower; 100% leased to Technicolor as North American HQ
327,000 S.F. pf Class A, LEED Gold office replaced former
parking lot at Sunset Bronson; 100% leased to Netflix as L.A. HQ
1) As of 9/30/17. See Glossary of Terms (p.3) for definitions. 2) Value creation calculated by applying a 5% cap rate to stabilized cash NOI less total
project cost as of stabilization (Technicolor includes land). Project costs exclude capitalized interest costs, capitalized personnel costs and
capitalized operating expenses. Actual value creation may differ materially from estimates. See Appendix (p.36) for additional calculation details.

16
We Are Committed to Sustainable Building Design and Operations
45 Energy Star Labeled Buildings
90 Average Energy Star Rating (Top 10% for Energy Efficiency)
15% Energy Star Improvement from 2000 to 2016
100% of Portfolio Benchmarked in Energy Star’s Portfolio Manager
21% of Office S.F. LEED Certified (Gold or Silver)
100% of New Developments Obtained/Pursing LEED Certification
$-
$0.20
$0.40
$0.60
$0.80
$1.00
$1.20
$1.40
$1.60
$1.80
$2.00
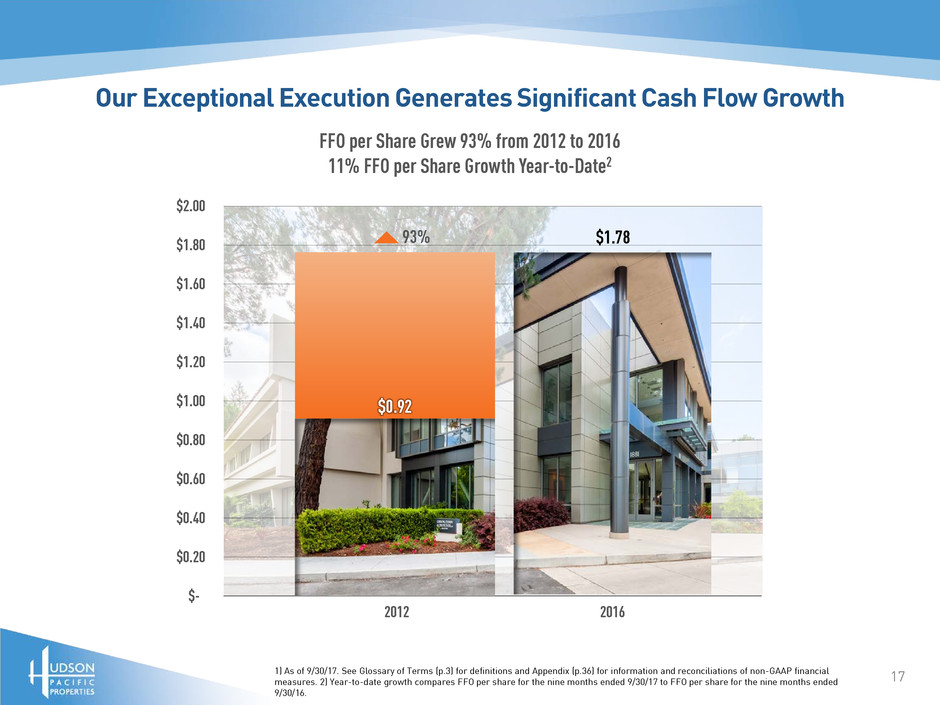
Our Exceptional Execution Generates Significant Cash Flow Growth
FFO per Share Grew 93% from 2012 to 2016
11% FFO per Share Growth Year-to-Date2
17
93%
1) As of 9/30/17. See Glossary of Terms (p.3) for definitions and Appendix (p.36) for information and reconciliations of non-GAAP financial
measures. 2) Year-to-date growth compares FFO per share for the nine months ended 9/30/17 to FFO per share for the nine months ended
9/30/16.
2012 2016
$1.78
$0.92

-10.0%
0.0%
10.0%
20.0%
30.0%
40.0%
50.0%
60.0%
70.0%
80.0%
90.0%
100.0%
110.0%
120.0%
18
Our 5-Year Total Shareholder Return Outperforms Most Office REITs
101% Total Return from September 2012 to September 2017
S&P 500
74%
RMZ USA
29%
HPP
101%
1) As of 9/30/17. Data provided by FactSet and as of 9/28/17 and based on closing price of $33.05.

Section 2:
Our Portfolio
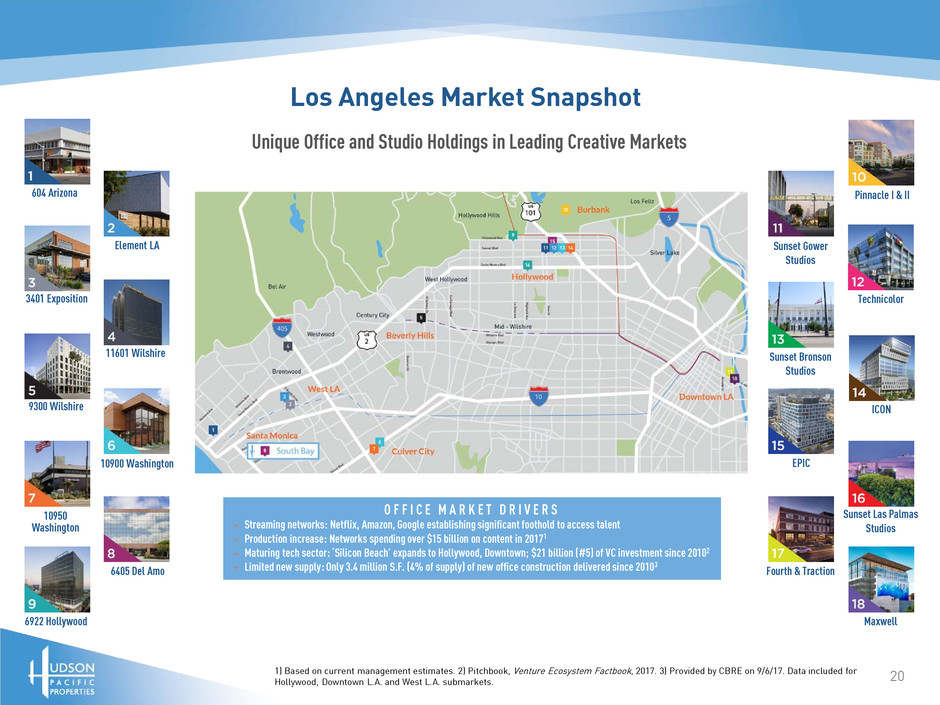
Los Angeles Market Snapshot
7-8
604 Arizona
Element LA
3401 Exposition
11601 Wilshire
9300 Wilshire
10900 Washington
10950
Washington
6405 Del Amo
6922 Hollywood
Pinnacle I & II
Sunset Gower
Studios
Technicolor
Sunset Bronson
Studios
ICON
EPIC
Sunset Las Palmas
Studios
Fourth & Traction
Maxwell
Unique Office and Studio Holdings in Leading Creative Markets
20
O F F I C E M A R K E T D R I V E R S
+ Streaming networks: Netflix, Amazon, Google establishing significant foothold to access talent
+ Production increase: Networks spending over $15 billion on content in 20171
+ Maturing tech sector: ‘Silicon Beach’ expands to Hollywood, Downtown; $21 billion (#5) of VC investment since 20102
+ Limited new supply: Only 3.4 million S.F. (4% of supply) of new office construction delivered since 20103
1) Based on current management estimates. 2) Pitchbook, Venture Ecosystem Factbook, 2017. 3) Provided by CBRE on 9/6/17. Data included for
Hollywood, Downtown L.A. and West L.A. submarkets.
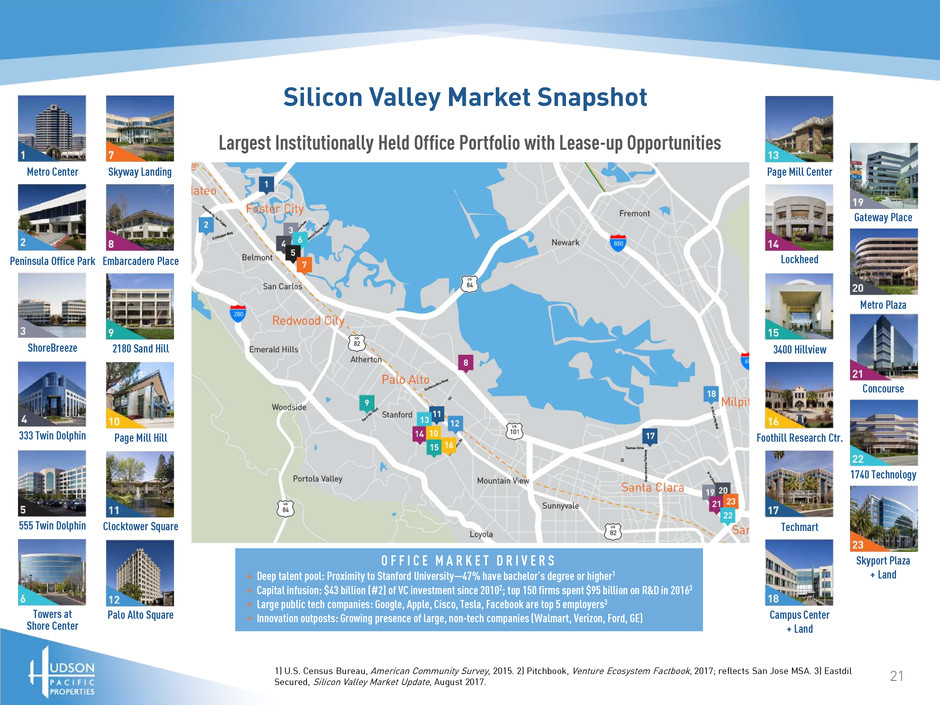
Silicon Valley Market Snapshot
Largest Institutionally Held Office Portfolio with Lease-up Opportunities
21
O F F I C E M A R K E T D R I V E R S
+ Deep talent pool: Proximity to Stanford University—47% have bachelor’s degree or higher1
+ Capital infusion: $43 billion (#2) of VC investment since 20102; top 150 firms spent $95 billion on R&D in 20163
+ Large public tech companies: Google, Apple, Cisco, Tesla, Facebook are top 5 employers3
+ Innovation outposts: Growing presence of large, non-tech companies (Walmart, Verizon, Ford, GE)
Metro Center
Peninsula Office Park
ShoreBreeze
333 Twin Dolphin
555 Twin Dolphin
Towers at
Shore Center
Skyway Landing
Embarcadero Place
2180 Sand Hill
Page Mill Hill
Clocktower Square
Palo Alto Square
Page Mill Center
Lockheed
3400 Hillview
Foothill Research Ctr.
Techmart
Campus Center
+ Land
Gateway Place
Metro Plaza
Concourse
1740 Technology
Skyport Plaza
+ Land
1) U.S. Census Bureau, American Community Survey, 2015. 2) Pitchbook, Venture Ecosystem Factbook, 2017; reflects San Jose MSA. 3) Eastdil
Secured, Silicon Valley Market Update, August 2017.

San Francisco Market Snapshot
7-8
Fully Leased, Iconic Office Assets in Prime Locations
22
O F F I C E M A R K E T D R I V E R S
+ Deep talent pool: 54% bachelor’s degree or higher1
+ Capital infusion: $101 billion (#1) of VC investment since 20102;
+ Urban sensibility: Tech companies expanding into the city to
augment Silicon Valley HQ (Google, Yahoo, Cisco)
+ Limited new supply: Prop M caps annual office construction
project completions at 950,000 S.F.
1) U.S. Census Bureau, American Community Survey, 2015. 2) Pitchbook, Venture Ecosystem Factbook, 2017; reflects San Francisco MSA.

Seattle Market Snapshot
Growing Office Foothold in Transforming Urban Markets
23
O F F I C E M A R K E T D R I V E R S
+ Deep talent pool: 48% bachelor’s degree or higher; 1,000 people moving to
Seattle each week1
+ Capital infusion: $8+ billion (#7) of VC investment since 2010; U. of
Washington spends $1+ billion (#4) on R&D annually2
+ Blue-chip growth companies: Global HQ for Starbucks, Microsoft, Amazon
(footprint increased nearly 7X since 2007)3
+ Company in-migration: Facebook, Google, HBO, Staples opened hubs to
access talent
1) U.S. Census Bureau, American Community Survey, 2015, U.S. Department of Education; Colliers International, Seattle Office Update, 9/30/17. 2)
Pitchbook, Venture Ecosystem Factbook, 2017; BestColleges.com, 2016. 3) Colliers International, Seattle Office Update, 9/30/17.

24
Tenancy Comprised of Leading Blue-Chip and Growth Companies
% A B R
3.1%3.8% 3.4% 3.1% 3.1% 2.9% 2.6% 2.5% 2.3% 2.0% 1.8% 1.8% 1.6% 1.5% 1.5% 1.4%
35.3% TOTAL
NASDAQ : $677B
(Tencent : HKG)
NASDAQ : $78B
NASDAQ : $170B
NASDAQ : $84B
NASDAQ : $67B
$68B Post-$
Valuation
NASDAQ : $11B
(Time Warner : TWX) (Access Industries)
$75B + Valuation
(Dell)
(Oracle : ORCL)
U.S. Government
$22B Endowment
15 Largest Tenants
1) As of 9/30/17, including public company market cap data. Uber, Stanford University and NFL valuations based on current management
estimates. See Glossary of Terms (p.3) for definitions.

2% 4%
7%
8%
9%
12%
18%
40%
Many Are in Technology, Media and Entertainment
INSURANCE: 2%
RETAIL: 4%
FINANCIAL SERVICES: 7%
BUSINESS SERVICES: 8%
LEGAL: 9%
OTHER: 12%
MEDIA & ENTERTAINMENT: 18%
TECHNOLOGY: 40%
Portfolio Industry Composition (% of ABR)
251) As of 9/30/17. See Glossary of Terms (p.3) for definitions.

Tech Composition by Public / Private & Age
(as % of Tech ABR)
63%11%
26%
Private < 10 Yrs. (Exc. Uber) Private > 10 Yrs. (+Uber) Public
43%
26%
31%
Public and Mature Companies Dominate Our Tech Tenancy
26
Tech Composition by % Contribution to Tech ABR
(as % of Tech ABR)
<1% >1% and < 5% > 5%
+ 11% of tech ABR attributable to private companies in business less than 10 years (excludes Uber)
+ Only 6 tenants contribute more than 5% of tech ABR: Google, Cisco, Uber, Qualcomm, Square, Salesforce
+ More than half of tech ABR comprised of tenants contributing less than 5%
1) As of 9/30/17. See Glossary of Terms (p.3) for definitions.

27
Our Facilities and Expertise Draw Media & Entertainment Users
10 Stages 308,000 S.F.
Clients: Netflix HQ,
KTLA, CBS, Showtime
12 Stages 572,000 S.F.
Clients: Technicolor HQ,
ABC, Netflix, Amazon, HBO
13 Stages 377,000 S.F.
Clients: MTV, Disney,
Comedy Central, Netflix
1) As of 9/30/17. Clients representative of both historical and current tenancy.
+ Own/operate Sunset Studios—largest collection of independent studios in Hollywood and U.S.
+ 1.2 million S.F. of existing/under construction Class A office space adjacent to stages
+ Deep relationships with traditional and streaming networks (e.g., Netflix, ABC/Disney, CBS, Amazon, HBO)

Section 3:
Our Opportunity
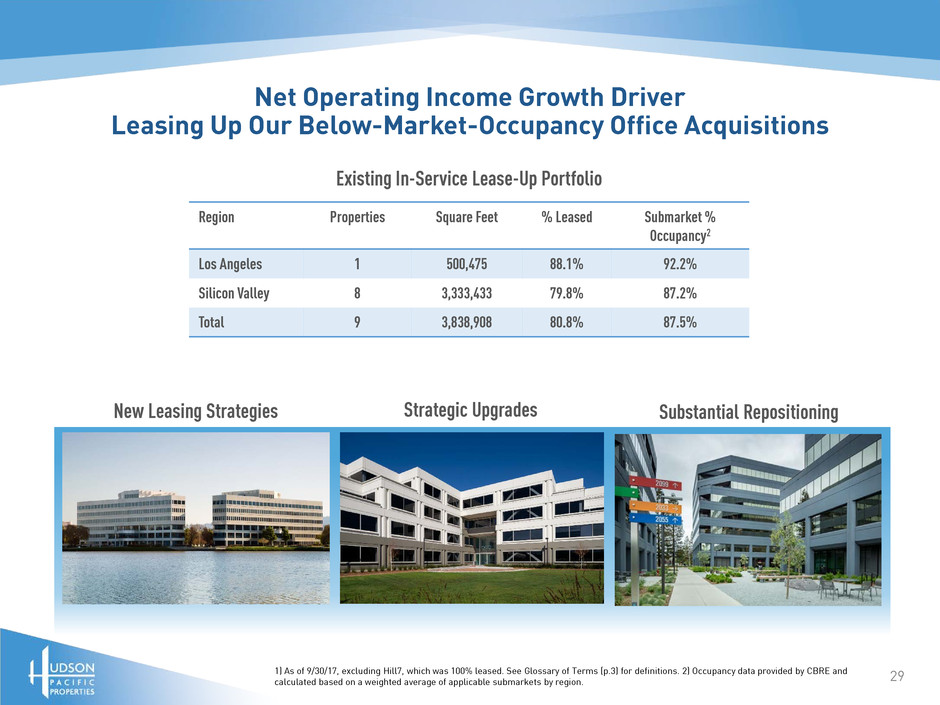
Net Operating Income Growth Driver
Leasing Up Our Below-Market-Occupancy Office Acquisitions
29
Region Properties Square Feet % Leased Submarket %
Occupancy2
Los Angeles 1 500,475 88.1% 92.2%
Silicon Valley 8 3,333,433 79.8% 87.2%
Total 9 3,838,908 80.8% 87.5%
Existing In-Service Lease-Up Portfolio
New Leasing Strategies Strategic Upgrades Substantial Repositioning
1) As of 9/30/17, excluding Hill7, which was 100% leased. See Glossary of Terms (p.3) for definitions. 2) Occupancy data provided by CBRE and
calculated based on a weighted average of applicable submarkets by region.

$42.47
$29.42
$43.63
$47.75
$46.97
$35.95
$51.12
$55.29
$-
$10.00
$20.00
$30.00
$40.00
$50.00
$60.00
Los Angeles Seattle San Francisco Silicon Valley
Expiring Rent Market Rent
199,000 Exp. S.F. 341,000 Exp. S.F. 2,030,000 Exp. S.F.554,000 Exp. S.F.
Mark-To-Market Rent Growth: 2018 & 2019 Expirations
Net Operating Income Growth Driver
Re-Leasing Our Office Space at Substantially Higher Rents
30
15% Mark-To-Market on 2018 and 2019 Expirations
16% Mark-To-Market on In-Place Leases
11%
22%
17%
16%
1) As of 9/30/17. Market rent statistics provided by CoStar and REIS. See Glossary of Terms (p.3) for definitions.

Net Operating Income Growth Driver
Building Our Pipeline of (Re)Development Projects
31
Under Construction Projects To Produce Estimated Weighted Avg. 6.9% Stabilized Yield3
Under Construction
815,000 S.F. in Los Angeles and Seattle
Future Projects
3 million S.F.—57% in Los Angeles, 43% in Silicon Valley
1.2 million of studio-adjacent opportunities2
450 Alaskan
(Pioneer Square)
CUE
(Hollywood)
Fourth & Traction
(L.A. Arts District)
Maxwell
(L.A. Arts District)
1) As of 9/30/17. See Glossary of Terms (p.3) for definitions. 2) Land square footage represents management’s estimate of developable square
feet, which may be subject to entitlement approvals not yet been obtained. 3) Calculated as the weighted average of the stabilized yield for each
under construction project. Initial stabilized yield calculated as the quotient of estimated NOI and total project cost upon stabilization.
EPIC
(Hollywood)

Net Operating Income Growth Driver
Enhancing Facilities and Operations at Sunset Las Palmas Studios
32
+ Investing $3 million to improve facilities and optimize stage and support space mix
+ Increasing stage occupancy from 78% to 95% by closing multi-year, multi-stage production deals
+ Increasing below-market office rates by 10% coincident with improved client experience

Our Valuation is Favorable Relative to Other West Coast Office REITs
33
HPP Pure Peers
Current FFO Multiple 17.1x 20.8x
Forward FFO Multiple 16.2x 19.3x
HPP Pure Peers
NAV Premium (Discount) (16.7%) (7.3%)
Analyst Coverage Reinforces HPP’s
Unrealized Value
HPP Trades at a Significant Discount
1) As of 9/30/17, including closing stock price of $33.53. Pure peers include Kilroy Realty Corporation and Douglas Emmett. Current and forward
FFO multiples based on 2017 and 2018 FFO consensus estimates, respectively. NAV consensus premium (discount) represents the delta between
closing stock price and consensus NAV. See Glossary of Terms (p.3) for definitions.

34
HPP Offers a Compelling Investment Opportunity
Exceptional track record of unlocking value through leasing, redevelopment
and development of ancillary sites
Blue-chip tenants in high-growth West Coast markets and industries, like
technology, media and entertainment
Strong balance sheet with excellent capital access
Attractive valuation with a significant opportunity for growth

Our Executive Team Has Deep Real Estate and Public Company Experience
Alexander Vouvalides
35
Dale Shimoda
Victor J. Coleman
Chairman & CEO
Founded Hudson Capital in
2006 and served as
Managing Partner.
Formerly Co-Founder,
President, COO and Director
at Arden Realty. Sold to GE.
Mark T. Lammas
COO & CFO
Joined in 2009 as CFO.
Formerly EVP, SVP and
General Counsel at Maguire
Properties, Inc.
Christopher Barton
EVP, Development & Capital
Investments
Joined in 2006. Prior roles as
SVP and VP, Construction &
Development.
Formerly with Arden Realty and
Beers-Skanska Construction.
CIO
Joined in 2009, Prior roles as
SVP, Acquisitions and VP, Asset
Management.
Formerly with Credit Suisse.
Arthur Suazo
EVP, Leasing
Joined in 2010, Prior roles as
SVP, VP and Director of
Leasing.
Formerly with Cushman &
Wakefield and Savills
Studley.
Josh Hatfield
EVP, Operations
Joined in 2014. Prior roles as
SVP, Operations and SVP,
Northern California.
Formerly held senior
positions at GE Capital Real
Estate.
Gary Hansel
SVP, Southern California
Joined in 2014.
Formerly SVP, Operations at
GE/Arden Realty.
Drew Gordon
SVP, Northern California
Joined in 2011 as SVP,
Northern California. Prior
role as SVP, Pacific
Northwest.
Formerly EVP and CIO at
Venture Corporation.
Andrew Wattula
SVP, Pacific Northwest
Joined in 2017.
Formerly Managing Director
with Beacon Partners.
Bill Humphrey
SVP, Sunset Studios
Joined in 2014.
Formerly SVP at Point 360 and
Principal and Founder at Water
Clock Media.
Kay Tidwell
EVP, General Counsel
Joined in 2010.
Formerly an attorney with
Lathan & Watkins, LLP.
EVP, Finance
Joined in 2010.
Formerly with Arden Realty, the
Yarmouth Group and Ernst &
Young.

Appendix:
Definitions, Calculations &
Reconciliations

37
Expanded Definitions
NOI: NET OPERATING INCOME
NOI is not a measure of operating results or cash flows from operating activities as measured by GAAP and should not be considered an alternative to income from continuing operations,
as an indication of our performance, or as an alternative to cash flows as a measure of liquidity, or our ability to make distributions. All companies may not calculate NOI in the same
manner. We consider NOI to be a useful performance measure to investors and management, because when compared across periods, NOI reflects the revenues and expenses directly
associated with owning and operating our properties and the impact to operations from trends in occupancy rates, rental rates, and operating costs, providing a perspective not
immediately apparent from income from continuing operations. We define NOI as operating revenues (including rental revenues, other property-related revenue, tenant recoveries and
other operating revenues), less property-level operating expenses (which includes external management fees, if any, and property-level general and administrative expenses). NOI
excludes corporate general and administrative expenses, depreciation and amortization, impairments, gain/loss on sale of real estate, interest expense, acquisition-related expenses
and other non-operating items. NOI on a cash basis is NOI on a GAAP basis, adjusted to exclude the effect of straight-line rent and adjustments required by GAAP. We believe that NOI on
a cash basis is helpful to investors as an additional measure of operating performance because it eliminates straight-line rent and other non-cash adjustments to revenue and expenses.
FFO: FUNDS FROM OPERATIONS
Total Funds From Operations (“FFO”): Funds From Operations before non-controlling interest (“FFO”) is a non-GAAP financial measure we believe is a useful supplemental measure of
our performance. We calculate FFO in accordance with the White Paper on FFO approved by the Board of Governors of the National Association of Real Estate Investment Trusts. The
White Paper defines FFO as net income or loss calculated in accordance with generally accepted accounting principles in the United States (“GAAP”), excluding extraordinary items, as
defined by GAAP, gains and losses from sales of depreciable real estate and impairment write-downs associated with depreciable real estate, plus real estate-related depreciation and
amortization (excluding amortization of deferred financing costs and depreciation of non-real estate assets) and after adjustment for unconsolidated partnerships and joint ventures. The
calculation of FFO includes the amortization of deferred revenue related to tenant-funded tenant improvements and excludes the depreciation of the related tenant improvement assets.
We believe that FFO is a useful supplemental measure of our operating performance. The exclusion from FFO of gains and losses from the sale of operating real estate assets allows
investors and analysts to readily identify the operating results of the assets that form the core of our activity and assists in comparing those operating results between periods. Also,
because FFO is generally recognized as the industry standard for reporting the operations of REITs, it facilitates comparisons of operating performance to other REITs. However, other
REITs may use different methodologies to calculate FFO, and accordingly, our FFO may not be comparable to all other REITs. Implicit in historical cost accounting for real estate assets in
accordance with GAAP is the assumption that the value of real estate assets diminishes predictably over time. Since real estate values have historically risen or fallen with market
conditions, many industry investors and analysts have considered presentations of operating results for real estate companies using historical cost accounting alone to be insufficient.
Because FFO excludes depreciation and amortization of real estate assets, we believe that FFO along with the required GAAP presentations provides a more complete measurement of our
performance relative to our competitors and a more appropriate basis on which to make decisions involving operating, financing and investing activities than the required GAAP
presentations alone would provide. We use FFO per share to calculate annual cost bonuses for certain employees. However, FFO should not be viewed as an alternative measure of our
operating performance because it does not reflect either depreciation and amortization costs or the level of capital expenditures and leasing costs necessary to maintain the operating
performance of our properties, which are significant economic costs and could materially impact our results from operations.
TOTAL CAPITALIZATION
Total capitalization represents the sum of total debt, Series A preferred units, Series B preferred stock and the aggregate market value of outstanding common equity as of the
applicable date assuming that each partnership unit owned by a third party has a market value equal to one share of common stock (including unvested restricted shares).
38
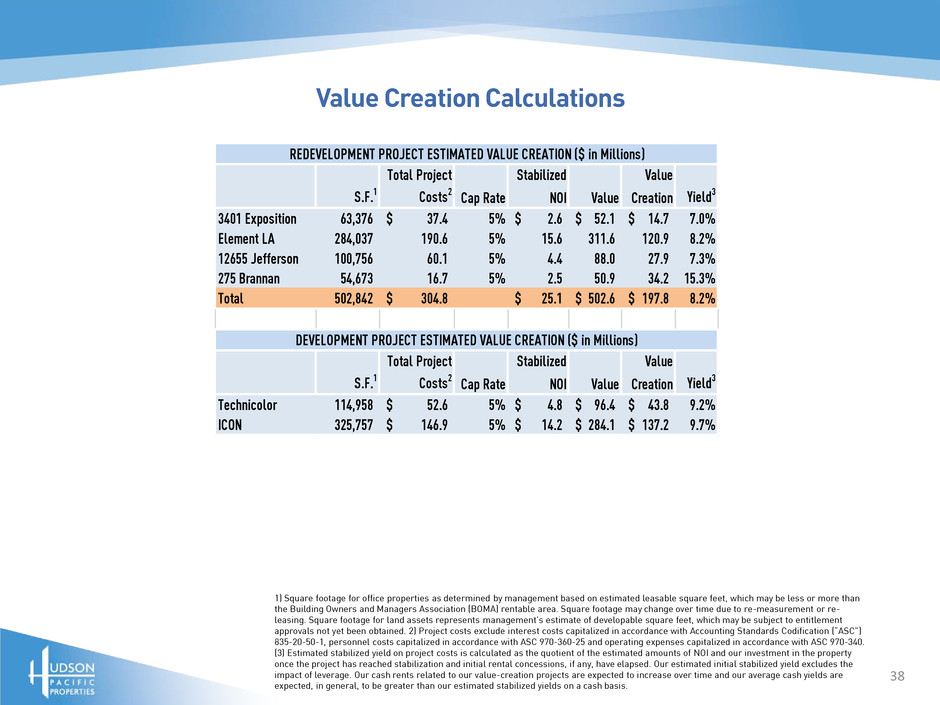
Value Creation Calculations
1) Square footage for office properties as determined by management based on estimated leasable square feet, which may be less or more than
the Building Owners and Managers Association (BOMA) rentable area. Square footage may change over time due to re-measurement or re-
leasing. Square footage for land assets represents management’s estimate of developable square feet, which may be subject to entitlement
approvals not yet been obtained. 2) Project costs exclude interest costs capitalized in accordance with Accounting Standards Codification (“ASC”)
835-20-50-1, personnel costs capitalized in accordance with ASC 970-360-25 and operating expenses capitalized in accordance with ASC 970-340.
(3) Estimated stabilized yield on project costs is calculated as the quotient of the estimated amounts of NOI and our investment in the property
once the project has reached stabilization and initial rental concessions, if any, have elapsed. Our estimated initial stabilized yield excludes the
impact of leverage. Our cash rents related to our value-creation projects are expected to increase over time and our average cash yields are
expected, in general, to be greater than our estimated stabilized yields on a cash basis.
Total Project Stabilized Value
S.F.1 Costs2 Cap Rate NOI Value Creation Yield3
3401 Exposition 63,376 37.4$ 5% 2.6$ 52.1$ 14.7$ 7.0%
Element LA 284,037 190.6 5% 15.6 311.6 120.9 8.2%
12655 Jefferson 100,756 60.1 5% 4.4 88.0 27.9 7.3%
275 Brannan 54,673 16.7 5% 2.5 50.9 34.2 15.3%
Total 502,842 304.8$ 25.1$ 502.6$ 197.8$ 8.2%
Total Project Stabilized Value
S.F.1 Costs2 Cap Rate NOI Value Creation Yield3
Technicolor 114,958 52.6$ 5% 4.8$ 96.4$ 43.8$ 9.2%
ICON 325,757 146.9$ 5% 14.2$ 284.1$ 137.2$ 9.7%
DEVELOPMENT PROJECT ESTIMATED VALUE CREATION ($ in Millions)
REDEVELOPMENT PROJECT ESTIMATED VALUE CREATION ($ in Millions)
39
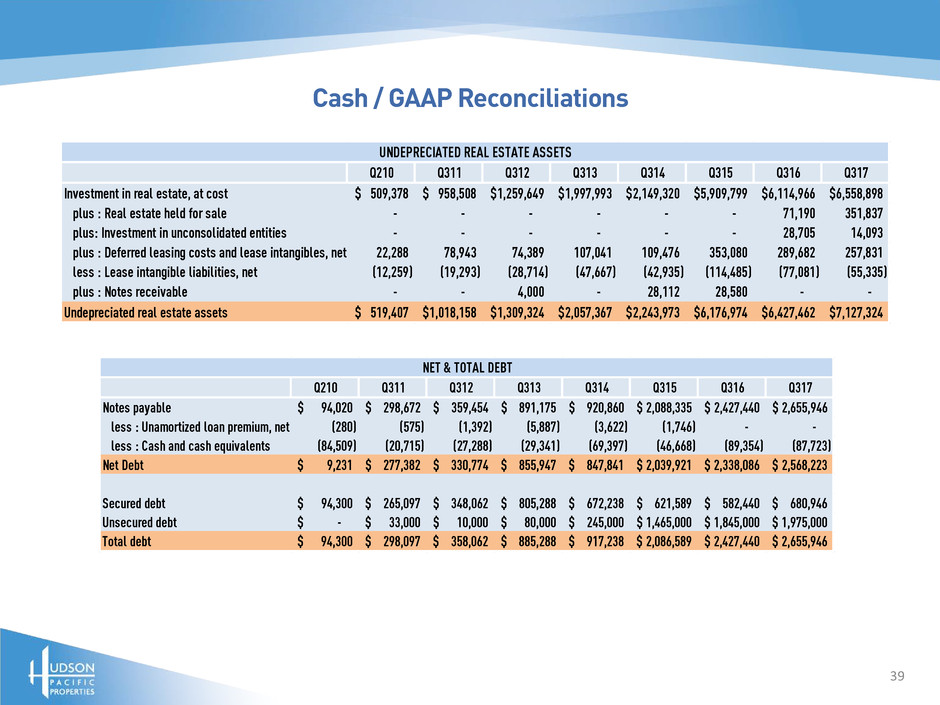
Q210 Q311 Q312 Q313 Q314 Q315 Q316 Q317
Notes payable 94,020$ 298,672$ 359,454$ 891,175$ 920,860$ 2,088,335$ 2,427,440$ 2,655,946$
less : Unamortized loan premium, net (280) (575) (1,392) (5,887) (3,622) (1,746) - -
less : Cash and cash equivalents (84,509) (20,715) (27,288) (29,341) (69,397) (46,668) (89,354) (87,723)
Net Debt 9,231$ 277,382$ 330,774$ 855,947$ 847,841$ 2,039,921$ 2,338,086$ 2,568,223$
Secured debt 94,300$ 265,097$ 348,062$ 805,288$ 672,238$ 621,589$ 582,440$ 680,946$
Unsecured debt -$ 33,000$ 10,000$ 80,000$ 245,000$ 1,465,000$ 1,845,000$ 1,975,000$
Total debt 94,300$ 298,097$ 358,062$ 885,288$ 917,238$ 2,086,589$ 2,427,440$ 2,655,946$
NET & TOTAL DEBT
Q210 Q311 Q312 Q313 Q314 Q315 Q316 Q317
Investment in real estate, at cost 509,378$ 958,508$ 1,259,649$ 1,997,993$ 2,149,320$ 5,909,799$ 6,114,966$ 6,558,898$
plus : Real estate held for sale - - - - - - 71,190 351,837
plus: Investment in unconsolidated entities - - - - - - 28,705 14,093
plus : Deferred leasing costs and lease intangibles, net 22,288 78,943 74,389 107,041 109,476 353,080 289,682 257,831
less : Lease intangible liabilities, net (12,259) (19,293) (28,714) (47,667) (42,935) (114,485) (77,081) (55,335)
plus : Notes receivable - - 4,000 - 28,112 28,580 - -
Undepreciated real estate assets 519,407$ 1,018,158$ 1,309,324$ 2,057,367$ 2,243,973$ 6,176,974$ 6,427,462$ 7,127,324$
UNDEPRECIATED REAL ESTATE ASSETS
Cash / GAAP Reconciliations
40
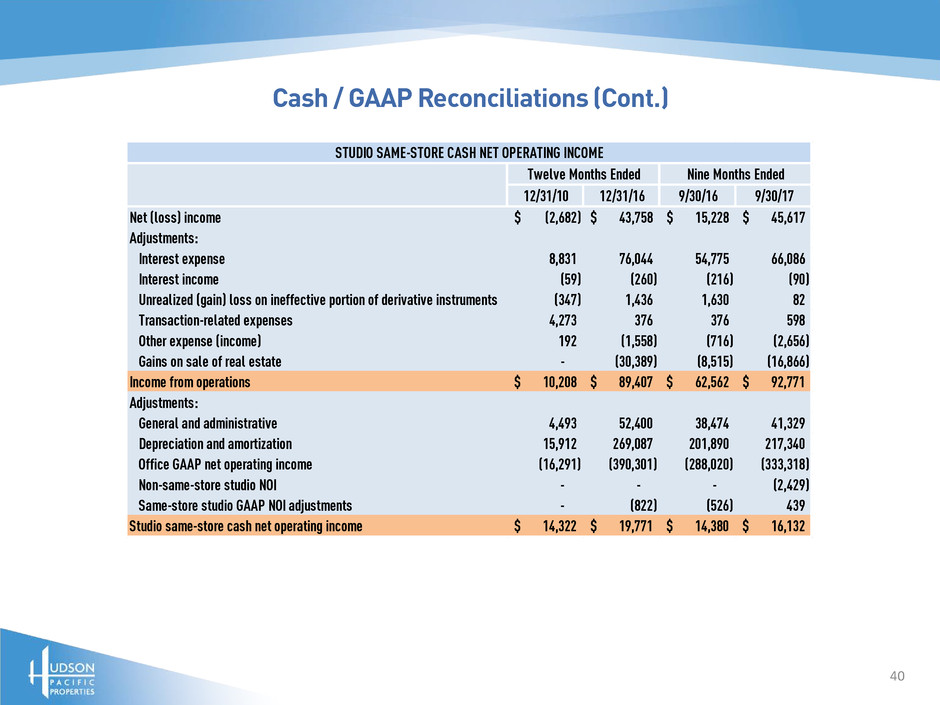
12/31/10 12/31/16 9/30/16 9/30/17
Net (loss) income (2,682)$ 43,758$ 15,228$ 45,617$
Adjustments:
Interest expense 8,831 76,044 54,775 66,086
Interest income (59) (260) (216) (90)
Unrealized (gain) loss on ineffective portion of derivative instruments (347) 1,436 1,630 82
Transaction-related expenses 4,273 376 376 598
Other expense (income) 192 (1,558) (716) (2,656)
Gains on sale of real estate - (30,389) (8,515) (16,866)
Income from operations 10,208$ 89,407$ 62,562$ 92,771$
Adjustments:
General and administrative 4,493 52,400 38,474 41,329
Depreciation and amortization 15,912 269,087 201,890 217,340
Office GAAP net operating income (16,291) (390,301) (288,020) (333,318)
Non-same-store studio NOI - - - (2,429)
Same-store studio GAAP NOI adjustments - (822) (526) 439
Studio same-store cash net operating income 14,322$ 19,771$ 14,380$ 16,132$
STUDIO SAME-STORE CASH NET OPERATING INCOME
Twelve Months Ended Nine Months Ended
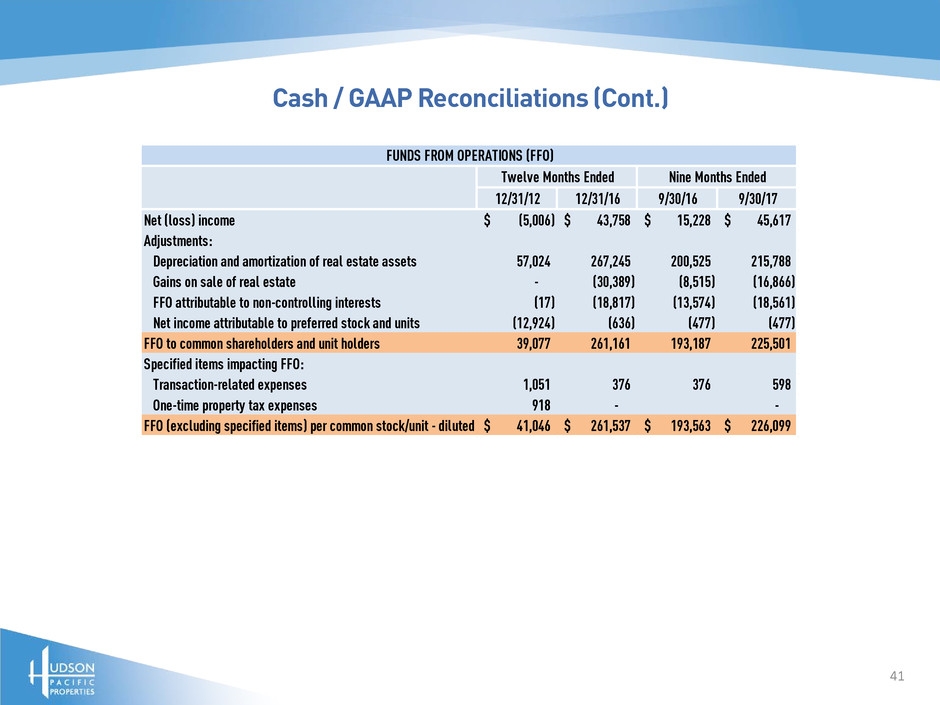
Cash / GAAP Reconciliations (Cont.)
41
12/31/12 12/31/16 9/30/16 9/30/17
Net (loss) income (5,006)$ 43,758$ 15,228$ 45,617$
Adjustments:
Depreciation and amortization of real estate assets 57,024 267,245 200,525 215,788
Gains on sale of real estate - (30,389) (8,515) (16,866)
FFO attributable to non-controlling interests (17) (18,817) (13,574) (18,561)
Net income attributable to preferred stock and units (12,924) (636) (477) (477)
FFO to common shareholders and unit holders 39,077 261,161 193,187 225,501
Specified items impacting FFO:
Transaction-related expenses 1,051 376 376 598
One-time property tax expenses 918 - -
FFO (excluding specified items) per common stock/unit - diluted 41,046$ 261,537$ 193,563$ 226,099$
Twelve Months Ended Nine Months Ended
FUNDS FROM OPERATIONS (FFO)
Cash / GAAP Reconciliations (Cont.)

42
Contact:
Laura Campbell
VP, Head of Investor Relations
(310) 622-1702
lcampbell@hudsonppi.com
