Attached files
| file | filename |
|---|---|
| EX-32 - EXHIBIT 32 CERT OF CEO AND CFO - TFS Financial CORP | tfslfy17sepex32.htm |
| EX-31.2 - EXHIBIT 31.2 CERT OF CFO - TFS Financial CORP | tfslfy17sepex312.htm |
| EX-31.1 - EXHIBIT 31.1 CERT OF CEO - TFS Financial CORP | tfslfy17sepex311.htm |
| EX-23.1 - EXHIBIT 23.1 CONSENT OF IND REG PUBLIC ACCTG FIRM - TFS Financial CORP | tfslfy17sepex231.htm |
UNITED STATES
SECURITIES AND EXCHANGE COMMISSION
WASHINGTON, D.C. 20549
FORM 10-K |
ý | ANNUAL REPORT PURSUANT TO SECTION 13 OR 15(d) OF THE SECURITIES EXCHANGE ACT OF 1934 |
For the fiscal year ended September 30, 2017
or
¨ | TRANSITION REPORT PURSUANT TO SECTION 13 OR 15(d) OF THE SECURITIES EXCHANGE ACT OF 1934 |
For transition period from to
Commission File Number 001-33390
___________________________________________
TFS FINANCIAL CORPORATION
(Exact Name of Registrant as Specified in its Charter)
___________________________________________
United States of America | 52-2054948 | |
(State or Other Jurisdiction of Incorporation or Organization) | (I.R.S. Employer Identification No.) | |
7007 Broadway Avenue | ||
Cleveland, Ohio | 44105 | |
(Address of Principal Executive Offices) | (Zip Code) | |
(216) 441-6000
(Registrant’s telephone number, including area code)
Securities registered pursuant to Section 12(b) of the Act:
Common Stock, par value $0.01 per share
(Title of class)
The NASDAQ Stock Market, LLC
(Name of exchange on which registered)
Securities registered pursuant to Section 12(g) of the Act: None
___________________________________________
Indicate by check mark if the registrant is a well-known seasoned issuer, as defined in Rule 405 of the Securities Act. Yes x No o
Indicate by check mark if the registrant is not required to file reports pursuant to Section 13 or Section 15(d) of the Act. Yes o No x
Indicate by check mark whether the Registrant (1) has filed all reports required to be filed by Section 13 or 15(d) of the Securities Exchange Act of 1934 during the preceding 12 months (or for such shorter period that the Registrant was required to file such reports), and (2) has been subject to such filing requirements for the past 90 days. Yes x No o
Indicate by check mark whether the registrant has submitted electronically and posted on its corporate Web site, if any, every Interactive Data File required to be submitted and posted pursuant to Rule 405 of Regulation S-T during the preceding 12 months (or for such shorter period that the registrant was required to submit and post such files). Yes x No o
Indicate by check mark if disclosure of delinquent filers pursuant to Item 405 of Regulation S-K (§229.405 of this chapter) is not contained herein, and will not be contained, to the best of registrant’s knowledge, in definitive proxy or information statements incorporated by reference in Part III of this Form 10-K or any amendment to this Form 10-K. x
Indicate by check mark whether the Registrant is a large accelerated filer, an accelerated filer, a non-accelerated filer, a smaller reporting company, or an emerging growth company. See the definitions of “large accelerated filer", "accelerated filer,” "smaller reporting company," and "emerging growth company" Rule 12b-2 of the Exchange Act:
Large accelerated filer x | Accelerated filer o | Non-accelerated filer o (do not check if a smaller reporting company) | Smaller reporting company o | |||
Emerging growth company o | ||||||
If an emerging company, indicate by check mark if the registrant has elected not to use the extended transition period for complying with any new or revised financial accounting standards provided pursuant to Section 13(a) of the Exchange Act. o
Indicate by check mark whether the Registrant is a shell company (as defined in Rule 12b-2 of the Exchange Act.) Yes o No x
The aggregate market value of the voting and non-voting common equity held by non-affiliates of the Registrant, computed by reference to the last sale price on March 31, 2017, as reported by the NASDAQ Global Select Market, was approximately $909.1 million.
At November 20, 2017, there were 281,071,072 shares of the Registrant’s common stock, par value $0.01 per share, outstanding, of which 227,119,132 shares, or 80.80% of the Registrant’s common stock, were held by Third Federal Savings and Loan Association of Cleveland, MHC, the Registrant’s mutual holding company.
DOCUMENTS INCORPORATED BY REFERENCE
Portions of the registrant’s Proxy Statement for the 2018 Annual Meeting of Shareholders are incorporated by reference in Part III hereof to the extent indicated therein.
TFS Financial Corporation
INDEX
Part I | |||
Item 1. | |||
Item 1A. | |||
Item 1B. | |||
Item 2. | |||
Item 3. | |||
Item 4. | |||
Part II | |||
Item 5. | |||
Item 6. | |||
Item 7. | |||
Item 7A. | |||
Item 8. | |||
Item 9. | |||
Item 9A. | |||
Item 9B. | |||
Part III | |||
Item 10. | |||
Item 11. | |||
Item 12. | |||
Item 13. | |||
Item 14. | |||
Part IV | |||
Item 15. | |||
Item 16. | |||
2
GLOSSARY OF TERMS
TFS Financial Corporation provides the following list of acronyms and other terms as a tool for the reader. The acronyms and other terms identified below are used throughout the document.
AOCI: Accumulated Other Comprehensive Income | FRB-Cleveland: Federal Reserve Bank of Cleveland |
ARM: Adjustable Rate Mortgage | FRS: Board of Governors of the Federal Reserve System |
ASC: Accounting Standards Codification | GAAP: Generally Accepted Accounting Principles |
ASU: Accounting Standards Update | Ginnie Mae: Government National Mortgage Association |
Association: Third Federal Savings and Loan | GVA: General Valuation Allowances |
Association of Cleveland | HARP: Home Affordable Refinance Program |
BOLI: Bank Owned Life Insurance | HPI: Home Price Index |
CDs: Certificates of Deposit | IRR: Interest Rate Risk |
CFPB: Consumer Financial Protection Bureau | IRS: Internal Revenue Service |
CLTV: Combined Loan-to-Value | IVA: Individual Valuation Allowance |
Company: TFS Financial Corporation and its | LIHTC: Low Income Housing Tax Credit |
subsidiaries | LIP: Loans-in-Process |
DFA: Dodd-Frank Wall Street Reform and Consumer | LTV: Loan-to-Value |
Protection Act of 2010 | MGIC: Mortgage Guaranty Insurance Corporation |
EaR: Earnings at Risk | OCC: Office of the Comptroller of the Currency |
EPS: Earnings per Share | OCI: Other Comprehensive Income |
ESOP: Third Federal Employee (Associate) Stock | OTS: Office of Thrift Supervision |
Ownership Plan | PMI: Private Mortgage Insurance |
EVE: Economic Value of Equity | PMIC: PMI Mortgage Insurance Co. |
FASB: Financial Accounting Standards Board | QTL: Qualified Thrift Lender |
FICO: Financing Corporation | REMICs: Real Estate Mortgage Investment Conduits |
FDIC: Federal Deposit Insurance Corporation | SEC: United States Securities and Exchange |
FHFA: Federal Housing Finance Agency | Commission |
FHLB: Federal Home Loan Bank | TDR: Troubled Debt Restructuring |
Fannie Mae: Federal National Mortgage Association | Third Federal Savings, MHC: Third Federal Savings |
Freddie Mac: Federal Home Loan Mortgage Corporation | and Loan Association of Cleveland, MHC |
3
PART I
Item 1. | Business |
Forward Looking Statements
This report contains forward-looking statements, which can be identified by the use of such words as estimate, project, believe, intend, anticipate, plan, seek, expect and similar expressions. These forward-looking statements include, among other things:
• | statements of our goals, intentions and expectations; |
• | statements regarding our business plans and prospects and growth and operating strategies; |
• | statements concerning trends in our provision for loan losses and charge-offs; |
• | statements regarding the trends in factors affecting our financial condition and results of operations, including asset quality of our loan and investment portfolios; and |
• | estimates of our risks and future costs and benefits. |
These forward-looking statements are subject to significant risks, assumptions and uncertainties, including, among other things, the following important factors that could affect the actual outcome of future events:
• | significantly increased competition among depository and other financial institutions; |
• | inflation and changes in the interest rate environment that reduce our interest margins or reduce the fair value of financial instruments; |
• | general economic conditions, either globally, nationally or in our market areas, including employment prospects, real estate values and conditions that are worse than expected; |
• | decreased demand for our products and services and lower revenue and earnings because of a recession or other events; |
• | adverse changes and volatility in the securities markets, credit markets or real estate markets; |
• | legislative or regulatory changes that adversely affect our business, including changes in regulatory costs and capital requirements and changes related to our ability to pay dividends and the ability of Third Federal Savings, MHC to waive dividends; |
• | our ability to enter new markets successfully and take advantage of growth opportunities, and the possible short-term dilutive effect of potential acquisitions or de novo branches, if any; |
• | changes in consumer spending, borrowing and savings habits; |
• | changes in accounting policies and practices, as may be adopted by the bank regulatory agencies, the Financial Accounting Standards Board or the Public Company Accounting Oversight Board; |
• | future adverse developments concerning Fannie Mae or Freddie Mac; |
• | changes in monetary and fiscal policy of the U.S. Government, including policies of the U.S. Treasury and the FRS and changes in the level of government support of housing finance; |
• | changes in policy and/or assessment rates of taxing authorities that adversely affect us; |
• | changes in our organization, or compensation and benefit plans and changes in expense trends (including, but not limited to trends affecting non-performing assets, charge-offs and provisions for loan losses); |
• | the continuing governmental efforts to restructure the U.S. financial and regulatory system; |
• | the inability of third-party providers to perform their obligations to us; |
• | a slowing or failure of the moderate economic recovery; |
• | the adoption of implementing regulations by a number of different regulatory bodies under the DFA, and uncertainty in the exact nature, extent and timing of such regulations and the impact they will have on us; |
• | the strength or weakness of the real estate markets and of the consumer and commercial credit sectors and its impact on the credit quality of our loans and other assets, and |
• | the ability of the U.S. Government to manage federal debt limits. |
Because of these and other uncertainties, our actual future results may be materially different from the results indicated by any forward-looking statements. Any forward-looking statement made by us in this report speaks only as of the date on which it is made. We undertake no obligation to publicly update any forward-looking statements, whether as a result of new information, future developments or otherwise, except as may be required by law. Please see Item 1A. Risk Factors for a discussion of certain risks related to our business.
4
TFS FINANCIAL CORPORATION
TFS Financial Corporation (“we,” “us,” or “our”) was organized in 1997 as the mid-tier stock holding company for the Association. We completed our initial public stock offering on April 20, 2007 and issued 100,199,618 shares of common stock, or 30.16% of our post-offering outstanding common stock, to subscribers in the offering. Additionally, at the time of the public offering, 5,000,000 shares of our common stock, or 1.50% of our outstanding shares, were issued to the newly formed charitable foundation, Third Federal Foundation. Third Federal Savings, MHC, our mutual holding company parent, holds the remainder of our outstanding common stock (227,119,132 shares). Net proceeds from our initial public stock offering were approximately $886 million and reflected the costs we incurred in completing the offering as well as a $106.5 million loan to the ESOP related to its acquisition of shares in the initial public stock offering.
Our ownership of the Association remains our primary business activity.
We also operate Third Capital, Inc. as a wholly-owned subsidiary. See Third Capital, Inc. below.
As the holding company of the Association, we are authorized to pursue other business activities permitted by applicable laws and regulations for savings and loan holding companies, which include making equity investments and the acquisition of banking and financial services companies.
Our cash flow depends primarily on earnings from the investment of the portion of the net offering proceeds we retained, and any dividends we receive from the Association and Third Capital, Inc. All of our officers are also officers of the Association. In addition, we use the services of the support staff of the Association from time to time. We may hire additional employees, as needed, to the extent we expand our business in the future.
THIRD CAPITAL, INC.
Third Capital, Inc. is a Delaware corporation that was organized in 1998 as our wholly-owned subsidiary. At September 30, 2017, Third Capital, Inc. had consolidated assets of $81.5 million, and for the fiscal year ended September 30, 2017, Third Capital, Inc. had consolidated net income of $1.0 million. Third Capital, Inc. has no separate operations other than as the holding company for its operating subsidiaries, and as a minority investor or partner in other entities. The following is a description of the entities in which Third Capital, Inc. is the owner, an investor or a partner.
Hazelmere Investment Group I, Ltd. This Ohio limited liability company engages in net lease transactions of commercial buildings in targeted markets. Third Capital, Inc. is a partner of this entity, receives a priority return on amounts contributed to acquire investment properties and has a 70% ownership interest in remaining earnings. Hazelmere Investment Group I, Ltd.recorded net income of $0.1 million during the fiscal year ended September 30, 2017.
Third Cap Associates, Inc. This Ohio corporation owns 49% and 60% of two title agencies that provide escrow and settlement services in the State of Ohio and Florida, primarily to customers of the Association. For the fiscal year ended September 30, 2017, Third Cap Associates, Inc. recorded net income of $0.7 million.
THIRD FEDERAL SAVINGS AND LOAN ASSOCIATION OF CLEVELAND
General
The Association is a federally chartered savings and loan association headquartered in Cleveland, Ohio, that was organized in 1938. In May 1997, the Association reorganized into its current two-tier mutual holding company structure. The Association’s principal business consists of originating and servicing residential real estate mortgage loans and attracting retail savings deposits.
The Association’s business strategy is to originate mortgage loans with interest rates that are competitive with those of similar products offered by other financial institutions in its markets. Similarly, the Association offers high-yield checking accounts and high-yield savings accounts and certificate of deposit accounts, each bearing interest rates that are competitive with similar products offered by other financial institutions in its markets. The Association expects to continue to pursue this business philosophy. While this strategy does not enable the Association to earn the highest rates of interest on loans that it offers or to pay the lowest rates on its deposit accounts, the Association believes that this strategy is the primary reason for its successful growth in the past and will continue to be a successful strategy in the future.
The Association attracts retail deposits from the general public in the areas surrounding its main office and its branch offices. It also utilizes its internet website, direct mail solicitation and its customer service call center to generate loan applications and attract retail deposits. Since September 2013, brokered CDs and more extensive use of longer-term advances from the FHLB of Cincinnati as well as shorter-term advances from the FHLB of Cincinnati, hedged to longer effective
5
durations by interest rate exchange contracts, have also been used as cost effective funding alternatives. In addition to residential real estate mortgage loans, the Association originates residential construction loans to individuals for the construction of their personal residences by a qualified builder. The Association also offers home equity loans and lines of credit subject to certain property and credit performance conditions. The Association retains in its portfolio a large portion of the loans that it originates. Since 2013, loans that the Association sells consist primarily of long-term, fixed-rate residential real estate mortgage loans. The Association retains the servicing rights on all loans that it sells. The Association’s revenues are derived primarily from interest on loans and, to a lesser extent, interest on interest-earning deposits in other financial institutions, deposits maintained at the FRS, federal funds sold, and investment securities, including mortgage-backed securities and dividends from FHLB of Cincinnati stock. The Association also generates revenues from fees and service charges. The Association’s primary sources of funds are deposits, borrowings, principal and interest payments on loans and securities and proceeds from loan sales.
The Association’s website address is www.thirdfederal.com. Filings of the Company made with the SEC are available, without charge, on the Association’s website. Information on that website is not and should not be considered a part of this document.
Market Area
The Association conducts its operations from its main office in Cleveland, Ohio, and from 38 additional, full-service branches and eight loan production offices located throughout the states of Ohio and Florida. In Ohio, the Association maintains 21 full-service offices located in the northeast Ohio counties of Cuyahoga, Lake, Lorain, Medina and Summit, four loan production offices located in the central Ohio counties of Franklin and Delaware (Columbus, Ohio) and four loan production offices located in the southern Ohio counties of Butler and Hamilton (Cincinnati, Ohio). In Florida, the Association maintains 17 full-service branches located in the counties of Pasco, Pinellas, Hillsborough, Sarasota, Lee, Collier, Palm Beach and Broward.
The Association also provides savings products in all 50 states and first mortgage refinance loans and home equity lines of credit in 21 states and the District of Columbia. First mortgage loans and bridge loans to purchase homes are provided in 13 states while other equity loan products are provided in eight states. These products are provided through its branch network for customers in its core markets of Ohio, Florida, Kentucky and selected counties in Indiana as well as its customer service call center and its internet site for all customers not served by its branch network.
Competition
The Association faces intense competition in its market areas both in making loans and attracting deposits. Its market areas have a high concentration of financial institutions, including large money center and regional banks, community banks and credit unions, and it faces additional competition for deposits from money market funds, brokerage firms, mutual funds and insurance companies. Some of its competitors offer products and services that the Association currently does not offer, such as commercial business loans, trust services and private banking.
The majority of the Association’s deposits are held in its offices located in Cuyahoga County, Ohio. As of June 30, 2017 (the latest date for which information is publicly available), the Association had $4.6 billion of deposits in Cuyahoga County, and ranked fifth among all financial institutions with offices in the county in terms of deposits, with a market share of 8.85%. As of that date, the Association had $6.0 billion of deposits in the State of Ohio, and ranked ninth among all financial institutions in the state in terms of deposits, with a market share of 1.77%. As of June 30, 2017, the Association had $2.3 billion of deposits in the State of Florida, and ranked 33rd among all financial institutions in terms of deposits, with a market share of 0.41%. This market share data excludes deposits held by credit unions, whose deposits are not insured by the FDIC.
The DFA, which was signed into law in July 2010, required that the FDIC amend its regulations on assessing insured institutions in order to fund the DIF. The resulting change effectively eliminated the funding cost advantage that borrowed funds generally had when compared to the funding cost associated with deposits. As a result, many financial institutions, including institutions that compete in our markets, have targeted retail deposit gathering as a more attractive funding source than borrowings, and have become more active and more competitive in their deposit product pricing. The combination of reduced demand for borrowed funds, more competition with respect to rates paid to depositors, and low savings rates that lead to reduced appeal for investors that have traditionally allocated a portion of their portfolios to insured savings accounts, has created an increasingly difficult marketplace for attracting deposits, which could adversely affect future operating results.
From October 2016 through September 30, 2017, per data furnished by MarketTrac®, the Association had the largest market share of conventional purchase mortgage loans originated in Cuyahoga County, Ohio. For the same period, it also had the largest market share of conventional purchase mortgage loans originated in the seven northeast Ohio counties which comprise the Cleveland and Akron metropolitan statistical areas. In addition, based on the same statistics, the Association has
6
consistently been one of the ten largest lenders in both Franklin County (Columbus, Ohio) and Hamilton County (Cincinnati, Ohio) since it entered those markets in 1999.
The Association’s primary strategy for increasing and retaining its customer base is to offer competitive deposit and loan rates and other product features, delivered with exceptional customer service, in each of the markets it serves.
We rely on the reputation that has been built during the Association’s almost 80-year history of serving its customers and the communities in which it operates, the Association’s high capital levels, and the Association's extensive liquidity alternatives which, in combination, serve to maintain and nurture customer and marketplace confidence. The Company’s high capital ratio continues to reflect the beneficial impact of our April 2007 initial public offering, which raised net proceeds of $886 million. At September 30, 2017, our ratio of shareholders’ equity to total assets was 12.3%. Our liquidity alternatives include management and monitoring of the level of liquid assets held in our portfolio as well as the maintenance of alternative wholesale funding sources. For the year ended September 30, 2017, our liquidity ratio averaged 5.65% (which we compute as the sum of cash and cash equivalents plus unpledged investment securities for which ready markets exist, divided by total assets) and, through the Association, we had the ability to immediately borrow an additional $41.0 million from the FHLB of Cincinnati under existing credit arrangements along with $72.3 million from the Federal Reserve Bank of Cleveland. From the perspective of collateral value securing FHLB of Cincinnati advances, our capacity limit for additional borrowings beyond the immediately available limit at September 30, 2017 was $4.87 billion, subject to satisfaction of the FHLB of Cincinnati's common stock ownership requirement. To satisfy the common stock ownership requirement we would have to increase our ownership of FHLB of Cincinnati common stock by an additional $97.4 million. See “Item 7. Management’s Discussion and Analysis of Financial Condition and Results of Operation—Liquidity and Capital Resources.”
We continue to utilize a multi-faceted approach to support our efforts to instill customer and marketplace confidence. First, we provide thorough and timely information to all of our associates so as to prepare them for their day-to-day interactions with customers and other individuals who are not part of the Company. We believe that it is important that our customers and others sense the comfort level and confidence of our associates throughout their dealings. Second, we encourage our management team to maintain a presence and to be available in our branches and other areas of customer contact, so as to provide more opportunities for informal contact and interaction with our customers and community members. Third, our CEO remains accessible to both local and national media, as a spokesman for our institution as well as an observer and interpreter of financial marketplace situations and events. Fourth, we periodically include advertisements in local newspapers that display our strong capital levels and history of service. We also continue to emphasize our traditional tagline—“STRONG * STABLE * SAFE”—in our advertisements and branch displays. Finally, for customers who adhere to the old adage of trust but verify, we refer them to the safety/security rankings of a nationally recognized, independent rating organization that specializes in the evaluation of financial institutions, which has awarded the Association its highest rating for more than one hundred consecutive quarters.
Lending Activities
The Association’s principal lending activity is the origination of fixed-rate and adjustable-rate, first mortgage loans to purchase or refinance residential real estate in its core markets in Ohio, Florida and Kentucky. Adjustable-rate and 10-year fixed rate first mortgage loans to refinance real estate are offered in a total of 22 states including its core markets and the District of Columbia. Also, the Association offers adjustable-rate and 10-year fixed rate first mortgage loans to purchase real estate in a total of 13 states including its core markets. Further, the Association originates residential construction loans to individuals (for the construction of their personal residences by a qualified builder) in Ohio and Florida. The Association also offers home equity lines of credit in a total of 22 states including its core markets and the District of Columbia and home equity loans in a total of 8 states including its core markets. Between 2010 and 2015, the Association, in various steps, modified its home equity lending products and the markets they were offered in response to the 2008 financial crisis. Refer to Item 7. Management’s Discussion and Analysis of Financial Condition and Results of Operation - Monitoring and Limiting Our Credit Risk for additional information regarding home equity loans and lines of credit. At September 30, 2017, residential real estate, fixed-rate and adjustable-rate, first mortgage loans totaled $10.86 billion, or 87.1% of our loan portfolio, home equity loans and lines of credit totaled $1.55 billion, or 12.4% of our loan portfolio, and residential construction loans totaled $61.0 million, or 0.5% of our loan portfolio. At September 30, 2017, adjustable-rate, residential real estate, first mortgage loans totaled $4.82 billion and comprised 38.6% of our loan portfolio.
7
Loan Portfolio Composition. The following table sets forth the composition of the portfolio of loans held for investment, by type of loan segregated by geographic location for the periods indicated, excluding loans held for sale. The majority of our construction loan portfolio is secured by properties located in Ohio and the balances of consumer loans are immaterial. Therefore, neither was segregated by geographic location.
September 30, | ||||||||||||||||||||||||||||||||||
2017 | 2016 | 2015 | 2014 | 2013 | ||||||||||||||||||||||||||||||
Amount | Percent | Amount | Percent | Amount | Percent | Amount | Percent | Amount | Percent | |||||||||||||||||||||||||
(Dollars in thousands) | ||||||||||||||||||||||||||||||||||
Real estate loans: | ||||||||||||||||||||||||||||||||||
Residential Core (1) | ||||||||||||||||||||||||||||||||||
Ohio | $ | 6,061,515 | $ | 5,937,114 | $ | 5,903,051 | $ | 5,986,801 | $ | 5,947,791 | ||||||||||||||||||||||||
Florida | 1,739,098 | 1,678,798 | 1,621,763 | 1,570,087 | 1,465,907 | |||||||||||||||||||||||||||||
Other | 2,945,591 | 2,453,740 | 1,938,125 | 1,271,951 | 704,813 | |||||||||||||||||||||||||||||
Total | 10,746,204 | 86.2 | % | 10,069,652 | 85.5 | % | 9,462,939 | 83.9 | % | 8,828,839 | 82.2 | % | 8,118,511 | 79.4 | % | |||||||||||||||||||
Residential Home Today (1) | ||||||||||||||||||||||||||||||||||
Ohio | 103,803 | 116,253 | 129,416 | 146,974 | 170,206 | |||||||||||||||||||||||||||||
Florida | 4,924 | 5,414 | 6,050 | 6,909 | 7,826 | |||||||||||||||||||||||||||||
Other | 237 | 271 | 280 | 313 | 321 | |||||||||||||||||||||||||||||
Total | 108,964 | 0.9 | 121,938 | 1.0 | 135,746 | 1.2 | 154,196 | 1.5 | 178,353 | 1.7 | ||||||||||||||||||||||||
Home equity loans and lines of credit | ||||||||||||||||||||||||||||||||||
Ohio | 606,301 | 597,735 | 641,321 | 675,911 | 721,890 | |||||||||||||||||||||||||||||
Florida | 340,530 | 370,111 | 421,904 | 475,375 | 539,152 | |||||||||||||||||||||||||||||
California | 205,157 | 210,004 | 216,233 | 213,309 | 227,841 | |||||||||||||||||||||||||||||
Other | 400,327 | 353,432 | 345,781 | 332,334 | 369,515 | |||||||||||||||||||||||||||||
Total | 1,552,315 | 12.4 | 1,531,282 | 13.0 | 1,625,239 | 14.4 | 1,696,929 | 15.8 | 1,858,398 | 18.2 | ||||||||||||||||||||||||
Construction | 60,956 | 0.5 | 61,382 | 0.5 | 55,421 | 0.5 | 57,104 | 0.5 | 72,430 | 0.7 | ||||||||||||||||||||||||
Other consumer loans | 3,050 | — | 3,116 | — | 3,468 | — | 4,721 | — | 4,100 | — | ||||||||||||||||||||||||
Total loans receivable | 12,471,489 | 100.0 | % | 11,787,370 | 100.0 | % | 11,282,813 | 100.0 | % | 10,741,789 | 100.0 | % | 10,231,792 | 100.0 | % | |||||||||||||||||||
Deferred loan expenses (fees), net | 30,865 | 19,384 | 10,112 | (1,155 | ) | (13,171 | ) | |||||||||||||||||||||||||||
Loans in process | (34,100 | ) | (36,155 | ) | (33,788 | ) | (28,585 | ) | (42,018 | ) | ||||||||||||||||||||||||
Allowance for loan losses | (48,948 | ) | (61,795 | ) | (71,554 | ) | (81,362 | ) | (92,537 | ) | ||||||||||||||||||||||||
Total loans receivable, net | $ | 12,419,306 | $ | 11,708,804 | $ | 11,187,583 | $ | 10,630,687 | $ | 10,084,066 | ||||||||||||||||||||||||
______________________
(1) | Residential Core and Home Today loans are primarily one- to four-family residential mortgage loans. See the Residential Real Estate Mortgage Loans section which follows for a further description of Home Today and Core loans. |
8
Loan Portfolio Maturities. The following table summarizes the scheduled repayments of the loan portfolio at September 30, 2017, according to each loan's final due date. Demand loans, loans having no stated repayment schedule or maturity, are reported as being due in the fiscal year ending September 30, 2018. Maturities are based on the final contractual payment date and do not reflect the impact of prepayments and scheduled principal amortization.
Due During the Years Ending September 30, | Residential Real Estate | Home Equity Loans and Lines of Credit | Construction Loans | Other Consumer Loans | Total | ||||||||||||||||||
Core | Home Today | ||||||||||||||||||||||
(In thousands) | |||||||||||||||||||||||
2018 | $ | 2,697 | $ | 131 | $ | 9,691 | $ | — | $ | 3,050 | $ | 15,569 | |||||||||||
2019 | 8,801 | 159 | 8,024 | — | — | 16,984 | |||||||||||||||||
2020 | 14,180 | 104 | 1,377 | 1,130 | — | 16,791 | |||||||||||||||||
2021 to 2022 | 148,770 | 327 | 14,626 | — | — | 163,723 | |||||||||||||||||
2023 to 2027 | 2,405,323 | 1,133 | 215,597 | — | — | 2,622,053 | |||||||||||||||||
2028 to 2032 | 795,228 | 3,823 | 478,813 | 6,640 | — | 1,284,504 | |||||||||||||||||
2033 and beyond | 7,371,205 | 103,287 | 824,187 | 53,186 | — | 8,351,865 | |||||||||||||||||
Total | $ | 10,746,204 | $ | 108,964 | $ | 1,552,315 | $ | 60,956 | $ | 3,050 | $ | 12,471,489 | |||||||||||
The following table sets forth the scheduled repayments of fixed- and adjustable-rate loans at September 30, 2017 that are contractually due after September 30, 2018.
Due After September 30, 2018 | |||||||||||
Fixed | Adjustable | Total | |||||||||
(In thousands) | |||||||||||
Real estate loans: | |||||||||||
Residential Core | $ | 5,924,820 | $ | 4,818,688 | $ | 10,743,508 | |||||
Residential Home Today | 108,627 | 207 | 108,834 | ||||||||
Home Equity Loans and Lines of Credit | 79,416 | 1,463,207 | 1,542,623 | ||||||||
Construction | 39,472 | 21,484 | 60,956 | ||||||||
Total | $ | 6,152,335 | $ | 6,303,586 | $ | 12,455,921 | |||||
Residential Real Estate Mortgage Loans. The Association’s primary lending activity is the origination of residential real estate mortgage loans. A comparison of 2017 data to the corresponding 2016 data can be found in “Item 7. Management’s Discussion and Analysis of Financial Condition and Results of Operation.” The Association currently offers fixed-rate conventional mortgage loans with terms of 30 years or less that are fully amortizing with monthly loan payments, and adjustable-rate mortgage loans that amortize over a period of up to 30 years, provide an initial fixed interest rate for three or five years and then adjust annually, subject to rate reset options as discussed later in this section. At September 30, 2017, there were no “interest only” residential real estate mortgage loans held in the Association's portfolio.
The Association generally originates both fixed- and adjustable-rate mortgage loans in amounts up to the maximum conforming loan limits as established by the FHFA, which is currently $424,100 and $636,150, respectively, for single-family homes in most of our lending markets. The Association also originates loans in amounts that exceed the lending limit for conforming loans, which the Association refers to as “jumbo loans.” The Association generally underwrites jumbo loans in a manner similar to conforming loans. Jumbo loans are not uncommon in the Association’s market areas.
The Association has always considered the promotion of home ownership a primary goal. In that regard, it has historically offered affordable housing programs in all of its market areas. These programs are targeted toward low- and moderate-income home buyers. During the latter portion of fiscal 2016, the Association began to market its HomeReady mortgage loan product for low- and moderate-income homeowners. Third Federal’s HomeReady product is designed to be salable to FannieMae under its HomeReady program. Previously, the Association’s primary program was referred to as "Home Today" and is described in detail below. Prior to March 27, 2009, loans originated under the Home Today program had higher risk characteristics. The Association did not classify Home Today as a sub-prime lending program based on the exclusion provided to community development loans in the Expanded Guidance for Sub-prime Lending issued by the OTS and the OCC. In the aftermath of the 2008 financial crisis, a great deal of attention was focused on sub-prime lending and its negative effect on borrowers and financial markets. Borrowers in our Home Today program were not charged higher fees or interest rates than our Core (non-Home Today) borrowers. Home Today loans were not "interest only" or negative amortizing and contain no low initial payment features or adjustable interest
9
rates, which are features often associated with sub-prime lending. While the credit risk profiles of the Association’s borrowers in the Home Today program were generally higher risk than the credit risk profiles of its Core borrowers, the Association attempted to mitigate that higher risk through the use of private mortgage insurance and continued pre- and post-purchase counseling. The Association’s philosophy has been to provide borrowers the opportunity for home ownership within their financial means.
Coinciding with the Association's marketing of the HomeReady mortgage loan product in 2016, the Association no longer originates loans under its Home Today program. Between March 27, 2009 and 2016, borrowers under the Home Today program were subject to substantially the same underwriting requirements as Core borrowers and borrowers must have completed a financial management education program. Prior to March 27, 2009, through the Home Today program, the Association originated loans with its standard terms to borrowers who might not have otherwise qualified for such loans. The Association originated loans with a LTV ratio of up to 90% through its Home Today program, provided that any loan originated through this program with a LTV ratio in excess of 80% must have met the underwriting criteria mandated by the Association's private mortgage insurance carrier. Because the Association previously applied less stringent underwriting and credit standards to these loans, the majority of loans originated under the Home Today program generally have greater credit risk than our Core residential real estate mortgage loans. Effective October 2007, the private mortgage insurance carrier that provides coverage for the Home Today loans with LTV ratios in excess of 80% imposed more restrictive lending requirements that decreased the volume of Home Today lending. As of September 30, 2017, the Association had $109.0 million of loans outstanding that were originated through its Home Today program, most of which were originated prior to March 27, 2009. At September 30, 2017, of the loans that were originated under the Home Today program, 11.5% were delinquent 30 days or more compared to 0.2% for the portfolio of Core loans as of that date. At September 30, 2017, $6.9 million, or 6.4%, of loans originated under the Home Today program were delinquent 90 days and over and $18.1 million of Home Today loans were non-accruing loans, representing 22.9% of total non-accruing loans as of that date. See “Non-performing Assets and Restructured Loans—Delinquent Loans” for a discussion of the asset quality of this portion of the Association’s loan portfolio.
Prior to November 2008, the Association also originated loans under its high LTV program. These loans had initial LTV ratios of 90% or greater and could be as high as 95%. To qualify for this program, the loan applicant was required to satisfy more stringent underwriting criteria (credit score, income qualification, and other criteria). Borrowers did not obtain private mortgage insurance with respect to these loans. High LTV loans were originated with higher interest rates than the Association’s other residential real estate loans. The Association believes that the higher credit quality of this portion of the portfolio offsets the risk of not requiring private mortgage insurance. While these loans were not initially covered by private mortgage insurance, the Association had negotiated with a private mortgage insurance carrier a contract under which, at the Association’s option, a pre-determined dollar amount of qualifying loans could be grouped and submitted to the carrier for pooled private mortgage insurance coverage. As of September 30, 2017, the Association had $55.8 million of loans outstanding that were originated through its High LTV program, $47.9 million of which the Association has insured through the private mortgage insurance carrier. The High LTV program was suspended in November 2008.
For loans with LTV ratios in excess of 85% but equal to or less than 95%, the Association requires private mortgage insurance. LTV ratios in excess of 80% are not available for refinance transactions except for adjustable-rate, first mortgage loans. The new HomeReady product will require private mortgage insurance on purchase transactions in excess of 80% to 97% LTV and refinance transactions in excess of 80% to 95% LTV.
The Association actively monitors its interest rate risk position to determine its desired level of investment in fixed-rate mortgages. While the sales of first mortgage loans remain strategically important for us, since fiscal 2010, they have played a lesser role in our management of interest rate risk.
The Association currently retains the servicing rights on all loans sold in order to generate fee income and reinforce its commitment to customer service. One- to four-family residential mortgage real estate loans that have been sold were underwritten generally to Fannie Mae guidelines and comply with applicable federal, state and local laws. At the time of the closing of these loans the Association owned the loans and subsequently sold them to Fannie Mae and others providing normal and customary representations and warranties, including representations and warranties related to compliance, generally with Fannie Mae underwriting standards. At the time of sale, the loans were free from encumbrances except for the mortgages filed by the Association which, with other underwriting documents, were subsequently assigned and delivered to Fannie Mae and others. For the fiscal years ended September 30, 2017 and 2016, the Association recognized servicing fees, net of amortization, related to these servicing rights of $4.3 million and $4.7 million, respectively. As of September 30, 2017 and September 30, 2016, the principal balance of loans serviced for others totaled $1.85 billion and $1.96 billion, respectively. In November 2013, the Association entered into a resolution agreement with Fannie Mae, pursuant to which the Association remitted $3.1 million to Fannie Mae. The remittance amount included $0.4 million related to outstanding mortgage insurance claim payments on 42 loans. Under the terms of the resolution agreement, Fannie Mae withdrew all outstanding repurchase and make-whole demands and generally waived its right to enforce future repurchase obligations with respect to all mortgage loans (approximately 23,400 active loans or loans with a remaining balance) that were originated by the Association between January 1, 2000 and December
10
31, 2008 and delivered to Fannie Mae prior to January 1, 2009. At September 30, 2017, substantially all of the loans serviced for Fannie Mae and others were performing in accordance with their contractual terms and management believes that it has no material repurchase obligations associated with these loans. However, an accrual for $0.6 million has been maintained for potential repurchase or loss reimbursement requests at September 30, 2017.
The Association currently offers “Smart Rate” adjustable-rate mortgage loan products secured by residential properties with interest rates that are fixed for an initial period of three or five years, after which the interest rate generally resets every year based upon a contractual spread or margin above the Prime Rate as published in the Wall Street Journal. These adjustable-rate loans provide the borrower with an attractive rate reset option, which allow the borrower to re-lock the rate an unlimited number of times at the Association’s then current lending rates, for another three or five years (which must be the same as the original lock period). Adjustable-rate mortgage loans generally present different credit risks than fixed-rate mortgage loans primarily because the underlying debt service payments of the borrowers increase as interest rates increase, thereby increasing the potential for default. Prior to July 2010, the Association’s adjustable-rate mortgage loan products secured by residential properties offered interest rates that were fixed for an initial period ranging from one year to five years, after which the interest rate generally reset every year based upon a contractual spread or margin above the average yield on U.S. Treasury securities, adjusted to a constant maturity of one year, as published weekly by the FRS (“Traditional ARM”). All of the Association’s adjustable-rate mortgage loans are subject to periodic and lifetime limitations on interest rate changes.
All adjustable-rate mortgage loans with initial fixed-rate periods of three or five years have initial and periodic caps of two percentage points on interest rate changes, with a cap of six percentage points for the life of the loan for Traditional ARM and five or six percentage points for the life of Smart Rate loans. Previously, the Association also offered Traditional ARM loans with an initial fixed-rate period of seven years. Loans originated under that program, which was discontinued in August 2007, had a cap of five percentage points on the initial change in interest rate, with a two percentage point cap on subsequent changes and a cap of five percentage points for the life of the loan. Many of the borrowers who select adjustable-rate mortgage loans have shorter-term credit needs than those who select long-term, fixed-rate mortgage loans. The Association will permit borrowers to convert Traditional ARMs into fixed-rate mortgage loans at no cost to the borrower. The Association has never offered “Option ARM” loans, where borrowers can pay less than the interest owed on their loan, resulting in an increased principal balance during the life of the loan. At September 30, 2017, "Smart Rate" adjustable-rate mortgage loans totaled $4.75 billion, or 97.9% of the adjustable-rate mortgage loan portfolio and Traditional ARMs totaled $103.1 million, or 2.1% of the adjustable-rate mortgage loan portfolio.
The Association requires title insurance on all of its residential real estate mortgage loans. The Association also requires that borrowers maintain fire and extended coverage casualty insurance (and, if appropriate, flood insurance up to $250 thousand) in an amount at least equal to the lesser of the loan balance or the replacement cost of the improvements. A majority of its residential real estate mortgage loans have a mortgage escrow account from which disbursements are made for real estate taxes and to a lesser extent for hazard insurance and flood insurance. The Association does not conduct environmental testing on residential real estate mortgage loans unless specific concerns for hazards are identified by the appraiser used in connection with the origination of the loan.
Home Equity Loans and Home Equity Lines of Credit. The Association offers home equity loans and home equity lines of credit, which are primarily secured by a second mortgage on residences. Home equity products offered by the Association varied significantly between June 28, 2010 and September 30, 2016. Prior to June 28, 2010, the Association offered home equity loans and home equity lines of credit. The Association also offered a home equity lending product that was secured by a third mortgage, although the Association only originated this loan to borrowers where the Association also held the second mortgage. Between June 28, 2010 and March 19, 2012, we suspended the acceptance of new home equity credit applications with the exception of bridge loans (loans where borrowers can utilize the existing equity in their current home to fund the purchase of a new home before they have sold their current home) and, in accordance with a directive from our primary federal banking regulator, actively pursued strategies to decrease the outstanding balance of our home equity lending portfolio as well as our exposure to undrawn home equity lines of credit. Beginning March 20, 2012, we again offered new home equity lines of credit to qualifying existing home equity customers. In 2013, we further modified the product design and we extended the offer to both existing home equity customers and new consumers in Ohio, Florida, and selected counties in Kentucky. Over the course of the fiscal year ended September 30, 2014, we expanded the home equity product offering to include 21 states and the District of Columbia. Home equity lines of credit originated since 2013 contain a provision for amortizing loan payments during the draw period. These offers were, and are, subject to certain property and credit performance conditions which, among other items, related to CLTV, geography, borrower income verification, minimum credit scores and draw period duration. At September 30, 2017 and 2016, home equity loans totaled $307.5 million, or 2.5%, and $223.6 million, or 1.9%, respectively, of total loans receivable (which included $217.8 million and $182.6 million, respectively, of home equity lines of credit which were in the amortization period and no longer eligible to be drawn upon and $17.3 million and $2.0 million of bridge loans), and home equity lines of credit totaled $1.24 billion, or 10.0%, and $1.31 billion, or 11.1%, respectively, of total loans receivable. A bridge loan permits a borrower to utilize the existing equity in their current home to fund the purchase of a new home before the current
11
home is sold. Bridge loans are originated for a one-year term, with no prepayment penalties. These loans have fixed interest rates, and are currently limited to a combined 80% LTV ratio (first and second mortgage liens). The Association charges a closing fee with respect to bridge loans. Additionally, at September 30, 2017 and 2016, the unadvanced amounts of home equity lines of credit totaled $1.43 billion and $1.25 billion, respectively.
Prior to June 28, 2010, the underwriting standards for home equity loans and home equity lines of credit were less restrictive than current underwriting standards, which impacted acceptable LTV ratios, minimum credit scores, income and employment verification and line amounts. Generally, the least restrictive qualifications and the most attractive product features from a borrower’s perspective were in place during portions of fiscal 2006 and 2007. Between 2007 and 2010 the home equity lending parameters became increasingly restrictive. The Association originated its home equity loans and home equity lines of credit without application fees (except for bridge loans) or borrower-paid closing costs. Home equity loans were offered with fixed interest rates, were fully amortizing and had terms of up to 15 years. The Association’s home equity lines of credit were offered with adjustable rates of interest indexed to the Prime Rate, as reported in The Wall Street Journal.
The following table sets forth credit exposure, principal balance, percent delinquent 90 days or more, the mean CLTV percent at the time of origination and the current CLTV percent of our home equity loans, home equity lines of credit and bridge loan portfolio as of September 30, 2017. Home equity lines of credit in the draw period are reported according to geographical distribution.
Credit Exposure | Principal Balance | Percent Delinquent 90 days or more | Mean CLTV Percent at Origination(2) | Current Mean CLTV Percent(3) | ||||||||||||
(Dollars in thousands) | ||||||||||||||||
Home equity lines of credit in draw period (by state): | ||||||||||||||||
Ohio | $ | 1,177,766 | $ | 469,137 | 0.06 | % | 60 | % | 54 | % | ||||||
Florida | 420,071 | 227,093 | 0.25 | % | 58 | % | 52 | % | ||||||||
California | 335,930 | 182,641 | 0.12 | % | 64 | % | 56 | % | ||||||||
Other (1) | 736,536 | 365,992 | 0.07 | % | 64 | % | 61 | % | ||||||||
Total home equity lines of credit in draw period | 2,670,303 | 1,244,863 | 0.11 | % | 61 | % | 56 | % | ||||||||
Home equity lines in repayment, home equity loans and bridge loans | 307,452 | 307,452 | 1.41 | % | 67 | % | 54 | % | ||||||||
Total | $ | 2,977,755 | $ | 1,552,315 | 0.35 | % | 62 | % | 55 | % | ||||||
______________________
(1) | No individual other state has a committed or drawn balance greater than 10% of total loans and 5% of equity products. |
(2) | Mean CLTV percent at origination for all home equity lines of credit is based on the committed amount. |
(3) | Current Mean CLTV is based on best available first mortgage and property values as of September 30, 2017. Property values are estimated using HPI data published by the FHFA. Current Mean CLTV percent for home equity lines of credit in the draw period is calculated using the committed amount. Current Mean CLTV on home equity lines of credit in the repayment period is calculated using the principal balance. |
At September 30, 2017, 45.0% of our home equity lending portfolio was either in first lien position (26.5%) or was in a subordinate (second) lien position behind a first lien that we held (13.2%) or behind a first lien that was held by a loan that we originated, sold and now service for others (5.3%). At September 30, 2017, 15.8% of our home equity line of credit portfolio in the draw period was making only the minimum payment on their outstanding line balance.
12
The following table sets forth by calendar origination year, the credit exposure, principal balance, percent delinquent 90 days or more, the mean CLTV percent at the time of origination and the current mean CLTV percent of our home equity loans, home equity lines of credit and bridge loan portfolio as of September 30, 2017. Home equity lines of credit in the draw period are included in the year originated:
Credit Exposure | Principal Balance | Percent Delinquent 90 Days or More | Mean CLTV Percent at Origination(1) | Current Mean CLTV Percent(2) | ||||||||||||
(Dollars in thousands) | ||||||||||||||||
Home equity lines of credit in draw period: | ||||||||||||||||
2007 and Prior | $ | 270,725 | $ | 141,511 | 0.36 | % | 65 | % | 55 | % | ||||||
2008 | 465,906 | 256,555 | 0.20 | % | 63 | % | 57 | % | ||||||||
2009 | 189,863 | 78,588 | 0.34 | % | 55 | % | 51 | % | ||||||||
2010 | 16,134 | 5,943 | — | % | 57 | % | 47 | % | ||||||||
2011 | — | — | — | % | — | % | — | % | ||||||||
2012 | 4,632 | 1,201 | — | % | 53 | % | 43 | % | ||||||||
2013 | 49,669 | 18,391 | — | % | 59 | % | 45 | % | ||||||||
2014 | 200,541 | 80,912 | — | % | 60 | % | 49 | % | ||||||||
2015 | 286,645 | 129,569 | 0.02 | % | 60 | % | 53 | % | ||||||||
2016 | 507,144 | 234,496 | — | % | 62 | % | 59 | % | ||||||||
2017 | 679,044 | 297,697 | — | % | 60 | % | 60 | % | ||||||||
Total home equity lines of credit in draw period | 2,670,303 | 1,244,863 | 0.11 | % | 61 | % | 56 | % | ||||||||
Home equity lines in repayment, home equity loans and bridge loans | 307,452 | 307,452 | 1.41 | % | 67 | % | 54 | % | ||||||||
Total | $ | 2,977,755 | $ | 1,552,315 | 0.35 | % | 62 | % | 55 | % | ||||||
______________________
(1) | Mean CLTV percent at origination for all home equity lines of credit is based on the committed amount. |
(2) | Current Mean CLTV is based on best available first mortgage and property values as of September 30, 2017. Property values are estimated using HPI data published by the FHFA. Current Mean CLTV percent for home equity lines of credit in the draw period is calculated using the committed amount. Current Mean CLTV on home equity lines of credit in the repayment period is calculated using the principal balance. |
In general, the home equity line of credit product originated prior to June 2010 (when new home equity lending was temporarily suspended) was characterized by a ten year draw period followed by a ten year repayment period; however, there were two types of transactions that could result in a draw period that extended beyond ten years. The first transaction involved customer requests for increases in the amount of their home equity line of credit. When the customer’s credit performance and profile supported the increase, the draw period term was reset for the ten year period following the date of the increase in the home equity line of credit amount. A second transaction that impacted the draw period involved extensions. For a period of time prior to June 2008, the Association had a program that evaluated home equity lines of credit that were nearing the end of their draw period and made a determination as to whether or not the customer should be offered an additional ten year draw period. If the account and customer met certain pre-established criteria, an offer was made to extend the otherwise expiring draw period by ten years from the date of the offer. If the customer chose to accept the extension, the origination date of the account remained unchanged but the account would have a revised draw period that was extended by ten years. As a result of these two programs, the reported draw periods for certain home equity line of credit accounts exceed ten years.
13
The following table sets forth by fiscal year when the draw period expires, the principal balance of home equity lines of credit in the draw period as of September 30, 2017, segregated by the current combined LTV range.
Current CLTV Category | |||||||||||||||||
Home equity lines of credit in draw period (by End of Draw Fiscal Year): | < 80% | 80 - 89.9% | 90 - 100% | >100% | Unknown (2) | Total | |||||||||||
(Dollars in thousands) | |||||||||||||||||
2018 (1) | $254,747 | $35,569 | $13,390 | $11,103 | $5,262 | $320,071 | |||||||||||
2019 (1) | 212,853 | 8,696 | 1,783 | 1,301 | 4,080 | 228,713 | |||||||||||
2020 (1) | 140,767 | 547 | 11 | 62 | 1,773 | 143,160 | |||||||||||
2021 (1) | 49,391 | 135 | 9 | — | 172 | 49,707 | |||||||||||
2022 | 58 | 36 | — | — | — | 94 | |||||||||||
2023 | 22 | — | — | — | — | 22 | |||||||||||
Post 2023 | 487,901 | 12,852 | 50 | 113 | 2,180 | 503,096 | |||||||||||
Total | $1,145,739 | $57,835 | $15,243 | $12,579 | $13,467 | $1,244,863 | |||||||||||
______________________
(1) | Home equity lines of credit whose draw period ends in fiscal years 2018, 2019, 2020 and 2021 include $17.7 million, $62.9 million, $126.5 million and $49.6 million respectively, of lines where the customer has an amortizing payment during the draw period. All home equity lines of credit whose draw period ends in fiscal years after 2021 have an amortizing payment during the draw period. |
(2) | Market data necessary for stratification is not readily available. |
As shown in the origination by year table,which is the second preceding table above, the percentage of loans delinquent 90 days or more (seriously delinquent) originated during the years 2009 and earlier are comparatively higher than the years following 2009. Those years saw rapidly increasing housing prices, especially in our Florida market. As housing prices declined along with the general economic downturn and higher levels of unemployment that accompanied the 2008 financial crisis, we see that reflected in delinquencies for those years. Home equity lines of credit originated during those years also saw higher loan amounts, higher permitted LTV ratios, and lower credit scores. However, recent increases in home values have reversed the trend of the general decrease in housing values from the aftermath of the 2008 financial crisis, resulting in current mean CLTV percentages becoming lower than the mean CLTV percentages at origination, which was not the case for a number of years. Increased home values have also allowed customers to refinance their home equity lines of credit approaching the end of draw period. The combination of the principal balance of all home equity products no longer in the draw period, plus those lines originated in 2009 and earlier, is $784.1 million, a reduction of $322.2 million during the current fiscal year. In addition, as shown in the table below, the principal balance of home equity lines of credit in the draw period that have a current mean CLTV over 80% or unknown is $99.1 million at September 30, 2017, a reduction of $108.1 million during the current fiscal year.
While there have been recent improvements, the previous past weakness in the housing market and the uncertainty with respect to future employment levels and economic prospects, causes us to continue to conduct an expanded loan level evaluation of our home equity lines of credit which are delinquent 90 days or more.
14
The following table sets forth the breakdown of current mean CLTV percentages for our home equity lines of credit in the draw period as of September 30, 2017.
Credit Exposure | Principal Balance | Percent of Total Principal Balance | Percent Delinquent 90 days or More | Mean CLTV Percent at Origination(2) | Current Mean CLTV Percent(3) | ||||||||||||||
(Dollars in thousands) | |||||||||||||||||||
Home equity lines of credit in draw period (by current mean CLTV): | |||||||||||||||||||
< 80% | $ | 2,513,063 | $ | 1,145,813 | 92.1 | % | 0.08 | % | 60 | % | 54 | % | |||||||
80 - 89.9% | 95,905 | 57,834 | 4.6 | % | 0.49 | % | 80 | % | 83 | % | |||||||||
90 - 100% | 18,509 | 15,243 | 1.2 | % | 0.16 | % | 82 | % | 94 | % | |||||||||
> 100% | 14,269 | 12,579 | 1.0 | % | 0.67 | % | 78 | % | 128 | % | |||||||||
Unknown (1) | 28,557 | 13,394 | 1.1 | % | — | % | 57 | % | (1 | ) | |||||||||
$ | 2,670,303 | $ | 1,244,863 | 100.0 | % | 0.11 | % | 61 | % | 56 | % | ||||||||
______________________
(1) | Market data necessary for stratification is not readily available. |
(2) | Mean CLTV percent at origination for all home equity lines of credit is based on the committed amount. |
(3) | Current Mean CLTV is based on best available first mortgage and property values as of September 30, 2017. Property values are estimated using HPI data published by the FHFA. Current Mean CLTV percent for home equity lines of credit in the draw period is calculated using the committed amount. Current Mean CLTV on home equity lines of credit in the repayment period is calculated using the principal balance. |
Construction Loans. The Association originates construction loans to individuals for the construction of their personal single-family residence by a qualified builder (construction/permanent loans). The Association’s construction/permanent loans generally provide for disbursements to the builder or sub-contractors during the construction phase as work progresses. During the construction phase, the borrower only pays interest on the drawn balance. Upon completion of construction, the loan converts to a permanent amortizing loan without the expense of a second closing. The Association offers construction/permanent loans with fixed or adjustable rates, and a current maximum loan-to-completed-appraised value ratio of 85%. At September 30, 2017, construction loans totaled $61.0 million, or 0.5% of total loans receivable. At September 30, 2017, the unadvanced portion of these construction loans totaled $34.1 million.
Construction financing generally involves greater credit risk than long-term financing on improved, owner-occupied real estate. Risk of loss on a construction loan depends largely upon the accuracy of the initial estimate of the value of the property at completion of construction compared to the estimated cost (including interest) of construction and other assumptions. If the estimate of construction cost proves to be inaccurate, the Association may be required to advance additional funds beyond the amount originally committed in order to protect the value of the property. Moreover, if the estimated value of the completed project proves to be inaccurate, the borrower may hold a property with a value that is insufficient to assure full repayment of the construction loan upon the sale of the property. This is more likely to occur when home prices are falling.
Loan Originations, Purchases, Sales, Participations and Servicing. Lending activities are conducted primarily by the Association’s loan personnel (all of whom are non-commissioned associates) operating at our main and branch office locations and at our loan production offices. All loans that the Association originates are underwritten pursuant to its policies and procedures, which, for real estate loans, are consistent with the ability to repay guidance provided by the CFPB. A small number of loans originated with the intent to sell and certain other long-term, fixed rate loans, as described below, are originated using Fannie Mae underwriting guidelines. The majority of loans however, are originated using guidelines that are similar, but not identical to Fannie Mae underwriting guidelines. The Association originates both adjustable-rate and fixed-rate loans and advertises extensively throughout its market area. Its ability to originate fixed- or adjustable-rate loans is dependent upon the relative consumer demand for such loans, which is affected by current market interest rates as well as anticipated future market interest rates. The Association’s loan origination and sales activity may be adversely affected by a rising interest rate environment or economic recession, which typically results in decreased loan demand. The Association’s residential real estate mortgage loan originations are generated by its in-house loan representatives, by direct mail solicitations, by referrals from existing or past customers, by referrals from local builders and real estate brokers, from calls to its telephone call center and from the internet.
Except for loans originated in accordance with the guidelines of Fannie Mae's HARP II and HomeReady programs, which loans are originated with the intent to sell, the Association decides whether to retain, sell or securitize the loans that it originates,
15
after evaluating current and projected market interest rates, its interest rate risk objectives, its liquidity needs and other factors. During the fiscal year ended September 30, 2017, the Association sold to Fannie Mae, in either whole loan or security form, $211.0 million of long-term, fixed-rate residential real estate mortgage loans and to the FHLB of Cincinnati, $38.4 million of long-term, fixed-rate residential real estate mortgage loans, all on a servicing retained basis. In addition to sales of long-term, fixed-rate residential real estate mortgage loans, during the fiscal year ended September 30, 2013, the Association also sold to private parties, non-agency eligible, long-term fixed-rate and adjustable-rate loans on a servicing retained basis. Those fiscal 2013 sales evidenced the saleability of our loans that are not originated in accordance with agency specified procedures, including adjustable-rate loans. As described in Item 7. Management’s Discussion and Analysis of Financial Condition and Results of Operation - Controlling Our Interest Rate Risk Exposure, effective July 1, 2010, Fannie Mae, historically the Association’s primary loan investor, implemented certain loan origination requirement changes affecting loan eligibility that, prior to May 2013, we had not adopted. In May 2013, we implemented loan origination changes with respect to a small portion of our loan originations, which were approved by Fannie Mae on November 15, 2013, which allow that portion of our first mortgage loan originations that were processed using the revised procedures to be eligible for securitization and sale in Fannie Mae mortgage backed security form. The balance of loans held for sale was $0.4 million at September 30, 2017, which were originated pursuant to the guidelines of Fannie Mae's HARP II and HomeReady programs.
Historically, the Association has retained the servicing rights on all residential real estate mortgage loans that it has sold, and intends to continue this practice into the future. At September 30, 2017, the Association serviced loans owned by others with a principal balance of $1.85 billion, including $4.2 million of loans sold to Fannie Mae subject to recourse. All recourse sales occurred prior to the year 2000. Loan servicing includes collecting and remitting loan payments, accounting for principal and interest, contacting delinquent borrowers, supervising foreclosures and property dispositions in the event of unremedied defaults, making certain insurance and tax payments on behalf of the borrowers and generally administering the loans. The Association retains a portion of the interest paid by the borrower on the loans it services as consideration for its servicing activities. The Association did not enter into any loan participations during the fiscal year ended September 30, 2017 and does not expect to do so in the near future.
Loan Approval Procedures and Authority. The Association’s lending activities follow written, non-discriminatory underwriting standards and loan origination procedures established by its Board of Directors. The loan approval process is intended to assess the borrower’s ability to repay the loan and the value of the property that will secure the loan. To assess the borrower’s ability to repay, the Association reviews the borrower’s employment and credit history and information on the historical and projected income and expenses of the borrower.
The Association’s policies and loan approval limits are established by its Board of Directors. The Association’s Board of Directors has delegated authority to its Executive Committee (consisting of the Association’s Chief Executive Officer and two directors) to review and assign lending authorities to certain individuals of the Association to consider and approve loans within their designated authority. Residential real estate mortgage loans and construction loans require the approval of one individual with designated underwriting authority.
The Association requires independent third-party valuations of real property. Appraisals are performed by independent licensed appraisers.
16
Delinquent Loans. The following tables set forth the number and recorded investment in loan delinquencies by type, segregated by geographic location and severity of delinquency at the dates indicated. The majority of our construction loan portfolio is secured by properties located in Ohio; therefore, it was not segregated by geography.
Loans Delinquent For | ||||||||||||||||||||
30-89 Days | 90 Days or Over | Total | ||||||||||||||||||
Number | Amount | Number | Amount | Number | Amount | |||||||||||||||
(Dollars in thousands) | ||||||||||||||||||||
September 30, 2017 | ||||||||||||||||||||
Real estate loans: | ||||||||||||||||||||
Residential Core | ||||||||||||||||||||
Ohio | 82 | $ | 6,850 | 114 | $ | 8,756 | 196 | $ | 15,606 | |||||||||||
Florida | 12 | 1,671 | 26 | 2,507 | 38 | 4,178 | ||||||||||||||
Other | 1 | 149 | 4 | 712 | 5 | 861 | ||||||||||||||
Total Residential Core | 95 | 8,670 | 144 | 11,975 | 239 | 20,645 | ||||||||||||||
Residential Home Today | ||||||||||||||||||||
Ohio | 123 | 5,244 | 193 | 6,678 | 316 | 11,922 | ||||||||||||||
Florida | 4 | 319 | 5 | 173 | 9 | 492 | ||||||||||||||
Kentucky | — | — | — | — | — | — | ||||||||||||||
Total Residential Home Today | 127 | 5,563 | 198 | 6,851 | 325 | 12,414 | ||||||||||||||
Home equity loans and lines of credit | ||||||||||||||||||||
Ohio | 117 | 3,037 | 133 | 2,134 | 250 | 5,171 | ||||||||||||||
Florida | 48 | 1,884 | 99 | 2,345 | 147 | 4,229 | ||||||||||||||
California | 7 | 590 | 9 | 354 | 16 | 944 | ||||||||||||||
Other | 22 | 859 | 44 | 575 | 66 | 1,434 | ||||||||||||||
Total Home equity loans and lines of credit | 194 | 6,370 | 285 | 5,408 | 479 | 11,778 | ||||||||||||||
Construction | — | — | — | — | — | — | ||||||||||||||
Total | 416 | $ | 20,603 | 627 | $ | 24,234 | 1,043 | $ | 44,837 | |||||||||||
Loans Delinquent For | ||||||||||||||||||||
30-89 Days | 90 Days or Over | Total | ||||||||||||||||||
Number | Amount | Number | Amount | Number | Amount | |||||||||||||||
(Dollars in thousands) | ||||||||||||||||||||
September 30, 2016 | ||||||||||||||||||||
Real estate loans: | ||||||||||||||||||||
Residential Core | ||||||||||||||||||||
Ohio | 93 | $ | 8,901 | 155 | $ | 10,957 | 248 | $ | 19,858 | |||||||||||
Florida | 5 | 790 | 39 | 4,055 | 44 | 4,845 | ||||||||||||||
Other | 1 | 119 | 4 | 581 | 5 | 700 | ||||||||||||||
Total Residential Core | 99 | 9,810 | 198 | 15,593 | 297 | 25,403 | ||||||||||||||
Residential Home Today | ||||||||||||||||||||
Ohio | 133 | 7,456 | 203 | 6,954 | 336 | 14,410 | ||||||||||||||
Florida | 5 | 398 | 10 | 378 | 15 | 776 | ||||||||||||||
Kentucky | 1 | — | 1 | 24 | 2 | 24 | ||||||||||||||
Total Residential Home Today | 139 | 7,854 | 214 | 7,356 | 353 | 15,210 | ||||||||||||||
Home equity loans and lines of credit | ||||||||||||||||||||
Ohio | 94 | 2,507 | 172 | 2,216 | 266 | 4,723 | ||||||||||||||
Florida | 34 | 2,134 | 122 | 2,257 | 156 | 4,391 | ||||||||||||||
California | 8 | 562 | 5 | 130 | 13 | 692 | ||||||||||||||
Other | 32 | 1,213 | 40 | 329 | 72 | 1,542 | ||||||||||||||
Total Home equity loans and lines of credit | 168 | 6,416 | 339 | 4,932 | 507 | 11,348 | ||||||||||||||
Construction | — | — | — | — | — | — | ||||||||||||||
Total | 406 | $ | 24,080 | 751 | $ | 27,881 | 1,157 | $ | 51,961 | |||||||||||
17
Loans Delinquent For | ||||||||||||||||||||
30-89 Days | 90 Days or Over | Total | ||||||||||||||||||
Number | Amount | Number | Amount | Number | Amount | |||||||||||||||
(Dollars in thousands) | ||||||||||||||||||||
September 30, 2015 | ||||||||||||||||||||
Real estate loans: | ||||||||||||||||||||
Residential Core | ||||||||||||||||||||
Ohio | 111 | $ | 10,622 | 188 | $ | 14,746 | 299 | $ | 25,368 | |||||||||||
Florida | 10 | 1,634 | 70 | 7,509 | 80 | 9,143 | ||||||||||||||
Other | 2 | 309 | 8 | 1,051 | 10 | 1,360 | ||||||||||||||
Total Residential Core | 123 | 12,565 | 266 | 23,306 | 389 | 35,871 | ||||||||||||||
Residential Home Today | ||||||||||||||||||||
Ohio | 147 | 8,021 | 231 | 8,371 | 378 | 16,392 | ||||||||||||||
Florida | 5 | 352 | 11 | 674 | 16 | 1,026 | ||||||||||||||
Kentucky | — | — | 1 | 23 | 1 | 23 | ||||||||||||||
Total Residential Home Today | 152 | 8,373 | 243 | 9,068 | 395 | 17,441 | ||||||||||||||
Home equity loans and lines of credit | ||||||||||||||||||||
Ohio | 128 | 2,633 | 189 | 2,772 | 317 | 5,405 | ||||||||||||||
Florida | 36 | 1,894 | 124 | 1,608 | 160 | 3,502 | ||||||||||||||
California | 9 | 680 | 13 | 49 | 22 | 729 | ||||||||||||||
Other | 30 | 967 | 48 | 1,146 | 78 | 2,113 | ||||||||||||||
Total Home equity loans and lines of credit | 203 | 6,174 | 374 | 5,575 | 577 | 11,749 | ||||||||||||||
Construction | — | — | 1 | 427 | 1 | 427 | ||||||||||||||
Total | 478 | $ | 27,112 | 884 | $ | 38,376 | 1,362 | $ | 65,488 | |||||||||||
Loans Delinquent For | ||||||||||||||||||||
30-89 Days | 90 Days or Over | Total | ||||||||||||||||||
Number | Amount | Number | Amount | Number | Amount | |||||||||||||||
(Dollars in thousands) | ||||||||||||||||||||
September 30, 2014 | ||||||||||||||||||||
Real estate loans: | ||||||||||||||||||||
Residential Core | ||||||||||||||||||||
Ohio | 108 | $ | 10,416 | 263 | $ | 22,218 | 371 | $ | 32,634 | |||||||||||
Florida | 14 | 2,006 | 141 | 14,291 | 155 | 16,297 | ||||||||||||||
Other | 3 | 544 | 4 | 942 | 7 | 1,486 | ||||||||||||||
Total Residential Core | 125 | 12,966 | 408 | 37,451 | 533 | 50,417 | ||||||||||||||
Residential Home Today | ||||||||||||||||||||
Ohio | 168 | 9,797 | 328 | 14,256 | 496 | 24,053 | ||||||||||||||
Florida | 9 | 643 | 18 | 849 | 27 | 1,492 | ||||||||||||||
Total Residential Home Today | 177 | 10,440 | 346 | 15,105 | 523 | 25,545 | ||||||||||||||
Home equity loans and lines of credit | ||||||||||||||||||||
Ohio | 123 | 3,753 | 214 | 3,637 | 337 | 7,390 | ||||||||||||||
Florida | 36 | 2,365 | 184 | 3,010 | 220 | 5,375 | ||||||||||||||
California | 11 | 753 | 16 | 298 | 27 | 1,051 | ||||||||||||||
Other | 21 | 958 | 59 | 2,092 | 80 | 3,050 | ||||||||||||||
Total Home equity loans and lines of credit | 191 | 7,829 | 473 | 9,037 | 664 | 16,866 | ||||||||||||||
Construction | 1 | 200 | — | — | 1 | 200 | ||||||||||||||
Total | 494 | $ | 31,435 | 1,227 | $ | 61,593 | 1,721 | $ | 93,028 | |||||||||||
18
Loans Delinquent For | ||||||||||||||||||||
30-89 Days | 90 Days or Over | Total | ||||||||||||||||||
Number | Amount | Number | Amount | Number | Amount | |||||||||||||||
(Dollars in thousands) | ||||||||||||||||||||
September 30, 2013 | ||||||||||||||||||||
Real estate loans: | ||||||||||||||||||||
Residential Core | ||||||||||||||||||||
Ohio | 165 | $ | 17,064 | 340 | $ | 31,498 | 505 | $ | 48,562 | |||||||||||
Florida | 17 | 2,743 | 200 | 24,405 | 217 | 27,148 | ||||||||||||||
Other | 3 | 465 | 3 | 581 | 6 | 1,046 | ||||||||||||||
Total Residential Core | 185 | 20,272 | 543 | 56,484 | 728 | 76,756 | ||||||||||||||
Residential Home Today | ||||||||||||||||||||
Ohio | 213 | 14,213 | 377 | 17,748 | 590 | 31,961 | ||||||||||||||
Florida | 6 | 373 | 16 | 593 | 22 | 966 | ||||||||||||||
Total Residential Home Today | 219 | 14,586 | 393 | 18,341 | 612 | 32,927 | ||||||||||||||
Home equity loans and lines of credit | ||||||||||||||||||||
Ohio | 151 | 5,304 | 200 | 5,132 | 351 | 10,436 | ||||||||||||||
Florida | 56 | 4,228 | 170 | 3,589 | 226 | 7,817 | ||||||||||||||
California | 9 | 749 | 27 | 1,479 | 36 | 2,228 | ||||||||||||||
Other | 30 | 1,990 | 49 | 1,842 | 79 | 3,832 | ||||||||||||||
Total Home equity loans and lines of credit | 246 | 12,271 | 446 | 12,042 | 692 | 24,313 | ||||||||||||||
Construction | — | — | 2 | 41 | 2 | 41 | ||||||||||||||
Total | 650 | $ | 47,129 | 1,384 | $ | 86,908 | 2,034 | $ | 134,037 | |||||||||||
Total loans seriously delinquent (i.e. delinquent 90 days or over) decreased five basis points to 0.19% of total net loans at September 30, 2017, from 0.24% at September 30, 2016. The percentage of seriously delinquent loans to total net loans decreased in the residential Core portfolio from 0.13% to 0.10%. Such loans in the residential Home Today portfolio decreased from 0.06% to 0.05%; and in the home equity loans and lines of credit portfolio the percentage was 0.04% as of both dates. Although regional employment levels have improved, we expect some borrowers who are current on their loans at September 30, 2017 to experience payment problems in the future. In addition, Hurricane Irma affected much of our Florida markets when it made landfall in September, 2017. There was minimal damage to our branch office operations and to the best of our knowledge, little damage to properties securing our mortgage loans. However we have offered homeowners in the affected areas an option to defer three months of mortgage payments to lessen any financial strain related to the storm. We expect there may be a related increase in short term delinquencies subsequent to September 30, 2017 as these payment deferrals are resolved through repayment plans, term extensions or other loan modifications, but we do not expect a material increase in loan losses as a result of these payment deferrals.
Non-performing Assets and Restructured Loans: Collection Procedures. Within 15 days of a borrower’s delinquency, the Association attempts personal, direct contact with the borrower to determine the reason for the delinquency, to ensure that the borrower correctly understands the terms of the loan and to emphasize the importance of making payments on or before the due date. If necessary, subsequent late charges and delinquent notices are issued and the borrower’s account will be monitored on a regular basis thereafter. The Association also mails system-generated reminder notices on a monthly basis. When a loan is more than 30 days past due, the Association attempts to contact the borrower and develop a plan of repayment. By the 90th day of delinquency, the Association may recommend foreclosure. By this date, if a repayment agreement has not been established, or if an agreement is established but is subsequently broken, the borrower’s credit file is reviewed and, if considered necessary, the loan will be evaluated for impairment. For further discussion on evaluating loans for impairment, see Note 5. LOANS AND ALLOWANCE FOR LOAN LOSSES. A summary report of all loans 30 days or more past due is provided to the Association’s Board of Directors.
Loans are placed in non-accrual status when they are contractually 90 days or more past due or if collection of principal or interest in full is in doubt. Loans restructured in TDRs that were in non-accrual status prior to the restructurings remain in non-accrual status for a minimum of six months. Home equity loans and lines of credit which are subordinate to a first mortgage lien where the customer is seriously delinquent, are placed in non-accrual status. Loans in Chapter 7 bankruptcy status where all borrowers have been discharged from their mortgage obligation are placed in non-accrual status. Beginning in 2014, loans in Chapter 7 bankruptcy status where all borrowers had filed, and had not reaffirmed or been dismissed, are also placed in non-accrual status. For discussion on interest recognition, see Note 5. LOANS AND ALLOWANCE FOR LOAN LOSSES.
19
The table below sets forth the recorded investments and categories of our non-performing assets and TDRs at the dates indicated.
September 30, | |||||||||||||||||||
2017 | 2016 | 2015 | 2014 | 2013 | |||||||||||||||
(Dollars in thousands) | |||||||||||||||||||
Non-accrual loans: | |||||||||||||||||||
Real estate loans: | |||||||||||||||||||
Residential Core | $ | 43,797 | $ | 51,304 | $ | 62,293 | $ | 79,388 | $ | 91,048 | |||||||||
Residential Home Today | 18,109 | 19,451 | 22,556 | 29,960 | 34,813 | ||||||||||||||
Home equity loans and lines of credit(1) | 17,185 | 19,206 | 21,514 | 26,189 | 29,943 | ||||||||||||||
Construction | — | — | 427 | — | 41 | ||||||||||||||
Total non-accrual loans(2)(3) | 79,091 | 89,961 | 106,790 | 135,537 | 155,845 | ||||||||||||||
Real estate owned | 5,521 | 6,803 | 17,492 | 21,768 | 22,666 | ||||||||||||||
Total non-performing assets | $ | 84,612 | $ | 96,764 | $ | 124,282 | $ | 157,305 | $ | 178,511 | |||||||||
Ratios: | |||||||||||||||||||
Total non-accrual loans to total loans | 0.63 | % | 0.76 | % | 0.95 | % | 1.27 | % | 1.53 | % | |||||||||
Total non-accrual loans to total assets | 0.58 | % | 0.70 | % | 0.86 | % | 1.15 | % | 1.38 | % | |||||||||
Total non-performing assets to total assets | 0.62 | % | 0.75 | % | 1.00 | % | 1.33 | % | 1.58 | % | |||||||||
TDRs (not included in non-accrual loans above): | |||||||||||||||||||
Real estate loans: | |||||||||||||||||||
Residential Core | $ | 53,511 | $ | 57,942 | $ | 60,175 | $ | 59,630 | $ | 63,045 | |||||||||
Residential Home Today | 28,751 | 32,401 | 35,674 | 39,148 | 46,435 | ||||||||||||||
Home equity loans and lines of credit | 20,864 | 16,528 | 11,904 | 8,117 | 7,092 | ||||||||||||||
Construction | — | — | — | — | 259 | ||||||||||||||
Total | $ | 103,126 | $ | 106,871 | $ | 107,753 | $ | 106,895 | $ | 116,831 | |||||||||
______________________
(1) | The totals at September 30, 2017, 2016, 2015, 2014 and 2013 include $0.5 million, $1.3 million, $1.8 million, $2.5 million and $5.3 million of performing home equity lines of credit, pursuant to regulatory guidance regarding senior lien delinquency issued in January 2012. |
(2) | At September 30, 2017, 2016, 2015, 2014 and 2013 the totals include $47.0 million, $51.4 million, $55.5 million, $58.7 million and $54.3 million respectively, in TDRs which: are less than 90 days past due but included with non-accrual loans for a minimum period of six months from the restructuring date due to their non-accrual status prior to restructuring; because they have been partially charged off; or because all borrowers have filed Chapter 7 bankruptcy, and had not reaffirmed or been dismissed. |
(3) | At September 30, 2017, 2016, 2015, 2014, and 2013 the totals include $11.9 million, $12.4 million, $15.0 million, $20.9 million and $$30.6 million in TDRs that are 90 days or more past due respectively. |
The gross interest income that would have been recorded during the year ended September 30, 2017 on non-accrual loans if they had been accruing during the entire period and TDRs if they had been current and performing in accordance with their original terms during the entire period was $10.2 million. The interest income recognized on those loans included in net income for the year ended September 30, 2017 was $6.8 million.
Impaired Loans. A loan is considered impaired when, based on current information and events, it is probable that the Association will be unable to collect the scheduled payments of principal and interest according to the contractual terms of the loan agreement. For discussion on impairment measurement, see Note 5. LOANS AND ALLOWANCE FOR LOAN LOSSES.
The recorded investment of impaired loans includes accruing TDRs and loans that are returned to accrual status when contractual payments are less than 90 days past due. Also, the recorded investment of non-accrual loans includes loans that are not included in the recorded investment of impaired loans because they are included in loans collectively evaluated for impairment. The table below sets forth a reconciliation of the recorded investments and categories between non-accrual loans and impaired loans at the dates indicated.
20
At or For the Years Ended September 30, | ||||||||||||||||||||
2017 | 2016 | 2015 | 2014 | 2013 | ||||||||||||||||
(Dollars in thousands) | ||||||||||||||||||||
Balance of Non-Accrual Loans | $ | 79,091 | $ | 89,961 | $ | 106,790 | $ | 135,537 | $ | 155,845 | ||||||||||
Accruing TDRs | 103,126 | 106,871 | 107,753 | 106,895 | 116,831 | |||||||||||||||
Performing Impaired Loans | 3,607 | 4,022 | 5,276 | 5,389 | 7,761 | |||||||||||||||
Less Loans Collectively Evaluated | (5,264 | ) | (6,004 | ) | (7,647 | ) | (14,435 | ) | (17,396 | ) | ||||||||||
Balance of Total Impaired loans | $ | 180,560 | $ | 194,850 | $ | 212,172 | $ | 233,386 | $ | 263,041 | ||||||||||
The balance of total (accrual and non-accrual) TDRs was $162.0 million at September 30, 2017, $8.6 million decrease from September 30, 2016. Of the $162.0 million of TDRs recorded at September 30, 2017, $86.6 million is in the Residential Core portfolio, $44.0 million is in the Home Today portfolio and $31.4 million is in the Home equity loans and lines of credit portfolio.
Loan restructuring is a method used to help families keep their homes and preserve our neighborhoods. This involves making changes to the borrowers’ loan terms through interest rate reductions, either for a specific period or for the remaining term of the loan; term extensions including those beyond that provided in the original agreement; principal forgiveness; capitalization of delinquent payments in special situations; or some combination of the above. Loans discharged through Chapter 7 bankruptcy are also reported as TDRs per OCC interpretive guidance. For discussion on impairment measurement, see Note 5. LOANS AND ALLOWANCE FOR LOAN LOSSES.
The following table sets forth the recorded investments of accrual and non-accrual TDRs, by the types of concessions granted as of September 30, 2017.
Reduction in Interest Rates | Payment Extensions | Forbearance or Other Actions | Multiple Concessions | Multiple Restructurings | Bankruptcy | Total | |||||||||||||||||||||
(Dollars in thousands) | |||||||||||||||||||||||||||
Accrual | |||||||||||||||||||||||||||
Residential Core | $ | 10,847 | $ | 498 | $ | 6,483 | $ | 17,891 | $ | 10,710 | $ | 7,082 | $ | 53,511 | |||||||||||||
Residential Home Today | 4,217 | — | 3,177 | 9,450 | 10,977 | 930 | 28,751 | ||||||||||||||||||||
Home equity loans and lines of credit | 106 | 5,551 | 236 | 12,241 | 226 | 2,504 | 20,864 | ||||||||||||||||||||
Total | $ | 15,170 | $ | 6,049 | $ | 9,896 | $ | 39,582 | $ | 21,913 | $ | 10,516 | $ | 103,126 | |||||||||||||
Non-Accrual, Performing | |||||||||||||||||||||||||||
Residential Core | $ | 1,006 | $ | — | $ | 485 | $ | 2,715 | $ | 8,161 | $ | 15,039 | $ | 27,406 | |||||||||||||
Residential Home Today | 688 | — | 838 | 866 | 5,358 | 2,562 | 10,312 | ||||||||||||||||||||
Home equity loans and lines of credit | — | 272 | 54 | 2,202 | 1,202 | 5,562 | 9,292 | ||||||||||||||||||||
Total | $ | 1,694 | $ | 272 | $ | 1,377 | $ | 5,783 | $ | 14,721 | $ | 23,163 | $ | 47,010 | |||||||||||||
Non-Accrual, Non-Performing | |||||||||||||||||||||||||||
Residential Core | $ | 632 | $ | 23 | $ | 1,208 | $ | 672 | $ | 1,588 | $ | 1,548 | $ | 5,671 | |||||||||||||
Residential Home Today | 536 | — | 796 | 222 | 2,543 | 845 | 4,942 | ||||||||||||||||||||
Home equity loans and lines of credit | — | 210 | 83 | 218 | 43 | 717 | 1,271 | ||||||||||||||||||||
Total | $ | 1,168 | $ | 233 | $ | 2,087 | $ | 1,112 | $ | 4,174 | $ | 3,110 | $ | 11,884 | |||||||||||||
Total TDRs | |||||||||||||||||||||||||||
Residential Core | $ | 12,485 | $ | 521 | $ | 8,176 | $ | 21,278 | $ | 20,459 | $ | 23,670 | $ | 86,589 | |||||||||||||
Residential Home Today | 5,441 | — | 4,811 | 10,538 | 18,877 | 4,337 | 44,004 | ||||||||||||||||||||
Home equity loans and lines of credit | 106 | 6,033 | 373 | 14,661 | 1,471 | 8,783 | 31,427 | ||||||||||||||||||||
Total | $ | 18,032 | $ | 6,554 | $ | 13,360 | $ | 46,477 | $ | 40,807 | $ | 36,790 | $ | 162,020 | |||||||||||||
21
TDRs on accrual status are loans accruing interest and performing according to the terms of the restructuring. To be performing, a loan must be less than 90 days past due as of the report date. Non-accrual, performing status indicates that a loan was: not accruing interest at the time of restructuring, continues to not accrue interest and is performing according to the terms of the restructuring, but has not been current for at least six consecutive months since its restructuring; has a partial charge-off; or is being classified as non-accrual per the OCC guidance on loans in Chapter 7 bankruptcy status, where all borrowers have filed and have not reaffirmed or been dismissed. Non-accrual, non-performing status includes loans that are not accruing interest because they are greater than 90 days past due and therefore not performing according to the terms of the restructuring.
Real Estate Owned. Real estate acquired as a result of foreclosure or by deed in lieu of foreclosure is classified as real estate owned until sold. When property is acquired, it is recorded at the estimated fair market value at the date of foreclosure less estimated costs to sell, establishing a new cost basis. Estimated fair value generally represents the sale price a buyer would be willing to pay on the basis of current market conditions. Subsequent to acquisition, real estate owned is carried at the lower of the cost basis or estimated fair market value less estimated costs to sell. Increases in the fair market value are recognized through income not exceeding the valuation allowance. Holding costs and declines in estimated fair market value result in charges to expense after acquisition. At September 30, 2017, we had $5.5 million in real estate owned.
Classification of Assets. Our policies, consistent with regulatory guidelines, provide for the classification of loans and other assets that are considered to be of lesser quality as substandard, doubtful, or loss assets. An asset is considered substandard if it is inadequately protected by the current payment capacity of the borrower or the collateral pledged has a defined weakness that jeopardizes the liquidation of the debt. Substandard assets include those assets characterized by the distinct possibility that we will sustain some loss if the deficiencies are not corrected. Assets classified as doubtful have all of the weaknesses inherent in those classified substandard with the added characteristic that the weaknesses present make collection or liquidation in full, on the basis of currently existing facts, conditions and values, highly questionable or improbable. Assets (or portions of assets) classified as loss are those considered uncollectible and of such little value that their continuance as assets is not warranted. Assets that do not expose us to risk sufficient to warrant classification in one of the aforementioned categories, but which possess potential weaknesses that deserve management's attention and may result in further deterioration in their repayment prospects and/or the Association's credit position, are required to be designated as special mention.
When we classify assets as either substandard or doubtful, we allocate a portion of the related general loss allowances to such assets as we deem prudent. The allowance for loan losses is the amount estimated by management as necessary to absorb credit losses incurred in the loan portfolio that are both probable and reasonably estimable at the balance sheet date. When we classify a problem asset as loss, we charge-off that portion of the asset that is uncollectible. Our determinations as to the classification of our assets and the amount of our loss allowances are subject to review by the Association's primary federal regulator, the OCC, which can require that we establish additional loss allowances. We regularly review our asset portfolio to determine whether any assets require classification in accordance with applicable regulations. On the basis of our review of assets at September 30, 2017, the recorded investment of classified assets consists of substandard assets of $96.8 million, including $5.5 million of real estate owned, and $3.8 million of assets designated special mention. As of September 30, 2017, there were no individual assets with balances exceeding $1 million that were classified as substandard. Substandard assets at September 30, 2017 include $24.2 million of loans 90 or more days past due and $67.1 million of loans less than 90 days past due displaying a weakness sufficient to warrant an adverse classification, the majority of which are TDRs.
Allowance for Loan Losses. We provide for loan losses based on the allowance method. Accordingly, all loan losses are charged to the related allowance and all recoveries are credited to it. Additions to the allowance for loan losses are provided by charges to income based on various factors which, in our judgment, deserve current recognition in estimating probable losses. We regularly review the loan portfolio and make provisions for loan losses in order to maintain the allowance for loan losses in accordance with accounting principles generally accepted in the United States of America. Our allowance for loan losses consists of two components:
(1) | individual valuation allowances (IVAs) established for any impaired loans dependent on cash flows, such as performing TDRs, and IVAs related to a portion of the allowance on loans individually reviewed that represents further deterioration in the fair value of the collateral not yet identified as uncollectible. |
(2) | general valuation allowances (GVAs), which are comprised of quantitative GVAs, which are general allowances for loan losses for each loan type based on historical loan loss experience and qualitative GVAs which are adjustments to the quantitative GVAs, maintained to cover uncertainties that affect our estimate of incurred probable losses for each loan type. |
We evaluate the allowance for loan losses based upon the combined total of the quantitative and qualitative GVAs and IVAs. The qualitative GVAs expand our ability to identify and estimate probable losses and are based on our evaluation of the following factors, some of which are consistent with factors that impact the determination of quantitative GVAs. For example,
22
delinquency statistics (both current and historical) are used in developing the quantitative GVAs while the trending of the delinquency statistics is considered and evaluated in the determination of the qualitative GVAs. Factors impacting the determination of qualitative GVAs include:
• | changes in lending policies and procedures including underwriting standards, collection, charge-off or recovery practices; |
• | changes in national, regional, and local economic and business conditions and trends including housing market factors and trends, such as the status of loans in foreclosure, real estate in judgment and real estate owned, and unemployment statistics and trends; |
• | changes in the nature and volume of the portfolios including home equity lines of credit nearing the end of the draw period; |
• | changes in the experience, ability or depth of lending management; |
• | changes in the volume or severity of past due loans, volume of nonaccrual loans, or the volume and severity of adversely classified loans including the trending of delinquency statistics (both current and historical), historical loan loss experience and trends, the frequency and magnitude of multiple restructurings of loans previously the subject of TDRs, and uncertainty surrounding borrowers’ ability to recover from temporary hardships for which short-term loan restructurings are granted; |
• | changes in the quality of the loan review system; |
• | changes in the value of the underlying collateral including asset disposition loss statistics (both current and historical) and the trending of those statistics, and additional charge-offs on individually reviewed loans; |
• | existence of any concentrations of credit; |
• | effect of other external factors such as competition, or legal and regulatory requirements including market conditions and regulatory directives that impact the entire financial services industry. |
When loan restructurings qualify as TDRs and the loans are performing according to the terms of the restructuring, we record an IVA based on the present value of expected future cash flows, which includes a factor for subsequent potential defaults, discounted at the effective interest rate of the original loan contract. Potential defaults are distinguished from multiple restructurings as borrowers who default are not eligible for a subsequent restructuring. At September 30, 2017, the balance of such IVAs was $11.1 million. In instances when loans require multiple restructurings, additional valuation allowances may be required. The new valuation allowance on a loan that has multiple restructurings, is calculated based on the present value of the expected cash flows, discounted at the effective interest rate of the original loan contract, considering the new terms of the restructured agreement. Due to the immaterial amount of this exposure to date, we continue to capture this exposure as a component of our qualitative GVA evaluation. The significance of this exposure will be monitored and if warranted, we will enhance our loan loss methodology to include a new default factor (developed to reflect the estimated impact to the balance of the allowance for loan losses that will occur as a result of subsequent future restructurings) that will be assessed against all loans reviewed collectively. If new default factors are implemented, the qualitative GVA methodology will be adjusted to preclude duplicative loss consideration.
Home equity loans and lines of credit generally have higher credit risk than traditional residential mortgage loans. These loans and lines are usually in a second lien position and when combined with the first mortgage, result in generally higher overall LTV ratios. In a stressed housing market with high delinquencies and decreasing housing prices, as arose beginning in 2008, these higher LTV ratios represent a greater risk of loss to the Company. A borrower with more equity in the property has a vested interest in keeping the loan current compared to a borrower with little or no equity in the property. We conduct an expanded loan level evaluation of our home equity loans and lines of credit, including bridge loans, which are delinquent 90 days or more. This expanded evaluation is in addition to our traditional evaluation procedures. Although the level of home equity loans and lines of credit charge-offs has been reduced during the year from previous levels and recoveries have actually exceeded gross charge-offs, our home equity loans and lines of credit portfolio continued to comprise a significant portion of our gross charge-offs during the current year. At September 30, 2017, we had a recorded investment of $1.57 billion in home equity loans and equity lines of credit outstanding, 0.3% of which were delinquent 90 days or more.
Construction loans generally have greater credit risk than traditional residential real estate mortgage loans as discussed in the Construction Loans section above.
We periodically evaluate the carrying value of loans and the allowance is adjusted accordingly. While we use the best information available to make evaluations, future additions to the allowance may be necessary based on unforeseen changes in
23
loan quality and economic conditions. For more information regarding the allowance for loan losses, see Item 7 “Management’s Discussion and Analysis of Financial Condition and Results of Operations.”
The following table sets forth activity in our allowance for loan losses segregated by geographic location for the periods indicated. The majority of our construction loan portfolio is secured by properties located in Ohio and the balances of Other consumer loans are immaterial; therefore neither was segregated.
At or For the Years Ended September 30, | |||||||||||||||||||
2017 | 2016 | 2015 | 2014 | 2013 | |||||||||||||||
(Dollars in thousands) | |||||||||||||||||||
Allowance balance (beginning of the year) | $ | 61,795 | $ | 71,554 | $ | 81,362 | $ | 92,537 | $ | 100,464 | |||||||||
Charge-offs: | |||||||||||||||||||
Real estate loans: | |||||||||||||||||||
Residential Core | |||||||||||||||||||
Ohio | 1,728 | 3,214 | 4,522 | 8,406 | 10,534 | ||||||||||||||
Florida | 1,272 | 981 | 1,703 | 7,782 | 6,129 | ||||||||||||||
Other | 29 | 99 | 641 | 32 | 56 | ||||||||||||||
Total Residential Core | 3,029 | 4,294 | 6,866 | 16,220 | 16,719 | ||||||||||||||
Residential Home Today | |||||||||||||||||||
Ohio | 2,172 | 2,649 | 3,277 | 7,336 | 11,869 | ||||||||||||||
Florida | 83 | 112 | 175 | 286 | 433 | ||||||||||||||
Other | 21 | — | — | — | — | ||||||||||||||
Total Residential Home Today | 2,276 | 2,761 | 3,452 | 7,622 | 12,302 | ||||||||||||||
Home equity loans and lines of credit | |||||||||||||||||||
Ohio | 2,707 | 3,095 | 5,241 | 4,879 | 4,604 | ||||||||||||||
Florida | 2,560 | 2,885 | 4,017 | 8,004 | 14,147 | ||||||||||||||
California | 199 | 76 | 498 | 1,021 | 2,490 | ||||||||||||||
Other | 707 | 1,790 | 1,278 | 2,039 | 2,302 | ||||||||||||||
Total Home equity loans and lines of credit | 6,173 | 7,846 | 11,034 | 15,943 | 23,543 | ||||||||||||||
Construction | — | — | — | 192 | 294 | ||||||||||||||
Total charge-offs | 11,478 | 14,901 | 21,352 | 39,977 | 52,858 | ||||||||||||||
Recoveries: | |||||||||||||||||||
Real estate loans: | |||||||||||||||||||
Residential Core | 5,458 | 3,708 | 5,369 | 2,742 | 2,061 | ||||||||||||||
Residential Home Today | 1,311 | 1,433 | 1,533 | 1,909 | 775 | ||||||||||||||
Home equity loans and lines of credit | 8,862 | 7,969 | 7,468 | 4,918 | 4,964 | ||||||||||||||
Construction | — | 32 | 174 | 233 | 131 | ||||||||||||||
Total recoveries | 15,631 | 13,142 | 14,544 | 9,802 | 7,931 | ||||||||||||||
Net recoveries (charge-offs) | 4,153 | (1,759 | ) | (6,808 | ) | (30,175 | ) | (44,927 | ) | ||||||||||
Provision (credit) for loan losses | (17,000 | ) | (8,000 | ) | (3,000 | ) | 19,000 | 37,000 | |||||||||||
Allowance balance (end of the year) | $ | 48,948 | $ | 61,795 | $ | 71,554 | $ | 81,362 | $ | 92,537 | |||||||||
Ratios: | |||||||||||||||||||
Net charge-offs (recoveries) to average loans outstanding | (0.03 | )% | 0.02 | % | 0.06 | % | 0.29 | % | 0.44 | % | |||||||||
Allowance for loan losses to non-accrual loans at end of the year | 61.89 | % | 68.69 | % | 67.00 | % | 60.03 | % | 59.38 | % | |||||||||
Allowance for loan losses to the total recorded investment in loans at end of the year | 0.39 | % | 0.52 | % | 0.64 | % | 0.76 | % | 0.91 | % | |||||||||
Charge-offs decreased during the year ended September 30, 2017 in all portfolios when compared to the year ended September 30, 2016, reflecting the improving market conditions. We continue to evaluate loans becoming delinquent for potential losses and record provisions for the estimate of those losses.
24
Allocation of Allowance for Loan Losses. The following tables set forth the allowance for loan losses allocated by loan category, the percent of allowance in each category to the total allowance, and the percent of loans in each category to total loans at the dates indicated. The allowance for loan losses allocated to each category is not necessarily indicative of future losses in any particular category and does not restrict the use of the allowance to absorb losses in other categories.
At September 30, | |||||||||||||||||||||||||||||
2017 | 2016 | 2015 | |||||||||||||||||||||||||||
Amount | Percent of Allowance to Total Allowance | Percent of Loans in Category to Total Loans | Amount | Percent of Allowance to Total Allowance | Percent of Loans in Category to Total Loans | Amount | Percent of Allowance to Total Allowance | Percent of Loans in Category to Total Loans | |||||||||||||||||||||
(Dollars in thousands) | |||||||||||||||||||||||||||||
Real estate loans: | |||||||||||||||||||||||||||||
Residential Core | $ | 14,186 | 29.0 | % | 86.2 | % | $ | 15,068 | 24.4 | % | 85.5 | % | $ | 22,596 | 31.6 | % | 83.9 | % | |||||||||||
Residential Home Today | 4,508 | 9.2 | 0.9 | 7,416 | 12.0 | 1.0 | 9,997 | 14.0 | 1.2 | ||||||||||||||||||||
Home equity loans and lines of credit | 30,249 | 61.8 | 12.4 | 39,304 | 63.6 | 13.0 | 38,926 | 54.4 | 14.4 | ||||||||||||||||||||
Construction | 5 | — | 0.5 | 7 | — | 0.5 | 35 | — | 0.5 | ||||||||||||||||||||
Total allowance | $ | 48,948 | 100.0 | % | 100.0 | % | $ | 61,795 | 100.0 | % | 100.0 | % | $ | 71,554 | 100.0 | % | 100.0 | % | |||||||||||
At September 30, | |||||||||||||||||||
2014 | 2013 | ||||||||||||||||||
Amount | Percent of Allowance to Total Allowance | Percent of Loans in Category to Total Loans | Amount | Percent of Allowance to Total Allowance | Percent of Loans in Category to Total Loans | ||||||||||||||
(Dollars in thousands) | |||||||||||||||||||
Real estate loans: | |||||||||||||||||||
Residential Core | $ | 31,080 | 38.2 | % | 82.2 | % | $ | 35,427 | 38.3 | % | 79.4 | % | |||||||
Residential Home Today | 16,424 | 20.2 | 1.5 | 24,112 | 26.0 | 1.7 | |||||||||||||
Home equity loans and lines of credit | 33,831 | 41.6 | 15.8 | 32,818 | 35.5 | 18.2 | |||||||||||||
Construction | 27 | — | 0.5 | 180 | 0.2 | 0.7 | |||||||||||||
Total allowance | $ | 81,362 | 100.0 | % | 100.0 | % | $ | 92,537 | 100.0 | % | 100.0 | % | |||||||
During the year ended September 30, 2017, the total allowance for loan losses decreased $12.9 million, to $48.9 million from $61.8 million at September 30, 2016, as we recorded a negative $17.0 million provision for loan losses, which offset the impact to the allowance of recorded net recoveries of $4.2 million for the year. The allowance for loan losses related to loans evaluated collectively decreased by $11.3 million during the year ended September 30, 2017, and the allowance for loan losses related to loans evaluated individually decreased by $1.6 million. Refer to the "Activity in the Allowance for Loan Losses" and "Analysis of the Allowance for Loan Losses" tables in Note 5 of the Notes to Consolidated Financial Statements for more information. Other than the less significant construction and other consumer loans segments, changes during the year ended September 30, 2017 in the balances of the GVAs, excluding changes in IVAs, related to the significant loan segments are described as follows:
• | Residential Core – The total balance of this segment of the loan portfolio increased 6.8% or $681.4 million while the total allowance for loan losses for this segment decreased 5.2% or $0.8 million. The portion of this loan segment’s allowance for loan losses that was determined by evaluating groups of loans collectively (i.e. those loans that were not individually evaluated), increased $0.8 million, or 13.0%, from $6.1 million at September 30, 2016 to $6.9 million at September 30, 2017. The ratio of this portion of the allowance for loan losses to the total balance of loans in this loan segment that were evaluated collectively, was 0.06% as of both dates. The decreases in the balance and ratio of the allowance for loan losses were reflective of the improvements in the levels of loan delinquencies and the reduction in the amount of net charge offs during the current year when compared to prior periods. These improvements occurred as the balance of this loan segment grew during the year due to the addition of high credit quality, residential first mortgage loans. Total delinquencies decreased 18.7% to $20.6 million at September 30, 2017 from $25.4 million at September 30, 2016. Loans 90 or more days delinquent decreased 23.2% to $12.0 million at September 30, 2017 from $15.6 million at September 30, 2016. There were net recoveries during the current year of $2.4 million as compared to |
25
$0.6 million of net charge-offs during the year ended September 30, 2016. As there continues to be a consistent improving trend in asset quality of this portfolio, additional reductions in the allowance may be warranted, offset by any increase that may be warranted from the overall rise in the portfolio balance.
• | Residential Home Today – The total balance of this segment of the loan portfolio decreased 10.6% or $12.8 million as new loans are no longer being originated in this portfolio. The total allowance for loan losses for this segment decreased by $2.9 million or 39.2%. The portion of this loan segment’s allowance for loan losses that was determined by evaluating groups of loans collectively (i.e. those loans that were not individually evaluated), decreased by 49.1% from $4.4 million at September 30, 2016 to $2.3 million at September 30, 2017. Similarly, the ratio of this portion of the allowance to the total balance of loans in this loan segment that were evaluated collectively, decreased 2.7% to 3.7% at September 30, 2017 from 6.4% at September 30, 2016. Total delinquencies decreased from $15.2 million at September 30, 2016 to $12.4 million at September 30, 2017. Delinquencies greater than 90 days decreased from $7.4 million to $6.9 million during the same period. The credit profile of the remaining Home Today portfolio segment in total improved during the year and net charge-offs were less at $1.0 million during the year ended September 30, 2017 as compared to $1.3 million during the year ended September 30, 2016. Despite the improving trends, there still remains concern surrounding the overall credit profile of Home Today borrowers based on the generally less stringent credit requirements that were in place at the time that these borrowers qualified for their loans. This increases the risk when impairment is identified through discharged Chapter 7 bankruptcy, restructurings and a high portfolio delinquency when compared to the other portfolios. |
• | Home Equity Loans and Lines of Credit – The total balance of this segment of the loan portfolio increased 1.8% or $27.5 million from $1.54 billion at September 30, 2016 to $1.57 billion at September 30, 2017. The total allowance for loan losses for this segment decreased 23.0% to $30.2 million from $39.3 million at September 30, 2016. The portion of this loan segment's allowance for loan losses that was determined by evaluating groups of loans collectively (i.e. those loans that were not individually evaluated) decreased by $9.8 million, or 25.4%, from $38.6 million to $28.8 million during the year ended September 30, 2017. The ratio of this portion of the allowance to the total balance of loans in this loan segment that were evaluated collectively also decreased to 1.9% at September 30, 2017 from 2.6% at September 30, 2016. Net charge-offs for this loan segment during the current year were less due to a decrease in gross charge-offs and an increase in loan recoveries, resulting in net recoveries of $2.7 million for the current year as compared to net recoveries of $123 thousand for the year ended September 30, 2016. Total delinquencies for this portfolio segment increased 3.8% to $11.8 million at September 30, 2017 as compared to $11.3 million at September 30, 2016. Delinquencies greater than 90 days increased 9.7% to $5.4 million at September 30, 2017 from $4.9 million at September 30, 2016. The credit metrics of this loan segment were mixed as recoveries exceeded charge-offs, while total delinquencies slightly increased during the current year, but the overall downward shift of risk level in the portfolio led to the reduction of the total allowance. The reduction in the allowance is also supported by a reduction of the principal balance of home equity lines of credit coming to the end of the draw period. In recent years, a large portion of the overall allowance has been allocated to the home equity loans and lines of credit portfolio to address exposure from customers whose lines of credit were originated without amortizing payments during the draw period and who could face potential increased payment shock at the end of the draw period. In general, home equity lines of credit originated prior to June 2010 were characterized by a ten-year draw period, with interest only payments, followed by a ten-year repayment period. However, a large number of those lines of credit approaching the end of draw period have been paid off or refinanced without significant loss. The principal balance of home equity lines of credit originated prior to 2010 without amortizing payments during the draw period that are coming to the end of the draw period through fiscal 2020 is $482.4 million at September 30, 2017, compared to $891.2 million at September 30, 2016. As this exposure decreases without incurring significant loss, the portion of the overall allowance allocated to the home equity loans and lines of credit category can be decreased. Generally, there were minimal home equity lines of credit originated between June 2010 and February 2013 and those originated after February 2013 require an amortizing payment during the draw period and do not face the same end-of-draw increased payment shock risk. However, the balance and ratio of this loan segment's allowance for loan losses continue to reflect our consideration of the potentially adverse impact that required payment increases that occur as home equity lines of credit near the end of their draw periods may have on our borrowers ability to meet their debt service obligations. |
While the portfolio performance has improved, loan losses on home equity loans and lines of credit continued to comprise a large component of our gross charge-offs for 2017 and are expected to continue to represent a large portion of our charge-offs for the foreseeable future until non-performing loan balances begin to decrease by more than the charge-offs.
Our analysis for evaluating the adequacy of and the appropriateness of our loan loss provision and allowance for loan losses is continually refined as new information becomes available and actual loss experience is acquired. During the years ended September 30, 2017, 2016, 2015, 2014 and 2013 no material changes were made to the allowance or allowance methodology.
26
Investments
The Association’s Board of Directors is responsible for establishing and overseeing the Association’s investment policy. The investment policy is reviewed at least annually by management and any changes to the policy are recommended to the Board of Directors, or a committee thereof, and are subject to its approval. This policy dictates that investment decisions be made based on the safety of the investment, liquidity requirements, potential returns, the ability to provide collateral for pledging requirements, and consistency with our interest rate risk management strategy. The Association’s Investment Committee, which consists of its chief operating officer, chief financial officer and other members of management, oversees its investing activities and strategies. The portfolio manager is responsible for making securities portfolio decisions in accordance with established policies. The portfolio manager has the authority to purchase and sell securities within specific guidelines established in the investment policy, but historically the portfolio manager has executed purchases only after extensive discussions with other Investment Committee members. All transactions are formally reviewed by the Investment Committee at least quarterly. Any investment which, subsequent to its purchase, fails to meet the guidelines of the policy is reported to the Investment Committee, which decides whether to hold or sell the investment.
The Association’s investment policy requires that it invest primarily in debt securities issued by the U.S. Government, agencies of the U.S. Government, and government-sponsored entities, which include Fannie Mae and Freddie Mac. The policy also permits investments in mortgage-backed securities, including pass-through securities issued and guaranteed by Fannie Mae, Freddie Mac and Ginnie Mae as well as collateralized mortgage obligations and real estate mortgage investment conduits issued or backed by securities issued by these governmental agencies and government-sponsored entities. The investment policy also permits investments in asset-backed securities, banker’s acceptances, money market funds, term federal funds, repurchase agreements and reverse repurchase agreements.
The Association’s investment policy does not permit investment in municipal bonds, corporate debt obligations, preferred or common stock of government agencies or equity securities other than its required investment in the common stock of the FHLB of Cincinnati. As of September 30, 2017, we held no asset-backed securities or securities with sub-prime credit risk exposure, nor did we hold any banker’s acceptances, term federal funds, repurchase agreements or reverse repurchase agreements. As a federal savings association, the Association is not permitted to invest in equity securities. This general restriction does not apply to the Company. The Association’s investment policy permits the use of interest rate agreements (caps, floors and collars) and interest rate exchange contracts (swaps) in managing our interest rate risk exposure. The use of financial futures, however, is prohibited without specific approval from its Board of Directors.
FASB ASC 320, “Investments-Debt and Equity Securities,” requires that, at the time of purchase, we designate a security as held to maturity, available-for-sale, or trading, depending on our ability and intent. Securities designated as available-for-sale are reported at fair value, while securities designated as held to maturity are reported at amortized cost. As a result of previous guidance from the Company's primary regulator that indicated that the Company's reported balance of liquid assets could not include any investment security not classified as available for sale, all investment securities held by the Company are classified as available for sale. We do not have a trading portfolio.
Our investment portfolio at September 30, 2017, consisted of $8.5 million in primarily fixed-rate securities guaranteed by Fannie Mae, and $533.4 million of REMICs collateralized only by securities guaranteed by Fannie Mae, Freddie Mac or Ginnie Mae.
U.S. Government and Federal Agency Obligations. While U.S. Government and federal agency securities generally provide lower yields than other investment options authorized in the Association's and Company's investment policies, we maintain these investments, to the extent appropriate, for liquidity purposes, as collateral for borrowings and as an interest rate risk hedge in the event of significant mortgage loan prepayments.
Mortgage-Backed Securities. We purchase mortgage-backed securities insured or guaranteed by Fannie Mae, Freddie Mac or Ginnie Mae. We invest in mortgage-backed securities to achieve positive interest rate spreads with minimal administrative expense, and to lower our credit risk as a result of the guarantees provided by Freddie Mac, Fannie Mae or Ginnie Mae. The U.S. Treasury Department has established financing agreements to ensure that Fannie Mae and Freddie Mac meet their obligations to holders of mortgage-backed securities that they have issued or guaranteed.
Mortgage-backed securities are created by the pooling of mortgages and the issuance of a security with an interest rate that is less than the interest rate on the underlying mortgages. Mortgage-backed securities typically represent a participation interest in a pool of single-family or multi-family mortgages, although we invest primarily in mortgage-backed securities backed by one- to four-family mortgages. The issuers of such securities (generally Ginnie Mae, Fannie Mae and Freddie Mac) pool and resell the participation interests in the form of securities to investors such as the Association, and guarantee the payment of principal and interest to investors. Mortgage-backed securities generally yield less than the loans that underlie such securities because of the cost of payment guarantees and credit enhancements. However, mortgage-backed securities are more
27
liquid than individual mortgage loans since there is an active trading market for such securities. While there has been significant disruption in the demand for private issuer mortgage-backed securities, the U.S. Treasury support for Fannie Mae and Freddie Mac guarantees has maintained an orderly market for the mortgage-backed securities the Company typically purchases. In addition, mortgage-backed securities may be used to collateralize our specific liabilities and obligations. Investments in mortgage-backed securities involve a risk that the timing of actual payments will be earlier or later than the timing estimated when the mortgage-backed security was purchased, which may require adjustments to the amortization of any premium or accretion of any discount relating to such interests, thereby affecting the net yield on our securities. We periodically review current prepayment speeds to determine whether prepayment estimates require modifications that could cause amortization or accretion adjustments.
REMICs are types of debt securities issued by a special-purpose entity that aggregates pools of mortgages and mortgage-backed securities and creates different classes of securities with varying maturities and amortization schedules, as well as a residual interest, with each class possessing different risk characteristics. The cash flows from the underlying collateral are generally divided into “tranches” or classes that have descending priorities with respect to the distribution of principal and interest cash flows, while cash flows on pass-through mortgage-backed securities are distributed pro rata to all security holders.
The following table sets forth the amortized cost and fair value of our securities portfolio (excluding FHLB of Cincinnati common stock) at the dates indicated.
At September 30, | |||||||||||||||||||||||
2017 | 2016 | 2015 | |||||||||||||||||||||
Amortized Cost | Fair Value | Amortized Cost | Fair Value | Amortized Cost | Fair Value | ||||||||||||||||||
(Dollars in thousands) | |||||||||||||||||||||||
Investments available for sale: | |||||||||||||||||||||||
U.S. Government and agency obligations | $ | — | $ | — | $ | — | $ | — | $ | 2,000 | $ | 2,002 | |||||||||||
REMICs | 533,427 | 528,536 | 508,044 | 507,997 | 570,194 | 572,451 | |||||||||||||||||
Fannie Mae certificates | 8,537 | 8,943 | 9,184 | 9,869 | 9,897 | 10,600 | |||||||||||||||||
Total investment securities available for sale | $ | 541,964 | $ | 537,479 | $ | 517,228 | $ | 517,866 | $ | 582,091 | $ | 585,053 | |||||||||||
Portfolio Maturities and Yields. The composition and maturities of our securities portfolio at September 30, 2017 are summarized in the following table. Maturities are based on the final contractual payment dates, and do not reflect the impact of prepayments or early redemptions that may occur. All of our securities at September 30, 2017 were taxable securities.
One Year or Less | More than One Year Through Five years | More than Five Years Through Ten Years | More than Ten Years | Total Securities | ||||||||||||||||||||||||||||||||||
Amortized Cost | Weighted Average Yield | Amortized Cost | Weighted Average Yield | Amortized Cost | Weighted Average Yield | Amortized Cost | Weighted Average Yield | Amortized Cost | Fair Value | Weighted Average Yield | ||||||||||||||||||||||||||||
(Dollars in thousands) | ||||||||||||||||||||||||||||||||||||||
Investments available-for-sale: | ||||||||||||||||||||||||||||||||||||||
REMICs | — | — | % | 5 | 2.68 | % | 90,890 | 1.69 | % | 442,532 | 1.82 | % | 533,427 | 528,536 | 1.80 | % | ||||||||||||||||||||||
Fannie Mae certificates | — | — | % | 5,345 | 2.35 | % | 604 | 7.90 | % | 2,588 | 6.19 | % | 8,537 | 8,943 | 3.91 | % | ||||||||||||||||||||||
Total investment securities available-for-sale | $ | — | — | % | $ | 5,350 | 2.35 | % | $ | 91,494 | 1.73 | % | $ | 445,120 | 1.84 | % | $ | 541,964 | $ | 537,479 | 1.83 | % | ||||||||||||||||
Sources of Funds
General. Deposits traditionally have been the primary source of funds for the Association’s lending and investment activities. The Association also borrows, primarily from the FHLB of Cincinnati and the FRB-Cleveland Discount Window, to supplement cash flow, to lengthen the maturities of liabilities for interest rate risk management purposes and to manage its cost of funds. Additional sources of funds are scheduled loan payments, maturing investments, loan prepayments, collateralized wholesale borrowings, income on other earning assets, the proceeds from loan sales, and brokered CDs.
Deposits. The Association obtains deposits primarily from the areas in which its branch offices are located, as well as from its customer service call center, its internet website, and from brokered CDs. It relies on its competitive pricing,
28
convenient locations, and customer service to attract and retain its non-brokered deposits. It offers a variety of retail deposit accounts with a range of interest rates and terms. Its retail deposit accounts consist of savings accounts (primarily high-yield savings), checking accounts, CDs, individual retirement accounts, and other qualified plan accounts.
Interest rates paid, maturity terms, service fees, and withdrawal penalties are established on a periodic basis. Deposit rates and terms are based primarily on current operating strategies and market interest rates, liquidity requirements, interest rates paid by competitors, and our deposit growth goals.
At September 30, 2017, deposits totaled $8.15 billion. Checking accounts totaled $987.0 million (including $911.6 million of high-yield checking accounts) and savings accounts totaled $1.47 billion (including $1.36 billion of high-yield savings accounts). At September 30, 2017, the Association had a total of $5.69 billion in CDs (including $620.7 million of brokered CDs), of which $2.13 billion had remaining maturities of one year or less. Based on historical experience and its current pricing strategy, management believes the Association will retain a large portion of these accounts upon maturity.
The following table sets forth the distribution of the Association’s average total deposit accounts, by account type, for the fiscal years indicated.
For the Years Ended September 30, | |||||||||||||||||||||||||||||
2017 | 2016 | 2015 | |||||||||||||||||||||||||||
Average Balance | Percent | Weighted Average Rate | Average Balance | Percent | Weighted Average Rate | Average Balance | Percent | Weighted Average Rate | |||||||||||||||||||||
(Dollars in thousands) | |||||||||||||||||||||||||||||
Deposit type: | |||||||||||||||||||||||||||||
Checking | 992,042 | 12.1 | % | 0.09 | % | $ | 990,592 | 11.9 | % | 0.13 | % | $ | 995,736 | 11.8 | % | 0.14 | % | ||||||||||||
Savings | 1,514,275 | 18.5 | % | 0.14 | % | 1,563,448 | 18.8 | % | 0.18 | % | 1,636,093 | 19.3 | % | 0.19 | % | ||||||||||||||
Certificates of deposit | 5,672,212 | 69.4 | % | 1.49 | % | 5,756,861 | 69.3 | % | 1.49 | % | 5,836,053 | 68.9 | % | 1.53 | % | ||||||||||||||
Total deposits | $ | 8,178,529 | 100.0 | % | 1.07 | % | $ | 8,310,901 | 100.0 | % | 1.08 | % | $ | 8,467,882 | 100.0 | % | 1.12 | % | |||||||||||
As of September 30, 2017, the aggregate amount of the Association’s outstanding CDs in amounts greater than or equal to $100,000 was approximately $2.69 billion. The following table sets forth the maturity of those CDs as of September 30, 2017.
At September 30, 2017 | |||
(In thousands) | |||
Three months or less | $ | 323,026 | |
Over three months through six months | 141,048 | ||
Over six months through one year | 485,879 | ||
Over one year to three years | 1,294,243 | ||
Over three years | 441,466 | ||
Total | $ | 2,685,662 | |
29
The following table sets forth the Association's CDs, by interest rate range and length of time until maturity, at September 30, 2017.
Period to Maturity | ||||||||||||||||||||||
Less Than or Equal to One Year | More Than One to Two Years | More Than Two to Three Years | More Than Three Years | Total | Percent of Total | |||||||||||||||||
(Dollars in thousands) | ||||||||||||||||||||||
Interest Rate Range: | ||||||||||||||||||||||
0.99% and below | $ | 531,640 | $ | 254,524 | $ | 43,597 | $ | 47,923 | $ | 877,684 | 15.43 | % | ||||||||||
1.00% to 1.99% | 1,473,180 | 1,229,516 | 1,062,747 | 583,475 | 4,348,918 | 76.44 | % | |||||||||||||||
2.00% to 2.99% | 122,270 | 356 | 27,132 | 299,600 | 449,358 | 7.90 | % | |||||||||||||||
3.00% to 3.99% | 515 | 4,977 | 3,156 | — | 8,648 | 0.15 | % | |||||||||||||||
4.00% and above | 3,960 | 668 | — | — | 4,628 | 0.08 | % | |||||||||||||||
Total | $ | 2,131,565 | $ | 1,490,041 | $ | 1,136,632 | $ | 930,998 | $ | 5,689,236 | 100.00 | % | ||||||||||
The following table sets forth the Association’s CDs classified by interest rate range at the dates indicated.
At September 30, | |||||||||||
2017 | 2016 | 2015 | |||||||||
(Dollars in thousands) | |||||||||||
Interest Rate | |||||||||||
0.99% and below | $ | 877,684 | $ | 1,164,802 | $ | 1,641,838 | |||||
1.00% to 1.99% | 4,348,918 | 4,214,976 | 3,293,964 | ||||||||
2.00% to 2.99% | 449,358 | 411,229 | 552,902 | ||||||||
3.00% to 3.99% | 8,648 | 9,487 | 158,504 | ||||||||
4.00% and above | 4,628 | 19,148 | 31,410 | ||||||||
Total | $ | 5,689,236 | $ | 5,819,642 | $ | 5,678,618 | |||||
Borrowings. At September 30, 2017, the Association had $3.67 billion of borrowings from the FHLB of Cincinnati. During the fiscal year ended September 30, 2017, the Association’s only third party borrowings consisted of loans, commonly referred to as “advances,” from the FHLB of Cincinnati. Borrowings from the FHLB of Cincinnati are secured by the Association’s investment in the common stock of the FHLB of Cincinnati as well as by a blanket pledge of its mortgage portfolio not otherwise pledged. Our current, immediate additional borrowing capacity with the FHLB of Cincinnati is $41.0 million as limited by the amount of FHLB of Cincinnati common stock that we own. Based on the amount of collateral that is subject to the blanket pledge that secures advances, in addition to the existing available capacity, our capacity limit for additional borrowings from the FHLB of Cincinnati at September 30, 2017 was $4.87 billion, subject to satisfaction of the FHLB of Cincinnati common stock ownership requirement. To satisfy the common stock ownership requirement, we would have to increase our ownership of FHLB of Cincinnati common stock by an additional $97.4 million. The ability to borrow from the FRB-Cleveland Discount Window is also available to the Association and is secured by a pledge of specific loans in the Association’s mortgage portfolio. At September 30, 2017, the Association had the capacity to borrow up to $72.3 million from the FRB-Cleveland and had no amount outstanding as of that date.
30
The following table sets forth information concerning balances and interest rates on the Association’s borrowings at and for the periods shown:
At or For The Fiscal Years Ended September 30, | |||||||||||
2017 | 2016 | 2015 | |||||||||
(Dollars in thousands) | |||||||||||
Balance at end of year | $ | 3,671,377 | $ | 2,718,795 | $ | 2,168,627 | |||||
Average balance during year | $ | 3,231,709 | $ | 2,284,881 | $ | 2,312,977 | |||||
Maximum outstanding at any month end | $ | 3,679,225 | $ | 2,720,903 | $ | 2,745,262 | |||||
Weighted average interest rate at end of year | 1.36 | % | 1.01 | % | 1.14 | % | |||||
Average interest rate during year | 1.32 | % | 1.23 | % | 0.86 | % | |||||
The Association has utilized borrowings from the FHLB of Cincinnati to manage its on-balance sheet liquidity, to replace maturing, high rate CDs at a lower cost and to lengthen the maturity of our funding through the use of interest rate swaps discussed in Note 17. Derivative Instruments of the Notes to Consolidated Financial Statements.
The following table sets forth information relating to a category of short-term borrowings for which the average balance outstanding during the period was at least 30% of shareholders' equity at the end of each period shown.
At or For the Fiscal Years Ended September 30, | |||||||||||
2017 | 2016 | 2015 | |||||||||
(Dollars in thousands) | |||||||||||
FHLB borrowings (30 days and under): | |||||||||||
Balance at end of year | $ | 1,110,000 | $ | 851,000 | $ | 755,000 | |||||
Maximum outstanding at any month-end | $ | 1,234,000 | $ | 851,000 | $ | 1,535,000 | |||||
Average balance during year | $ | 970,733 | $ | 678,883 | $ | 1,242,380 | |||||
Average interest rate during the fiscal year | 0.81 | % | 0.36 | % | 0.15 | % | |||||
Weighted average interest rate at end of year | 1.17 | % | 0.40 | % | 0.18 | % | |||||
During the 2015 fiscal year, the Association implemented a strategy to increase net income which involved borrowing, on an overnight basis, approximately $1.00 billion of additional funds from the FHLB at the beginning of a particular quarter and repaying it prior to the end of that quarter. The proceeds of the overnight borrowings, net of the required investment in FHLB stock, were deposited at the Federal Reserve. The strategy was not utilized at or during the fiscal years ended September 30, 2017, 2016, or 2015, however, dependent upon market rates, remains an option in the future.
Federal Taxation
General. The Company and the Association are subject to federal income taxation in the same general manner as other corporations, with certain exceptions. Prior to the completion of our initial public stock offering on April 20, 2007, the Company and the Association were included as part of Third Federal Savings, MHC’s consolidated tax group. However, upon completion of the offering, the Company and the Association were no longer a part of Third Federal Savings, MHC’s consolidated tax group because Third Federal Savings, MHC no longer owned at least 80% of the common stock of the Company. As a result of the Company's stock repurchase program over the past few years, which reduced the number of outstanding shares of the Company, at September 30, 2017, Third Federal Savings, MHC, owned 80.74% of the common stock of the Company and it is possible in the future for the Company and the Association, to once again, be a part of Third Federal Savings, MHC’s consolidated tax group. Beginning on September 30, 2007 and for each subsequent fiscal year thereafter, the Company has filed consolidated tax returns with the Association and Third Capital Inc., its wholly-owned subsidiaries. On November 27, 2012, the IRS completed an audit of the federal tax returns of the Company and its subsidiaries for fiscal years ended September 30, 2008, 2009 and 2010.
The following discussion of federal taxation is intended only to summarize certain pertinent federal income tax matters and is not a comprehensive description of the tax rules applicable to the Company or its subsidiaries.
Bad Debt Reserves. Historically, the Third Federal Savings, MHC consolidated group used the specific charge-off method to account for bad debt deductions for income tax purposes, and the Company has used and intends to use the specific charge off method to account for tax bad debt deductions in the future.
31
Taxable Distributions and Recapture. Prior to 1996, bad debt reserves created prior to 1988 were subject to recapture into taxable income if the Association failed to meet certain thrift asset and definitional tests or made certain distributions. Tax law changes in 1996 eliminated thrift-related recapture rules. However, under current law, pre-1988 tax bad debt reserves remain subject to recapture if the Association makes certain non-dividend distributions, repurchases any of its common stock, pays dividends in excess of earnings and profits, or fails to qualify as a bank for tax purposes.
At September 30, 2017, the total federal pre-base year bad debt reserve of the Association was approximately $105.0 million.
State Taxation
Following its initial public stock offering in 2007, the Company converted from a qualified passive investment company domiciled in the State of Delaware to a qualified holding company in Ohio. Through 2013, the Company was subject to Ohio tax levied on income and a significant majority of state taxes paid by the remaining entities in our corporate structure were also paid to the State of Ohio. The Association was subject to Ohio franchise tax based on equity capital reduced by certain exempted assets taxed at a rate of 1.3%. The other Ohio subsidiaries of the Company were taxed on the greater of a tax based on net income or net worth.
Effective January 1, 2014 for Ohio tax filings based on 2013 financial results, the Third Federal Savings, MHC consolidated group is subject to the Ohio Financial Institutions Tax. The Financial Institutions Tax is based on total equity capital apportioned to Ohio using a single gross receipts factor. Ohio equity capital is taxed at a three-tiered rate of 0.8% on the first $200 million, 0.4% on amounts greater than $200 million and less than or equal to $1.3 billion, and 0.25% on amounts greater than $1.3 billion.
On April 29, 2013, the State of Ohio Department of Taxation completed an audit of the Association's Ohio Franchise Tax Returns for fiscal years ended September 30, 2009, 2010 and 2011, which resulted in no adjustments.
SUPERVISION AND REGULATION
General
The Company is a savings and loan holding company, and is required to file certain reports with, is subject to examination by, and otherwise must comply with the rules and regulations of, the FRS. The Company is also subject to the rules and regulations of the Securities and Exchange Commission under the federal securities laws.
The Association is a federal savings association that is currently examined and supervised by the OCC and the CFPB, and is subject to examination by the FDIC. This regulation and supervision establishes a comprehensive framework of activities in which an institution may engage and is intended primarily for the protection of the FDIC’s deposit insurance fund and depositors. Under this system of federal regulation, financial institutions are periodically examined to ensure that they satisfy applicable standards with respect to their capital adequacy, assets, management, earnings, liquidity and sensitivity to market risk. Following completion of its examination, the federal agency critiques the institution’s operations and assigns its rating (known as an institution’s CAMELS rating). Under federal law, an institution may not disclose its CAMELS rating to the public. The Association also is a member of and owns stock in the FHLB of Cincinnati, which is one of the eleven regional banks in the FHLB System. The Association is also regulated to a lesser extent by the FRS, governing reserves to be maintained against deposits and other matters. The OCC will examine the Association and prepare reports for the consideration of the Association’s Board of Directors on any operating deficiencies. The CFPB, which is discussed further in the Dodd-Frank Act section that follows, has examination and enforcement authority over the Association. The Association’s relationship with its depositors and borrowers also is regulated to a great extent by federal law and, to a much lesser extent, state law, especially in matters concerning the ownership of deposit accounts and the form and content of the Association’s mortgage documents.
Any change in these laws or regulations, whether by the FDIC, OCC, FRS, CFPB or Congress, could have a material impact on the Company, the Association and their operations.
Certain statutes and regulations of the regulatory requirements that are applicable to the Association and the Company are described below. This description of statutes and regulations is not intended to be a complete explanation of such statutes and regulations and their effects on the Association and the Company, and is qualified in its entirety by reference to the actual statutes and regulations.
Dodd-Frank Act
The Dodd-Frank Wall Street Reform and Consumer Protection Act of 2010, has changed bank regulation and the lending, investment, trading and operating activities of depository institutions and their holding companies. The DFA eliminated our former primary federal regulator, the OTS, and required the Association to be regulated by the OCC (the primary federal
32
regulator for national banks). The DFA also authorized the FRS to supervise and regulate all savings and loan holding companies, including mutual holding companies and their mid-tier holding companies, like Third Federal Savings, MHC and the Company, in addition to bank holding companies that the FRS already regulated. Third Federal Savings, MHC requires the non-objection of the FRS before it may waive the receipt of any dividends from the Company under the standards specified in the DFA and implementing FRS regulations. The DFA also required the FRS to set minimum capital levels for depository institution holding companies that are as stringent as those required for the insured depository subsidiaries with the components of Tier 1 capital restricted to capital instruments that are currently considered to be Tier 1 capital for insured depository institutions. The legislation also established a floor for capital of insured depository institutions that cannot be lower than the standards in effect on July 21, 2010, and directed the federal banking regulators to implement new leverage and capital requirements within 18 months from the enactment of the DFA that take into account off-balance sheet activities and other risks, including risks relating to securitized products and derivatives. A final rule implementing these requirements was effective January 1, 2015.
The DFA also created the CFPB with substantial power to supervise and enforce consumer protection laws. The CFPB has broad rulemaking authority for a wide range of consumer protection laws that apply to all banks and savings institutions such as the Association, including the authority to prohibit “unfair, deceptive or abusive” acts and practices. The CFPB has examination and enforcement authority over all banks and savings institutions with more than $10 billion in assets. Banks and savings institutions with $10 billion or less in assets are examined by their applicable federal bank regulators. The banking agencies used June 30, 2011 financial information for purposes of initially determining CFPB authority. Since the Association had more than $10 billion of total assets on that date, it is subject to CFPB examination and enforcement authority. The legislation also weakened the federal preemption available for national banks and federal savings associations, and gives state attorneys general the ability to enforce applicable federal consumer protection laws.
The legislation broadened the base for FDIC insurance assessments. Assessments are now based on the average consolidated total assets less tangible equity capital of a financial institution. The DFA also permanently increased the maximum amount of deposit insurance for banks, savings institutions and credit unions to $250,000 per depositor, retroactive to January 1, 2008, and non-interest bearing transaction accounts had unlimited deposit insurance through December 31, 2012. The DFA increased stockholder influence over boards of directors by requiring companies to give stockholders a non-binding vote on executive compensation and so-called “golden parachute” payments. The legislation also directed the FRS to promulgate rules prohibiting excessive compensation paid to bank holding company executives, regardless of whether the company is publicly traded. The DFA provided for originators of certain securitized loans to retain a percentage of the risk for transferred loans, directed the FRS to regulate pricing of certain debit card interchange fees and contained a number of reforms related to mortgage origination. Many of the provisions of the DFA have delayed effective dates and the legislation requires various federal agencies to promulgate numerous and extensive implementing regulations. Although the full impact of these regulations cannot be completely determined at this time, it is expected that the legislation and implementing regulations has and will continue to increase our operating and compliance costs.
Federal Banking Regulation
Business Activities. A federal savings association derives its lending and investment powers from the Home Owners’ Loan Act, as amended, and federal regulations. Under these laws and regulations, the Association may invest in mortgage loans secured by residential real estate without limitations as a percentage of assets, and may invest in non-residential real estate loans up to 400% of capital in the aggregate. The Association may also invest in commercial business loans up to 20% of assets in the aggregate and consumer loans up to 35% of assets in the aggregate, and in certain types of debt securities and certain other assets. An association may also establish subsidiaries that may engage in certain activities not otherwise permissible for an association, including real estate investment and securities and insurance brokerage.
Capital Requirements. Federal regulations require FDIC insured depository institutions to meet several minimum capital standards: a common equity Tier 1 capital to risk-based assets ratio, a Tier 1 capital to risk-based assets ratio, a total capital to risk-based assets ratio, and a Tier 1 capital to total assets leverage ratio. The existing capital requirements were effective January 1, 2015 and are the result of a final rule implementing regulatory amendments based on recommendations of the Basel Committee on Banking Supervision and certain requirements of the DFA.
The capital standards require the maintenance of common equity Tier 1 capital, Tier 1 capital and total capital to risk-weighted assets of at least 4.5%, 6% and 8%, respectively, and a leverage ratio of at least 4% Tier 1 capital. Common equity Tier 1 capital is generally defined as common stockholders’ equity and retained earnings. Tier 1 capital is generally defined as common equity Tier 1 and additional Tier 1 capital. Additional Tier 1 capital includes certain noncumulative perpetual preferred stock and related surplus and minority interests in equity accounts of consolidated subsidiaries. Total capital includes Tier 1 capital (common equity Tier 1 capital plus additional Tier 1 capital) and Tier 2 capital. Tier 2 capital is comprised of capital instruments and related surplus, meeting specified requirements, and may include cumulative preferred stock and long-
33
term perpetual preferred stock, mandatory convertible securities, intermediate preferred stock and subordinated debt. Also included in Tier 2 capital is the allowance for loan and lease losses limited to a maximum of 1.25% of risk-weighted assets and, for institutions that have exercised an opt-out election regarding the treatment of Accumulated Other Comprehensive Income (“AOCI”), up to 45% of net unrealized gains on available-for-sale equity securities with readily determinable fair market values. Institutions that have not exercised the AOCI opt-out have AOCI incorporated into common equity Tier 1 capital (including unrealized gains and losses on available-for-sale-securities). The Association exercised its opt-out election during the first quarter of calendar 2015. Calculation of all types of regulatory capital is subject to deductions and adjustments specified in the regulations.
In determining the amount of risk-weighted assets for purposes of calculating risk-based capital ratios, all assets, including certain off-balance sheet assets (e.g., recourse obligations, direct credit substitutes, residual interests) are multiplied by a risk weight factor assigned by the regulations based on the risks believed inherent in the type of asset. Higher levels of capital are required for asset categories believed to present greater risk. For example, a risk weight of 0% is assigned to cash and U.S. government securities, a risk weight of 50% is generally assigned to prudently underwritten first lien one to four- family residential mortgages, a risk weight of 100% is assigned to commercial and consumer loans, a risk weight of 150% is assigned to certain past due loans and a risk weight of between 0% to 600% is assigned to permissible equity interests, depending on certain specified factors.
Federal savings associations must also meet a statutory “tangible capital” standard of 1.5% of total adjusted assets. Tangible capital is generally defined as Tier 1 capital less intangible assets other than certain mortgage servicing rights.
In addition to establishing the minimum regulatory capital requirements, the regulations limit capital distributions and certain discretionary bonus payments to management if the institution does not hold a “capital conservation buffer” consisting of 2.5% in addition to the minimum capital requirements. The capital conservation buffer requirement is being phased in beginning January 1, 2016 at 0.625% of risk-weighted assets and increasing each year until fully implemented at 2.5% on January 1, 2019. At September 30, 2017, the Association exceeded the fully phased in regulatory requirement for the "capital conservation buffer". In assessing an institution’s capital adequacy, the OCC takes into consideration, not only these numeric factors, but qualitative factors as well, and has the authority to establish higher capital requirements for individual institutions where deemed necessary. As presented in Note 3. Regulatory Matters, at September 30, 2017, the Association exceeded all regulatory capital requirements to be considered “Well Capitalized”.
Loans-to-One Borrower. Generally, a federal savings association may not make a loan or extend credit to a single or related group of borrowers in excess of 15% of unimpaired capital and surplus. An additional amount may be loaned, equal to 10% of unimpaired capital and surplus, if the loan is secured by readily marketable collateral, which generally does not include real estate. As of September 30, 2017, the Association was in compliance with the loans-to-one borrower limitations.
Qualified Thrift Lender Test. As a federal savings association, the Association must satisfy the qualified thrift lender test. Under the QTL test, the Association must maintain at least 65% of its “portfolio assets” in “qualified thrift investments” (primarily residential mortgages and related investments, including mortgage-backed securities) in at least nine months of the most recent 12-month period. “Portfolio assets” generally means total assets of a savings institution, less the sum of specified liquid assets up to 20% of total assets, goodwill and other intangible assets, and the value of property used in the conduct of the savings association’s business.
The Association also may satisfy the QTL test by qualifying as a “domestic building and loan association” as defined in the Internal Revenue Code.
A savings association that fails the qualified thrift lender test must operate under specified restrictions. Under the DFA, non-compliance with the QTL test may subject the Association to agency enforcement action for a violation of law. At September 30, 2017, the Association satisfied the QTL test.
Capital Distributions. Federal regulations govern capital distributions by a federal savings association, which include cash dividends, stock repurchases and other transactions charged to the capital account. A federal savings association must file an application with the OCC and the FRS for approval of a capital distribution if:
• | the total capital distributions for the applicable calendar year exceed the sum of the savings association’s net income for that year to date plus the savings association’s retained net income for the preceding two years; |
• | the savings association would not be at least adequately capitalized following the distribution; |
• | the distribution would violate any applicable statute, regulation, agreement or condition imposed by a regulator; or |
• | the savings association is not eligible for expedited treatment of its filings. |
34
Even if an application is not otherwise required, every savings association that is a subsidiary of a holding company must still file a notice with the FRS at least 30 days before the board of directors declares a dividend or approves a capital distribution.
The OCC and the FRS have established similar criteria for approving an application or notice, and may disapprove an application or notice if:
•the savings association would be undercapitalized following the distribution;
•the proposed capital distribution raises safety and soundness concerns; or
•the capital distribution would violate a prohibition contained in any statute, regulation or agreement.
In addition, the Federal Deposit Insurance Act provides that an insured depository institution may not make any capital distribution, if the institution would be undercapitalized after the distribution.
The Association, in compliance with the preceding requirements, paid an $81 million, a $60 million and a $66 million cash dividend to the Company during the fiscal years ending September 30, 2017, 2016 and 2015, respectively. There were no dividends paid to the Company by Third Capital during the fiscal years ended September 30, 2017, 2016 or 2015. Additionally, the Association paid a special dividend of $150 million to the Company in the fiscal year ended September 30, 2016. This amount was equal to the voluntary contribution of capital that the Company made to the Association in October 2010.
The Company's sixth stock repurchase program, for the repurchase of 10,000,000 shares of its equity stock, was announced on September 9, 2014 and completed August 3, 2015. The seventh stock repurchase program, for 10,000,000 shares, was announced on July 30, 2015 and completed January 6, 2017. The eighth stock repurchase program, also for 10,000,000 shares, was announced on October 27, 2016 and began on January 6, 2017.
Under current FRS regulations, Third Federal Savings, MHC is required to obtain the approval of its members (depositors and certain loan customers of the Association) every 12 months to enable Third Federal Savings, MHC to waive its right to receive dividends on the Company’s common stock that Third Federal Savings, MHC owns. Third Federal Savings, MHC has received this approval of its members at meetings held July 19, 2017, July 26, 2016, August 5, 2015 and July 31, 2014. Third Federal Savings, MHC has the approval to waive the receipt of up to a total of $0.68 per share of dividends from the Company over the four quarterly periods ending June 30, 2018. Third Federal Savings, MHC waived its right to receive a $0.17 per share dividend payment on September 25, 2017. As a result of the 2016, 2015 and 2014 approvals, Third Federal Savings, MHC previously waived its right to receive four separate $0.125 per share dividend payments during the four quarterly periods ending June 30, 2017, four separate $0.10 per share dividend payments during the four quarterly periods ending June 30, 2016 and four separate $0.07 per share dividend payments during the four quarterly periods ending June 30, 2015.
Liquidity. A federal savings association is required to maintain a sufficient amount of liquid assets to ensure its safe and sound operation.
Community Reinvestment Act and Fair Lending Laws. All savings associations have a responsibility under the Community Reinvestment Act and federal regulations to help meet the credit needs of their communities, including low- and moderate-income neighborhoods. In connection with its examination of a federal savings association, the OCC is required to assess the savings association’s record of compliance with the Community Reinvestment Act. In addition, the Equal Credit Opportunity Act and the Fair Housing Act prohibit lenders from discriminating in their lending practices on the basis of characteristics specified in those statutes. A savings association’s failure to comply with the provisions of the Community Reinvestment Act could, at a minimum, result in denial of certain corporate applications such as branches or mergers, or in restrictions on its activities. The failure to comply with the Equal Credit Opportunity Act and the Fair Housing Act could result in enforcement actions by the OCC, as well as other federal regulatory agencies and the Department of Justice.
The Association received a satisfactory Community Reinvestment Act rating in its most recent federal examination.
Transactions with Related Parties. A federal savings association’s authority to engage in transactions with its affiliates is limited by FRS regulations and by Sections 23A and 23B of the FRS Act and its implementing Regulation W. An affiliate is a company that controls, is controlled by, or is under common control with an insured depository institution such as the Association. Third Federal Savings, MHC and the Company are affiliates of the Association. In general, loan transactions between an insured depository institution and its affiliates are subject to certain quantitative and collateral requirements. In this regard, transactions between an insured depository institution and its affiliates are limited to 10% of the institution’s unimpaired capital and unimpaired surplus for transactions with any one affiliate and 20% of unimpaired capital and unimpaired surplus for transactions in the aggregate with all affiliates. Collateral in specified amounts ranging from 100% to 130% of the amount of the transaction must be provided by affiliates in order to receive loans from the savings association. In
35
addition, federal regulations prohibit a savings association from lending to any of its affiliates that are engaged in activities that are not permissible for bank holding companies and from purchasing the securities of any affiliate, other than a subsidiary. Finally, transactions with affiliates must be consistent with safe and sound banking practices, not involve low-quality assets and be on terms that are as favorable to the institution as comparable transactions with non-affiliates. Savings associations are required to maintain detailed records of all transactions with affiliates.
The Association’s authority to extend credit to its directors, executive officers and 10% shareholders, as well as to entities controlled by such persons, is currently governed by the requirements of Sections 22(g) and 22(h) of the FRS Act and Regulation O of the FRS. Among other things, these provisions require that extensions of credit to insiders:
(i) | are subject to certain exceptions for loan programs made available to all employees, be made on terms that are substantially the same as, and follow credit underwriting procedures that are not less stringent than, those prevailing for comparable transactions with unaffiliated persons and that do not involve more than the normal risk of repayment or present other unfavorable features; and |
(ii) | do not exceed certain limitations on the amount of credit extended to such persons, individually and in the aggregate, which limits are based, in part, on the amount of the Association’s capital. |
In addition, extensions of credit in excess of certain limits must be approved by the Association’s Board of Directors.
Enforcement. The OCC has primary enforcement responsibility over federal savings institutions and has the authority to bring enforcement action against all “institution-affiliated parties,” including shareholders, attorneys, appraisers and accountants who knowingly or recklessly participate in wrongful action likely to have an adverse effect on an insured institution. Formal enforcement action by the OCC may range from the issuance of a capital directive or cease and desist order, to removal of officers and/or directors of the institution and the appointment of a receiver or conservator. Civil penalties cover a wide range of violations and actions, and range up to $25,000 per day, unless a finding of reckless disregard is made, in which case penalties may be as high as $1 million per day. The FDIC also has the authority to terminate deposit insurance or to recommend to the OCC that enforcement action be taken with respect to a particular savings institution. If action is not taken by the OCC, the FDIC has authority to take action under specified circumstances.
Standards for Safety and Soundness. Federal law requires each federal banking agency to prescribe certain standards for all insured depository institutions. These standards relate to, among other things, internal controls, information systems, audit systems, loan documentation, credit underwriting, interest rate risk exposure, asset growth, compensation, and other operational and managerial standards as the agency deems appropriate. The federal banking agencies adopted Interagency Guidelines Prescribing Standards for Safety and Soundness to implement the safety and soundness standards required under federal law. The guidelines set forth the safety and soundness standards that the federal banking agencies use to identify and address problems at insured depository institutions before capital becomes impaired. If the appropriate federal banking agency determines that an institution fails to meet any standard prescribed by the guidelines, the agency may require the institution to submit to the agency an acceptable plan to achieve compliance with the standard. If an institution fails to meet these standards, the appropriate federal banking agency may require the institution to submit a compliance plan.
Prompt Corrective Action Regulations. Under the prompt corrective action regulations, the OCC is required and authorized to take supervisory actions against undercapitalized savings associations. For this purpose, a savings association is placed in one of the following five categories based on the savings association’s capital:
• | well-capitalized (at least 5% leverage capital, 8% Tier 1 risk-based capital, 10% total risk-based capital, and 6.5% common equity Tier 1 ratios and is not subject to any written agreement, order, capital directive or prompt corrective action directive issued under certain statutes and regulations, to maintain a specific capital level for any capital measure); |
• | adequately capitalized (at least 4% leverage capital, 6% Tier 1 risk-based capital, 8% total risk-based capital and 4.5% common equity Tier 1 ratios); |
• | undercapitalized (less than 4% leverage capital, 6% Tier 1 risk-based capital, 8% total risk-based capital, or 4.5% common equity Tier 1 ratios); |
• | significantly undercapitalized (less than 3% leverage capital, 4% Tier 1 risk-based capital, 6% total risk-based capital or 3% common equity Tier 1 ratios); and |
• | critically undercapitalized (less than 2% tangible capital to total assets). |
The final rule that strengthened regulatory capital requirements adjusted the prompt corrective actions categories to incorporate the new standards, as reflected above.
36
Generally, the banking regulator is required to appoint a receiver or conservator for a savings association that is “critically undercapitalized” within specific time frames. The regulations also provide that a capital restoration plan must be filed with the OCC within 45 days of the date a savings association receives notice that it is “undercapitalized,” “significantly undercapitalized” or “critically undercapitalized.” The criteria for an acceptable capital restoration plan include, among other things, the establishment of the methodology and assumptions for attaining adequately capitalized status on an annual basis, procedures for ensuring compliance with restrictions imposed by applicable federal regulations, the identification of the types and levels of activities the savings association will engage in while the capital restoration plan is in effect, and assurances that the capital restoration plan will not appreciably increase the current risk profile of the savings association. Any holding company for a savings association required to submit a capital restoration plan must guarantee the lesser of an amount equal to 5% of the savings association’s assets at the time it was notified or deemed to be undercapitalized by the OCC, or the amount necessary to restore the savings association to adequately capitalized status. This guarantee remains in place until the OCC notifies the savings association that it has maintained adequately capitalized status for each of four consecutive calendar quarters, and the OCC has the authority to require payment and collect payment under the guarantee. Failure by a holding company to provide the required guarantee will result in certain operating restrictions on the savings association, such as restrictions on the ability to declare and pay dividends, pay executive compensation and management fees, and increase assets or expand operations. The OCC may also take any one of a number of discretionary supervisory actions against undercapitalized associations, including the issuance of a capital directive and the replacement of senior executive officers and directors.
As of September 30, 2017 the Association exceeded all regulatory requirements to be considered “Well Capitalized” as presented in the table below (dollar amounts in thousands).
Actual | Required (Well Capitalized) | ||||||||||||
Amount | Ratio | Amount | Ratio | ||||||||||
Total Capital to Risk Weighted Assets | $ | 1,555,903 | 21.37 | % | $ | 728,192 | 10.00 | % | |||||
Tier 1 (Leverage) Capital to Net Average Assets | 1,506,952 | 11.16 | % | 675,242 | 5.00 | % | |||||||
Tier I Capital to Risk-Weighted Assets | 1,506,952 | 20.69 | % | 582,553 | 8.00 | % | |||||||
Common Equity Tier I to Risk-Weighted Assets | 1,506,938 | 20.69 | % | 473,325 | 6.50 | % | |||||||
Insurance of Deposit Accounts. The DFA permanently increased the maximum amount of deposit insurance for banks, savings institutions and credit unions to $250,000 per depositor, retroactive to January 1, 2008.
Effective April 1, 2011, the FDIC implemented a requirement of the DFA to revise its assessment system to base the assessments on each institution’s total assets less Tier 1 capital, instead of deposits. The FDIC also revised its assessment schedule so that it ranged from 2.5 basis points for the least risky institutions to 45 basis points for the riskiest. Institutions with over $10 billion of total assets, such as the Association, are classified for assessment purposes as "Large Institutions", and unless otherwise classified, are subjected to a large institution pricing system that includes a separate “scorecard” methodology, also adopted in 2011. In conjunction with the FDIC Deposit Insurance Fund’s reserve ratio reaching 1.15%, the assessment range was lowered to 1.5 to 40 basis points, effective July 1, 2016. In addition, “Large Institutions” (those with assets of $10 billion or more) will now be assessed a surcharge required by the DFA until the earlier of the Deposit Insurance Fund reaching 1.35% or December 31, 2018. The surcharge is 4.5 basis points of the Large Institution’s “surcharge base,” which is generally its regular assessment base reduced by $10 billion. The FDIC has indicated that it expects that the surcharges will be sufficient to achieve the 1.35% ratio by December 31, 2018. However, in the event that ratio is not achieved by that date, Large Institutions will be required to pay a short-fall assessment during the first half of 2019.
Insurance of deposits may be terminated by the FDIC upon a finding that an institution has engaged in unsafe or unsound practices, is in an unsafe or unsound condition to continue operations or has violated any applicable law, regulation, rule, order or condition imposed by the FDIC. The Association does not believe that it is taking, or is subject to, any action, condition or violation that could lead to termination of its deposit insurance.
All FDIC-insured institutions are required to pay a pro rata portion of the interest due on obligations issued by the FICO for anticipated payments, issuance costs and custodial fees on bonds issued by the FICO in the 1980s to recapitalize the Federal Savings and Loan Insurance Corporation. The bonds issued by the FICO are due to mature in 2017 through 2019. For the quarter ended September 30, 2017, the annualized FICO assessment was equal to 0.54 basis points of total assets less Tier 1 capital.
37
For the fiscal year ended September 30, 2017, the Association paid $629 thousand related to the FICO bonds and $7.2 million, applicable to deposit insurance assessments. The deposit insurance payments are assessed on an arrears basis. At September 30, 2017, the balance of the Association's accrued deposit insurance assessment was $1.9 million.
Prohibitions Against Tying Arrangements. Federal savings associations are prohibited, subject to some exceptions, from extending credit to or offering any other service, or fixing or varying the consideration for such extension of credit or service, on the condition that the customer obtain some additional service from the institution or its affiliates or not obtain services of a competitor of the institution.
Federal Home Loan Bank System. The Association is a member of the FHLB System, which consists of 11 regional FHLBs. The FHLB System provides a central credit facility primarily for member institutions. As a member of the FHLB of Cincinnati, the Association is required to acquire and hold shares of capital stock in the FHLB.
As of September 30, 2017, outstanding borrowings (including accrued interest) from the FHLB of Cincinnati were $3.67 billion and the Association was in compliance with the stock investment requirement.
Other Regulations
Interest and other charges collected or contracted for by the Association are subject to state usury laws and federal laws concerning interest rates. The Association’s operations are also subject to federal laws applicable to credit transactions, such as the:
• | Truth-In-Lending Act, governing disclosures of credit terms to consumer borrowers; |
• | Home Mortgage Disclosure Act, requiring financial institutions to provide information to enable the public and public officials to determine whether a financial institution is fulfilling its obligation to help meet the housing needs of the community it serves; |
• | Equal Credit Opportunity Act, prohibiting discrimination on the basis of race, creed or other prohibited factors in extending credit; |
• | Fair Credit Reporting Act, governing the use and provision of information to credit reporting agencies; |
• | Fair Debt Collection Act, governing the manner in which consumer debts may be collected by collection agencies; and |
• | rules and regulations of the various federal agencies charged with the responsibility of implementing such federal laws. |
The operations of the Association also are subject to:
• | The Right to Financial Privacy Act, which imposes a duty to maintain confidentiality of consumer financial records and prescribes procedures for complying with administrative subpoenas of financial records; |
• | The Electronic Funds Transfer Act and Regulation E promulgated thereunder, which govern automatic deposits to and withdrawals from deposit accounts and customers’ rights and liabilities arising from the use of automated teller machines and other electronic banking services; |
• | The Check Clearing for the 21st Century Act (also known as “Check 21”), which gives “substitute checks,” such as digital check images and copies made from those images, the same legal standing as the original paper check; |
• | Title III of The Uniting and Strengthening America by Providing Appropriate Tools Required to Intercept and Obstruct Terrorism Act of 2001 (referred to as the “USA PATRIOT Act”), which significantly expanded the responsibilities of financial institutions, including savings associations, in preventing the use of the U.S. financial system to fund terrorist activities. Among other provisions, the USA PATRIOT Act and the related regulations of the OCC require savings associations operating in the United States to develop new anti-money laundering compliance programs, due diligence policies and controls to ensure the detection and reporting of money laundering. Such compliance programs are intended to supplement existing compliance requirements, also applicable to financial institutions, under the Bank Secrecy Act and the Office of Foreign Assets Control Regulations; and |
• | The Gramm-Leach-Bliley Act, which placed limitations on the sharing of consumer financial information by financial institutions with unaffiliated third parties. Specifically, the Gramm-Leach-Bliley Act requires all financial institutions offering financial products or services to retail customers to provide such customers with the financial institution’s privacy policy and provide such customers the opportunity to “opt out” of the sharing of certain personal financial information with unaffiliated third parties. |
38
Holding Company Regulation
General. Third Federal Savings, MHC, and the Company are non-diversified savings and loan holding companies within the meaning of the Home Owners’ Loan Act. As such, Third Federal Savings, MHC and the Company are registered with the FRS and subject to FRS regulations, examinations, supervision and reporting requirements. In addition, the FRS has enforcement authority over Third Federal Savings, MHC, the Company and the Association. Among other things, this authority permits the FRS to restrict or prohibit activities that are determined to be a serious risk to the Association. As federal corporations, Third Federal Savings, MHC and the Company are generally not subject to state business organization laws.
Permitted Activities. Pursuant to Section 10(o) of the Home Owners’ Loan Act and FRS regulations, a mutual holding company, such as Third Federal Savings, MHC and its mid-tier companies, such as the Company, may, with appropriate regulatory approval, engage in the following activities:
(i) | investing in the stock of a savings association; |
(ii) | acquiring a mutual association through the merger of such association into a savings association subsidiary of such holding company or an interim savings association subsidiary of such holding company; |
(iii) | merging with or acquiring another holding company, one of whose subsidiaries is a savings association; |
(iv) | investing in a corporation, the capital stock of which is available for purchase by a savings association under federal law or under the law of any state where the subsidiary savings association has its home offices; |
(v) | furnishing or performing management services for a savings association subsidiary of such company; |
(vi) | holding, managing or liquidating assets owned or acquired from a savings association subsidiary of such company; |
(vii) | holding or managing properties used or occupied by a savings association subsidiary of such company; |
(viii) | acting as trustee under deeds of trust; |
(ix) | any other activity: |
(A) that the FRS, by regulation, has determined to be permissible for bank holding companies under Section 4(c) of the Bank Holding Company Act of 1956, unless the FRS, by regulation, prohibits or limits any such activity for savings and loan holding companies; or
(B) in which multiple savings and loan holding companies were authorized (by regulation) to directly engage on March 5, 1987;
(x) if the savings and loan holding company meets the criteria to qualify as a financial holding company, any activity permissible for financial holding companies under Section 4(k) of the Bank Holding Company Act, including securities and insurance underwriting; and
(xi) purchasing, holding, or disposing of stock acquired in connection with a qualified stock issuance if the purchase of such stock by such savings and loan holding company is approved by the FRS. If a mutual holding company acquires or merges with another holding company, the holding company acquired or the holding company resulting from such merger or acquisition may only invest in assets and engage in activities listed in (i) through (x) above, and has a period of two years to cease any nonconforming activities and divest any nonconforming investments.
The Home Owners’ Loan Act prohibits a savings and loan holding company, including the Company, directly or indirectly, or through one or more subsidiaries, from acquiring more than 5% of another savings institution or holding company thereof, without prior written approval of the FRS. It also prohibits the acquisition or retention of, with certain exceptions, more than 5% of a non-subsidiary company engaged in activities other than those permitted by the Home Owners’ Loan Act or acquiring or retaining control of an institution that is not federally insured. In evaluating applications by holding companies to acquire savings institutions, the FRS must consider the financial and managerial resources, future prospects of the company and institution involved, the effect of the acquisition on the risk to the federal deposit insurance fund, the convenience and needs of the community and competitive factors.
The FRS is prohibited from approving any acquisition that would result in a multiple savings and loan holding company controlling savings institutions in more than one state, subject to two exceptions:
(i) | the approval of interstate supervisory acquisitions by savings and loan holding companies; and |
(ii) | the acquisition of a savings institution in another state if the laws of the state of the target savings institution specifically permit such acquisition. |
The states vary in the extent to which they permit interstate savings and loan holding company acquisitions.
39
Capital. Savings and loan holding companies were historically not subject to specific regulatory capital requirements. The DFA, however, required the FRS to promulgate consolidated capital requirements for depository institution holding companies that are no less stringent, both quantitatively and in terms of components of capital, than those applicable to depository institutions themselves. Instruments such as cumulative preferred stock and trust preferred securities can no longer be included as Tier 1 capital, as was previously permitted for bank holding companies.
The previously discussed final rule regarding regulatory capital requirements implements the DFA’s directive as to savings and loan holding companies. Consolidated regulatory capital requirements identical to those applicable to the subsidiary depository institutions generally applied to savings and loan holding companies as of January 1, 2015. As is the case with institutions themselves, the capital conservation buffer is being phased in between 2016 and 2019.
Dividends and Repurchases. The FRS has issued a policy statement regarding the payment of dividends and the repurchase of shares of common stock by bank holding companies that it has made applicable to savings and loan holding companies as well. In general, the policy provides that dividends should be paid only out of current earnings and only if the prospective rate of earnings retention by the holding company appears consistent with the organization's capital needs, asset quality and overall financial condition. Regulatory guidance provides for prior regulatory review of capital distributions in certain circumstances such as where the company's net income for the past four quarters, net of dividends previously paid over that period, is insufficient to fully fund the dividend or the company's overall rate of earnings retention is inconsistent with the company's capital needs and overall financial condition. The ability of a holding company to pay dividends may be restricted if a subsidiary bank becomes undercapitalized. The policy statement also provides for regulatory review prior to a holding company redeeming or repurchasing regulatory capital instruments when the holding company is experiencing financial weaknesses or redeeming or repurchasing common stock or perpetual preferred stock that would result in a net reduction as of the end of a quarter in the amount of such equity instruments outstanding compared with the beginning of the quarter in which the redemption or repurchase occurred. These regulatory policies could affect the ability of the Company to pay dividends, repurchase shares of common stock or otherwise engage in capital distributions.
Source of Strength. The DFA extended the “source of strength” doctrine, which has traditionally been applicable to bank holding companies, to savings and loan holding companies as well. The FRS has issued regulations requiring that all savings and loan holding companies serve as a source of strength to their subsidiary depository institutions by providing capital, liquidity and other support in times of financial stress.
Waivers of Dividends by Third Federal Savings, MHC. Federal regulations require Third Federal Savings, MHC to notify the FRS of any proposed waiver of its receipt of dividends from the Company. The OTS, the previous regulator for Third Federal Savings, MHC, allowed dividend waivers provided the mutual holding company’s Board of Directors determined that the waiver was consistent with its fiduciary duties and the waiver would not be detrimental to the safety and soundness of its subsidiary institution. In February 2008, the Company declared its first quarterly dividend and continued to declare and pay quarterly dividends through May 2010, when the Company suspended future dividend payments until concerns expressed by the OTS regarding the Association’s home equity line of credit portfolio were satisfactorily resolved. Prior to the suspension of the dividends, Third Federal Savings, MHC waived its right to receive each dividend paid by the Company. Section 625(a) of DFA preserved, for mutual holding companies, including Third Federal Savings, MHC, that had reorganized into mutual holding company form, issued minority stock and waived dividends prior to December 1, 2009, the right to waive dividends if the waiver was not detrimental to the safe and sound operation of the savings association and the board of directors expressly determines that the waiver is consistent with the fiduciary duties of the board to the mutual members of the mutual holding company. However, on August 12, 2011, the FRS issued an interim final rule that added a requirement that a majority of the mutual holding company’s members eligible to vote must approve a dividend waiver by a mutual holding company within 12 months prior to the declaration of the dividend being waived. The FRS is reviewing comments on the interim final rule, which were required to be submitted by November 1, 2011, as part of its rulemaking process, and there can be no assurance that the final rule will not require such a member vote. On July 19, 2017, Third Federal Savings, MHC received the approval of its members (depositors and certain loan customers of the Association) with respect to the waiver of dividends, and subsequently received the non-objection of the FRB-Cleveland, to waive receipt of dividends on the Company’s common stock the MHC owns up to a total of $0.68 per share during the four quarterly periods ending June 30, 2018. Third Federal Savings, MHC previously received the approval of its members at: (1) a July 26, 2016 meeting to waive receipt of dividends up to a total of $0.50 per share during the four quarterly periods ending June 30, 2017: (2) an August 5, 2015 meeting to waive receipt of dividends up to $0.40 per share during the four quarterly periods ending June 30, 2016; and (3) a July 31, 2014 meeting to waive receipt of dividends up to $0.28 per share during the four quarterly periods ending June 30, 2015.
Conversion of Third Federal Savings, MHC to Stock Form. Federal regulations permit Third Federal Savings, MHC to convert from the mutual form of organization to the capital stock form of organization (a “Conversion Transaction”). There can be no assurance when, if ever, a Conversion Transaction will occur, and the Board of Directors has no current intention or plan to undertake a Conversion Transaction. In a Conversion Transaction, a new stock holding company would be formed as the
40
successor to the Company, Third Federal Savings, MHC’s corporate existence would end, and certain depositors of the Association would receive the right to subscribe for additional shares of common stock of the new holding company. In a Conversion Transaction, each share of common stock held by stockholders other than Third Federal Savings, MHC (“Minority Stockholders”) would be automatically converted into a number of shares of common stock of the new holding company determined pursuant to an exchange ratio that ensures that Minority Stockholders own the same percentage of common stock in the new holding company as they owned in the Company immediately prior to the Conversion Transaction. Under a provision of the DFA applicable to Third Federal Savings, MHC, Minority Stockholders should not be diluted because of any dividends waived by Third Federal Savings, MHC (and waived dividends should not be considered in determining an appropriate exchange ratio), in the event Third Federal Savings, MHC converts to stock form. Any such Conversion Transaction would require various member and stockholder approvals, as well as regulatory approval.
Sarbanes-Oxley Act of 2002
The Sarbanes-Oxley Act of 2002 and related regulations address, among other issues, corporate governance, auditing and accounting, executive compensation, and enhanced and timely disclosure of corporate information. We have prepared policies, procedures and systems designed to ensure compliance with these regulations.
41
Item 1A. | Risk Factors |
Future changes in interest rates could reduce our net income.
Our net income largely depends on our net interest income, which could be negatively affected by changes in interest rates. Net interest income is the difference between the interest income we earn on our interest-earning assets, such as loans and securities, and the interest we pay on our interest-bearing liabilities, such as deposits and borrowings.
The vast majority of our assets and liabilities are financial in nature, and as a result, changes in market and competitive interest rates can impact our customers’ actions as well as the types and amount of business opportunities that are available to us. In general, when changes occur in interest rates that prompt our existing customers to pursue strategies that are beneficial to them, the results are generally unfavorable for us.
Generally, in a period of rising interest rates, the interest income earned on our assets may not increase as rapidly as the interest paid on our liabilities because, like many savings institutions, our liabilities generally have shorter contractual maturities than our assets. An example of this occurs when, interest rates paid on certificates of deposit experience a significant increase. In this circumstance, a CD customer may determine that it is in his/her best interest to incur the existing penalty for early withdrawal, tender the certificate for cash and either reinvest the proceeds in a new CD with us, or withdraw the funds and leave us. As a result, we either establish a new, higher rate certificate (if the customer stays with us) or we must fund the customer’s withdrawal by: (1) reducing our cash reserves; (2) selling assets to generate cash to fund the withdrawal; (3) attracting deposits from another customer at the then-higher interest rate; or (4) borrowing from a wholesale lender like the FHLB of Cincinnati, again at the then-higher interest rate. Each of these alternatives can have an unfavorable impact on us.
As another example of changes in interest rates that can have an unfavorable impact on our net interest income, if mortgage interest rates decline, our customers may seek to refinance, without penalty, their mortgage loans with us or repay their mortgage loans with us and borrow from another lender. When that happens, either the yield that we earn on the customer’s loan is reduced (if the customer refinances with us) or the mortgage is paid off and we are faced with the challenge of reinvesting the cash received to repay the mortgage in a lower interest rate environment. This is frequently referred to as reinvestment risk, which is the risk that we may not be able to reinvest the proceeds of loan prepayments at rates that are comparable to the rates we earned on the loans prior to receipt of the repayment. Reinvestment risk also exists with the securities in our investment portfolio that are backed by mortgage loans.
Our net interest income can also be negatively impacted when assets and funding sources with seemingly similar, but not identical re-pricing characteristics react differently to changing interest rates. An example is our home equity lines of credit loan portfolio and our high yield checking and high yield savings deposit products. Interest rates charged on our home equity lines of credit loans are linked to the prime rate of interest, which generally adjusts in a direct relationship to changes in the FRS’s Federal Funds target rate. Similarly, our High Yield Checking and High Yield Savings deposit products are generally expected to adjust when changes are made to the Federal Funds target rate. However, to the extent that increases or decreases are made to the Federal Funds target rate, and those increases or decreases translate into increases or decreases of the prime rate and the rate charged on our home equity lines of credit loans, but do not extend to equivalent adjustments to our High Yield Checking and High Yield Savings deposit products, we can experience a reduction in our net interest income. At September 30, 2017, we held $1.46 billion of home equity lines of credit loans and $2.27 billion of High Yield Checking and High Yield Savings deposits.
Our net income can also be reduced by the impact that changes in interest rates can have on the value of our capitalized mortgage servicing rights. As of September 30, 2017, we serviced $1.85 billion of loans sold to third parties, and the mortgage servicing rights associated with such loans had an amortized cost of $8.4 million and an estimated fair value, at that date, of $16.1 million. Because the estimated life and estimated income to be derived from servicing the underlying mortgage loans generally increase with rising interest rates and decrease with falling interest rates, the value of mortgage servicing rights generally increases as interest rates rise and decreases as interest rates fall. If interest rates fall and the value of our capitalized servicing rights decrease, we may be required to recognize an additional impairment charge against income for the amount by which amortized cost exceeds estimated fair market value.
Our securities portfolio may be impacted by fluctuations in market value, potentially reducing accumulated other comprehensive income and/or earnings. Fluctuations in market value may be caused by changes in market interest rates, lower market prices for securities and limited investor demand. Changes in interest rates can also have an adverse effect on our financial condition, as our available-for-sale securities are reported at their estimated fair value, and therefore are impacted by fluctuations in interest rates. We increase or decrease our stockholders’ equity by the amount of change in the estimated fair value of the available-for-sale securities, net of taxes. The declines in market value could result in other-than-temporary
42
impairments of these assets, which would lead to accounting charges that could have a material adverse effect on our net income and capital levels.
In general, changes in market and competitive interest rates result from events that we do not control and over which we generally have little or no influence. As a result, mitigation of the adverse affects of changing interest rates is generally limited to controlling the composition of the assets and liabilities that we hold. To monitor our positions, we maintain an interest rate risk modeling system which is designed to measure our interest rate risk sensitivity. Using customized modeling software, the Association prepares periodic estimates of the amounts by which the net present value of its cash flows from assets, liabilities and off balance sheet items (the institution’s economic value of equity) would change in the event of a range of assumed changes in market interest rates. The simulation model uses a discounted cash flow analysis and an option-based pricing approach in measuring the interest rate sensitivity of EVE. At September 30, 2017, in the event of an immediate 200 basis point increase in all interest rates, our model projects that we would experience a $386.6 million, or 18.33%, decrease in EVE. Our calculations further project that, at September 30, 2017, in the event that market interest rates used in the simulation were adjusted in equal monthly amounts (termed a "ramped" format) during the 12 month measurement period to an aggregate increase in 200 basis points, we would expect our projected net interest income for the twelve months ended September 30, 2018 to decrease by 1.63%. See “Item 7A. Quantitative and Qualitative Disclosures about Market Risk.”
A continuation of historically low interest rates and the possibility that we may access higher-cost funds to support our growth may adversely affect our net interest income and profitability.
During the past several years, it has been the policy of the Board of Governors of the FRS to maintain interest rates at historically low levels through its targeted federal funds rate and the purchase of U.S. Treasury and mortgage-backed securities. As a result, market rates on the loans we have originated and the yields on securities we have purchased have been at lower levels than available prior to 2008. This has been a significant factor in the decrease in the amount of our interest income to $409.0 million for the fiscal year ended September 30, 2017 from $550.2 million for the fiscal year ended September 30, 2008 while the average balance of total interest earning assets increased to $12.93 billion for the fiscal year ended September 30, 2017 from $10.10 billion for the fiscal year ended September 30, 2008. As a general matter, our interest-bearing liabilities reprice or mature more quickly than our interest-earning assets, which, as interest rates declined, has generally resulted in progressive increases in net interest income since 2008. However, because interest rates have been low for so long, our ability to further lower our interest expense may become increasingly difficult while the average yield on our interest-earning assets may continue to decrease, and our interest expense may increase as we access non-core funding sources or increase deposit rates to fund our operations.
Accordingly, our net interest income (the difference between interest income earned on assets and interest expense paid on liabilities) may be adversely affected which may have an adverse effect on our profitability.
Difficult market conditions, geographic concentration and heightened regulatory scrutiny have already affected us and our industry and may continue to do so.
Our performance is significantly impacted by the general economic conditions in our primary markets in the states of Ohio and Florida, and surrounding areas, which were severely affected during the 2008 financial crisis and its aftermath. A recurrence of those or similar difficult market conditions is likely to again result in high levels of unemployment, which will further weaken recently, and in some cases, continuing distressed local economies and could result in additional defaults of mortgage loans. Most of the loans in our loan portfolio are secured by real estate located in our primary market areas. Negative conditions, such as layoffs, in the markets where collateral for a mortgage loan is located could adversely affect a borrower’s ability to repay the loan and the value of the collateral securing the loan. Declines in the U.S. housing market during and in the aftermath of the 2008 financial crisis, as manifested by falling home prices and increasing foreclosures, as well as unemployment and under-employment, all negatively impacted the credit performance of mortgage loans and resulted in significant write-downs of asset values by financial institutions.
In response to the financial crisis of 2008, many lenders and institutional investors reduced or ceased providing funding to borrowers, including other financial institutions. This market turmoil and tightening of credit led to an increased level of commercial and consumer delinquencies, lack of consumer confidence, increased market volatility and widespread reduction of business activity generally. The resulting economic pressure on consumers and lack of confidence in the financial markets adversely affected our business, financial condition and results of operations. While the economy has progressed on a tenuous road to recovery and we have experienced significant improvements in the credit metrics in our mortgage portfolio, a relapse or worsening of the conditions associated with the 2008 financial crisis would likely exacerbate the adverse effects that those difficult market conditions had on us and others in the financial industry. In particular, we already face and would expect to continue to face the following risks in connection with these events:
43
• | Increased regulation of our industry, heightened supervisory scrutiny related to the USA Patriot Act, Bank Secrecy Act, Fair Lending and other laws and regulations, including those still contemplated by the DFA, along with enhanced monitoring of compliance with such regulation, including, as an institution with assets in excess of $10 billion, direct supervision by the CFPB. Each aspect of amplified supervision and regulation will in all likelihood increase our costs, may be accompanied by the risk of unexpected fines, sanctions, penalties, litigation and corresponding management diversion and may limit our ability to pursue business opportunities and return capital to our shareholders. |
• | Our ability to assess the creditworthiness of our customers may be impaired if the models and approaches we use to select, manage, and underwrite our customers become less predictive of future behaviors. |
• | The processes we use to estimate losses inherent in our credit exposure require difficult, subjective, and complex judgments, including forecasts of economic conditions and how these economic predictions might impair the ability of our borrowers to repay their loans, which may no longer be capable of viable estimation and which may, in turn, impact the reliability of our evaluation processes, the comfort of our regulators with respect to the adequacy of our allowance for loan losses and who may require adjustments thereto, and ultimately could result in increased provisions for loan losses and reduced levels of earnings and capital. |
• | Our ability to engage in sales of mortgage loans to third parties (including mortgage loan securitization transactions with governmental entities) on favorable terms or at all could be adversely affected by further disruptions in the capital markets or other events, including deteriorating investor expectations. |
• | Competition in our industry could intensify as a result of increasing consolidation of financial services companies in connection with current market conditions. |
Changes in laws and regulations and the cost of compliance with new laws and regulations may adversely affect our operations and our income.
We are subject to extensive regulation, supervision and examination by the FRS, the OCC, the CFPB and the FDIC. These regulatory authorities have extensive discretion in connection with their supervisory and enforcement activities, including the ability to impose restrictions on a bank’s operations, reclassify assets, determine the adequacy of a bank’s allowance for loan losses and determine the level of deposit insurance premiums assessed. Because our business is highly regulated, the laws and applicable regulations are subject to frequent change. Any change in these regulations and oversight, whether in the form of regulatory policy, new regulations or legislation or additional deposit insurance premiums could have a material impact on our operations.
The potential exists for additional federal or state laws and regulations, or changes in policy, affecting lending and funding practices and liquidity standards. Moreover, bank regulatory agencies have been active in responding to concerns and trends identified in examinations, and have issued many formal enforcement orders requiring capital ratios in excess of regulatory requirements. Bank regulatory agencies, such as the FRS, the OCC, the CFPB and the FDIC, govern the activities in which we may engage, primarily for the protection of depositors, and not for the protection or benefit of potential investors. In addition, new laws and regulations may increase our costs of regulatory compliance and of doing business, and otherwise affect our operations. New laws and regulations may significantly affect the markets in which we do business, the markets for and value of our loans and investments, the fees we can charge and our ongoing operations, costs and profitability.
Strong competition within our market areas may limit our growth and profitability.
Competition in the banking and financial services industry is intense. In our market areas, we compete with commercial banks, savings institutions, mortgage brokerage firms, credit unions, finance companies, mutual funds, money market funds, insurance companies, and brokerage and investment banking firms operating locally and elsewhere. Some of our competitors have greater name recognition and market presence that benefit them in attracting business, and offer certain services that we do not or cannot provide. In addition, larger competitors may be able to price loans and deposits more aggressively than we do. Troubled financial institutions may significantly increase the interest rates paid to depositors in pursuit of retail deposits when wholesale funding sources are not available to them. Furthermore, the wide acceptance of Internet-based commerce has resulted in a number of alternative payment processing systems and lending platforms in which banks play only minor roles. Customers can now maintain funds in prepaid debit cards or digital currencies, and pay bills and transfer funds directly without the direct assistance of banks. Our profitability depends upon our continued ability to successfully compete in our market areas. For additional information see PART 1 Item 1. Business-THIRD FEDERAL SAVINGS AND LOAN ASSOCIATION OF CLEVELAND-Competition.
We continually encounter technological change, and may have fewer resources than many of our larger competitors to continue to invest in technological improvements
The financial services industry is undergoing rapid technological changes, with frequent introductions of new technology-driven products and services. The effective use of technology increases efficiency and enables financial institutions to better
44
serve customers and to reduce costs. Our future success will depend, in part, upon our ability to address the needs of our customers by using technology to provide products and services that will satisfy customer demands for convenience, as well as to create additional efficiencies in our operations. Many of our competitors have substantially greater resources to invest in technological improvements. We also may not be able to effectively implement new technology-driven products and services or be successful in marketing these products and services to our customers.
Certain aspects of our corporate structure related to dividend payment ability and governance could adversely affect the value of our common stock.
The value of the Company’s common stock is significantly affected by our ability to pay dividends to our public stockholders. The Company’s ability to pay dividends to our stockholders is subject to the availability of cash at the holding company and, in the event earnings are not sufficient to fund the dividends, eventually, the ability of the Association to make capital distributions to the Company. Moreover, our ability to pay dividends and the amount of such dividends is affected by the ability of Third Federal Savings, MHC, our mutual holding company, to waive the receipt of dividends declared by the Company.
Federal regulations require Third Federal Savings, MHC to notify the FRS of any proposed waiver of its receipt of dividends from the Company. In August 2011, the FRS issued an interim final rule pursuant to the DFA, providing that the FRS “may not” object to dividend waivers by grandfathered mutual holding companies, such as Third Federal Savings, MHC, under standards substantially similar to those previously required by the OTS. However, the interim final rule added a requirement that a majority of the mutual holding company’s members eligible to vote must approve a dividend waiver by a mutual holding company within 12 months prior to the declaration of the dividend being waived. As part of its rulemaking process, the FRS is reviewing comments on the interim final rule and there can be no assurance that the final rule will not require such a member vote. Third Federal Savings, MHC has received the approval of its members in four separate meetings (in July 2014, August 2015, July 2016 and July 2017) to waive the receipt of dividends for a twelve-month period, and the FRS has “non-objected” to Third Federal Savings, MHC’s waiver each time However, future approvals of members and non-objections from the FRS are not assured and if not obtained, the discontinuance of dividend payments would adversely affect the value of our common stock.
Third Federal Savings, MHC, as our majority shareholder, is able to control the outcome of virtually all matters presented to our shareholders for their approval, including any proposal to acquire us. Accordingly, Third Federal Savings, MHC may prevent the sale of control or merger of the Company or its subsidiaries even if such a transaction were favored by a majority of the public shareholders of the Company.
Cyber-attacks, other security breaches or failure or interruption of information systems could adversely affect our operations, net income or reputation.
We rely heavily on communications and information systems to conduct our business. We regularly collect, process, transmit and store significant amounts of data and confidential information regarding our customers, employees and others and concerning our own business, operations, plans and strategies. In some cases, this confidential or proprietary information is collected, compiled, processed, transmitted or stored by third parties on our behalf.
Information security risks have generally increased in recent years because of the proliferation of new technologies, the use of the Internet and telecommunications technologies to conduct financial and other transactions and the increased sophistication and activities of perpetrators of cyber-attacks and mobile phishing. Mobile phishing, a means for identity thieves to obtain sensitive personal information through fraudulent e-mail, text or voice mail, is an emerging threat targeting the customers of popular financial entities. A failure in or breach of our operational or information security systems, or those of our third-party service providers, as a result of cyber-attacks or information security breaches or due to employee error, malfeasance or other disruptions could adversely affect our business, result in the disclosure or misuse of confidential or proprietary information, damage our reputation, increase our costs and/or cause losses.
If this confidential or proprietary information were to be mishandled, misused or lost, we could be exposed to significant regulatory consequences, reputational damage, civil litigation and financial loss.
Although we employ a variety of physical, procedural and technological safeguards to protect this confidential and proprietary information from mishandling, misuse or loss, these safeguards do not provide absolute assurance that mishandling, misuse or loss of the information will not occur, and that if mishandling, misuse or loss of the information did occur, those events will be promptly detected and addressed. Similarly, when confidential or proprietary information is collected, compiled, processed, transmitted or stored by third parties on our behalf, our policies and procedures require that the third party agree to maintain the confidentiality of the information, establish and maintain policies and procedures designed to preserve the
45
confidentiality of the information, and permit us to confirm the third party’s compliance with the terms of the agreement. As information security risks and cyber threats continue to evolve, we may be required to expend additional resources to continue to enhance our information security measures and/or to investigate and remediate any information security vulnerabilities.
We have experienced no known material breaches.
Our operations rely on numerous external vendors.
We rely on numerous external vendors to provide us with products and services necessary to maintain our day-to-day operations. Accordingly, our operations are exposed to risk that these vendors will not perform in accordance with the contracted arrangements under service level agreements. The failure of an external vendor to perform in accordance with the contracted arrangements under service level agreements because of changes in the vendor's organizational structure, financial condition, support for existing products and services or strategic focus or for any other reason, could be disruptive to our operations, which in turn could have a material negative impact on our financial condition and results of operations. We also could be adversely affected to the extent such an agreement is not renewed by the third-party vendor or is renewed on terms less favorable to us.
Hurricanes or other adverse weather events could negatively affect the economy in our Florida market area or cause disruptions to our branch office locations, which could have an adverse effect on our business or results of operations.
A significant portion of our branch operations are conducted in the State of Florida, a geographic region with coastal areas that are susceptible to hurricanes and tropical storms. Such weather events can disrupt our operations, result in damage to our branch office locations and negatively affect the local economy in which we operate. We cannot predict whether or to what extent damage caused by future hurricanes or tropical storms will affect our operations or the economy in our market area, but such weather events could result in fewer loan originations and greater delinquencies, foreclosures or loan losses. These and other negative effects of future hurricanes or tropical storms may adversely affect our business or results of operations.
A new accounting standard may require us to increase our allowance for loan losses and may have a material adverse effect on our financial condition and results of operations.
The Financial Accounting Standards Board has adopted a new accounting standard that will be effective for the Company for our fiscal year beginning October 1, 2020. This standard, referred to as Current Expected Credit Loss, or CECL, will require financial institutions to determine periodic estimates of lifetime expected credit losses on loans, and recognize the expected credit losses as allowances for loan losses. This will change the current method of providing allowances for loan losses that are probable, which may require us to increase our allowance for loan losses, and to greatly increase the types of data we would need to collect and review to determine the appropriate level of the allowance for loan losses. Any increase in our allowance for loan losses or expenses incurred to determine the appropriate level of the allowance for loan losses may have a material adverse effect on our financial condition and results of operations.
If we are required to repurchase mortgage loans that we have previously sold, it would negatively affect our earnings.
We sell mortgage loans in the secondary market under agreements that contain representations and warranties related to, among other things, the origination, characteristics of the mortgage loans and subsequent servicing. We may be required to repurchase mortgage loans that we have sold in cases of borrower default or breaches of these representations and warranties, and we would be subject to increased risk of disputes and repurchase demands as our volume of loan sales increases. If we are required to repurchase mortgage loans or provide indemnification or other recourse, this could significantly increase our costs and thereby affect our future earnings.
Recently adopted final regulations could restrict our ability to originate and sell loans.
The Consumer Financial Protection Bureau has issued a rule designed to clarify for lenders how they can avoid legal liability under the Dodd-Frank Act, which holds lenders accountable for ensuring a borrower’s ability to repay a mortgage. Loans that meet this “qualified mortgage” definition will be presumed to have complied with the new ability-to-repay standard. Under the rule, a “qualified mortgage” loan must not contain certain specified features, including:
• | excessive upfront points and fees (those exceeding 3% of the total loan amount, less “bona fide discount points” for prime loans); |
• | interest-only payments; |
• | negative amortization; and |
• | terms of longer than 30 years. |
46
Also, to qualify as a “qualified mortgage,” a loan must be made to a borrower whose total monthly debt-to-income ratio does not exceed 43%. Lenders must also verify and document the income and financial resources relied upon to qualify the borrower on the loan and underwrite the loan based on a fully amortizing payment schedule and maximum interest rate during the first five years, taking into account all applicable taxes, insurance and assessments.
In addition, the Dodd-Frank Act requires the regulatory agencies to issue regulations that require securitizers of loans to retain “not less than 5% of the credit risk for any asset that is not a qualified residential mortgage.” The regulatory agencies have issued a final rule to implement this requirement. The final rule provides that the definition of “qualified residential mortgage” includes loans that meet the definition of qualified mortgage issued by the Consumer Financial Protection Bureau.
The final rule could have a significant effect on the secondary market for loans and the types of loans we originate, and restrict our ability to make loans. Similarly, the Consumer Financial Protection Bureau’s rule on qualified mortgages could limit our ability or desire to make certain types of loans or loans to certain borrowers, which could limit our growth or profitability.
Any future action by the U.S. Congress lowering the federal corporate income tax rate and/or eliminating the federal corporate alternative minimum tax could result in the need to establish a deferred tax assets valuation allowance and a corresponding charge against earnings.
Deferred tax assets are reported as assets on the Company’s balance sheet and represent the decrease in taxes expected to be paid in the future because of future reversals of temporary differences in the bases of assets and liabilities as measured by enacted tax laws and their bases as reported in the financial statements. As of September 30, 2017, the Company’s net federal deferred tax asset was $15.5 million. The Company did not have a federal net operating loss carryforward, a federal tax credit carryforward, an alternative minimum tax credit carryforward or a federal alternative minimum tax net operating loss carryforward that impacted the deferred tax asset as of September 30, 2017. The President of the U.S. and the majority political party in the U.S. Congress have announced plans to lower the federal corporate income tax rate from its current level of 35%. If enacted, this reduction could result in a decrease in the value of our deferred tax assets and a reduction to our net income and total equity during the period in which a tax rate change is enacted. The reduction in corporate income tax rate could also reduce our income tax provision expense in future periods.
Our sources of funds are limited because of our holding company structure
The Company is a separate legal entity from its subsidiaries and does not have significant operations of its own. Dividends from the Association provide a significant source of cash for the Company. The availability of dividends from the Association is limited by various statutes and regulations. Under these statutes and regulations, the Association is not permitted to pay dividends on its capital stock to the Company, its sole stockholder, if the dividend would reduce the stockholders' equity of the Association below the amount of the liquidation account established in connection with the mutual-to-stock conversion. Federal savings associations may pay dividends without the approval of its primary federal regulator only if they meet applicable regulatory capital requirements before and after the payment of the dividends and total dividends do not exceed net income to date over the calendar year plus its retained net income over the preceding two years. If in the future, the Company utilizes its available cash and the Bank is unable to pay dividends to the Company, the Company may not have sufficient funds to pay dividends or fund stock repurchases.
Item 1B. | Unresolved Staff Comments |
None.
Item 2. | Properties |
We operate from our main office in Cleveland, Ohio, our 38 full-service branch offices located in Ohio and Florida and our eight loan production offices located in Ohio. Our branch offices are located in the Ohio counties of Cuyahoga, Lake, Lorain, Medina and Summit and in the Florida counties of Broward, Collier, Hillsborough, Lee, Palm Beach, Pasco, Pinellas and Sarasota. Our loan production offices are located in the Ohio counties of Franklin, Butler, Delaware and Hamilton. The Company owns the building in which its home office and executive offices are located, and six other office locations. The net book value of our land, premises, equipment and software was $60.9 million at September 30, 2017. Included in the net book value are two commercial buildings located in Canton, Massachusetts, valued at $18.2 million, which are owned by our Hazelmere entity and leased to third parties in net lease transactions.
47
Item 3. | Legal Proceedings |
The Company and its subsidiaries are subject to various legal actions arising in the normal course of business. In the opinion of management, the resolution of these legal actions is not expected to have a material adverse effect on the Company’s consolidated financial condition, results of operation, or statements of cash flows.
Item 4. | Mine Safety Disclosures |
Not applicable.
PART II
Item 5. | Market for Registrant’s Common Equity, Related Stockholder Matters and Issuer Purchases of Equity Securities |
Our common stock is listed and traded on the NASDAQ Global Select Market under the symbol “TFSL”. As of November 20, 2017, we had 7,180 shareholders of record, which number does not include persons or entities holding shares in “nominee” or “street” name through brokerage firms. Shares of our common stock began trading on April 23, 2007 following the completion of our initial public offering. Quarterly trading information for the periods indicated is provided by NASDAQ and included in the following table.
Traded Market Prices | |||||||||||
High | Low | Dividends | |||||||||
Quarter ended December 31, 2015 | $ | 19.23 | $ | 17.05 | $ | 0.10 | |||||
Quarter ended March 31, 2016 | 18.53 | 15.60 | 0.10 | ||||||||
Quarter ended June 30, 2016 | 18.50 | 16.43 | 0.10 | ||||||||
Quarter ended September 30, 2016 | 18.67 | 16.92 | 0.125 | ||||||||
Quarter ended December 31, 2016 | 19.83 | 18.61 | 0.125 | ||||||||
Quarter ended March 31, 2017 | 17.38 | 16.40 | 0.125 | ||||||||
Quarter ended June 30, 2017 | 16.07 | 15.30 | 0.125 | ||||||||
Quarter ended September 30, 2017 | 16.13 | 14.84 | 0.17 | ||||||||
Payment of dividends is subject to declaration by our Board of Directors and is dependent on a number of factors, including:
• | our capital requirements and, to the extent that funds for any such dividend are provided by the Association, the regulatory capital requirements imposed on the Association by the OCC; |
• | our financial position and results of operations; |
• | tax considerations; |
• | our alternative uses of funds; |
• | statutory and regulatory limitations; and |
• | general economic conditions. |
Pursuant to IRS regulations, any payment of dividends by the Association to the Company that would be deemed to be drawn from the Association’s bad debt reserves would require a payment of taxes at the then-current tax rate by the Association on the amount of earnings deemed to be removed from the reserves for such distribution. The Association does not intend to make any distribution to the Company that would create such a federal tax liability.
Through September 30, 2010, Third Federal Savings, MHC, waived its right to receive dividends. The waivers complied with regulatory authorizations (in the form of non-objection) obtained by Third Federal Savings, MHC. Any requests for future regulatory authorizations to waive receipts of dividends will be submitted to the FRS. Please refer to the preceding discussion of dividend waivers presented in Part I, Item 1. Business, SUPERVISION AND REGULATION, Holding Company Regulation, sections—Dividends and Waivers of Dividends by Third Federal Savings, MHC. Regulatory non-objection is subject to periodic regulatory review and no assurances can be given regarding future regulatory non-objection. In addition, interim final rules issued by the FRS on August 12, 2011 require that a majority of the mutual holding company's members
48
eligible to vote must approve a dividend waiver by a mutual holding company within 12 months prior to the declaration of the dividend being waived. There can be no assurance that a final rule will not require such a member vote.
On July 19, 2017, at a special meeting of members of Third Federal Savings, MHC, the members (depositors and certain loan customers of the Association) of Third Federal Savings, MHC voted to approve Third Federal Savings, MHC's proposed waiver of dividends, aggregating up to $0.68 per share, to be declared on the Company’s common stock during the four quarterly periods ending June 30, 2018. The members approved the waiver by casting 64% of the eligible votes in favor of the waiver. Of the votes cast, 97% were in favor of the proposal. Third Federal Savings, MHC is the 81% majority shareholder of the Company.
Following the receipt of the members’ approval at the July 19, 2017 special meeting, Third Federal Savings, MHC filed a notice with, and subsequently received the non-objection of, the FRB-Cleveland for the proposed dividend waivers.
In the table and graph that follow, we have provided summary information regarding the performance of the cumulative total return of our common stock from September 30, 2012 through September 30, 2017, relative to the cumulative total return on stocks included in the SNL Bank and Thrift Index, SNL Thrift Index and NASDAQ Composite, in each case for the same period. The cumulative return data is presented in dollars, based on starting investments of $100 and assuming the reinvestment of dividends.
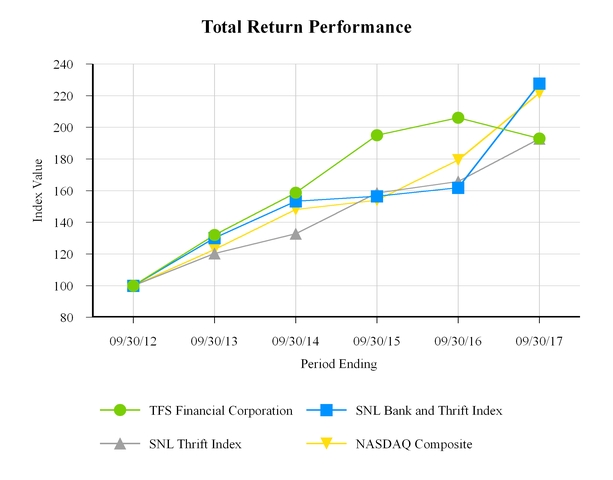
Measurement Date | |||||||||||||||||
Index (with base price at 9/30/2012) | 9/30/2012 | 9/30/2013 | 9/30/2014 | 9/30/2015 | 9/30/2016 | 9/30/2017 | |||||||||||
TFS Financial Corporation | 100.00 | 131.97 | 158.65 | 194.98 | 206.11 | 193.01 | |||||||||||
SNL Bank and Thrift Index | 100.00 | 130.10 | 153.33 | 156.54 | 161.85 | 227.64 | |||||||||||
SNL Thrift Index | 100.00 | 120.39 | 132.79 | 158.59 | 165.85 | 192.83 | |||||||||||
NASDAQ Composite | 100.00 | 122.77 | 148.08 | 153.99 | 179.29 | 221.75 | |||||||||||
Source: S&P Global Market Intelligence
______________________
49
We did not sell any securities during the quarter ended September 30, 2017.
The following table summarizes our stock repurchase activity during the three months ended September 30, 2017 and the stock repurchase plans approved by our Board of Directors.
Average | Total Number of | Maximum Number | ||||||||||
Total Number | Price | Shares Purchased | of Shares that May | |||||||||
of Shares | Paid per | as Part of Publicly | Yet be Purchased | |||||||||
Period | Purchased | Share | Announced Plans (1) | Under the Plans | ||||||||
July 1, 2017 through July 31, 2017 | 398,900 | $ | 15.79 | 398,900 | 7,938,890 | |||||||
August 1, 2017 through August 31, 2017 | 108,000 | 15.48 | 108,000 | 7,830,890 | ||||||||
September 1, 2017 through September 30, 2017 | 80,000 | 15.38 | 80,000 | 7,750,890 | ||||||||
586,900 | 15.68 | 586,900 | ||||||||||
(1) | On October 27, 2016, the Company announced that the Board of Directors approved the Company's eighth stock repurchase program, which authorizes the repurchase of up to 10,000,000 shares of the Company's outstanding common stock, which commenced upon the completion of the Company's seventh stock repurchase program on January 7, 2017. Purchases under the program will be on an ongoing basis and subject to the availability of stock, general market conditions, the trading price of the stock, alternative uses of capital, and our financial performance. Repurchased shares will be held as treasury stock and be available for general corporate use. The program has 7,750,890 shares yet to be purchased as of September 30, 2017. |
Item 6. | Selected Financial Data |
At September 30, | |||||||||||||||||||
2017 | 2016 | 2015 | 2014 | 2013 | |||||||||||||||
(In thousands) | |||||||||||||||||||
Selected Financial Condition Data: | |||||||||||||||||||
Total assets | $ | 13,692,563 | $ | 12,906,062 | $ | 12,368,886 | $ | 11,803,195 | $ | 11,269,346 | |||||||||
Cash and cash equivalents | 268,218 | 231,239 | 155,369 | 181,403 | 285,996 | ||||||||||||||
Investment securities - available for sale | 537,479 | 517,866 | 585,053 | 568,868 | 477,376 | ||||||||||||||
Loans held for sale | 351 | 4,686 | 116 | 4,962 | 4,179 | ||||||||||||||
Loans, net | 12,419,306 | 11,708,804 | 11,187,583 | 10,630,687 | 10,084,066 | ||||||||||||||
Bank owned life insurance | 205,883 | 200,144 | 195,861 | 190,152 | 183,724 | ||||||||||||||
Prepaid expenses and other assets | 61,086 | 63,994 | 58,277 | 64,880 | 71,639 | ||||||||||||||
Deposits | 8,151,625 | 8,331,368 | 8,285,858 | 8,653,878 | 8,464,499 | ||||||||||||||
Borrowed funds | 3,671,377 | 2,718,795 | 2,168,627 | 1,138,639 | 745,117 | ||||||||||||||
Shareholders’ equity | 1,689,959 | 1,660,458 | 1,729,370 | 1,839,457 | 1,871,477 | ||||||||||||||
50
For the Years Ended September 30, | |||||||||||||||||||
2017 | 2016 | 2015 | 2014 | 2013 | |||||||||||||||
(In thousands, except per share amounts) | |||||||||||||||||||
Selected Operating Data: | |||||||||||||||||||
Interest income | $ | 408,995 | $ | 388,441 | $ | 383,477 | $ | 374,684 | $ | 383,972 | |||||||||
Interest expense | 130,099 | 118,026 | 113,350 | 103,251 | 115,419 | ||||||||||||||
Net interest income | 278,896 | 270,415 | 270,127 | 271,433 | 268,553 | ||||||||||||||
Provision (credit) for loan losses | (17,000 | ) | (8,000 | ) | (3,000 | ) | 19,000 | 37,000 | |||||||||||
Net interest income after provision for loan losses | 295,896 | 278,415 | 273,127 | 252,433 | 231,553 | ||||||||||||||
Non-interest income | 19,849 | 24,952 | 24,260 | 21,900 | 28,468 | ||||||||||||||
Non-interest expenses | 182,404 | 181,004 | 187,992 | 175,476 | 177,660 | ||||||||||||||
Earnings before income tax | 133,341 | 122,363 | 109,395 | 98,857 | 82,361 | ||||||||||||||
Income tax expense | 44,464 | 41,810 | 36,804 | 32,966 | 26,402 | ||||||||||||||
Net earnings after income tax expense | $ | 88,877 | $ | 80,553 | $ | 72,591 | $ | 65,891 | $ | 55,959 | |||||||||
Earnings per share—basic and fully diluted | $ | 0.32 | $ | 0.28 | $ | 0.25 | $ | 0.22 | $ | 0.18 | |||||||||
Cash dividends declared per share | $ | 0.545 | $ | 0.425 | $ | 0.31 | $ | 0.07 | $ | — | |||||||||
51
At or For The Years Ended September 30, | ||||||||||||||
2017 | 2016 | 2015 | 2014 | 2013 | ||||||||||
Selected Financial Ratios and Other Data: | ||||||||||||||
Performance Ratios: | ||||||||||||||
Return on average assets | 0.67 | % | 0.65 | % | 0.57 | % | 0.57 | % | 0.50 | % | ||||
Return on average equity | 5.28 | % | 4.73 | % | 4.04 | % | 3.52 | % | 3.05 | % | ||||
Interest rate spread(1) | 2.02 | % | 2.09 | % | 2.03 | % | 2.26 | % | 2.25 | % | ||||
Net interest margin(2) | 2.16 | % | 2.23 | % | 2.17 | % | 2.42 | % | 2.46 | % | ||||
Efficiency ratio(3) | 61.06 | % | 61.28 | % | 63.86 | % | 59.82 | % | 59.81 | % | ||||
Noninterest expense to average total assets | 1.37 | % | 1.45 | % | 1.47 | % | 1.53 | % | 1.58 | % | ||||
Average interest-earning assets to average interest-bearing liabilities | 113.29 | % | 114.67 | % | 115.43 | % | 118.51 | % | 119.58 | % | ||||
Dividend payout ratio(4) | 170.31 | % | 151.79 | % | 124.00 | % | 31.82 | % | — | % | ||||
Asset Quality Ratios: | ||||||||||||||
Non-performing assets as a percent of total assets | 0.62 | % | 0.75 | % | 1.00 | % | 1.33 | % | 1.58 | % | ||||
Non-accruing loans as a percent of total loans | 0.63 | % | 0.76 | % | 0.95 | % | 1.27 | % | 1.53 | % | ||||
Allowance for loan losses as a percent of non-accruing loans | 61.89 | % | 68.69 | % | 67.00 | % | 60.03 | % | 59.38 | % | ||||
Allowance for loan losses as a percent of total loans | 0.39 | % | 0.52 | % | 0.64 | % | 0.76 | % | 0.91 | % | ||||
Capital Ratios: | ||||||||||||||
Association | ||||||||||||||
Total risk-based capital to risk weighted assets(5) | NA | NA | NA | 25.25 | % | 26.16 | % | |||||||
Total capital to risk-weighted assets(6) | 21.37 | % | 22.24 | % | 22.92 | % | NA | NA | ||||||
Tier 1 core capital to adjusted tangible assets(5) | NA | NA | NA | 13.47 | % | 14.18 | % | |||||||
Tier 1 (leverage) capital to net average assets(6)(7) | 11.16 | % | 11.73 | % | 12.78 | % | NA | NA | ||||||
Tier 1 risk-based capital to risk weighted assets(5) | NA | NA | NA | 24.02 | % | 24.91 | % | |||||||
Tier 1 capital to risk-weighted assets(6) | 20.69 | % | 21.36 | % | 21.95 | % | NA | NA | ||||||
Common equity tier 1 capital to risk-weighted assets(6) | 20.69 | % | 21.36 | % | 21.95 | % | NA | NA | ||||||
TFS Financial Corporation | ||||||||||||||
Total risk-based capital to risk weighted assets(5) | NA | NA | NA | 29.00 | % | 29.11 | % | |||||||
Total capital to risk-weighted assets(6) | 23.63 | % | 24.62 | % | 24.54 | % | NA | NA | ||||||
Tier 1 core capital to adjusted tangible assets(5) | NA | NA | NA | 15.60 | % | 16.59 | % | |||||||
Tier 1 (leverage) capital to net average assets(6)(7) | 12.41 | % | 13.07 | % | 13.76 | % | NA | NA | ||||||
Tier 1 risk-based capital to risk weighted assets(5) | NA | NA | NA | 27.77 | % | 30.36 | % | |||||||
Tier 1 capital to risk-weighted assets(6) | 22.96 | % | 23.74 | % | 23.57 | % | NA | NA | ||||||
Common equity tier 1 capital to risk-weighted assets(6) | 22.96 | % | 23.74 | % | 23.57 | % | NA | NA | ||||||
Average equity to average total assets | 12.67 | % | 13.64 | % | 14.09 | % | 16.28 | % | 16.38 | % | ||||
Other Data: | ||||||||||||||
Association | ||||||||||||||
Number of full service offices | 38 | 38 | 38 | 38 | 38 | |||||||||
Loan production offices | 8 | 8 | 8 | 8 | 8 | |||||||||
______________________
(1) | Represents the difference between the weighted-average yield on interest-earning assets and the weighted-average cost of interest-bearing liabilities for the year. |
(2) | The net interest margin represents net interest income as a percent of average interest-earning assets for the year. |
(3) | The efficiency ratio represents non-interest expense divided by the sum of net interest income and non-interest income. |
(4) | Represents dividends paid per share divided by diluted earnings per share. Receipt of dividends on shares owned by Third Federal Savings, MHC has been waived and dividends paid on unallocated shares of the ESOP are used to pay down the loan to the ESOP. |
(5) | Calculated using the regulatory capital methodology applicable to the Association prior to January 1, 2015. |
52
(6) | Calculated using the regulatory capital methodology applicable to the Association beginning January 1, 2015. Please refer to Part I, Item 1, Business, Federal Banking Regulation, Capital Requirements for a detailed discussion of the new Basel III rules. |
(7) | Tier 1 (leverage) capital to net average assets ratio disclosures were based on net average assets beginning quarter end September 30, 2015. |
53
Item 7. | Management’s Discussion and Analysis of Financial Condition and Results of Operations |
Overview
Our business strategy is to operate as a well-capitalized and profitable financial institution dedicated to providing exceptional personal service to our customers.
Since being organized in 1938, we grew to become, at the time of our initial public offering of stock in April 2007, the nation’s largest mutually-owned savings and loan association based on total assets. We credit our success to our continued emphasis on our primary values: “Love, Trust, Respect, and a Commitment to Excellence, along with Having Fun.” Our values are reflected in the design and pricing of our loan and deposit products, as described below. Our values are further reflected in a long-term revitalization program encompassing the three-mile corridor of the Broadway-Slavic Village neighborhood in Cleveland, Ohio where our main office was established and continues to be located and the educational programs we have established and/or supported. We intend to continue to adhere to our primary values and to support our customers and the communities in which we operate.
Management believes that the following matters are those most critical to our success: (1) controlling our interest rate risk exposure; (2) monitoring and limiting our credit risk; (3) maintaining access to adequate liquidity and diverse funding sources; and (4) monitoring and controlling operating expenses.
Controlling Our Interest Rate Risk Exposure. Although the significant housing and credit quality issues that arose in connection with the 2008 financial crisis had a distinctly negative effect on our operating results and, as described below, that experience made a lasting impression on our risk awareness, historically our greatest risk has been our exposure to changes in interest rates. When we hold long-term, fixed-rate assets, funded by liabilities with shorter re-pricing characteristics, we are exposed to potentially adverse impacts from changing interest rates, and most notably rising interest rates. Generally, and particularly over extended periods of time that encompass full economic cycles, interest rates associated with longer-term assets, like fixed-rate mortgages, have been higher than interest rates associated with shorter-term funding sources, like deposits. This difference has been an important component of our net interest income and is fundamental to our operations. We manage the risk of holding longer-term, fixed-rate mortgage assets primarily by maintaining the levels of regulatory capital required to be well capitalized, by promoting adjustable-rate loans and shorter-term, fixed-rate loans, and by opportunistically extending the duration of our funding sources.
Levels of Regulatory Capital
At September 30, 2017, the Company’s Tier 1 (leverage) capital totaled $1.68 billion, or 12.41% of net average assets and 22.96% of risk-weighted assets, while the Association’s Tier 1 (leverage) capital totaled $1.51 billion, or 11.16% of net average assets and 20.69% of risk-weighted assets. Each of these measures was more than twice the requirements currently in effect for the Association for designation as “well capitalized” under regulatory prompt corrective action provisions, which set minimum levels of 5.00% of net average assets and 8.00% of risk-weighted assets. Refer to the Liquidity and Capital Resources section of this Item 7 for additional discussion regarding regulatory capital requirements.
Promotion of Adjustable-Rate Loans and Shorter-Term, Fixed-Rate Loans
In July 2010, we began marketing an adjustable-rate mortgage loan that provides us with improved interest rate risk characteristics when compared to a 30-year, fixed-rate mortgage loan. Our “Smart Rate” adjustable rate mortgage offers borrowers an interest rate lower than that of a 30-year, fixed-rate loan. The interest rate in the Smart Rate mortgage is locked for three or five years then resets annually. The Smart Rate mortgage contains a feature to re-lock the rate an unlimited number of times at our then current interest rate and fee schedule, for another three or five years (which must be the same as the original lock period) without having to complete a full refinance transaction. Re-lock eligibility is subject to a satisfactory payment performance history by the borrower (current at the time of re-lock, and no foreclosures or bankruptcies since the Smart Rate application was taken). In addition to a satisfactory payment history, re-lock eligibility requires that the property continues to be the borrower’s primary residence. The loan term cannot be extended in connection with a re-lock nor can new funds be advanced. All interest rate caps and floors remain as originated.
Beginning in the latter portion of fiscal 2012, we began to feature a ten-year, fully amortizing fixed-rate first mortgage loan in our product promotions. The ten-year, fixed-rate loan has a less severe interest rate risk profile when compared to loans with fixed-rate terms of 15 to 30 years and helps us to more effectively manage our interest rate risk exposure, yet provides our borrowers with the certainty of a fixed interest rate throughout the life of the obligation.
54
The following tables set forth our first mortgage loan production and balances segregated by loan structure at origination.
For the Years Ended September 30, | |||||||||||||
2017 | 2016 | ||||||||||||
Amount | Percent | Amount | Percent | ||||||||||
First Mortgage Loan Originations: | (Dollars in thousands) | ||||||||||||
ARM (all Smart Rate) production | $ | 1,342,801 | 49.7 | % | $ | 1,134,159 | 43.8 | % | |||||
Fixed-rate production: | |||||||||||||
Terms less than or equal to 10 years | 417,182 | 15.4 | 608,786 | 23.5 | |||||||||
Terms greater than 10 years | 941,634 | 34.9 | 848,538 | 32.7 | |||||||||
Total fixed-rate production | 1,358,816 | 50.3 | 1,457,324 | 56.2 | |||||||||
Total First Mortgage Loan Originations: | $ | 2,701,617 | 100.0 | % | $ | 2,591,483 | 100.0 | % | |||||
September 30, 2017 | September 30, 2016 | ||||||||||||
Amount | Percent | Amount | Percent | ||||||||||
Balances of Residential Mortgage Loans Held For Investment: | (Dollars in thousands) | ||||||||||||
ARM (primarily Smart Rate) Loans | $ | 4,816,567 | 44.4 | % | $ | 4,253,531 | 41.7 | % | |||||
Fixed-rate Loans: | |||||||||||||
Terms less than or equal to 10 years | 2,051,529 | 18.9 | 2,078,561 | 20.4 | |||||||||
Terms greater than 10 years | 3,987,072 | 36.7 | 3,859,498 | 37.9 | |||||||||
Total fixed-rate loans | 6,038,601 | 55.6 | 5,938,059 | 58.3 | |||||||||
Total Residential Mortgage Loans Held For Investment: | $ | 10,855,168 | 100.0 | % | $ | 10,191,590 | 100.0 | % | |||||
The following table sets forth the balances as of September 30, 2017 for all ARM loans segregated by the next scheduled interest rate reset date.
Current Balance of ARM Loans Scheduled for Interest Rate Reset | |||
During the Fiscal Years Ending September 30, | (in thousands) | ||
2018 | $ | 405,426 | |
2019 | 569,254 | ||
2020 | 807,754 | ||
2021 | 1,223,347 | ||
2022 | 1,621,812 | ||
2023 | 188,974 | ||
Total | $ | 4,816,567 | |
At September 30, 2017 and September 30, 2016, mortgage loans held for sale, all of which were long-term, fixed-rate first mortgage loans and all of which were held for sale to Fannie Mae, totaled $0.4 million and $4.7 million, respectively.
Extending the Duration of Funding Sources
As a complement to our strategies to shorten the duration of our interest earning assets, as described above, we also seek to lengthen the duration of our interest bearing funding sources. These efforts include monitoring the relative costs of alternative funding sources such as retail deposits, brokered certificates of deposit, longer-term (e.g. four to six years) fixed rate advances from the FHLB of Cincinnati, and shorter-term (e.g. three months) advances from the FHLB of Cincinnati, the durations of which are extended by correlated interest rate exchange contracts. Each funding alternative is monitored and evaluated based on its effective interest payment rate, options exercisable by the creditor (early withdrawal, right to call, etc.), and collateral requirements. The interest payment rate is a function of market influences that are specific to the nuances and market competitiveness/breadth of each funding source. Generally, early withdrawal options are available to our retail CD customers but not to holders of brokered CDs; issuer call options are not provided on our advances from the FHLB of
55
Cincinnati; and we are not subject to early termination options with respect to our interest rate exchange contracts. Additionally, collateral pledges are not provided with respect to our retail CDs or our brokered CDs; but are required for our advances from the FHLB of Cincinnati as well as for our interest rate exchange contracts.
During the year ended September 30, 2017, the composition of our duration-extending funding sources changed as follows: the balance of retail CDs decreased $211.7 million while the balance of brokered CDs (which is inclusive of acquisition costs and subsequent amortization) increased $81.3 million. Additionally during the year ended September 30, 2017, we increased the balance of our short-term advances from the FHLB of Cincinnati by $259.0 million; and we added $900.0 million of new, shorter-term advances from the FHLB of Cincinnati that were matched/correlated to interest rate exchange contracts that extended the effective durations of those shorter-term advances to approximately five years at inception. These funding source modifications facilitated asset growth of $786.5 million and funded stock repurchases of $52.5 million and stock dividends of $27.7 million.
Other Interest Rate Risk Management Tools
In addition to maintaining the levels of regulatory capital required to be well capitalized, since 2016, we have actively marketed home equity lines of credit, which carry an adjustable rate of interest indexed to the prime rate which provides interest rate sensitivity to that portion of our assets. Prior to 2010, home equity lending also represented a meaningful strategy to manage our interest rate risk profile. Between 2010 and 2015, the Association, in various steps, restricted and modified its home equity lending products and the markets they were offered in response to the 2008 financial crisis and the resulting regulatory environments that existed during that time. Through redesigned home equity products, we hope to have re-established home equity line of credit lending as a meaningful strategy to manage our interest rate risk profile. At September 30, 2017, the principal balance of home equity lines of credit totaled $1.24 billion. Our home equity lending is discussed in the preceding Lending Activities section of Item 1. Business in Part I.—THIRD FEDERAL SAVINGS AND LOAN ASSOCIATION OF CLEVELAND.
We also manage interest rate risk by selectively selling a small portion of our long-term, fixed-rate mortgage loans in the secondary market. Prior to fiscal 2010, this strategy was used to a greater extent to manage our interest rate risk. At September 30, 2017, we serviced $1.85 billion of loans for others, of which $1.04 billion were sold in the secondary market prior to fiscal 2010. While the sales of first mortgage loans remain strategically important for us, since fiscal 2010, they have played only a minor role in our management of interest rate risk. Loan sales are discussed later in this Part I1, Item 7. under the heading Liquidity and Capital Resources, and in Part I1, Item 7A. Quantitative and Qualitative Disclosures About Market Risk.
Monitoring and Limiting Our Credit Risk. While, historically, we had been successful in limiting our credit risk exposure by generally imposing high credit standards with respect to lending, the confluence of unfavorable regional and macro-economic events that culminated in the 2008 housing market collapse and financial crisis, coupled with our pre-2010 expanded participation in the second lien mortgage lending markets, significantly refocused our attention with respect to credit risk. In response to the evolving economic landscape, we continuously revise and update our quarterly analysis and evaluation procedures, as needed, for each category of our lending with the objective of identifying and recognizing all appropriate credit impairments. At September 30, 2017, 91% of our assets consisted of residential real estate loans (both “held for sale” and “held for investment”) and home equity loans and lines of credit, which were originated predominantly to borrowers in Ohio and Florida. Our analytic procedures and evaluations include specific reviews of all home equity loans and lines of credit that become 90 or more days past due, as well as specific reviews of all first mortgage loans that become 180 or more days past due. We transfer performing home equity lines of credit subordinate to first mortgages delinquent greater than 90 days to non-accrual status. We also charge-off performing loans to collateral value and classify those loans as non-accrual within 60 days of notification of all borrowers filing Chapter 7 bankruptcy, that have not reaffirmed or been dismissed, regardless of how long the loans have been performing. Loans where at least one borrower has been discharged of their obligation in Chapter 7 bankruptcy, are classified as TDRs. At September 30, 2017, $33.0 million of loans in Chapter 7 bankruptcy status were included in total TDRs. At September 30, 2017, the recorded investment in non-accrual status loans included $34.1 million of performing loans in Chapter 7 bankruptcy status, of which $33.0 million were also reported as TDRs.
In response to the unfavorable regional and macro-economic environment that arose beginning in 2008, and in an effort to limit our credit risk exposure and improve the credit performance of new customers, we tightened our credit eligibility criteria in evaluating a borrower’s ability to successfully fulfill his or her repayment obligation and we revised the design of many of our loan products to require higher borrower down-payments, limited the products available for condominiums, eliminated certain product features (such as interest-only adjustable-rate loans and loans above certain LTV ratios), and we previously suspended home equity lending products with the exception of bridge loans between June 2010 and March 2012. The delinquency level related to loan originations prior to 2009, compared to originations in 2009 and after, reflect the higher credit standards to which we have subjected all new originations. As of September 30, 2017, loans originated prior to 2009 had
56
a balance of $1.48 billion, of which $37.0 million, or 2.5%, were delinquent, while loans originated in 2009 and after had a balance of $10.99 billion, of which $7.9 million, or 0.1%, were delinquent.
One aspect of our credit risk concern relates to high concentrations of our loans that are secured by residential real estate in specific states, particularly Ohio and Florida, in light of the difficulties that arose in connection with the 2008 housing crisis with respect to the real estate markets in those two states. At September 30, 2017, approximately 56.7% and 16.1% of the combined total of our residential Core and construction loans held for investment and approximately 39.1% and 21.9% of our home equity loans and lines of credit were secured by properties in Ohio and Florida, respectively. In an effort to moderate the concentration of our credit risk exposure in individual states, particularly Ohio and Florida, we have utilized direct mail marketing, our internet site and our customer service call center to extend our lending activities to other attractive geographic locations. Currently, in addition to Ohio and Florida, we are actively lending in 19 other states and the District of Columbia, and as a result of that activity, the concentration ratios of the combined total of our residential, Core and construction loans held for investment in Ohio and Florida have trended downward from their September 30, 2010 levels when the concentrations were 79.1% in Ohio and 19.0% in Florida. Of the total mortgage and home equity originations for the years ended September 30, 2017 and 2016, 34.7% and 33.1%, respectively, are secured by properties in states other than Ohio or Florida.
Our residential Home Today loans are another area of credit risk concern. Although we no longer originate loans under this program and the principal balance in these loans constituted only 0.9% of our total “held for investment” loan portfolio balance, they comprised 28.3% and 27.7% of our 90 days or greater delinquencies and our total delinquencies, respectively, at that date. At September 30, 2017, approximately 95.3% and 4.5% of our residential Home Today loans were secured by properties in Ohio and Florida, respectively. At September 30, 2017, the percentages of those loans delinquent 30 days or more in Ohio and Florida were 11.6% and 10.1%, respectively. The disparity between the portfolio composition ratio and delinquency composition ratio reflects the nature of the Home Today loans. We do not offer, and have not offered, loan products frequently considered to be designed to target sub-prime borrowers containing features such as higher fees or higher rates, negative amortization, or low initial payment features with adjustable interest rates. Our Home Today loans, the majority of which were entered into with borrowers that had credit profiles that would not have otherwise qualified for our loan products due to deficient credit scores, generally contained the same features as loans offered to our Core borrowers. The overriding objective of our Home Today lending, just as it is with our Core lending, was the creation of successful homeowners. We have attempted to manage our Home Today credit risk by requiring that borrowers attend pre- and post-borrowing financial management education and counseling and that the borrowers be referred to us by a sponsoring organization with which we have partnered. Further, to manage the credit aspect of these loans, inasmuch as the majority of these buyers did not have sufficient funds for required down payments, many loans included private mortgage insurance. At September 30, 2017, 21.6% of Home Today loans included private mortgage insurance coverage. From a peak recorded investment of $306.6 million at December 31, 2007, the total recorded investment of the Home Today portfolio has declined to $107.7 million at September 30, 2017. This trend generally reflects the evolving conditions in the mortgage real estate market and the tightening of standards imposed by issuers of private mortgage insurance. As part of our effort to manage credit risk, effective March 27, 2009, the Home Today underwriting guidelines were revised to be substantially the same as our traditional mortgage product. At September 30, 2017, the recorded investment in Home Today loans originated subsequent to March 27, 2009 was $3.3 million. Since we are no longer originating loans under our Home Today program,the Home Today portfolio will continue to decline in balance due to contractual amortization. To supplant the Home Today product and to continue to meet the credit needs of our customers and the communities that we serve, during fiscal 2016 we began to offer Fannie Mae eligible, HomeReady loans. These loans are originated in accordance with Fannie Mae's underwriting standards. While we retain the servicing rights related to these loans, the loans, along with the credit risk associated therewith, are securitized/sold to Fannie Mae.
Maintaining Access to Adequate Liquidity and Diverse Funding Sources. For most insured depositories, customer and community confidence are critical to their ability to maintain access to adequate liquidity and to conduct business in an orderly manner. We believe that a well capitalized institution is one of the most important factors in nurturing customer and community confidence. Accordingly, we have managed the pace of our growth in a manner that reflects our emphasis on high capital levels. At September 30, 2017, the Association’s ratio of Tier 1 (leverage) capital to net average assets (a basic industry measure that deems 5.00% or above to represent a “well capitalized” status) was 11.16%. The Association's current Tier 1 (leverage) capital ratio is lower than its ratio at September 30, 2016, which was 11.73%, due primarily to an $81 million cash dividend payment that the Association made to the Company, its sole shareholder, in December 2016 that reduced the Association's Tier 1 (leverage) capital ratio by an estimated 63 basis points. Because of its intercompany nature, this dividend payment did not impact the Company's consolidated capital ratios which are reported in the Liquidity and Capital Resources section of this Item 7. We expect to continue to remain a well capitalized institution.
In managing its level of liquidity, the Company monitors available funding sources, which include attracting new deposits (including brokered CDs), borrowing from others, the conversion of assets to cash and the generation of funds through profitable operations. The Company has traditionally relied on retail deposits as its primary means in meeting its funding needs. At September 30, 2017, deposits totaled $8.15 billion (including $620.7 million of brokered CDs), while borrowings totaled
57
$3.67 billion and borrowers’ advances and servicing escrows totaled $0.14 billion, combined. In evaluating funding sources, we consider many factors, including cost, collateral, duration and optionality, current availability, expected sustainability, impact on operations and capital levels.
To attract deposits, we offer our customers attractive rates of return on our deposit products. Our deposit products typically offer rates that are highly competitive with the rates on similar products offered by other financial institutions. We intend to continue this practice, subject to market conditions.
We preserve the availability of alternative funding sources through various mechanisms. First, by maintaining high capital levels, we retain the flexibility to increase our balance sheet size without jeopardizing our capital adequacy. Effectively, this permits us to increase the rates that we offer on our deposit products thereby attracting more potential customers. Second, we pledge available real estate mortgage loans and investment securities with the FHLB of Cincinnati and the FRB-Cleveland. At September 30, 2017, these collateral pledge support arrangements provide the Association with the ability to immediately borrow an additional $41.0 million from the FHLB of Cincinnati and $72.3 million from the FRB-Cleveland Discount Window. From the perspective of collateral value securing FHLB of Cincinnati advances, our capacity limit for additional borrowings beyond the outstanding balance at September 30, 2017 was $4.87 billion, subject to satisfaction of the FHLB of Cincinnati common stock ownership requirement. To satisfy the common stock ownership requirement for the maximum limit of borrowing we would need to increase our ownership of FHLB of Cincinnati common stock by an additional $97.4 million. Third, we invest in high quality marketable securities that exhibit limited market price variability, and to the extent that they are not needed as collateral for borrowings, can be sold in the institutional market and converted to cash. At September 30, 2017, our investment securities portfolio totaled $537.5 million. Finally, cash flows from operating activities have been a regular source of funds. During the fiscal years ended September 30, 2017 and 2016, cash flows from operations totaled $108.7 million and $84.9 million, respectively.
Historically, a portion of the residential first mortgage loans that we originated were considered to be highly liquid as they were eligible for delivery/sale to Fannie Mae. However, due to delivery requirement changes imposed by Fannie Mae as a result of the 2008 financial crisis, effective July 1, 2010, that was no longer an available source of liquidity for the Company. We have since implemented certain loan origination changes for a small portion of our loan production, which resulted in our November 15, 2013 reinstatement as an approved seller to Fannie Mae, which elevates the level of liquidity available for those loans. In addition, we have completed non-agency eligible, whole loan sales, all on a servicing retained basis, of both fixed-rate and Smart Rate loans, demonstrating that with adequate lead time, the majority of our residential first mortgage loan portfolio could be available for liquidity management purposes. At September 30, 2017, $0.4 million of agency eligible, long-term, fixed-rate first mortgage loans were classified as “held for sale”. During the fiscal year ended September 30, 2017, $13.7 million of agency-compliant HARP II loans and $197.3 million of long-term, fixed-rate, agency-compliant, non-HARP II first mortgage loans were sold to Fannie Mae. In addition to the loan sales to Fannie Mae, during the fiscal year ended September 30, 2017, $38.4 million of long-term, fixed-rate loans were sold to the FHLB of Cincinnati, under their Mortgage Purchase Program.
Overall, while customer and community confidence can never be assured, the Company believes that our liquidity is adequate and that we have adequate access to alternative funding sources.
Monitoring and Controlling Operating Expenses. We continue to focus on managing operating expenses. Our ratio of non-interest expense to average assets was 1.37% for the fiscal year ended September 30, 2017 and 1.45% for the fiscal year ended September 30, 2016. As of September 30, 2017, our average assets per full-time employee and our average deposits per full-time employee were $13.5 million and $8.0 million, respectively. We believe that each of these measures compares favorably with industry averages. Our relatively high average deposits (exclusive of brokered CDs) held at our branch offices ($198.2 million per branch office as of September 30, 2017) contributes to our expense management efforts by limiting the overhead costs of serving our deposit customers. We will continue our efforts to control operating expenses as we grow our business.
Critical Accounting Policies
Critical accounting policies are defined as those that involve significant judgments and uncertainties, and could potentially give rise to materially different results under different assumptions and conditions. We believe that the most critical accounting policies upon which our financial condition and results of operations depend, and which involve the most complex subjective decisions or assessments, are our policies with respect to our allowance for loan losses, income taxes and pension benefits.
Allowance for Loan Losses. The allowance for loan losses is the amount estimated by management as necessary to absorb credit losses incurred in the loan portfolio that are both probable and reasonably estimable at the balance sheet date. The
58
amount of the allowance is based on significant estimates and the ultimate losses may vary from such estimates as more information becomes available or conditions change. The methodology for determining the allowance for loan losses is considered a critical accounting policy by management due to the high degree of judgment involved, the subjectivity of the assumptions used and the potential for changes in the economic environment that could result in changes to the amount of the recorded allowance for loan losses. At September 30, 2017, the allowance for loan losses was $48.9 million or 0.39% of total loans. An increase or decrease of 10% in the allowance at September 30, 2017 would result in a $4.9 million charge or credit, respectively, to income before income taxes.
As a substantial percentage of our loan portfolio is collateralized by real estate, appraisals of the underlying value of property securing loans are critical in determining the charge-offs for specific loans. Assumptions are instrumental in determining the value of properties. Overly optimistic assumptions or negative changes to assumptions could significantly affect the valuation of a property securing a loan and the related allowance determined. Management carefully reviews the assumptions supporting such appraisals to determine that the resulting values reasonably reflect amounts realizable on the related loans.
Management performs a quarterly evaluation of the adequacy of the allowance for loan losses. We consider a variety of factors in establishing this estimate including, but not limited to, current economic conditions, delinquency statistics, geographic concentrations, the adequacy of the underlying collateral, the financial strength of the borrower, results of internal loan reviews and other relevant factors. This evaluation is inherently subjective as it requires material estimates by management that may be susceptible to significant change based on changes in economic and real estate market conditions.
Historically, the evaluation has been comprised of a specific component and a general component. The specific component relates to loans that are delinquent or otherwise identified as a problem loan through the application of our loan review process and our loan grading system. All such loans are evaluated individually, with principal consideration given to the value of the collateral securing the loan. The general component of the evaluation is determined by segregating the remaining loans by type of loan, risk weighting (if applicable) and payment history. We also analyze historical loss experience, delinquency trends, general economic conditions and geographic concentrations. Quantitative loss factors used in determining an appropriate allowance level are supplemented by more qualitative factors that impact potential losses. Qualitative factors include various market conditions, such as collateral values and unemployment rates. This analysis establishes factors that are applied to the loan groups to determine the amount of the general component of the allowance for loan losses.
Actual loan losses may be significantly more than the allowances we have established, which would have a material adverse effect on our financial results.
Income Taxes. We consider accounting for income taxes a critical accounting policy due to the subjective nature of certain estimates that are involved in the calculation. We use the asset/liability method of accounting for income taxes in which deferred tax assets and liabilities are established for the temporary differences between the financial reporting basis and the tax basis of our assets and liabilities. We must assess the realization of the deferred tax asset and, to the extent that we believe that recovery is not likely, a valuation allowance is established. Adjustments to increase or decrease existing valuation allowances, if any, are charged or credited, respectively, to income tax expense. At September 30, 2017, no valuation allowances were outstanding. Even though we have determined a valuation allowance is not required for deferred tax assets at September 30, 2017, there is no guarantee that those assets will be recognizable in the future.
Pension Benefits. The determination of our obligations and expense for pension benefits is dependent upon certain assumptions used in calculating such amounts. Key assumptions used in the actuarial valuations include the discount rate and expected long-term rate of return on plan assets. Actual results could differ from the assumptions and market driven rates may fluctuate. Significant differences in actual experience or significant changes in the assumptions could materially affect future pension obligations and expense.
Comparison of Financial Condition at September 30, 2017 and 2016
Total assets increased $786.5 million, or 6%, to $13.69 billion at September 30, 2017 from $12.91 billion at September 30, 2016. This increase was primarily the result of increases in the balances of loans held for investment and, to a lesser extent, cash and cash equivalents and investment securities.
Cash and cash equivalents increased $37.0 million, or 16%, to $268.2 million at September 30, 2017 from $231.2 million at September 30, 2016, as we hold cash to maintain the level of liquidity described in the Liquidity and Capital Resources section of the Overview.
Investment securities increased $19.6 million, or 4%, to $537.5 million at September 30, 2017 from $517.9 million at September 30, 2016. Investment securities increased as $183.5 million in purchases exceeded the combination of $153.3
59
million in principal paydowns, $5.5 million of net acquisition premium amortization and $5.1 million in net unrealized losses that occurred in the mortgage-backed securities portfolio during the fiscal year ended September 30, 2017. There were no sales of investment securities during the fiscal year ended September 30, 2017.
Loans held for investment, net, increased $710.5 million, or 6%, to $12.42 billion at September 30, 2017 from $11.71 billion at September 30, 2016. Residential mortgage loans increased $663.6 million, or 7%, to $10.86 billion at September 30, 2017 from $10.19 billion at September 30, 2016 as new originations exceeded the combination of principal repayments, loan sales and net charge-offs. The increase in residential mortgage loans reflected the negative impact of $5.3 million in gross charge-offs during the year ended September 30, 2017. During the year ended September 30, 2017, $1.34 billion of three- and five-year “SmartRate” loans were originated while $1.36 billion of 10-, 15-, and 30-year fixed-rate first mortgage loans were originated. During the year ended September 30, 2017 the total fixed-rate portion of our first mortgage loan portfolio increased $100.5 million and was comprised of a decrease of $27.1 million in the balance of fixed-rate loans with original terms of 10 years or less, and an increase of $127.6 million in the balance of fixed-rate loans with original terms greater than 10 years. During the fiscal year ended September 30, 2017, we completed $249.4 million in loan sales, which included $13.7 million of agency-compliant HARP II loans and $197.3 million of long-term, fixed-rate, agency-compliant, non-HARP II first mortgage loans to Fannie Mae, and $38.4 million of long-term fixed-rate loans to the FHLB of Cincinnati.
Augmenting the increase in residential mortgage loans was a $21.0 million, or 1%, increase in the balance of home equity loans and lines of credit during the current year as new originations and additional draws on existing accounts exceeded repayments and charge-offs. This increase reversed a downward trend over the past few years and signals a new focus on the origination of home equity loans and lines of credit. Commitments originated for home equity loans and lines of credit and bridge loans were $1.00 billion for the twelve months ended September 30, 2017 and $438.3 million for the twelve months ended September 30, 2016. Between 2010 and 2015, the Association, in various steps, suspended and then modified its home equity lending products and the markets where they were offered in response to the 2008 financial crisis. At September 30, 2017, the recorded investment related to home equity lines of credit originated subsequent to March 2012, totaled $780.2 million. At September 30, 2017, pending commitments to extend new home equity lines of credit totaled $97.9 million. Refer to the Controlling Our Interest Rate Risk Exposure section of the Overview for additional information.
The total allowance for loan losses decreased $12.9 million, or 21%, to $48.9 million at September 30, 2017 from $61.8 million at September 30, 2016, primarily reflecting improved credit metrics, including reduced net charge-offs and lower loan delinquencies. Refer to Note 4. Loans and Allowance for Loan Losses for additional discussion.
Deposits decreased $179.7 million, or 2%, to $8.15 billion at September 30, 2017 from $8.33 billion at September 30, 2016. The decrease in deposits was the result of a $130.4 million decrease in our CDs, a $39.2 million decrease in our high-yield savings accounts (a subcategory of our savings accounts) and a $9.7 million decrease in our high-yield checking accounts (a subcategory of our checking accounts) during the fiscal year ended September 30, 2017. The change in CDs is attributed to a $211.7 million net decrease in the balance of CDs generated through our retail operations, partially offset by an $81.3 million increase (net of premium and maturities) in brokered CDs acquired during the current fiscal year which had original terms of 33 to 48 months. The balance of CDs at September 30, 2017 included $620.7 million in brokered CDs. We believe that our high-yield savings accounts as well as our high-yield checking accounts provide a stable source of funds. In addition, our high yield savings and high yield checking accounts are expected to reprice in a manner similar to our equity loan products, and, therefore, assist us in managing interest rate risk.
Borrowed funds, all from the FHLB of Cincinnati, increased $952.6 million, or 35%, to $3.67 billion at September 30, 2017 from $2.72 billion at September 30, 2016. This increase reflects an additional $900.0 million of new, short-term advances hedged by interest rate swaps with original terms of five years, combined with a $259.0 million increase in the balance of other short-term advances and partially offset by other principal repayments, as a combination of loan growth, share repurchases and dividend payments led to increased cash demands. The total balance of borrowed funds at September 30, 2017 consisted of short-term advances of $1.11 billion, long-term advances of $1.06 billion with a remaining weighted average maturity of approximately 1.6 years and short-term advances of $1.50 billion aligned with interest rate swap contracts with a remaining weighted average effective maturity of approximately 4.1 years. Interest rate swaps were used during the current fiscal year to extend the duration of short-term borrowings to approximately five years by paying a fixed rate of interest and receiving the variable rate. Refer to the Extending the Duration of Funding Sources section of the Overview for additional discussion regarding short-term borrowings and interest-rate exchange contracts.
Shareholders’ equity increased $29.5 million, or 2%, to $1.69 billion at September 30, 2017 from $1.66 billion at September 30, 2016. This net increase primarily reflected the effect of $88.9 million of net income, the positive impact related to awards under the stock-based compensation plan, the allocation of shares held by the ESOP and the increase in other comprehensive income, partially offset by $52.5 million of repurchases of outstanding common stock and $27.7 million of dividend payments. Refer to Item 5. Market for Registrant’s Common Equity, Related Stockholder Matters and Issuer
60
Purchases of Equity Securities for additional details regarding the repurchase of shares of common stock and the payment of dividends. As a result of July 19, 2017 and July 26, 2016 mutual member votes, Third Federal Savings, MHC, the mutual holding company that owns 81% of the outstanding stock of the Company, waived the receipt of its share of the dividends paid.
61
Analysis of Net Interest Income
Net interest income represents the difference between the income we earn on our interest-earning assets and the expense we pay on our interest-bearing liabilities. Net interest income depends on the volume of interest-earning assets and interest-bearing liabilities and the rates earned on such assets and the rates paid on such liabilities.
Average balances and yields. The following table sets forth average balances, average yields and costs, and certain other information at and for the fiscal years indicated. No tax-equivalent yield adjustments were made, as the effect thereof was not material. Average balances are derived from daily average balances. Non-accrual loans were included in the computation of average balances, but have been reflected in the table as loans carrying a zero yield. The yields set forth below include the effect of deferred fees, discounts and premiums that are amortized or accreted to interest income or interest expense.
For the Fiscal Years Ended September 30, | ||||||||||||||||||||||||||||||||
2017 | 2016 | 2015 | ||||||||||||||||||||||||||||||
Average Balance | Interest Income/ Expense | Yield/ Cost | Average Balance | Interest Income/ Expense | Yield/ Cost | Average Balance | Interest Income/ Expense | Yield/ Cost | ||||||||||||||||||||||||
(Dollars in thousands) | ||||||||||||||||||||||||||||||||
Interest-earning assets: | ||||||||||||||||||||||||||||||||
Interest-earning cash equivalents | $ | 214,465 | $ | 1,961 | 0.91 | % | $ | 143,079 | $ | 641 | 0.45 | % | $ | 851,047 | $ | 2,206 | 0.26 | % | ||||||||||||||
Investment securities | — | — | — | % | 162 | 2 | 1.23 | % | 2,015 | 25 | 1.24 | % | ||||||||||||||||||||
Mortgage-backed securities | 526,610 | 9,041 | 1.72 | % | 555,996 | 9,388 | 1.69 | % | 572,232 | 9,546 | 1.67 | % | ||||||||||||||||||||
Loans | 12,104,277 | 394,447 | 3.26 | % | 11,380,798 | 375,624 | 3.30 | % | 10,951,984 | 369,302 | 3.37 | % | ||||||||||||||||||||
Federal Home Loan Bank stock | 81,105 | 3,546 | 4.37 | % | 69,658 | 2,786 | 4.00 | % | 67,360 | 2,398 | 3.56 | % | ||||||||||||||||||||
Total interest-earning assets | 12,926,457 | 408,995 | 3.16 | % | 12,149,693 | 388,441 | 3.20 | % | 12,444,638 | 383,477 | 3.08 | % | ||||||||||||||||||||
Noninterest-earning assets | 358,213 | 337,083 | 319,063 | |||||||||||||||||||||||||||||
Total assets | $ | 13,284,670 | $ | 12,486,776 | $ | 12,763,701 | ||||||||||||||||||||||||||
Interest-bearing liabilities: | ||||||||||||||||||||||||||||||||
Checking accounts | $ | 992,042 | 918 | 0.09 | % | $ | 990,592 | 1,289 | 0.13 | % | $ | 995,736 | 1,371 | 0.14 | % | |||||||||||||||||
Savings accounts | 1,514,275 | 2,093 | 0.14 | % | 1,563,448 | 2,811 | 0.18 | % | 1,636,093 | 3,045 | 0.19 | % | ||||||||||||||||||||
Certificates of deposit | 5,672,212 | 84,410 | 1.49 | % | 5,756,861 | 85,900 | 1.49 | % | 5,836,053 | 89,110 | 1.53 | % | ||||||||||||||||||||
Borrowed funds | 3,231,709 | 42,678 | 1.32 | % | 2,284,881 | 28,026 | 1.23 | % | 2,312,977 | 19,824 | 0.86 | % | ||||||||||||||||||||
Total interest-bearing liabilities | 11,410,238 | 130,099 | 1.14 | % | 10,595,782 | 118,026 | 1.11 | % | 10,780,859 | 113,350 | 1.05 | % | ||||||||||||||||||||
Noninterest-bearing liabilities | 190,873 | 187,417 | 184,587 | |||||||||||||||||||||||||||||
Total liabilities | 11,601,111 | 10,783,199 | 10,965,446 | |||||||||||||||||||||||||||||
Shareholders’ equity | 1,683,559 | 1,703,577 | 1,798,255 | |||||||||||||||||||||||||||||
Total liabilities and shareholders’ equity | $ | 13,284,670 | $ | 12,486,776 | $ | 12,763,701 | ||||||||||||||||||||||||||
Net interest income | $ | 278,896 | $ | 270,415 | $ | 270,127 | ||||||||||||||||||||||||||
Interest rate spread(1) | 2.02 | % | 2.09 | % | 2.03 | % | ||||||||||||||||||||||||||
Net interest-earning assets(2) | $ | 1,516,219 | $ | 1,553,911 | $ | 1,663,779 | ||||||||||||||||||||||||||
Net interest margin(3) | 2.16 | % | 2.23 | % | 2.17 | % | ||||||||||||||||||||||||||
Average interest-earning assets to average interest-bearing liabilities | 113.29 | % | 114.67 | % | 115.43 | % | ||||||||||||||||||||||||||
______________________
(1) | Interest rate spread represents the difference between the yield on average interest-earning assets and the cost of average interest-bearing liabilities. |
(2) | Net interest-earning assets represent total interest-earning assets less total interest-bearing liabilities. |
(3) | Net interest margin represents net interest income divided by total interest-earning assets. |
62
Rate/Volume Analysis. The following table presents the effects of changing rates (yields) and volumes (average balances) on our net interest income for the fiscal years indicated. The rate column shows the effects attributable to changes in rate (changes in rate multiplied by prior volume). The volume column shows the effects attributable to changes in volume (changes in volume multiplied by prior rate). The net column represents the sum of the prior columns. For purposes of this table, changes attributable to both rate and volume, which cannot be segregated, have been allocated proportionately, based on the changes due to rate and the changes due to volume.
For the Fiscal Years Ended September 30, 2017 vs. 2016 | For the Fiscal Years Ended September 30, 2016 vs. 2015 | ||||||||||||||||||||||
Increase (Decrease) Due to | Increase (Decrease) Due to | ||||||||||||||||||||||
Volume | Rate | Net | Volume | Rate | Net | ||||||||||||||||||
(In thousands) | |||||||||||||||||||||||
Interest-earning assets: | |||||||||||||||||||||||
Interest-earning cash equivalents | $ | 428 | $ | 892 | $ | 1,320 | $ | (2,548 | ) | $ | 983 | $ | (1,565 | ) | |||||||||
Investment securities | (1 | ) | (1 | ) | (2 | ) | (23 | ) | — | (23 | ) | ||||||||||||
Mortgage-backed securities | (503 | ) | 156 | (347 | ) | (273 | ) | 115 | (158 | ) | |||||||||||||
Loans | 23,627 | (4,804 | ) | 18,823 | 14,261 | (7,939 | ) | 6,322 | |||||||||||||||
Federal Home Loan Bank stock | 486 | 274 | 760 | 84 | 304 | 388 | |||||||||||||||||
Total interest-earning assets | 24,037 | (3,483 | ) | 20,554 | 11,501 | (6,537 | ) | 4,964 | |||||||||||||||
Interest-bearing liabilities: | |||||||||||||||||||||||
Checking accounts | 2 | (373 | ) | (371 | ) | (7 | ) | (75 | ) | (82 | ) | ||||||||||||
Passbook savings | (86 | ) | (632 | ) | (718 | ) | (133 | ) | (101 | ) | (234 | ) | |||||||||||
Certificates of deposit | (1,260 | ) | (230 | ) | (1,490 | ) | (1,199 | ) | (2,011 | ) | (3,210 | ) | |||||||||||
Borrowed funds | 12,365 | 2,287 | 14,652 | (243 | ) | 8,445 | 8,202 | ||||||||||||||||
Total interest-bearing liabilities | 11,021 | 1,052 | 12,073 | (1,582 | ) | 6,258 | 4,676 | ||||||||||||||||
Net change in net interest income | $ | 13,016 | $ | (4,535 | ) | $ | 8,481 | $ | 13,083 | $ | (12,795 | ) | $ | 288 | |||||||||
Comparison of Operating Results for the Fiscal Years Ended September 30, 2017 and 2016
General. Net income increased $8.3 million, or 10%, to $88.9 million for the fiscal year ended September 30, 2017 compared to $80.6 million for the fiscal year ended September 30, 2016. This change was attributed to a $9.0 million decrease in the provision for loan losses and an increase of $8.5 million in net interest income, partially offset by an increase of $1.4 million in non-interest expense and a decrease of $5.2 million in non-interest income.
Interest and Dividend Income. Total interest income increased $20.6 million, or 5%, to $409.0 million for the fiscal year ended September 30, 2017 compared to $388.4 million for the prior fiscal year. The increase in interest income resulted primarily from an increase in interest income from loans combined with increases in interest income from other interest-earning cash equivalents, and to a lesser extent, FHLB stock, partially offset by a decrease in interest income from investment securities available for sale.
Interest income on loans increased $18.8 million, or 5%, to $394.4 million compared to $375.6 million for the prior fiscal year. This increase was attributed to a $723.5 million increase in the average balance of loans to $12.10 billion in the current fiscal year compared to $11.38 billion during the prior fiscal year as new loan production exceeded repayments and loan sales. The impact from the increase in the average balance of loans was partially offset by a four basis point decrease in the average yield on loans to 3.26% from 3.30% as historically low interest rates have kept the level of refinance activity relatively high resulting in new originations at lower rates compared to the rest of our portfolio. Additionally, both our “Smart Rate” adjustable-rate first mortgage loan and our 10-year, fixed-rate first mortgage loan originations for the fiscal year ended September 30, 2017, were originated at interest rates below rates offered on our traditional 15- and 30-year fixed-rate products and contributed to the lower average yield. During the fiscal year ended September 30, 2017, loan sales totaled $249.4 million while during the fiscal year ended September 30, 2016, loan sales totaled $200.3 million.
Interest income on interest-earning cash equivalents increased $1.4 million, or 233%, to $2.0 million compared to $0.6 million for the prior fiscal year. As a result of the additional required investment in FHLB stock and an increase in the dividend yield, dividend income on FHLB stock increased $0.7 million, or 25%, to $3.5 million compared to $2.8 million during the prior fiscal year.
63
Interest Expense. Interest expense increased $12.1 million, or 10%, to $130.1 million for the fiscal year ended September 30, 2017 from $118.0 million for the 2016 fiscal year. The change resulted primarily from a $14.7 million increase in interest expense on borrowed funds partially offset by modest decreases in interest expense on checking accounts, savings accounts and CDs.
Interest expense on CDs decreased $1.5 million, or 2%, to $84.4 million compared to $85.9 million for fiscal 2016. The change was attributed to an $84.7 million, or 1%, decrease in the average balance of CDs to $5.67 billion from $5.76 billion, as the average rate we paid on CDs was 1.49% for both years. To optimally manage our funding costs during the current fiscal year, many maturing, higher rate CDs that were not renewed were replaced with with longer-term brokered CDs or lower rate borrowed funds.
Interest expense on borrowed funds increased $14.7 million, or 53%, to $42.7 million compared to $28.0 million for fiscal 2016. The increase was attributed to a nine basis point increase in the average rate paid for these funds, to 1.32% from 1.23% during fiscal 2016, combined with the impact of a $946.8 million, or 41%, increase in the average balance of borrowed funds to $3.23 billion during the current fiscal year from $2.28 billion during fiscal 2016. The increase in the average balance of borrowed funds was used to fund our balance sheet growth and our capital management activities, including share repurchases and dividend payments. The increases in borrowed funds were in overnight and short-term advances and longer-term advances with initial effective durations of approximately five years as hedged by interest rate swaps. Refer to the Extending the Duration of Funding Sources section of the Overview and Comparison of Financial Condition for further discussion.
Net Interest Income. Net interest income increased $8.5 million, or 3%, to $278.9 million for the fiscal year ended September 30, 2017 compared to $270.4 million for the prior fiscal year. Average interest-earning assets increased during the current fiscal year by $776.8 million, or 6%, when compared to the prior fiscal year. The increase in average assets was attributed primarily to the growth of our loan portfolio and to a lesser extent other interest-earning cash equivalents and FHLB stock, partially offset by a decrease in mortgage-backed securities. Partially offsetting the increase in average interest earning assets was a four basis point decrease in the yield on those assets to 3.16% from 3.20%. Our interest rate spread decreased seven basis points to 2.02% compared to 2.09% for the prior fiscal year. Our net interest margin was 2.16% for the current fiscal year and 2.23% for the prior fiscal year. Our interest rate spread and net interest margin narrowed as our asset yields decreased while our overall funding costs increased as we extended the effective duration of our borrowed funds through the use of interest rate swaps.
Provision for Loan Losses. We establish provisions for loan losses, which are charged to operations, in order to maintain the allowance for loan losses at a level we consider necessary to absorb credit losses incurred in the loan portfolio that are both probable and reasonably estimable at the balance sheet date. In determining the level of the allowance for loan losses, we consider past and current loss experience, evaluations of real estate collateral, current economic conditions, volume and type of lending, adverse situations that may affect a borrower’s ability to repay a loan and the levels of non-performing and other classified loans. The amount of the allowance is based on estimates and the ultimate losses may vary from such estimates as more information becomes available or conditions change. We assess the allowance for loan losses on a quarterly basis and make provisions for loan losses in order to maintain the adequacy of the allowance as described in the next paragraph. Recently, improving regional employment levels, stabilization in residential real estate values in many markets, recovering capital and credit markets, and upturns in consumer confidence have resulted in better credit metrics for us. Nevertheless, the depth of the decline in housing values that accompanied the 2008 financial crisis still presents significant challenges for many of our borrowers who may attempt to sell their homes or refinance their loans as a means to self-cure a delinquency. Refer to Critical Accounting Policies - Allowance for Loan Losses section of the Overview for further discussion.
Based on our evaluation, we recorded a credit for loan losses of $17.0 million for the fiscal year ended September 30, 2017 and a credit of $8.0 million for the fiscal year ended September 30, 2016. The current credit for loan losses reflects reduced levels of loan delinquencies and net charge-offs, but we continue our awareness of the relative values of residential properties in comparison to their cyclical peaks as well as the uncertainty that persists in the current economic environment, which continues to challenge many of our loan customers. As delinquencies in the portfolio have been resolved through pay-off, short sale or foreclosure, or management determines the collateral is not sufficient to satisfy the loan, uncollected balances have been charged against the allowance for loan losses previously provided. The level of net charge-offs decreased during fiscal year 2017 to $4.2 million of net recoveries as compared to $1.8 million of net charge-offs during the fiscal year ended September 30, 2016. Net recoveries combined with the $17.0 million credit for loan losses recorded for the current fiscal year resulted in a decrease in the balance of the allowance for loan losses. Net charge-offs of $1.8 million and a credit for loan losses of $8.0 million were recorded for the fiscal year ended September 30, 2016. The allowance for loan losses was $48.9 million, or 0.39% of the total recorded investment in loans receivable, at September 30, 2017, compared to $61.8 million, or 0.52% of the total recorded investment in loans receivable, at September 30, 2016. Balances of recorded investments are net of deferred fees/expenses and any applicable loans-in-process.
64
The total recorded investment in non-accrual loans decreased $10.9 million during the fiscal year ended September 30, 2017 compared to a $16.8 million decrease during the fiscal year ended September 30, 2016.
The recorded investment in non-accrual loans in our residential Core portfolio decreased $7.5 million, or 15%, during the current fiscal year, to $43.8 million at September 30, 2017, compared to an $11.0 million decrease during the fiscal year ended September 30, 2016. At September 30, 2017, the recorded investment in our Core portfolio was $10.76 billion, compared to $10.08 billion at September 30, 2016. During the current fiscal year, Core portfolio net recoveries were $2.4 million, as compared to net charge-offs of $0.6 million during the fiscal year ended September 30, 2016. The $43.8 million balance in Core portfolio non-accrual loans at September 30, 2017 includes $27.4 million in TDRs which are current but included with non-accrual loans for a minimum period of six months from their restructuring date.
The recorded investment in non-accrual loans in our residential Home Today portfolio decreased $1.3 million, or 7% during the current fiscal year, to $18.1 million at September 30, 2017 compared to a $3.1 million decrease during the fiscal year ended September 30, 2016. At September 30, 2017, the recorded investment in our Home Today portfolio was $107.7 million, compared to $120.4 million at September 30, 2016. During the current fiscal year, Home Today net charge-offs were $1.0 million as compared to net charge-offs of $1.3 million during the fiscal year ended September 30, 2016. The $18.1 million balance in Home Today non-accrual loans includes $10.3 million in TDRs which are current but included with non-accrual loans for a minimum period of six months from their restructuring date.
The recorded investment in non-accrual home equity loans and lines of credit decreased $2.0 million, or 11%, during the current fiscal year, to $17.2 million at September 30, 2017 compared to a $2.3 million decrease during the fiscal year ended September 30, 2016. The recorded investment in our home equity loans and lines of credit portfolio at September 30, 2017 was $1.57 billion, compared to $1.54 billion at September 30, 2016. During the current fiscal year, home equity loans and lines of credit net recoveries were $2.7 million as compared to net recoveries of $0.1 million during the fiscal year ended September 30, 2016. We believe that non-performing home equity loans and lines of credit, on a relative basis, represent a higher level of credit risk than Core loans as these home equity loans and lines of credit generally hold subordinated lien positions. The seriously delinquent balances of home equity loans and lines of credit were $5.4 million, or less than 1%, of the home equity loans and lines of credit portfolio at September 30, 2017 compared to $4.9 million, or less than 1%, at September 30, 2016.
At September 30, 2017 and 2016, we believe we had recorded an allowance for loan losses that provides for all losses that are both probable and reasonable to estimate at September 30, 2017 and 2016, respectively.
Refer to Lending Activities in Item 1. Business for additional discussion and disclosure related to our provisions for loan losses.
Non-Interest Income. Non-interest income decreased $5.2 million, or 21%, to $19.8 million during the fiscal year ended September 30, 2017 compared to $25.0 million for the prior fiscal year mainly as a result of lower gains on the sale of loans and a decrease in death benefits from BOLI contracts during the current fiscal year. Gains on the sales of loans in the current fiscal year decreased $4.0 million from the prior fiscal year as market interest rate movements contributed to lower percentage gains on $249.4 million in sales during the current fiscal year as compared to the gains realized on $200.3 million in sales during the fiscal year ending September 30, 2016.
Non-Interest Expense. Non-interest expense increased $1.4 million, or 1%, to $182.4 million during the fiscal year ended September 30, 2017 compared to $181.0 million for fiscal 2016. This increase resulted primarily from a combination of higher marketing expenses and other expenses, partially offset by a combination of lower real estate owned expenses and compensation related expenses. The $2.6 million decrease in real estate owned expenses (which includes associated legal and maintenance expenses as well as gains (losses) on the disposal of properties) was driven in part by the decrease in real estate owned assets since September 30, 2016. The $2.8 million increase in marketing expenditures can be attributed to the timing of media campaigns supporting our lending activities. Other operating expenses increased $1.7 million, which consisted primarily of a $1.1 million increase in professional services expenses. Salaries and employee benefits decreased $0.6 million during the current fiscal year compared to the fiscal year ended September 30, 2016. This decrease was primarily due to a combination of a $2.2 million decrease in stock based compensation and a $1.9 million increase in the deferral of salary compensation related to direct loan origination costs, partially offset by a $3.6 million increase in associate compensation costs.
Income Tax Expense. The provision for income taxes was $44.5 million for the fiscal year ended September 30, 2017 compared to $41.8 million for the fiscal year ended September 30, 2016. The provision for fiscal year 2017 included $43.4 million of federal income tax provision and $1.1 million of state income tax provision. The provision for fiscal year ended September 30, 2016 included $40.9 million of federal income tax provision and $0.9 million of state income tax provision. The increase in state income tax between the current and prior fiscal years is reflective of the growth in our expansion states. Our federal effective tax rate decreased to 32.8% during fiscal 2017 from 33.7% during fiscal year 2016, mainly as a result of
65
recognizing $1.1 million of excess tax benefits in the current year related to our adoption, effective October 1, 2016, of ASU 2016-09, Compensation - Stock Compensation (Topic 718), Improvements to Employee Share-Based Payment Accounting. Under this standard, excess tax benefits and tax deficiencies related to stock-based compensation are recognized in the provision for income taxes. Previously the amounts were recognized as part of paid-in capital in shareholders' equity. Our expected federal effective income tax rate is less than the federal statutory rate of 35.0%, primarily because of our ownership of bank owned life insurance contracts. Non-taxable income on bank owned insurance contracts was $6.4 million during fiscal 2017 and $7.4 million during fiscal 2016.
Comparison of Operating Results for the Fiscal Years Ended September 30, 2016 and 2015
General. Net income increased $8.0 million, or 11%, to $80.6 million for the fiscal year ended September 30, 2016 compared to $72.6 million for the fiscal year ended September 30, 2015. This change was attributed to a $5.0 million decrease in the provision for loan losses and a $7.0 million decrease in non-interest expenses. Net interest income was relatively unchanged during fiscal 2016 compared to fiscal 2015.
Interest and Dividend Income. Total interest income increased $4.9 million, or 1%, to $388.4 million for the fiscal year ended September 30, 2016 compared to $383.5 million for fiscal 2015. The increase in interest income resulted primarily from an increase in interest income from loans partially offset by a decrease in interest income from other interest-earning cash equivalents.
Interest income on loans for fiscal 2016 increased $6.3 million, or 2%, to $375.6 million compared to $369.3 million for fiscal 2015. This increase was attributed to a $428.8 million increase in the average balance of loans to $11.38 billion in fiscal 2016 compared to $10.95 billion during fiscal 2015 as new loan production exceeded repayments and loan sales. The impact from the increase in the average balance of loans was partially offset by a seven basis point decrease in the average yield on loans to 3.30% from 3.37% as historically low interest rates kept the level of refinance activity relatively high resulting in new originations at lower rates compared to the rest of our portfolio. Additionally, both our “Smart Rate” adjustable-rate first mortgage loan and our 10-year, fixed-rate first mortgage loan originations for the fiscal year ended September 30, 2016, were originated at interest rates below rates offered on our traditional 15- and 30-year fixed-rate products and contributed to the lower average yield. During the fiscal year ended September 30, 2016, loan sales totaled $200.3 million while during the fiscal year ended September 30, 2015, loan sales totaled $160.1 million.
Interest income on interest-earning cash equivalents for fiscal 2016 decreased $1.6 million, or 73%, to $0.6 million compared to $2.2 million for fiscal 2015. The decrease in interest income can be attributed to utilizing a strategy during fiscal 2015 to increase income. The strategy involved borrowing, on an overnight basis, approximately $1.00 billion of additional funds from the FHLB at the beginning of a particular quarter and repaying it prior to the end of that quarter. The proceeds of the borrowings, net of the required investment in FHLB stock, were deposited at the Federal Reserve. Because of increases in the interest rates charged by the FHLB, the strategy was not utilized during fiscal 2016. As a result of the additional required investment in FHLB stock, dividend income on FHLB stock for fiscal 2016 increased $0.4 million, or 17%, to $2.8 million compared to $2.4 million during fiscal 2015. Although the strategy's borrowings component was not utilized during fiscal 2016, the FHLB stock component remained in place and the receipt of increased FHLB stock dividends continued.
Interest Expense. Interest expense increased $4.6 million, or 4%, to $118.0 million for the fiscal year ended September 30, 2016 from $113.4 million for the 2015 fiscal year. The change resulted primarily from an $8.2 million increase in interest expense on borrowed funds partially offset by a decrease in interest expense on CDs.
Interest expense on CDs for fiscal 2016 decreased $3.2 million, or 4%, to $85.9 million compared to $89.1 million for fiscal 2015. The change was attributed to a four basis point decrease in the average rate we paid on CDs to 1.49% from 1.53% combined with a $79.2 million, or 1%, decrease in the average balance of CDs to $5.76 billion from $5.84 billion. Rates were adjusted on deposits in response to changes in general market rates as well as to changes in the rates paid by our competition on short-term CDs. Additionally, to optimally manage our funding costs during fiscal 2016, many maturing, higher rate CDs that were not renewed were replaced with with longer-term brokered CDs or lower rate borrowed funds.
Interest expense on borrowed funds for fiscal 2016 increased $8.2 million, or 41%, to $28.0 million compared to $19.8 million for fiscal 2015. The increase was attributed to a 37 basis point increase in the average rate paid for these funds during fiscal 2016, to 1.23% from 0.86% during fiscal 2015. Partially offsetting the impact of the increase in the average rate paid was a $28.1 million, or 1%, decrease in the average balance of borrowed funds to $2.28 billion during fiscal 2016 from $2.31 billion during fiscal 2015. The net decrease in the average balance was attributed to utilizing the strategy to increase income in fiscal 2015, as discussed earlier. The strategy was not utilized in fiscal 2016. Partially offsetting the decrease in the average balance resulting from discontinuing this strategy was an increase in FHLB of Cincinnati borrowings as part of our efforts to lengthen the duration of our interest bearing funding sources. Refer to the Extending the Duration of Funding Sources section
66
of the Overview for further discussion. To better manage funding costs, longer term borrowed funds from the FHLB of Cincinnati were also used to fund mortgage loan originations.
Net Interest Income. Net interest income increased $0.3 million, or less than 1%, to $270.4 million for the fiscal year ended September 30, 2016 compared to $270.1 million for fiscal 2015. Average interest-earning assets decreased during fiscal 2016 by $294.9 million, or 2%, when compared to fiscal 2015. The decrease in average assets was attributed primarily to the use of the strategy, discussed earlier, in fiscal 2015, which was not utilized in fiscal 2016, partially offset by the growth of our loan portfolio. Our interest rate spread increased six basis points to 2.09% for fiscal 2016 compared to 2.03% for fiscal 2015. Our net interest margin was 2.23% for fiscal 2016 and 2.17% for fiscal 2015. The change in these performance ratios was impacted by the net income strategy utilized in fiscal 2015. The strategy, which served to increase net income slightly also negatively impacted the interest rate spread and net interest margin due to the increase in the average balance of low-yield, interest-earning cash equivalents.
Provision for Loan Losses. Based on our evaluation, we recorded a negative provision for loan losses of $8.0 million for the fiscal year ended September 30, 2016 and a negative provision of $3.0 million for the fiscal year ended September 30, 2015. The fiscal 2016 negative provision for loan loss reflected reduced levels of loan delinquencies and net charge-offs, but we continued our awareness of the relative values of residential properties in comparison to their cyclical peaks as well as the uncertainty that persisted in the economic environment, which continued to challenge many of our loan customers. As delinquencies in the portfolio were resolved through pay-off, short sale or foreclosure, or management determined the collateral was not sufficient to satisfy the loan, uncollected balances were charged against the allowance for loan losses previously provided. The level of net charge-offs decreased during fiscal 2016 to $1.8 million as compared to $6.8 million during fiscal 2015. Net charge-offs combined with the $8.0 million negative provision for loan losses recorded for fiscal 2016 resulted in a decrease in the balance of the allowance for loan losses. Net charge-offs of $6.8 million and a negative provision for loan losses of $3.0 million were recorded for fiscal 2015. The allowance for loan losses was $61.8 million, or 0.52% of the total recorded investment in loans receivable, at September 30, 2016, compared to $71.6 million, or 0.64% of the total recorded investment in loans receivable, at September 30, 2015. Balances of recorded investments were net of deferred fees and any applicable loans-in-process.
The total recorded investment in non-accrual loans decreased $16.8 million during the fiscal year ended September 30, 2016 compared to a $28.7 million decrease during the fiscal year ended September 30, 2015.
The recorded investment in non-accrual loans in our residential Core portfolio decreased $11.0 million, or 18%, during fiscal 2016, to $51.3 million at September 30, 2016, compared to a $17.1 million decrease during fiscal 2015. At September 30, 2016, the recorded investment in our Core portfolio was $10.08 billion, compared to $9.47 billion at September 30, 2015. During fiscal 2016, Core portfolio net charge-offs were $0.6 million, as compared to net charge-offs of $1.5 million during fiscal 2015. The $51.3 million balance in non-accrual loans at September 30, 2016 included $31.1 million in TDRs which were current but included with non-accrual loans for a minimum period of six months from their restructuring date.
The recorded investment in non-accrual loans in our residential Home Today portfolio decreased $3.1 million, or 14% during fiscal 2016, to $19.5 million at September 30, 2016 compared to a $7.4 million decrease during fiscal 2015. At September 30, 2016, the recorded investment in our Home Today portfolio was $120.4 million, compared to $134.0 million at September 30, 2015. During fiscal 2016, Home Today net charge-offs were $1.3 million as compared to net charge-offs of $1.9 million during fiscal 2015. The $19.5 million balance in Home Today non-accrual loans included $10.7 million in TDRs which were current but included with non-accrual loans for a minimum period of six months from their restructuring date.
The recorded investment in non-accrual home equity loans and lines of credit decreased $2.3 million, or 11%, during fiscal 2016, to $19.2 million at September 30, 2016 compared to a $4.7 million decrease during fiscal 2015. The recorded investment in our home equity loans and lines of credit portfolio at September 30, 2016, was $1.54 billion, compared to $1.63 billion at September 30, 2015. During fiscal 2016, home equity loans and lines of credit net recoveries were $0.1 million as compared to net charge-offs of $3.6 million during fiscal 2015. We believe that non-performing home equity loans and lines of credit, on a relative basis, represented a higher level of credit risk than Core loans as these home equity loans and lines of credit generally hold subordinated lien positions. The seriously delinquent balances of home equity loans and lines of credit were $4.9 million, or less than 1%, of the home equity loans and lines of credit portfolio at September 30, 2016 compared to $5.6 million, or less than 1%, at September 30, 2015.
At September 30, 2016 and 2015, we believe we had recorded an allowance for loan losses that provides for all losses that are both probable and reasonable to estimate at September 30, 2016 and 2015, respectively.
Refer to Lending Activities in Item 1. Business for additional discussion and disclosure related to our provisions for loan losses.
67
Non-Interest Income. Non-interest income increased $0.7 million, or 3%, to $25.0 million during fiscal 2016 compared to $24.3 million for fiscal 2015 mainly as a result of increased net gains on the sale of loans partially offset by a decrease in loan fees and service charges and other. The increase in the net gain on sales of loans primarily reflected a higher volume of loan sales in fiscal 2016, $200.3 million, as compared to $160.1 million during fiscal 2015. This increase was partially offset by a decrease in net loan servicing fees received in connection with the smaller portfolio of loans serviced for others included in loan fees and service charges and a decrease in income received in connection with reduced real estate owned activity included in other.
Non-Interest Expense. Non-interest expense decreased $7.0 million, or 4%, to $181.0 million during fiscal 2016 compared to $188.0 million for fiscal 2015. This decrease resulted primarily from lower real estate owned expense, marketing expenses, and other operating expenses partially offset by higher data processing expenses. The $3.9 million decrease in real estate owned expenses (which includes associated legal and maintenance expenses as well as gains (losses) on the disposal of properties) was driven in part by the decrease in real estate owned assets since September 30, 2015. The $2.9 million decrease in marketing expenditures can be attributed to the timing of media campaigns supporting our lending activities. Other operating expenses decreased $1.4 million, which consisted primarily of a $1.0 million decrease in professional services expenses, and a $0.6 million decrease in postage/courier fees partially offset by a $0.7 increase in expenses associated with originating loans. Salaries and employee benefits increased $0.6 million during fiscal 2016 compared to fiscal 2015. This increase was primarily due to a $1.2 million increase in pension costs partially offset by a $0.6 million decrease in stock based compensation.
Income Tax Expense. The provision for income taxes was $41.8 million for fiscal 2016 compared to $36.8 million for fiscal 2015. The provision for fiscal 2016 included $40.9 million of federal income tax provision and $932 thousand of state income tax provision. The provision for fiscal 2015 included $36.7 million of federal income tax provision and $143 thousand of state income tax provision. The increase in state income tax between fiscal 2016 and 2015 was reflective of the growth in our expansion states. Our federal effective tax rate increased to 33.7% during fiscal 2016 from 33.6% during fiscal year 2015. Our expected federal effective income tax rate was less than the federal statutory rate of 35.0%, primarily because of our ownership of bank owned life insurance contracts. Non-taxable income on bank owned insurance contracts was $7.4 million during fiscal 2016 and $7.3 million during fiscal 2015.
Liquidity and Capital Resources
Liquidity is the ability to meet current and future financial obligations of a short-term nature. Our primary sources of funds consist of deposit inflows, loan repayments, advances from the FHLB of Cincinnati, borrowings from the FRB-Cleveland Discount Window, proceeds from brokered CDs transactions, principal repayments and maturities of securities, and sales of loans.
In addition to the primary sources of funds described above, we have the ability to obtain funds through the use of collateralized borrowings in the wholesale markets, and from sales of securities. Also, access to the equity capital markets via a supplemental minority stock offering or a full conversion (second step) transaction remain as other potential sources of liquidity, although these channels generally require six to nine months of lead time.
While maturities and scheduled amortization of loans and securities are predictable sources of funds, deposit flows and mortgage prepayments are greatly influenced by general interest rates, economic conditions and competition. The Association’s Asset/Liability Management Committee is responsible for establishing and monitoring our liquidity targets and strategies in order to ensure that sufficient liquidity exists for meeting the borrowing needs and deposit withdrawals of our customers as well as unanticipated contingencies. We generally seek to maintain a minimum liquidity ratio of 5% (which we compute as the sum of cash and cash equivalents plus unencumbered investment securities for which ready markets exist, divided by total assets). For the year ended September 30, 2017, our liquidity ratio averaged 5.65%. We believe that we had sufficient sources of liquidity to satisfy our short- and long-term liquidity needs as of September 30, 2017.
We regularly adjust our investments in liquid assets based upon our assessment of expected loan demand, expected deposit flows, yields available on interest-earning deposits and securities and the objectives of our asset/liability management program. Excess liquid assets are generally invested in interest-earning deposits and short- and intermediate-term securities.
Our most liquid assets are cash and cash equivalents. The levels of these assets are dependent on our operating, financing, lending and investing activities during any given period. At September 30, 2017, cash and cash equivalents totaled $268.2 million which represented an increase of 16% from September 30, 2016.
Investment securities classified as available-for-sale, which provide additional sources of liquidity, totaled $537.5 million at September 30, 2017.
68
During the year ended September 30, 2017, loan sales to Fannie Mae totaled $211.0 million, which included $13.7 million of loans that qualified under Fannie Mae's HARP II initiative and $15.3 million of loans that qualified under Fannie Mae's HomeReady initiative. Loans originated under the HARP II an HomeReady initiatives are classified as “held for sale” at origination. Loans originated under Fannie Mae compliant procedures other than HARP II and HomeReady are classified as “held for investment” until they are specifically identified for sale.
In addition to the loan sales to Fannie Mae, during the year ended September 30, 2017, loan sales to the FHLB of Cincinnati, under their Mortgage Purchase Program, totaled $38.4 million. Loans that qualify under the FHLB Mortgage Purchase Program are classified as “held for investment” until they are specifically identified for sale.
At September 30, 2017, $0.4 million of long-term, fixed-rate residential first mortgage loans were classified as “held for sale,” all of which qualified under Fannie Mae's HARP II or HomeReady initiatives. There were no loan sale commitments outstanding at September 30, 2017.
Our cash flows are derived from operating activities, investing activities and financing activities as reported in our Consolidated Statements of Cash Flows included in the Consolidated Financial Statements.
At September 30, 2017, we had $548.9 million in loan commitments outstanding. In addition to commitments to originate loans, we had $1.43 billion in undisbursed home equity lines of credit to borrowers. CDs due within one year of September 30, 2017 totaled $2.13 billion, or 26.1% of total deposits. If these deposits do not remain with us, we will be required to seek other sources of funds, including loan sales, sales of investment securities, other deposit products, including new CDs, brokered CDs, FHLB advances, borrowings from the FRB-Cleveland Discount Window or other collateralized borrowings. Depending on market conditions, we may be required to pay higher rates on such deposits or other borrowings than we currently pay on the CDs due on or before September 30, 2018. We believe, however, based on past experience, that a significant portion of such deposits will remain with us. Generally, we have the ability to attract and retain deposits by adjusting the interest rates offered.
Our primary investing activities are originating residential mortgage loans and purchasing investments. During the year ended September 30, 2017, we originated $2.70 billion of residential mortgage loans, and during the year ended September 30, 2016, we originated $2.59 billion of residential mortgage loans. We purchased $183.5 million of securities during the year ended September 30, 2017, and $95.2 million during the year ended September 30, 2016.
Financing activities consist primarily of changes in deposit accounts, changes in the balances of principal and interest owed on loans serviced for others, FHLB advances and borrowings from the FRB-Cleveland Discount Window. We experienced a net decrease in total deposits of $179.7 million during the year ended September 30, 2017, which reflected the active management of the overall cost of funding between maturing CDs and wholesale borrowings, compared to a net increase of $45.5 million during the year ended September 30, 2016. Deposit flows are affected by the overall level of interest rates, the interest rates and products offered by us and our local competitors, and by other factors. The net decrease in total deposits during the year ended September 30, 2017, was partially offset by the $80.9 million increase in the balance of brokered CDs, to $620.7 million, from $539.8 million at September 30, 2016. During the year ended September 30, 2016 the balance of brokered CDs increased by $19.7 million. Principal and interest owed on loans serviced for others experienced a net decrease of $13.6 million to $35.8 million during the year ended September 30, 2017 compared to a net decrease of $0.1 million to $49.4 million during the year ended September 30, 2016. During the year ended September 30, 2017, we increased our advances from the FHLB of Cincinnati by $952.6 million, as we funded new loan originations and actively managed our liquidity ratio. During the year ended September 30, 2016, our advances from the FHLB of Cincinnati increased by $550.2 million.
Liquidity management is both a daily and long-term function of business management. If we require funds beyond our ability to generate them internally, borrowing agreements exist with the FHLB of Cincinnati and the FRB-Cleveland Discount Window, each of which provides an additional source of funds. Additionally, in evaluating funding alternatives, we may participate in the brokered CDs market. At September 30, 2017, we had $3.67 billion of FHLB of Cincinnati advances and no outstanding borrowings from the FRB-Cleveland Discount Window. Additionally, at September 30, 2017, we had $620.7 million of brokered CDs. During the year ended September 30, 2017, we had average outstanding advances from the FHLB of Cincinnati of $3.23 billion as compared to average outstanding advances of $2.28 billion during the year ended September 30, 2016. The increase in net average balance in the current year reflects an increase in FHLB of Cincinnati borrowings as part of our efforts to lengthen the duration of our interest bearing funding sources as well as increases in the balance of our short-term borrowings used to fund: balance sheet growth; our net savings outflow; our capital initiatives; and to manage our on-balance sheet liquidity. Refer to the Extending the Duration of Funding Sources section of the Overview and the General section of Item 7A. Quantitative and Qualitative Disclosures About Market Risk for further discussion. At September 30, 2017, we had the ability to immediately borrow an additional $41.0 million from the FHLB of Cincinnati and $72.3 million from the FRB-Cleveland Discount Window. From the perspective of collateral value securing FHLB of Cincinnati advances, our capacity limit for additional borrowings beyond the immediately available limits at September 30, 2017 was $4.87 billion, subject to
69
satisfaction of the FHLB of Cincinnati common stock ownership requirement. To satisfy the common stock ownership requirement, we would have to increase our ownership of FHLB of Cincinnati common stock by an additional $97.4 million.
The Association and the Company are subject to various regulatory capital requirements, including a risk-based capital measure. The Basel III capital framework for U.S. banking organizations ("Basel III Rules") includes both a revised definition of capital and guidelines for calculating risk-weighted assets by assigning balance sheet assets and off-balance sheet items to broad risk categories. Effective January 1, 2015, the OCC and the other federal bank regulatory agencies revised their leverage and risk-based capital requirements and the method for calculating risk-weighted assets to make them consistent with agreements that were reached by the Basel Committee on Banking Supervision and certain provisions of the DFA and revised the definition of assets used in the Tier 1 (leverage) capital ratio from adjusted tangible assets (a measurement computed based on quarter-end asset balances) to net average assets (a measurement computed based on the average of daily asset balances during the quarter). Among other things, the rule established a new common equity Tier 1 minimum capital requirement (4.5% of risk-weighted assets) and increased the minimum Tier 1 capital to risk-based assets requirement (from 4% to 6% of risk-weighted assets). The rule also requires unrealized gains and losses on certain "available-for-sale" security holdings and change in defined benefit plan obligations to be included for purposes of calculating regulatory capital requirements unless a one-time opt-in or opt-out is exercised. The Association exercised its one time opt-out election with the filing of its March 31, 2015 regulatory call report. Effective January 1, 2015, the Association implemented the new capital requirements for the standardized approach to the Basel III Rules, subject to transitional provisions extending through the end of 2018. The final rule also implemented consolidated capital requirements for savings and loan holding companies effective January 1, 2015.
As of September 30, 2017, the Association exceeded all regulatory capital requirements to be considered "Well Capitalized".
In addition to the operational liquidity considerations described above, which are primarily those of the Association, the Company, as a separate legal entity, also monitors and manages its own, parent company-only liquidity, which provides the source of funds necessary to support all of the parent company's stand-alone operations, including its capital distribution strategies which encompass its share repurchase and dividend payment programs. The Company's primary source of liquidity is dividends received from the Association. The amount of dividends that the Association may declare and pay to the Company in any calendar year, without the receipt of prior approval from the OCC but with prior notice to the FRB-Cleveland, cannot exceed net income for the current calendar year-to-date period plus retained net income (as defined) for the preceding two calendar years, reduced by prior dividend payments made during those periods. In December 2016, the Company received an $81.0 million cash dividend from the Association. Because of its intercompany nature, this dividend payment had no impact on the Company's capital ratios or its consolidated statement of condition but reduced the Association's reported capital ratios.
The Company's seventh stock repurchase program, covering 10,000,000 shares, which began on August 4, 2015, was completed on January 6, 2017. On October 27, 2016, the Company announced that the Board of Directors approved the Company’s eighth stock repurchase program, which authorized the repurchase of up to 10,000,000 shares of the Company’s outstanding common stock. Repurchases under the eighth stock repurchase authorization began on January 6, 2017. There were 2,249,110 shares repurchased under that program between its start date and September 30, 2017. During the year ended September 30, 2017, the Company repurchased $54.0 million of its common stock.
On July 26, 2016, Third Federal Savings, MHC received the approval of its members (depositors and certain loan customers of the Association) with respect to the waiver of dividends, and subsequently received the non-objection of the FRB-Cleveland, to waive receipt of dividends on the Company’s common stock the MHC owns up to a total of $0.50 per share during the four quarterly periods ended June 30, 2017. Third Federal Savings, MHC waived its right to receive a $0.125 per share dividend payment on September 19, 2016, December 12, 2016, March 20, 2017 and June 23, 2017.
On July 19, 2017, Third Federal Savings, MHC received the approval of its members with respect to the waiver of dividends, and subsequently received the non-objection of the FRB-Cleveland, to waive receipt of dividends on the Company’s common stock the MHC owns up to a total of $0.68 per share, to be declared on the Company’s common stock during the twelve months subsequent to the members’ approval (i.e., through July 19, 2018). The members approved the waiver by casting 64% of the eligible votes in favor of the waiver. Of the votes cast, 97% were in favor of the proposal. Third Federal Savings, MHC waived its right to receive a $0.17 per share dividend payment on September 25, 2017.
While stock repurchases are planned to continue in the future, the payment of dividends and support of asset growth will likely represent a larger focus for future capital deployment activities.
At September 30, 2017, the Company had, in the form of cash and a demand loan from the Association, $94.4 million of funds readily available to support its stand-alone operations.
70
Off-Balance Sheet Arrangements and Aggregate Contractual Obligations
Commitments. As a financial services provider, we routinely are a party to various financial instruments with off-balance-sheet risks, such as commitments to extend credit and unused lines of credit. While these contractual obligations represent our future cash requirements, a significant portion of commitments to extend credit may expire without being drawn upon. Such commitments are subject to the same credit policies and approval process accorded to loans we make. In addition, we routinely enter into commitments to securitize and sell mortgage loans. For additional information, see Note 15 of the Notes to Consolidated Financial Statements.
Contractual Obligations. In the ordinary course of our operations, we enter into certain contractual obligations. Such obligations include operating leases for premises and equipment, agreements with respect to borrowed funds and deposit liabilities and agreements with respect to investments.
The following table summarizes our significant fixed and determinable contractual obligations and other funding needs by payment date at September 30, 2017. The payment amounts represent those amounts due to the recipient and do not include any unamortized premiums or discounts or other similar carrying amount adjustments.
______________________
Payments due by period | |||||||||||||||||||||
Contractual Obligations | Less than One year | One to Three years | Three to Five years | More than Five years | Total | ||||||||||||||||
(In thousands) | |||||||||||||||||||||
FHLB advances(1)(2) | $ | 2,888,245 | $ | 744,294 | $ | 1,290 | $ | 37,548 | $ | 3,671,377 | |||||||||||
Operating leases | 6,697 | 11,125 | 6,732 | 6,264 | 30,818 | ||||||||||||||||
Certificates of deposit(1) | 2,133,538 | 2,626,673 | 728,409 | 202,589 | 5,691,209 | ||||||||||||||||
Limited partner investments | 11,541 | — | — | — | 11,541 | ||||||||||||||||
Total | $ | 5,040,021 | $ | 3,382,092 | $ | 736,431 | $ | 246,401 | $ | 9,404,945 | |||||||||||
Commitments to extend credit | $ | 2,084,599 | (3) | $ | — | $ | — | $ | — | $ | 2,084,599 | ||||||||||
(1) | Includes accrued interest payable, computed on an actual days outstanding basis, at September 30, 2017. |
(2) | Reflect the net impact of deferred penalties discussed in Note 10. Borrowed Funds. |
(3) | Includes the unused portion (including commitments for accounts suspended as a result of material default or a decline in equity) of home equity lines of credit of $1.50 billion. |
Impact of Inflation and Changing Prices
Our consolidated financial statements and related notes have been prepared in accordance with GAAP. GAAP generally requires the measurement of financial position and operating results in terms of historical dollars without consideration for changes in the relative purchasing power of money over time due to inflation. The impact of inflation is reflected in the increased cost of our operations. Unlike industrial companies, our assets and liabilities are primarily monetary in nature. As a result, changes in market interest rates have a greater impact on performance than the effects of inflation.
Recent Accounting Pronouncements
Refer to Note 21. Recent Accounting Pronouncements for pending and adopted accounting guidance.
Item 7A. | Quantitative and Qualitative Disclosures About Market Risk |
General. The majority of our assets and liabilities are monetary in nature. Consequently, our most significant form of market risk has historically been interest rate risk. In general, our assets, consisting primarily of mortgage loans, have longer maturities than our liabilities, consisting primarily of deposits and advances from the FHLB of Cincinnati. As a result, a fundamental component of our business strategy is to manage interest rate risk and limit the exposure of our net interest income to changes in market interest rates. Accordingly, our Board of Directors has established risk parameter limits deemed appropriate given our business strategy, operating environment, capital, liquidity and performance objectives. Additionally, our Board of Directors has authorized the formation of an Asset/Liability Management Committee comprised of key operating personnel, which is responsible for managing this risk in a matter that is consistent with the guidelines and risk limits approved by the Board of Directors. Further, the Board has established the Directors Risk Committee, which, among other responsibilities, conducts regular oversight and review of the guidelines, policies and deliberations of the Asset/Liability Management Committee. We have sought to manage our interest rate risk in order to control the exposure of our earnings and
71
capital to changes in interest rates. As part of our ongoing asset-liability management, we use the following strategies to manage our interest rate risk:
(i) | marketing adjustable-rate and shorter-maturity (10-year, fixed-rate mortgage) loan products; |
(ii) | lengthening the weighted average remaining term of major funding sources, primarily by offering attractive interest rates on deposit products, particularly longer-term certificates of deposit, and through the use of longer-term advances from the FHLB of Cincinnati (or shorter-term advances converted to longer-term durations via the use of interest rate exchange contracts that qualify as cash flow hedges) and longer-term brokered certificates of deposit; |
(iii) | investing in shorter- to medium-term investments and mortgage-backed securities; |
(iv) | maintaining the levels of capital required for "well capitalized" designation; and |
(v) | securitizing and/or selling long-term, fixed-rate residential real estate mortgage loans. |
During the fiscal year ended September 30, 2017, $211.0 million of agency-compliant, long-term, fixed-rate mortgage loans were sold to Fannie Mae, and $38.4 million of long-term, fixed-rate mortgage loans, which were also agency-compliant, were sold to the FHLB of Cincinnati. All loans were sold on a servicing retained basis. At September 30, 2017, $0.4 million of agency-compliant, long-term, fixed-rate residential first mortgage loans that qualified under Fannie Mae's HARP II or HomeReady programs, were classified as "held for sale". Of the Fannie Mae loan sales completed during fiscal 2017, $13.7 million was comprised of long-term, (15 to 30 years), fixed-rate first mortgage loans which were sold under Fannie Mae's HARP II, $15.3 million was comprised of long-term, (15 to 30 years), fixed-rate first mortgage loans which were sold under Fannie Mae's HomeReady program, and $182.0 million was comprised of long-term (15 to 30 years), fixed-rate first mortgage loans which had been originated under our revised procedures and were sold to Fannie Mae under our re-instated seller contract, as described in the next paragraph. The loans that were sold to the FHLB of Cincinnati were sold under the FHLB's Mortgage Purchase Program. Loans that qualify under the FHLB Mortgage Purchase Program are classified as “held for investment” until they are specifically identified for sale. At September 30, 2017, we had no outstanding loan sales commitments.
Fannie Mae, historically the Association’s primary loan investor, implemented, effective July 1, 2010, certain loan origination requirement changes affecting loan eligibility that we chose not to adopt until May 2013. Subsequent to the May 2013 implementation date of our revised procedures, and, upon review and validation by Fannie Mae which was received on November 15, 2013, fixed-rate, first mortgage loans (primarily fixed-rate, mortgage refinances with terms of 15 years or more and HARP II, and more recently HomeReady, loans) that are originated under the revised procedures are eligible for sale to Fannie Mae either as whole loans or as mortgage-backed securities. We expect that certain loan types (i.e. our Smart Rate adjustable-rate loans, purchase fixed-rate loans and 10-year fixed-rate loans) will continue to not be originated under the revised (Fannie Mae) procedures and accordingly, the Association’s ability to reduce interest rate risk via loan sales for such loans is limited to those loans that have established payment histories, strong borrower credit profiles and are supported by adequate collateral values that meet the requirements of the FHLB's Mortgage Purchase Program or of private third-party investors.
In response to impact that the 2008 financial crisis had on housing and more particularly on the operation of the secondary mortgage market, we have actively marketed an adjustable-rate mortgage loan product since 2010 and a 10-year fixed-rate mortgage loan product since 2012. Each of these products provides us with improved interest rate risk characteristics when compared to longer-term, fixed-rate mortgage loans. Shortening the average maturity of our interest-earning assets by increasing our investments in shorter-term loans and investments, as well as loans and investments with variable rates of interest, helps to better match the maturities and interest rates of our assets and liabilities, thereby reducing the exposure of our net interest income to changes in market interest rates. By following these strategies, we believe that we are better positioned to react to increases in market interest rates.
The Association evaluates funding source alternatives as it seeks to extend its liability duration. Extended duration funding sources that are currently considered include: retail certificates of deposit (which, subject to a fee, generally provide depositors with an early withdrawal option, but do not require pledged collateral); brokered certificates of deposit (which generally do not provide an early withdrawal option and do not require collateral pledges); collateralized borrowings which are not subject to creditor call options (generally advances from the FHLB of Cincinnati); and interest rate exchange contracts ("swaps") which are subject to collateral pledges and which require specific structural features to qualify for hedge accounting treatment (hedge accounting treatment directs that periodic mark-to-market adjustments be recorded in other comprehensive income (loss) in the equity section of the balance sheet rather than being included in operating results of the income statement). The Association's intent is that any swap to which it may be a party will qualify for hedge accounting treatment. The Association is generally opportunistic in the timing of its funding duration deliberations and when evaluating alternative funding sources, compares effective interest rates, early withdrawal/call options and collateral requirements.
72
In December 2015, the Association entered into its first interest rate swap agreements in over ten years. Each of the Association's swap agreements is registered on the Chicago Mercantile Exchange and involves the exchange of interest payment amounts based on a notional principal balance. No exchange of principal amounts occurs and the notional principal amount does not appear on our balance sheet. The Association uses swaps to extend the duration of its funding sources. In each of the Association's agreements, interest paid is based on a fixed rate of interest throughout the term of each agreement while interest received is based on an interest rate that resets at a specified interval (generally three months) throughout the term of each agreement. On the initiation date of the swap, the agreed upon exchange interest rates reflect market conditions at that point in time. Swaps generally require counterparty collateral pledges that ensure the counterparties' ability to comply with the conditions of the agreement. The notional amount of the Association's swap portfolio at September 30, 2017 was $1.50 billion. The swap portfolio's weighted average fixed pay rate was 1.62% and the weighted average remaining term was 4.1 years. Concurrent with the execution of each swap, the Association entered into a short-term borrowing from the FHLB of Cincinnati in an amount equal to the notional amount of the swap and with interest rate resets aligned with the reset interval of the swap. For $1.35 billion of our outstanding swaps, the borrowing proceeds represented new monies which were generally used to fund loans and investment securities. During the fiscal year ended September 30, 2016, swaps totaling $150.0 million were contracted to restructure existing longer-term FHLB borrowings. These restructuring transactions lowered our effective cost of funding but did not involve the receipt of new monies. Each individual swap agreement has been designated as a cash flow hedge of interest rate risk associated with the Company's variable rate borrowings from the FHLB of Cincinnati.
Economic Value of Equity. Using customized modeling software, the Association prepares periodic estimates of the amounts by which the net present value of its cash flows from assets, liabilities and off-balance sheet items (the institution’s economic value of equity or EVE) would change in the event of a range of assumed changes in market interest rates. The simulation model uses a discounted cash flow analysis and an option-based pricing approach in measuring the interest rate sensitivity of EVE. The model estimates the economic value of each type of asset, liability and off-balance sheet contract under the assumption that instantaneous changes (measured in basis points) occur at all maturities along the United States Treasury yield curve and other relevant market interest rates. A basis point equals one, one-hundredth of one percent, and 100 basis points equals one percent. An increase in interest rates from 2% to 3% would mean, for example, a 100 basis point increase in the “Change in Interest Rates” column below. The model is tailored specifically to our organization, which, we believe, improves its predictive accuracy. The following table presents the estimated changes in the Association’s EVE at September 30, 2017 that would result from the indicated instantaneous changes in the United States Treasury yield curve and other relevant market interest rates. Computations of prospective effects of hypothetical interest rate changes are based on numerous assumptions, including relative levels of market interest rates, loan prepayments and deposit decay, and should not be relied upon as indicative of actual results.
Change in Interest Rates (basis points) (1) | Estimated EVE (2) | Estimated Increase (Decrease) in EVE | EVE as a Percentage of Present Value of Assets (3) | ||||||||||||||
EVE Ratio (4) | Increase (Decrease) (basis points) | ||||||||||||||||
Amount | Percent | ||||||||||||||||
(Dollars in thousands) | |||||||||||||||||
+300 | $ | 1,461,909 | $ | (647,110 | ) | (30.68 | )% | 11.57 | % | (348 | ) | ||||||
+200 | 1,722,441 | (386,578 | ) | (18.33 | )% | 13.13 | % | (192 | ) | ||||||||
+100 | 1,951,186 | (157,833 | ) | (7.48 | )% | 14.36 | % | (69 | ) | ||||||||
0 | 2,109,019 | — | — | % | 15.05 | % | — | ||||||||||
-100 | 2,103,755 | (5,264 | ) | (0.25 | )% | 14.69 | % | (36 | ) | ||||||||
_________________
(1) | Assumes an instantaneous uniform change in interest rates at all maturities. |
(2) | EVE is the discounted present value of expected cash flows from assets, liabilities and off-balance sheet contracts. |
(3) | Present value of assets represents the discounted present value of incoming cash flows on interest-earning assets. |
(4) | EVE Ratio represents EVE divided by the present value of assets. |
The preceding table indicates that at September 30, 2017, in the event of an increase of 200 basis points in all interest rates, the Association would experience a 18.33% decrease in EVE. In the event of a 100 basis point decrease in interest rates, the Association would experience a 0.25% decrease in EVE.
73
The following table is based on the calculations contained in the previous table, and sets forth the change in the EVE at a +200 basis point rate of shock at September 30, 2017, with comparative information as of September 30, 2016. By regulation, the Association must measure and manage its interest rate risk for interest rate shocks relative to established risk tolerances in EVE.
At September 30, | |||||
Risk Measure (+200 bp Rate Shock) | 2017 | 2016 | |||
Pre-Shock EVE Ratio | 15.05 | % | 14.98 | % | |
Post-Shock EVE Ratio | 13.13 | % | 13.72 | % | |
Sensitivity Measure in basis points | (192 | ) | (126 | ) | |
Percentage Change in EVE Ratio | (18.33 | )% | (13.55 | )% | |
Certain shortcomings are inherent in the methodologies used in measuring interest rate risk through changes in EVE. Modeling changes in EVE requires making certain assumptions that may or may not reflect the manner in which actual yields and costs respond to changes in market interest rates. In this regard, the EVE tables presented above assume:
• | no new growth or business volumes; |
• | that the composition of our interest-sensitive assets and liabilities existing at the beginning of a period remains constant over the period being measured, except for reductions to reflect mortgage loan principal repayments along with modeled prepayments and defaults; and |
• | that a particular change in interest rates is reflected uniformly across the yield curve regardless of the duration or repricing of specific assets and liabilities. |
Accordingly, although the EVE tables provide an indication of our interest rate risk exposure as of the indicated dates, such measurements are not intended to and do not provide a precise forecast of the effect of changes in market interest rates on our EVE and will differ from actual results. While our core business activities, which primarily sought to originate Smart Rate (adjustable) and 10-year fixed-rate loans funded by borrowings from the FHLB and intermediate term CDs (including brokered CDs) are intended to have a favorable impact on our IRR profile, the net impact of three other items resulted in the 4.78% deterioration in the Percentage Change in EVE measure at September 30, 2017, when compared to the measure at September 30, 2016. The most significant factor contributing to the overall deterioration was the change in market interest rates, which included an increase of 72 basis points for the two-year term, an increase of 79 basis points for the five-year term and an increase of 74 basis points for the ten-year term, and which resulted in a decrease of 9.14% in the Percentage Change in EVE. Combined with this deterioration was the impact of an $81.0 million cash dividend that the Association paid to the Company. Because of its intercompany nature, this payment had no impact on the Company's capital position, or the Company's overall IRR profile but reduced the Association's regulatory capital and regulatory capital ratios and negatively impacted the Association's Percentage Change in EVE by approximately 0.86%. Partially offsetting the unfavorable impact of the two preceding factors, numerous modifications and enhancements to our modeling assumptions and methodologies, which are continually challenged and evaluated, on a net basis, positively impacted the Association's Percentage Change in EVE by 2.83%. These changes primarily involved factors used in the modeling of prepayment rates for our fixed-rate, first mortgage loans and attempt to more closely align the model’s projections with our historical experience for those products. Finally, our core business activities, as described at the beginning of this paragraph, resulted in 2.39% of improvement to our Percentage Change in EVE. The IRR simulation results presented above were in line with management's expectations and were within the risk limits established by our Board of Directors.
Our simulation model possesses random patterning capabilities and accommodates extensive regression analytics applicable to the prepayment and decay profiles of our borrower and depositor portfolios. The model facilitates the generation of alternative modeling scenarios and provides us with timely decision making data that is integral to our IRR management processes. Modeling our IRR profile and measuring our IRR exposure are processes that are subject to continuous revision, refinement, modification, enhancement, back testing and validation. We continually evaluate, challenge and update the methodology and assumptions used in our IRR model, including behavioral equations that have been derived based on third-party studies of our customer historical performance patterns. Changes to the methodology and/or assumptions used in the model will result in reported IRR profiles and reported IRR exposures that will be different, and perhaps significantly, from the results reported above.
Earnings at Risk. In addition to EVE calculations, we use our simulation model to analyze the sensitivity of our net interest income to changes in interest rates (the institution’s EaR). Net interest income is the difference between the interest income that we earn on our interest-earning assets, such as loans and securities, and the interest that we pay on our interest-bearing liabilities, such as deposits and borrowings. In our model, we estimate what our net interest income would be for
74
prospective 12 and 24 month periods using customized (based on our portfolio characteristics) assumptions with respect to loan prepayment rates, default rates and deposit decay rates, and the implied forward yield curve as of the market date for assumptions as to projected interest rates. We then calculate what the estimated net interest income would be for the same period under numerous interest rate scenarios. The simulation process is subject to continual enhancement, modification, refinement and adaptation in order that it might most accurately reflect our current circumstances, factors and expectations. As of September 30, 2017, we estimated that our EaR for the 12 months ending September 30, 2018 would decrease by 1.63% in the event that market interest rates used in the simulation were adjusted in equal monthly amounts (termed a "ramped" format) during the 12 month measurement period to an aggregate increase in 200 basis points. This assumption differs from the assumption used to report our EaR estimates in reporting periods prior to March 31, 2017, when our EaR disclosures were determined under assumed instantaneous changes in market interest rates. During the March 31, 2017 quarter, based on a survey of the predominate practices disclosed by other similarly profiled financial institutions, the Association adopted the "ramped" assumption in preparing the EaR simulation estimates for use in its public disclosures. In addition to conforming to predominate industry practice, the Association also believes that the ramped assumption provides a more probable/plausible scenario for net interest income simulations than instantaneous shocks which provide a theoretical analysis but a much less credible economic scenario. The Association continues to calculate instantaneous scenarios, and as of September 30, 2017, we estimated that our EaR for the 12 month period ending September 30, 2018, would decrease by 5.14% in the event of an instantaneous 200 basis point increase in market interest rates. At September 30, 2017, the IRR simulations results were in line with management's expectations and were within the risk limits established by our Board of Directors.
Certain shortcomings are also inherent in the methodologies used in determining interest rate risk through changes in EaR. Modeling changes in EaR require making certain assumptions that may or may not reflect the manner in which actual yields and costs respond to changes in market interest rates. In this regard, the interest rate risk information presented above assumes that a particular change in interest rates is reflected uniformly across the yield curve regardless of the duration or repricing of specific assets and liabilities. Accordingly, although interest rate risk calculations provide an indication of our interest rate risk exposure at a particular point in time, such measurements are not intended to and do not provide a precise forecast of the effect of changes in market interest rates on our net interest income and will differ from actual results. In addition to the preparation of computations as described above, we also formulate simulations based on a variety of non-linear changes in interest rates and a variety of non-constant balance sheet composition scenarios.
Other Considerations. The EVE and EaR analyses are similar in that they both start with the same month end balance sheet amounts, weighted average coupon and maturity. The underlying prepayment, decay and default assumptions are also the same and they both start with the same month end "markets" (Treasury and Libor yield curves, etc.). From that similar starting point, the models follow divergent paths. EVE is a stochastic model using 100 different interest rate paths to compute market value at the cohorted transaction level for each of the categories on the balance sheet whereas EaR uses the implied forward curve to compute interest income/expense at the cohorted transaction level for each of the categories on the balance sheet.
EVE is considered as a point in time calculation with a "liquidation" view of the Association where all the cash flows (including interest, principal and prepayments) are modeled and discounted using discount factors derived from the current market yield curves. It provides a long term view and helps to define changes in equity and duration as a result of changes in interest rates. On the other hand, EaR is based on balance sheet projections going one year and two year forward and assumes new business volume and pricing to calculate net interest income under different interest rate environments. EaR is calculated to determine the sensitivity of net interest income under different interest rate scenarios. With each of these models specific policy limits have been established that are compared with the actual month end results. These limits have been approved by the Association's Board of Directors and are used as benchmarks to evaluate and moderate interest rate risk. In the event that there is a breach of policy limits that extends beyond two consecutive quarter end measurement periods, management is responsible for taking such action, similar to those described under the preceding heading of General, as may be necessary in order to return the Association's interest rate risk profile to a position that is in compliance with the policy. At September 30, 2017 the IRR profile as disclosed above was within our internal limits.
Item 8. | Financial Statements and Supplementary Data |
The Financial Statements are included in Part IV, Item 15 of this Form 10-K.
Item 9. | Changes in and Disagreements with Accountants on Accounting and Financial Disclosure |
Not applicable.
75
Item 9A. | Controls and Procedures |
Disclosure Controls and Procedures
Under the supervision of and with the participation of the Company’s management, including our principal executive officer and principal financial officer, we have evaluated the effectiveness of the design and operation of our disclosure controls and procedures (as defined in Rule 13a-15(e) and 15d-15(e) under the Exchange Act) as of the end of the period covered by this report. Disclosure controls and procedures include, without limitation, controls and procedures designed to ensure that information required to be disclosed by an issuer in the reports that it files or submits under the Act is accumulated and communicated to the issuer’s management, including its principal executive and principal financial officers, or persons performing similar functions, as appropriate to allow timely decisions regarding required disclosure. Based upon that evaluation, our principal executive officer and principal financial officer concluded that, as of the end of the period covered by this report, our disclosure controls and procedures were effective to ensure that information required to be disclosed in the reports that we file or submit under the Exchange Act is recorded, processed, summarized and reported, within the time periods specified in the SEC’s rules and forms.
Changes in Internal Control Over Financial Reporting
No change in our internal control over financial reporting (as defined in Rules 13a-15(f) and 15d-15(f) under the Exchange Act) occurred during the most recent fiscal quarter that has materially affected, or is reasonably likely to materially affect, our internal control over financial reporting.
Management’s Report Regarding Internal Control Over Financial Reporting
The Company’s management is responsible for establishing and maintaining adequate internal control over financial reporting as such terms are defined in Rule 13a-15(f) of the Exchange Act of 1934. Our system of internal controls is designed to provide reasonable assurance that the financial statements that we provide to the public are fairly presented.
Our internal control over financial reporting includes policies and procedures that (i) pertain to the maintenance of records that, in reasonable detail, accurately and fairly reflect transactions and dispositions of assets, (ii) provide reasonable assurances that transactions are recorded as necessary to permit preparation of financial statements in accordance with accounting principles generally accepted in the United States of America and that receipts and expenditures are being made only in accordance with authorizations of management and the directors of the Company; and (iii) provide reasonable assurance regarding prevention or timely detection of unauthorized acquisition, use or disposition of the Company’s assets that could have a material effect on our financial statements.
All internal control systems, no matter how well designed, have inherent limitations. Therefore, even those systems determined to be effective can provide only reasonable assurance with respect to financial statement preparation and presentation. Accordingly, absolute assurance cannot be provided that the effectiveness of the internal control systems may not become inadequate in future periods because of changes in conditions, or because the degree of compliance with the policies or procedures may deteriorate.
Management assessed the effectiveness of the Company’s internal control over financial reporting as of September 30, 2017. In making this assessment, the criteria set forth by the Committee of Sponsoring Organizations of the Treadway Commission in Internal Control-Integrated Framework (2013) was utilized. Based on this assessment, management believes that, as of September 30, 2017, the Company’s internal control over financial reporting is effective at the reasonable assurance level.
The Company’s independent registered public accounting firm has issued an attestation report on the Company’s internal control over financial reporting.
The Sarbanes-Oxley Act Section 302 Certifications have been filed as Exhibit 31.1 and Exhibit 31.2 to this Annual Report on Form 10-K.
76
REPORT OF INDEPENDENT REGISTERED PUBLIC ACCOUNTING FIRM
To the Board of Directors and Shareholders of
TFS Financial Corporation
Cleveland, OH
We have audited the internal control over financial reporting of TFS Financial Corporation and subsidiaries (the "Company") as of September 30, 2017, based on criteria established in Internal Control - Integrated Framework (2013) issued by the Committee of Sponsoring Organizations of the Treadway Commission. The Company's management is responsible for maintaining effective internal control over financial reporting and for its assessment of the effectiveness of internal control over financial reporting, included in the accompanying Management’s Report Regarding Internal Control Over Financial Reporting. Our responsibility is to express an opinion on the Company's internal control over financial reporting based on our audit.
We conducted our audit in accordance with the standards of the Public Company Accounting Oversight Board (United States). Those standards require that we plan and perform the audit to obtain reasonable assurance about whether effective internal control over financial reporting was maintained in all material respects. Our audit included obtaining an understanding of internal control over financial reporting, assessing the risk that a material weakness exists, testing and evaluating the design and operating effectiveness of internal control based on the assessed risk, and performing such other procedures as we considered necessary in the circumstances. We believe that our audit provides a reasonable basis for our opinion.
A company's internal control over financial reporting is a process designed by, or under the supervision of, the company's principal executive and principal financial officers, or persons performing similar functions, and effected by the company's board of directors, management, and other personnel to provide reasonable assurance regarding the reliability of financial reporting and the preparation of financial statements for external purposes in accordance with generally accepted accounting principles. A company's internal control over financial reporting includes those policies and procedures that (1) pertain to the maintenance of records that, in reasonable detail, accurately and fairly reflect the transactions and dispositions of the assets of the company; (2) provide reasonable assurance that transactions are recorded as necessary to permit preparation of financial statements in accordance with generally accepted accounting principles, and that receipts and expenditures of the company are being made only in accordance with authorizations of management and directors of the company; and (3) provide reasonable assurance regarding prevention or timely detection of unauthorized acquisition, use, or disposition of the company's assets that could have a material effect on the financial statements.
Because of the inherent limitations of internal control over financial reporting, including the possibility of collusion or improper management override of controls, material misstatements due to error or fraud may not be prevented or detected on a timely basis. Also, projections of any evaluation of the effectiveness of the internal control over financial reporting to future periods are subject to the risk that the controls may become inadequate because of changes in conditions, or that the degree of compliance with the policies or procedures may deteriorate.
In our opinion, the Company maintained, in all material respects, effective internal control over financial reporting as of September 30, 2017, based on the criteria established in Internal Control - Integrated Framework (2013) issued by the Committee of Sponsoring Organizations of the Treadway Commission.
We have also audited, in accordance with the standards of the Public Company Accounting Oversight Board (United States), the consolidated financial statements as of and for the year ended September 30, 2016 of the Company and our report dated November 22, 2017 expressed an unqualified opinion on those financial statements.
/s/ Deloitte & Touche LLP
Cleveland, OH
November 22, 2017
77
Item 9B. | Other Information |
Not applicable.
PART III
Item 10. | Directors, Executive Officers and Corporate Governance |
Incorporated by reference from the Notice of Annual Meeting and Proxy Statement for the 2018 Annual Meeting of Shareholders (the “Proxy Statement”) sections entitled “Proposal One: Election of Directors,” “Executive Compensation,” “Section 16(a) Beneficial Ownership Reporting Compliance” and “Corporate Governance.” Such information will be filed with the SEC no later than 120 days after the end of the fiscal year covered by this report.
The table below sets forth information, as of September 30, 2017, regarding our executive officers other than Mr. Stefanski and Ms. Weil.
Name | Title | Age |
Judith Z. Adam | Chief Risk Officer | 62 |
David S. Huffman | Chief Financial Officer and Secretary | 65 |
Paul J. Huml | Chief Accounting Officer Chief Operating Officer, the Company | 58 |
Anna Maria P. Motta | Chief Information Officer, the Association | 58 |
Cathy W. Zbanek | Chief Marketing and Human Resources Officer, the Association | 44 |
The executive officers of the Company and the Association are elected annually and hold office until their respective successors are elected or until death, resignation, retirement or removal by the Board of Directors.
The Business Background of Our Executive Officers
The business experience for the past five years of each of our executive officers other than Mr. Stefanski and Ms. Weil is set forth below. Unless otherwise indicated, executive officers have held their positions for the past five years.
Judith Z. Adam joined the Association in 2000 and was named Chief Risk Officer in 2015. During her time with the Association, Ms. Adam has managed the Accounting, Internet Services and Loan Production teams. Ms. Adam’s more than 30 years in the banking industry have included serving in various accounting roles at TransOhio Savings Bank and Metropolitan Bank & Trust.
David S. Huffman joined the Association in 1993, and has served as its Chief Financial Officer since 2000. He has also served as Chief Financial Officer of the Company since 2004 and as Secretary since 2011. Mr. Huffman has more than 30 years of experience in the financial institutions industry, including serving as Chief Financial Officer of First American Savings Bank of Canton, Ohio, from 1989 to 1993.
Paul J. Huml joined the Association as a Vice President in 1998 and was appointed Chief Operating Officer of the Company in 2002 and Chief Accounting Officer in June 2009. Prior to joining the Association, Mr. Huml spent 10 years in the hotel industry, focusing on the areas of finance, real estate development and risk management. Mr. Huml is a certified public accountant in the state of Ohio.
Anna Maria P. Motta joined the Association in 1989 and was named Chief Information Officer in 2014. During her time with the Association, Ms. Motta has managed a number of different operational areas including Northeast Ohio Retail Operations, Customer Service, Internet Services, Loan Servicing, Default Servicing, Deposit Operations, and Information Services. Ms. Motta’s more than 30 years in the banking industry also included serving as Treasurer of ParkView Federal Savings and Loan, in Cleveland, Ohio, from 1987 to 1989.
78
Cathy W. Zbanek joined the Association in 2001 and was named the Chief Marketing Officer in January 2013 and also serves as the Human Resources Officer for the Association. Prior to her current role, she directed several key strategic business projects as well as systems design and development. She also managed several departments, including Customer Service. Before joining the Association, Ms. Zbanek served as a senior consultant with Waterstone Consulting, working in their Management Consulting Group. Her experience also includes working with the consulting group, Price Waterhouse Coopers.
The Company has adopted a policy statement entitled CODE OF ETHICS FOR SENIOR FINANCIAL OFFICERS that applies to our chief executive officer and our senior financial officers. A copy of the CODE OF ETHICS FOR SENIOR FINANCIAL OFFICERS is available on our website, www.thirdfederal.com.
Item 11. | Executive Compensation |
Incorporated by reference from the sections of the Proxy Statement entitled “Executive Compensation,” “Report of the Compensation Committee,” and “Director Compensation.” Such information will be filed with the SEC no later than 120 days after the end of the fiscal year covered by this report.
Item 12. | Security Ownership of Certain Beneficial Owners and Management and Related Stockholder Matters |
Incorporated by reference from the section of the Proxy Statement entitled “Security Ownership of Certain Beneficial Owners and Management.” Such information will be filed with the SEC no later than 120 days after the end of the fiscal year covered by this report.
The Company’s only equity compensation program that was not approved by shareholders is its employee stock ownership plan, which was established in conjunction with our initial stock offering completed in April 2007.
The following table provides information as of September 30, 2017 regarding our 2008 Equity Incentive Plan that was approved by shareholders on May 29, 2008:
Plan Category | Number of Shares to be Issued Upon Exercise of Outstanding Options, Rights and Warrants | Weighted-Average Exercise Price of Outstanding Options, Rights and Warrants | Number of Shares Remaining Available for Future Issuance Under the Plan | |||||||||||||
Equity Compensation Plans | ||||||||||||||||
Approved by Stockholders | 5,685,500 | $ | 10.53 | (1) | 11,011,124 | |||||||||||
Equity Compensation Plans | ||||||||||||||||
Not Approved by Stockholders | N/A | N/A | N/A | |||||||||||||
Total | 5,685,500 | $ | 10.53 | (1) | 11,011,124 | |||||||||||
______________________
(1) | Weighted-Average Exercise Price of Outstanding Options, Rights and Warrants is calculated using 1,169,068 shares of restricted stock awards at $0.00 and 4,516,432 shares of stock option awards at $13.26. |
Item 13. | Certain Relationships and Related Transactions, and Director Independence |
Incorporated by reference from the sections of the Proxy Statement entitled “Certain Relationships and Related Transactions” and “Corporate Governance.” Such information will be filed with the SEC no later than 120 days after the end of the fiscal year covered by this report.
Item 14. | Principal Accounting Fees and Services |
Incorporated by reference from the section of the Proxy Statement entitled “Fees Paid to Deloitte & Touche LLP.” Such information will be filed with the SEC no later than 120 days after the end of the fiscal year covered by this report.
79
PART IV
Item 15. | Exhibits and Financial Statement Schedules |
(a)(1) Financial Statements
The following documents are filed as part of this Annual Report on Form 10-K:
a. | The consolidated financial statements of TFS Financial Corporation and subsidiaries contained in Part II, Item 8 of this Annual Report on Form 10-K: |
• | Consolidated Statements of Condition as of September 30, 2017 and 2016; |
• | Consolidated Statements of Income for the years ended September 30, 2017, 2016 and 2015; |
• | Consolidated Statements of Comprehensive Income for the years ended September 30, 2017, 2016 and 2015; |
• | Consolidated Statements of Shareholders' Equity for the years ended September 30, 2017, 2016 and 2015; |
• | Consolidated Statements of Cash Flows for the years ended September 30, 2017, 2016 and 2015; and |
• | Notes to the Consolidated Financial Statements |
b. The exhibits listed in the Exhibits Index beginning on Page 131 of this Annual Report on Form 10-K.
Item 16. | Form 10-K Summary |
Not applicable.
80
REPORT OF INDEPENDENT REGISTERED PUBLIC ACCOUNTING FIRM
To the Board of Directors and Shareholders of
TFS Financial Corporation
Cleveland, OH
We have audited the accompanying consolidated statements of condition of TFS Financial Corporation and subsidiaries (the "Company") as of September 30, 2017 and 2016, and the related consolidated statements of income, comprehensive income, shareholders' equity, and cash flows for each of the three years in the period ended September 30, 2017. These financial statements are the responsibility of the Company's management. Our responsibility is to express an opinion on these financial statements based on our audits.
We conducted our audits in accordance with the standards of the Public Company Accounting Oversight Board (United States). Those standards require that we plan and perform the audit to obtain reasonable assurance about whether the financial statements are free of material misstatement. An audit includes examining, on a test basis, evidence supporting the amounts and disclosures in the financial statements. An audit also includes assessing the accounting principles used and significant estimates made by management, as well as evaluating the overall financial statement presentation. We believe that our audits provide a reasonable basis for our opinion.
In our opinion, such consolidated financial statements present fairly, in all material respects, the financial position of TFS Financial Corporation and subsidiaries as of September 30, 2017 and 2016, and the results of their operations and their cash flows for each of the three years in the period ended September 30, 2017, in conformity with accounting principles generally accepted in the United States of America.
We have also audited, in accordance with the standards of the Public Company Accounting Oversight Board (United States), the Company's internal control over financial reporting as of September 30, 2017, based on the criteria established in Internal Control - Integrated Framework (2013) issued by the Committee of Sponsoring Organizations of the Treadway Commission and our report dated November 22, 2017 expressed an unqualified opinion on the Company's internal control over financial reporting.
/s/ Deloitte & Touche LLP
Cleveland, OH
November 22, 2017
81
TFS FINANCIAL CORPORATION AND SUBSIDIARIES
CONSOLIDATED STATEMENTS OF CONDITION
As of September 30, 2017 and 2016
(In thousands, except share data)
2017 | 2016 | ||||||
ASSETS | |||||||
Cash and due from banks | $ | 35,243 | $ | 27,914 | |||
Other interest-earning cash equivalents | 232,975 | 203,325 | |||||
Cash and cash equivalents | 268,218 | 231,239 | |||||
Investment securities available for sale (amortized cost $541,964 and $517,228, respectively) | 537,479 | 517,866 | |||||
Mortgage loans held for sale, at lower of cost or market (none measured at fair value) | 351 | 4,686 | |||||
Loans held for investment, net: | |||||||
Mortgage loans | 12,434,339 | 11,748,099 | |||||
Other loans | 3,050 | 3,116 | |||||
Deferred loan expenses, net | 30,865 | 19,384 | |||||
Allowance for loan losses | (48,948 | ) | (61,795 | ) | |||
Loans, net | 12,419,306 | 11,708,804 | |||||
Mortgage loan servicing assets, net | 8,375 | 8,852 | |||||
Federal Home Loan Bank stock, at cost | 89,990 | 69,853 | |||||
Real estate owned, net | 5,521 | 6,803 | |||||
Premises, equipment, and software, net | 60,875 | 61,003 | |||||
Accrued interest receivable | 35,479 | 32,818 | |||||
Bank owned life insurance contracts | 205,883 | 200,144 | |||||
Other assets | 61,086 | 63,994 | |||||
TOTAL ASSETS | $ | 13,692,563 | $ | 12,906,062 | |||
LIABILITIES AND SHAREHOLDERS’ EQUITY | |||||||
Deposits | $ | 8,151,625 | $ | 8,331,368 | |||
Borrowed funds | 3,671,377 | 2,718,795 | |||||
Borrowers’ advances for insurance and taxes | 100,446 | 92,313 | |||||
Principal, interest, and related escrow owed on loans serviced | 35,766 | 49,401 | |||||
Accrued expenses and other liabilities | 43,390 | 53,727 | |||||
Total liabilities | 12,002,604 | 11,245,604 | |||||
Commitments and contingent liabilities | |||||||
Preferred stock, $0.01 par value, 100,000,000 shares authorized, none issued and outstanding | — | — | |||||
Common stock, $0.01 par value, 700,000,000 shares authorized; 332,318,750 shares issued; 281,291,750 and 284,219,019 outstanding at September 30, 2017 and September 30, 2016, respectively | 3,323 | 3,323 | |||||
Paid-in capital | 1,722,672 | 1,716,818 | |||||
Treasury stock, at cost; 51,027,000 and 48,099,731 shares at September 30, 2017 and September 30, 2016, respectively | (735,530 | ) | (681,569 | ) | |||
Unallocated ESOP shares | (53,084 | ) | (57,418 | ) | |||
Retained earnings—substantially restricted | 760,070 | 698,930 | |||||
Accumulated other comprehensive loss | (7,492 | ) | (19,626 | ) | |||
Total shareholders’ equity | 1,689,959 | 1,660,458 | |||||
TOTAL LIABILITIES AND SHAREHOLDERS’ EQUITY | $ | 13,692,563 | $ | 12,906,062 | |||
See accompanying notes to consolidated financial statements.
82
TFS FINANCIAL CORPORATION AND SUBSIDIARIES
CONSOLIDATED STATEMENTS OF INCOME
For each of the three years in the period ended September 30, 2017
(In thousands, except share and per share data)
2017 | 2016 | 2015 | |||||||||
INTEREST AND DIVIDEND INCOME: | |||||||||||
Loans, including fees | $ | 394,447 | $ | 375,624 | $ | 369,302 | |||||
Investment securities available for sale | 9,041 | 9,390 | 9,571 | ||||||||
Other interest and dividend earning assets | 5,507 | 3,427 | 4,604 | ||||||||
Total interest and dividend income | 408,995 | 388,441 | 383,477 | ||||||||
INTEREST EXPENSE: | |||||||||||
Deposits | 87,421 | 90,000 | 93,526 | ||||||||
Borrowed funds | 42,678 | 28,026 | 19,824 | ||||||||
Total interest expense | 130,099 | 118,026 | 113,350 | ||||||||
NET INTEREST INCOME | 278,896 | 270,415 | 270,127 | ||||||||
PROVISION (CREDIT) FOR LOAN LOSSES | (17,000 | ) | (8,000 | ) | (3,000 | ) | |||||
NET INTEREST INCOME AFTER PROVISION FOR LOAN LOSSES | 295,896 | 278,415 | 273,127 | ||||||||
NON-INTEREST INCOME: | |||||||||||
Fees and service charges, net of amortization | 6,896 | 7,423 | 7,972 | ||||||||
Net gain on the sale of loans | 2,183 | 6,161 | 4,519 | ||||||||
Increase in and death benefits from bank owned life insurance contracts | 6,449 | 7,409 | 7,324 | ||||||||
Other | 4,321 | 3,959 | 4,445 | ||||||||
Total non-interest income | 19,849 | 24,952 | 24,260 | ||||||||
NON-INTEREST EXPENSE: | |||||||||||
Salaries and employee benefits | 95,682 | 96,281 | 95,638 | ||||||||
Marketing services | 19,713 | 16,956 | 19,904 | ||||||||
Office property, equipment, and software | 24,531 | 23,862 | 22,048 | ||||||||
Federal insurance premium and assessments | 10,055 | 10,377 | 11,135 | ||||||||
State franchise tax | 5,235 | 5,459 | 5,914 | ||||||||
Real estate owned expense, net | 3,185 | 5,772 | 9,705 | ||||||||
Other expenses | 24,003 | 22,297 | 23,648 | ||||||||
Total non-interest expense | 182,404 | 181,004 | 187,992 | ||||||||
INCOME BEFORE INCOME TAXES | 133,341 | 122,363 | 109,395 | ||||||||
INCOME TAX EXPENSE | 44,464 | 41,810 | 36,804 | ||||||||
NET INCOME | $ | 88,877 | $ | 80,553 | $ | 72,591 | |||||
Earnings per share—basic and diluted | $ | 0.32 | $ | 0.28 | $ | 0.25 | |||||
Weighted average shares outstanding | |||||||||||
Basic | 277,213,258 | 281,566,648 | 289,935,861 | ||||||||
Diluted | 279,268,768 | 283,785,713 | 292,210,417 | ||||||||
See accompanying notes to consolidated financial statements.
83
TFS FINANCIAL CORPORATION AND SUBSIDIARIES
CONSOLIDATED STATEMENTS OF COMPREHENSIVE INCOME
For each of the three years in the period ended September 30, 2017
(In thousands)
2017 | 2016 | 2015 | ||||||||||
Net income | $ | 88,877 | $ | 80,553 | $ | 72,591 | ||||||
Other comprehensive income (loss), net of tax: | ||||||||||||
Net change in unrealized gain (loss) on securities available for sale | (3,331 | ) | (1,510 | ) | 3,018 | |||||||
Net change in cash flow hedges | 11,620 | (1,371 | ) | — | ||||||||
Change in pension obligation | 3,845 | (3,680 | ) | (5,291 | ) | |||||||
Total other comprehensive income (loss) | 12,134 | (6,561 | ) | (2,273 | ) | |||||||
Total comprehensive income | $ | 101,011 | $ | 73,992 | $ | 70,318 | ||||||
See accompanying notes to consolidated financial statements.
84
TFS FINANCIAL CORPORATION AND SUBSIDIARIES
CONSOLIDATED STATEMENTS OF SHAREHOLDERS’ EQUITY
For each of the three years in the period ended September 30, 2017
(In thousands, except share and per share data)
Common stock | Paid-in capital | Treasury stock | Unallocated common stock held by ESOP | Retained earnings | Accumulated other comprehensive income (loss) | Total shareholders’ equity | ||||||||||||||||
Balance at September 30, 2014 | $ | 3,323 | 1,702,441 | (379,109 | ) | (66,084 | ) | 589,678 | (10,792 | ) | $ | 1,839,457 | ||||||||||
Comprehensive income | ||||||||||||||||||||||
Net income | — | — | — | — | 72,591 | — | 72,591 | |||||||||||||||
Other comprehensive loss, net of tax | — | — | — | — | — | (2,273 | ) | (2,273 | ) | |||||||||||||
ESOP shares allocated or committed to be released | — | 2,284 | — | 4,333 | — | — | 6,617 | |||||||||||||||
Compensation costs for stock-based plans | — | 7,363 | — | — | — | — | 7,363 | |||||||||||||||
Excess tax benefit from stock-based compensation | — | 1,582 | — | — | — | — | 1,582 | |||||||||||||||
Purchase of treasury stock (11,275,950 shares) | — | — | (172,366 | ) | — | — | — | (172,366 | ) | |||||||||||||
Treasury stock allocated to restricted stock plan | — | (6,041 | ) | 2,918 | — | (988 | ) | — | (4,111 | ) | ||||||||||||
Dividends paid to common shareholders ($0.31 per common share) | — | — | — | — | (19,490 | ) | — | (19,490 | ) | |||||||||||||
Balance at September 30, 2015 | $ | 3,323 | 1,707,629 | (548,557 | ) | (61,751 | ) | 641,791 | (13,065 | ) | $ | 1,729,370 | ||||||||||
Comprehensive income | ||||||||||||||||||||||
Net income | — | — | — | — | 80,553 | — | 80,553 | |||||||||||||||
Other comprehensive loss, net of tax | — | — | — | — | — | (6,561 | ) | (6,561 | ) | |||||||||||||
ESOP shares allocated or committed to be released | — | 3,380 | — | 4,333 | — | — | 7,713 | |||||||||||||||
Compensation costs for stock-based plans | — | 5,723 | — | — | — | — | 5,723 | |||||||||||||||
Excess tax benefit from stock-based compensation | — | 3,198 | — | — | — | — | 3,198 | |||||||||||||||
Purchase of treasury stock (7,210,500 shares) | — | — | (128,427 | ) | — | — | — | (128,427 | ) | |||||||||||||
Treasury stock allocated to restricted stock plan | — | (3,112 | ) | (4,585 | ) | — | — | — | (7,697 | ) | ||||||||||||
Dividends paid to common shareholders ($0.425 per common share) | — | — | — | — | (23,414 | ) | — | (23,414 | ) | |||||||||||||
Balance at September 30, 2016 | $ | 3,323 | 1,716,818 | (681,569 | ) | (57,418 | ) | 698,930 | (19,626 | ) | $ | 1,660,458 | ||||||||||
Comprehensive income | ||||||||||||||||||||||
Net income | — | — | — | — | 88,877 | — | 88,877 | |||||||||||||||
Other comprehensive loss, net of tax | — | — | — | — | — | 12,134 | 12,134 | |||||||||||||||
ESOP shares allocated or committed to be released | — | 3,009 | — | 4,334 | — | — | 7,343 | |||||||||||||||
Compensation costs for stock-based plans | — | 3,937 | — | — | (28 | ) | — | 3,909 | ||||||||||||||
Purchase of treasury stock (3,148,610 shares) | — | — | (52,549 | ) | — | — | — | (52,549 | ) | |||||||||||||
Treasury stock allocated to restricted stock plan | — | (1,092 | ) | (1,412 | ) | — | — | — | (2,504 | ) | ||||||||||||
Dividends paid to common shareholders ($0.545 per common share) | — | — | — | — | (27,709 | ) | — | (27,709 | ) | |||||||||||||
Balance at September 30, 2017 | $ | 3,323 | 1,722,672 | (735,530 | ) | (53,084 | ) | 760,070 | (7,492 | ) | $ | 1,689,959 | ||||||||||
See accompanying notes to consolidated financial statements.
85
TFS FINANCIAL CORPORATION AND SUBSIDIARIES
CONSOLIDATED STATEMENTS OF CASH FLOWS
For each of the three years in the period ended September 30, 2017
(In thousands)
2017 | 2016 | 2015 | |||||||||
CASH FLOWS FROM OPERATING ACTIVITIES: | |||||||||||
Net income | $ | 88,877 | $ | 80,553 | $ | 72,591 | |||||
Adjustments to reconcile net income to net cash provided by operating activities: | |||||||||||
ESOP and stock-based compensation expense | 11,252 | 13,436 | 13,980 | ||||||||
Depreciation and amortization | 20,885 | 19,369 | 17,453 | ||||||||
Deferred income taxes | 3,548 | 11,099 | 9,185 | ||||||||
Provision (credit) for loan losses | (17,000 | ) | (8,000 | ) | (3,000 | ) | |||||
Net gain on the sale of loans | (2,183 | ) | (6,161 | ) | (4,519 | ) | |||||
Other net increase | 562 | 613 | 2,962 | ||||||||
Principal repayments on and proceeds from sales of loans held for sale | 29,172 | 16,285 | 27,815 | ||||||||
Loans originated for sale | (24,947 | ) | (20,466 | ) | (27,011 | ) | |||||
Increase in and death benefits for bank owned life insurance contracts | (6,320 | ) | (4,854 | ) | (6,491 | ) | |||||
Cash Collateral received from derivative counterparties | 7,525 | — | — | ||||||||
Net increase in interest receivable and other assets | (1,383 | ) | (13,087 | ) | (2,173 | ) | |||||
Net (decrease) increase in accrued expenses and other liabilities | (1,295 | ) | (4,128 | ) | 1,014 | ||||||
Other | — | 255 | 296 | ||||||||
Net cash provided by operating activities | 108,693 | 84,914 | 102,102 | ||||||||
CASH FLOWS FROM INVESTING ACTIVITIES: | |||||||||||
Loans originated | (3,422,896 | ) | (3,024,260 | ) | (2,760,277 | ) | |||||
Principal repayments on loans | 2,494,866 | 2,310,358 | 2,052,276 | ||||||||
Proceeds from sales, principal repayments and maturities of: | |||||||||||
Securities available for sale | 153,315 | 154,520 | 153,945 | ||||||||
Proceeds from sale of: | |||||||||||
Loans | 218,158 | 186,705 | 133,456 | ||||||||
Real estate owned | 8,761 | 22,400 | 25,134 | ||||||||
Purchases of: | |||||||||||
FHLB Stock | (20,137 | ) | (383 | ) | (29,059 | ) | |||||
Securities available for sale | (183,518 | ) | (95,176 | ) | (171,125 | ) | |||||
Premises and equipment | (4,150 | ) | (9,125 | ) | (5,522 | ) | |||||
Other | 792 | 584 | 784 | ||||||||
Net cash used in investing activities | (754,809 | ) | (454,377 | ) | (600,388 | ) | |||||
CASH FLOWS FROM FINANCING ACTIVITIES: | |||||||||||
Net (decrease) increase in deposits | (179,743 | ) | 45,510 | (368,020 | ) | ||||||
Net increase in borrowers' advances for insurance and taxes | 8,133 | 6,021 | 10,026 | ||||||||
Net decrease in principal and interest owed on loans serviced | (13,635 | ) | (92 | ) | (5,177 | ) | |||||
Net increase in short-term borrowed funds | 1,160,682 | 696,227 | 444,830 | ||||||||
Proceeds from long-term borrowed funds | — | 40,290 | 600,294 | ||||||||
Repayment of long-term borrowed funds | (208,100 | ) | (186,349 | ) | (15,136 | ) | |||||
Purchase of treasury shares | (54,029 | ) | (128,361 | ) | (172,546 | ) | |||||
Excess tax benefit related to stock-based compensation | — | 3,198 | 1,582 | ||||||||
Acquisition of treasury shares through net settlement | (2,504 | ) | (7,697 | ) | (4,111 | ) | |||||
Dividends paid to common shareholders | (27,709 | ) | (23,414 | ) | (19,490 | ) | |||||
Net cash provided by financing activities | 683,095 | 445,333 | 472,252 | ||||||||
NET INCREASE (DECREASE) CASH AND CASH EQUIVALENTS | 36,979 | 75,870 | (26,034 | ) | |||||||
CASH AND CASH EQUIVALENTS—Beginning of year | 231,239 | 155,369 | 181,403 | ||||||||
CASH AND CASH EQUIVALENTS—End of year | $ | 268,218 | $ | 231,239 | $ | 155,369 | |||||
SUPPLEMENTAL DISCLOSURE OF CASH FLOW INFORMATION: | |||||||||||
Cash paid for interest on deposits | $ | 87,373 | $ | 89,947 | $ | 93,093 | |||||
Cash paid for interest on borrowed funds | 36,216 | 26,421 | 18,994 | ||||||||
Cash paid for income taxes | 38,208 | 31,815 | 22,533 | ||||||||
SUPPLEMENTAL SCHEDULES OF NONCASH INVESTING AND FINANCING ACTIVITIES: | |||||||||||
Transfer of loans to real estate owned | 7,989 | 12,134 | 23,761 | ||||||||
Transfer of loans from held for investment to held for sale | 218,720 | 183,178 | 127,066 | ||||||||
Treasury stock issued for stock benefit plans | 1,135 | 3,112 | 7,041 | ||||||||
See accompanying notes to consolidated financial statements.
86
TFS FINANCIAL CORPORATION AND SUBSIDIARIES
NOTES TO CONSOLIDATED FINANCIAL STATEMENTS
As of and for the years ended September 30, 2017, 2016, and 2015
(Dollars in thousands unless otherwise indicated)
1. DESCRIPTION OF BUSINESS AND SUMMARY OF SIGNIFICANT ACCOUNTING POLICIES
Business—TFS Financial Corporation, a federally chartered stock holding company, conducts its principal activities through its wholly owned subsidiaries. The principal line of business of the Company is retail consumer banking, including mortgage lending, deposit gathering, and other insignificant financial services. Third Federal Savings and Loan Association of Cleveland, MHC, its federally chartered mutual holding company parent, owned 80.74% of the outstanding shares of common stock of the Company at September 30, 2017.
The Company’s primary operating subsidiaries include the Association and Third Capital, Inc. The Association is a federal savings association, which provides retail loan and savings products to its customers in Ohio and Florida, through its 38 full-service branches, eight loan production offices, customer service call center and internet site. The Association also provides savings products, purchase mortgages, first mortgage refinance loans, home equity lines of credit, and home equity loans in states outside of its branch footprint. Third Capital, Inc. was formed to hold non-thrift investments and subsidiaries, which include a limited liability company that acquires and manages commercial real estate.
The accounting and reporting policies of TFS Financial Corporation and its subsidiaries conform to accounting principles generally accepted in the United States of America and to general practices within the thrift industry.
No material subsequent events have occurred requiring recognition in the consolidated financial statements or disclosure in the notes to the consolidated financial statements.
The following is a description of the significant accounting and reporting policies, which the Company follows in preparing and presenting its consolidated financial statements.
Principles of Consolidation—The consolidated financial statements of the Company include the accounts of TFS Financial Corporation and its wholly owned subsidiaries. Intercompany balances and transactions have been eliminated in consolidation.
Cash and Cash Equivalents—Cash and cash equivalents consist of working cash on hand, and demand and interest bearing deposits at other financial institutions with maturities of three months or less. For purposes of reporting cash flows, cash and cash equivalents also includes federal funds sold. The Company has acknowledged informal agreements with banks where it maintains deposits. Under these agreements, service fees charged to the Company are waived provided certain average compensating balances are maintained throughout each month.
Investment Securities—Securities are all classified as available for sale. Securities held as available for sale are reported at fair value, with unrealized gains and losses, net of tax, reported as a component of AOCI. Management determines the appropriate classification of securities based on the intent and ability at the time of purchase.
Gains and losses on the sale of investment and mortgage-backed securities available for sale are computed on a specific identification basis. Purchases and sales of securities are accounted for on a trade-date or settlement-date basis, depending on the settlement terms.
A decline in the fair value of any available for sale security, below cost, that is deemed to be other than temporary, results in a reduction in the carrying amount to fair value. The impairment loss is bifurcated between that related to credit loss which is recognized in non-interest income and that related to all other factors which is recognized in other comprehensive income. To determine whether an impairment is other than temporary, the Company considers, among other things, the duration and extent to which the fair value of an investment is less than its cost, changes in value subsequent to year end, forecast performance of the issuer, and whether the Company has the intent to hold the investment until market price recovery, or, for debt securities, whether the Company has the intent to sell the security or more likely than not will be required to sell the debt security before its anticipated recovery.
Premiums and discounts are amortized using the level-yield method.
Mortgage Banking Activity—Mortgage loans originated and intended for sale in the secondary market are carried at the lower of cost or estimated fair value in the aggregate. Mortgage loans included in pending agency contracts to sell and securitize loans are carried at fair value. Fair value is based on quoted secondary market pricing for loan portfolios with similar
87
characteristics and includes consideration of deferred fees (costs). Net unrealized losses or net unrealized gains on loans carried at fair value, are recognized in a valuation allowance by charges to income.
The Company retains servicing on loans that are sold and initially recognizes an asset for mortgage loan servicing rights based on the fair value of the servicing rights. Residential mortgage loans represent the single class of servicing rights and are measured at the lower of cost or fair value on a recurring basis. Mortgage loan servicing rights are reported net of accumulated amortization, which is recorded in proportion to, and over the period of, estimated net servicing revenues. The Company monitors prepayments and changes amortization of mortgage servicing rights accordingly. Fair values are estimated using discounted cash flows based on current interest rates and prepayment assumptions, and impairment is monitored each quarterly reporting period. The impairment analysis is based on predominant risk characteristics of the loans serviced, such as type, fixed and adjustable rate loans, original terms and interest rates. The amount of impairment recognized is the amount by which the mortgage loan servicing assets exceed their fair value.
Servicing fee income net of amortization and other loan fees collected on loans serviced for others are included in Fees and service charges, net of amortization on the consolidated financial statements.
Derivative Instruments—Derivative instruments are carried at fair value in the Company's financial statements. For derivative instruments that are designated and qualify as cash flow hedges, the effective portion of the gain or loss on the derivative instrument is reported as a component of other comprehensive income, net of tax, and reclassified into earnings in the same period during which the hedged transaction affects earnings. Ineffectiveness is measured as the amount by which the cumulative change in the fair value of the hedging instrument exceeds or is substantially less than the present value of the cumulative change in the hedged item's expected cash flows attributable to the risk being hedged and, when present, is recognized in current earnings during the period. At the inception of a hedge, the Company documents certain items, including the relationship between the hedging instrument and the hedged item, the risk management objective and the nature of the risk being hedged, a description of how effectiveness will be measured and an evaluation of hedge transaction effectiveness.
Hedge accounting is discontinued prospectively when (1) a derivative is no longer highly effective in offsetting changes in the fair value or cash flow of a hedged item, (2) a derivative expires or is sold, (3) a derivative is de-designated as a hedge, because it is unlikely that a forecasted transaction will occur, or (4) it is determined that designation of a derivative as a hedge is no longer appropriate. When hedge accounting is discontinued, the Company would continue to carry the derivative on the statement of condition at its fair value; however, changes in its fair value would be recorded in earnings instead of through OCI.
For derivative instruments not designated as hedging instruments, the Company recognizes gains and losses on the derivative instrument in current earnings during the period of change.
Loans and Related Deferred Loan Expenses, net—Loans originated with the intent to hold into the foreseeable future are carried at unpaid principal balances adjusted for partial charge-offs, the allowance for loan losses and net deferred loan expenses. Interest on loans is accrued and credited to income as earned. Interest on loans is not recognized in income when collectability is uncertain.
Loan fees and certain direct loan origination costs are deferred and recognized as an adjustment to interest income using the level-yield method over the contractual lives of related loans, if the loans are held for investment. If the loans are held for sale, net deferred fees (costs) are not amortized, but rather are recognized when the related loans are sold.
Loans are classified as TDRs when the original contractual terms are restructured to provide a concession to a borrower experiencing financial difficulty under terms that would not otherwise be available and the restructuring is the result of an agreement between the Company and the borrower or is imposed by a court or law. Concessions granted in TDRs may include a reduction of the stated interest rate, a reduction or forbearance of principal, an extension of the maturity date, a significant delay in payments, the removal of one or more borrowers from the obligation, or any combination of these.
Allowance for Loan Losses—The allowance for loan losses is assessed on a quarterly basis and provisions for (or recaptures of) loan losses are made in order to maintain the allowance at a level sufficient to absorb credit losses in the portfolio. Impairment evaluations are performed on loans segregated into homogeneous pools based on similarities in credit profile, product and property types. Through the evaluation, general allowances for loan losses are assessed based on historical loan loss experience for each homogeneous pool. General allowances are adjusted to address other factors that affect estimated probable losses including the size of the portion of the portfolio that is not subjected to individual review; current delinquency statistics; the status of loans in foreclosure, real estate in judgment and real estate owned; national, regional and local economic factors and trends; asset disposition loss statistics (both current and historical); and the relative level of individually allocated valuation allowances to the balances of loans individually reviewed. The allowance for loan losses is increased by charges to income and decreased by charge-offs (net of recoveries). Management believes the allowance is adequate.
88
For further discussion on the allowance for loan losses, non-accrual, impairment, and TDRs, see Note 5. Loans and Allowance for Loan Losses.
Real Estate Owned, net—Real estate owned, net represents real estate acquired through foreclosure or deed in lieu of foreclosure and is initially recorded at fair value less estimated costs to sell. Subsequent to acquisition, real estate owned is carried at the lower of cost or fair value less estimated selling costs. Management performs periodic valuations and a valuation allowance is established by a charge to income for any excess of the carrying value over the fair value less estimated costs to sell the property. Recoveries in fair value during the holding period are recognized until the valuation allowance is reduced to zero. Costs related to holding and maintaining the property are charged to expense.
Premises, Equipment, and Software, net—Depreciation and amortization of premises, equipment and software is computed on a straight-line basis over the estimated useful lives of the related assets. Estimated lives are 31.5 years for office facilities and three to 10 years for equipment and software. Amortization of leasehold or building improvements is computed on a straight-line basis over the lesser of the economic useful life of the improvement or term of the lease, typically 10 years.
Bank Owned Life Insurance Contracts—Life insurance is provided under both whole and split dollar life insurance agreements. Policy premiums were prepaid and the Company will recover the premiums paid from the proceeds of the policies. The Company recognizes death benefits and growth in the cash surrender value of the policies in other non-interest income.
Goodwill—The excess of purchase price over the fair value of net assets of acquired companies is classified as goodwill and reported in Other Assets. Goodwill was $9,732 at September 30, 2017 and 2016. Goodwill is reviewed for impairment on an annual basis as of September 30. No impairment was identified as of September 30, 2017 or 2016.
Taxes on Income—Deferred tax assets and liabilities are recognized for the future tax consequences attributable to differences between the financial statement carrying amounts of existing assets and liabilities and their respective tax bases. Deferred tax assets and liabilities are measured using enacted tax rates expected to apply to taxable income in the years in which those temporary differences are expected to be recovered or settled. The effect on deferred tax assets and liabilities of a change in tax rates is recognized in income in the period that includes the enactment date. Additional information about policies related to income taxes is included in Note 12. Income Taxes.
Deposits—Interest on deposits is accrued and charged to expense monthly and is paid or credited in accordance with the terms of the accounts.
Treasury Stock—Acquisitions of treasury stock are recorded at cost using the cost method of accounting. Repurchases may be made through open market purchases, block trades and in negotiated private transactions, subject to the availability of stock, general market conditions, the trading price of the stock, alternative uses for capital, and the Company’s financial performance. Repurchased shares will be available for general corporate purposes.
Accumulated Other Comprehensive Loss—Accumulated other comprehensive loss consists of changes in pension obligations and changes in unrealized gains (losses) on securities available for sale and cash flow hedges, each of which is net of the related income tax effects.
Pension Benefits. The determination of our obligations and expense for pension benefits is dependent upon certain assumptions used in calculating such amounts. Key assumptions used in the actuarial valuations include the discount rate and expected long-term rate of return on plan assets. Actual results could differ from the assumptions and market driven rates may fluctuate. Significant differences in actual experience or significant changes in the assumptions could materially affect future pension obligations and expense.
Share-Based Compensation—Compensation expense for awards of equity instruments is recognized on a straight-line basis over the requisite service period based on the grant date fair value estimated in accordance with the provisions of FASB ASC 718 “Compensation—Stock Compensation”. Share-based compensation expense is included in Salaries and employee benefits in the consolidated statements of income.
The grant date fair value of stock options is estimated using the Black-Scholes option-pricing model using assumptions for the expected option term, expected stock price volatility, risk-free interest rate, and expected dividend yield. Due to limited historical data on exercise of share options, the simplified method is used to estimate expected option term.
Marketing Costs—Marketing costs are expensed as incurred.
Earnings per Share—Basic earnings per share is computed by dividing net income by the weighted-average number of shares of common stock outstanding. Outstanding shares include shares sold to subscribers, shares held by the Third Federal
89
Foundation, shares of the Employee Stock Ownership Plan which have been allocated or committed to be released for allocation to participants, and shares held by Third Federal Savings, MHC. Unvested shares awarded in the Company's restricted stock plans are treated as participating securities as they contain nonforfeitable rights to dividends and are not included in the number of shares in the computation of EPS. The two-class method is an earnings allocation that determines EPS for each class of common stock and participating security.
Diluted earnings per share is computed using the same method as basic earnings per share, but the weighted-average number of shares reflects the potential dilution, if any, of unexercised stock options and unvested shares of restricted stock units that could occur if stock options were exercised and restricted stock units were issued and converted into common stock. These potentially dilutive shares would then be included in the number of weighted-average number of shares outstanding for the period using the treasury stock method. At September 30, 2017, 2016 and 2015, potentially dilutive shares include stock options and restricted stock units issued through stock-based compensation plans.
Use of Estimates—The preparation of financial statements in conformity with GAAP requires management to make estimates and assumptions that affect the reported amounts of assets and liabilities at the date of the financial statements and the reported amounts of revenues and expenses during the reporting period. Actual results could differ from these estimates.
2. STOCK TRANSACTIONS
TFS Financial Corporation completed its initial public stock offering on April 20, 2007 and sold 100,199,618 shares, or 30.16% of its post-offering outstanding common stock, to subscribers in the offering. Third Federal Savings, MHC, the Company’s mutual holding company parent, holds 227,119,132 shares of TFS Financial Corporation’s outstanding common stock. TFS Financial Corporation issued 5,000,000 shares of common stock, or 1.50% of its post-offering outstanding common stock, to Third Federal Foundation.
In January 2017, the seventh repurchase program allowing the repurchase of up to 10,000,000 shares of TFS Financial Corporation's outstanding common stock, which was originally authorized by the Board of Directors in July 2015, was completed. The Board of Directors authorized an eighth repurchase program for the repurchase of 10,000,000 shares in October 2016 and repurchases under this program began in January, 2017. A total of 3,148,610 shares were repurchased during the year ended September 30, 2017 and 7,210,500 shares were repurchased during the year ended September 30, 2016. At September 30, 2017, there were 7,750,890 shares remaining to be purchased under the eighth repurchase program. The Company previously repurchased 51,300,000 shares of the Company’s common stock as part of the previous seven Board of Directors-approved share repurchase programs. In total, the Company has repurchased 53,549,110 shares of the Company's common stock as of September 30, 2017.
3. REGULATORY MATTERS
The Association is subject to various regulatory capital requirements administered by the federal banking agencies. Failure to meet minimum capital requirements can initiate certain mandatory and possibly additional discretionary actions by regulators that, if undertaken, could have a direct material effect on the financial statements of the Association. Under capital adequacy guidelines and the regulatory framework for prompt corrective action, the Association must meet specific capital guidelines that involve quantitative measures of its assets, liabilities, and certain off-balance-sheet items as calculated under regulatory accounting practices. The capital amounts and classifications are also subject to qualitative judgments by the regulators about components, risk weightings, and other factors.
Quantitative measures established by regulation to ensure capital adequacy require the Association to maintain minimum amounts and ratios (set forth in table below) of common equity Tier 1, Tier 1, and Total capital (as defined in the regulations) to risk-weighted assets (as defined) and Tier 1 capital (as defined) to net average assets (as defined). The risk-based capital guidelines include both a definition of capital and a framework for calculating risk-weighted assets by assigning balance sheet assets and off-balance sheet assets to broad risk categories. At September 30, 2017, the Association exceeded all regulatory capital requirements and is considered “well capitalized” under regulatory guidelines.
The Association operates under the capital requirements for the standardized approach of the Basel III capital framework for U.S. banking organizations (“Basel III Rules”), subject to transitional provisions extending through the end of calendar 2018. The requirement would limit capital distributions and certain discretionary bonus payments to management if the institution does not hold a "capital conservation buffer" consisting of 2.5% in addition to the minimum capital requirements. At September 30, 2017, the Association exceeded the fully phased-in regulatory requirement for the "capital conservation buffer".
90
The following table summarizes the actual capital amounts and ratios of the Association as of September 30, 2017 and 2016, compared to the minimum capital adequacy requirements and the requirements for classification as a well capitalized institution.
Minimum Requirements | ||||||||||||||||||||
Actual | For Capital Adequacy Purposes | To be “Well Capitalized” Under Prompt Corrective Action Provision | ||||||||||||||||||
Amount | Ratio | Amount | Ratio | Amount | Ratio | |||||||||||||||
September 30, 2017 | ||||||||||||||||||||
Total Capital to Risk-Weighted Assets | $ | 1,555,903 | 21.37 | % | $ | 582,553 | 8.00 | % | $ | 728,192 | 10.00 | % | ||||||||
Tier 1 (Leverage) Capital to Net Average Assets | 1,506,952 | 11.16 | % | 540,193 | 4.00 | % | 675,242 | 5.00 | % | |||||||||||
Tier 1 Capital to Risk-Weighted Assets | 1,506,952 | 20.69 | % | 436,915 | 6.00 | % | 582,553 | 8.00 | % | |||||||||||
Common Equity Tier 1 Capital to Risk-Weighted Assets | 1,506,938 | 20.69 | % | 327,686 | 4.50 | % | 473,325 | 6.50 | % | |||||||||||
September 30, 2016 | ||||||||||||||||||||
Total Capital to Risk-Weighted Assets | $ | 1,551,502 | 22.24 | % | $ | 558,006 | 8.00 | % | $ | 697,508 | 10.00 | % | ||||||||
Tier 1 (Leverage) Capital to Net Average Assets | 1,489,704 | 11.73 | % | 507,977 | 4.00 | % | 634,972 | 5.00 | % | |||||||||||
Tier 1 Capital to Risk-Weighted Assets | 1,489,704 | 21.36 | % | 418,505 | 6.00 | % | 558,006 | 8.00 | % | |||||||||||
Common Equity Tier 1 Capital to Risk-Weighted Assets | 1,489,690 | 21.36 | % | 313,879 | 4.50 | % | 453,380 | 6.50 | % | |||||||||||
The Association paid dividends of $81,000 and $60,000 to the Company during the years ended September 30, 2017 and September 30, 2016, respectively. Additionally, the Association paid a special dividend of $150,000 to the Company in the fiscal year ended September 30, 2016. The special dividend amount was equal to the voluntary contribution of capital that the Company made to the Association in October 2010.
On July 19, 2017, as dictated under interim final rules issued by the FRS on August 12, 2011, a majority of Third Federal Savings, MHC's members eligible to vote, approved Third Federal Savings, MHC waiving its right to receive dividends on the Company's stock that Third Federal Savings, MHC owns, up to $0.68 per share during the four quarters ending June 30, 2018. Unless the FRS amends its interim rule, a member vote will be required for Third Federal Savings, MHC to waive its right to receive dividends beyond June 30, 2018.
4. INVESTMENT SECURITIES
Investments available for sale are summarized as follows:
September 30, 2017 | |||||||||||||||
Amortized Cost | Gross Unrealized | Fair Value | |||||||||||||
Gains | Losses | ||||||||||||||
REMICs | $ | 533,427 | $ | 52 | $ | (4,943 | ) | $ | 528,536 | ||||||
Fannie Mae certificates | 8,537 | 419 | (13 | ) | 8,943 | ||||||||||
Total | $ | 541,964 | $ | 471 | $ | (4,956 | ) | $ | 537,479 | ||||||
September 30, 2016 | |||||||||||||||
Amortized Cost | Gross Unrealized | Fair Value | |||||||||||||
Gains | Losses | ||||||||||||||
REMICs | $ | 508,044 | $ | 1,447 | $ | (1,494 | ) | $ | 507,997 | ||||||
Fannie Mae certificates | 9,184 | 685 | — | 9,869 | |||||||||||
Total | $ | 517,228 | $ | 2,132 | $ | (1,494 | ) | $ | 517,866 | ||||||
91
Gross unrealized losses on available for sale securities and the estimated fair value of the related securities, aggregated by the length of time the securities have been in a continuous loss position, at September 30, 2017 and 2016, were as follows:
September 30, 2017 | |||||||||||||||||||||||
Less Than 12 Months | 12 Months or More | Total | |||||||||||||||||||||
Estimated Fair Value | Unrealized Loss | Estimated Fair Value | Unrealized Loss | Estimated Fair Value | Unrealized Loss | ||||||||||||||||||
Available for sale— | |||||||||||||||||||||||
REMICs | $ | 246,113 | $ | 1,508 | $ | 260,837 | $ | 3,435 | $ | 506,950 | $ | 4,943 | |||||||||||
Fannie Mae certificates | 4,601 | 13 | — | — | 4,601 | 13 | |||||||||||||||||
Total | $ | 250,714 | $ | 1,521 | $ | 260,837 | $ | 3,435 | $ | 511,551 | $ | 4,956 | |||||||||||
September 30, 2016 | |||||||||||||||||||||||
Less Than 12 Months | 12 Months or More | Total | |||||||||||||||||||||
Estimated Fair Value | Unrealized Loss | Estimated Fair Value | Unrealized Loss | Estimated Fair Value | Unrealized Loss | ||||||||||||||||||
Available for sale—REMICs | $ | 210,735 | $ | 797 | $ | 73,361 | $ | 697 | $ | 284,096 | $ | 1,494 | |||||||||||
The unrealized losses on investment securities were attributable to interest rate increases. The contractual cash flows of mortgage-backed securities are guaranteed by Fannie Mae, Freddie Mac or Ginnie Mae. REMICs are issued by or backed by securities issued by these governmental agencies. It is expected that the securities would not be settled at a price substantially less than the amortized cost of the investment. The U.S. Treasury Department established financing agreements in 2008 to ensure Fannie Mae and Freddie Mac meet their obligations to holders of mortgage-backed securities that they have issued or guaranteed.
Since the decline in value is attributable to changes in interest rates and not credit quality and because the Association has neither the intent to sell the securities nor is it more likely than not the Association will be required to sell the securities for the time periods necessary to recover the amortized cost, these investments are not considered other-than-temporarily impaired.
5. LOANS AND ALLOWANCE FOR LOAN LOSSES
Loans held for investment consist of the following:
September 30, | |||||||
2017 | 2016 | ||||||
Real estate loans: | |||||||
Residential Core | $ | 10,746,204 | $ | 10,069,652 | |||
Residential Home Today | 108,964 | 121,938 | |||||
Home equity loans and lines of credit | 1,552,315 | 1,531,282 | |||||
Construction | 60,956 | 61,382 | |||||
Real estate loans | 12,468,439 | 11,784,254 | |||||
Other consumer loans | 3,050 | 3,116 | |||||
Add (deduct): | |||||||
Deferred loan expenses, net | 30,865 | 19,384 | |||||
Loans-in-process (“LIP”) | (34,100 | ) | (36,155 | ) | |||
Allowance for loan losses | (48,948 | ) | (61,795 | ) | |||
Loans held for investment, net | $ | 12,419,306 | $ | 11,708,804 | |||
At September 30, 2017 and 2016, respectively, $351 and $4,686 of long-term, fixed-rate loans were classified as mortgage loans held for sale.
A large concentration of the Company’s lending is in Ohio and Florida. As of September 30, 2017 and 2016, the percentage of total Residential Core, Home Today and Construction loans held in Ohio were 57% and 60%, respectively, and
92
the percentages held in Florida was 16% as of both dates. As of September 30, 2017 and 2016, home equity loans and lines of credit were concentrated in Ohio (39% as of both dates), Florida (22% and 24%) and California (13% and 14%).
Home Today was an affordable housing program targeted to benefit low- and moderate-income home buyers and most loans under the program were originated prior to 2009. No new loans were originated under the Home Today program after September 30, 2016. Through this program the Association provided the majority of loans to borrowers who would not otherwise qualify for the Association’s loan products, generally because of low credit scores. Although the credit profiles of borrowers in the Home Today program might be described as sub-prime, Home Today loans generally contained the same features as loans offered to our Residential Core borrowers. Borrowers with a Home Today loan completed financial management education and counseling and were referred to the Association by a sponsoring organization with which the Association partnered as part of the program. Because the Association applied less stringent underwriting and credit standards to the majority of Home Today loans, loans originated under the program have greater credit risk than its traditional residential real estate mortgage loans in the Residential Core portfolio. As of September 30, 2017 and 2016, the principal balance of Home Today loans originated prior to March 27, 2009 was $105,485 and $118,255 respectively. Since loans are no longer originated under the Home Today program, the Home Today portfolio will continue to decline in balance due to contractual amortization. To supplant the Home Today product and to continue to meet the credit needs of customers and the communities served, during 2016 the Association began to offer Fannie Mae eligible, HomeReady loans. These loans are originated in accordance with Fannie Mae's underwriting standards. While the Association retains the servicing to these loans, the loans, along with the credit risk associated therewith, are securitized/sold to Fannie Mae. The Association does not offer, and has not offered, loan products frequently considered to be designed to target sub-prime borrowers containing features such as higher fees or higher rates, negative amortization, a LTV ratio greater than 100%, or pay-option, adjustable-rate mortgages.
The Association currently offers home equity lines of credit that include monthly principal and interest payments throughout the entire term. Home equity lines of credit prior to June 28, 2010 require interest only payments for 10 years, with an option to extend the interest only and draw period another 10 years, at which time they are included in the home equity loan balance. The recorded investment in interest only loans is comprised solely of equity lines of credit with balances of $483,127 and $892,973 for the years ending September 30, 2017 and 2016, respectively.
An age analysis of the recorded investment in loan receivables that are past due at September 30, 2017 and 2016 is summarized in the following tables. When a loan is more than one month past due on its scheduled payments, the loan is considered 30 days or more past due. Balances are adjusted for deferred loan fees, expenses and any applicable loans-in-process.
30-59 Days Past Due | 60-89 Days Past Due | 90 Days or More Past Due | Total Past Due | Current | Total | ||||||||||||||||||
September 30, 2017 | |||||||||||||||||||||||
Real estate loans: | |||||||||||||||||||||||
Residential Core | $ | 6,077 | $ | 2,593 | $ | 11,975 | $ | 20,645 | $ | 10,740,398 | $ | 10,761,043 | |||||||||||
Residential Home Today | 4,067 | 1,496 | 6,851 | 12,414 | 95,269 | 107,683 | |||||||||||||||||
Home equity loans and lines of credit | 4,418 | 1,952 | 5,408 | 11,778 | 1,558,273 | 1,570,051 | |||||||||||||||||
Construction | — | — | — | — | 26,427 | 26,427 | |||||||||||||||||
Total real estate loans | 14,562 | 6,041 | 24,234 | 44,837 | 12,420,367 | 12,465,204 | |||||||||||||||||
Other consumer loans | — | — | — | — | 3,050 | 3,050 | |||||||||||||||||
Total | $ | 14,562 | $ | 6,041 | $ | 24,234 | $ | 44,837 | $ | 12,423,417 | $ | 12,468,254 | |||||||||||
93
30-59 Days Past Due | 60-89 Days Past Due | 90 Days or More Past Due | Total Past Due | Current | Total | ||||||||||||||||||
September 30, 2016 | |||||||||||||||||||||||
Real estate loans: | |||||||||||||||||||||||
Residential Core | $ | 6,653 | $ | 3,157 | $ | 15,593 | $ | 25,403 | $ | 10,054,211 | $ | 10,079,614 | |||||||||||
Residential Home Today | 5,271 | 2,583 | 7,356 | 15,210 | 105,225 | 120,435 | |||||||||||||||||
Home equity loans and lines of credit | 4,605 | 1,811 | 4,932 | 11,348 | 1,531,242 | 1,542,590 | |||||||||||||||||
Construction | — | — | — | — | 24,844 | 24,844 | |||||||||||||||||
Total real estate loans | 16,529 | 7,551 | 27,881 | 51,961 | 11,715,522 | 11,767,483 | |||||||||||||||||
Other consumer loans | — | — | — | — | 3,116 | 3,116 | |||||||||||||||||
Total | $ | 16,529 | $ | 7,551 | $ | 27,881 | $ | 51,961 | $ | 11,718,638 | $ | 11,770,599 | |||||||||||
At September 30, 2017 and 2016, real estate loans include $14,736 and $20,047, respectively, of loans that were in the process of foreclosure.
Loans are placed in non-accrual status when they are contractually 90 days or more past due. Loans restructured in TDRs that were in non-accrual status prior to the restructurings remain in non-accrual status for a minimum of six months after restructuring. Loans where the borrowers' sustained ability to repay is not fully supported at the time of modification are placed in non-accrual status for a minimum of twelve months. Additionally, home equity loans and lines of credit where the customer has a severely delinquent first mortgage loan and loans in Chapter 7 bankruptcy status where all borrowers have filed, and not reaffirmed or been dismissed, are placed in non-accrual status.
The recorded investment of loan receivables in non-accrual status is summarized in the following table. Balances are adjusted for deferred loan fees and expenses.
September 30, | |||||||
2017 | 2016 | ||||||
Real estate loans: | |||||||
Residential Core | $ | 43,797 | $ | 51,304 | |||
Residential Home Today | 18,109 | 19,451 | |||||
Home equity loans and lines of credit | 17,185 | 19,206 | |||||
Total non-accrual loans | $ | 79,091 | $ | 89,961 | |||
At September 30, 2017 and September 30, 2016, respectively, the recorded investment in non-accrual loans includes $54,858 and $62,081 which are performing according to the terms of their agreement, of which $34,142 and $40,546 are loans in Chapter 7 bankruptcy status, primarily where all borrowers have filed, and have not reaffirmed or been dismissed.
Interest on loans in accrual status, including certain loans individually reviewed for impairment, is recognized in interest income as it accrues, on a daily basis. Accrued interest on loans in non-accrual status is reversed by a charge to interest income and income is subsequently recognized only to the extent cash payments are received. Cash payments on loans in non-accrual status are applied to the oldest scheduled, unpaid payment first. Cash payments on loans with a partial charge-off are applied fully to principal, then to recovery of the charged off amount prior to interest income being recognized. A non-accrual loan is generally returned to accrual status when contractual payments are less than 90 days past due. However, a loan may remain in non-accrual status when collectability is uncertain, such as a TDR that has not met minimum payment requirements, a loan with a partial charge-off, an equity loan or line of credit with a delinquent first mortgage greater than 90 days, or a loan in Chapter 7 bankruptcy status where all borrowers have filed, and have not reaffirmed or been dismissed. The number of days past due is determined by the number of scheduled payments that remain unpaid, assuming a period of 30 days between each scheduled payment.
94
The recorded investment in loan receivables at September 30, 2017 and 2016 is summarized in the following table. The table provides details of the recorded balances according to the method of evaluation used for determining the allowance for loan losses, distinguishing between determinations made by evaluating individual loans and determinations made by evaluating groups of loans not individually evaluated. Balances of recorded investments are adjusted for deferred loan fees, expenses and any applicable loans-in-process.
September 30, | |||||||||||||||||||||||
2017 | 2016 | ||||||||||||||||||||||
Individually | Collectively | Total | Individually | Collectively | Total | ||||||||||||||||||
Real estate loans: | |||||||||||||||||||||||
Residential Core | $ | 94,747 | $ | 10,666,296 | $ | 10,761,043 | $ | 107,541 | $ | 9,972,073 | $ | 10,079,614 | |||||||||||
Residential Home Today | 46,641 | 61,042 | 107,683 | 51,415 | 69,020 | 120,435 | |||||||||||||||||
Home equity loans and lines of credit | 39,172 | 1,530,879 | 1,570,051 | 35,894 | 1,506,696 | 1,542,590 | |||||||||||||||||
Construction | — | 26,427 | 26,427 | — | 24,844 | 24,844 | |||||||||||||||||
Total real estate loans | 180,560 | 12,284,644 | 12,465,204 | 194,850 | 11,572,633 | 11,767,483 | |||||||||||||||||
Other consumer loans | — | 3,050 | 3,050 | — | 3,116 | 3,116 | |||||||||||||||||
Total | $ | 180,560 | $ | 12,287,694 | $ | 12,468,254 | $ | 194,850 | $ | 11,575,749 | $ | 11,770,599 | |||||||||||
An analysis of the allowance for loan losses at September 30, 2017 and 2016 is summarized in the following table. The analysis provides details of the allowance for loan losses according to the method of evaluation, distinguishing between allowances for loan losses determined by evaluating individual loans and allowances for loan losses determined by evaluating groups of loans collectively.
September 30, | |||||||||||||||||||||||
2017 | 2016 | ||||||||||||||||||||||
Individually | Collectively | Total | Individually | Collectively | Total | ||||||||||||||||||
Real estate loans: | |||||||||||||||||||||||
Residential Core | $ | 7,336 | $ | 6,850 | $ | 14,186 | $ | 8,927 | $ | 6,141 | $ | 15,068 | |||||||||||
Residential Home Today | 2,250 | 2,258 | 4,508 | 2,979 | 4,437 | 7,416 | |||||||||||||||||
Home equity loans and lines of credit | 1,475 | 28,774 | 30,249 | 722 | 38,582 | 39,304 | |||||||||||||||||
Construction | — | 5 | 5 | — | 7 | 7 | |||||||||||||||||
Total real estate loans | $ | 11,061 | $ | 37,887 | $ | 48,948 | $ | 12,628 | $ | 49,167 | $ | 61,795 | |||||||||||
At September 30, 2017 and 2016, individually evaluated loans that required an allowance were comprised only of loans evaluated for impairment based on the present value of cash flows, such as performing TDRs, and loans with a further deterioration in the fair value of collateral not yet identified as uncollectible. All other individually evaluated loans received a charge-off if applicable.
Because many variables are considered in determining the appropriate level of general valuation allowances, directional changes in individual considerations do not always align with the directional change in the balance of a particular component of the general valuation allowance. At September 30, 2017 and 2016, respectively, allowances on individually reviewed loans evaluated for impairment based on the present value of cash flows, such as performing TDRs were $11,061 and $12,432; and allowances on loans with further deteriorations in the fair value of collateral not yet identified as uncollectible were $0 and $196.
Residential Core mortgage loans represent the largest portion of the residential real estate portfolio. The Company believes overall credit risk is low based on the nature, composition, collateral, products, lien position and performance of the portfolio. The portfolio does not include loan types or structures that have recently experienced severe performance problems at other financial institutions (sub-prime, no documentation or pay-option adjustable-rate mortgages).
As described earlier in this note, Home Today loans have greater credit risk than traditional residential real estate mortgage loans. At September 30, 2017 and 2016, respectively, approximately 22% and 27% of Home Today loans include private mortgage insurance coverage. The majority of the coverage on these loans was provided by PMI Mortgage Insurance Co., which the Arizona Department of Insurance seized in 2011 and indicated that all claims payments would be reduced by
95
50%. Between March 2013 and June 2016, PMIC gradually increased the cash percentage of the partial claim payment from 55% to 71.5% of the claim with the remainder deferred. Appropriate adjustments have been made to the Association’s affected valuation allowances and charge-offs, and estimated loss severity factors were adjusted accordingly for loans evaluated collectively. The amount of loans in the Association's total owned residential portfolio covered by mortgage insurance provided by PMIC as of September 30, 2017 and 2016, respectively, was $61,470 and $91,784 of which $56,511 and $84,007 was current. The amount of loans in our owned portfolio covered by mortgage insurance provided by Mortgage Guaranty Insurance Corporation as of September 30, 2017 and 2016, respectively, was $28,946 and $40,578 of which $28,870 and $40,190 was current. As of September 30, 2017, MGIC's long-term debt rating, as published by the major credit rating agencies, did not meet the requirements to qualify as "high credit quality"; however, MGIC continues to make claims payments in accordance with its contractual obligations and the Association has not increased its estimated loss severity factors related to MGIC's claim paying ability. No other loans were covered by mortgage insurers that were deferring claim payments or which we assessed as being non-investment grade.
Home equity loans and lines of credit, which are comprised primarily of home equity lines of credit, represent a significant portion of the residential real estate portfolio. Post-origination deterioration in economic and housing market conditions may impact a borrower's ability to afford the higher payments required during the end of draw repayment period that follows the period of interest only payments on home equity lines of credit originated prior to 2012 or the ability to secure alternative financing. Beginning in February 2013, the terms on new home equity lines of credit included monthly principal and interest payments throughout the entire term to minimize the potential payment differential between the during draw and after draw periods.
The Association originates construction loans to individuals for the construction of their personal single-family residence by a qualified builder (construction/permanent loans). The Association’s construction/permanent loans generally provide for disbursements to the builder or sub-contractors during the construction phase as work progresses. During the construction phase, the borrower only pays interest on the drawn balance. Upon completion of construction, the loan converts to a permanent amortizing loan without the expense of a second closing. The Association offers construction/permanent loans with fixed or adjustable rates, and a current maximum loan-to-completed-appraised value ratio of 85%.
Other consumer loans are comprised of loans secured by certificate of deposit accounts, which are fully recoverable in the event of non-payment.
For all classes of loans, a loan is considered impaired when, based on current information and events, it is probable that the Association will be unable to collect the scheduled payments of principal and interest according to the contractual terms of the loan agreement. Factors considered in determining that a loan is impaired may include the deteriorating financial condition of the borrower indicated by missed or delinquent payments, a pending legal action, such as bankruptcy or foreclosure, or the absence of adequate security for the loan.
96
The recorded investment and the unpaid principal balance of impaired loans, including those reported as TDRs, as of September 30, 2017 and 2016 are summarized as follows. Balances of recorded investments are adjusted for deferred loan fees and expenses.
September 30, | |||||||||||||||||||||||
2017 | 2016 | ||||||||||||||||||||||
Recorded Investment | Unpaid Principal Balance | Related Allowance | Recorded Investment | Unpaid Principal Balance | Related Allowance | ||||||||||||||||||
With no related IVA recorded: | |||||||||||||||||||||||
Residential Core | $ | 47,507 | $ | 65,132 | $ | — | $ | 53,560 | $ | 72,693 | $ | — | |||||||||||
Residential Home Today | 18,780 | 41,064 | — | 20,108 | 44,914 | — | |||||||||||||||||
Home equity loans and lines of credit | 18,793 | 25,991 | — | 20,549 | 30,216 | — | |||||||||||||||||
Total | $ | 85,080 | $ | 132,187 | $ | — | $ | 94,217 | $ | 147,823 | $ | — | |||||||||||
With an IVA recorded: | |||||||||||||||||||||||
Residential Core | $ | 47,240 | $ | 47,747 | $ | 7,336 | $ | 53,981 | $ | 54,717 | $ | 8,927 | |||||||||||
Residential Home Today | 27,861 | 28,210 | 2,250 | 31,307 | 31,725 | 2,979 | |||||||||||||||||
Home equity loans and lines of credit | 20,379 | 20,389 | 1,475 | 15,345 | 15,357 | 722 | |||||||||||||||||
Total | $ | 95,480 | $ | 96,346 | $ | 11,061 | $ | 100,633 | $ | 101,799 | $ | 12,628 | |||||||||||
Total impaired loans: | |||||||||||||||||||||||
Residential Core | $ | 94,747 | $ | 112,879 | $ | 7,336 | $ | 107,541 | $ | 127,410 | $ | 8,927 | |||||||||||
Residential Home Today | 46,641 | 69,274 | 2,250 | 51,415 | 76,639 | 2,979 | |||||||||||||||||
Home equity loans and lines of credit | 39,172 | 46,380 | 1,475 | 35,894 | 45,573 | 722 | |||||||||||||||||
Total | $ | 180,560 | $ | 228,533 | $ | 11,061 | $ | 194,850 | $ | 249,622 | $ | 12,628 | |||||||||||
At September 30, 2017 and 2016, respectively, the recorded investment in impaired loans includes $162,020 and $170,602 of loans restructured in TDRs of which $11,884 and $12,368 are 90 days or more past due.
The average recorded investment in impaired loans and the amount of interest income recognized during period that the loans were impaired are summarized below.
For the Years Ended September 30, | |||||||||||||||||||||||
2017 | 2016 | 2015 | |||||||||||||||||||||
Average Recorded Investment | Interest Income Recognized | Average Recorded Investment | Interest Income Recognized | Average Recorded Investment | Interest Income Recognized | ||||||||||||||||||
With no related IVA recorded: | |||||||||||||||||||||||
Residential Core | $ | 50,534 | $ | 1,411 | $ | 57,869 | $ | 1,288 | $ | 67,509 | $ | 1,464 | |||||||||||
Residential Home Today | 19,444 | 337 | 21,573 | 352 | 25,542 | 271 | |||||||||||||||||
Home equity loans and lines of credit | 19,671 | 293 | 21,798 | 282 | 24,832 | 299 | |||||||||||||||||
Total | $ | 89,649 | $ | 2,041 | $ | 101,240 | $ | 1,922 | $ | 117,883 | $ | 2,034 | |||||||||||
With an IVA recorded: | |||||||||||||||||||||||
Residential Core | $ | 50,611 | $ | 1,891 | $ | 55,696 | $ | 2,228 | $ | 58,145 | $ | 2,570 | |||||||||||
Residential Home Today | 29,584 | 1,445 | 33,158 | 1,756 | 37,070 | 1,877 | |||||||||||||||||
Home equity loans and lines of credit | 17,862 | 849 | 13,206 | 255 | 9,469 | 271 | |||||||||||||||||
Construction | — | — | 213 | — | 213 | 10 | |||||||||||||||||
Total | $ | 98,057 | $ | 4,185 | $ | 102,273 | $ | 4,239 | $ | 104,897 | $ | 4,728 | |||||||||||
Total impaired loans: | |||||||||||||||||||||||
Residential Core | $ | 101,145 | $ | 3,302 | $ | 113,565 | $ | 3,516 | $ | 125,654 | $ | 4,034 | |||||||||||
Residential Home Today | 49,028 | 1,782 | 54,731 | 2,108 | 62,612 | 2,148 | |||||||||||||||||
Home equity loans and lines of credit | 37,533 | 1,142 | 35,004 | 537 | 34,301 | 570 | |||||||||||||||||
Construction | — | — | 213 | — | 213 | 10 | |||||||||||||||||
Total | $ | 187,706 | $ | 6,226 | $ | 203,513 | $ | 6,161 | $ | 222,780 | $ | 6,762 | |||||||||||
97
Interest on loans in non-accrual status is recognized on a cash-basis. The amount of interest income on impaired loans recognized using a cash-basis method is $1,443, $1,400 and $1,347 for the years ended September 30, 2017, 2016 and 2015, respectively. Cash payments on loans with a partial charge-off are applied fully to principal, then to recovery of the charged off amount prior to interest income being recognized. Interest income on the remaining impaired loans is recognized on an accrual basis.
Charge-offs on residential mortgage loans, home equity loans and lines of credit, and construction loans are recognized when triggering events, such as foreclosure actions, short sales, or deeds accepted in lieu of repayment, result in less than full repayment of the recorded investment in the loans.
Partial or full charge-offs are also recognized for the amount of impairment on loans considered collateral dependent that meet the conditions described below.
• | For residential mortgage loans, payments are greater than 180 days delinquent; |
• | For home equity lines of credit, equity loans, and residential loans restructured in a TDR, payments are greater than 90 days delinquent; |
• | For all classes of loans, a sheriff sale is scheduled within 60 days to sell the collateral securing the loan; |
• | For all classes of loans, all borrowers have been discharged of their obligation through a Chapter 7 bankruptcy; |
• | For all classes of loans, within 60 days of notification, all borrowers obligated on the loan have filed Chapter 7 bankruptcy and have not reaffirmed or been dismissed; |
• | For all classes of loans, a borrower obligated on a loan has filed bankruptcy and the loan is greater than 30 days delinquent; |
• | For all classes of loans, it becomes evident that a loss is probable. |
Collateral dependent residential mortgage loans and construction loans are charged off to the extent the recorded investment in a loan, net of anticipated mortgage insurance claims, exceeds the fair value less costs to dispose of the underlying property. Management can determine the loan is uncollectible for reasons such as foreclosures exceeding a reasonable time frame and recommend a full charge-off. Home equity loans or lines of credit are charged off to the extent the recorded investment in the loan plus the balance of any senior liens exceeds the fair value less costs to dispose of the underlying property or management determines the collateral is not sufficient to satisfy the loan. A loan in any portfolio that is identified as collateral dependent will continue to be reported as impaired until it is no longer considered collateral dependent, is less than 30 days past due and does not have a prior charge-off. A loan in any portfolio that has a partial charge-off consequent to impairment evaluation will continue to be individually evaluated for impairment until, at a minimum, the impairment has been recovered.
The following summarizes the effective dates of charge-off policies that changed or were first implemented during the current and previous four fiscal years and the portfolios to which those policies apply.
Effective Date | Policy | Portfolio(s) Affected |
6/30/2014 | A loan is considered collateral dependent and any collateral shortfall is charged off when, within 60 days of notification, all borrowers obligated on a loan filed Chapter 7 bankruptcy and have not reaffirmed or been dismissed (1) | All |
(1) | Prior to 6/30/2014, collateral shortfalls on loans in Chapter 7 bankruptcy were charged off when all borrowers were discharged of the obligation or when the loan was 30 days or more past due. Adoption of this policy did not result in a material change to total charge-offs or the provision for loan losses in the fiscal year ending September 30, 2014. |
Loans restructured in TDRs that are not evaluated based on collateral are separately evaluated for impairment on a loan by loan basis at the time of restructuring and at each subsequent reporting date for as long as they are reported as TDRs. The impairment evaluation is based on the present value of expected future cash flows discounted at the effective interest rate of the original loan. Expected future cash flows include a discount factor representing a potential for default. Valuation allowances are recorded for the excess of the recorded investments over the result of the cash flow analysis. Loans discharged in Chapter 7 bankruptcy are reported as TDRs and also evaluated based on the present value of expected future cash flows unless evaluated based on collateral. We evaluate these loans using the expected future cash flows because we expect the borrower, not liquidation of the collateral, to be the source of repayment for the loan. Other consumer loans are not considered for restructuring. A loan restructured in a TDR is classified as an impaired loan for a minimum of one year. After one year, that loan may be reclassified out of the balance of impaired loans if the loan was restructured to yield a market rate for loans of
98
similar credit risk at the time of restructuring and the loan is not impaired based on the terms of the restructuring agreement. No loans whose terms were restructured in TDRs were reclassified from impaired loans during the years ended September 30, 2017, 2016 and 2015.
The recorded investment in TDRs by type of concession as of September 30, 2017 and September 30, 2016 is shown in the tables below.
September 30, 2017 | Reduction in Interest Rates | Payment Extensions | Forbearance or Other Actions | Multiple Concessions | Multiple Restructurings | Bankruptcy | Total | |||||||||||||||||||||
Residential Core | $ | 12,485 | $ | 521 | $ | 8,176 | $ | 21,278 | $ | 20,459 | $ | 23,670 | $ | 86,589 | ||||||||||||||
Residential Home Today | 5,441 | — | 4,811 | 10,538 | 18,877 | 4,337 | 44,004 | |||||||||||||||||||||
Home equity loans and lines of credit | 106 | 6,033 | 373 | 14,661 | 1,471 | 8,783 | 31,427 | |||||||||||||||||||||
Total | $ | 18,032 | $ | 6,554 | $ | 13,360 | $ | 46,477 | $ | 40,807 | $ | 36,790 | $ | 162,020 | ||||||||||||||
September 30, 2016 | Reduction in Interest Rates | Payment Extensions | Forbearance or Other Actions | Multiple Concessions | Multiple Restructurings | Bankruptcy | Total | |||||||||||||||||||||
Residential Core | $ | 13,456 | $ | 748 | $ | 8,595 | $ | 22,641 | $ | 21,517 | $ | 28,263 | $ | 95,220 | ||||||||||||||
Residential Home Today | 6,338 | — | 5,198 | 11,330 | 20,497 | 5,241 | 48,604 | |||||||||||||||||||||
Home equity loans and lines of credit | 120 | 4,135 | 401 | 9,354 | 1,166 | 11,602 | 26,778 | |||||||||||||||||||||
Total | $ | 19,914 | $ | 4,883 | $ | 14,194 | $ | 43,325 | $ | 43,180 | $ | 45,106 | $ | 170,602 | ||||||||||||||
TDRs may be restructured more than once. Among other requirements, a subsequent restructuring may be available for a borrower upon the expiration of temporary restructured terms if the borrower cannot return to regular loan payments. If the borrower is experiencing an income curtailment that temporarily has reduced his/her capacity to repay, such as loss of employment, reduction of hours, non-paid leave or short term disability, a temporary restructuring is considered. If the borrower lacks the capacity to repay the loan at the current terms due to a permanent condition, a permanent restructuring is considered. In evaluating the need for a subsequent restructuring, the borrower’s ability to repay is generally assessed utilizing a debt to income and cash flow analysis. As the economy has improved, the need for multiple restructurings has begun to abate. Loans discharged in Chapter 7 bankruptcy are classified as multiple restructurings if the loan's original terms had also been restructured by the Association.
For all loans restructured during the years ended September 30, 2017, 2016 and 2015 (set forth in the tables below), the pre-restructured outstanding recorded investment was not materially different from the post-restructured outstanding recorded investment.
The following tables set forth the recorded investment in TDRs restructured during the years presented, according to the types of concessions granted.
For the Year Ended September 30, 2017 | |||||||||||||||||||||||||||
Reduction in Interest Rates | Payment Extensions | Forbearance or Other Actions | Multiple Concessions | Multiple Restructurings | Bankruptcy | Total | |||||||||||||||||||||
(Dollars in thousands) | |||||||||||||||||||||||||||
Residential Core | $ | 818 | $ | — | $ | 1,340 | $ | 1,654 | $ | 2,176 | $ | 2,621 | $ | 8,609 | |||||||||||||
Residential Home Today | 147 | — | 456 | 458 | 2,734 | 469 | 4,264 | ||||||||||||||||||||
Home equity loans and lines of credit | — | 2,282 | 32 | 6,834 | 694 | 1,042 | 10,884 | ||||||||||||||||||||
Total | $ | 965 | $ | 2,282 | $ | 1,828 | $ | 8,946 | $ | 5,604 | $ | 4,132 | $ | 23,757 | |||||||||||||
99
For the Year Ended September 30, 2016 | |||||||||||||||||||||||||||
Reduction in Interest Rates | Payment Extensions | Forbearance or Other Actions | Multiple Concessions | Multiple Restructurings | Bankruptcy | Total | |||||||||||||||||||||
(Dollars in thousands) | |||||||||||||||||||||||||||
Residential Core | $ | 1,342 | $ | — | $ | 1,154 | $ | 4,444 | $ | 2,902 | $ | 4,929 | $ | 14,771 | |||||||||||||
Residential Home Today | 169 | — | 489 | 542 | 3,487 | 469 | 5,156 | ||||||||||||||||||||
Home equity loans and lines of credit | 58 | 1,371 | 33 | 5,842 | 459 | 1,360 | 9,123 | ||||||||||||||||||||
Total | $ | 1,569 | $ | 1,371 | $ | 1,676 | $ | 10,828 | $ | 6,848 | $ | 6,758 | $ | 29,050 | |||||||||||||
For the Year Ended September 30, 2015 | |||||||||||||||||||||||||||
Reduction in Interest Rates | Payment Extensions | Forbearance or Other Actions | Multiple Concessions | Multiple Restructurings | Bankruptcy | Total | |||||||||||||||||||||
(Dollars in thousands) | |||||||||||||||||||||||||||
Residential Core | $ | 2,490 | $ | — | $ | 745 | $ | 4,464 | $ | 4,437 | $ | 6,720 | $ | 18,856 | |||||||||||||
Residential Home Today | 80 | — | 758 | 301 | 5,306 | 2,096 | 8,541 | ||||||||||||||||||||
Home equity loans and lines of credit | — | 1,800 | 88 | 3,079 | 290 | 1,634 | 6,891 | ||||||||||||||||||||
Total | $ | 2,570 | $ | 1,800 | $ | 1,591 | $ | 7,844 | $ | 10,033 | $ | 10,450 | $ | 34,288 | |||||||||||||
Below summarizes the information on TDRs restructured within the previous 12 months of the period presented for which there was a subsequent payment default, at least 30 days past due on one scheduled payment, during the period presented.
For the Year Ended September 30, 2017 | For the Year Ended September 30, 2016 | For the Year Ended September 30, 2015 | ||||||||||||||||||
TDRs That Subsequently Defaulted | Number of Contracts | Recorded Investment | Number of Contracts | Recorded Investment | Number of Contracts | Recorded Investment | ||||||||||||||
(Dollars in thousands) | (Dollars in thousands) | (Dollars in thousands) | ||||||||||||||||||
Residential Core | 17 | $ | 1,462 | 32 | $ | 2,282 | 34 | $ | 3,296 | |||||||||||
Residential Home Today | 25 | 1,126 | 26 | 1,088 | 26 | 1,179 | ||||||||||||||
Home equity loans and lines of credit | 16 | 667 | 28 | 886 | 44 | 689 | ||||||||||||||
Total | 58 | $ | 3,255 | 86 | $ | 4,256 | 104 | $ | 5,164 | |||||||||||
Residential loans are internally assigned a grade that complies with the guidelines outlined in the OCC’s Handbook for Rating Credit Risk. Pass loans are assets well protected by the current paying capacity of the borrower. Special Mention loans have a potential weakness, as evaluated based on delinquency status, that the Association feels deserve management’s attention and may result in further deterioration in their repayment prospects and/or the Association’s credit position. Substandard loans are inadequately protected by the current payment capacity of the borrower or the collateral pledged with a defined weakness that jeopardizes the liquidation of the debt. Also included in Substandard are performing home equity loans and lines of credit where the customer has a severely delinquent first mortgage to which the performing home equity loan or line of credit is subordinate and loans in Chapter 7 bankruptcy status where all borrowers have filed, and have not reaffirmed or been dismissed. Loss loans are considered uncollectible and are charged off when identified.
100
The following tables provide information about the credit quality of residential loan receivables by an internally assigned grade. Balances are adjusted for deferred loan fees, expenses and any applicable LIP.
Pass | Special Mention | Substandard | Loss | Total | |||||||||||||||
September 30, 2017 | |||||||||||||||||||
Real Estate Loans: | |||||||||||||||||||
Residential Core | $ | 10,709,739 | $ | — | $ | 51,304 | $ | — | $ | 10,761,043 | |||||||||
Residential Home Today | 88,247 | — | 19,436 | — | 107,683 | ||||||||||||||
Home equity loans and lines of credit | 1,545,658 | 3,837 | 20,556 | — | 1,570,051 | ||||||||||||||
Construction | 26,427 | — | — | — | 26,427 | ||||||||||||||
Total real estate loans | $ | 12,370,071 | $ | 3,837 | $ | 91,296 | $ | — | $ | 12,465,204 | |||||||||
Pass | Special Mention | Substandard | Loss | Total | |||||||||||||||
September 30, 2016 | |||||||||||||||||||
Real Estate Loans: | |||||||||||||||||||
Residential Core | $ | 10,022,555 | $ | — | $ | 57,059 | $ | — | $ | 10,079,614 | |||||||||
Residential Home Today | 99,442 | — | 20,993 | — | 120,435 | ||||||||||||||
Home equity loans and lines of credit | 1,516,551 | 4,122 | 21,917 | — | 1,542,590 | ||||||||||||||
Construction | 24,844 | — | — | — | 24,844 | ||||||||||||||
Total real estate loans | $ | 11,663,392 | $ | 4,122 | $ | 99,969 | $ | — | $ | 11,767,483 | |||||||||
At September 30, 2017 and 2016, respectively, the recorded investment of impaired loans includes $94,104 and $101,227 of TDRs that are individually evaluated for impairment, but have adequately performed under the terms of the restructuring and are classified as Pass loans. At September 30, 2017 and 2016, respectively, there were $4,840 and $6,346 of loans classified substandard and $3,837 and $4,122 of loans designated special mention that are not included in the recorded investment of impaired loans; rather, they are included in loans collectively evaluated for impairment.
Other consumer loans are internally assigned a grade of nonperforming when they are considered 90 days or more past due. At September 30, 2017 and September 30, 2016, no consumer loans were graded as nonperforming.
During the years ended September 30, 2017 and 2016, respectively, $0 and $244 in recoveries were recorded representing payments received as a result of PMIC increasing the cash percentage of the partial claim payment plan as discussed earlier in this note.
Activity in the allowance for loan losses is summarized as follows:
For the Year Ended September 30, 2017 | |||||||||||||||||||
Beginning Balance | Provisions | Charge-offs | Recoveries | Ending Balance | |||||||||||||||
Real estate loans: | |||||||||||||||||||
Residential Core | $ | 15,068 | $ | (3,311 | ) | $ | (3,029 | ) | $ | 5,458 | $ | 14,186 | |||||||
Residential Home Today | 7,416 | (1,943 | ) | (2,276 | ) | 1,311 | 4,508 | ||||||||||||
Home equity loans and lines of credit | 39,304 | (11,744 | ) | (6,173 | ) | 8,862 | 30,249 | ||||||||||||
Construction | 7 | (2 | ) | — | — | 5 | |||||||||||||
Total real estate loans | $ | 61,795 | $ | (17,000 | ) | $ | (11,478 | ) | $ | 15,631 | $ | 48,948 | |||||||
101
For the Year Ended September 30, 2016 | |||||||||||||||||||
Beginning Balance | Provisions | Charge-offs | Recoveries | Ending Balance | |||||||||||||||
Real estate loans: | |||||||||||||||||||
Residential Core | $ | 22,596 | $ | (6,942 | ) | $ | (4,294 | ) | $ | 3,708 | $ | 15,068 | |||||||
Residential Home Today | 9,997 | (1,253 | ) | (2,761 | ) | 1,433 | 7,416 | ||||||||||||
Home equity loans and lines of credit | 38,926 | 255 | (7,846 | ) | 7,969 | 39,304 | |||||||||||||
Construction | 35 | (60 | ) | — | 32 | 7 | |||||||||||||
Total real estate loans | $ | 71,554 | $ | (8,000 | ) | $ | (14,901 | ) | $ | 13,142 | $ | 61,795 | |||||||
For the Year Ended September 30, 2015 | |||||||||||||||||||
Beginning Balance | Provisions | Charge-offs | Recoveries | Ending Balance | |||||||||||||||
Real estate loans: | |||||||||||||||||||
Residential Core | $ | 31,080 | $ | (6,987 | ) | $ | (6,866 | ) | $ | 5,369 | $ | 22,596 | |||||||
Residential Home Today | 16,424 | (4,508 | ) | (3,452 | ) | 1,533 | 9,997 | ||||||||||||
Home equity loans and lines of credit | 33,831 | 8,661 | (11,034 | ) | 7,468 | 38,926 | |||||||||||||
Construction | 27 | (166 | ) | — | 174 | 35 | |||||||||||||
Total real estate loans | $ | 81,362 | $ | (3,000 | ) | $ | (21,352 | ) | $ | 14,544 | $ | 71,554 | |||||||
6. MORTGAGE LOAN SERVICING RIGHTS
The Company sells certain types of loans through whole loan sales and through securitizations. In each case, the Company retains a servicing interest in the loans or securitized loans. Certain assumptions and estimates are used to determine the fair value allocated to these retained interests at the date of transfer and at subsequent measurement dates. These assumptions and estimates include loan repayment rates and discount rates.
Changes in interest rates can affect the average life of loans and mortgage-backed securities and the related servicing rights. A reduction in interest rates normally results in increased prepayments, as borrowers refinance their debt in order to reduce their borrowing costs. This creates reinvestment risk, which is the risk that the Company may not be able to reinvest the proceeds of loan and securities prepayments at rates that are comparable to the rates earned on the loans or securities prior to receipt of the repayment.
During 2017, 2016 and 2015, $249,426, $200,298 and $160,052, respectively, of mortgage loans were securitized and/or sold including accrued interest thereon. In these transactions, the Company retained residual interests in the form of mortgage loan servicing rights. Primary economic assumptions used to measure the value of the Company’s retained interests at the date of sale resulting from the completed transactions were as follows (per annum):
2017 | 2016 | ||||
Primary prepayment speed assumptions (weighted average annual rate) | 9.9 | % | 11.3 | % | |
Weighted average life (years) | 22.2 | 23.0 | |||
Amortized cost to service loans (weighted average) | 0.12 | % | 0.12 | % | |
Weighted average discount rate | 12 | % | 12 | % | |
Key economic assumptions and the sensitivity of the current fair value of mortgage loan servicing rights to immediate 10% and 20% adverse changes in those assumptions are as presented in the following table. The three key economic assumptions that impact the valuation of the mortgage loan servicing rights are: (1) the prepayment speed, or how long the mortgage servicing right will be outstanding; (2) the estimate of servicing costs that will be incurred in fulfilling the mortgage servicing right responsibilities; and (3) the discount factor applied to future net cash flows to convert them to present value. The Company established these factors based on independent analysis of our portfolio and reviews these assumptions periodically to ensure that they reasonably reflect current market conditions and our loan portfolio experience. Additionally, to confirm the appropriateness of the Company's mortgage loan servicing rights valuation, an independent third party is engaged at least annually, and more frequently if warranted by market volatility, to value our mortgage loan servicing rights portfolio. The results of the third party valuation are compared and reconciled to the Company's valuation, thereby validating the Company's approach and assumptions.
102
September 30, 2017 | |||
Fair value of mortgage loan servicing rights | $ | 16,102 | |
Prepayment speed assumptions (weighted average annual rate) | 18.0 | % | |
Impact on fair value of 10% adverse change | $ | (568 | ) |
Impact on fair value of 20% adverse change | $ | (1,085 | ) |
Estimated prospective annual cost to service loans (weighted average) | 0.12 | % | |
Impact on fair value of 10% adverse change | $ | (1,493 | ) |
Impact on fair value of 20% adverse change | $ | (2,987 | ) |
Discount rate | 12.0 | % | |
Impact on fair value of 10% adverse change | $ | (570 | ) |
Impact on fair value of 20% adverse change | $ | (1,096 | ) |
These sensitivities are hypothetical and should be used with caution. As indicated in the table above, changes in fair value based on a 10% variation in assumptions generally cannot be extrapolated because the relationship in the change in assumption to the change in fair value may not be linear. Also, the effect of a variation in a particular assumption on the fair value of the retained interest is calculated without changing any other assumption. In reality, changes in one factor may result in changes in another (for example, increases in market interest rates may result in lower prepayments), which could magnify or counteract the sensitivities.
Servicing rights are evaluated periodically for impairment based on the fair value of those rights. Twenty-one risk tranches are used in evaluating servicing rights for impairment, segregated primarily by interest rate stratum within original term to maturity categories with additional strata for less uniform account types.
Activity in mortgage servicing rights is summarized as follows:
Year Ended September 30, | |||||||||||
2017 | 2016 | 2015 | |||||||||
Balance—beginning of year | $ | 8,852 | $ | 9,988 | $ | 11,669 | |||||
Additions from loan securitizations/sales | 1,347 | 1,044 | 907 | ||||||||
Amortization | (1,824 | ) | (2,180 | ) | (2,588 | ) | |||||
Net change in valuation allowance | — | — | — | ||||||||
Balance—end of year | $ | 8,375 | $ | 8,852 | $ | 9,988 | |||||
Fair value of capitalized amounts | $ | 16,102 | $ | 16,428 | $ | 21,084 | |||||
The Company receives annual servicing fees ranging from 0.02% to 0.98% of the outstanding loan balances. Servicing income, net of amortization of capitalized servicing rights, included in Non-interest income, amounted to $4,257 in 2017, $4,696 in 2016 and $5,444 in 2015. The unpaid principal balance of mortgage loans serviced for others was approximately $1,849,653, $1,959,467 and $2,181,436 at September 30, 2017, 2016 and 2015, respectively. The ratio of capitalized servicing rights to the unpaid principal balance of mortgage loans serviced for others was 0.45%, 0.45%, and 0.46% at September 30, 2017, 2016 and 2015, respectively.
103
7. PREMISES, EQUIPMENT AND SOFTWARE, NET
Premises, equipment and software at cost are summarized as follows:
September 30, | |||||||
2017 | 2016 | ||||||
Land | $ | 12,183 | $ | 12,183 | |||
Office buildings | 76,003 | 73,235 | |||||
Furniture, fixtures and equipment | 33,313 | 32,513 | |||||
Software | 17,432 | 17,061 | |||||
Leasehold improvements | 15,224 | 13,820 | |||||
154,155 | 148,812 | ||||||
Less: accumulated depreciation and amortization | (93,280 | ) | (87,809 | ) | |||
Total | $ | 60,875 | $ | 61,003 | |||
During the years ended September 30, 2017, 2016 and 2015, depreciation and amortization expense on premises, equipment, and software was $5,633, $5,507 and $4,798, respectively.
The Company leases certain of its branches under renewable operating lease agreements. Future minimum payments under non-cancelable operating leases with initial or remaining terms of one year or more consisted of the following at September 30, 2017:
Years Ending September 30, | |||
2018 | $ | 6,697 | |
2019 | 6,138 | ||
2020 | 4,987 | ||
2021 | 3,989 | ||
2022 | 2,743 | ||
Thereafter | 6,264 | ||
During the years ended September 30, 2017, 2016 and 2015, rental expense was $6,929, $6,711 and $6,421, respectively, and appears in office property, equipment, and software in the accompanying statements.
The Company, as lessor, leases certain commercial office buildings. The Company anticipates receiving future minimum payments of the following as of September 30, 2017:
Years Ending September 30, | |||
2018 | $ | 2,154 | |
2019 | 1,991 | ||
2020 | 1,124 | ||
2021 | 1,072 | ||
2022 | 998 | ||
Thereafter | 824 | ||
During each of the years ended September 30, 2017, 2016 and 2015, rental income was $1,857, $1,556 and $1,414 respectively, and appears in other non-interest income in the accompanying statements.
104
8. ACCRUED INTEREST RECEIVABLE
Accrued interest receivable is summarized as follows:
September 30, | |||||||
2017 | 2016 | ||||||
Investment securities | $ | 1,270 | $ | 1,179 | |||
Loans | 34,209 | 31,639 | |||||
Total | $ | 35,479 | $ | 32,818 | |||
9. DEPOSITS
Deposit account balances are summarized by interest rate as follows:
Stated Interest Rate | September 30, | |||||||||||||||
2017 | 2016 | |||||||||||||||
Amount | Percent | Amount | Percent | |||||||||||||
Checking accounts | 0.00–0.10% | $ | 987,001 | 12.1 | % | $ | 995,372 | 12.0 | % | |||||||
Savings accounts | 0.00–0.15 | 1,473,415 | 18.1 | 1,514,428 | 18.2 | |||||||||||
Subtotal | 2,460,416 | 30.2 | 2,509,800 | 30.2 | ||||||||||||
Certificates of deposit | 0.00–0.99 | 877,684 | 10.8 | 1,164,802 | 14.0 | |||||||||||
1.00–1.99 | 4,348,918 | 53.3 | 4,214,976 | 50.6 | ||||||||||||
2.00–2.99 | 449,358 | 5.5 | 411,229 | 4.9 | ||||||||||||
3.00–3.99 | 8,648 | 0.1 | 9,487 | 0.1 | ||||||||||||
4.00 and above | 4,628 | 0.1 | 19,148 | 0.2 | ||||||||||||
5,689,236 | 69.8 | 5,819,642 | 69.8 | |||||||||||||
Subtotal | 8,149,652 | 100.0 | 8,329,442 | 100.0 | ||||||||||||
Accrued interest | 1,973 | — | 1,926 | — | ||||||||||||
Total deposits | $ | 8,151,625 | 100.0 | % | $ | 8,331,368 | 100.0 | % | ||||||||
At September 30, 2017 and 2016, the weighted average interest rate was 0.14% on savings accounts; 0.09% on checking accounts; 1.52% and 1.48% on certificates of deposit, respectively; and 1.10% and 1.07% on total deposits, respectively.
The aggregate amount of certificates of deposit in denominations of $100 or more totaled approximately $2,685,662 and $2,668,391 at September 30, 2017 and 2016, respectively. In accordance with the DFA, the maximum amount of deposit insurance is $250 per depositor.
Brokered certificates of deposit, which are used as a cost effective funding alternative, totaled $620,705 and $539,775 at September 30, 2017 and 2016, respectively. The FDIC places restrictions on banks with regard to issuing brokered deposits based on the bank's capital classification. A well-capitalized institution may accept brokered deposits without FDIC restrictions. An adequately capitalized institution must obtain a waiver from the FDIC in order to accept brokered deposits, while an undercapitalized institution is prohibited by the FDIC from accepting brokered deposits.
The scheduled maturity of certificates of deposit is as follows:
September 30, 2017 | ||||||
Amount | Percent | |||||
12 months or less | $ | 2,131,565 | 37.4 | % | ||
13 to 24 months | 1,490,041 | 26.2 | % | |||
25 to 36 months | 1,136,632 | 20.0 | % | |||
37 to 48 months | 491,055 | 8.6 | % | |||
49 to 60 months | 237,354 | 4.2 | % | |||
Over 60 months | 202,589 | 3.6 | % | |||
Total | $ | 5,689,236 | 100.0 | % | ||
105
Interest expense on deposits is summarized as follows:
Year Ended September 30, | |||||||
2017 | 2016 | ||||||
Certificates of deposit | $ | 84,410 | $ | 85,900 | |||
Checking accounts | 918 | 1,289 | |||||
Savings accounts | 2,093 | 2,811 | |||||
Total | $ | 87,421 | $ | 90,000 | |||
10. BORROWED FUNDS
Federal Home Loan Bank borrowings at September 30, 2017 are summarized in the table below. The amount and weighted average rates of certain FHLB Advances maturing in years 2018 through 2021 reflect the net impact of deferred penalties discussed below:
Amount | Weighted Average Rate | |||||
Maturing in: | ||||||
2018 | $ | 2,884,479 | 1.25 | % | ||
2019 | 414,478 | 1.79 | % | |||
2020 | 329,816 | 1.82 | % | |||
2021 | 1,290 | 1.54 | % | |||
thereafter | 37,548 | 1.56 | % | |||
Total FHLB Advances | 3,667,611 | 1.36 | % | |||
Accrued interest | 3,766 | |||||
Total | $ | 3,671,377 | ||||
Through the use of interest rate swaps discussed in Note 17. Derivative Instruments, $1,500,000 of FHLB advances included in the table above as maturing in 2018, have effective maturities, assuming no early terminations of the swap contracts, as shown below:
Effective Maturity: | Amount | Swap Adjusted Weighted Average Rate | ||||
2020 | $ | 50,000 | 1.23 | % | ||
2021 | 525,000 | 1.19 | % | |||
2022 | 900,000 | 1.90 | % | |||
2023 | 25,000 | 1.67 | % | |||
Total FHLB Advances under swap contracts | $ | 1,500,000 | 1.62 | % | ||
During fiscal year 2016, $150,000 fixed-rate FHLB advances with remaining terms of approximately four years were prepaid and replaced with new four- and five-year interest rate swap arrangements. The deferred repayment penalties of $2,408 related to the $150,000 of restructuring are being recognized in interest expense over the remaining term of the swap contracts.
106
The following table sets forth certain information relating to Federal Home Loan Bank short-term borrowings at or for the periods indicated.
At or For the Fiscal Years Ended September 30, | |||||||||||
2017 | 2016 | 2015 | |||||||||
(dollars in thousands) | |||||||||||
Balance at end of year | $ | 2,610,000 | $ | 1,451,000 | $ | 755,000 | |||||
Maximum outstanding at any month-end | $ | 2,610,000 | $ | 1,451,000 | $ | 1,535,000 | |||||
Average balance during year | $ | 1,976,281 | $ | 934,689 | $ | 1,242,380 | |||||
Average interest rate during the fiscal year | 0.89 | % | 0.42 | % | 0.15 | % | |||||
Weighted average interest rate at end of year | 1.22 | % | 0.47 | % | 0.18 | % | |||||
Interest expense | $ | 17,826 | $ | 3,984 | $ | 1,811 | |||||
The Association implemented a strategy in fiscal year 2015 to increase net income, which involved borrowing, on an overnight basis, approximately $1,000,000 of additional funds from the FHLB at the beginning of a particular quarter and repaying it prior to the end of that quarter. The proceeds of the borrowings, net of the required investment in FHLB stock, were deposited at the Federal Reserve. The strategy was not utilized at September 30, 2017, 2016 or 2015, however, dependent upon market rates, remains an option in the future.
The Association’s maximum borrowing capacity at the FHLB, under the most restrictive measure, was an additional $40,979 at September 30, 2017. Pursuant to collateral agreements with FHLB of Cincinnati, advances are secured by a blanket lien on qualifying first mortgage loans. In addition to the existing available capacity, the Association’s capacity limit for additional borrowings from the FHLB of Cincinnati was $4,867,936 at September 30, 2017, subject to satisfaction of the FHLB of Cincinnati common stock ownership requirement. To satisfy the common stock ownership requirement, the Association would have to increase its ownership of FHLB of Cincinnati common stock by an additional $97,359. The terms of the advances include various restrictive covenants including limitations on the acquisition of additional debt in excess of specified levels. As of September 30, 2017, the Association was in compliance with all such covenants. The Association’s borrowing capacity at the FRB-Cleveland Discount Window was $72,295 at September 30, 2017.
107
11. OTHER COMPREHENSIVE INCOME (LOSS)
The change in accumulated other comprehensive income (loss) by component is as follows:
Unrealized Gains (Losses) on Securities Available for Sale | Cash Flow Hedges | Defined Benefit Plan | Total | ||||||||||||
Fiscal year 2015 activity | |||||||||||||||
Balance at September 30, 2014 | $ | (1,092 | ) | $ | — | $ | (9,700 | ) | $ | (10,792 | ) | ||||
Other comprehensive income (loss) before reclassifications, net of tax benefit of $1,490 | 3,018 | — | (5,785 | ) | (2,767 | ) | |||||||||
Amounts reclassified from accumulated other comprehensive income (loss), net of tax expense of $265 | — | — | 494 | 494 | |||||||||||
Other comprehensive income (loss) | 3,018 | — | (5,291 | ) | (2,273 | ) | |||||||||
Balance at September 30, 2015 | $ | 1,926 | $ | — | $ | (14,991 | ) | $ | (13,065 | ) | |||||
Fiscal year 2016 activity | |||||||||||||||
Other comprehensive loss before reclassifications, net of tax benefit of $4,621 | (1,510 | ) | (2,389 | ) | (4,682 | ) | (8,581 | ) | |||||||
Amounts reclassified from accumulated other comprehensive loss, net of tax expense of $1,089 | — | 1,018 | 1,002 | 2,020 | |||||||||||
Other comprehensive loss | (1,510 | ) | (1,371 | ) | (3,680 | ) | (6,561 | ) | |||||||
Balance at September 30, 2016 | $ | 416 | $ | (1,371 | ) | $ | (18,671 | ) | $ | (19,626 | ) | ||||
Fiscal year 2017 activity | |||||||||||||||
Other comprehensive income (loss) before reclassifications, net of tax expense of $4,479 | (3,331 | ) | 9,186 | 2,463 | 8,318 | ||||||||||
Amounts reclassified from accumulated other comprehensive income (loss), net of tax expense of $2,055 | — | 2,434 | 1,382 | 3,816 | |||||||||||
Other comprehensive (loss) income | (3,331 | ) | 11,620 | 3,845 | 12,134 | ||||||||||
Balance at September 30, 2017 | $ | (2,915 | ) | $ | 10,249 | $ | (14,826 | ) | $ | (7,492 | ) | ||||
The following table presents the reclassification adjustment out of accumulated other comprehensive income (loss) included in net income and the corresponding line item on the consolidated statements of income for the periods indicated:
Details about Accumulated Other Comprehensive Income Components | For the Years Ended September 30, | Line Item in the Statement of Income | ||||||||||||
2017 | 2016 | 2015 | ||||||||||||
Cash flow hedges: | ||||||||||||||
Interest expense, effective portion | $ | 3,745 | $ | 1,567 | $ | — | Interest expense | |||||||
Income tax | (1,311 | ) | (549 | ) | — | Income tax expense | ||||||||
Net of income tax | $ | 2,434 | $ | 1,018 | $ | — | ||||||||
Amortization of pension plan: | ||||||||||||||
Actuarial loss | $ | 2,126 | $ | 1,542 | $ | 759 | (a) | |||||||
Income tax | (744 | ) | (540 | ) | (265 | ) | Income tax expense | |||||||
Net of income tax | 1,382 | 1,002 | 494 | |||||||||||
Total reclassifications for the period | $ | 3,816 | $ | 2,020 | $ | 494 | ||||||||
(a) These items are included in the computation of net period pension cost. See Note 13. Employee Benefit Plans for additional disclosure.
108
12. INCOME TAXES
The components of the income tax provision are as follows:
Year Ended September 30, | |||||||||||
2017 | 2016 | 2015 | |||||||||
Current tax expense: | |||||||||||
Federal | $ | 39,794 | $ | 29,833 | $ | 27,056 | |||||
State | 1,121 | 878 | 564 | ||||||||
Deferred tax expense (benefit): | |||||||||||
Federal | 3,634 | 11,045 | 9,605 | ||||||||
State | (85 | ) | 54 | (421 | ) | ||||||
Income tax provision | $ | 44,464 | $ | 41,810 | $ | 36,804 | |||||
Reconciliation from tax at the statutory rate to the income tax provision is as follows:
Year Ended September 30, | ||||||||
2017 | 2016 | 2015 | ||||||
Tax at statutory rate | 35.0 | % | 35.0 | % | 35.0 | % | ||
State tax, net | 0.5 | 0.5 | 0.1 | |||||
Non-taxable income from bank owned life insurance contracts | (1.7 | ) | (2.1 | ) | (2.4 | ) | ||
Other, net | (0.5 | ) | 0.8 | 0.9 | ||||
Income tax provision | 33.3 | % | 34.2 | % | 33.6 | % | ||
Temporary differences between the financial statement carrying amounts and tax basis of assets and liabilities that gave rise to significant portions of net deferred taxes relate to the following:
September 30, | |||||||
2017 | 2016 | ||||||
Deferred tax assets: | |||||||
Loan loss reserve | $ | 26,690 | $ | 30,240 | |||
Deferred compensation | 12,280 | 11,796 | |||||
Pension | 2,696 | 5,790 | |||||
Property, equipment and software basis difference | 2,180 | 1,759 | |||||
Other | 2,482 | 3,234 | |||||
Total deferred tax assets | 46,328 | 52,819 | |||||
Deferred tax liabilities: | |||||||
FHLB stock basis difference | 7,999 | 7,826 | |||||
Mortgage servicing rights | 1,583 | 1,322 | |||||
Goodwill | 3,473 | 3,434 | |||||
Deferred loan costs, net of fees | 15,288 | 11,131 | |||||
Other | 1,994 | 3,033 | |||||
Total deferred tax liabilities | 30,337 | 26,746 | |||||
Net deferred tax asset | $ | 15,991 | $ | 26,073 | |||
In the accompanying Consolidated Statements of Condition the net deferred tax asset is included in Other assets.
A valuation allowance is established to reduce deferred tax assets if it is more likely than not that the related tax benefits will not be realized. The ultimate realization of deferred tax assets is dependent upon the generation of future taxable income during the periods in which those temporary differences become deductible. There was no valuation allowance required at September 30, 2017 or 2016.
109
Retained earnings at September 30, 2017 and 2016 included approximately $104,861 for which no provision for federal or state income tax has been made. This amount represents allocations of income during years prior to 1988 to bad debt deductions for tax purposes only. These qualifying and nonqualifying base year reserves and supplemental reserves will be recaptured into income in the event of certain distributions and redemptions. Such recapture would create income for tax purposes only, which would be subject to the then current corporate income tax rate. However, recapture would not occur upon the reorganization, merger, or acquisition of the Association, nor if the Association is merged or liquidated tax-free into a bank or undergoes a charter change. If the Association fails to qualify as a bank or merges into a nonbank entity, these reserves will be recaptured into income.
The provisions of Accounting for Uncertainty in Income Taxes, codified within FASB ASC 740 “Income Taxes,” prescribe a recognition threshold and measurement attribute for the financial statement recognition and measurement for a tax position taken or expected to be taken in a tax return. FASB ASC 740 also provides guidance on derecognition, classification, interest and penalties, accounting in interim periods, disclosure and transition. Tax positions must meet a more-likely-than-not recognition threshold in order for the related tax benefit to be recognized or continue to be recognized. As of September 30, 2017, 2016 and 2015, the Company had no unrecognized tax benefits. The Company does not anticipate the total amount of unrecognized tax benefits to significantly change within the next 12 months.
The Company recognizes interest and penalties on income tax assessments or income tax refunds, where applicable, in the financial statements as a component of its provision for income taxes. The Company recognized no interest expense or penalties on income tax assessments during the years ended September 30, 2017, 2016 and 2015. Total interest accrued was $0 at September 30, 2017 and 2016.
The Company’s effective income tax rate was 33.3%, 34.2% and 33.6% for the years ending September 30, 2017, 2016 and 2015, respectively. The decrease in the effective rate for the year ended September 30, 2017 compared to the same periods during fiscal 2016 and 2015 is primarily due to how excess tax benefits on share-based payment awards are recognized pursuant to the adoption of ASU 2016-09. This change is described more fully in Note 21, Recent Accounting Pronouncements.
The Company and its subsidiaries file income tax returns in the U.S. federal jurisdiction and various state and city jurisdictions. With few exceptions, the Company is no longer subject to income tax examinations in its major jurisdictions for tax years prior to 2014.
The Company makes certain investments in limited partnerships which invest in affordable housing projects that qualify for the Low Income Housing Tax Credit. The Company acts as a limited partner in these investments and does not exert control
over the operating or financial policies of the partnership. The Company accounts for its interests in LIHTCs using the
proportional amortization method. The impact of the Company's investments in tax credit entities on the provision for income
taxes was not material at September 30, 2017, 2016 and 2015.
13. EMPLOYEE BENEFIT PLANS
Defined Benefit Plan—The Third Federal Savings Retirement Plan (the “Plan”) is a defined benefit pension plan. Effective December 31, 2002, the Plan was amended to limit participation to employees who met the Plan’s eligibility requirements on that date. Effective December 31, 2011, the Plan was amended to freeze future benefit accruals for participants in the Plan. After December 31, 2002, employees not participating in the Plan, upon meeting the applicable eligibility requirements, and those eligible participants who no longer receive service credits under the Plan, participate in a separate tier of the Company’s defined contribution 401(k) Savings Plan. Benefits under the Plan are based on years of service and the employee’s average annual compensation (as defined in the Plan) through December 31, 2011. The funding policy of the Plan is consistent with the funding requirements of U.S. federal and other governmental laws and regulations.
The following table sets forth the change in projected benefit obligation for the defined benefit plan:
September 30, | |||||||
2017 | 2016 | ||||||
Projected benefit obligation at beginning of year | $ | 84,218 | $ | 76,735 | |||
Interest cost | 3,068 | 3,288 | |||||
Actuarial loss and other | (955 | ) | 7,464 | ||||
Benefits paid | (4,113 | ) | (3,269 | ) | |||
Projected benefit obligation at end of year | $ | 82,218 | $ | 84,218 | |||
110
The following table reconciles the beginning and ending balances of the fair value of Plan assets and presents the funded status of the Plan recognized in the Consolidated Statements of Condition at the September 30 measurement dates:
September 30, | |||||||
2017 | 2016 | ||||||
Fair value of plan assets at beginning of the year | $ | 65,951 | $ | 60,849 | |||
Actual return on plan assets | 6,968 | 4,371 | |||||
Employer contributions | 4,000 | 4,000 | |||||
Benefits paid | (4,113 | ) | (3,269 | ) | |||
Fair value of plan assets at end of year | $ | 72,806 | $ | 65,951 | |||
Funded status of the plan—asset (liability) | $ | (9,412 | ) | $ | (18,267 | ) | |
The components of net periodic cost recognized in the Consolidated Statements of Income are as follows:
Year Ended September 30, | |||||||||||
2017 | 2016 | 2015 | |||||||||
Interest Cost | 3,068 | 3,288 | 3,130 | ||||||||
Expected return on plan assets | (4,134 | ) | (4,111 | ) | (4,414 | ) | |||||
Amortization of net loss and other | 2,126 | 1,542 | 759 | ||||||||
Net periodic benefit (income) cost | $ | 1,060 | $ | 719 | $ | (525 | ) | ||||
There were no required minimum employer contributions during the fiscal year ended September 30, 2017. The Company made a voluntary contribution of $4,000 during the current fiscal year.
Plan assets consist of investments in pooled separate accounts that invest in mutual funds, equity securities, debt securities, or real estate investments. Pooled separate accounts are valued at net asset value per share at the reporting date. The fair values of the underlying investments used to determine net asset value of the pooled separate accounts are primarily publicly quoted prices or quoted prices for similar assets in active or non-active markets. In accordance with Subtopic 820-10, certain investments measured at fair value using the net asset value per share practical expedient are not classified in the fair value hierarchy described in Note16. Fair Value.
111
The following table presents the fair value of Plan assets.
September 30, | |||||||||||||||||||
2017 | 2016 | ||||||||||||||||||
Fair Value (in thousands) | Unfunded Commitments | Redemption Frequency (if currently eligible) | Redemption Notice Period | Fair Value (in thousands) | Unfunded Commitments | Redemption Frequency (if currently eligible) | Redemption Notice Period | ||||||||||||
Pooled Separate Accounts | $ | 72,806 | N/A | Daily | 7 Days | $ | 65,951 | N/A | Daily | 7 Days | |||||||||
There are no redemption restrictions on Plan assets at September 30, 2017. Redemptions may be deferred for a longer period if conditions do not permit an orderly transfer or for certain investments of an illiquid nature.
The following additional information is provided with respect to the Plan:
September 30, | ||||||||
2017 | 2016 | 2015 | ||||||
Assumptions and dates used to determine benefit obligations: | ||||||||
Discount rate | 3.90 | % | 3.75 | % | 4.40 | % | ||
Rate of compensation increase | n/a | n/a | n/a | |||||
Assumptions used to determine net periodic benefit cost: | ||||||||
Discount rate | 3.75 | % | 4.40 | % | 4.40 | % | ||
Long-term rate of return on plan assets | 7.00 | % | 7.50 | % | 7.50 | % | ||
Rate of compensation increase (graded scale) | n/a | n/a | n/a | |||||
The expected long-term return on assets assumption has been derived based upon the average rates of earnings expected on the funds invested to provide for Plan benefits. Management evaluates the historical performance of the various asset categories, as well as current expectations in determining the adequacy of the assumed rates of return in meeting Plan obligations. If warranted, the assumption is modified.
The following table provides estimates of expected future benefit payments during each of the next five fiscal years, as well as in the aggregate for years six through ten. Additionally, the table includes the minimum employer contributions expected during the next fiscal year.
Expected Benefit Payments During the Fiscal Years Ending September 30: | |||
2018 | $ | 5,700 | |
2019 | 4,020 | ||
2020 | 4,370 | ||
2021 | 4,910 | ||
2022 | 3,990 | ||
Aggregate expected benefit payments during the five fiscal year period beginning October 1, 2023, and ending September 30, 2027 | 22,970 | ||
Minimum employer contributions expected to be paid during the fiscal year ending September 30, 2018 | — | ||
Effective September 30, 2006, the Company adopted the provisions of FASB ASC 715 “Compensation – Retirement Benefits” which requires an employer to recognize the funded status of its Plan in the statement of financial condition by a charge to AOCI. For the fiscal years ended September 30, 2017, 2016, and 2015, AOCI includes pretax net actuarial losses of $22,809, $28,725, and $23,063, respectively, which have not been recognized as components of net periodic benefit costs as of the measurement date (there was no transition obligation at any date).
The Company expects that $1,679 of net actuarial losses will be recognized as AOCI components of net periodic benefit cost during the fiscal year ended September 30, 2018.
401(k) Savings Plan—The Company maintains a 401(k) savings plan that is comprised of three tiers. The first tier allows eligible employees to contribute up to 75% of their compensation to the plan, subject to limitations established by the Internal Revenue Service, with the Company matching 100% of up to 4% on funds contributed. The second tier permits the Company to
112
make a profit-sharing contribution at its discretion. The first and second tiers cover substantially all employees who have reached age 21 and have worked 1,000 hours in one year of service. The third tier permits the Company to make discretionary contributions allocable to eligible employees including those eligible employees who are participants, but no longer receiving service credits, under the Company’s defined benefit pension plan. Voluntary contributions made by employees are vested at all times whereas Company contributions and Company matching contributions are subject to various vesting periods which range from immediately vested to fully vesting upon five years of service.
The total of the Company’s matching and discretionary contributions related to the 401(k) savings plan for the years ended September 30, 2017, 2016 and 2015 was $3,456, $3,412 and $3,204, respectively.
Employee (Associate) Stock Ownership Plan—The Company established an ESOP for its employees effective January 1, 2006. The ESOP is a tax-qualified plan designed to invest primarily in the Company’s common stock and provides employees with an opportunity to receive a funded retirement benefit, based primarily on the value of the Company’s common stock. The ESOP covers all eligible employees of the Company and its wholly-owned subsidiaries. Employees are eligible to participate in the ESOP after attainment of age 18, completion of 1,000 hours of service, and employment on the last day of the plan’s calendar year. Company contributions to the plan are at the discretion of the Board of Directors. The ESOP is accounted for in accordance with the provisions for stock compensation in FASB ASC 718. Compensation expense for the ESOP is based on the market price of the Company’s stock and is recognized as shares are committed to be released to participants. The total compensation expense related to this plan in the 2017, 2016 and 2015 fiscal years was $7,342, $7,714 and $6,617, respectively.
The ESOP was authorized to purchase, and did purchase, 11,605,824 shares of the Company’s common stock at a price of $10 per share with a 2006 plan year cash contribution and the proceeds of a loan from the Company to the ESOP. The outstanding loan principal balance as of September 30, 2017 and 2016 was $61,759 and $65,462, respectively. Shares of the Company’s common stock pledged as collateral for the loan are released from the pledge for allocation to participants as loan payments are made. At September 30, 2017, 5,972,408 shares have been allocated to participants and 325,005 shares were committed to be released. Shares that are committed to be released will be allocated to participants at the end of the plan year (December 31). ESOP shares that are unallocated or not yet committed to be released totaled 5,308,411 at September 30, 2017, and had a fair market value of $85,625. Participants have the option to receive dividends on allocated shares in cash or leave the dividend in the ESOP. Dividends are reinvested in Company stock for those participants who choose to leave their dividends in the ESOP or who do not make an election. The purchase of Company stock for reinvestment of dividends is made in the open market on or about the date of the cash disbursement to the participants who opt to take dividends in cash. Dividends on unallocated shares held in the Employer Stock fund were paid to the trustee to be used to make payments on the outstanding loan obligation.
14. EQUITY INCENTIVE PLAN
At a special meeting of shareholders held on May 29, 2008, shareholders of the Company approved the TFS Financial Corporation 2008 Equity Incentive Plan (the "Equity Plan”). The Company adopted the provisions related to share-based compensation in FASB ASC 718 and FASB ASC 505, upon approval of the Equity Plan, and began to expense the fair value of all share-based compensation granted over the requisite service periods.
During the year ended September 30, 2017, the Compensation Committee of the Company’s Board of Directors approved the issuance of an additional 300,400 stock options and 72,900 restricted stock units to certain directors, officers and employees of the Company. The awards were made pursuant to the Equity Plan.
Amendments to FASB ASC 718 requires the Company to report the benefits of realized tax deductions in excess of the deferred tax benefits previously recognized for compensation expense as an operating cash flow. Prior to the year ended September 30, 2017, excess tax benefits were reported as a financing cash flow. The Company recorded an excess tax benefit of $1,058, $3,198, and $1,582 for 2017, 2016 and 2015, respectively.
The stock options have a contractual term of 10 years and vest over a one to seven year service period. The Company recognizes compensation expense for the fair values of these awards, which have installment vesting, on a straight-line basis over the requisite service period of the awards.
Restricted stock units vest over a one to ten year service period. The product of the number of units granted and the grant date market price of the Company’s common stock determines the fair value of restricted stock units under the Equity Plan. The Company recognizes compensation expense for the fair value of restricted stock units on a straight-line basis over the requisite service period.
113
During the years ended September 30, 2017, 2016 and 2015, the Company recorded $3,893, $5,723 and $7,363, respectively, of share-based compensation expense, comprised of stock option expense of $1,502, $2,473 and $3,391, respectively and restricted stock units expense of $2,391, $3,250 and $3,972, respectively. The tax benefit recognized in net income related to share-based compensation expense was $1,195, $1,776 and $2,505, respectively.
The following is a summary of the status of the Company’s restricted stock units as of September 30, 2017 and changes therein during the year then ended:
Number of Shares Awarded | Weighted Average Grant Date Fair Value | |||||
Outstanding at September 30, 2016 | 1,184,357 | $ | 13.00 | |||
Granted | 72,900 | $ | 19.26 | |||
Exercised | (82,489 | ) | $ | 15.66 | ||
Forfeited | (5,700 | ) | $ | 17.01 | ||
Outstanding at September 30, 2017 | 1,169,068 | $ | 13.18 | |||
Vested and exercisable, at September 30, 2017 | 611,883 | $ | 12.23 | |||
Vested and expected to vest, at September 30, 2017 | 1,169,068 | $ | 13.18 | |||
The weighted average grant date fair value of restricted stock units granted during the years ended September 30, 2017, 2016 and 2015 was $19.26, $19.06 and $14.98 per share, respectively. The total fair value of restricted stock units vested during the years ended September 30, 2017, 2016 and 2015 was $2,655, $2,519, and $5,042, respectively. Expected future compensation expense relating to the non-vested restricted stock units at September 30, 2017 is $1,364 over a weighted average period of 1.77 years.
The following is a summary of the Company’s stock option activity and related information for the Equity Plan for the year ended September 30, 2017:
Number of Stock Options | Weighted Average Exercise Price | Weighted Average Remaining Contractual Life (years) | Aggregate Intrinsic Value | |||||||||
Outstanding at September 30, 2016 | 4,961,757 | $ | 12.62 | 5.76 | $ | 26,216 | ||||||
Granted | 300,400 | $ | 19.28 | |||||||||
Exercised | (738,925 | ) | $ | 11.41 | $ | 5,027 | ||||||
Forfeited | (6,800 | ) | $ | 15.45 | $ | 13 | ||||||
Outstanding at September 30, 2017 | 4,516,432 | $ | 13.26 | 5.54 | $ | 15,057 | ||||||
Vested and exercisable, at September 30, 2017 | 3,113,511 | $ | 11.74 | 4.48 | $ | 14,064 | ||||||
Vested or expected to vest, at September 30, 2017 | 4,516,432 | $ | 13.26 | 5.54 | $ | 15,057 | ||||||
The fair value of the option grants was estimated on the date of grant using the Black-Scholes option-pricing model with the following weighted average assumptions.
2017 | 2016 | ||||
Expected dividend yield | 2.59 | % | 2.10 | % | |
Expected volatility | 21.97 | % | 22.03 | % | |
Risk-free interest rate | 1.86 | % | 1.86 | % | |
Expected option term (in years) | 6.00 | 6.00 | |||
The expected dividend yield for 2017 was estimated on the then current annualized dividend payout of $0.50 per share which was not expected to change. The expected dividend yield for 2016 was estimated based on the then current annualized dividend payout of $0.40 per share which was not expected to change. Volatility of the company’s stock was used in the estimation of fair value. Management estimated the expected life of the options using the simplified method allowed under SEC Staff Accounting Bulletin 110, which expresses the views of the SEC regarding the use of a “simplified” method, as discussed in Staff Accounting Bulletin No. 107. The five and seven year Treasury yield in effect at the time of the grant provides the risk-free rate of return for periods within the expected term of the options.
114
The weighted average grant date fair value of options granted during the years ended September 30, 2017, 2016 and 2015 was $3.22, $3.48, and $3.08 per share, respectively. Expected future compensation expense relating to the non-vested options outstanding as of September 30, 2017 is $1,587 over a weighted average period of 2.09 years. Upon exercise of vested options, management expects to draw on treasury stock as the source of the shares. At September 30, 2017, the number of common shares authorized for award under the Equity Plan was 23,000,000, of which 11,011,124 shares remain available for future award.
15. COMMITMENTS AND CONTINGENT LIABILITIES
In the normal course of business, the Company enters into commitments with off-balance-sheet risk to meet the financing needs of its customers. Commitments to extend credit are agreements to lend to a customer as long as there is no violation of any condition established in the contract. Commitments to originate loans generally have fixed expiration dates of 60 to 360 days or other termination clauses and may require payment of a fee. Unfunded commitments related to home equity lines of credit generally expire from 5 to 10 years following the date that the line of credit was established, subject to various conditions including compliance with payment obligation, adequacy of collateral securing the line and maintenance of a satisfactory credit profile by the borrower. Since some of the commitments may expire without being drawn upon, the total commitment amounts do not necessarily represent future cash requirements.
Off-balance sheet commitments to extend credit involve elements of credit risk and interest rate risk in excess of the amount recognized in the consolidated statements of condition. The Company’s exposure to credit loss in the event of nonperformance by the other party to the commitment is represented by the contractual amount of the commitment. The Company generally uses the same credit policies in making commitments as it does for on-balance-sheet instruments. Interest rate risk on commitments to extend credit results from the possibility that interest rates may have moved unfavorably from the position of the Company since the time the commitment was made.
At September 30, 2017, the Company had commitments to originate loans as follows:
Fixed-rate mortgage loans | $ | 211,351 | |
Adjustable-rate mortgage loans | 214,065 | ||
Equity loans and lines of credit including bridge loans | 123,492 | ||
Total | $ | 548,908 | |
At September 30, 2017, the Company had unfunded commitments outstanding as follows:
Equity lines of credit | $ | 1,425,440 | |
Construction loans | 34,100 | ||
Limited partner investments | 11,541 | ||
Total | $ | 1,471,081 | |
At September 30, 2017, the unfunded commitment on home equity lines of credit, including commitments for accounts suspended as a result of material default or a decline in equity, is $1,501,591.
The above commitments are expected to be funded through normal operations.
The Company and its subsidiaries are subject to various legal actions arising in the normal course of business. In the opinion of management, the resolution of these legal actions is not expected to have a material adverse effect on the Company’s consolidated financial condition, results of operation, or statements of cash flows.
115
16. FAIR VALUE
Under U.S. GAAP, fair value is defined as the price that would be received to sell an asset, or paid to transfer a liability, in an orderly transaction between market participants at the measurement date under current market conditions and a fair value framework is established whereby assets and liabilities measured at fair value are grouped into three levels of a fair value hierarchy, based on the transparency of inputs and the reliability of assumptions used to estimate fair value. The Company’s policy is to recognize transfers between levels of the hierarchy as of the end of the reporting period in which the transfer occurs. The three levels of inputs are defined as follows:
Level 1 – | quoted prices (unadjusted) for identical assets or liabilities in active markets. | |
Level 2 – | quoted prices for similar assets or liabilities in active markets, quoted prices for identical or similar assets or liabilities in markets with few transactions, or model-based valuation techniques using assumptions that are observable in the market. | |
Level 3 – | a company’s own assumptions about how market participants would price an asset or liability. | |
As permitted under the fair value guidance in U.S. GAAP, the Company elects to measure at fair value, mortgage loans classified as held for sale that are subject to pending agency contracts to securitize and sell loans. This election is expected to reduce volatility in earnings related to market fluctuations between the contract trade and settlement dates. At September 30, 2017 and 2016, respectively, there were no loans held for sale, subject to pending agency contracts for which the fair value option was elected. For the years ended September 30, 2017, 2016 and 2015, net gain (loss) on the sale of loans includes $0, $0 and $(111), respectively, related to changes during the period in the fair value of loans held for sale subject to pending agency contracts.
Presented below is a discussion of the methods and significant assumptions used by the Company to estimate fair value.
Investment Securities Available for Sale—Investment securities available for sale are recorded at fair value on a recurring basis. At September 30, 2017 and 2016, respectively, this includes $537,479 and $517,866 of investments in highly liquid collateralized mortgage obligations issued by Fannie Mae, Freddie Mac, and Ginnie Mae. Values at both dates are measured using the market approach. The fair values of collateralized mortgage obligations represent unadjusted price estimates obtained from third party independent nationally recognized pricing services using pricing models or quoted prices of securities with similar characteristics and are included in Level 2 of the hierarchy. Third party pricing is reviewed on a monthly basis for reasonableness based on the market knowledge and experience of company personnel that interact daily with the markets for these types of securities.
Mortgage Loans Held for Sale—The fair value of mortgage loans held for sale is estimated on an aggregate basis using a market approach based on quoted secondary market pricing for loan portfolios with similar characteristics. Loans held for sale are carried at the lower of cost or fair value except, as described above, the Company elects the fair value measurement option for mortgage loans held for sale subject to pending agency contracts to securitize and sell loans. Loans held for sale are included in Level 2 of the hierarchy. At September 30, 2017 and 2016, respectively, there were $351 and $4,686 of loans held for sale carried at cost.
Impaired Loans—Impaired loans represent certain loans held for investment that are subject to a fair value measurement under U.S. GAAP because they are individually evaluated for impairment and that impairment is measured using a fair value measurement, such as the fair value of the underlying collateral. Impairment is measured using a market approach based on the fair value of the collateral less estimated costs to dispose for loans the Company considers to be collateral-dependent due to a delinquency status or other adverse condition severe enough to indicate that the borrower can no longer be relied upon as the continued source of repayment. These conditions are described more fully in Note 5. Loans and Allowance for Loan Losses. To calculate impairment of collateral-dependent loans, the fair market values of the collateral, estimated using exterior appraisals in the majority of instances, are reduced by calculated costs to dispose, derived from historical experience and recent market conditions. Any indicated impairment is recognized by a charge to the allowance for loan losses. Subsequent increases in collateral values or principal pay downs on loans with recognized impairment could result in an impaired loan being carried below its fair value. When no impairment loss is indicated, the carrying amount is considered to approximate the fair value of that loan to the Company because contractually that is the maximum recovery the Company can expect. The recorded investment of loans individually evaluated for impairment based on the fair value of the collateral are included in Level 3 of the hierarchy with assets measured at fair value on a non-recurring basis. The range and weighted average impact of costs to dispose on fair values is determined at the time of impairment or when additional impairment is recognized and is included in quantitative information about significant unobservable inputs later in this note.
Loans held for investment that have been restructured in TDRs and are performing according to the restructured terms of the loan agreement are individually evaluated for impairment using the present value of future cash flows based on the loan’s
116
effective interest rate, which is not a fair value measurement. At September 30, 2017 and 2016, respectively, this included $95,480 and $102,079 in recorded investment of TDRs with related allowances for loss of $11,061 and $12,432.
Real Estate Owned—Real estate owned includes real estate acquired as a result of foreclosure or by deed in lieu of foreclosure and is carried at the lower of the cost basis or fair value less estimated costs to dispose. Fair value is estimated under the market approach using independent third party appraisals. As these properties are actively marketed, estimated fair values may be adjusted by management to reflect current economic and market conditions. At September 30, 2017 and 2016, these adjustments were not significant to reported fair values. At September 30, 2017 and 2016, respectively, $3,479 and $4,192 of real estate owned is included in Level 3 of the hierarchy with assets measured at fair value on a non-recurring basis where the cost basis equals or exceeds the estimate of fair values less costs to dispose of these properties. Real estate owned, as reported in the Consolidated Statements of Condition, includes estimated costs to dispose of $401 and $521 related to properties measured at fair value and $2,443 and $3,132 of properties carried at their original or adjusted cost basis at September 30, 2017 and 2016, respectively.
Derivatives—Derivative instruments include interest rate locks on commitments to originate loans for the held for sale portfolio, forward commitments on contracts to deliver mortgage loans, and interest rate swaps designated as cash flow hedges. Derivatives not designated as cash flow hedges are reported at fair value in other assets or other liabilities on the Consolidated Statement of Condition with changes in value recorded in current earnings. Derivatives qualifying as cash flow hedges, when highly effective, are reported at fair value in other assets or other liabilities on the Consolidated Statement of Condition with changes in value recorded in OCI. Should the hedge no longer be considered effective, the ineffective portion of the change in fair value is recorded directly in earnings in the period in which the change occurs. See Note 17. Derivative Instruments for additional details. Fair value of forward commitments is estimated using a market approach based on quoted secondary market pricing for loan portfolios with characteristics similar to loans underlying the derivative contracts. The fair value of interest rate swaps is estimated using a discounted cash flow method that incorporates current market interest rates and other market parameters. The fair value of of interest rate lock commitments is adjusted by a closure rate based on the estimated percentage of commitments that will result in closed loans. The range and weighted average impact of the closure rate is included in quantitative information about significant unobservable inputs later in this note. A significant change in the closure rate may result in a significant change in the ending fair value measurement of these derivatives relative to their total fair value. Because the closure rate is a significantly unobservable assumption, interest rate lock commitments are included in Level 3 of the hierarchy. Forward commitments on contracts to deliver mortgage loans and interest rate swaps are included in Level 2 of the hierarchy.
Assets and liabilities carried at fair value on a recurring basis in the Consolidated Statements of Condition at September 30, 2017 and 2016 are summarized below.
Recurring Fair Value Measurements at Reporting Date Using | |||||||||||||||
September 30, 2017 | Quoted Prices in Active Markets for Identical Assets (Level 1) | Significant Other Observable Inputs (Level 2) | Significant Unobservable Inputs (Level 3) | ||||||||||||
Assets | |||||||||||||||
Investment securities available for sale: | |||||||||||||||
REMIC’s | $ | 528,536 | $ | — | $ | 528,536 | $ | — | |||||||
Fannie Mae certificates | 8,943 | — | 8,943 | — | |||||||||||
Derivatives: | |||||||||||||||
Interest rate lock commitments | 58 | — | — | 58 | |||||||||||
Interest rate swaps | 17,001 | — | 17,001 | — | |||||||||||
Total | $ | 554,538 | $ | — | $ | 554,480 | $ | 58 | |||||||
Liabilities | |||||||||||||||
Derivatives: | |||||||||||||||
Interest rate swaps | 1,233 | — | 1,233 | — | |||||||||||
Total | $ | 1,233 | $ | — | $ | 1,233 | $ | — | |||||||
117
Recurring Fair Value Measurements at Reporting Date Using | |||||||||||||||
September 30, 2016 | Quoted Prices in Active Markets for Identical Assets (Level 1) | Significant Other Observable Inputs (Level 2) | Significant Unobservable Inputs (Level 3) | ||||||||||||
Assets | |||||||||||||||
Investment securities available for sale: | |||||||||||||||
REMIC’s | 507,997 | — | 507,997 | — | |||||||||||
Fannie Mae certificates | 9,869 | — | 9,869 | — | |||||||||||
Derivatives: | |||||||||||||||
Interest rate lock commitments | 99 | — | — | 99 | |||||||||||
Interest rate swaps | 772 | — | 772 | — | |||||||||||
Total | $ | 518,737 | $ | — | $ | 518,638 | $ | 99 | |||||||
Liabilities | |||||||||||||||
Derivatives: | |||||||||||||||
Interest rate swaps | 2,880 | — | 2,880 | — | |||||||||||
Total | $ | 2,880 | $ | — | $ | 2,880 | $ | — | |||||||
The table below presents a reconciliation of the beginning and ending balances and the location within the Consolidated Statements of Income where gains (losses) due to changes in fair value are recognized on interest rate lock commitments which are measured at fair value on a recurring basis using significant unobservable inputs (Level 3).
Interest Rate Lock Commitments | |||||||||||
Year Ended September 30, | |||||||||||
2017 | 2016 | 2015 | |||||||||
Beginning balance | $ | 99 | $ | 79 | $ | 59 | |||||
Gain (loss) during the period due to changes in fair value: | |||||||||||
Included in other non-interest income | (41 | ) | 20 | 20 | |||||||
Ending balance | $ | 58 | $ | 99 | $ | 79 | |||||
Change in unrealized gains for the period included in earnings for assets held at end of the reporting date | $ | 58 | $ | 99 | $ | 79 | |||||
Summarized in the tables below are those assets measured at fair value on a nonrecurring basis.
Nonrecurring Fair Value Measurements at Reporting Date Using | |||||||||||||||
September 30, 2017 | Quoted Prices in Active Markets for Identical Assets (Level 1) | Significant Other Observable Inputs (Level 2) | Significant Unobservable Inputs (Level 3) | ||||||||||||
Impaired loans, net of allowance | $ | 85,080 | $ | — | $ | — | $ | 85,080 | |||||||
Real estate owned(1) | 3,479 | — | — | 3,479 | |||||||||||
Total | $ | 88,559 | $ | — | $ | — | $ | 88,559 | |||||||
______________________
(1) Amounts represent fair value measurements of properties before deducting estimated costs to dispose.
Nonrecurring Fair Value Measurements at Reporting Date Using | |||||||||||||||
September 30, 2016 | Quoted Prices in Active Markets for Identical Assets (Level 1) | Significant Other Observable Inputs (Level 2) | Significant Unobservable Inputs (Level 3) | ||||||||||||
Impaired loans, net of allowance | $ | 92,576 | $ | — | $ | — | $ | 92,576 | |||||||
Real estate owned(1) | 4,192 | — | — | 4,192 | |||||||||||
Total | $ | 96,768 | $ | — | $ | — | $ | 96,768 | |||||||
______________________
118
(1) Amounts represent fair value measurements of properties before deducting estimated costs to dispose.
The following provides quantitative information about significant unobservable inputs categorized within Level 3 of the Fair Value Hierarchy.
Fair Value | Weighted | |||||||||||
9/30/2017 | Valuation Technique(s) | Unobservable Input | Range | Average | ||||||||
Impaired loans, net of allowance | $85,080 | Market comparables of collateral discounted to estimated net proceeds | Discount appraised value to estimated net proceeds based on historical experience: | |||||||||
• Residential Properties | 0 | - | 28% | 7.6% | ||||||||
Interest rate lock commitments | $58 | Quoted Secondary Market pricing | Closure rate | 0 | - | 100% | 93.0% | |||||
Fair Value | Weighted | |||||||||||
9/30/2016 | Valuation Technique(s) | Unobservable Input | Range | Average | ||||||||
Impaired loans, net of allowance | $92,576 | Market comparables of collateral discounted to estimated net proceeds | Discount appraised value to estimated net proceeds based on historical experience: | |||||||||
• Residential Properties | 0 | - | 26% | 8.2% | ||||||||
Interest rate lock commitments | $99 | Quoted Secondary Market pricing | Closure rate | 0 | - | 100% | 93.0% | |||||
The following table presents the carrying amount and estimated fair value of the Company’s financial instruments.
September 30, 2017 | |||||||||||||||||||
Carrying | Estimated Fair Value | ||||||||||||||||||
Amount | Total | Level 1 | Level 2 | Level 3 | |||||||||||||||
Assets: | |||||||||||||||||||
Cash and due from banks | $ | 35,243 | $ | 35,243 | $ | 35,243 | $ | — | $ | — | |||||||||
Interest earning cash equivalents | 232,975 | 232,975 | 232,975 | — | — | ||||||||||||||
Investment securities available for sale | 537,479 | 537,479 | — | 537,479 | — | ||||||||||||||
Mortgage loans held for sale | 351 | 355 | — | 355 | — | ||||||||||||||
Loans-net: | |||||||||||||||||||
Mortgage loans held for investment | 12,416,256 | 12,758,951 | — | — | 12,758,951 | ||||||||||||||
Other loans | 3,050 | 3,143 | — | — | 3,143 | ||||||||||||||
Federal Home Loan Bank stock | 89,990 | 89,990 | N/A | — | — | ||||||||||||||
Accrued interest receivable | 35,479 | 35,479 | — | 35,479 | — | ||||||||||||||
Cash collateral held by counterparty | 2,955 | 2,955 | 2,955 | — | — | ||||||||||||||
Derivatives | 17,059 | 17,059 | — | 17,001 | 58 | ||||||||||||||
Liabilities: | |||||||||||||||||||
Checking and passbook accounts | $ | 2,460,416 | $ | 2,460,416 | $ | — | $ | 2,460,416 | $ | — | |||||||||
Certificates of deposit | 5,691,209 | 5,550,162 | — | 5,550,162 | — | ||||||||||||||
Borrowed funds | 3,671,377 | 3,677,256 | — | 3,677,256 | — | ||||||||||||||
Borrowers’ advances for taxes and insurance | 100,446 | 100,446 | — | 100,446 | — | ||||||||||||||
Principal, interest and escrow owed on loans serviced | 35,766 | 35,766 | — | 35,766 | — | ||||||||||||||
Derivatives | 1,233 | 1,233 | — | 1,233 | — | ||||||||||||||
119
September 30, 2016 | |||||||||||||||||||
Carrying | Estimated Fair Value | ||||||||||||||||||
Amount | Total | Level 1 | Level 2 | Level 3 | |||||||||||||||
Assets: | |||||||||||||||||||
Cash and due from banks | $ | 27,914 | $ | 27,914 | $ | 27,914 | $ | — | $ | — | |||||||||
Interest earning cash equivalents | 203,325 | 203,325 | 203,325 | — | — | ||||||||||||||
Investment securities available for sale | 517,866 | 517,866 | — | 517,866 | — | ||||||||||||||
Mortgage loans held for sale | 4,686 | 4,839 | — | 4,839 | — | ||||||||||||||
Loans-net: | |||||||||||||||||||
Mortgage loans held for investment | 11,705,688 | 12,177,536 | — | — | 12,177,536 | ||||||||||||||
Other loans | 3,116 | 3,277 | — | — | 3,277 | ||||||||||||||
Federal Home Loan Bank stock | 69,853 | 69,853 | N/A | — | — | ||||||||||||||
Accrued interest receivable | 32,818 | 32,818 | — | 32,818 | — | ||||||||||||||
Cash collateral held by counterparty | 10,480 | 10,480 | 10,480 | — | — | ||||||||||||||
Derivatives | 871 | 871 | — | 772 | 99 | ||||||||||||||
Liabilities: | |||||||||||||||||||
Checking and passbook accounts | $ | 2,509,800 | $ | 2,509,800 | $ | — | $ | 2,509,800 | $ | — | |||||||||
Certificates of deposit | 5,821,568 | 5,832,958 | — | 5,832,958 | — | ||||||||||||||
Borrowed funds | 2,718,795 | 2,740,565 | — | 2,740,565 | — | ||||||||||||||
Borrowers’ advances for taxes and insurance | 92,313 | 92,313 | — | 92,313 | — | ||||||||||||||
Principal, interest and escrow owed on loans serviced | 49,401 | 49,401 | — | 49,401 | — | ||||||||||||||
Derivatives | 2,880 | 2,880 | — | 2,880 | — | ||||||||||||||
Presented below is a discussion of the valuation techniques and inputs used by the Company to estimate fair value.
Cash and Due from Banks, Interest Earning Cash Equivalents, Cash Collateral Received from or Held by Counterparty—The carrying amount is a reasonable estimate of fair value.
Investment and Mortgage-Backed Securities—Estimated fair value for investment and mortgage-backed securities is based on quoted market prices, when available. If quoted prices are not available, management will use as part of their estimation process fair values which are obtained from third party independent nationally recognized pricing services using pricing models, quoted prices of securities with similar characteristics, or discounted cash flows.
Mortgage Loans Held for Sale—Fair value of mortgage loans held for sale is based on quoted secondary market pricing for loan portfolios with similar characteristics.
Loans—For mortgage loans held for investment and other loans, fair value is estimated by discounting contractual cash flows adjusted for prepayment estimates using the current rates at which similar loans would be made to borrowers with similar credit ratings and for the same remaining term. The use of current rates to discount cash flows reflects current market expectations with respect to credit exposure. Impaired loans are measured at the lower of cost or fair value as described earlier in this footnote.
Federal Home Loan Bank Stock—It is not practical to estimate the fair value of FHLB stock due to restrictions on its transferability. The fair value is estimated to be the carrying value, which is par. All transactions in capital stock of the FHLB Cincinnati are executed at par.
Deposits—The fair value of demand deposit accounts is the amount payable on demand at the reporting date. The fair value of fixed-maturity certificates of deposit is estimated using discounted cash flows and rates currently offered for deposits of similar remaining maturities.
Borrowed Funds—Estimated fair value for borrowed funds is estimated using discounted cash flows and rates currently charged for borrowings of similar remaining maturities.
120
Accrued Interest Receivable, Borrowers’ Advances for Insurance and Taxes, and Principal, Interest and Related Escrow Owed on Loans Serviced—The carrying amount is a reasonable estimate of fair value.
Derivatives—Fair value is estimated based on the valuation techniques and inputs described earlier in this footnote.
17. DERIVATIVE INSTRUMENTS
The Company enters into interest rate swaps to add stability to interest expense and manage exposure to interest rate movements as part of an overall risk management strategy. For hedges of the Company's borrowing program, interest rate swaps designated as cash flow hedges involve the receipt of variable amounts from a counterparty in exchange for the Company making fixed payments. These derivatives are used to hedge the forecasted cash outflows associated with the Company's FHLB borrowings.
Cash flow hedges are assessed for effectiveness using regression analysis. The effective portion of changes in the fair value of derivatives designated and that qualify as cash flow hedges is recorded in OCI and is subsequently reclassified into earnings in the period that the hedged forecasted transaction affects earnings. Ineffectiveness is generally measured as the amount by which the cumulative change in the fair value of the hedging instrument exceeds or is substantially less than the present value of the cumulative change in the hedged item's expected cash flows attributable to the risk being hedged. The ineffective portion of the change in fair value of the derivatives is recognized directly in earnings for the period in which it occurs.
The following table presents additional information about the interest rate swaps used in the Company's asset liability management strategy.
Cash Flow Hedges | ||||||||
September 30, 2017 | September 30, 2016 | |||||||
Notional value | $ | 1,500,000 | $ | 600,000 | ||||
Fair value | 15,768 | (2,108 | ) | |||||
Weighted-average rate receive | 1.32 | % | 0.79 | % | ||||
Weighted-average rate pay | 1.62 | % | 1.21 | % | ||||
Average maturity (in years) | 4.1 | 4.5 | ||||||
Amounts reported in AOCI related to derivatives are reclassified to interest expense during the same period in which the hedged transaction affects earnings. During the next twelve months, the Company estimates that $665 of the amounts reported in AOCI will be reclassified to interest expense.
The Company enters into forward commitments for the sale of mortgage loans principally to protect against the risk of adverse interest rate movements on net income. The Company recognizes the fair value of such contracts when the characteristics of those contracts meet the definition of a derivative. These derivatives are not designated in a hedging relationship; therefore, gains and losses are recognized immediately in the statement of income. There were no forward commitments for the sale of mortgage loans at September 30, 2017 or September 30, 2016.
In addition, the Company is party to derivative instruments when it enters into commitments to originate a portion of its loans, which when funded, are classified as held for sale. Such commitments are not designated in a hedging relationship; therefore, gains and losses are recognized immediately in the statement of income.
121
The following tables provide the locations within the Consolidated Statements of Condition and the fair values for derivative instruments.
Asset Derivatives | |||||||||||
At September 30, 2017 | At September 30, 2016 | ||||||||||
Location | Fair Value | Location | Fair Value | ||||||||
Derivatives designated as hedging instruments | |||||||||||
Cash flow hedges: | |||||||||||
Interest rate swaps | Other Assets | $ | 17,001 | Other Assets | $ | 772 | |||||
Derivatives not designated as hedging instruments | |||||||||||
Interest rate lock commitments | Other Assets | $ | 58 | Other Assets | $ | 99 | |||||
Liability Derivatives | |||||||||||
At September 30, 2017 | At September 30, 2016 | ||||||||||
Location | Fair Value | Location | Fair Value | ||||||||
Derivatives designated as hedging instruments | |||||||||||
Cash flow hedges: | |||||||||||
Interest rate swaps | Other Liabilities | $ | 1,233 | Other Liabilities | $ | 2,880 | |||||
The following tables present the net gains and losses recorded within the Consolidated Statements of Income and the Consolidated Statements of Comprehensive Income relating to derivative instruments.
Location of Gain or (Loss) Recognized in Income | Amount of Gain or (Loss) Recognized in Income on Derivative | ||||||||||||
Year Ended September 30, | |||||||||||||
2017 | 2016 | 2015 | |||||||||||
Cash flow hedges | |||||||||||||
Amount of loss recognized, effective portion | Other comprehensive income | $ | 14,131 | $ | (3,676 | ) | $ | — | |||||
Amount of loss reclassified from AOCI | Interest expense | (3,745 | ) | (1,567 | ) | — | |||||||
Amount of ineffectiveness recognized | Other non-interest income | — | — | — | |||||||||
Derivatives not designated as hedging instruments | |||||||||||||
Interest rate lock commitments | Other non-interest income | $ | (41 | ) | $ | 20 | $ | 20 | |||||
Forward commitments for the sale of mortgage loans | Net gain on the sale of loans | — | — | 14 | |||||||||
Total | $ | (41 | ) | $ | 20 | $ | 34 | ||||||
Derivatives contain an element of credit risk which arises from the possibility that the Company will incur a loss because a counterparty fails to meet its contractual obligations. The Company's exposure is limited to the replacement value of the contracts rather than the notional or principal amounts. Credit risk is minimized through counterparty collateral, transaction limits and monitoring procedures. Swap transactions that are handled by a registered clearing broker are cleared through the broker to a registered clearing organization. The clearing organization establishes daily cash and upfront cash or securities margin requirements to cover potential exposure in the event of default. This process shifts the risk away from the counterparty, since the clearing organization acts as the middleman on each cleared transaction. The fair values of derivative instruments are presented on a gross basis, even when the derivative instruments are subject to master netting arrangements. Cash collateral payables or receivables associated with the derivative instruments are not added to or netted against the fair value amounts. The Company’s interest rate swaps are cleared through a registered clearing broker. At September 30, 2017 and September 30, 2016, respectively, the Company posted collateral of $2,955 and $10,480 related to the initial and daily margin requirements of interest rate swaps.
122
18. PARENT COMPANY ONLY FINANCIAL STATEMENTS
The following condensed financial statements for TFS Financial Corporation (parent company only) reflect the investments in, and transactions with, its wholly-owned subsidiaries. Intercompany activity is eliminated in the consolidated financial statements.
September 30, | |||||||
2017 | 2016 | ||||||
Statements of Condition | |||||||
Assets: | |||||||
Cash and due from banks | $ | 5,123 | $ | 5,102 | |||
Other loans: | |||||||
Demand loan due from Third Federal Savings and Loan | 89,299 | 88,443 | |||||
ESOP loan receivable | 61,759 | 65,462 | |||||
Investments in: | |||||||
Third Federal Savings and Loan | 1,503,831 | 1,475,175 | |||||
Non-thrift subsidiaries | 80,420 | 79,386 | |||||
Prepaid federal and state taxes | 154 | 374 | |||||
Deferred income taxes | 2,630 | 2,704 | |||||
Accrued receivables and other assets | 9,247 | 6,727 | |||||
Total assets | $ | 1,752,463 | $ | 1,723,373 | |||
Liabilities and shareholders’ equity: | |||||||
Line of credit due non-thrift subsidiary | $ | 59,815 | $ | 58,890 | |||
Accrued expenses and other liabilities | 2,689 | 4,025 | |||||
Total liabilities | 62,504 | 62,915 | |||||
Preferred stock, $0.01 par value, 100,000,000 shares authorized, none issued and outstanding | — | — | |||||
Common stock, $0.01 par value, 700,000,000 shares authorized; 332,318,750 shares issued; 281,291,750 and 284,219,019 outstanding at September 30, 2017 and September 30, 2016, respectively | 3,323 | 3,323 | |||||
Paid-in capital | 1,722,672 | 1,716,818 | |||||
Treasury stock, at cost; 51,027,000 and 48,099,731 shares at September 30, 2017 and September 30, 2016, respectively | (735,530 | ) | (681,569 | ) | |||
Unallocated ESOP shares | (53,084 | ) | (57,418 | ) | |||
Retained earnings—substantially restricted | 760,070 | 698,930 | |||||
Accumulated other comprehensive loss | (7,492 | ) | (19,626 | ) | |||
Total shareholders’ equity | 1,689,959 | 1,660,458 | |||||
Total liabilities and shareholders’ equity | $ | 1,752,463 | $ | 1,723,373 | |||
123
Years Ended September 30, | |||||||||||
2017 | 2016 | 2015 | |||||||||
Statements of Comprehensive Income | |||||||||||
Interest income: | |||||||||||
Demand loan due from Third Federal Savings and Loan | $ | 914 | $ | 433 | $ | 139 | |||||
ESOP loan | 2,308 | 2,281 | 2,276 | ||||||||
Other interest income | 21 | 4 | — | ||||||||
Total interest income | 3,243 | 2,718 | 2,415 | ||||||||
Interest expense: | |||||||||||
Borrowed funds from non-thrift subsidiaries | 612 | 377 | 253 | ||||||||
Total interest expense | 612 | 377 | 253 | ||||||||
Net interest income | 2,631 | 2,341 | 2,162 | ||||||||
Non-interest income: | |||||||||||
Intercompany service charges | 68 | 90 | 218 | ||||||||
Dividend from Third Federal Savings and Loan | 81,000 | 60,000 | 66,000 | ||||||||
Total other income | 81,068 | 60,090 | 66,218 | ||||||||
Non-interest expenses: | |||||||||||
Salaries and employee benefits | 5,134 | 5,543 | 6,216 | ||||||||
Professional services | 982 | 922 | 997 | ||||||||
Office property and equipment | 3 | 13 | 13 | ||||||||
Other operating expenses | 193 | 253 | 255 | ||||||||
Total non-interest expenses | 6,312 | 6,731 | 7,481 | ||||||||
Income before income taxes | 77,387 | 55,700 | 60,899 | ||||||||
Income tax benefit | (3,747 | ) | (2,915 | ) | (2,583 | ) | |||||
Income before undistributed earnings of subsidiaries | 81,134 | 58,615 | 63,482 | ||||||||
Equity in undistributed earnings of subsidiaries (dividend in excess of earnings): | |||||||||||
Third Federal Savings and Loan | 6,709 | 21,231 | 8,777 | ||||||||
Non-thrift subsidiaries | 1,034 | 707 | 332 | ||||||||
Net income | 88,877 | 80,553 | 72,591 | ||||||||
Change in net unrealized (loss) gain on securities available for sale | (3,331 | ) | (1,510 | ) | 3,018 | ||||||
Change in cash flow hedges | 11,620 | (1,371 | ) | — | |||||||
Change in pension obligation | 3,845 | (3,680 | ) | (5,291 | ) | ||||||
Total other comprehensive loss | 12,134 | (6,561 | ) | (2,273 | ) | ||||||
Total comprehensive income | $ | 101,011 | $ | 73,992 | $ | 70,318 | |||||
124
Years Ended September 30, | |||||||||||
2017 | 2016 | 2015 | |||||||||
Statements of Cash Flows | |||||||||||
Cash flows from operating activities: | |||||||||||
Net income | $ | 88,877 | $ | 80,553 | $ | 72,591 | |||||
Adjustments to reconcile net income to net cash provided by operating activities: | |||||||||||
(Equity in undistributed earnings of subsidiaries) dividend in excess of earnings: | |||||||||||
Third Federal Savings and Loan | (6,709 | ) | (21,231 | ) | (8,777 | ) | |||||
Non-thrift subsidiaries | (1,034 | ) | (707 | ) | (332 | ) | |||||
Deferred income taxes | 74 | 542 | (261 | ) | |||||||
ESOP and Stock-based compensation expense | 1,439 | 2,435 | 3,205 | ||||||||
Net (increase) decrease in interest receivable and other assets | (2,300 | ) | (346 | ) | 2,166 | ||||||
Net increase (decrease) in accrued expenses and other liabilities | 144 | 359 | 107 | ||||||||
Net cash provided by operating activities | 80,491 | 61,605 | 68,699 | ||||||||
Cash flows from investing activities: | |||||||||||
(Increase) decrease in balances lent to Third Federal Savings and Loan | (856 | ) | (54,792 | ) | 122,257 | ||||||
Repayment of capital contribution from Third Federal Savings and Loan | — | 150,000 | — | ||||||||
Net cash (used in) provided by investing activities | (856 | ) | 95,208 | 122,257 | |||||||
Cash flows from financing activities: | |||||||||||
Principal reduction of ESOP loan | 3,703 | 3,648 | 3,534 | ||||||||
Purchase of treasury shares | (54,029 | ) | (128,361 | ) | (172,546 | ) | |||||
Dividends paid to common shareholders | (27,709 | ) | (23,414 | ) | (19,490 | ) | |||||
Excess tax benefit related to stock-based compensation | — | 1,485 | 484 | ||||||||
Acquisition of treasury shares through net settlement for taxes | (2,504 | ) | (7,697 | ) | (4,111 | ) | |||||
Net increase in borrowings from non-thrift subsidiaries | 925 | 529 | 1,173 | ||||||||
Net cash used in financing activities | (79,614 | ) | (153,810 | ) | (190,956 | ) | |||||
Net increase in cash and cash equivalents | 21 | 3,003 | — | ||||||||
Cash and cash equivalents—beginning of year | 5,102 | 2,099 | 2,099 | ||||||||
Cash and cash equivalents—end of year | $ | 5,123 | $ | 5,102 | $ | 2,099 | |||||
19. EARNINGS PER SHARE
Basic earnings per share is the amount of earnings available to each share of common stock outstanding during the reporting period. Diluted earnings per share is the amount of earnings available to each share of common stock outstanding during the reporting period adjusted to include the effect of potentially dilutive common shares. For purposes of computing earnings per share amounts, outstanding shares include shares held by the public, shares held by the ESOP that have been allocated to participants or committed to be released for allocation to participants, the 227,119,132 shares held by Third Federal Savings, MHC, and, for purposes of computing dilutive earnings per share, stock options and restricted stock units with a dilutive impact. Unvested shares awarded pursuant to the Company's restricted stock plans are treated as participating securities in the computation of EPS pursuant to the two-class method as they contain nonforfeitable rights to dividends. The two-class method is an earnings allocation that determines EPS for each class of common stock and participating security. At September 30, 2017 and 2016, respectively, the ESOP held 5,308,411 and 5,741,751 shares that were neither allocated to participants nor committed to be released to participants.
125
The following is a summary of the Company’s earnings per share calculations.
For the Year Ended September 30, 2017 | ||||||||||
Income | Shares | Per share amount | ||||||||
(Dollars in thousands, except per share data) | ||||||||||
Net income | $ | 88,877 | ||||||||
Less: income allocated to restricted stock units | 901 | |||||||||
Basic earnings per share: | ||||||||||
Income available to common shareholders | 87,976 | 277,213,258 | $ | 0.32 | ||||||
Diluted earnings per share: | ||||||||||
Effect of dilutive potential common shares | 2,055,510 | |||||||||
Income available to common shareholders | $ | 87,976 | 279,268,768 | $ | 0.32 | |||||
For the Year Ended September 30, 2016 | ||||||||||
Income | Shares | Per share amount | ||||||||
(Dollars in thousands, except per share data) | ||||||||||
Net income | $ | 80,553 | ||||||||
Less: income allocated to restricted stock units | 761 | |||||||||
Basic earnings per share: | ||||||||||
Income available to common shareholders | 79,792 | 281,566,648 | $ | 0.28 | ||||||
Diluted earnings per share: | ||||||||||
Effect of dilutive potential common shares | 2,219,065 | |||||||||
Income available to common shareholders | $ | 79,792 | 283,785,713 | $ | 0.28 | |||||
For the Year Ended September 30, 2015 | ||||||||||
Income | Shares | Per share amount | ||||||||
(Dollars in thousands, except per share data) | ||||||||||
Net income | $ | 72,591 | ||||||||
Less: income allocated to restricted stock units | 626 | |||||||||
Basic earnings per share: | ||||||||||
Income available to common shareholders | 71,965 | 289,935,861 | $ | 0.25 | ||||||
Diluted earnings per share: | ||||||||||
Effect of dilutive potential common shares | 2,274,556 | |||||||||
Income available to common shareholders | $ | 71,965 | 292,210,417 | $ | 0.25 | |||||
The following is a summary of outstanding stock options that are excluded from the computation of diluted earnings per share because their inclusion would be anti-dilutive. No restricted stock units were anti-dilutive for the years ended September 30, 2017, 2016, and 2015.
For the Year Ended September 30, | ||||||||
2017 | 2016 | 2015 | ||||||
Options to purchase shares | 779,740 | 393,500 | 1,382,900 | |||||
20. RELATED PARTY TRANSACTIONS
The Company has made loans and extensions of credit, in the ordinary course of business, to certain Directors. These loans were under normal credit terms, including interest rate and collateralization, and do not represent more than the normal risk of collection. The aggregate amount of loans to such related parties at September 30, 2017 and 2016 was $173 and $181, respectively. None of these loans were past due, considered impaired or on nonaccrual at September 30, 2017.
126
21. RECENT ACCOUNTING PRONOUNCEMENTS
Pending as of September 30, 2017
In August 2017, The FASB issued ASU 2017-12 Derivatives and Hedging (Topic 815): Targeted Improvements to Accounting for Hedging Activities. This Update is intended to more closely align financial reporting of hedging relationships with risk management activities. This amendment expands hedge accounting for both nonfinancial and financial risk components, modifies the presentation of certain hedging relationships in the financial statements and eases hedge effectiveness testing requirements. The amendments are effective for fiscal years beginning after December 15, 2018. Early adoption is permissible in any interim period after the issuance of this update and is being considered by the Company. The update is not expected to have a significant impact on the Company's consolidated financial condition or results of operations.
In May 2017, the FASB issued ASU No. 2017-09, Compensation-Stock Compensation (Topic 718), Scope of Modification Accounting. This Update clarifies when to account for a change to the terms or conditions of a share-based payment award as a modification. Under the new guidance, modification accounting is required only if the fair value (or calculated intrinsic value, if those amounts are being used to measure the award under ASC 718), the vesting conditions, or the classification of the award (as equity or liability) change as a result of the change in terms or conditions. The guidance is effective prospectively for annual periods beginning on or after December 15, 2017, and interim periods within those annual periods. Early adoption is permitted. The Company intends to adopt the guidance on the effective date and does not expect the adoption to have a material impact on its consolidated financial condition or results of operations.
In March 2017, the FASB issued ASU 2017-07 Compensation - Retirement Benefits (Topic 715), Improving the Presentation of Net Periodic Pension Cost and Net Periodic Postretirement Benefit Cost. This Update was issued to improve the presentation of net periodic pension or benefit costs for employers that offer their employees defined benefit pension plans, postretirement benefit plans, or other types of benefits accounted for under Topic 715. The amendments prescribe where the amount of net benefit cost should be presented in an employer’s income statement and require entities to disclose by line item the amount of net benefit cost that is included in the income statement or capitalized in assets. The ASU is effective for annual reporting periods beginning after December 15, 2017, including interim periods within those annual periods. Early adoption is permitted. Retrospective application is required for the change in income statement presentation, while the change in capitalized benefit cost is to be applied prospectively. The Company plans to early adopt this guidance for the annual and interim reporting periods beginning October 1, 2017. The only impact is a change to how certain items will be presented in the Company’s Consolidated Statements of Condition and Statements of Income and the accompanying Notes.
In August 2016, the FASB issued ASU 2016-15, Statement of Cash Flows (Topic 230): Classification of Certain Cash Receipts and Cash Payments. The amendments in this Update address eight specific cash flow issues with the objective of reducing the existing diversity in how certain cash receipts and cash payments are presented and classified in the statement of cash flows under Topic 230, Statement of Cash Flows, and Other Topics. Current guidance is either unclear or does not include specific guidance on these issues. Additionally, in November 2016, the FASB issued ASU 2016-18, Statement of Cash Flows (Topic 230) Restricted Cash, which requires restricted cash or restricted cash equivalents be included in beginning-of-period and end-of-period cash totals and changes in this classification be explained separately. The amendments in both these Updates are effective for public business entities for fiscal years beginning after December 15, 2017, and interim periods within those fiscal years and should be applied using a retrospective transition method. Early adoption is permitted, provided that all of the amendments are adopted in the same period. The Company is reviewing the requirements with an implementation team and currently does not expect to early adopt. Adoption of this accounting guidance may affect the presentation in the Company's Consolidated Statements of Cash Flows.
In June 2016, the FASB issued ASU 2016-13, Financial Instruments - Credit Losses (Topic 326), Measurement of Credit Losses on Financial Instruments. The amendments in this Update replace the existing incurred loss impairment methodology with a methodology that reflects expected credit losses for the remaining life of the asset. This will require consideration of a broader range of information, including reasonably supportable forecasts, in the measurement of expected credit losses. The amendments expand disclosures of credit quality indicators, requiring disaggregation by year of origination (vintage). Additionally, credit losses on available for sale debt securities will be recognized as an allowance rather than a write-down, with reversals permitted as credit loss estimates decline. An entity will apply the amendments in this Update through a cumulative-effect adjustment to retained earnings as of the beginning of the first reporting period in which the guidance is effective (that is, a modified-retrospective approach). For public business entities that are SEC filers, the amendments are effective for fiscal years beginning after December 15, 2019, including interim periods within those fiscal years. Early adoption is permitted. Management has formed a working group comprised of teams from across the association including accounting, risk management, and finance. This group has begun assessing the required changes to our credit loss estimation methodologies and systems, as well as additional data and resources that may be required to comply with this standard. The
127
Company is currently evaluating the impact that this accounting guidance may have on its consolidated financial condition or results of operations. The actual effect on our allowance for loan losses at the adoption date will be dependent upon the nature of the characteristics of the portfolio as well as the macroeconomic conditions and forecasts at that date.
In February 2016, the FASB issued ASU 2016-02, Leases (Topic 842). This guidance changes the accounting treatment of leases by requiring lessees to recognize operating leases on the balance sheet as lease assets (a right-to-use asset) and lease liabilities (a liability to make lease payments), measured on a discounted basis and will require both quantitative and qualitative disclosure regarding key information about the leasing arrangements. An accounting policy election to not recognize operating leases with terms of 12 months or less as assets and liabilities is permitted. This guidance will be effective for the fiscal year beginning after December 15, 2018, with early adoption permitted. A modified retrospective approach is required that includes a number of optional practical expedients to address leases that commenced before the effective date. An implementation team has been created to identify all leases involved, which, if any, practical expedients to utilize, and all data gathering required to comply. All leases have been identified. The Company expects to recognize a right-to-use asset and a lease liability for its operating lease commitments on the Consolidated Statements of Condition and is assessing the impact this new standard will have on its consolidated financial condition and results of operations.
In January 2016, the FASB issued ASU 2016-01, Financial Instruments - Overall (Subtopic 825-10), Recognition and Measurement of Financial Assets and Financial Liabilities. This ASU changes the accounting for certain equity investments, financial liabilities under the fair value option and presentation and disclosure requirements for financial instruments. Equity investments not accounted for under the equity method of accounting will be measured at fair value with changes recognized in net income. If there are no readily determinable fair values, the guidance allows entities to measure investments at cost less impairment, whereby impairment is based on a qualitative assessment. The guidance eliminates the requirement to disclose the methods and significant assumptions used to estimate fair value of financial instruments measured at amortized cost. If an entity has elected the fair value option to measure liabilities, the new accounting guidance requires the portion of the change in fair value of a liability resulting from credit risk to be presented in OCI. This accounting and disclosure guidance is effective for the fiscal year beginning after December 15, 2017, including interim periods within that fiscal year on a prospective basis, with a cumulative-effect adjustment to the balance sheet at the beginning of the fiscal year adopted. Early adoption is not permitted. The Company is currently evaluating the impact that this accounting guidance may have on its consolidated financial condition or results of operations.
In May 2014, the FASB issued ASU 2014-09, Revenue from Contracts with Customers (Topic 606), that revises the criteria for determining when to recognize revenue from contracts with customers and expands disclosure requirements. This ASU affects any entity that either enters into contracts with customers to transfer goods or services or enters into contracts for the transfer of nonfinancial assets unless those contracts are within the scope of other standards. In August 2015, the FASB issued ASU 2015-14 which defers the effective date of ASU 2014-09 to annual reporting periods and interim period within those annual periods beginning after December 15, 2017. Early adoption is permitted but only for interim and annual reporting periods beginning after December 15, 2016. During 2016 and 2017, the FASB also issued five separate ASUs which amend the original guidance regarding principal versus agent considerations, identify performance obligations and licensing, address the presentation of sales tax, noncash consideration, contract modifications at transition, and assessing collectability, gains and losses from derecognition of nonfinancial assets and other minor technical corrections and improvements. The requirements within 2014-09 and its subsequent amendments should be applied retrospectively or modified retrospectively with a cumulative-effect adjustment. The Company's preliminary analysis suggests that the adoption of this accounting guidance is not expected to have a material effect on its consolidated financial condition or results of operations.
Adopted in fiscal year ended September 30, 2017
In March 2016, the FASB issued ASU 2016-09, Compensation - Stock Compensation (Topic 718), Improvements to Employee Share-Based Payment Accounting, which simplifies several aspects of the accounting for share-based payment transactions, including accounting for income taxes, forfeitures, and classification in the statement of cash flows. Additionally, the ASU expanded the threshold on statutory tax withholding requirements used to qualify for equity classification. This accounting guidance is effective for annual periods beginning after December 15, 2016 and interim periods within those annual periods. Early adoption is permitted.
The Company early adopted the revised guidance on October 1, 2016. The impact of this adoption on the Company's consolidated financial statements is described below.
• | On a prospective basis, all excess tax benefits and deficiencies related to share-based payments are recognized as income tax expense or benefit. For the fiscal year ended September 30, 2017, $1,058 was recognized as income tax benefit rather than additional paid-in capital as a result of this adoption. Excess tax benefits and tax deficiencies are |
128
considered discrete items in the reporting period they occur and are not included in the estimate of the Company's annual effective tax rate in interim periods.
• | On a prospective basis, excess tax benefits and deficiencies related to share-based payments are classified as operating activities on the Statements of Cash Flows. No change was applied to prior periods. |
• | The Company elects to account for forfeitures as they occur, rather than estimate expected forfeitures. This election was applied using a modified retrospective transition method. The cumulative-effect adjustment to equity recognized as of October 1, 2016 was not material. |
In February 2015, the FASB issued ASU 2015-02, Consolidation (Topic 810), Amendments to the Consolidation Analysis. This accounting guidance changes the analysis that a reporting entity must perform to determine whether it should consolidate certain types of legal entities. The new guidance amends the current accounting guidance to address limited partnerships and similar legal entities, certain investment funds, fees paid to a decision maker or service provider, and the impact of fee arrangements and related parties on the primary beneficiary determination. In addition, the FASB issued ASU 2016-17, Consolidation (Topic 810), Interests Held through Related Parties that are under Common Control in October 2016, amending the consolidation guidance on how a reporting entity that is the single decision maker of a Variable Interest Entity (VIE) should treat indirect interests in the entity held through related parties that are under common control. Both accounting guidances are effective for annual periods beginning after December 15, 2015. A reporting entity may apply the ASU by using a modified retrospective approach (by recording a cumulative-effect adjustment to equity as of the beginning of the year of adoption) or a full retrospective approach (by restating all periods presented). The adoption of this accounting guidance did not have a material effect on the Company's consolidated financial condition or results and operations.
In March 2016, the FASB issued ASU 2016-05, Derivatives and Hedging (Topic 815), Effects of Derivative Contract Novations on Existing Hedge Accounting Relationships. This amendment clarifies that a change in the counterparty to a derivative instrument that has been designated as the hedging instrument under Topic 815 does not, in and of itself, require dedesignation of that hedging relationship provided that all other hedging accounting criteria continue to be met. This guidance is effective for financial statements issued for fiscal years beginning after December 15, 2016 and interim periods within those fiscal years. Early adoption is permitted. An entity has an option to apply the amendments in this Update on either a prospective or a modified retrospective basis. The Company elected to early adopt this accounting guidance using a prospective method and will consider opportunities provided by these amendments in future transactions. The adoption of this accounting guidance does not currently affect the Company's consolidated financial condition and results of operations.
In May 2015, the FASB issued ASU 2015-07, Fair Value Measurement (Topic 820), Disclosures for Investments in Certain Entities That Calculate Net Asset Value per Share. This guidance eliminates the requirement to categorize investments measured at net value per share (or its equivalent) using the practical expedient in the fair value hierarchy table and eliminates certain disclosures required for these investments. Entities will continue to provide information helpful to understanding the nature and risks of these investments and whether the investments, if sold, are probable of being sold at amounts different from net asset value. The amendments in this Update are effective for public companies retrospectively for fiscal years beginning after December 15, 2015, and interim periods within those fiscal years. This guidance was applied to the Company's disclosures on pension assets presented in Note 13. Employee Benefit Plans.
In January 2017, the FASB issued ASU 2017-04, Intangibles - Goodwill and Other (Topic 350): Simplifying the Test for Goodwill Impairment. This Update simplifies how an entity is required to test goodwill impairment by eliminating Step 2 from the goodwill impairment test. Step 2 measures a goodwill impairment loss by calculating the implied fair value of goodwill by assigning the fair value of a reporting unit to all of its assets and liabilities as if that reporting unit had been acquired in a business combination. An entity will still perform its annual or interim goodwill impairment test by comparing the fair value of the reporting unit with its carrying amount. Under this guidance, an entity would recognize an impairment charge for the amount by which the carry amount exceeds the fair value, not to exceed the total amount of goodwill allocated to that reporting unit. The entity still has the option to perform the qualitative assessment to determine if the quantitative impairment test is necessary. An entity should apply the amendments in this Update on a prospective basis, with disclosure of the nature and reason for a change in accounting principle upon transition. The amendments in this Update are effective for annual and interim goodwill impairment testing in fiscal years beginning after December 15, 2019, with early adoption permitted for interim or annual goodwill impairment tests performed on testing dates after January 1, 2017. The Company adopted and considered this guidance for the fiscal year-end goodwill impairment test. The adoption of this disclosure guidance did not materially affect the Company's consolidated financial condition or results of operations.
The Company has determined that all other recently issued accounting pronouncements will not have a material impact on the Company's consolidated financial statements or do not apply to its operations.
129
22. SELECTED QUARTERLY DATA (UNAUDITED)
The following tables are a summary of certain quarterly financial data for the fiscal years ended September 30, 2017 and 2016.
Fiscal 2017 Quarter Ended | |||||||||||||||
December 31 | March 31 | June 30 | September 30 | ||||||||||||
(In thousands, except per share data) | |||||||||||||||
Interest income | $ | 98,214 | $ | 101,083 | $ | 103,721 | $ | 105,977 | |||||||
Interest expense | 29,984 | 30,797 | 33,449 | 35,869 | |||||||||||
Net interest income | 68,230 | 70,286 | 70,272 | 70,108 | |||||||||||
Provision (credit) for loan losses | — | (6,000 | ) | (4,000 | ) | (7,000 | ) | ||||||||
Net interest income after provision for loan losses | 68,230 | 76,286 | 74,272 | 77,108 | |||||||||||
Non-interest income | 5,368 | 4,552 | 4,804 | 5,125 | |||||||||||
Non-interest expense | 45,262 | 45,294 | 44,669 | 47,179 | |||||||||||
Income before income tax | 28,336 | 35,544 | 34,407 | 35,054 | |||||||||||
Income tax expense | 8,726 | 12,083 | 11,619 | 12,036 | |||||||||||
Net income | $ | 19,610 | $ | 23,461 | $ | 22,788 | $ | 23,018 | |||||||
Earnings per share—basic and diluted | $ | 0.07 | $ | 0.08 | $ | 0.08 | $ | 0.08 | |||||||
Fiscal 2016 Quarter Ended | |||||||||||||||
December 31 | March 31 | June 30 | September 30 | ||||||||||||
(In thousands, except per share data) | |||||||||||||||
Interest income | $ | 96,431 | $ | 97,145 | $ | 96,993 | $ | 97,872 | |||||||
Interest expense | 28,790 | 29,386 | 29,604 | 30,246 | |||||||||||
Net interest income | 67,641 | 67,759 | 67,389 | 67,626 | |||||||||||
Provision (credit) for loan losses | (1,000 | ) | (1,000 | ) | (3,000 | ) | (3,000 | ) | |||||||
Net interest income after provision for loan losses | 68,641 | 68,759 | 70,389 | 70,626 | |||||||||||
Non-interest income | 6,117 | 6,703 | 6,108 | 6,024 | |||||||||||
Non-interest expense | 47,633 | 46,341 | 44,976 | 42,054 | |||||||||||
Income before income tax | 27,125 | 29,121 | 31,521 | 34,596 | |||||||||||
Income tax expense | 9,274 | 9,845 | 10,901 | 11,790 | |||||||||||
Net income | $ | 17,851 | $ | 19,276 | $ | 20,620 | $ | 22,806 | |||||||
Earnings per share—basic and diluted | $ | 0.06 | $ | 0.07 | $ | 0.07 | $ | 0.08 | |||||||
Per share amounts for the full fiscal year, as reported in the Consolidated Statements of Income may differ from the totals of the four fiscal quarters as presented above, due to rounding.
130
FORM 10-K EXHIBIT INDEX
Exhibit Number | Description of Exhibit | If Incorporated by Reference, Documents with Which Exhibit was Previous Filed with SEC | ||
Amendment No. 2 to Registration Statement on Form S-1 No. 333-139295 (filed with the SEC on February 9, 2006; Exhibit 3.2 therein) | ||||
Current Report on Form 8-K No. 001-33390 (filed with the SEC on April 28, 2008; Exhibit 3.2 therein) | ||||
Registration Statement on Form S-1 No. 333-139295 (filed with the SEC on December 13, 2006; Exhibit 4 therein) | ||||
10.1 | [Intentionally omitted] | |||
Registration Statement on Form S-1 No. 333-139295 (filed with the SEC on December 13, 2006; Exhibit 10.2 therein) | ||||
Registration Statement on Form S-1 No. 333-139295 (filed with the SEC on December 13, 2006; Exhibit 10.3 therein) | ||||
Registration Statement on Form S-1 No. 333-139295 (filed with the SEC on December 13, 2006; Exhibit 10.4 therein) | ||||
Registration Statement on Form S-1 No. 333-139295 (filed with the SEC on December 13, 2006; Exhibit 10.5 therein) | ||||
Registration Statement on Form S-1 No. 333-139295 (filed with the SEC on December 13, 2006; Exhibit 10.6 therein) | ||||
Registration Statement on Form S-1 No. 333-139295 (filed with the SEC on December 13, 2006; Exhibit 10.7 therein) | ||||
Registration Statement on Form S-1 No. 333-139295 (filed with the SEC on December 13, 2006; Exhibit 10.8 therein) | ||||
Quarterly Report on Form 10-Q No. 001-33390 (filed with the SEC on May 15, 2007; Exhibit 10.9 therein) | ||||
Current Report on Form 8-K No. 001-33390 (filed with the SEC on May 30, 2008; Exhibit 10.1 therein) | ||||
Current Report on Form 8-K No. 001-33390 (filed with the SEC on May 30, 2008; Exhibit 10.2 therein) | ||||
Current Report on Form 8-K No. 001-33390 (filed with the SEC on August 9, 2012; Exhibit 10.1 therein) | ||||
131
Exhibit Number | Description of Exhibit | If Incorporated by Reference, Documents with Which Exhibit was Previous Filed with SEC | ||
Current Report on Form 8K No. 001-33390 (filed with the SEC on August 9, 2012; Exhibit 10.2 therein) | ||||
Current Report on Form 8K No. 001-33390 (filed with the SEC on August 9, 2012; Exhibit 10.3 therein) | ||||
14 | Code of Ethics | Available on our website, www.thirdfederal.com | ||
Registration Statement on Form S-1 No. 333-139295 (filed with the SEC on December 13, 2006; Exhibit 21 therein) | ||||
Filed herewith | ||||
Filed herewith | ||||
Filed herewith | ||||
Filed herewith | ||||
100 | XBRL related documents | The following financial statements from TFS Financial Corporation’s Annual Report on Form 10-K for the year ended September 30, 2017 filed on November 22, 2017 formatted in XBRL: (i) Consolidated Statements of Condition, (ii) Consolidated Statements of Income, (iii) Consolidated Statements of Comprehensive Income, (iv) Consolidated Statements of Shareholders' Equity, (v) Consolidated Statements of Cash Flows, (vi) Notes to Consolidated Financial Statements. | ||
101.INS | Interactive datafile | XBRL Instance Document | ||
101.SCH | Interactive datafile | XBRL Taxonomy Extension Schema Document | ||
101.CAL | Interactive datafile | XBRL Taxonomy Extension Calculation Linkbase Document | ||
101.DEF | Interactive datafile | XBRL Taxonomy Extension Definition Linkbase Document | ||
101.LAB | Interactive datafile | XBRL Taxonomy Extension Label Linkbase Document | ||
101.PRE | Interactive datafile | XBRL Taxonomy Extension Presentation Linkbase Document | ||
132
SIGNATURES
Pursuant to the requirements of Section 13 or 15(d) the Securities Exchange Act of 1934, the Registrant has duly caused this report to be signed on its behalf by the undersigned thereunto duly authorized.
TFS Financial Corporation
Dated: | November 22, 2017 | /S/ MARC A. STEFANSKI | |||
Marc A. Stefanski Chairman of the Board, President and Chief Executive Officer (Principal Executive Officer) | |||||
Pursuant to the requirements of the Securities Exchange Act of 1934, this report has been signed below by the following persons on behalf of the Registrant and in the capacities and on the dates indicated.
Dated: | November 22, 2017 | /S/ MARC A. STEFANSKI | |||
Marc A. Stefanski Chairman of the Board, President and Chief Executive Officer (Principal Executive Officer) | |||||
Dated: | November 22, 2017 | /S/ DAVID S. HUFFMAN | |||
David S. Huffman Chief Financial Officer and Secretary (Principal Financial Officer) | |||||
Dated: | November 22, 2017 | /S/ PAUL J. HUML | |||
Paul J. Huml Chief Accounting Officer (Principal Accounting Officer) | |||||
Dated: | November 22, 2017 | /S/ ANTHONY J. ASHER | |||
Anthony J. Asher, Director | |||||
Dated: | November 22, 2017 | /S/ MARTIN J. COHEN | |||
Martin J. Cohen, Director | |||||
Dated: | November 22, 2017 | /S/ ROBERT A. FIALA | |||
Robert A. Fiala, Director | |||||
Dated: | November 22, 2017 | /S/ WILLIAM C. MULLIGAN | |||
William C. Mulligan, Director | |||||
Dated: | November 22, 2017 | /S/ TERRENCE R. OZAN | |||
Terrence R. Ozan, Director | |||||
Dated: | November 22, 2017 | /S/ JOHN P. RINGENBACH | |||
John P. Ringenbach, Director | |||||
Dated: | November 22, 2017 | /S/ BEN S. STEFANSKI III | |||
Ben S. Stefanski III, Director | |||||
Dated: | November 22, 2017 | /S/ MEREDITH S. WEIL | |||
Meredith S. Weil, Director | |||||
133