Attached files
| file | filename |
|---|---|
| EX-32.2 - EXHIBIT 32.2 - EDGEWELL PERSONAL CARE Co | epc10k93017ex322.htm |
| EX-32.1 - EXHIBIT 32.1 - EDGEWELL PERSONAL CARE Co | epc10k93017ex321.htm |
| EX-31.2 - EXHIBIT 31.2 - EDGEWELL PERSONAL CARE Co | epc10k93017ex312.htm |
| EX-31.1 - EXHIBIT 31.1 - EDGEWELL PERSONAL CARE Co | epc10k93017ex311.htm |
| EX-23.1 - EXHIBIT 23.1 - EDGEWELL PERSONAL CARE Co | epc10k93017ex231.htm |
| EX-21.1 - EXHIBIT 21.1 - EDGEWELL PERSONAL CARE Co | epc10k93017ex211.htm |
| EX-12 - EXHIBIT 12 - EDGEWELL PERSONAL CARE Co | epc10k93017ex12.htm |
| EX-10.39 - EXHIBIT 10.39 - EDGEWELL PERSONAL CARE Co | epc10k93017ex1039.htm |
UNITED STATES
SECURITIES AND EXCHANGE COMMISSION
Washington, D.C. 20549
____________________________________
FORM 10-K
x | ANNUAL REPORT PURSUANT TO SECTION 13 OR 15(d) OF THE SECURITIES EXCHANGE ACT OF 1934 |
For the fiscal year ended September 30, 2017
or
o | TRANSITION REPORT PURSUANT TO SECTION 13 OR 15(d) OF THE SECURITIES EXCHANGE ACT OF 1934 |
For the transition period from _______________ to _______________
Commission File Number 001-15401

EDGEWELL PERSONAL CARE COMPANY
(Exact name of registrant as specified in its charter)
Missouri | 43-1863181 | |
(State or other jurisdiction of incorporation or organization) | (I. R. S. Employer Identification No.) | |
1350 Timberlake Manor Parkway | ||
Chesterfield, Missouri 63017 | ||
(Address of principal executive offices) (Zip Code) | ||
(314) 594-1900 | ||
(Registrant's telephone number, including area code) | ||
Securities registered pursuant to Section 12(b) of the Act:
Title of each class | Name of each exchange on which registered | |
Common Stock, par value $0.01 per share | New York Stock Exchange | |
Securities registered pursuant to Section 12(g) of the Act: None.
Indicate by check mark if the registrant is a well-known seasoned issuer, as defined in Rule 405 of the Securities Act. Yes x No o
Indicate by check mark if the registrant is not required to file reports pursuant to Section 13 or 15(d) of the Act. Yes o No x
Indicate by check mark whether the registrant (1) has filed all reports required to be filed by Section 13 or 15(d) of the Securities Exchange Act of 1934 during the preceding 12 months (or for such shorter period that the registrant was required to file such reports), and (2) has been subject to such filing requirements for the past 90 days. Yes x No o
Indicate by check mark whether the registrant has submitted electronically and posted on its corporate Web site, if any, every Interactive Data File required to be submitted and posted pursuant to Rule 405 of Regulation S-T (§232.405 of this chapter) during the preceding 12 months (or for such shorter period that the registrant was required to submit and post such files). Yes x No o
Indicate by check mark if disclosure of delinquent filers pursuant to Item 405 of Regulation S-K (§229.405 of this chapter) is not contained herein, and will not be contained, to the best of registrant's knowledge, in definitive proxy or information statements incorporated by reference in Part III of this Form 10-K or any amendment to this Form 10-K. x
Indicate by check mark whether the registrant is a large accelerated filer, an accelerated filer, a non-accelerated filer, or a smaller reporting company. See the definitions of "large accelerated filer," "accelerated filer" and "smaller reporting company" in Rule 12b-2 of the Exchange Act.
Large accelerated filer | x | Accelerated filer | o | |
Non-accelerated filer | o | (Do not check if a smaller reporting company) | Smaller reporting company | o |
Emerging growth company | o | |||
1
If an emerging growth company, indicate by check mark if the registrant has elected not to use the extended transition period for complying with any new or revised financial accounting standards provided pursuant to Section 13(a) of the Exchange Act. o
Indicate by check mark whether the registrant is a shell company (as defined in Rule 12b-2 of the Act). Yes o No x
The aggregate market value of the voting and non-voting common equity held by non-affiliates of the registrant as of March 31, 2017, the last day of the registrant's most recently completed second fiscal quarter, was $3,552,560,980.
The number of shares of the registrant's common stock outstanding as of October 31, 2017 was 56,017,537.
DOCUMENTS INCORPORATED BY REFERENCE
Certain portions of the registrant's definitive proxy statement for its annual meeting of shareholders, to be filed with the Securities and Exchange Commission within 120 days after September 30, 2017, are incorporated by reference into Part III of this report.
2
EDGEWELL PERSONAL CARE COMPANY
INDEX TO FORM 10-K
PART I | ||
Item 1. | Business. | |
Item 1A. | Risk Factors. | |
Item 1B. | Unresolved Staff Comments. | |
Item 2. | Properties. | |
Item 3. | Legal Proceedings. | |
Item 4. | Mine Safety Disclosures. | |
PART II | ||
Item 5. | Market for Registrant's Common Equity, Related Stockholder Matters and Issuer Purchases of Equity Securities. | |
Item 6. | Selected Financial Data. | |
Item 7. | Management's Discussion and Analysis of Financial Condition and Results of Operations. | |
Item 7A. | Quantitative and Qualitative Disclosures About Market Risk. | |
Item 8. | Financial Statements and Supplementary Data. | |
Item 9. | Changes in and Disagreements With Accountants on Accounting and Financial Disclosure. | |
Item 9A. | Controls and Procedures. | |
Item 9B. | Other Information. | |
PART III | ||
Item 10. | Directors, Executive Officers and Corporate Governance. | |
Item 11. | Executive Compensation. | |
Item 12. | Security Ownership of Certain Beneficial Owners and Management and Related Stockholder Matters. | |
Item 13. | Certain Relationships and Related Transactions, and Director Independence. | |
Item 14. | Principal Accounting Fees and Services. | |
Part IV | ||
Item 15. | Exhibits, Financial Statement Schedules. | |
Signatures | ||
Exhibit Index | ||
3
Presentation of Information
Unless the context requires otherwise, references to "Edgewell Personal Care Company," "Edgewell," "we," "us," "our" and "the Company" refer to Edgewell Personal Care Company, and its consolidated subsidiaries.
Trademarks and Trade Names
We own or have rights to use trademarks and trade names that we use in conjunction with the operation of our business, which appear throughout this Annual Report on Form 10-K. Solely for convenience, we only use the ™ or ® symbols the first time any trademark or trade name is mentioned. We may also refer to brand names, trademarks, service marks and trade names of other companies and organizations, and these brand names, trademarks, service marks and trade names are the property of their respective owners.
Industry and Market Data
Unless we indicate otherwise, we base the information concerning our industry contained or incorporated by reference herein on our general knowledge of and expectations concerning the industry. Our market position, market share and industry market size is based on our estimates using internal data and data from various industry analyses, our internal research and adjustments and assumptions that we believe to be reasonable. We have not independently verified data from industry analyses and cannot guarantee accuracy or completeness. In addition, we believe that data regarding the industry, market size and our market position and market share within such industry provide general guidance but are inherently imprecise. Further, our estimates and assumptions involve risks and uncertainties and are subject to change based on various factors, including those discussed in the "Risk Factors" section of this document. These and other factors could cause results to differ materially from those expressed in the estimates and assumptions.
Retail sales for purposes of market size, market position and market share information are based on retail sales in United States dollars.
Forward-Looking Statements
This document contains both historical and forward-looking statements. Forward-looking statements are not based on historical facts, but instead reflect our expectations, estimates or projections concerning future results or events, including, without limitation, the future earnings and performance of Edgewell Personal Care Company or any of our businesses. These statements generally can be identified by the use of forward-looking words or phrases such as "believe," "expect," "expectation," "anticipate," "may," "could," "intend," "belief," "estimate," "plan," "target," "predict," "likely," "will," "should," "forecast," "outlook," or other similar words or phrases. These statements are not guarantees of performance and are inherently subject to known and unknown risks, uncertainties and assumptions that are difficult to predict and could cause our actual results to differ materially from those indicated by those statements. We cannot assure you that any of our expectations, estimates or projections will be achieved. The forward-looking statements included in this document are only made as of the date of this document, and we disclaim any obligation to publicly update any forward-looking statement to reflect subsequent events or circumstances. Numerous factors could cause our actual results and events to differ materially from those expressed or implied by forward-looking statements, including, without limitation:
• | We face risks associated with global economic conditions. |
• | Competition in our industries may hinder our ability to execute our business strategy, achieve profitability, or maintain relationships with existing customers. |
• | Loss of any of our principal customers could significantly decrease our sales and profitability. |
• | Our inability to execute a successful e-commerce strategy could have a significant impact on our business. |
• | Changes in production costs, including raw material prices, could erode our profit margins and negatively impact operating results. |
• | Loss of reputation of our leading brands or failure of our marketing plans could have an adverse effect on our business. |
• | We are subject to risks related to our international operations, including currency fluctuations, which could adversely affect our results of operations. |
• | We face risks arising from our ongoing efforts to achieve cost savings. |
4
• | If we cannot continue to develop new products in a timely manner, and at favorable margins, we may not be able to compete effectively. |
• | We may not be able to continue to identify and complete strategic acquisitions and effectively integrate acquired companies to achieve desired financial benefits. |
• | A failure of a key information technology system or a breach of our information security could adversely impact our ability to conduct business. |
• | Our business is subject to increasing global regulation, including product related regulations and environmental regulations, that may expose us to significant liabilities. |
• | Our access to capital markets and borrowing capacity could be limited. |
• | Impairment of our goodwill and other intangible assets would result in a reduction in net income. |
• | Legislative changes in applicable tax laws, policies and regulations or unfavorable resolution of tax matters may result in additional tax liabilities, which could adversely impact our cash flows and results of operations. |
• | Our manufacturing facilities, supply channels or other business operations may be subject to disruption from events beyond our control. |
• | We have a substantial level of indebtedness and are subject to various covenants relating to such indebtedness, which could limit our discretion to operate and grow our business. |
• | Our business is subject to seasonal volatility. |
• | There can be no guarantee that we will repurchase stock. |
• | We do not expect to pay dividends for the foreseeable future. |
• | If we fail to adequately protect our intellectual property rights, competitors may manufacture and market similar products, which could adversely affect our market share and results of operations. |
• | Our financial results could be adversely impacted by the United Kingdom's departure from the European Union. |
• | Our business involves the potential for product liability and other claims against us, which could affect our results of operations and financial condition and result in product recalls or withdrawals. |
• | Our business could be negatively impacted as a result of stockholder activism or an unsolicited takeover proposal or a proxy contest. |
• | We may not be able to attract, retain and develop key personnel. |
• | We may experience losses or be subject to increased funding and expenses related to our pension plans. |
• | Certain provisions in our articles of incorporation and bylaws, and of Missouri law, could deter or delay a third-party's effort to acquire us, especially if the Board determines it is not in the best interest of our shareholders. |
• | The trading price of our common shares may be volatile. |
• | Our historical financial information is not necessarily representative of the results that we would have achieved had the Separation taken place before July 1, 2015, and may not be a reliable indicator of our future results. |
• | If the Separation, together with certain related transactions, does not qualify as a transaction that is generally tax free for U.S. federal income tax purposes, our shareholders could be subject to significant tax liabilities. |
• | Indemnifications under the Separation agreement with New Energizer or New Energizer’s inability to satisfy indemnification obligations in the future could negatively impact our financial results. |
In addition, other risks and uncertainties not presently known to us or that we presently consider immaterial could significantly affect the forward-looking statements. The list of factors above is illustrative, but not exhaustive. All forward-looking statements should be evaluated with the understanding of their inherent uncertainty. Additional risks and uncertainties include those detailed from time to time in our publicly filed documents, including in Item 1A. Risk Factors of Part I of this Annual Report on Form 10-K.
5
PART I
Item 1. Business.
Overview
Edgewell Personal Care Company, and its subsidiaries, is one of the world's largest manufacturers and marketers of personal care products in the wet shave, sun and skin care, feminine care and infant care categories. We have a portfolio of over 25 brands and a broad global footprint in more than 50 countries.
History and Development
We were incorporated in the state of Missouri on September 23, 1999 and, prior to April 2000, were a wholly-owned subsidiary of Ralston Purina Company. On April 1, 2000, all of the outstanding shares of our common stock were distributed to shareholders of Ralston Purina Company and we became an independent publicly-owned company. During the years that followed, we implemented a strategy of acquiring several personal care brands, which created the foundation for the company we are today.
In 2003, we completed the acquisition of the Schick-Wilkinson Sword business ("SWS") from Pfizer, Inc., which was the second largest manufacturer and marketer of men's and women's wet shave products in the world. Our portfolio of wet shave products include: Hydro® and Quattro® men's shaving systems; Hydro Silk®, Quattro for Women®, Intuition® and Silk Effects® Plus women's shaving systems; and the Hydro, Quattro, Xtreme 3®, Slim Twin®, Slim Triple® and Extra3® disposables. SWS has over 75 years of history in the shaving products industry with a reputation for high quality and innovation in shaving technology. SWS products are sold throughout the world.
In 2007, we acquired Playtex Products, Inc. ("Playtex"), expanding our branded consumer products portfolio. Playtex was a leading manufacturer and marketer of well-recognized brands such as Playtex® feminine care products, Playtex infant care products, Diaper Genie® diaper disposal systems, Wet Ones® pre-moistened wipes, Banana Boat® and Hawaiian Tropic® sun care products and Playtex household gloves.
In 2009, we completed the acquisition of the Edge® and Skintimate® shave preparation brands from S.C. Johnson & Son, Inc., adding United States ("U.S.") market leading shave preparation brands to our existing wet shave product portfolio. In 2010, we completed the acquisition of American Safety Razor, LLC ("ASR"), a leading global manufacturer of private label and value wet shaving razors and blades and specialty blades. ASR was founded in 1875.
Strengthening the company's feminine care product portfolio, in 2013, we acquired the Stayfree® pad, Carefree® liner and o.b.® tampon feminine hygiene brands in the U.S., Canada and the Caribbean from Johnson & Johnson.
On July 1, 2015, we completed the separation of our Household Products business, which manufactures and markets batteries and portable lighting, into a separate publicly-traded company (the "Spin" or the "Separation"). We completed the tax-free Separation by distributing 100% of the outstanding shares of common stock of Energizer SpinCo, Inc. to our shareholders. The newly formed company assumed the name Energizer Holdings, Inc. ("New Energizer") and began trading under the symbol "ENR" on the New York Stock Exchange ("NYSE"). Edgewell retained the Personal Care business and trades on the NYSE under the symbol "EPC." Following the Separation, we do not beneficially own any shares of New Energizer. In connection with the Separation, we changed our name to Edgewell Personal Care Company on June 30, 2015.
On October 31, 2016, we completed the acquisition of Bulldog Skincare Holdings Limited, a men's grooming and skincare products company based in the United Kingdom (the "U.K."). The acquisition created opportunities to expand our personal care portfolio into a growing global category to leverage our international geographic footprint.
6
Our Business Segments and Product Strategies
We manage our business in four reportable segments: Wet Shave, Sun and Skin Care, Feminine Care and All Other. Prior to the Separation, our business was managed in two reportable segments: Personal Care and Household Products. Prior periods have been recast to reflect our current segment reporting. Segment performance is evaluated based on segment profit, exclusive of general corporate expenses, share-based compensation costs, costs associated with restructuring initiatives and other items that are not representative of management's view on how segment performance is evaluated. Information regarding the product portfolios of these segments is included within the following discussion. Financial information regarding each of our reportable segments, as well as other geographical information, is included in Item 7. Management's Discussion and Analysis of Financial Condition and Results of Operations and in Note 18 of Notes to Consolidated Financial Statements included within Item 8. Financial Statements and Supplementary Data of this Annual Report on Form 10-K.
Wet Shave
Wet shave products are sold under the Schick®, Wilkinson Sword®, Edge, Skintimate, Shave Guard and Personna® brand names. We manufacture and distribute Schick and Wilkinson Sword razor systems, composed of razor handles and refillable blades, and disposable shave products for men and women. While we market our wet shave products throughout the world, our primary markets are the U.S., Canada, Japan, Germany, France and the U.K. We believe we hold the #2 global market share position in wet shaving. The category is competitive with manufacturers vying for consumer loyalty and retail shelf space.
We have gained recognition for our innovation designed to improve the shaving experience, including the introduction of our Schick Hydro men's shaving system in 2010. This system incorporated new technologies, including innovative skin protectors that act to smooth skin between blade tips and an advanced hydrating gel reservoir that lubricates throughout the shaving process. Schick Hydro is available in three- and five-blade models. Following the launch of Schick Hydro, we have introduced additional innovative products under the Hydro franchise, such as Schick Hydro Silk for women, including the Hydro Silk TrimStyle® razor introduced in 2015, the only 2-in-1 razor and trimmer, the Schick Hydro Power Select™, Schick Hydro 5 Groomer, and Schick Hydro men's and women's disposable razors. In 2016, we introduced the next generation of Schick Hydro with upgraded features for most aspects of the mechanical cartridge.
During 2017, we launched our first direct-to-consumer site in the U.S., featuring our new Hydro Connect™ innovation. Hydro Connect, which is also available in certain markets internationally, features cartridges with three- and five-blade Hydro technology that fit on Gillette® handles. Additionally, during 2017, we launched our Schick Quattro YOU™ disposables for women in North America, which have a unique SmoothProtect™ four-blade design to protect skin and a slimmer handle for greater control. We intend to continue to develop and expand across our Wet Shave brands, including Hydro, Quattro, Intuition and Xtreme 3.
In the U.S., Canada and Japan, we also sell market-leading shave preparation products, including shaving gels and creams under the Edge, Skintimate and Shave Guard brands.
We also manufacture, distribute and sell a complete line of private label and value-priced wet shaving disposable razors, shaving systems and replacement blades. These wet shave products are sold primarily under a retailer's store name or under value brand names such as Personna.
Our Wet Shave segment represented 60% of our net sales in each of fiscal 2017, 2016 and 2015. Our razors and blades represented 53% of our net sales in each of fiscal 2017, 2016 and 2015.
Sun and Skin Care
Sun and Skin Care products are sold under the Banana Boat, Hawaiian Tropic, Bulldog® and Wet Ones brand names. We market sun care products under the Banana Boat and Hawaiian Tropic brands and believe these brands, on a combined basis, hold a leading market share position in the U.S. sun care category. We compete across the full spectrum of sun care categories: general protection, sport, kids, baby, tanning and after sun. Outside the U.S., we believe we are also the leading sun care manufacturer in Australia and Mexico. We expect to continue to drive our worldwide business through innovation, increased distribution and geographic expansion.
Our Bulldog skincare products are purpose built for men and were created to work simply and efficiently while dealing with issues specific to men's skin. Since acquiring the brand in October 2016, we have expanded sales geographically and are committed to further growth and distribution for the brand. We also offer Wet Ones, the leader in the U.S. portable hand wipes category, and offered Playtex household gloves until the sale of this business in October 2017.
7
Our Sun and Skin Care segment represented 19%, 18% and 17% of our net sales during fiscal 2017, 2016 and 2015, respectively. Our sun care products represented 15%, 14% and 13% of our net sales during fiscal 2017, 2016 and 2015, respectively.
Feminine Care
In Feminine Care, we market products under the Playtex, Stayfree, Carefree and o.b. brands. We offer tampons under the Playtex Gentle Glide® 360°™, Playtex Sport®, Playtex and o.b. brands, including the new Playtex Sport compact tampon launched in 2017. We also market pads and liners under the Stayfree and Carefree brands. We believe we are one of the top three manufacturers of feminine care products in North America, with unique, competitive product technologies and well-known brands that address complementary consumer needs. We intend to continue to invest in innovation in our feminine care brands.
Our Feminine Care segment represented 15%, 16% and 16% of our net sales during fiscal 2017, 2016 and 2015, respectively.
All Other
Our All Other segment includes infant care, pet care and miscellaneous other products. In the infant care category, we market a broad range of products including bottles, cups and mealtime products under the Playtex brand name. We also offer a line of pacifiers, including the OrthoPro® and Binky® pacifiers. We believe our Playtex Diaper Genie brand of diaper disposal systems leads the U.S. diaper pail category. The Diaper Genie brand consists of the diaper pail unit and refill liners. We also market Litter Genie®, a waste disposal solution for cat owners originating from our Diaper Genie technology. The industrial business sold on September 1, 2015 was also included within our All Other segment.
Our All Other segment represented 6%, 6% and 7% of our net sales during fiscal 2017, 2016 and 2015, respectively.
Competition
The personal care product categories are highly competitive, both in the U.S. and on a global basis, as large manufacturers with global operations compete for consumer acceptance and, increasingly, limited retail shelf space. Competition is based upon brand perception, product performance, customer service and price.
The global shaving products category is comprised of wet shave blades and razors, electric shavers and shaving gels and creams. The wet shave segment of that business is further segmented between razor systems and disposable products. This category is characterized by high margins, significant barriers to entry and international growth opportunities. Geographically, North America, Western Europe, Australia and Japan represent relatively developed and stable markets. With our established product lines and global presence, we believe we compete effectively in this market. Our principal competitors in the global wet shave business are The Procter & Gamble Company, which owns the Gillette brand and is the leading company in the global wet shave segment, and Bic Group, which competes primarily in the disposable segment. We also compete with direct-to-consumer online competitors such as Dollar Shave Club, owned by Unilever, and Harry's.
The markets for sun and skin care, feminine care and other personal care products are also highly competitive, characterized by frequent introduction of new products, accompanied by major advertising and promotional programs. Our competitors in these markets consist of a large number of domestic and foreign companies, including The Procter & Gamble Company and Kimberly-Clark Corp. in feminine care; Bayer AG and Johnson & Johnson in sun and skin care; and a variety of competitors in the fragmented infant care market.
The market for sun care products is also characterized by global growth, and is impacted by trends in skin care. With our balanced sun care portfolio, depth of sun care expertise and global presence, we believe we compete effectively and have more than doubled our international sun care business since acquiring the Banana Boat and Hawaiian Tropic brands in 2008. We intend to continue to compete by driving innovation, building differentiated equity and focusing on in-store visibility.
The global men's skincare market is expected to continue to grow, with increased demand for men's personal care products. Our competitors in this market include large companies such as Johnson & Johnson, L'Oréal S.A., The Estee Lauder Companies, Inc. and Unilever, as well as smaller companies. We compete by creating simple and effective skincare products with natural ingredients at an affordable price.
With our fiscal 2014 acquisition of the Stayfree, Carefree and o.b. brands, we have expanded our presence within the feminine care product category and have become one of the top three manufacturers in North America. We compete by having a portfolio of well-known brands that address complementary consumer needs.
8
Sales and Distribution
Our products are marketed primarily through a direct sales force, but also through exclusive and non-exclusive distributors and wholesalers. In the U.S., Japan and the larger countries of Western Europe and Latin America, we have dedicated commercial organizations, reflecting the scale and importance of these businesses. During fiscal 2015, in order to compete more effectively in smaller markets after the Separation, we increased our use of third-party distributors and wholesalers and either decreased or eliminated our business operations in certain countries. As a result of increased competition through the expansion of online markets, we launched our first direct-to-consumer site in the U.S. during 2017, SchickHydro.com. Additionally, we have expanded our eRetail offerings through Amazon.com in the U.S. and Europe, and with T-Mall in China. We distribute our products to consumers through numerous retail locations worldwide, including mass merchandisers and warehouse clubs, food, drug and convenience stores, military stores and e-commerce.
Although a large percentage of our sales are attributable to a relatively small number of retail customers, only Wal-Mart Stores, Inc. and its subsidiaries ("Wal-Mart"), as a group, account for more than 10% of our consolidated annual net sales. Wal-Mart accounted for approximately 23% of our net sales from continuing operations in fiscal 2017. Purchases by Wal-Mart included products from all of our segments. Target Corporation represented approximately 10% and 14% of net sales for our Sun and Skin Care and All Other segments, respectively, for fiscal 2017.
Generally, orders are shipped within a month of their order date. Because of the short period of time between order and shipment dates, the dollar amount of current backlog is not material and is not considered to be a reliable indicator of future sales volume.
Government contracts do not represent a material portion of our net sales.
Seasonality
Customer orders for sun care products within our Sun and Skin Care segment are highly seasonal, which has historically resulted in higher sun care sales to retailers during the late winter through mid-summer months. Within our Wet Shave segment, sales of women's products are moderately seasonal, with increased consumer demand in the spring and summer months. See "Our business is subject to seasonal volatility" in Item 1A. Risk Factors.
Sources and Availability of Raw Materials
The principal raw materials used in our products include steel, various plastic resins, plastic based components, textile fibers and non-woven fabrics, organic and inorganic chemicals, soap based lubricants and plastic-pulp based packaging. These materials are sourced on a regional or global basis, as applicable, and are generally available from multiple sources. Price and availability of our raw materials fluctuate over time. While we have confidence our supply assurance plans adequately support our current operational needs, we cannot predict the future with certainty. Both price and supply are subject to risk from global socio- and macroeconomic influences such as, but not exclusive to, force majeure, loss or impairment to key manufacturing sites, transportation, government regulation, currency or other unforeseen circumstances. In the past, we have avoided significant interruption in the availability of our input materials and believe our extensive experience in procurement allows us to manage these risks effectively.
Patents, Technology and Trademarks
We own a number of U.S., Canadian and foreign trademarks, which we consider of substantial importance and which are used individually or in conjunction with our other trademarks. These include, but are not limited to: Edgewell, Schick, Schick Hydro, Schick Hydro Silk, Hydro Connect, Wilkinson Sword, Intuition, Quattro, Xtreme 3, Protector, Silk Effects, Slim Twin, Edge, Skintimate, Personna, Banana Boat, Hawaiian Tropic, Bulldog, Binky, Diaper Genie, Litter Genie, Drop-Ins, Gentle Glide, 360°, Play On, Twist 'N Click, Sport, Sport Level Protection, VentAire, Wet Ones, Stayfree, Carefree and o.b. As a result of the Playtex acquisition, we also own royalty-free licenses in perpetuity to the Playtex trademark in the U.S., Canada and many foreign jurisdictions related to certain feminine hygiene, baby care and other products, but excluding certain apparel-related products.
9
Our ability to compete effectively in the wet shave, sun and skin care, feminine care and other personal care categories depends, in part, on our ability to maintain the proprietary nature of technology and manufacturing processes through a combination of patent and trade secret protection, non-disclosure agreements and licensing agreements. We own or license from third parties a considerable number of patents, patent applications and other technology, which we believe are significant to our business. These relate primarily to shaving product improvements and additional features, feminine care hygiene products including digital and applicator tampons, pads and liners, baby bottles and nipples, disposable liners and plastic holders for nurser systems, children's drinking cups, pacifiers, sunscreen formulations, diaper disposal systems, pet care and pet waste disposal products, and manufacturing processes.
As of September 30, 2017, we owned, either directly or beneficially, approximately 916 unexpired U.S. patents, which have a range of expiration dates from October 2017 to December 2036, and we had approximately 169 U.S. patent applications pending. We routinely prepare additional patent applications for filing in the U.S., as well as actively pursue foreign patent protection in various foreign countries. As of September 30, 2017, we owned, either directly or beneficially, approximately 2,237 foreign patents having a range of expiration dates from October 2017 to May 2041, and we had approximately 338 patent applications pending in foreign countries.
We rely on trademark, trade secret, patent and copyright laws to protect our intellectual property rights. We cannot be sure that these intellectual property rights will be effectively utilized or, if necessary, successfully asserted. There is a risk that we will not be able to obtain and perfect our own intellectual property rights, or, where appropriate, license from others intellectual property rights.
Governmental Regulation and Environmental Matters
Our operations are subject to various federal, state, foreign and local laws and regulations intended to protect the public health and environment.
Contamination has been identified at certain of our current and former facilities, as well as third-party waste disposal sites, and we are conducting investigation and remediation activities in relation to such properties. In connection with certain sites, we have received notices from the U.S. Environmental Protection Agency ("EPA"), state agencies and private parties seeking contribution, that we have been identified as a potentially responsible party ("PRP") under the Comprehensive Environmental Response, Compensation and Liability Act, and may be required to share in the cost of cleanup with respect to a number of federal "Superfund" sites. We may also be required to share in the cost of cleanup with respect to state-designated sites, and certain international locations, as well as any of our own properties.
The amount of our ultimate liability in connection with those sites may depend on many factors, including the volume and toxicity of material contributed to the site, the number of other PRPs and their financial viability, and the remediation methods and technology to be used. Total environmental capital expenditures and operating expenses are not expected to have a material effect on our total capital and operating expenditures, cash flows, earnings or competitive position. Current environmental spending estimates could be modified as a result of changes in our plans or our understanding of the underlying facts, changes in legal requirements, including any requirements related to global climate change, or other factors.
Many European countries, as well as the European Union (the "E.U."), have been very active in adopting and enforcing environmental regulations. As such, it is possible that new regulations may increase the risk and expense of doing business in such countries.
Certain of our products are subject to regulation under the U.S. Federal Food, Drug and Cosmetic Act and are regulated by the U.S. Food and Drug Administration ("FDA").
Employees
As of September 30, 2017, we employed approximately 6,000 employees, with approximately 2,400 based in the U.S. Certain of these employees are represented by unions or work councils. We believe that we generally have a good relationship with our employees, and with the unions and work councils that represent certain employees.
10
Executive Officers
Set forth below are the names, ages as of September 30, 2017, and current positions of our executive officers.
Name | Age | Title |
David P. Hatfield | 57 | Chief Executive Officer, President and Chairman of the Board |
Sandra J. Sheldon | 55 | Chief Financial Officer |
Colin A. Hutchinson | 59 | Chief Operating Officer |
Anthony J. Bender | 59 | Chief Information Officer and Vice President of Global Business Services |
Peter J. Conrad | 57 | Chief Administrative Officer |
Elizabeth E. Dreyer | 55 | Vice President, Controller and Chief Accounting Officer |
John N. Hill | 54 | Vice President, Global Human Resources |
Manish R. Shanbhag | 47 | Chief Legal Officer, Chief Compliance Officer and Secretary |
Set forth below is a brief description of the position and business experience of each of our executive officers.
David P. Hatfield has served as the Chairman of our Board since July 6, 2016. Mr. Hatfield has been our Chief Executive Officer and President since July 1, 2015. From October 2007 to July 1, 2015, he served as President and Chief Executive Officer of the Energizer Personal Care division commencing upon our acquisition of Playtex in October 2007. In 2007, Mr. Hatfield was named President and Chief Executive Officer of Schick-Wilkinson Sword. From 2004 to 2007, he served as the Executive Vice President and Chief Marketing Officer. Prior to 2004, he held various other positions within the Company since joining Ralston Purina Company in 1986.
Sandra J. Sheldon has served as Chief Financial Officer since July 1, 2015. Previously Ms. Sheldon had been the Vice President of Financial Planning and Analysis since 2012. Prior to that she served as the Vice President of Finance for Schick-Wilkinson Sword and Energizer Personal Care from 2006 to 2012. Ms. Sheldon joined Ralston Purina in 1986 and began her career at PricewaterhouseCoopers.
Colin A. Hutchinson has served as Chief Operating Officer since April 4, 2017. Mr. Hutchinson had served as the Company's Vice President Commercial, International since July 1, 2015. From January 2011 to July 1, 2015, Mr. Hutchinson served as Vice President and General Manager of the Company's Private Brands Group, and prior to that as Vice President for Schick-Wilkinson Sword and Personal Care in Europe since joining the Company in 2004. Prior to joining the Company, Mr. Hutchinson held various positions at consumer goods business based in Europe including United Biscuits and the Campbell's Soup Company.
Anthony J. Bender has served as Chief Information Officer and Vice President of Global Business Services since July 1, 2015. Previously, Mr. Bender served as Vice President, Chief Information Officer of Energizer Holdings, Inc. since February 2012. Prior to this, Mr. Bender served as the Vice President, IT at Unilever, Vice President and Chief Information Officer at Alberto Culver Company, Senior Vice President and Chief Information Officer at The Relizon Company, and various other senior leadership positions.
Peter J. Conrad has served as Chief Administrative Officer since July 1, 2015. Prior to this, Mr. Conrad served as our Vice President, Human Resources since 2000. Mr. Conrad joined Eveready Battery Company, Inc. in 1997 and served as Vice President, Human Resources from 1997 to 2000. He had previously served as Vice President, Human Resources for Protein Technologies International, Inc., a former subsidiary of Ralston Purina Company, from 1995 to 1997. Mr. Conrad's last day with the Company will be November 30, 2017.
Elizabeth E. Dreyer has served as Vice President, Controller and Chief Accounting Officer since July 1, 2015. Ms. Dreyer served in the same position for the Personal Care business prior to the Separation, since January 2015. Prior to joining the Company, Ms. Dreyer was Vice President, Controller and Chief Accounting Officer of Hillenbrand Inc. from 2010 to 2014. She previously held positions as Vice President of Finance with Zimmer Corp., Chief Financial Officer of Createc Corporation, Vice President of Organizational Effectiveness of ADESA and Manager of Corporate Accounting and Financial Reporting of Guidant Corporation. Ms. Dreyer began her career with Deloitte and is a Certified Public Accountant.
John N. Hill has served as Vice President, Global Human Resources since April 4, 2017. Mr. Hill had previously led the North America commercial organization as the Company's Vice President, North America since July 1, 2015, and as the VP, North America Commercial of Energizer's Personal Care division from 2007 to 2015. Mr. Hill joined the Company in 2003 as General Manager Schick Canada following the acquisition of Schick-Wilkinson Sword from Pfizer, Inc. Prior to joining the Company, Mr. Hill held various positions at other international consumer product companies, including Warner-Lambert Company, Kraft and General Foods.
11
Manish R. Shanbhag has served as Chief Legal Officer, Chief Compliance Officer and Secretary since July 1, 2015. Mr. Shanbhag began working at the Company in 2013 as the Vice President and Deputy General Counsel. Prior to 2013, Mr. Shanbhag was general counsel of Honeywell's Life Safety business. Previously, he was with The Gillette Company, where he held various roles within the legal department.
Available Information
Our website address is www.edgewell.com. We are not including the information contained on our website as part of, or incorporating it by reference into, this filing. We make available to the public on our website, free of charge, our Annual Reports on Form 10-K, Quarterly Reports on Form 10-Q, Current Reports on Form 8-K and amendments to those reports filed or furnished pursuant to Section 13(a) or 15(d) of the Securities Exchange Act of 1934 as soon as reasonably practicable after such material is electronically filed with, or furnished to, the U.S. Securities and Exchange Commission ("SEC"). Our reports filed with, or furnished to, the SEC may be read and copied at the SEC's Public Reference Room at 100 F Street, N.E. Washington, DC 20549. Investors may obtain information on the operation of the Public Reference Room by calling the SEC at 1-800-SEC-0330. These filings are also available on the SEC's website at www.sec.gov.
Item 1A. Risk Factors.
The following risks and uncertainties could materially adversely affect our business, results of operations, financial condition and cash flows. We may amend or supplement the risk factors described below from time to time in other reports we file with the SEC.
Risks Related to Our Business
We face risks associated with global economic conditions.
Unfavorable global economic conditions, unemployment levels and uncertainty about future economic prospects could reduce consumer demand for our products as a result of a reduction in discretionary spending or a shift of purchasing patterns to lower-cost options such as private label brands sold by retail chains, which could drive the market towards lower margin product and force us to reduce prices for our products in order to compete. Similarly, our retailer customers could reduce their inventories, shift to different products or require us to lower our prices to retain the shelf placement of our products. Declining financial performance by certain of our retailer customers could impact their ability to pay us on a timely basis, or at all. Worsening economic conditions could harm our sales and profitability. Additionally, disruptions in financial markets could reduce our access to debt and equity capital markets, negatively affecting our ability to implement our business plan and strategy.
Competition in our industries may hinder our ability to execute our business strategy, achieve profitability, or maintain relationships with existing customers.
The categories in which we operate are mature and highly competitive, both in the U.S. and globally, as a limited number of large manufacturers compete for consumer acceptance, limited retail shelf space and e-commerce opportunities. Because of the highly competitive environment in which we operate as well as increasing retailer concentration, our retailer customers, including online retailers, frequently seek to obtain pricing concessions or better trade terms, resulting in either reduction of our margins or losses of distribution to lower cost competitors. Competition is based upon brand perceptions, product performance and innovation, customer service and price. Our ability to compete effectively may be affected by a number of factors, including:
• | our primary competitor in wet shave and feminine care products, The Procter & Gamble Company, as well as Unilever and our other competitors, may have substantially greater financial, marketing, research and development and other resources and greater market share in certain segments than we do, which could provide them with greater scale and negotiating leverage with retailers and suppliers; |
• | our competitors may have lower production, sales and distribution costs, and higher profit margins, which may enable them to offer aggressive retail discounts and other promotional incentives; |
12
• | our competitors may be able to obtain exclusive distribution rights at particular retailers or favorable in-store placement; and |
• | we may lose market share to private label brands sold by retail chains, or to price brands sold by local and regional competitors, which, in each case, are typically sold at lower prices than our products. |
Loss of any of our principal customers could significantly decrease our sales and profitability.
Wal-Mart, together with its subsidiaries, is our largest customer, accounting for approximately 23% of our net sales from continuing operations in fiscal 2017. Generally, sales to our top customers are made pursuant to purchase orders and we do not have supply agreements or guarantees of minimum purchases from them. As a result, these customers may cancel their purchase orders or reschedule or decrease their level of purchases from us at any time. The loss or a substantial decrease in the volume of purchases by any of our top customers would harm our sales and profitability. Increasing retailer customer concentration could result in reduced sales outlets for our products, as well as greater negotiating pressures and pricing requirements.
Our inability to execute a successful e-commerce strategy could have a significant impact on our business.
Sales of consumer products via e-commerce is a relatively new sales channel that has gained increasing acceptance among end user customers and could result in a change in the retail environment. The Company is engaged in e-commerce sales channels with respect to many of its products; however, if e-commerce and other new sales channels were to take significant market share away from traditional retailers, and if we are not successful in achieving sales growth in these new sales channels, our business, financial condition and results of operations may be negatively impacted. For example, the acquisition of the Dollar Shave Club e-commerce wet shave platform by Unilever provides this competitor certain financial, marketing and research and development resources, which could provide them greater scale and leverage with suppliers and customers. While we are establishing a variety of e-commerce initiatives, there can be no assurances that these initiatives will be successful.
Changes in production costs, including raw material prices, could erode our profit margins and negatively impact operating results.
Pricing and availability of raw materials, energy, shipping and other services needed for our business can be volatile due to general economic conditions, labor costs, production levels, import duties and tariffs and other factors beyond our control. There is no certainty that we will be able to offset future cost increases. This volatility can significantly affect our production cost, and may, therefore, have a material adverse effect on our business, results of operations and financial condition.
Loss of reputation of our leading brands or failure of our marketing plans could have an adverse effect on our business.
We depend on the continuing reputation and success of our brands, particularly the Schick, Wilkinson Sword, Edge, Skintimate, Playtex, Diaper Genie, Wet Ones, Banana Boat, Hawaiian Tropic, Bulldog, Stayfree, Carefree and o.b. brands. Our operating results could be adversely affected if one of our leading brands suffers damage to its reputation due to real or perceived quality issues. Further, the success of our brands can suffer if our marketing plans or new product offerings do not improve, or have a negative impact on, our brands' image or ability to attract and retain consumers. Additionally, if claims made in our marketing campaigns become subject to litigation alleging false advertising, it could damage our brand, cause us to alter our marketing plans in ways that may materially and adversely affect sales, or result in the imposition of significant damages against us. Further, a boycott or other campaign critical of us, through social media or otherwise, could negatively impact our brands' reputation and, consequently, our products' sales.
We are subject to risks related to our international operations, including currency fluctuations, which could adversely affect our results of operations.
Our businesses are conducted on a worldwide basis, with nearly 42% of our sales in fiscal 2017 arising outside the U.S., and a significant portion of our production capacity and cash are located overseas. Consequently, we are subject to a number of risks associated with doing business in foreign countries, including:
• | the possibility of expropriation, confiscatory taxation or price controls; |
13
• | the inability to repatriate foreign-based cash, which constitutes substantially all of our overall cash, for strategic needs in the U.S., either at all or without incurring significant income tax and earnings consequences, as well as the heightened counterparty, internal control and country-specific risks associated with holding cash overseas; |
• | the effect of foreign income taxes, value-added taxes and withholding taxes, including the inability to recover amounts owed to us by a government authority without extended proceedings or at all; |
• | the effect of the U.S. tax treatment of foreign source income and losses, and other restrictions on the flow of capital between countries; |
• | adverse changes in local investment or exchange control regulations; |
• | restrictions on and taxation of international imports and exports; |
• | currency fluctuations, including the impact of hyper-inflationary conditions, particularly where exchange controls limit or eliminate our ability to convert from local currency; |
• | political or economic instability, government nationalization of business or industries, government corruption, and civil unrest, including political or economic instability; |
• | legal and regulatory constraints, including tariffs and other trade barriers; |
• | difficulty in enforcing contractual and intellectual property rights; and |
• | the impact of fluctuations in foreign currency. A significant portion of our sales are denominated in local currencies but reported in U.S. dollars, and a high percentage of product costs for such sales are denominated in U.S. dollars. Although we may hedge a portion of the exposure, the strengthening of the U.S. dollar relative to such currencies can negatively impact our reported sales and operating profits. |
One or more of these factors could harm our international operations or investments and our operating results.
We face risks arising from our ongoing efforts to achieve cost savings.
In the normal course of business, we may initiate projects which change our footprint or our operations in order to gain efficiencies and reduce costs. The execution of cost savings initiatives may present a number of significant risks, including:
• | actual or perceived disruption of service or reduction in service standards to customers; |
• | the failure to preserve adequate internal controls as we restructure our general and administrative functions, including our information technology and financial reporting infrastructure; |
• | the failure to preserve supplier relationships and distribution, sales and other important relationships and to resolve conflicts that may arise; |
• | loss of sales as we reduce or eliminate staffing on non-core product lines; |
• | diversion of management attention from ongoing business activities; and |
• | the failure to maintain employee morale and retain key employees while implementing benefit changes and reductions in the workforce. |
Because of these and other factors, we cannot predict whether we will realize the purpose and anticipated benefits of these initiatives and, if we do not, our business and results of operations may be adversely affected.
In fiscal 2016 we announced a company-wide Zero Based Spending program, which is one of our productivity initiatives designed to capture savings and establish cost-conscious spending policies that are consistent with our strategic needs. The anticipated savings will provide ongoing financial and operational flexibility for reinvestment to reinforce both the growth and margin improvement objectives in our financial algorithm. Our Zero Based Spending program follows on three years of productivity initiatives, as well as the initiatives launched with the overall Separation program, and is complementary to our overall trade promotion management project focused on improving productivity in our trade promotion spending. The achievement of our savings targets depends on our ability to successfully identify and realize savings opportunities. Events and circumstances, such as financial or strategic difficulties, delays and unexpected costs may occur that could result in our not realizing all of the anticipated benefits or our not realizing the anticipated benefits on our expected timetable. If we are unable to realize the anticipated savings, our business, results of operations, cash flows and financial condition may be adversely affected.
14
If we cannot continue to develop new products in a timely manner, and at favorable margins, we may not be able to compete effectively.
The wet shave, sun and skin care, feminine care and other personal care industries in which we compete have been known for the pace of innovations in product life, product design and applied technology, and our success depends on our future innovations. The successful development and introduction of new products requires retail and consumer acceptance and overcoming the reaction from competitors. New product introductions in categories where we have existing products will likely also reduce sales of our existing products. Our investments in research and development may not result in successful products or innovation that will recover the costs of such investments. Our customers or end consumers may not purchase our new products once introduced. Additionally, new products could require regulatory approval which may not be available or may require modification to the product which could impact product success. Our competitors may introduce new or enhanced products that significantly outperform ours, or develop manufacturing technology that permits them to manufacture at a lower cost relative to ours and sell at a lower price. If we fail to develop and launch successful new products, or fail to reduce our cost structure to a competitive level, we may be unable to grow our business and compete successfully.
We may not be able to continue to identify and complete strategic acquisitions and effectively integrate acquired companies to achieve desired financial benefits.
We have completed a number of significant acquisitions and we expect to continue making acquisitions if appropriate opportunities arise. Acquisitions could be a key use of our cash and a potential driver of future growth. However, we may not be able to identify and successfully negotiate suitable strategic acquisitions at attractive valuations, obtain financing for future acquisitions on satisfactory terms or otherwise complete future acquisitions. As a result of the Separation, our reduced size may make completing desirable acquisitions more challenging.
If we can complete future acquisitions, we may face significant challenges in consolidating functions and effectively integrating procedures, personnel, product lines, and operations in a timely and efficient manner. The integration process can be complex and time consuming, may be disruptive to our existing and acquired business and may cause an interruption of, or a loss of momentum in, the business. Even if we can successfully complete the integration of acquired businesses into our operations, there is no assurance that anticipated cost savings, synergies, or revenue enhancements will be realized within the expected time frame, or at all.
A failure of a key information technology system or a breach of our information security could adversely impact our ability to conduct business.
We rely extensively on information technology systems in order to conduct business, including some that are managed by third-party service providers. These systems include, but are not limited to, programs and processes relating to internal and external communications, ordering and managing materials from suppliers, converting materials to finished products, shipping products to customers, processing transactions, summarizing and reporting results of operations, and complying with regulatory, legal or tax requirements. These information technology systems could be damaged or cease to function properly due to the poor performance or failure of third-party service providers, catastrophic events, power outages, network outages, failed upgrades or other similar events. If our business continuity plans do not effectively resolve such issues on a timely basis, we may suffer interruptions in conducting our business which may adversely impact our operating results.
Further, our systems and networks, as well as those of our retailer customers, suppliers, service providers, and banks, may become the target of cyber-attacks or information security breaches, which in turn could result in the unauthorized release and misuse of confidential or proprietary information about our Company, employees, customers or consumers, as well as disrupt our operations or damage our facilities or those of third parties. As a result, a cyber-attack could negatively impact our net sales and increase our operating and capital costs. In addition, our employees frequently access our supplier's and customer's systems and we may be liable if our employees are the source of any breaches in these third-party systems. It could also damage our reputation with retailer customers and consumers and diminish the strength and reputation of our brands, or require us to pay monetary penalties. We may also be required to incur additional costs to modify or enhance our systems in order to try to prevent or remediate any such attacks.
15
Our business is subject to increasing global regulation, including product related regulations and environmental regulations, that may expose us to significant liabilities.
The manufacture, packaging, labeling, storage, distribution, advertising and sale of our products are subject to extensive regulation. For example, our products are regulated by health authorities (such as the Food and Drug Administration in the U.S.) and consumer protection organizations (such as the Consumer Product Safety Commission in the U.S.). These regulatory frameworks focus on our ingredients as well as the safety and efficacy of our products. Similarly, the advertising and marketing of our products is regulated by agencies such as the Federal Trade Commission in the U.S. All of these regulatory frameworks exist at the federal, state and local level in the United States as well as in foreign countries where we sell our products. New or more restrictive regulations or more restrictive interpretations of existing regulations are likely and could lead to additional compliance cost and have an adverse impact on our business. Additionally, a finding that we are in violation of, or not in compliance with, applicable laws or regulations could subject us to material civil remedies, including fines, damages, injunctions or product recalls, or criminal sanctions. Even if a claim is unsuccessful, is not merited or is not fully pursued, the negative publicity surrounding such assertions could jeopardize our reputation and brand image and have a material adverse effect on our businesses, as well as require resources to rebuild our reputation.
We must comply with various environmental laws and regulations in the jurisdictions in which we operate, including those relating to the handling and disposal of solid and hazardous wastes and the remediation of contamination associated with the use and disposal of hazardous substances. A release of such substances due to accident or an intentional act could result in substantial liability to governmental authorities or to third parties. Pursuant to certain environmental laws, we could be subject to joint and several strict liability for contamination relating to our or our predecessors' current or former properties or any of their respective third-party waste disposal sites. In addition to potentially significant investigation and remediation costs, any such contamination can give rise to claims from governmental authorities or other third-parties for natural resource damage, personal injury, property damage or other liabilities. We have incurred, and will continue to incur, capital and operating expenses and other costs in complying with environmental laws and regulations, including remediation costs relating to our current and former properties and third-party waste disposal sites. As new laws and regulations are introduced, we could become subject to additional environmental liabilities in the future that could cause a material adverse effect on our results of operations or financial condition.
Our access to capital markets and borrowing capacity could be limited.
Our access to capital markets to raise funds through the sale of debt or equity securities is subject to various factors, including general economic and financial market conditions. Significant reduction in market liquidity conditions could impact access to funding and increase associated funding costs, which could reduce our earnings and cash flows. Additionally, disruptions in financial markets could reduce our access to debt and equity capital markets, negatively affecting our ability to implement our business plan and strategy.
Our access to debt financing at competitive risk-based interest rates is partly a function of our credit ratings. The major credit rating agencies periodically evaluate our creditworthiness and have assigned us credit ratings. These ratings are based on a number of factors, which include our financial strength and financial policies as well as our strategies, operations and execution. A downgrade to our credit ratings could increase our interest rates, limit our access to public debt markets, limit the institutions willing to provide us credit facilities, result in more restrictive credit arrangements and make any future credit facilities or credit facility amendments more costly and difficult to obtain.
16
Impairment of our goodwill and other intangible assets would result in a reduction in net income.
We have a material amount of goodwill, trademarks and other intangible assets, as well as other long-lived assets, which are periodically evaluated for impairment in accordance with current accounting standards. Declines in our profitability and estimated cash flows related to specific intangible assets, as well as potential changes in market valuations for similar assets and market discount rates, may result in an impairment charge, which could have an adverse impact on our operating results.
For example, during the fourth quarter of fiscal 2015, we completed impairment testing on indefinite-lived intangible assets other than goodwill, which consist of trademarks and brand names used across our segments. We determined that the carrying values of our Playtex, Wet Ones and Skintimate brand names were above their fair values, resulting in a non-cash asset impairment charge of $318.2 million. During the fourth quarter of fiscal 2016, we completed our annual impairment testing and found the carrying value of our Skintimate brand name to be above the fair value, resulting in an additional non-cash asset impairment charge of $6.5 million. As of October 1, 2016, the Skintimate brand name was converted to a definite-lived asset and assigned a useful life of 20 years. During the fourth quarter of fiscal 2017, we completed our annual impairment testing and found the carrying values of our Playtex and Edge brand names to be above the fair value, resulting in a non-cash asset impairment charge of $312.0 and $7.0, respectively. Both Playtex and Edge brand names have been converted to a definite-lived asset with a useful life of 20 years The carrying value of our Wet Ones brand name was reduced to the determined fair value in fiscal 2015. As such, the intangible asset will be sensitive in the future to changes in forecasted cash flows, as well as other assumptions used in an impairment analysis, including discount rates.
Legislative changes in applicable tax laws, policies and regulations or unfavorable resolution of tax matters may result in additional tax liabilities, which could adversely impact our cash flows and results of operations.
Our businesses are subject to taxation in the U.S. and multiple foreign jurisdictions. The U.S. is considering corporate tax reform that may significantly change the corporate tax rate and the U.S. International tax rules. In addition, international tax reform remains a priority with the Organization for Economic Cooperation and Development’s Action Plan on Base Erosion & Profit Shifting and other proposed foreign jurisdictional tax law changes. Given the uncertainty of the potential changes we are unable to determine whether the net consolidated impact would be positive or negative. However, the impact of any legislative tax law, policy or regulation changes by federal, state and local and foreign authorities may result in additional tax liabilities which could adversely impact our cash flows and results of operations.
Significant estimation and judgment is required in determining our provisions for taxes in the U.S. and jurisdictions outside the U.S. In the ordinary course of our business, there are transactions and calculations in which the ultimate tax determination is uncertain. We are regularly under audit by tax authorities, and although we believe our tax positions are defensible and our tax provision estimates are reasonable, the final outcome of tax audits and related litigation could be materially different than that reflected in our income tax provisions and accruals. The unfavorable resolution of any audits or litigation could have an adverse impact on future operating results and our financial condition. More aggressive and assertive tax collection policies, particularly in jurisdictions outside the U.S., may increase the costs of resolving tax issues and enhance the likelihood that we will have increased tax liabilities going forward.
Our manufacturing facilities, supply channels or other business operations may be subject to disruption from events beyond our control.
Operations of our manufacturing and packaging facilities worldwide, and of our corporate offices, and the methods we use to obtain supplies and to distribute our products, may be subject to disruption for a variety of reasons, including availability of raw materials, work stoppages, industrial accidents, disruptions in logistics, loss or impairment of key manufacturing sites, product quality or safety issues, licensing requirements and other regulatory issues, trade disputes between countries in which we have operations, and acts of war, terrorism, pandemics, fire, earthquake, hurricanes, flooding or other natural disasters. The supply of our raw materials may be similarly disrupted. There is also a possibility that third-party manufacturers, which produce a significant portion of certain of our products, could discontinue production with little or no advance notice, or experience financial problems or problems with product quality or timeliness of product delivery, resulting in manufacturing delays or disruptions, regulatory sanctions, product liability claims or consumer complaints. If a major disruption were to occur, it could result in delays in shipments of products to customers or suspension of operations. We maintain business interruption insurance to potentially mitigate the impact of business interruption, but such coverage may not be sufficient to offset the financial or reputational impact of an interruption.
17
We have a substantial level of indebtedness and are subject to various covenants relating to such indebtedness, which could limit our discretion to operate and grow our business.
As of September 30, 2017, our debt level was approximately $1.5 billion. We may be required to dedicate a substantial portion of our cash to debt service, thereby reducing funds available to fund working capital, capital expenditures, acquisitions and investments and other general corporate purposes. Our failure to make scheduled interest payments or to repay or refinance the indebtedness at maturity or obtain additional financing as needed could have a material adverse effect on our business.
Additionally, certain of our debt instruments are subject to certain financial and other covenants, including debt ratio tests. We may be in breach of such covenants in the event of future declines in our operating cash flows or earnings performance, foreign currency movements or other events. In the event of such breach, our lenders may be entitled to accelerate the related debt as well as any other debt to which a cross-default provision applies, and we could be required to seek amendments or waivers under the debt instruments or to refinance the debt. There is no assurance that we would obtain such amendments or waivers or effect such refinancing, or that we would be able to do so on terms similar to our current debt instruments. The covenants and financial ratio requirements contained in our debt instruments could also increase our vulnerability to general adverse economic and industry conditions, limit our flexibility in planning for, or reacting to, changes in our business and the markets in which we operate, place us at a competitive disadvantage relative to our competitors that have greater financial flexibility or limit, among other things, our ability to borrow additional funds as needed or take advantage of business opportunities as they arise.
Our business is subject to seasonal volatility.
Customer orders for sun care products within our Sun and Skin Care segment are highly seasonal, which has historically resulted in higher sun care sales to retailers during the late winter through mid-summer months. Accordingly, our sales, financial performance, working capital requirements and cash flow may experience volatility during these periods. Further, purchases of our sun care products can be significantly impacted by unfavorable weather conditions during the summer period, and as a result we may suffer decreases in net sales if conditions are not favorable for use of our products, which could in turn have a material adverse effect on our financial condition, results of operation and cash flows. Within our Wet Shave segment, sales of women's products are moderately seasonal, with increased consumer demand in the spring and summer months.
There can be no guarantee that we will repurchase stock.
Although the Board has authorized a share repurchase program, and we repurchased approximately 2.2 million of our shares in fiscal 2017 for $165.4 million, any determination to repurchase or to continue to repurchase our common shares will be based primarily upon our financial condition, results of operations, available U.S. cash, business requirements and the Board's continuing determination that the repurchase program is in the best interests of shareholders and is in compliance with all laws and agreements applicable to the repurchase program.
We do not expect to pay dividends for the foreseeable future.
Following the completion of the Separation, the Board eliminated the quarterly cash dividend payable on our common shares, which had been in effect prior to that time, and we do not currently expect to declare or pay dividends on our common shares for the foreseeable future. Instead, we intend to retain earnings to finance the growth and development of our business, for our share repurchase program and for working capital and general corporate purposes. Any payment of dividends will be at the discretion of the Board and will depend upon various factors then existing, including earnings, financial condition, results of operations, capital requirements, level of indebtedness, contractual restrictions with respect to payment of dividends, restrictions imposed by applicable law, general business conditions and other factors that the Board may deem relevant. As a result, you may not receive any return on an investment in our capital stock in the form of dividends.
18
If we fail to adequately protect our intellectual property rights, competitors may manufacture and market similar products, which could adversely affect our market share and results of operations.
The vast majority of our total net sales are from products bearing proprietary trademarks and brand names. In addition, we own or license from third parties a considerable number of patents, patent applications and other technology. We rely on trademark, trade secret, patent and copyright laws to protect our intellectual property rights. There is a risk that we will not be able to obtain and perfect or maintain our own intellectual property rights or, where appropriate, license intellectual property rights necessary to support new product introductions. In addition, even if such rights are protected in the U.S., the laws of some other countries in which our products are or may be sold do not protect intellectual property rights to the same extent as the laws of the U.S. Our intellectual property rights could be invalidated, circumvented or challenged in the future, and we could incur significant costs in connection with legal actions relating to such rights. As patents expire, we could face increased competition or decreased royalties, either of which could negatively impact our operating results. If other parties infringe our intellectual property rights, they may dilute the value of our brands in the marketplace, which could diminish the value that consumers associate with our brands and harm our sales.
Our financial results could be adversely impacted by the United Kingdom's departure from the European Union.
On June 23, 2016, the United Kingdom (the "U.K.") held a referendum in which voters approved an exit from the E.U., commonly referred to as "Brexit," and on March 29, 2017, the U.K. began the process to withdraw from the E.U. As a result, the global markets and currencies have been adversely impacted, including a sharp decline in the value of the British Pound as compared to the U.S. dollar and other foreign currencies. Volatility in exchange rates is expected to continue as the U.K. negotiates its exit from the E.U. Given the lack of comparable precedent, the implications of Brexit or how such implications might affect us and our operations are unclear. Brexit could, among other things, disrupt trade and the free movement of goods, services and people between the U.K. and the E.U. or other countries, as well as create legal and global economic uncertainty. For fiscal 2017, net sales of our U.K. operations were 4.0% of our consolidated net sales. In addition, the Company completed the acquisition of Bulldog Skincare Holdings Limited on October 31, 2016, which is based in the U.K. These and other potential implications of Brexit could adversely affect our business and financial results.
Our business involves the potential for product liability and other claims against us, which could affect our results of operations and financial condition and result in product recalls or withdrawals.
We face exposure to claims arising out of alleged defects in our products, including for property damage, bodily injury or other adverse effects. We maintain product liability insurance, but this insurance does not cover all types of claims, particularly claims other than those involving personal injury or property damage or claims that exceed the amount of insurance coverage. Further, we may not be able to maintain such insurance in sufficient amounts, on desirable terms, or at all, in the future. In addition to the risk of monetary judgments not covered by insurance, product liability claims could result in negative publicity that could harm our products' reputation and in certain cases require a product recall. Product recalls or product liability claims, and any subsequent remedial actions, could have a material adverse effect on our business, reputation, brand value, results of operations and financial condition.
Our business could be negatively impacted as a result of stockholder activism or an unsolicited takeover proposal or a proxy contest.
In recent years, proxy contests and other forms of shareholder activism have been directed against numerous public companies. If a proxy contest or an unsolicited takeover proposal was made with respect to us, we could incur significant costs in defending the Company, which would have an adverse effect on our financial results. Shareholder activists may also seek to involve themselves in the governance, strategic direction and operations of the Company. Such proposals may disrupt our business and divert the attention of our management and employees, and any perceived uncertainties as to our future direction resulting from such a situation could result in the loss of potential business opportunities, be exploited by our competitors, cause concern to our current or potential customers, and make it more difficult to attract and retain qualified personnel and business partners, all of which could adversely affect our business. In addition, actions of activist shareholders may cause significant fluctuations in our stock price based on temporary or speculative market perceptions or other factors that do not necessarily reflect the underlying fundamentals and prospects of our business.
19
We may not be able to attract, retain and develop key personnel.
Our future performance depends in significant part upon the continued service of our executive officers and other key personnel. The loss of the services of one or more of our executive officers or other key employees could have a material adverse effect on our business, prospects, financial condition and results of operations. Our success also depends on our continuing ability to attract, retain and develop highly qualified personnel. Competition for such personnel is intense, and there can be no assurance that we can retain and motivate our key employees or attract and retain other highly qualified personnel in the future.
We may experience losses or be subject to increased funding and expenses related to our pension plans.
The funding obligations for our pension plans are impacted by the performance of the financial markets, interest rates and governmental regulations. While the pension benefit earned to date by active participants under our legacy U.S. pension plan was frozen effective January 1, 2014, and retirement service benefits no longer accrue under this retirement program, our pension obligations are expected to remain significant. If the investment of plan assets does not provide the expected long-term returns, if interest rates or other assumptions change, or if governmental regulations change the timing or amounts of required contributions to the plans, we could be required to make significant additional pension contributions which may have an adverse impact on our liquidity, our ability to comply with debt covenants and may require recognition of increased expense within our financial statements.
Certain provisions in our articles of incorporation and bylaws, and of Missouri law, could deter or delay a third-party's efforts to acquire us, especially if the Board determines it is not in the best interest of our shareholders.
Our articles of incorporation and bylaws contain, and the General and Business Corporation Law of Missouri contains, provisions that are intended to deter coercive takeover practices and inadequate takeover bids by making such practices or bids unacceptably expensive to the bidder and to encourage prospective acquirers to negotiate with the Board rather than to attempt a hostile takeover by making the replacement of incumbent directors more time-consuming and difficult. These provisions include, among others:
• | restrictions on various types of business combinations with, or the voting of certain holders of shares of our voting stock by, significant shareholders; |
• | the inability of our shareholders to call a special meeting or, unless unanimous, to act by written consent; |
• | rules regarding how shareholders may present proposals or nominate directors for election at shareholder meetings; |
• | the right of the Board to issue preferred stock without shareholder approval; |
• | a provision that our shareholders may only remove directors "for cause" and with the approval of the holders of two-thirds of our outstanding voting stock at a special meeting of shareholders called expressly for that purpose; |
• | the ability of our directors, and not shareholders, to fix the size of the Board or to fill vacancies on the Board; |
• | a prohibition of amendment of our bylaws by shareholders without first amending the articles of incorporation; and |
• | the requirement that any amendment or repeal of specified provisions of our articles of incorporation (including provisions relating to certain business combinations, directors, and amendment of our bylaws) must be approved by the holders of at least two-thirds of the outstanding shares of our common stock and any other voting shares that may be outstanding, voting together as a single class. |
We believe that these provisions will help to protect our shareholders from coercive or otherwise unfair takeover tactics by requiring potential acquirers to negotiate with the Board and by providing the Board with more time to assess any acquisition proposal. These provisions are not intended to make us immune from takeovers. However, these provisions will apply even if the offer may be considered beneficial by some shareholders and could deter or delay an acquisition that the Board determines is not in our best interests or the best interests of our shareholders. These provisions may also prevent or discourage attempts to remove and replace incumbent directors.
20
The trading price of our common shares may be volatile.
The trading price of our common shares could be subject to significant fluctuations in response to several factors, some of which are beyond our control. These include general stock market volatility, variations in our quarterly operating results, general trends in the consumer products industry, changes by securities analysts in their estimates or investment ratings and general marketplace conditions.
Risks Related to the Separation of the Household Products Business
Our historical financial information is not necessarily representative of the results that we would have achieved had the Separation taken place before July 1, 2015, and may not be a reliable indicator of our future results.
Our historical financial information included in this Annual Report on Form 10-K is derived from our consolidated financial statements and accounting records compiled when the Household Products business was part of the Company. Accordingly, the historical financial information does not necessarily reflect the financial condition, results of operations or cash flows that we would have achieved had the Separation taken place prior to the periods presented or those that we will achieve in the future as a stand-alone Personal Care products enterprise. For additional information about the past financial performance of our business and the basis of presentation of our historical financial statements, see the historical financial statements and accompanying notes included elsewhere in this Annual Report on Form 10-K.
If the Separation, together with certain related transactions, does not qualify as a transaction that is generally tax free for U.S. federal income tax purposes, our shareholders could be subject to significant tax liabilities.
In connection with the Separation we received an opinion of counsel regarding the qualification of the Separation, together with certain related transactions, as a transaction that is generally tax free for U.S. federal income tax purposes under Sections 355 and 368(a)(1)(D) of the Internal Revenue Code (the "Code"). The opinion of counsel was based upon and relied on, among other things, certain facts and assumptions, as well as certain representations, statements and undertakings of us and New Energizer, including those relating to the past and future conduct of us and New Energizer. If any of these representations, statements or undertakings are, or become, inaccurate or incomplete, or if either we or New Energizer breaches any of its covenants in the Separation documents, the opinion of counsel may be invalid and the conclusions reached therein could be jeopardized.
Notwithstanding the opinion of counsel, the Internal Revenue Service ("IRS") could determine that the distribution, together with certain related transactions, should be treated as a taxable transaction if it determines that any of the representations, assumptions or undertakings upon which the opinion of counsel was based are false or have been violated, or if it disagrees with the conclusions in the opinion of counsel. The opinion of counsel is not binding on the IRS and there can be no assurance that the IRS will not assert a contrary position.
If the Separation, together with certain related transactions, fails to qualify as a transaction that is generally tax-free, for U.S. federal income tax purposes, we would recognize taxable gain as if we had sold the New Energizer common shares in a taxable sale for its fair market value and our shareholders who received New Energizer shares in the distribution would be subject to tax as if they had received a taxable distribution equal to the fair market value of such shares. Failure of the Separation to qualify as a transaction that is generally tax-free could have a substantial impact on our tax obligations, consolidated financial condition and cash flows.
Indemnifications under the Separation agreement with New Energizer or New Energizer’s inability to satisfy indemnification obligations in the future could negatively impact our financial results.
Pursuant to the separation agreement and certain other agreements with New Energizer, New Energizer agreed to indemnify us for certain liabilities, and we agreed to indemnify New Energizer for certain liabilities, in each case for uncapped amounts. Indemnities that we may be required to provide New Energizer may be significant and could negatively impact our business. Further, the indemnity from New Energizer may not be sufficient to protect us against the full amount of such liabilities, and New Energizer may not be able to fully satisfy its indemnification obligations. Moreover, even if we ultimately succeed in recovering from New Energizer any amounts for which we are held liable, we may be temporarily required to bear these losses ourselves. Each of these risks could negatively affect our business, results of operations and financial condition.
21
Item 1B. Unresolved Staff Comments.
None.
Item 2. Properties.
As of September 30, 2017, we owned or leased 60 properties, 25 in the U.S. and 35 in other countries. 12 of these properties are used as production plants consisting of 1.8 million square feet that is owned and 0.7 million square feet that is leased. Five of these plants are located in the U.S. and seven are in other countries. Seven of these plants are used exclusively by our Wet Shave segment, one by our Feminine Care segment, two are shared by our Sun and Skin Care and All Other segments, one is shared by our Wet Shave and All Other segments and one is shared by our Wet Shave and Sun and Skin Care segments. We also have thirteen warehouses totaling 0.7 million square feet, of which 0.6 million is leased. We operate from 35 different offices throughout the world totaling 0.4 million square feet, all of which is leased, and includes our corporate headquarters in Chesterfield, Missouri. We believe all of our facilities are well-maintained and suitable for the operations conducted in them.
Item 3. Legal Proceedings.
We, and our affiliates, are subject to a number of legal proceedings in various jurisdictions arising out of our operations during the ordinary course of business. Many of these legal matters are in preliminary stages and involve complex issues of law and fact, and may proceed for protracted periods of time. The amount of liability, if any, from these proceedings cannot be determined with certainty. We review our legal proceedings and claims, regulatory reviews and inspections and other legal proceedings on an ongoing basis and follow appropriate accounting guidance when making accrual and disclosure decisions. We establish accruals for those contingencies when the incurrence of a loss is probable and can be reasonably estimated, and disclose the amount accrued and the amount of a reasonably possible loss in excess of the amount accrued, if such disclosure is necessary for our financial statements to not be misleading. We do not record liabilities when the likelihood that the liability has been incurred is probable, but the amount cannot be reasonably estimated. Based upon present information, we believe that our liability, if any, arising from such pending legal proceedings, asserted legal claims and known potential legal claims, which are likely to be asserted, is not reasonably likely to be material to our financial position, results of operations or cash flows, taking into account established accruals for estimated liabilities.
See also the discussion captioned "Governmental Regulation and Environmental Matters" included within Item 1. Business of this Annual Report on Form 10-K.
Item 4. Mine Safety Disclosures.
Not applicable.
22
PART II
Item 5. Market for Registrant's Common Equity, Related Stockholder Matters and Issuer Purchases of Equity Securities.
Market Information
Edgewell common shares are listed and traded on the New York Stock Exchange ("NYSE") under the symbol "EPC." The following table presents the high and low sales prices of our common shares for the periods indicated, as reported by the NYSE.
Market Price Per Share | |||||||||||||
FY2017 | FY2016 | ||||||||||||
High | Low | High | Low | ||||||||||
First Quarter | $ | 84.45 | $ | 72.79 | $ | 87.00 | $ | 72.44 | |||||
Second Quarter | $ | 82.06 | $ | 72.75 | $ | 83.24 | $ | 67.94 | |||||
Third Quarter | $ | 78.04 | $ | 69.63 | $ | 85.44 | $ | 76.07 | |||||
Fourth Quarter | $ | 76.76 | $ | 69.72 | $ | 88.00 | $ | 74.96 | |||||
There were approximately 8,051 shareholders of record of our common shares as of October 31, 2017.
Dividends
We have not declared nor paid any dividends since the third quarter of fiscal 2015, and we do not currently intend to pay dividends in the foreseeable future. Any future dividends are dependent on future earnings, capital requirements and our financial condition and will be declared at the sole discretion of our Board of Directors. See "We do not expect to pay dividends for the foreseeable future" in Item 1A. Risk Factors.
Issuer Purchases of Equity Securities
In May 2015, our Board of Directors approved an authorization to repurchase up to ten million shares of our common stock. This authorization replaced a prior share repurchase authorization. During the fourth quarter of fiscal 2017, we repurchased 953,812 shares of our common stock under this resolution.
Period | Total Number of Shares Purchased (1) | Average Price Paid per Share (2) | Total Number of Shares Purchased as Part of Publicly Announced Plans or Programs | Maximum Number that May Yet Be Purchased Under the Plans or Programs | |||||||||
July 1, 2017 to July 31, 2017 | 25,832 | $ | 73.12 | — | 4,235,729 | ||||||||
August 1, 2017 to August 31, 2017 | 359,863 | $ | 74.80 | 359,863 | 3,875,866 | ||||||||
September 1, 2017 to September 30, 2017 | 593,949 | $ | 73.94 | 593,949 | 3,281,917 | ||||||||
(1) | 25,832 shares purchased during the quarter relate to the surrender to the Company of shares of common stock to satisfy tax withholding obligations in connection with the vesting of restricted stock equivalents. |
(2) | Includes $0.02 per share of brokerage fee commissions. |
During fiscal 2017, we repurchased 2,218,858 shares under the share repurchase authorization. Future share repurchases, if any, would be made in the open market, privately negotiated transactions or otherwise, in such amounts and at such times as we deem appropriate based upon prevailing market conditions, business needs and other factors. See "There can be no guarantee that we will repurchase stock" under Item 1A. Risk Factors.
During fiscal 2017, we repurchased 225,306 shares related to the surrender of shares of common stock to satisfy tax withholding obligations in connection with the vesting of restricted stock equivalent awards.
23
Performance Graph
The following graph compares the cumulative 5-year total return provided to shareholders of Edgewell Personal Care Company's common shares relative to the cumulative total returns of the S&P Midcap 400 index and the S&P Household Products index. An investment of $100 (with reinvestment of all dividends and other distributions, including the New Energizer shares distributed on July 1, 2015) is assumed to have been made in our common shares and in each of the indexes on September 30, 2012 and its relative performance is tracked through September 30, 2017. These indices are included only for comparative purposes as required by Securities and Exchange Commission rules and do not necessarily reflect management's opinion that such indices are an appropriate measure of the relative performance of our common shares. They are not intended to forecast possible future performance of our common shares, nor is our historic common share price performance necessarily indicative of our future common share price performance.
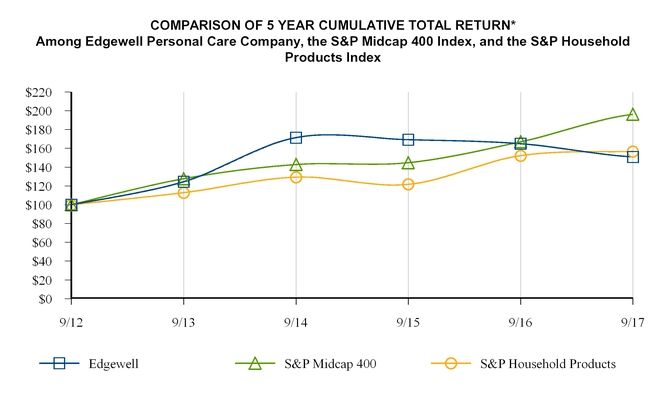
* $100 invested on 9/30/12 in stock or index, with reinvestment of all dividends. Fiscal year ending September 30.
Copyright© 2017 Standard & Poor's, a division of S&P Global. All rights reserved.
9/12 | 9/13 | 9/14 | 9/15 | 9/16 | 9/17 | |||||||||||||||||||
Edgewell Personal Care Company | $ | 100.00 | $ | 124.47 | $ | 171.39 | $ | 169.24 | $ | 164.93 | $ | 150.93 | ||||||||||||
S&P Midcap 400 | $ | 100.00 | $ | 127.68 | $ | 142.77 | $ | 144.76 | $ | 166.95 | $ | 196.19 | ||||||||||||
S&P Household Products | $ | 100.00 | $ | 112.85 | $ | 129.34 | $ | 121.70 | $ | 152.22 | $ | 156.64 | ||||||||||||
24
Item 6. Selected Financial Data.
The selected historical financial data presented below should be read in conjunction with Item 7. Management's Discussion and Analysis of Financial Condition and Results of Operations and our consolidated financial statements and accompanying notes included in Item 8. Financial Statements and Supplementary Data.
(in millions, except per share data)
Statements of Earnings Data (1) | Fiscal Year | ||||||||||||||||||
2017 | 2016 | 2015 | 2014 | 2013 | |||||||||||||||
Net sales | $ | 2,298.4 | $ | 2,362.0 | $ | 2,421.2 | $ | 2,612.2 | $ | 2,448.9 | |||||||||
Depreciation and amortization | 96.2 | 96.5 | 91.3 | 101.7 | 92.9 | ||||||||||||||
(Loss) earnings from continuing operations before income taxes (5) | (52.9 | ) | 219.9 | (458.7 | ) | 145.8 | 205.4 | ||||||||||||
Earnings (loss) from continuing operations | 5.7 | 178.7 | (296.1 | ) | 117.7 | 155.2 | |||||||||||||
Earnings from discontinued operations, net of tax | — | — | 20.8 | 238.4 | 251.8 | ||||||||||||||
Net earnings (loss) | $ | 5.7 | $ | 178.7 | $ | (275.3 | ) | $ | 356.1 | $ | 407.0 | ||||||||
Basic earnings (loss) per share: | |||||||||||||||||||
Continuing operations | $ | 0.10 | $ | 3.02 | $ | (4.78 | ) | $ | 1.90 | $ | 2.50 | ||||||||
Discontinued operations | — | — | 0.34 | 3.85 | 4.05 | ||||||||||||||
Net earnings (loss) | 0.10 | 3.02 | (4.44 | ) | 5.74 | 6.55 | |||||||||||||
Diluted earnings (loss) per share: | |||||||||||||||||||
Continuing operations | $ | 0.10 | $ | 2.99 | $ | (4.78 | ) | $ | 1.88 | $ | 2.47 | ||||||||
Discontinued operations | — | — | 0.34 | 3.81 | 4.00 | ||||||||||||||
Net earnings (loss) | 0.10 | 2.99 | (4.44 | ) | 5.69 | 6.47 | |||||||||||||
Cash dividends per common share (2) | $ | — | $ | — | $ | 1.50 | $ | 2.00 | $ | 1.70 | |||||||||
Balance Sheet Data (3) | As of September 30, | ||||||||||||||||||
2017 | 2016 | 2015 | 2014 | 2013 | |||||||||||||||
Working capital (4) | $ | 661.8 | $ | 583.8 | $ | 969.8 | $ | 1,155.9 | $ | 1,415.0 | |||||||||
Property, plant and equipment, net | 453.4 | 486.1 | 498.9 | 751.7 | 755.6 | ||||||||||||||
Total assets | 4,188.8 | 4,771.5 | 4,986.3 | 6,928.7 | 6,717.4 | ||||||||||||||
Long-term debt | 1,525.4 | 1,544.2 | 1,698.6 | 1,768.9 | 1,998.8 | ||||||||||||||
(1) | Comparisons of statements of earnings data are impacted by the fiscal 2014 feminine care brands acquisition. |
(2) | We paid dividends through the third quarter of fiscal 2015. We did not declare or pay any dividends thereafter. |
(3) | Balance sheet data as of September 30, 2014 and 2013 has not been adjusted to reflect the Separation. |
(4) | Working capital represents current assets less current liabilities. |
(5) | (Loss) earnings from continuing operations before income taxes were (reduced) increased by the following items: |
Fiscal Year | |||||||||||||||||||
2017 | 2016 | 2015 | 2014 | 2013 | |||||||||||||||
Venezuela deconsolidation charge | $ | — | $ | — | $ | (79.3 | ) | $ | — | $ | — | ||||||||
Spin costs (6) | — | (12.0 | ) | (142.0 | ) | (24.4 | ) | — | |||||||||||
Spin restructuring charges | — | — | (28.3 | ) | — | — | |||||||||||||
Restructuring and related costs (7) | (30.3 | ) | (38.8 | ) | (27.0 | ) | (53.5 | ) | (19.6 | ) | |||||||||
Industrial sale charges | — | (0.2 | ) | (32.7 | ) | — | — | ||||||||||||
Cost of early debt retirements | — | — | (59.6 | ) | — | — | |||||||||||||
Impairment charges | (319.0 | ) | (6.5 | ) | (318.2 | ) | — | — | |||||||||||
Acquisition, integration and other realignment costs | — | — | — | (18.5 | ) | (1.5 | ) | ||||||||||||
Venezuela devaluation and other impacts | — | — | — | — | (6.3 | ) | |||||||||||||
Net pension and postretirement gains | — | — | — | 1.1 | 39.2 | ||||||||||||||
Total | $ | (349.3 | ) | $ | (57.5 | ) | $ | (687.1 | ) | $ | (95.3 | ) | $ | 11.8 | |||||
(6) | Includes Selling, general and administrative expense ("SG&A") of $11.8, $137.8 and $24.4 for fiscal 2016, 2015 and 2014, respectively, and Cost of products sold of $0.2 and $4.2 for fiscal 2016 and 2015, respectively. |
25
(7) | Includes SG&A of $0.3, $4.3 and $1.6 for fiscal 2015, 2014 and 2013, respectively, and Cost of products sold of $0.7 and $1.8 for fiscal 2017 and 2016, respectively, and positive adjustments of $0.7 for fiscal 2014. |
Item 7. Management's Discussion and Analysis of Financial Condition and Results of Operations.
(in millions, except per share data, unaudited)
The following discussion and analysis of our financial condition and results of operations should be read in conjunction with our consolidated financial statements and the accompanying notes included in this Annual Report on Form 10-K. The following discussion may contain forward-looking statements that reflect our plans, estimates and beliefs and involve risks, uncertainties and assumptions. Our actual results could differ materially from those discussed in these forward-looking statements. Factors that could cause or contribute to these differences include those discussed in Item 1A. Risk Factors and "Forward-Looking Statements" included within this Annual Report on Form 10-K.
Non-GAAP Financial Measures. While we report financial results in accordance with accounting principles generally accepted in the United States ("reported" or "GAAP"), this discussion also includes Non-GAAP measures. These Non-GAAP measures are referred to as "adjusted" or "organic" and exclude items such as spin costs, restructuring charges, the Venezuela deconsolidation charge, the sale of the industrial business, amortization and impairment of intangibles and cost of early debt retirements. Reconciliations of Non-GAAP measures are included within this Management's Discussion and Analysis of Financial Condition and Results of Operations.
This Non-GAAP information is provided as a supplement to, not as a substitute for, or as superior to, measures of financial performance prepared in accordance with GAAP. We use this Non-GAAP information internally to make operating decisions and believe it is helpful to investors because it allows more meaningful period-to-period comparisons of ongoing operating results. Given the various significant events that took place during fiscal 2016 and 2015, most prominently the separation of our Household Products business and the resulting go-to-market impacts, the deconsolidation of our Venezuelan operations and the sale of our industrial business, we view the use of Non-GAAP measures that take into account the impact of these unique events as particularly valuable in understanding our underlying operational results and providing insights into future performance.
The information can also be used to perform trend analysis and to better identify operating trends that may otherwise be masked or distorted by the types of items that are excluded. This Non-GAAP information is a component in determining management's incentive compensation. Finally, we believe this information provides a higher degree of transparency. The following provides additional detail on our Non-GAAP measures:
• | We analyze our net sales and segment profit on an organic basis to better measure the comparability of results between periods. Organic net sales and organic segment profit exclude the impact of changes in foreign currency, acquisitions and dispositions (including the results of the former industrial business) and the period-over-period change in the results of our Venezuelan operations. Underlying net sales represents organic net sales adjusted for the international go-to-market impacts, as defined below. This information is provided because these types of fluctuations can distort the underlying change in net sales and segment profit either positively or negatively. |
• | To compete more effectively as an independent company, we increased our use of third-party distributors and wholesalers, and decreased or eliminated our business operations in certain countries, consistent with our international go-to-market strategy. Within this Management's Discussion and Analysis of Financial Condition and Results of Operations, we discuss go-to-market impacts, which reflect our best estimate on the impact of these international go-to-market changes and exits, and represent the year-over-year change in those markets. We believe we realized the majority of the impact from these changes in the fourth quarter of fiscal 2015 and first three quarters of fiscal 2016. |
• | Adjusted net earnings and adjusted earnings per share are defined as net earnings (loss) from continuing operations and diluted earnings (loss) per share excluding items such as impairment charges, the Venezuela deconsolidation charge, spin costs, restructuring charges, the sale of the industrial business, cost of early debt retirements and the related tax effects of these items. |
• | Adjusted effective tax rate is defined as the effective tax rate excluding items such as impairment charges, the Venezuela deconsolidation charge, spin costs, restructuring charges, the sales of the industrial business, cost of early debt retirements and the related tax effects of these items from the income tax provision and earnings before income taxes. |
All comparisons are with the same period in the prior year, unless otherwise noted.
26
Overview
Edgewell Personal Care Company, and its subsidiaries (collectively, "Edgewell"), is one of the world's largest manufacturers and marketers of personal care products in the wet shave, sun and skin care, feminine care and infant care categories. We have a portfolio of over 25 brands and a broad global footprint that operates in more than 50 countries.
We conduct our business in the following four segments:
• | Wet Shave consists of products sold under the Schick, Wilkinson Sword, Edge, Skintimate, Shave Guard and Personna brands, as well as non-branded products. Our wet shave products include razor handles and refillable blades, disposable shave products and shaving gels and creams. |
• | Sun and Skin Care consists of Banana Boat and Hawaiian Tropic sun care products and Bulldog men's skin care products, as well as Wet Ones wipes and Playtex household gloves until the sale of the gloves business in October 2017. |
• | Feminine Care includes tampons, pads and liners sold under the Playtex Gentle Glide and Sport, Stayfree, Carefree and o.b. brands, as well as personal cleansing wipes under the Playtex brand. |
• | All Other includes infant care products, such as bottles, cups and pacifiers, under the Playtex, OrthoPro and Binky brand names, as well as the Diaper Genie and Litter Genie disposal systems. |
The personal care product categories are highly competitive, both in the United States ("U.S.") and on a global basis, as large manufacturers with global operations compete for consumer acceptance and, increasingly, limited retail shelf space. Competition is based upon brand perception, product performance, customer service and price. The markets are generally characterized by the frequent introduction of new products, accompanied by major advertising and promotional programs. Our priority is to deliver our strategic objectives, focusing on maximizing sales and profit growth through innovation, product line extensions and share gains, and we continue to target improved working capital management as a key business objective.
Significant Events
Intangible Asset Impairment
During the third fiscal quarter of 2015, we recorded a $2.5 impairment of brand names and a $5.6 impairment of customer-related intangibles associated with the sale of our industrial business.
During the fourth quarter of fiscal 2015, we completed impairment testing on indefinite-lived intangible assets other than goodwill, which consist of trademarks and brand names used across our segments, and determined that the carrying values of our Playtex, Wet Ones and Skintimate brand names were above the fair values, resulting in a non-cash asset impairment charge of $318.2. The impairment of the Playtex brand was primarily the result of slower adoption of new products and reductions in legacy product sales for certain feminine care products, as well as declines in certain international markets related to the Separation. In addition, the impairment of the Playtex brand was driven by our infant care products, where competitive pressures, delays in product launches and loss of licensing drove the sales decline. Both the Wet Ones and Skintimate impairments were primarily related to the introduction of competing products in the market, which resulted in share and margin declines.
During the fourth quarter of fiscal 2016, we completed our annual impairment testing and found the carrying value of our Skintimate brand name to be above the fair value, resulting in an additional non-cash asset impairment charge of $6.5. The fiscal 2016 impairment charge was caused by further market share erosion above previous estimates. Based on the impairments taken in fiscal 2015 and 2016 and continued competitive pressure on this brand, the Skintimate brand name was converted to a definite-lived asset and assigned a useful life of 20 years. This conversion increased amortization expense by $1.5 during fiscal 2017.
During the fourth quarter of fiscal 2017, we completed our annual impairment testing and found the carrying values of our Playtex and Edge brand names to be above the fair value, resulting in a non-cash asset impairment charge of $312.0 and $7.0, respectively. The impairment of the Playtex brand was caused by market share declines due to increased competition affecting feminine care, skin care and infant care products. The Edge impairment was related to erosion of market share to competing products. Based on the impairment taken on the Playtex brand in fiscal 2015 and continued competitive pressure on both brands, these intangible assets were converted to definite-lived assets with a useful life of 20 years. We recorded amortization expense of $1.8 in the fourth quarter of fiscal 2017 related to the amortization of the Playtex and Edge brand names.
27
Acquisition of Bulldog
On October 31, 2016, we completed the acquisition of Bulldog Skincare Holdings Limited ("Bulldog"), a men's grooming and skincare products company based in the U.K. for $34.0, net of cash acquired. The acquisition created opportunities to expand our personal care portfolio into a growing global category where we can leverage our international geographic footprint. The acquisition was financed through available foreign cash. The results of Bulldog for the post-acquisition period are included within our results for fiscal 2017. For more information on the acquisition, see Note 4 of Notes to Consolidated Financial Statements.
Restructuring Projects
In November 2012, our Board of Directors (the "Board") authorized an enterprise-wide restructuring plan and delegated authority to management to determine the final actions with respect to this plan (the "Restructuring"). The Restructuring originally included several initiatives focused on reducing costs in general and administrative functions as well as reducing manufacturing and operating costs associated with our discontinued operations. In January 2014, the Board authorized an expansion of scope of the previously announced Restructuring, which included rationalization and streamlining of the Edgewell operating facilities and other cost saving initiatives. Restructuring charges have primarily related to plant closure and accelerated depreciation charges and severance and related benefit costs.
During fiscal 2017, we incurred $30.3 of charges related to the Restructuring, which includes $0.7 associated with non-core inventory obsolescence charges included within Cost of products sold. Fiscal 2017 charges include a non-cash charge related to the disposition of real estate. We do not expect to incur additional costs in future periods. Project-to-date restructuring costs total $170.1. We estimate our incremental additional gross savings during fiscal 2017 under the Restructuring to be approximately $22. Project-to-date savings total approximately $150. Due to an increase in the Wet Shave footprint costs and a delay in the transition of Feminine Care manufacturing from Montreal to Dover, Delaware, project costs were higher than expected during fiscal 2017, and some anticipated savings are expected to be realized later than planned.
We incurred $28.3 in Spin restructuring charges during fiscal 2015. We do not expect to incur additional Spin-related restructuring charges in the future.
For further information on our restructuring projects, see Note 5 of Notes to Consolidated Financial Statements.
Discontinued Operations
On July 1, 2015, we completed the separation of our Household Products business into a separate publicly-traded company (the "Spin" or the "Separation"). The historical results of the Households Products business ("New Energizer") are presented as discontinued operations. We have focused our discussion in Management's Discussion and Analysis of Financial Condition and Results of Operations on our continuing operation, Edgewell. Historical results on a continuing operations basis include certain costs associated with supporting the Household Products business that were not reported in discontinued operations in fiscal 2015. These costs affected Selling, general and administrative expense ("SG&A"), interest expense, spin costs, restructuring charges and income taxes. As a result, fiscal 2015 earnings per share on both a GAAP and Adjusted (Non-GAAP) basis are not comparable to fiscal 2016 or 2017. In addition, the fiscal 2015 cash flow statement was not adjusted for the impact of the Separation and is not comparable.
Prior to the Separation, we managed our business in two reportable segments: Personal Care and Household Products. Beginning July 1, 2015, we manage our business in four reportable segments: Wet Shave, Sun and Skin Care, Feminine Care and All Other. Prior periods have been recast to reflect our current segment reporting.
Our financial statements include incremental costs incurred to evaluate, plan and execute the Separation. Fiscal 2016 and 2015 included costs related to the Separation of $11.8 and $137.8 recorded in SG&A, respectively, and $0.2 and $4.2 recorded in Cost of products sold, respectively. Additionally, fiscal 2015 included $28.3 in Spin restructuring charges. We did not incur Separation-related costs during fiscal 2017, and do not expect to incur such costs in the future.
28
Venezuela Deconsolidation
Venezuelan exchange control regulations resulted in an other-than-temporary lack of exchangeability between the Venezuelan bolivar and U.S. dollar, resulting in a lack of control over our Venezuelan subsidiaries for accounting purposes. We deconsolidated our Venezuelan subsidiaries on March 31, 2015 and began accounting for the investment in our Venezuelan operations using the cost method of accounting. As a result of the deconsolidation, we recorded a charge of $144.5 during fiscal 2015, of which $79.3 was included within continuing operations and had no accompanying tax benefit. This charge included the write-off of our investment in our Venezuelan subsidiaries, foreign currency translation losses of $18.5 previously recorded in Accumulated other comprehensive loss and the write-off of $18.5 of intercompany receivables. Since March 31, 2015, our financial results have not included the operating results of our Venezuelan operations.
Sale of Industrial Business
In May 2015, the Board authorized the strategic decision to exit our industrial business, which was part of our All Other segment, due to a shift of management focus to other segment products. We finalized the sale of the business in September 2015. The sale impacted operations in Verona, Virginia; Obregon, Mexico; and the U.K.. During fiscal 2015, we incurred $21.9 of non-cash asset impairment charges and a $10.8 loss on sale of assets related to the sale of the industrial business.
Subsequent Event
On October 3, 2017, the Company entered into an agreement to sell its Playtex® Gloves business to a household products company (the “Acquirer”) for $19 million. The agreement also provides the Acquirer with indefinite and exclusive worldwide rights to the Playtex trademark for gloves. The strategic sale of the Playtex Gloves business will allow the Company to better focus and utilize its resources on its other product lines.
Executive Summary
Following is a summary of key results for fiscal 2017, 2016 and 2015. Net earnings (loss) and diluted earnings (loss) per share ("EPS") for the time periods presented were impacted by impairment charges, restructuring activities, costs related to the Separation, the sale of the industrial business and certain other adjustments, as well as the related tax impact from those costs as described in the table below. The impact of these items on reported net earnings (loss) and EPS are provided below as a reconciliation of net earnings (loss) and EPS to adjusted net earnings and adjusted diluted EPS, which are Non-GAAP measures.
29
Fiscal 2017
• | Net sales of $2,298.4 decreased 2.7% from fiscal 2016, inclusive of a 0.6% increase due to the acquisition of Bulldog and a 0.5% decrease due to currency movements. Excluding the impact of the Bulldog acquisition and currency movements, organic net sales decreased 2.8% for fiscal 2017 as compared to the prior year period, as declines in Wet Shave and Feminine Care were partially offset by growth in Sun and Skin Care. |
• | Net earnings from continuing operations for fiscal 2017 were $5.7, as compared to $178.7 in the prior year. On an adjusted basis, as illustrated in the table below, net earnings for fiscal 2017 increased 7.1% to $228.4. The increase in adjusted net earnings was driven primarily by higher adjusted operating profit and favorable other income, slightly offset by negative currency translation. |
• | Net earnings per diluted share from continuing operations during fiscal 2017 were $0.10 compared to $2.99 in the prior year. On an adjusted basis, as illustrated in the table below, net earnings per diluted share from continuing operations during fiscal 2017 were $3.97 compared to $3.57 in the prior year. |
Fiscal Year | |||||||||||||||||||||||
Net Earnings (Loss) | Diluted EPS | ||||||||||||||||||||||
2017 | 2016 | 2015 | 2017 | 2016 | 2015 | ||||||||||||||||||
Net Earnings (Loss) from Continuing Operations and Diluted EPS - GAAP | $ | 5.7 | $ | 178.7 | $ | (296.1 | ) | $ | 0.10 | $ | 2.99 | $ | (4.78 | ) | |||||||||
Impairment charge | 319.0 | 6.5 | 318.2 | 5.55 | 0.11 | 5.13 | |||||||||||||||||
Venezuela deconsolidation charge | — | — | 79.3 | — | — | 1.27 | |||||||||||||||||
Spin costs (1) | — | 12.0 | 142.0 | — | 0.20 | 2.29 | |||||||||||||||||
Spin restructuring charges | — | — | 28.3 | — | — | 0.44 | |||||||||||||||||
Restructuring and related costs (2) | 30.3 | 38.8 | 27.0 | 0.53 | 0.65 | 0.43 | |||||||||||||||||
Industrial sale charges | — | 0.2 | 32.7 | — | — | 0.52 | |||||||||||||||||
Cost of early debt retirements | — | — | 59.6 | — | — | 0.96 | |||||||||||||||||
Income taxes | (126.6 | ) | (22.9 | ) | (215.8 | ) | (2.21 | ) | (0.38 | ) | (3.49 | ) | |||||||||||
Impact of basic/dilutive shares (3) | — | — | — | — | — | 0.03 | |||||||||||||||||
Adjusted Net Earnings and Adjusted Diluted EPS - Non-GAAP | $ | 228.4 | $ | 213.3 | $ | 175.2 | $ | 3.97 | $ | 3.57 | $ | 2.80 | |||||||||||
Weighted-average shares outstanding - Diluted | 57.5 | 59.7 | 62.0 | ||||||||||||||||||||
(1) | Includes SG&A of $11.8 and $137.8 for fiscal 2016 and 2015, respectively, and Cost of products sold of $0.2 and $4.2 for fiscal 2016 and 2015, respectively. |
(2) | Includes SG&A of $0.3 for fiscal 2015 and Cost of products sold of $0.7 and $1.8 for fiscal 2017 and 2016, respectively. |
(3) | All EPS impacts are calculated using diluted weighted-average shares outstanding. For fiscal 2015, this reflects the impact of 0.5 dilutive restricted stock equivalent ("RSE") awards which were excluded from the GAAP EPS calculation due to the reported net loss. |
30
Operating Results
The following table presents changes in net sales for fiscal 2017 and 2016, as compared to the corresponding prior year period, and provides a reconciliation of organic net sales to reported amounts.
Net Sales
Net Sales - Total Company | |||||||||||||
For the Years Ended September 30, | |||||||||||||
2017 | %Chg | 2016 | %Chg | ||||||||||
Net sales - prior year | $ | 2,362.0 | $ | 2,421.2 | |||||||||
Organic | (65.0 | ) | (2.8 | )% | 34.9 | 1.4 | % | ||||||
Impact of Venezuela | — | — | % | (24.0 | ) | (1.0 | )% | ||||||
Impact of acquisitions | 14.6 | 0.6 | % | — | — | % | |||||||
Impact of currency | (13.2 | ) | (0.5 | )% | (28.2 | ) | (1.1 | )% | |||||
Impact of Industrial | — | — | % | (41.9 | ) | (1.7 | )% | ||||||
Net sales - current year | $ | 2,298.4 | (2.7 | )% | $ | 2,362.0 | (2.4 | )% | |||||
For fiscal 2017, net sales decreased 2.7% on a reported basis. Excluding the impact of the Bulldog acquisition and currency movements, organic net sales decreased 2.8% versus the prior year period. North America organic net sales decreased $67.2, or 4.4%, and International organic net sales increased $2.2, or 0.3%. The decline in organic net sales was primarily due to declines in Wet Shave, primarily in North America and Europe, and Feminine Care, which more than offset growth in global Sun and Skin Care.
For fiscal 2016, net sales decreased 2.4% on a reported basis. Excluding the impact of currency movements, the sale of the industrial business ("Industrial") and the deconsolidation of our Venezuelan subsidiaries ("Venezuela"), organic net sales increased 1.4% versus the prior year period. North America organic net sales increased $25.0, or 1.7%, and International organic net sales increased $9.9, or 1.1%, primarily due to increases in Wet Shave and Sun and Skin Care. Excluding the estimated go-to-markets impacts of $34.0, underlying net sales increased by 2.8%.
For further discussion regarding net sales, including a summary of reported versus organic changes, see "Segment Results."
Gross Profit
Gross profit was $1,130.6 in fiscal 2017, as compared to $1,159.9 in fiscal 2016. The decrease in gross profit was due primarily to lower sales volumes compared to the prior year, partially offset by the positive impact of the Bulldog acquisition. Gross margin as a percent of net sales for fiscal 2017 was 49.2%, up 10 basis points as compared to fiscal 2016. The increase in gross margin was primarily driven by favorable price mix and lower promotions and returns in Sun and Skin Care, lower promotions in Feminine Care and lower commodity costs across all segments, partially offset by higher product costs related to the consolidation of Feminine Care manufacturing.
Gross profit was $1,159.9 in fiscal 2016, as compared to $1,183.8 in fiscal 2015. The decrease in gross profit was due primarily to lower net sales and higher product costs, including the impact of Venezuela and Industrial, which were partially offset by favorable price mix. Gross margin as a percent of net sales for fiscal 2016 was 49.1%, up 20 basis points as compared to fiscal 2015, including a ten basis point benefit from the impact of foreign currency.
31
Selling, General and Administrative Expense
SG&A was $390.0 in fiscal 2017, or 17.0% of net sales, as compared to $412.7 in the prior year period, or 17.5% of net sales. Included in SG&A in fiscal 2016 were approximately $11.8 of Spin costs. Excluding these costs, SG&A was $400.9, or 17.0% of net sales for the prior year period. The decrease in SG&A was primarily driven by lower incentive compensation as well as savings realized from the Company's Zero Based Spending program, which more than offset increased amortization expense.
SG&A was $412.7 in fiscal 2016, or 17.5% of net sales, as compared to $571.6 in the prior year period, or 23.6% of net sales. Included in SG&A in fiscal 2016 and 2015 were approximately $11.8 and $137.8 of Spin costs, respectively. Excluding Spin costs, SG&A was $400.9 in fiscal 2016, or 17.0% of net sales, as compared to $433.8 in fiscal 2015, or 17.9% of net sales. In addition, SG&A in the first nine months of fiscal 2015 included certain costs associated with supporting the Household Products business, which were not reported in discontinued operations.
Advertising and Sales Promotion Expense
For fiscal 2017, A&P was $318.3, down $18.4 as compared to fiscal 2016. A&P spending as a percent of net sales was 13.8% for fiscal 2017, compared with 14.3% in fiscal 2016. The decrease was driven by higher Wet Shave spend in the prior year in support of new product innovation in disposables for Xtreme 3 as well as lower spending in Feminine Care in fiscal 2017.
For fiscal 2016, A&P was $336.7, or 14.3% of net sales, a decrease from $367.1, or 15.2% of net sales, in fiscal 2015. Adjusting for the impact of currency, Venezuela and Industrial, A&P spending for fiscal 2016 decreased by $26.6 compared to the prior year, driven by lower spending in Wet Shave, Sun and Skin Care and Feminine Care.
Research and Development Expense
Research and development expense ("R&D") was relatively consistent over the three-year period with spending at $67.6 in fiscal 2017, $71.9 in fiscal 2016 and $71.0 in fiscal 2015. As a percent of sales, R&D was approximately 2.9% in fiscal 2017, 3.0% in fiscal 2016 and 2.9% in fiscal 2015.
Interest Expense Associated with Debt
Interest expense associated with debt for fiscal 2017 was $69.2, a decrease of $2.6 as compared to fiscal 2016. Interest expense associated with debt for fiscal 2016 decreased $28.0 as compared to fiscal 2015. The decreases were due to lower average debt outstanding.
Other (Income) Expense, Net
Other (income) expense, net was income of $10.2 in fiscal 2017, expense of $3.2 in fiscal 2016 and income of $11.8 in fiscal 2015. All periods primarily reflect the net impact of foreign currency exchange contract gains and losses and revaluation of nonfunctional currency balance sheet exposures. The current year gains and prior year loss was primarily driven by change in the Japanese Yen.
Income Tax Provision (Benefit)
Income taxes, which include federal, state and foreign taxes, were 110.8%, 18.7% and 35.4% of Earnings (loss) from continuing operations before income taxes in fiscal 2017, 2016 and 2015, respectively.
The effective income tax rate for fiscal 2017 for continuing operations was 110.8% as compared to 18.7% in the prior year. The effective tax rate for fiscal 2017 was significantly impacted by the pre-tax impairment of intangible assets. The adjusted effective tax rate for fiscal 2017 was 22.9% compared to 23.1% in the prior year, which excludes the impact of restructuring charges and asset impairment charges.
The effective income tax rate for fiscal 2016 for continuing operations was 18.7% as compared to 35.4% in fiscal 2015. The tax rate for fiscal 2016 reflects a favorable mix of earnings in lower tax rate jurisdictions and a positive adjustment to prior year tax accruals, as well as favorable impact of Separation and restructuring charges in higher tax rate jurisdictions. The adjusted effective tax rate for fiscal 2016 was 23.1% compared to 23.2% in the prior year, which excludes the impact of Separation and restructuring charges, as well as intangible impairment charges and cost of early debt retirements.
32
The following table presents a reconciliation of the adjusted effective tax rate, which is a Non-GAAP measure:
2017 | |||||||||||
Reported | Adjustments (1) | Adjusted (Non-GAAP) | |||||||||
(Loss) earnings from continuing operations before income taxes | $ | (52.9 | ) | $ | 349.3 | $ | 296.4 | ||||
Income tax (benefit) provision | (58.6 | ) | 126.6 | 68.0 | |||||||
Earnings from continuing operations | $ | 5.7 | $ | 222.7 | $ | 228.4 | |||||
Effective tax rate | 110.8 | % | 22.9 | % | |||||||
2016 | |||||||||||
Reported | Adjustments (1) | Adjusted (Non-GAAP) | |||||||||
Earnings from continuing operations before income taxes | $ | 219.9 | $ | 57.5 | $ | 277.4 | |||||
Income tax provision | 41.2 | 22.9 | 64.1 | ||||||||
Earnings from continuing operations | $ | 178.7 | $ | 34.6 | $ | 213.3 | |||||
Effective tax rate | 18.7 | % | 23.1 | % | |||||||
2015 | |||||||||||
Reported | Adjustments (1) | Adjusted (Non-GAAP) | |||||||||
(Loss) earnings from continuing operations before income taxes | $ | (458.7 | ) | $ | 687.1 | $ | 228.4 | ||||
Income tax (benefit) provision | (162.6 | ) | 215.8 | 53.2 | |||||||
(Loss) earnings from continuing operations | $ | (296.1 | ) | $ | 471.3 | $ | 175.2 | ||||
Effective tax rate | 35.4 | % | 23.2 | % | |||||||
(1) | Includes adjustments for the Venezuela deconsolidation charge, spin costs, restructuring charges, Industrial sale charges, Cost of early debt retirements, impairment charges and the associated tax impact of these charges, as well as adjustments to prior years' tax accruals. See reconciliation of net earnings to adjusted net earnings. |
Our effective tax rate is highly sensitive to the mix of countries from which earnings or losses are derived. Declines in earnings in lower tax rate jurisdictions, earnings increases in higher tax rate jurisdictions, repatriation of foreign earnings or operating losses in the future could increase future tax rates. Additionally, adjustments to prior year tax provision estimates could increase or decrease future tax provisions.
Segment Results
Segment performance is evaluated based on segment profit, exclusive of general corporate expenses, share-based compensation costs, costs associated with restructuring initiatives, the Venezuela deconsolidation charge, the sale of the industrial blade business, Cost of early debt retirements, and the amortization and impairment of intangible assets. Financial items, such as interest income and expense, are managed on a global basis at the corporate level. The exclusion of such charges from segment results reflects management's view on how it evaluates segment performance.
Our operating model includes some shared business functions across the segments, including product warehousing and distribution, transaction processing functions, and in most cases a combined sales force and management teams. We apply a fully allocated cost basis, in which shared business functions are allocated between the segments on a percentage of net sales basis. Such allocations are estimates, and do not represent the costs of such services if performed on a stand-alone basis.
The following tables present changes in segment net sales and segment profit for fiscal 2017 and 2016, as compared to the corresponding prior year periods, and also provide a reconciliation of organic segment net sales and organic segment profit to reported amounts. For a reconciliation of segment profit to Earnings (loss) from continuing operations before income taxes, see Note 18 of Notes to Consolidated Financial Statements.
33
Wet Shave
Net Sales - Wet Shave | |||||||||||||
For the Years Ended September 30, | |||||||||||||
2017 | %Chg | 2016 | %Chg | ||||||||||
Net sales - prior year | $ | 1,425.8 | $ | 1,441.3 | |||||||||
Organic | (39.2 | ) | (2.7 | )% | 25.5 | 1.8 | % | ||||||
Impact of Venezuela | — | — | % | (24.0 | ) | (1.7 | )% | ||||||
Impact of currency | (11.3 | ) | (0.8 | )% | (17.0 | ) | (1.2 | )% | |||||
Net sales - current year | $ | 1,375.3 | (3.5 | )% | $ | 1,425.8 | (1.1 | )% | |||||
Wet Shave net sales for fiscal 2017 decreased 3.5%, inclusive of a 0.8% decline due to currency movements. Excluding the impact of currency movements, organic net sales decreased $39.2, or 2.7%, primarily driven by volume declines. Volume declines in North America were driven by all categories of Wet Shave. The North America Wet Shave category continued to be disrupted with increased competitive activity and unprecedented levels of pricing and promotional pressure since the second quarter of fiscal 2017. International Wet Shave experienced declines primarily related to higher prior year promotional activity and competitive pressure and category softness primarily in Europe. Shaving gels and creams experienced competitive pressure, distribution losses and discontinuations globally.
Wet Shave net sales for fiscal 2016 decreased 1.1%, inclusive of a 1.2% decline due to currency movements and a 1.7% decline due to the impact of Venezuela. Excluding the impact of currency movements and Venezuela, organic net sales increased $25.5, or 1.8%, including an estimated $29.0 negative impact from international go-to-market changes. Excluding the impact of international go-to-market changes, underlying net sales grew by 3.7%. The improvement in organic net sales was primarily driven by favorable price mix due to lower coupons and promotional activity, International price increases and Hydro volume increases due to a new product launch.
Segment Profit - Wet Shave | |||||||||||||
For the Years Ended September 30, | |||||||||||||
2017 | %Chg | 2016 | %Chg | ||||||||||
Segment profit - prior year | $ | 290.2 | $ | 308.7 | |||||||||
Organic | 8.3 | 2.9 | % | (7.9 | ) | (2.6 | )% | ||||||
Impact of Venezuela | — | — | % | (9.4 | ) | (3.0 | )% | ||||||
Impact of currency | (3.6 | ) | (1.3 | )% | (1.2 | ) | (0.4 | )% | |||||
Segment profit - current year | $ | 294.9 | 1.6 | % | $ | 290.2 | (6.0 | )% | |||||
Wet Shave segment profit for fiscal 2017 was $294.9, up $4.7 or 1.6%, inclusive of the impact of currency movements. Excluding the impact of currency movements, organic segment profit increased $8.3, or 2.9%, primarily due to improved operational efficiencies, lower commodity costs and decreased A&P spend, partially offset by lower organic net sales.
Wet Shave segment profit for fiscal 2016 was $290.2, down $18.5 or 6.0%, inclusive of the impact of currency movements and Venezuela. Excluding the impact of currency movements and Venezuela, organic segment profit decreased $7.9, or 2.6%, primarily due to lower volumes and increased SG&A, partially offset by favorable price mix and decreased A&P spend.
34
Sun and Skin Care
Net Sales - Sun and Skin Care | |||||||||||||
For the Years Ended September 30, | |||||||||||||
2017 | %Chg | 2016 | %Chg | ||||||||||
Net sales - prior year | $ | 414.9 | $ | 403.6 | |||||||||
Organic | 13.2 | 3.2 | % | 18.6 | 4.6 | % | |||||||
Impact of acquisition | 14.6 | 3.5 | % | — | — | % | |||||||
Impact of currency | (2.3 | ) | (0.6 | )% | (7.3 | ) | (1.8 | )% | |||||
Net sales - current year | $ | 440.4 | 6.1 | % | $ | 414.9 | 2.8 | % | |||||
Sun and Skin Care net sales for fiscal 2017 increased 6.1%, inclusive of a 3.5% increase related to the acquisition of Bulldog and a 0.6% decline due to currency movements. Excluding the impact of the Bulldog acquisition and currency movements, organic segment net sales increased $13.2, or 3.2%, with strong performance by Banana Boat and Hawaiian Tropic products globally, driven by higher volumes, lower returns and favorable price mix, partially offset by a $8.2 decline related to exiting the private label sun care business.
Sun and Skin Care net sales for fiscal 2016 increased 2.8%, inclusive of a 1.8% decline due to currency movements. Excluding the impact of currency movements, organic segment net sales increased $18.6, or 4.6%, including an estimated $3.0 negative impact from international go-to-market changes. The increase in organic net sales was primarily driven by higher North America volumes on favorable category growth due to weather trends. Sales growth of sun care products were partially offset by declines in skin care due to lower sales of gloves and Wet Ones.
Segment Profit - Sun and Skin Care | |||||||||||||
For the Years Ended September 30, | |||||||||||||
2017 | %Chg | 2016 | %Chg | ||||||||||
Segment profit - prior year | $ | 89.5 | $ | 71.5 | |||||||||
Organic | 10.2 | 11.4 | % | 20.9 | 29.2 | % | |||||||
Impact of acquisition | 0.3 | 0.3 | % | — | — | % | |||||||
Impact of currency | (1.2 | ) | (1.3 | )% | (2.9 | ) | (4.0 | )% | |||||
Segment profit - current year | $ | 98.8 | 10.4 | % | $ | 89.5 | 25.2 | % | |||||
Sun and Skin Care segment profit for fiscal 2017 was $98.8, an increase of $9.3 or 10.4%, inclusive of the impact of the acquisition of Bulldog and unfavorable currency movements. Excluding the impact of the Bulldog acquisition and currency movements, organic segment profit increased $10.2, or 11.4%, driven primarily by higher volumes, lower returns and favorable price mix, as well as favorable material costs and increased operational efficiencies, which were partially offset by increased A&P spend.
Sun and Skin Care segment profit for fiscal 2016 was $89.5, an increase of $18.0 or 25.2%, inclusive of the impact of currency movements. Excluding the impact of currency movements, organic segment profit increased $20.9, or 29.2%, driven by the increase in organic segment net sales and decreased investment in A&P.
35
Feminine Care
Net Sales - Feminine Care | |||||||||||||
For the Years Ended September 30, | |||||||||||||
2017 | %Chg | 2016 | %Chg | ||||||||||
Net sales - prior year | $ | 388.9 | $ | 398.2 | |||||||||
Organic | (37.6 | ) | (9.7 | )% | (7.1 | ) | (1.8 | )% | |||||
Impact of currency | 0.3 | 0.1 | % | (2.2 | ) | (0.5 | )% | ||||||
Net sales - current year | $ | 351.6 | (9.6 | )% | $ | 388.9 | (2.3 | )% | |||||
Feminine Care net sales for fiscal 2017 decreased $37.3, or 9.6%, inclusive of a 0.1% increase due to currency movements. Excluding the impact of currency movements, organic segment net sales decreased $37.6, or 9.7%, driven by volume declines across Gentle Glide, Stayfree, Carefree and Sport branded tampons, pads and liners related to distribution losses and heightened competitive pressure, partially offset by lower promotional spend in the current year period.
Feminine Care net sales for fiscal 2016 decreased 2.3%, inclusive of a 0.5% decline due to currency movements. Excluding the impact of currency movements, organic segment net sales decreased $7.1, or 1.8%, including an estimated $2.0 negative impact from international go-to-market changes. Excluding the impact of international go-to-market changes, underlying net sales decreased 1.3%, driven by declines in pads, partially offset by increases in tampons and liners.
Segment Profit - Feminine Care | |||||||||||||
For the Years Ended September 30, | |||||||||||||
2017 | %Chg | 2016 | %Chg | ||||||||||
Segment profit - prior year | $ | 39.1 | $ | 48.7 | |||||||||
Organic | (10.2 | ) | (26.1 | )% | (7.9 | ) | (16.2 | )% | |||||
Impact of currency | — | — | % | (1.7 | ) | (3.5 | )% | ||||||
Segment profit - current year | $ | 28.9 | (26.1 | )% | $ | 39.1 | (19.7 | )% | |||||
Feminine Care segment profit for fiscal 2017 was $28.9, a decrease of $10.2, or 26.1%, primarily due to volume declines and transition costs related to the shift of manufacturing from Montreal to Dover, Delaware, partially offset by favorable material costs.
Feminine Care segment profit for fiscal 2016 was $39.1, a decrease of $9.6, or 19.7%, inclusive of the impact of currency movements. Excluding the impact of currency movements, organic segment profit decreased $7.9, or 16.2%, primarily due to lower net sales, start-up costs related to the production consolidation into the U.S. plant and higher SG&A, offset by decreased investment in A&P.
All Other
Net Sales - All Other | |||||||||||||
For the Years Ended September 30, | |||||||||||||
2017 | %Chg | 2016 | %Chg | ||||||||||
Net sales - prior year | $ | 132.4 | $ | 178.1 | |||||||||
Organic | (1.4 | ) | (1.1 | )% | (2.1 | ) | (1.2 | )% | |||||
Impact of currency | 0.1 | 0.1 | % | (1.7 | ) | (1.0 | )% | ||||||
Impact of Industrial | — | — | % | (41.9 | ) | (23.5 | )% | ||||||
Net sales - current year | $ | 131.1 | (1.0 | )% | $ | 132.4 | (25.7 | )% | |||||
All Other net sales for fiscal 2017 decreased 1.0%, inclusive of a 0.1% increase due to the impact of currency movements. Excluding the impact of currency movements, organic net sales decreased $1.4, or 1.1%, as a result of volume declines in infant cups and bottles, partially offset by growth in Diaper Genie and pet care products.
36
All Other net sales for fiscal 2016 decreased 25.7%, inclusive of a 1.0% decline due to the impact of currency movements and a 23.5% decline due to the negative impact of Industrial. Excluding the impact of currency movements and Industrial, organic net sales decreased $2.1, or 1.2%, primarily due to lower volume on Playtex bottles and cups as a result of ongoing competitive pressure, offset in part by increased sales on Diaper Genie.
Segment Profit - All Other | |||||||||||||
For the Years Ended September 30, | |||||||||||||
2017 | %Chg | 2016 | %Chg | ||||||||||
Segment profit - prior year | $ | 28.4 | $ | 24.6 | |||||||||
Organic | (1.9 | ) | (6.7 | )% | 7.2 | 29.3 | % | ||||||
Impact of currency | 0.1 | 0.4 | % | (1.2 | ) | (5.0 | )% | ||||||
Impact of Industrial | — | — | % | (2.2 | ) | (8.9 | )% | ||||||
Segment profit - current year | $ | 26.6 | (6.3 | )% | $ | 28.4 | 15.4 | % | |||||
All Other segment profit for fiscal 2017 was $26.6, a decrease of $1.8 or 6.3%, inclusive of the impact of currency movements. Excluding the impact of currency movements, segment profit decreased $1.9, or 6.7%, as lower spending and favorable price mix were more than offset by unfavorable product costs.
All Other segment profit for fiscal 2016 was $28.4, an increase of $3.8 or 15.4%, inclusive of the impact of currency movements and the negative impact of Industrial. Excluding the impact of currency movements and Industrial, segment profit increased $7.2, or 29.3%, as lower sales were more than offset by favorable product costs and lower spending.
General Corporate and Other Expenses
Fiscal Year | |||||||||||
2017 | 2016 | 2015 | |||||||||
Corporate expenses | $ | 76.0 | $ | 80.4 | $ | 122.0 | |||||
Impairment charge | 319.0 | 6.5 | 318.2 | ||||||||
Venezuela deconsolidation charge | — | — | 79.3 | ||||||||
Spin costs (1) | — | 12.0 | 142.0 | ||||||||
Spin restructuring charges | — | — | 28.3 | ||||||||
Restructuring and related costs (2) | 30.3 | 38.8 | 27.0 | ||||||||
Industrial sale charges | — | 0.2 | 32.7 | ||||||||
General corporate and other expenses | $ | 425.3 | $ | 137.9 | $ | 749.5 | |||||
% of net sales | 18.5 | % | 5.8 | % | 31.0 | % | |||||
(1) | Includes SG&A of $11.8, and $137.8 and for fiscal 2016 and 2015, respectively, and Cost of products sold of $0.2 and $4.2 for fiscal 2016 and 2015, respectively. |
(2) | Includes SG&A of $0.3 for fiscal 2015, associated with certain information technology and related activities. Also includes Cost of products sold of $0.7 and $1.8 for fiscal 2017 and 2016, respectively, associated with obsolescence charges related to the exit of certain non-core product lines as part of the restructuring. |
General Corporate and Other Expenses
For fiscal 2017, general corporate expenses were $76.0, a decrease of $4.4 as compared to fiscal 2016, primarily related to lower share-based and incentive compensation expense and savings realized from the Company's Zero Based Spending program. Fiscal 2016 general corporate expenses decreased $41.6 when compared to fiscal 2015, due primarily to the Separation. We estimate that fiscal 2015 included approximately $47.5 of general corporate expenses to support the Household Products business that were not reported in discontinued operations. For fiscal 2015, we estimated this impact by allocating a portion of general corporate expenses to the Household Products business based on net sales.
37
Liquidity and Capital Resources
At September 30, 2017, substantially all of our cash balances were located outside the U.S. Given our extensive international operations, a significant portion of our cash is denominated in foreign currencies. We manage our worldwide cash requirements by reviewing available funds among the many subsidiaries through which we conduct business and the cost effectiveness with which those funds can be accessed. We generally repatriate a portion of current year earnings from select non-US subsidiaries only if the economic cost of the repatriation is not considered material.
The counterparties to deposits consist of a number of major financial institutions. We consistently monitor positions with, and credit ratings of, counterparties both internally and by using outside ratings agencies.
Our total borrowings were $1,544.8 at September 30, 2017, including $429.7 tied to variable interest rates. Our total borrowings at September 30, 2016 were $1,844.5.
As of September 30, 2017, we had outstanding borrowings of $245.0 under our unsecured revolving credit facility in the U.S. (the "Revolving Facility") and $8.0 of outstanding letters of credit. Taking into account outstanding borrowings and outstanding letters of credit at September 30, 2017, $472.0 remains available under the Revolving Facility. As of September 30, 2017 and 2016, we had $185.0 outstanding under a term loan.
On March 13, 2017, we entered into Amendment No. 3 to the Revolving Facility (the "Amendment"), and an Increasing Lender Support Supplement to the Revolving Facility (the "Supplement"). The Amendment and the Supplement provide for an increase of $75.0 (from $650.0 to $725.0) in the revolving loans available to us. Additionally, certain other changes were made to the Revolving Facility, including allowing us to enter into receivables sales facilities for up to $150.0.
On October 20, 2016, we terminated our commitments under our revolving credit facility in the Netherlands (the "Netherlands Credit Facility) and repaid all amounts in full totaling $277.0. As of September 30, 2016, we had $281.8 outstanding under the Netherlands Credit Facility.
On September 15, 2017, we entered into an uncommitted master accounts receivable purchase agreement (the "Receivables Purchase Agreement") with The Bank of Tokyo-Mitsubishi UFJ, Ltd., New York Branch, as the Purchaser ("BTMU"). Under this agreement, we can sell a pool of trade accounts receivable from certain customers to the Purchaser on a revolving basis. subject to specific sub-limits for each customer. The Purchaser may purchase receivables at face value less a dilution reserve, adjusted annually based on historical data and the discount rate. As of September 30, 2017, the discount rate used to determine the purchase price for the receivables is based upon LIBOR plus a margin applicable to the specified customer. We service and administer the subject receivables for BTMU and are paid a servicing fee. The maximum amount which may be advanced at any one time in the form of a discounted purchase price for the receivables sold is $150 million. The term of the Receivables Purchase Agreement will end on September 14, 2018, subject to automatic 364-day extensions unless we or BTMU elect not to extend the term. Additionally, we or BTMU may terminate the Receivables Purchase Agreement at any time after the initial 364-day term upon 30 days written notice. Receivables sold for the year ended September 30, 2017 were $98.1 million. Our operating cash flows were positively impacted by the amount of the receivables sold. The receivables sold that remained outstanding as of September 30, 2017 were $81.7 million.
We had outstanding international borrowings, recorded within Notes payable, of $19.4 and $18.5 as of September 30, 2017 and September 30, 2016, respectively.
In fiscal 2018, we expect our total capital expenditures to be in the range of $50 to $60 primarily related to maintenance of manufacturing facilities, new products and information technology system enhancements. While we intend to fund these capital expenditures with cash generated from operations, we may also utilize our borrowing facilities.
During fiscal 2017, we contributed $6.0 to our pension plans. The expected minimum required contribution to our pension plans in fiscal 2018 is $9.6; however, discretionary contributions may be made.
38
Debt Covenants
The credit agreements governing our outstanding debt at September 30, 2017 contain certain customary representations and warranties, financial covenants, covenants restricting our ability to take certain actions, affirmative covenants and provisions relating to events of default. Under the terms of our credit agreements, the ratio of our indebtedness to our earnings before interest, taxes, depreciation and amortization ("EBITDA"), as defined in the agreement and detailed below, cannot be greater than 4.0 to 1, and may not remain above 3.5 to 1 for more than four consecutive quarters. In addition, under the credit agreements, the ratio of our current year earnings before interest and taxes ("EBIT"), as defined in the agreements, to total interest expense must exceed 3.0 to 1. Under the credit agreements, EBITDA is defined as net earnings, as adjusted to add-back interest expense, income taxes, depreciation and amortization, all of which are determined in accordance with GAAP. In addition, the credit agreement allows certain non-cash charges such as stock award amortization and asset write-offs including, but not limited to, impairment and accelerated depreciation, to be "added-back" in determining EBITDA for purposes of the indebtedness ratio. Total debt is calculated in accordance with GAAP, but excludes outstanding borrowings under the Netherlands Credit Facility (which was repaid in October 2016). EBIT is calculated in a fashion identical to EBITDA except that depreciation and amortization are not "added-back." Total interest expense is calculated in accordance with GAAP. If we fail to comply with these covenants or with other requirements of these credit agreements, the lenders may have the right to accelerate the maturity of the debt. Acceleration under one of our facilities would trigger cross defaults on our other borrowings.
As of September 30, 2017 we were in compliance with the provisions and covenants associated with these debt agreements.
Cash Flows
Our cash flow statements in fiscal 2015 were not required to be adjusted for discontinued operations. Accordingly, fiscal 2015 included nine months of activity for the Household Products business. A summary of our cash flow from operating, investing and financing activities is provided in the following table:
Fiscal Year | |||||||||||
2017 | 2016 | 2015 | |||||||||
Net cash from (used by): | |||||||||||
Operating activities | $ | 296.2 | $ | 176.4 | $ | 148.8 | |||||
Investing activities | (84.6 | ) | (69.5 | ) | (174.8 | ) | |||||
Financing activities | (460.6 | ) | (83.0 | ) | (327.2 | ) | |||||
Effect of exchange rate changes on cash | 13.0 | 2.9 | (63.7 | ) | |||||||
Net (decrease) increase in cash and cash equivalents | $ | (236.0 | ) | $ | 26.8 | $ | (416.9 | ) | |||
Operating Activities
Cash flow from operating activities was $296.2 in fiscal 2017, as compared to $176.4 in fiscal 2016. The improvement is primarily reflective of the discretionary funding of certain international defined benefit plans of $100.5 during fiscal 2016 and higher fiscal 2017 adjusted net earnings, partially offset by a $17.7 increase in deferred compensation payments.
Cash flow from operating activities was $176.4 in fiscal 2016, as compared to $148.8 in fiscal 2015. The improvement in cash flow from operating activities was primarily due to improvements in cash earnings as a result of the significant decrease in Separation-related expenditures in fiscal 2016 as compared to fiscal 2015. Improvements in cash earnings were partially offset by the discretionary funding of certain international defined benefit plans of $100.5 during fiscal 2016 and by working capital changes which reduced cash flow by $18.5.
39
Investing Activities
Cash flow used by investing activities was $84.6 in fiscal 2017 as compared to $69.5 in the prior year. The increase was primarily due to the $34.0 acquisition of Bulldog in fiscal 2017, partially offset by proceeds from the sale of assets. Capital expenditures were $69.0 during fiscal 2017 and $69.5 during the prior year.
Cash flow used by investing activities was $69.5 in fiscal 2016 as compared to $174.8 in fiscal 2015. The decrease was primarily due to the deconsolidation of our Venezuelan subsidiaries and a fiscal 2015 acquisition for our discontinued operations, partially offset by proceeds from the sale of assets in fiscal 2015. Capital expenditures were $69.5 during fiscal 2016 and $99.4 during fiscal 2015. Excluding capital expenditures related to the Household Products business, capital expenditures during fiscal 2015 were $63.7. The $5.8 increase in fiscal 2016 primarily related to streamlining of certain operating facilities within the Feminine Care Segment.
Financing Activities
Net cash used by financing activities was $460.6 in fiscal 2017 as compared to $83.0 in fiscal 2016. The $377.6 increase in net cash used by financing activities was driven by the repayment of the Netherlands Credit Facility for $277.0 in fiscal 2017 and a $132.2 reduction in net borrowings on other debt instruments, partially offset by a decrease in the repurchase of common shares of $31.2.
Net cash used by financing activities was $83.0 in fiscal 2016 as compared to $327.2 in fiscal 2015. This change was driven by $499.7 of cash transferred to New Energizer upon Separation and cash dividends of $93.2 during fiscal 2015, partially offset by a decrease in net borrowings of $337.4 and a $21.4 increase in repurchases of common shares during fiscal 2016.
Dividends
We did not declare or pay any cash dividends during fiscal 2017, and we do not currently intend to pay dividends in the foreseeable future. Any future dividends are dependent on future earnings, capital requirements and our financial condition, and will be declared at the sole discretion of the Board. See "We do not expect to pay dividends for the foreseeable future" in Item 1A. Risk Factors.
Share Repurchases
In May 2015, the Board approved an authorization to repurchase up to 10.0 shares of our common stock. This authorization replaced a prior share repurchase authorization. During fiscal 2017, we repurchased 2.2 shares of our common stock for $165.4, all of which were purchased under this authorization. We have 3.3 shares remaining under the Board authorization to repurchase our common shares in the future. Future share repurchases, if any, would be made in the open market, privately negotiated transactions or otherwise, in such amounts and at such times as we deem appropriate based upon prevailing market conditions, business needs and other factors. See "There can be no guarantee that we will repurchase stock" in Item 1A. Risk Factors.
During fiscal 2017, 0.2 shares were purchased related to the surrender of shares of common stock to satisfy tax withholding obligations in connection with the vesting of restricted stock equivalent awards.
Inflation
Management recognizes that inflationary pressures may have an adverse effect on us through higher material, labor and transportation costs, asset replacement costs and related depreciation, and healthcare and other costs. In general, we have been able to offset or minimize inflation effects through a variety of methods including pricing actions, cost reductions and productivity improvements. We can provide no assurance that such mitigation will be available in the future.
40
Seasonality
Customer orders for sun care products within our Sun and Skin Care segment are highly seasonal. This has historically resulted in higher sun care sales to retailers during the late winter through mid-summer months. Within our Wet Shave segment, sales of women's products are moderately seasonal, with increased consumer demand in the spring and summer months. See "Our business is subject to seasonal volatility" in Item 1A. Risk Factors.
Foreign Currency
Certain net sales and costs of our international operations are denominated in the local currency of the respective countries. As such, sales and profits from these subsidiaries may be impacted by fluctuations in the value of these local currencies relative to the U.S. dollar. We also have significant intercompany financing arrangements that may result in gains and losses in our results of operations. In an effort to mitigate the impact of currency exchange rate effects, we may hedge certain operational and intercompany transactions; however, our hedging strategies may not fully offset gains and losses recognized in our results of operations.
On June 23, 2016, the U.K. held a referendum in which voters approved an exit from the European Union (the "E.U."), commonly referred to as "Brexit," and on March 29, 2017, the U.K. began the process to withdraw from the E.U. As a result, the global markets and currencies have been adversely impacted, including a sharp decline in the value of the British Pound as compared to the U.S. dollar and other foreign currencies. Volatility in exchange rates is expected to continue as the U.K. negotiates its exit from the E.U. Historically, our hedging strategy has included hedging a portion of our exposure to the British Pound, thereby reducing our currency risk. We routinely monitor and evaluate this strategy based on risk, and will adjust as necessary to minimize exposure to fluctuations in exchange rates related to our U.K. operations. A weaker British Pound as compared to the U.S. dollar during a reporting period causes the local currency results of our U.K. operations to be translated into fewer U.S. dollars. For fiscal 2017, net sales of our U.K. operations were 4.0% of our consolidated net sales. Future impacts on our U.K. operations and financial results will depend, in part, on the outcome of tariff, trade, regulatory and other negotiations. See "Our financial results could be adversely impacted by the United Kingdom's departure from the European Union" in Item 1A. Risk Factors.
Commitments and Contingencies
Contractual Obligations
A summary of our significant contractual obligations at September 30, 2017 is shown below:
Total | Less than 1 year | 1-3 years | 3-5 years | More than 5 years | |||||||||||||||
Long-term debt, including current maturities | $ | 1,530.0 | $ | — | $ | 430.0 | $ | 1,100.0 | $ | — | |||||||||
Interest on long-term debt | 256.1 | 63.2 | 117.8 | 75.1 | — | ||||||||||||||
Notes payable | 19.4 | 19.4 | — | — | — | ||||||||||||||
Minimum pension funding (1) | 54.6 | 9.6 | 17.9 | 27.1 | — | ||||||||||||||
Operating leases | 36.2 | 12.8 | 16.0 | 5.7 | 1.7 | ||||||||||||||
Purchase obligations and other (2) (3) | 69.0 | 34.2 | 15.8 | 10.8 | 8.2 | ||||||||||||||
Total | $ | 1,965.3 | $ | 139.2 | $ | 597.5 | $ | 1,218.7 | $ | 9.9 | |||||||||
(1) | Globally, our total pension contributions in the next twelve months are estimated to be approximately $9.6. U.S. pension plans constitute 69% of the total benefit obligations and plan assets for our pension plans. The estimates beyond fiscal 2018 represent future pension payments to comply with local funding requirements in the U.S. only. The projected payments beyond fiscal 2022 are not currently determinable. |
(2) | Included in the table above are approximately $36.0 of fixed costs related to third-party logistics contracts. |
(3) | Included in the table above are approximately $13.8 of deferred compensation payments to retirees. |
41
Purchase obligations set forth in the table above represent contractual obligations that generally have longer terms and are non-routine in nature. We are also party to various service and supply contracts that generally extend one to three months. These arrangements are primarily individual, short-term purchase orders for routine goods and services at market prices, which are part of our normal operations and are reflected in historical operating cash flow trends. These contracts can generally be canceled at our option at any time. We do not believe such arrangements will adversely affect our liquidity position. In addition, we have various commitments related to service and supply contracts that contain penalty provisions for early termination. Because of the short period between order and shipment date (generally less than one month) for most of our orders, the dollar amount of current backlog is not material and is not considered to be a reliable indicator of future sales volume. Generally, sales to our top customers are made pursuant to purchase orders and we do not have supply agreements or guarantees of minimum purchases from them. As a result, these customers may cancel their purchase orders or reschedule or decrease their level of purchases from us at any time. As of September 30, 2017, we do not believe such purchase arrangements or termination penalties will have a significant effect on our results of operations, financial position or liquidity position in the future. As such, these arrangements have been excluded from the table above.
Environmental Matters
Our operations, like those of other companies, are subject to various federal, state, foreign and local laws and regulations intended to protect the public health and the environment. These regulations relate primarily to worker safety, air and water quality, underground fuel storage tanks and waste handling and disposal. Accrued environmental costs at September 30, 2017 were $11.9. It is difficult to quantify with certainty the cost of environmental matters, particularly remediation and future capital expenditures for environmental control equipment. Total environmental capital expenditures and operating expenses are not expected to have a material effect on our total capital and operating expenditures, consolidated earnings or competitive position. However, current environmental spending estimates could be modified as a result of changes in our plans or our understanding of underlying facts, changes in legal requirements, including any requirements related to global climate change, or other factors.
Legal and Other Contingencies
We, and our affiliates, are subject to a number of legal proceedings in various jurisdictions arising out of our operations during the ordinary course of business. Many of these legal matters are in preliminary stages and involve complex issues of law and fact, and may proceed for protracted periods of time. The amount of liability, if any, from these proceedings cannot be determined with certainty. We review our legal proceedings and claims, regulatory reviews and inspections and other legal proceedings on an ongoing basis and follow appropriate accounting guidance when making accrual and disclosure decisions. We establish accruals for those contingencies when the incurrence of a loss is probable and can be reasonably estimated, and disclose the amount accrued and the amount of a reasonably possible loss in excess of the amount accrued, if such disclosure is necessary for our financial statements to not be misleading. We do not record liabilities when the likelihood that the liability has been incurred is probable, but the amount cannot be reasonably estimated. Based upon present information, we believe that our liability, if any, arising from such pending legal proceedings, asserted legal claims and known potential legal claims, which are likely to be asserted, is not reasonably likely to be material to our financial position, results of operations or cash flows, taking into account established accruals for estimated liabilities.
Critical Accounting Policies
The methods, estimates and judgments we use in applying our most critical accounting policies have a significant impact on the results we report in our consolidated financial statements. Specific areas, among others, requiring the application of management's estimates and judgment include assumptions pertaining to accruals for consumer and trade-promotion programs, pension and postretirement benefit costs, share-based compensation, future cash flows associated with impairment testing of goodwill and other long-lived assets, uncertain tax positions, the reinvestment of undistributed foreign earnings and tax valuation allowances. On an ongoing basis, we evaluate our estimates, but actual results could differ materially from those estimates.
Our most critical accounting policies are revenue recognition, pension and other postretirement benefits, share-based compensation, the valuation of long-lived assets (including property, plant and equipment), income taxes (including uncertain tax positions) and the carrying value of intangible assets (and the related impairment testing of goodwill and other indefinite-lived intangible assets). A summary of our significant accounting policies is contained in Note 2 of Notes to Consolidated Financial Statements. This listing is not intended to be a comprehensive list of all of our accounting policies.
42
Revenue Recognition
We derive revenues from the sale of our products. Revenue is recognized when title, ownership and risk of loss pass to the customer. When discounts are offered to customers for early payment, an estimate of the discounts is recorded as a reduction of net sales in the same period as the sale. Standard sales terms are final and, except for seasonal sun care returns which are discussed in detail in the next paragraph, returns or exchanges are not permitted unless a special exception is made. Reserves are established and recorded in cases where the right of return exists for a particular sale.
Under certain circumstances, we allow customers to return sun care products that have not been sold by the end of the sun care season, which is normal practice in the sun care industry. We record sales at the time the title, ownership and risk of loss pass to the customer. The terms of these sales vary, but in all instances the following conditions are met: the sales arrangement is evidenced by purchase orders submitted by customers; the selling price is fixed or determinable; title to the product has transferred; there is an obligation to pay at a specified date without any additional conditions or actions required by us; and collection is reasonably assured. Simultaneous with the sale, we reduce sales and cost of sales, and reserve amounts on the Consolidated Balance Sheet for anticipated returns based upon an estimated return level, in accordance with GAAP. Customers are required to pay for the sun care product purchased during the season under the required terms. We generally receive returns of U.S. sun care products from September through January following the summer sun care season. We estimate the level of sun care returns using a variety of inputs including historical experience, consumption trends during the sun care season, obsolescence factors, including expiration dates, and inventory positions at key retailers as the sun care season progresses. We monitor shipment activity and inventory levels at key retailers during the season to more accurately estimate potential returns. This allows us to manage shipment activity to our customers, especially in the latter stages of the sun care season, to reduce the potential for returned product. The level of returns may fluctuate from our estimates due to several factors including weather conditions, customer inventory levels and competitive activity. Based on our fiscal 2017 sun care shipments, each percentage point change in our returns rate would have impacted our reported net sales by $3.0 and our reported operating income by $2.8. At September 30, 2017 and 2016, our reserve on the Consolidated Balance Sheet for returns was $53.3 and $49.9, respectively.
We offer a variety of programs, primarily to our retail customers, designed to promote sales of our products. Such programs require periodic payments and allowances based on estimated results of specific programs and are recorded as a reduction to net sales. We accrue, at the time of sale, the estimated total payments and allowances associated with each transaction. Additionally, we offer programs directly to consumers to promote the sale of our products. Promotions which reduce the ultimate consumer sale prices are recorded as a reduction of net sales at the time the promotional offer is made, generally using estimated redemption and participation levels. Taxes we collect on behalf of governmental authorities, which are generally included in the price to the customer, are also recorded as a reduction of net sales.
We continually assess the adequacy of accruals for customer and consumer promotional program costs not yet paid. To the extent total program payments differ from estimates, adjustments may be necessary. Historically, these adjustments have not been material to annual results.
Pension Plans and Other Postretirement Benefits
The determination of our obligation and expense for pension and other postretirement benefits is dependent on certain assumptions developed by us and used by actuaries in calculating such amounts. Assumptions include, among others, the discount rate, future salary increases, where applicable, and the expected long-term rate of return on plan assets. Actual results that differ from assumptions made are recognized on the balance sheet and subsequently amortized to earnings over future periods. Significant differences in actual experience or significant changes in macroeconomic conditions resulting in changes to assumptions may materially affect pension and other postretirement obligations. This has been evident in recent years, as market discount rates utilized to determine the actuarial valuation of plan liabilities have, collectively, moved significantly lower as compared to market interest rates prior to the most recent recession. This has resulted in higher actuarial pension liabilities over time and contributed to higher net periodic pension costs. In determining the discount rate, we use the yield on high-quality bonds that coincide with the cash flows of our plans' estimated payouts. For the U.S. plans, which represent our most significant obligations, we consider the Mercer yield curve in determining the discount rates.
In fiscal 2017, we changed the methodology used to estimate the service and interest components of net periodic benefit cost for our pension benefits, which resulted in a decrease in the service and interest components in fiscal 2017. We believe that the spot discount rate approach, which applies the specific spot rates along the yield curve used in the determination of the benefit obligation to the relevant projected cash flows, is a more precise application of the yield curve spot rates used in the traditional single discount rate approach. This change in methodology does not affect the measurement of our total benefit obligations but did cause an approximate $4 decline in our annual net periodic benefit cost in fiscal 2017. This change was accounted for prospectively as a change in accounting estimate.
43
Of the assumptions listed above, changes in the expected long-term rate of return on plan assets and changes in the discount rate used in developing plan obligations will likely have the most significant impact on our annual earnings, prospectively. Based on plan assets at September 30, 2017, a one percentage point decrease or increase in expected asset returns would increase or decrease our pension expense by approximately $5.1. In addition, it may increase and accelerate the rate of required pension contributions in the future. Uncertainty related to economic markets and the availability of credit may produce changes in the yields on corporate bonds rated as high-quality. As a result, discount rates based on high-quality corporate bonds may increase or decrease leading to lower or higher, respectively, pension obligations. A one percentage point decrease in the discount rate would increase pension obligations by approximately $81.9 at September 30, 2017.
As allowed under GAAP, our U.S. qualified pension plan uses Market Related Value, which recognizes market appreciation or depreciation in the portfolio over five years, thereby reducing the short-term impact of market fluctuations.
We have historically provided defined benefit pension plans to our eligible employees, former employees and retirees including those associated with New Energizer. As part of the Separation, and in accordance with an employee matters agreement entered into with New Energizer, certain combined plans were split between Edgewell and New Energizer. Accordingly, we transferred to New Energizer pension obligations associated with their active, retired and other former employees for those impacted defined benefit pension plans. The allocation of plan assets was determined in accordance with applicable ERISA (The Employee Retirement Income Security Act of 1974), Internal Revenue Service and other jurisdictional requirements. In June 2016, we transferred the remaining international pension obligation to New Energizer, which had been pending jurisdictional approval. In connection with this transfer, our pension liability decreased by approximately $11.6.
We fund our pension plans in compliance with ERISA or local funding requirements. We evaluated the discretionary funding of certain international defined benefit plans and contributed approximately $100.5 to one of these plans during the second quarter of fiscal 2016. Additionally, we remeasured the pension benefit obligation and unrecognized loss in Accumulated other comprehensive loss for the funded plan, using an updated discount rate of 2.40% as of January 31, 2016, increasing the liability and decreasing Accumulated other comprehensive loss by approximately $7.7.
Further detail on our pension and other postretirement benefit plans is included in Note 12 of Notes to Consolidated Financial Statements.
Share-Based Compensation
We grant RSE awards, which generally vest over two to four years. A portion of the RSE awards granted may provide for the issuance of common stock to certain managerial staff and executive management if we achieve specified performance targets. The estimated fair value of each grant issued is estimated on the date of grant based on the current market price of the shares. The total amount of compensation expense recognized reflects the initial assumption that target performance goals will be achieved. Compensation expense may be adjusted during the life of the performance grant based on management's assessment of the probability that performance goals will be achieved. If such goals are not met or it is determined that achievement of performance goals is not probable, compensation expense is adjusted to reflect the reduced expected payout level. If it is determined that the performance goals will be exceeded, additional compensation expense is recognized.
Non-qualified stock option awards ("share options") are granted at the market price on the grant date and generally vest ratably over three years. We calculate the fair value of total share-based compensation for share options using the Black-Scholes option pricing model, which utilizes certain assumptions and estimates that have a material impact on the amount of total compensation cost recognized in our consolidated financial statements, including the expected term, expected stock price volatility, risk-free interest rate and expected dividends. An additional assumption is made on the number of awards expected to forfeit prior to vesting. The original estimate of the grant date fair value is not subsequently revised unless the awards are modified, or there is a change in the number of awards expected to forfeit prior to vesting.
44
Valuation of Long-Lived Assets
We periodically evaluate our long-lived assets, including property, plant and equipment, goodwill and intangible assets, for potential impairment indicators. Judgments regarding the existence of impairment indicators, including lower than expected cash flows from acquired businesses, are based on legal factors, market conditions and operational performance. Future events could cause us to conclude that impairment indicators exist. We estimate fair value using valuation techniques such as discounted cash flows. This requires management to make assumptions regarding future income, working capital and discount rates, which would affect the impairment calculation. See the discussion on "Acquisitions, Goodwill and Intangible Assets" included later in this section for further information, including information on the non-cash impairment charges taken during fiscal 2017, 2016 and 2015.
In November 2012, the Board authorized an enterprise-wide restructuring plan. In January 2014, the Board authorized an expansion of the scope of the previously announced Restructuring project. We recorded accelerated depreciation of $1.8, $3.9 and $4.6 for fiscal 2017, 2016 and 2015, respectively, related primarily to certain manufacturing assets including property, plant and equipment located at facilities to be closed or streamlined as part of our restructuring initiatives. See Note 5 of Notes to Consolidated Financial Statements for further details.
Additionally, we initiated certain restructuring activities in connection with the Separation, in order to prepare both businesses to operate as stand-alone entities. The restructuring activities included efforts to: (i) adapt the global go-to-market footprint to adjust to the future strategies and scale of each stand-alone business; (ii) centralize certain back-office functions to increase efficiencies; (iii) outsource certain non-core transactional activities; and (iv) reduce headcount to optimize the cost structures of each stand-alone business. As part of these restructuring activities, we recorded non-cash asset impairment charges of $3.7 during fiscal 2015.
In May 2015, the Board authorized the strategic decision to exit our industrial business, which was part of our All Other segment, due to a shift of management focus to other segment products. During fiscal 2015, we incurred $21.9 of non-cash asset impairment charges and a $10.8 loss on sale of assets related to the sale of the business.
Income Taxes
Our annual effective income tax rate is determined based on our income, statutory tax rates and the tax impacts of items treated differently for tax purposes than for financial reporting purposes. Tax law requires certain items to be included in the tax return at different times than the items are reflected in the financial statements. Some of these differences are permanent, such as expenses that are not deductible in our tax return, and some differences are temporary, reversing over time, such as depreciation expense. These temporary differences create deferred tax assets and liabilities.
Deferred tax assets generally represent the tax effect of items that can be used as a tax deduction or credit in future years for which we have already recorded the tax benefit in our income statement. Deferred tax liabilities generally represent tax expense recognized in our financial statements for which payment has been deferred, the tax effect of expenditures for which a deduction has already been taken in our tax return but has not yet been recognized in our financial statements or assets recorded at estimated fair value in business combinations for which there was no corresponding tax basis adjustment.
We generally repatriate a portion of current year earnings from select non-US subsidiaries only if the economic cost of the repatriation is not considered material. Our intention is to reinvest earnings of other foreign subsidiaries indefinitely as the repatriation of cash balances could have adverse tax consequences or be subject to regulatory capital requirements; however, those balances are generally available without legal restrictions to fund ordinary business operations. No provision is made for additional taxes on undistributed earnings of foreign affiliates that are intended and planned to be indefinitely invested in foreign affiliates. We intend to reinvest these earnings indefinitely in our foreign subsidiaries to fund local operations, fund strategic growth objectives, fund pension and other postretirement obligations and fund capital projects. See Note 6 of Notes to Consolidated Financial Statements for further discussion.
We estimate income taxes and the effective income tax rate in each jurisdiction that we operate. This involves estimating taxable earnings, specific taxable and deductible items, the likelihood of generating sufficient future taxable income to utilize deferred tax assets, the portion of the income of foreign subsidiaries that is expected to be remitted to the U.S. and be taxable and possible exposures related to future tax audits. Deferred tax assets are evaluated on a subsidiary by subsidiary basis to ensure that the asset will be realized. Valuation allowances are established when the realization is not deemed to be more likely than not. Future performance is monitored, and when objectively measurable operating trends change, adjustments are made to the valuation allowances accordingly. To the extent the estimates described above change, adjustments to income taxes are made in the period in which the estimate is changed.
45
We operate in multiple jurisdictions with complex tax and regulatory environments, which are subject to differing interpretations by the taxpayer and the taxing authorities. At times, we may take positions that management believes are supportable, but are potentially subject to successful challenges by the appropriate taxing authority. We evaluate our tax positions and establish liabilities in accordance with guidance governing accounting for uncertainty in income taxes. We review these tax uncertainties in light of the changing facts and circumstances, such as the progress of tax audits, and adjust them accordingly.
Acquisitions, Goodwill and Intangible Assets
We allocate the cost of an acquired business to the assets acquired and liabilities assumed based on their estimated fair values at the date of acquisition. The excess value of the cost of an acquired business over the estimated fair value of the assets acquired and liabilities assumed is recognized as goodwill. The valuation of the acquired assets and liabilities will impact the determination of future operating results, as we recognize amortization expense on definite-lived intangible assets. We use a variety of information sources to determine the value of acquired assets and liabilities including: third-party appraisers for the values and lives of property, identifiable intangibles and inventories; actuaries for defined benefit retirement plans; and legal counsel or other experts to assess the obligations associated with legal, environmental or other claims. The recorded value of goodwill and intangible assets from recently acquired businesses are derived from more recent business operating plans and macroeconomic environmental conditions and, therefore, are likely more susceptible to an adverse change that could require an impairment charge. As such, significant judgment is required in estimating the fair value of goodwill and intangible assets. Additionally, judgment is needed when assigning a useful life to intangible assets.
We perform an annual test of impairment of the goodwill on each of our reporting units - Wet Shave, Sun Care, Skin Care, Feminine Care, Infant Care and All Other. As part of the goodwill impairment test we estimate the fair value of each reporting unit using both market and income approaches of valuation. The income approach utilizes the discounted cash flow method and incorporates significant estimates and assumptions, including long-term projections of future cash flows, market conditions, and discount rates reflecting the risk inherent in future cash flows. The projections for future cash flows are generated using the company’s strategic plan to determine a five-year period of forecasted cash flows and operating data. The market approach uses the guideline public company method to calculate the value of each reporting unit based on the operating data of similar assets from competing publicly traded companies. Multiples derived from guideline companies provide an indication of how much a knowledgeable investor in the marketplace would be willing to pay for a company. The multiples are adjusted given the specific characteristics of the reporting unit including its position in the market relative to the guideline companies and applied to the reporting unit’s operating data to arrive at an indication of value. The income and market approaches are weighted based on circumstances specific to each reporting unit and combined are used to calculate fair value.
Determining the fair value of a reporting unit requires the use of significant judgments, estimates and assumptions. While we believe that the estimates and assumptions underlying the valuation methodology are reasonable, these estimates and assumptions could have a significant impact on whether an impairment charge is recognized, and also on the magnitude of any such charge. The results of an impairment analysis are as of a point in time. There is no assurance that actual future earnings or cash flows of the reporting units will not decline significantly from these projections. We will monitor any changes to these assumptions and will evaluate goodwill as deemed warranted during future periods.
The key assumptions for the market and income approaches used to determine fair value of the reporting units are updated at least annually. Those assumptions and estimates include market data and market multiples, discount rates and terminal growth rates, as well as future levels of revenue growth, operating margins, depreciation, amortization and working capital requirements, which are based upon our strategic plan. The assumptions used for the goodwill impairment test for fiscal year 2017 include terminal growth rates ranging from 0.5% to 2.25% and a weighted average cost of capital ranging from 8.1% to 9.1%. The results of current year testing do not indicate that impairment exists as of the testing date. The fair values of our Skin Care and Feminine Care reporting units are between 110% and 120% of the respective carrying values. The carrying value of goodwill associated with our Skin Care and Feminine Care reporting units is $71.6 and $207.8, respectively.
We evaluate the fair value of indefinite-lived intangible assets annually in conjunction with the goodwill impairment test. Our assessment of intangible assets that have an indefinite life is based on a number of factors including the competitive environment, market share, brand history, underlying product life cycles, operating plans and the macroeconomic environment. Our assessment of intangible assets that have an indefinite life is based on a number of factors including the competitive environment, market share, brand history, underlying product life cycles, operating plans and the macroeconomic environment.
46
During the fourth quarter, we completed impairment testing on indefinite-lived intangible assets, which consist of trademarks and brand names used across our segments. The estimated fair value was determined using two income approaches: the multi-period excess earnings method and the relief-from-royalty method, both of which require significant assumptions, including estimates regarding future revenue and operating margin growth, discount rates, contributory asset charges and appropriate royalty rates. Revenue and operating margin growth assumptions are based on historical trends and management's expectations for future growth by brand. The discount rates were based on a weighted-average cost of capital utilizing industry market data of similar companies, in addition to estimated returns on the assets utilized in the operations of the applicable reporting unit, including net working capital, fixed assets and intangible assets. We estimated royalty rates based on operating profits of the brand.
Future changes in the judgments, assumptions and estimates that are used in our impairment testing, could result in significantly different estimates of the fair values in the future. An increase in discount rates, a reduction in projected cash flows or a combination of the two could lead to a reduction in the estimated fair values, which may result in impairment charges that could materially affect our financial statements in any given year.
In fiscal 2015, we determined that the carrying values of our Playtex, Wet Ones and Skintimate brand names were above the fair values, resulting in a non-cash asset impairment charge of $318.2. This charge, which was shown as a separate line item, is attributable to our segments as follows: $29.6 Wet Shave; $55.8 Sun and Skin Care; $161.3 Feminine Care and $71.5 All Other. The impairment of the Playtex brand in fiscal 2015 was primarily the result of slower adoption of new products and reductions in legacy product sales for certain feminine care products, as well as declines in certain international markets related to the Separation. In addition, the impairment of the Playtex brand was driven by our infant care products, where competitive pressures, delays in product launches and loss of licensing drove the sales decline. Both the Wet Ones and Skintimate impairments were primarily related to the introduction of competing products in the market, which resulted in share and margin declines.
During the fourth quarter of fiscal 2016, we completed our annual impairment testing and found the carrying value of our Skintimate brand name to be above the fair value, resulting in a non-cash asset impairment charge of $6.5. The fiscal 2016 impairment charge was caused by further market share erosion above previous estimates. Based on the impairments taken in fiscal 2016 and 2015 and continued competitive pressure on this brand, as of October 1, 2016, the Skintimate brand name was converted to a definite-lived asset and assigned a useful life of 20 years. This conversion increased amortization expense by $1.5 during fiscal 2017.
During the fourth quarter of fiscal 2017, we completed our annual impairment testing and found the carrying values of our Playtex and Edge brand names to be above fair value, resulting in a non-cash asset impairment charge of $312.0 and $7.0, respectively.
The 2017 Playtex impairment was largely driven by products in the feminine care reporting unit and to a lesser degree, by Playtex gloves and certain products in the infant care reporting unit. After the initial impairment in 2015, we were in the beginning stages of consolidating our feminine care manufacturing operations into one plant in the U.S., with the project expected to deliver significant cost savings for the manufacture of Playtex feminine care products, as well as our other feminine care products. We had also recently introduced our new Sport Pads and Liners products and were optimistic about their future growth as well as the potential for other new Playtex feminine care products in the development pipeline.
Sales of our legacy product, Gentle Glide, continued to decline in 2016 and 2017, due to competitive activity and market share declines. The Playtex brand name passed impairment testing in 2016, due to growth expected in Playtex Sport tampons with new media campaigns, new product launch estimates, and ongoing strong equity, as well as margin improvement due to cost savings from the consolidation of manufacturing operations, as well as new Playtex branded feminine care products in the development pipeline.
In 2017, heightened competitive activity and retail planogram compression led to lower than expected consumption and delistings of the new Sports Pads and Liners products. These products were discontinued in the fourth quarter of 2017.
In the 4th quarter of 2017, consumption, share and net sales declines accelerated due to further heightened competitive activity including product launches directed at the Sport franchise. In addition significant retail channel shifts within the category toward value and club impacted our share position. Competitive media spend increased almost 90% for the full fiscal year. When we completed our projections for the Playtex business in the fourth quarter of fiscal 2017, the future cash flows from our Playtex brands were significantly lower than previous projections due to lower sales as well as reduced profitability driven by higher unit costs. In October 2017, we completed the sale of our Playtex gloves business.
The Edge impairment is related to erosion of market share to competing products.
47
Based on the impairments taken on the Playtex and Edge brand names and based on continued competitive pressure on these brands, these intangible assets were converted from indefinite-lived assets to definite lived with a useful life of 20 years. The Company recorded amortization expense of $1.8 in the fourth quarter of fiscal 2017 related to the amortization of the Playtex and Edge brand names.
Our impairment analysis indicated that the Wet Ones trade name was not impaired during the fiscal 2017 or 2016 testing. The fair value of the brand name was determined to be $189 or approximately 110% of the carrying value. The fair value of the trade name will be sensitive to changes in discount rates and forecasts that could lead to future impairment as the fair value of intangible asset continues to be relatively close to the carrying value due to the assets being written down to their fair value in fiscal 2015.
The table below presents, based on the impairment test performed in the fourth quarter, the change in the fair value of the Playtex and Wet Ones brand name intangible assets given a 0.5% change in the assumed discount rate or long-term annual revenue growth rate.
Discount rate increased by 0.5% | Discount rate decreased by 0.5% | Long-term growth rate increased by 0.5% | Long-term growth rate decreased by 0.5% | ||||||||||||
Playtex brand name | |||||||||||||||
Change in fair value | $ | (7 | ) | $ | 8 | $ | 6 | $ | (5 | ) | |||||
Wet Ones brand name | |||||||||||||||
Change in fair value | $ | (14 | ) | $ | 17 | $ | 13 | $ | (11 | ) | |||||
Percentage by which fair value exceeds carrying value | 1 | % | 19 | % | 17 | % | 3 | % | |||||||
Recently Issued Accounting Standards
Refer to Note 2 of Notes to Consolidated Financial Statements for a discussion regarding recently issued accounting standards and their estimated impact on our financial statements.
Item 7A. Quantitative and Qualitative Disclosures About Market Risk.
($ in millions)
The market risk inherent in our financial instruments and positions represents the potential loss arising from adverse changes in currency rates, commodity prices, interest rates and our stock price. The following risk management discussion and the estimated amounts generated from the sensitivity-analysis are forward-looking statements of market risk, assuming certain adverse market conditions occur. Company policy allows derivatives to be used only for identifiable exposures and, therefore, we do not enter into hedges for trading purposes where the sole objective is to generate profits.
Currency Rate Exposure
A significant share of our sales are tied to currencies other than the U.S. dollar, our reporting currency. As such, a weakening of currencies relative to the U.S. dollar can have a negative impact to reported earnings. Conversely, strengthening of currencies relative to the U.S. dollar can improve reported results. The primary currencies to which we are exposed include the Euro, the Japanese Yen, the British Pound, the Canadian Dollar and the Australian Dollar.
We do business in certain developing markets, which may be susceptible to greater volatility of inflation and currency exchange rates, as well as government pricing and import controls. While the activity is not considered material in relation to the consolidated company as a whole, there could be negative impacts to operating results in certain markets, if inflationary pressures, exchange volatility and government controls negatively impact our ability to operate effectively and profitably.
Derivatives Designated as Cash Flow Hedging Relationships
At September 30, 2017, we maintained a cash flow hedging program related to foreign currency risk. These derivative instruments have a high correlation to the underlying exposure being hedged and have been deemed highly effective for accounting purposes in offsetting the associated risk.
48
We enter into forward currency contracts to hedge the cash flow uncertainty associated with currency fluctuations. These transactions are accounted for as cash flow hedges. We had unrealized pre-tax losses of $1.6 and $4.3 at September 30, 2017 and 2016, respectively, on these forward currency contracts accounted for as cash flow hedges included in Accumulated other comprehensive loss ("AOCI"). Assuming foreign exchange rates versus the U.S. dollar remain at September 30, 2017 levels over the next twelve months, approximately $1.6 of the pre-tax loss included in AOCI at September 30, 2017 is expected to be included in Other expense (income), net. Contract maturities for these hedges extend into fiscal year 2019. There were 63 open foreign currency contracts at September 30, 2017 with a notional value of approximately $130.9.
For further information on our derivatives designated as cash flow hedging relationships, see Note 16 of Notes to Consolidated Financial Statements.
Derivatives Not Designated as Cash Flow Hedging Relationships
Our foreign subsidiaries enter into internal and external transactions that create non-functional currency balance sheet positions at the foreign subsidiary level. These exposures are generally the result of intercompany purchases, intercompany loans and, to a lesser extent, external purchases and are revalued in the foreign subsidiary's local currency at the end of each period. Changes in the value of the non-functional currency balance sheet positions in relation to the foreign subsidiary's local currency result in an exchange gain or loss recorded in Other expense (income), net. The primary currency to which our foreign subsidiaries are exposed is the U.S. dollar.
We enter into foreign currency derivative contracts which are not designated as cash flow hedges for accounting purposes to hedge these balance sheet exposures. Any gains or losses on these contracts are expected to be offset by exchange gains or losses on the underlying exposure, thus they are not subject to significant market risk. The change in the estimated fair value of the foreign currency contracts resulted in a gain of $2.4 for fiscal 2017 and a loss of $10.1 for fiscal 2016, which were recorded in Other expense (income), net. There were six open foreign currency derivative contracts which are not designated as cash flow hedges at September 30, 2017, with a notional amount of approximately $100.3.
For further information on our derivatives not designated as cash flow hedging relationships, see Note 16 of Notes to Consolidated Financial Statements.
Commodity Price Exposure
We use raw materials that are subject to price volatility. At times, we have used, and may in the future use, hedging instruments to reduce exposure to variability in cash flows associated with future purchases of certain materials and commodities. At September 30, 2017, there were no open derivative or hedging instruments for future purchases of raw materials or commodities.
Interest Rate Exposure
Our exposure to interest rate risk relates primarily to our variable-rate debt instruments, which currently bear interest based on LIBOR plus margin. As of September 30, 2017, our outstanding debt included $245.0 variable-rate debt on our revolving credit facility in the U.S. and $184.7 variable-rate debt on our term loan. Assuming a one percent increase in the applicable interest rates, annual interest expense would increase by approximately $4.3.
The remaining outstanding debt as of September 30, 2017 is fixed-rate debt. Changes in market interest rates generally affect the fair value of fixed-rate debt, but do not impact earnings or cash flows.
49
Item 8. Financial Statements and Supplementary Data.
INDEX TO FINANCIAL STATEMENTS
Consolidated Financial Statements | |
Responsibility for Financial Statements | |
Management's Report on Internal Control Over Financial Reporting | |
Report of Independent Registered Public Accounting Firm | |
Consolidated Statements of Earnings and Comprehensive Income (Loss) for the fiscal years ended September 30, 2017, 2016 and 2015. | |
Consolidated Balance Sheets as of September 30, 2017 and 2016. | |
Consolidated Statements of Cash Flows for the fiscal years ended September 30, 2017, 2016 and 2015. | |
Consolidated Statement of Changes in Shareholders' Equity for the period from October 1, 2014 to September 30, 2017. | |
Notes to Consolidated Financial Statements. | |
50
Responsibility for Financial Statements
The preparation and integrity of the financial statements of Edgewell Personal Care Company (the "Company") are the responsibility of its management. These statements have been prepared in conformance with generally accepted accounting principles in the United States of America, and in the opinion of management, fairly present the Company's financial position, results of operations and cash flows.
The Company maintains accounting and internal control systems, which it believes are adequate to provide reasonable assurance that assets are safeguarded against loss from unauthorized use or disposition and that the financial records are reliable for preparing financial statements. The selection and training of qualified personnel, the establishment and communication of accounting and administrative policies and procedures, and a program of internal audits are important elements of these control systems.
The Board of Directors, through its Audit Committee consisting solely of non-management directors, meets periodically with management, internal audit and the independent auditors to discuss audit and financial reporting matters. To assure independence, PricewaterhouseCoopers LLP has direct access to the Audit Committee.
Management's Report on Internal Control over Financial Reporting
The management of the Company is responsible for establishing and maintaining internal control over financial reporting. The Company's internal control over financial reporting is a process designed to provide reasonable assurance regarding the reliability of financial reporting and the preparation of financial statements in accordance with generally accepted accounting principles for external purposes. The Company's internal control over financial reporting includes those policies and procedures that: (i) pertain to the maintenance of records that, in reasonable detail, accurately and fairly reflect the transactions and dispositions of the assets of the Company; (ii) provide reasonable assurance that transactions are recorded as necessary to permit preparation of financial statements in accordance with generally accepted accounting principles, and that receipts and expenditures of the Company are being made only in accordance with authorizations of management and directors of the Company; and (iii) provide reasonable assurance regarding prevention or timely detection of unauthorized acquisition, use or disposition of the Company's assets that could have a material effect on the financial statements. Internal control over financial reporting, because of its inherent limitations, may not prevent or detect misstatements. Also, projections of any evaluation of effectiveness to future periods are subject to the risk that controls may become inadequate because of changes in conditions, or that the degree of compliance with the policies or procedures may deteriorate. Management conducted an assessment of the effectiveness of the Company's internal control over financial reporting based on the framework set forth in Internal Control - Integrated Framework (2013), issued by the Committee of Sponsoring Organizations of the Treadway Commission. Based on the Company's assessment, management has concluded that internal control over financial reporting as of September 30, 2017 was effective. The Company's internal control over financial reporting as of September 30, 2017 has been audited by PricewaterhouseCoopers LLP, an independent registered public accounting firm, as stated in their report that appears herein.
51
Report of Independent Registered Public Accounting Firm
To the Shareholders and Board of Directors of Edgewell Personal Care Company:
In our opinion, the consolidated financial statements listed in the index appearing under Item 15(1) present fairly, in all material respects, the financial position of Edgewell Personal Care Company and its subsidiaries at September 30, 2017 and 2016, and the results of their operations and their cash flows for each of the three years in the period ended September 30, 2017 in conformity with accounting principles generally accepted in the United States of America. In addition, in our opinion, the financial statement schedule listed in the index appearing under Item 15(2) presents fairly, in all material respects, the information set forth therein when read in conjunction with the related consolidated financial statements. Also in our opinion, the Company maintained, in all material respects, effective internal control over financial reporting as of September 30, 2017, based on criteria established in Internal Control - Integrated Framework (2013) issued by the Committee of Sponsoring Organizations of the Treadway Commission (COSO). The Company's management is responsible for these financial statements and financial statement schedule, for maintaining effective internal control over financial reporting and for its assessment of the effectiveness of internal control over financial reporting, included in the accompanying Management's Report on Internal Control over Financial Reporting. Our responsibility is to express opinions on these financial statements, on the financial statement schedule and on the Company's internal control over financial reporting based on our integrated audits. We conducted our audits in accordance with the standards of the Public Company Accounting Oversight Board (United States). Those standards require that we plan and perform the audits to obtain reasonable assurance about whether the financial statements are free of material misstatement and whether effective internal control over financial reporting was maintained in all material respects. Our audits of the financial statements included examining, on a test basis, evidence supporting the amounts and disclosures in the financial statements, assessing the accounting principles used and significant estimates made by management, and evaluating the overall financial statement presentation. Our audit of internal control over financial reporting included obtaining an understanding of internal control over financial reporting, assessing the risk that a material weakness exists, and testing and evaluating the design and operating effectiveness of internal control based on the assessed risk. Our audits also included performing such other procedures as we considered necessary in the circumstances. We believe that our audits provide a reasonable basis for our opinions.
A company’s internal control over financial reporting is a process designed to provide reasonable assurance regarding the reliability of financial reporting and the preparation of financial statements for external purposes in accordance with generally accepted accounting principles. A company’s internal control over financial reporting includes those policies and procedures that (i) pertain to the maintenance of records that, in reasonable detail, accurately and fairly reflect the transactions and dispositions of the assets of the company; (ii) provide reasonable assurance that transactions are recorded as necessary to permit preparation of financial statements in accordance with generally accepted accounting principles, and that receipts and expenditures of the company are being made only in accordance with authorizations of management and directors of the company; and (iii) provide reasonable assurance regarding prevention or timely detection of unauthorized acquisition, use, or disposition of the company’s assets that could have a material effect on the financial statements.
Because of its inherent limitations, internal control over financial reporting may not prevent or detect misstatements. Also, projections of any evaluation of effectiveness to future periods are subject to the risk that controls may become inadequate because of changes in conditions, or that the degree of compliance with the policies or procedures may deteriorate.
/s/ PricewaterhouseCoopers LLP
St. Louis, Missouri
November 17, 2017
52
EDGEWELL PERSONAL CARE COMPANY
CONSOLIDATED STATEMENTS OF EARNINGS AND COMPREHENSIVE INCOME (LOSS)
(in millions, except per share data)
Fiscal Year | |||||||||||
2017 | 2016 | 2015 | |||||||||
Net sales | $ | 2,298.4 | $ | 2,362.0 | $ | 2,421.2 | |||||
Cost of products sold | 1,167.8 | 1,202.1 | 1,237.4 | ||||||||
Gross profit | 1,130.6 | 1,159.9 | 1,183.8 | ||||||||
Selling, general and administrative expense | 390.0 | 412.7 | 571.6 | ||||||||
Advertising and sales promotion expense | 318.3 | 336.7 | 367.1 | ||||||||
Research and development expense | 67.6 | 71.9 | 71.0 | ||||||||
Impairment charge | 319.0 | 6.5 | 318.2 | ||||||||
Venezuela deconsolidation charge | — | — | 79.3 | ||||||||
Spin restructuring charges | — | — | 28.3 | ||||||||
Restructuring charges | 29.6 | 37.0 | 26.7 | ||||||||
Industrial sale charges | — | 0.2 | 32.7 | ||||||||
Interest expense associated with debt | 69.2 | 71.8 | 99.8 | ||||||||
Cost of early debt retirements | — | — | 59.6 | ||||||||
Other (income) expense, net | (10.2 | ) | 3.2 | (11.8 | ) | ||||||
(Loss) earnings from continuing operations before income taxes | (52.9 | ) | 219.9 | (458.7 | ) | ||||||
Income tax (benefit) provision | (58.6 | ) | 41.2 | (162.6 | ) | ||||||
Earnings (loss) from continuing operations | 5.7 | 178.7 | (296.1 | ) | |||||||
Earnings from discontinued operations, net of tax | — | — | 20.8 | ||||||||
Net earnings (loss) | $ | 5.7 | $ | 178.7 | $ | (275.3 | ) | ||||
Basic earnings (loss) per share (Note 7): | |||||||||||
Earnings (loss) from continuing operations | $ | 0.10 | $ | 3.02 | $ | (4.78 | ) | ||||
Earnings from discontinued operations, net of tax | — | — | 0.34 | ||||||||
Net earnings (loss) | 0.10 | 3.02 | (4.44 | ) | |||||||
Diluted earnings (loss) per share (Note 7): | |||||||||||
Earnings (loss) from continuing operations | $ | 0.10 | $ | 2.99 | $ | (4.78 | ) | ||||
Earnings from discontinued operations, net of tax | — | — | 0.34 | ||||||||
Net earnings (loss) | 0.10 | 2.99 | (4.44 | ) | |||||||
Statements of Comprehensive Income (Loss): | |||||||||||
Net earnings (loss) | $ | 5.7 | $ | 178.7 | $ | (275.3 | ) | ||||
Other comprehensive income (loss), net of tax: | |||||||||||
Foreign currency translation adjustments | 39.1 | 1.0 | (111.4 | ) | |||||||
Pension and postretirement activity, net of tax of $12.7 in 2017, $11.6 in 2016 and $6.2 in 2015 | 25.0 | (22.9 | ) | (7.4 | ) | ||||||
Deferred gain (loss) on hedging activity, net of tax of $1.0 in 2017, $2.8 in 2016 and $2.0 in 2015 | 1.7 | (6.1 | ) | (3.4 | ) | ||||||
Total other comprehensive income (loss), net of tax | 65.8 | (28.0 | ) | (122.2 | ) | ||||||
Total comprehensive income (loss) | $ | 71.5 | $ | 150.7 | $ | (397.5 | ) | ||||
See accompanying Notes to Consolidated Financial Statements.
53
EDGEWELL PERSONAL CARE COMPANY
CONSOLIDATED BALANCE SHEETS
(in millions, except share data)
September 30, 2017 | September 30, 2016 | ||||||
Assets | |||||||
Current assets | |||||||
Cash and cash equivalents | $ | 502.9 | $ | 738.9 | |||
Trade receivables, less allowance for doubtful accounts of $4.3 and $4.9 | 224.1 | 260.7 | |||||
Inventories | 333.5 | 309.2 | |||||
Other current assets | 125.7 | 143.2 | |||||
Total current assets | 1,186.2 | 1,452.0 | |||||
Property, plant and equipment, net | 453.4 | 486.1 | |||||
Goodwill | 1,445.9 | 1,420.3 | |||||
Other intangible assets, net | 1,071.7 | 1,385.1 | |||||
Other assets | 31.6 | 28.0 | |||||
Total assets | $ | 4,188.8 | $ | 4,771.5 | |||
Liabilities and Shareholders' Equity | |||||||
Current liabilities | |||||||
Current maturities of long-term debt | $ | — | $ | 281.8 | |||
Notes payable | 19.4 | 18.5 | |||||
Accounts payable | 223.6 | 196.5 | |||||
Other current liabilities | 281.4 | 371.4 | |||||
Total current liabilities | 524.4 | 868.2 | |||||
Long-term debt | 1,525.4 | 1,544.2 | |||||
Deferred income tax liabilities | 181.8 | 255.3 | |||||
Other liabilities | 215.5 | 274.8 | |||||
Total liabilities | 2,447.1 | 2,942.5 | |||||
Commitments and contingencies (Note 17) | |||||||
Shareholders' equity | |||||||
Preferred shares, $0.01 par value, 10,000,000 authorized; none issued or outstanding | — | — | |||||
Common shares, $0.01 par value, 300,000,000 authorized; 65,251,989 and 65,251,989 issued; 56,017,537 and 57,914,448 outstanding | 0.7 | 0.7 | |||||
Additional paid-in capital | 1,623.4 | 1,642.5 | |||||
Retained earnings | 952.9 | 946.0 | |||||
Common shares in treasury at cost, 9,234,452 and 7,337,541 | (703.9 | ) | (563.0 | ) | |||
Accumulated other comprehensive loss | (131.4 | ) | (197.2 | ) | |||
Total shareholders' equity | 1,741.7 | 1,829.0 | |||||
Total liabilities and shareholders' equity | $ | 4,188.8 | $ | 4,771.5 | |||
See accompanying Notes to Consolidated Financial Statements.
54
EDGEWELL PERSONAL CARE COMPANY
CONSOLIDATED STATEMENTS OF CASH FLOWS
(in millions)
Fiscal Year | |||||||||||
2017 | 2016 | 2015 | |||||||||
Cash Flow from Operating Activities | |||||||||||
Net earnings (loss) | $ | 5.7 | $ | 178.7 | $ | (275.3 | ) | ||||
Adjustments to reconcile net earnings (loss) to net cash flow from operations: | |||||||||||
Non-cash restructuring costs | 6.8 | 3.9 | 41.5 | ||||||||
Depreciation and amortization | 94.4 | 92.6 | 115.3 | ||||||||
Impairment charge | 319.0 | 6.5 | 318.2 | ||||||||
Venezuela deconsolidation charge | — | — | 144.5 | ||||||||
Deferred income taxes | (87.4 | ) | 7.8 | (190.4 | ) | ||||||
Deferred compensation payments | (27.9 | ) | (10.2 | ) | (16.5 | ) | |||||
Share-based compensation expense | 22.2 | 25.6 | 32.9 | ||||||||
International pension funding | — | (100.5 | ) | — | |||||||
Other, net | (15.9 | ) | (9.5 | ) | (34.9 | ) | |||||
Changes in current assets and liabilities used in operations, net of effects of business acquisitions: | |||||||||||
Accounts receivable, net | 41.4 | 23.3 | 21.7 | ||||||||
Inventories | (15.5 | ) | 28.2 | (35.7 | ) | ||||||
Other current assets | 22.6 | 75.8 | 13.9 | ||||||||
Accounts payable | 23.7 | (29.3 | ) | (73.4 | ) | ||||||
Other current liabilities | (92.9 | ) | (116.5 | ) | 87.0 | ||||||
Net cash from operating activities | 296.2 | 176.4 | 148.8 | ||||||||
Cash Flow from Investing Activities | |||||||||||
Capital expenditures | (69.0 | ) | (69.5 | ) | (99.4 | ) | |||||
Change related to Venezuelan operations | — | — | (93.8 | ) | |||||||
Acquisitions, net of cash acquired | (34.0 | ) | — | (12.1 | ) | ||||||
Proceeds from sale of assets | 18.4 | — | 16.6 | ||||||||
Change in restricted cash | — | — | 13.9 | ||||||||
Net cash used by investing activities | (84.6 | ) | (69.5 | ) | (174.8 | ) | |||||
Cash Flow from Financing Activities | |||||||||||
Cash proceeds from debt with original maturities greater than 90 days | 271.0 | 756.3 | 2,604.2 | ||||||||
Cash payments on debt with original maturities greater than 90 days | (568.0 | ) | (631.0 | ) | (1,900.0 | ) | |||||
Net increase (decrease) in debt with original maturities of 90 days or less | 2.0 | (11.1 | ) | (252.6 | ) | ||||||
Deferred finance expense | — | (0.6 | ) | (15.1 | ) | ||||||
Common shares purchased | (165.4 | ) | (196.6 | ) | (175.2 | ) | |||||
Cash dividends paid | — | — | (93.2 | ) | |||||||
Transfer of cash and cash equivalents to New Energizer | — | — | (499.7 | ) | |||||||
Proceeds from issuance of common shares, net | — | — | 4.4 | ||||||||
Other, net | (0.2 | ) | — | — | |||||||
Net cash used by financing activities | (460.6 | ) | (83.0 | ) | (327.2 | ) | |||||
Effect of exchange rate changes on cash | 13.0 | 2.9 | (63.7 | ) | |||||||
Net (decrease) increase in cash and cash equivalents | (236.0 | ) | 26.8 | (416.9 | ) | ||||||
Cash and cash equivalents, beginning of period | 738.9 | 712.1 | 1,129.0 | ||||||||
Cash and cash equivalents, end of period | $ | 502.9 | $ | 738.9 | $ | 712.1 | |||||
Supplemental Disclosures of Cash Flow Information: | |||||||||||
Cash paid for interest, net | $ | 66.4 | $ | 71.3 | $ | 164.3 | |||||
Cash paid for income taxes, net | 14.4 | 28.3 | 55.0 | ||||||||
See accompanying Notes to Consolidated Financial Statements.
55
EDGEWELL PERSONAL CARE COMPANY
CONSOLIDATED STATEMENT OF CHANGES IN SHAREHOLDERS' EQUITY
(in millions)
Common Shares | Treasury Shares | ||||||||||||||||||||||||||||
Number | Par Value | Number | Amount | Additional Paid-In Capital | Retained Earnings | Accumulated Other Comprehensive Loss | Total Shareholders' Equity | ||||||||||||||||||||||
Balance at October 1, 2014 | 65.2 | $ | 0.7 | (3.4 | ) | $ | (221.6 | ) | $ | 1,641.3 | $ | 1,373.0 | $ | (271.1 | ) | $ | 2,522.3 | ||||||||||||
Net loss | — | — | — | — | — | (275.3 | ) | — | (275.3 | ) | |||||||||||||||||||
Foreign currency translation adjustments | — | — | — | — | — | — | (111.4 | ) | (111.4 | ) | |||||||||||||||||||
Pension and postretirement activity | — | — | — | — | — | — | (7.4 | ) | (7.4 | ) | |||||||||||||||||||
Deferred loss on hedging activity | — | — | — | — | — | — | (3.4 | ) | (3.4 | ) | |||||||||||||||||||
Distribution to New Energizer | — | — | — | — | — | (230.6 | ) | 221.8 | (8.8 | ) | |||||||||||||||||||
Cash dividends declared | — | — | — | — | — | (94.2 | ) | — | (94.2 | ) | |||||||||||||||||||
Repurchase of shares | — | — | (2.0 | ) | (175.2 | ) | — | — | — | (175.2 | ) | ||||||||||||||||||
Activity under share plans | — | — | 0.3 | 14.6 | 2.9 | — | — | 17.5 | |||||||||||||||||||||
Balance at September 30, 2015 | 65.2 | $ | 0.7 | (5.1 | ) | $ | (382.2 | ) | $ | 1,644.2 | $ | 772.9 | $ | (171.5 | ) | $ | 1,864.1 | ||||||||||||
Net earnings | — | — | — | — | — | 178.7 | — | 178.7 | |||||||||||||||||||||
Foreign currency translation adjustments | — | — | — | — | — | — | 1.0 | 1.0 | |||||||||||||||||||||
Pension and postretirement activity | — | — | — | — | — | — | (22.9 | ) | (22.9 | ) | |||||||||||||||||||
Deferred loss on hedging activity | — | — | — | — | — | — | (6.1 | ) | (6.1 | ) | |||||||||||||||||||
Distribution to New Energizer | — | — | — | — | — | (5.6 | ) | 2.3 | (3.3 | ) | |||||||||||||||||||
Repurchase of shares | — | — | (2.5 | ) | (196.6 | ) | — | — | — | (196.6 | ) | ||||||||||||||||||
Activity under share plans | — | — | 0.3 | 15.8 | (1.7 | ) | — | — | 14.1 | ||||||||||||||||||||
Balance at September 30, 2016 | 65.2 | $ | 0.7 | (7.3 | ) | $ | (563.0 | ) | $ | 1,642.5 | $ | 946.0 | $ | (197.2 | ) | $ | 1,829.0 | ||||||||||||
Net earnings | — | — | — | — | — | 5.7 | — | 5.7 | |||||||||||||||||||||
Foreign currency translation adjustments | — | — | — | — | — | — | 39.1 | 39.1 | |||||||||||||||||||||
Pension and postretirement activity | — | — | — | — | — | — | 25.0 | 25.0 | |||||||||||||||||||||
Deferred gain on hedging activity | — | — | — | — | — | — | 1.7 | 1.7 | |||||||||||||||||||||
Repurchase of shares | — | — | (2.2 | ) | (165.4 | ) | — | — | — | (165.4 | ) | ||||||||||||||||||
Activity under share plans | — | — | 0.3 | 24.5 | (19.1 | ) | 1.2 | — | 6.6 | ||||||||||||||||||||
Balance at September 30, 2017 | 65.2 | $ | 0.7 | (9.2 | ) | $ | (703.9 | ) | $ | 1,623.4 | $ | 952.9 | $ | (131.4 | ) | $ | 1,741.7 | ||||||||||||
See accompanying Notes to Consolidated Financial Statements.
56
EDGEWELL PERSONAL CARE COMPANY
NOTES TO CONSOLIDATED FINANCIAL STATEMENTS
(in millions, except per share data)
Note 1 - Background and Basis of Presentation
Background
Edgewell Personal Care Company and its subsidiaries (collectively, "Edgewell" or the "Company"), is one of the world's largest manufacturers and marketers of personal care products in the wet shave, sun and skin care, feminine care and infant care categories. Edgewell has a portfolio of over 25 brands and a global footprint in more than 50 countries.
The Company conducts its business in the following four segments:
• | Wet Shave consists of products sold under the Schick, Wilkinson Sword, Edge, Skintimate, Shave Guard and Personna brands, as well as non-branded products. The Company's wet shave products include razor handles and refillable blades, disposable shave products and shaving gels and creams. |
• | Sun and Skin Care consists of Banana Boat and Hawaiian Tropic sun care products and Bulldog men's skin care products, as well as Wet Ones wipes and Playtex household gloves until the sale of the gloves business in October 2017. Refer to Note 21 for additional details on the sale of the Playtex household gloves business. |
• | Feminine Care includes tampons, pads and liners sold under the Playtex Gentle Glide and Sport, Stayfree, Carefree and o.b. brands, as well as personal cleansing wipes under the Playtex brand. |
• | All Other includes infant care products, such as bottles, cups and pacifiers, under the Playtex, OrthoPro and Binky brand names, as well as the Diaper Genie and Litter Genie disposal systems. |
Basis of Presentation
The accompanying consolidated financial statements include the accounts of the Company and its controlled subsidiaries and have been prepared in accordance with United States ("U.S.") generally accepted accounting principles ("GAAP"), under the rules and regulations of the U.S. Securities and Exchange Commission (the "SEC"). The preparation of the consolidated financial statements in conformity with GAAP requires management to make estimates and assumptions that affect the reported amount of assets and liabilities, disclosure of contingent assets and liabilities and the reported amounts of revenues and expenses. Actual results may differ materially from those estimates. All intercompany balances and transactions have been eliminated in consolidation and, in the opinion of management, all normal recurring adjustments considered necessary for a fair presentation have been included.
Acquisition of Bulldog Skincare. On October 31, 2016, the Company completed the acquisition of Bulldog Skincare Holdings Limited ("Bulldog"), a men's grooming and skincare products company based in the United Kingdom ("U.K."). The results of Bulldog for the post-acquisition period are included within the Company's results for the fiscal year ended September 30, 2017. For more information on the acquisition, see Note 4 of Notes to Consolidated Financial Statements.
Separation. On July 1, 2015, the Company completed the separation of its Household Products business into a separate publicly-traded company (the "Spin" or the "Separation"). The historical financial results of the Company's Household Products business, which assumed the name Energizer Holdings, Inc. ("New Energizer"), are presented as discontinued operations on the Consolidated Statements of Earnings and, as such, have been excluded from both continuing operations and segment results for all periods presented. The Company has reflected the Separation as a distribution on the Consolidated Statement of Changes in Shareholders' Equity and as cash transferred on the Consolidated Statement of Cash Flows in fiscal 2015. The Consolidated Statements of Comprehensive Income (Loss) and Cash Flows for all prior periods presented have not been adjusted to reflect the effect of the Separation, as the Company had not adopted the Financial Accounting Standards Board's ("FASB") updated guidance on the presentation of discontinued operations at the time of Separation. Unless indicated otherwise, the information in Notes to Consolidated Financial Statements relates to the Company's continuing operations. Prior periods have been recast to reflect the Company's current segment reporting. See Note 3 of Notes to Consolidated Financial Statements for more information on the Separation.
57
Venezuela Deconsolidation. Venezuelan exchange control regulations have resulted in an other-than-temporary lack of exchangeability between the Venezuelan bolivar and U.S. dollar, resulting in a lack of control over the Company's Venezuelan subsidiaries for accounting purposes. The Company deconsolidated its Venezuelan subsidiaries on March 31, 2015, and began accounting for the investment in its Venezuelan operations using the cost method of accounting. As a result of deconsolidating its Venezuelan subsidiaries, the Company recorded a charge of $144.5 in March 2015, of which $79.3 was included within continuing operations and had no accompanying tax benefit. This charge included the write-off of the investment in the Company's Venezuelan subsidiaries, foreign currency translation losses of $18.5 previously recorded in Accumulated other comprehensive loss and the write-off of $18.5 of intercompany receivables. Since March 31, 2015, the Company's financial results have not included the operating results of its Venezuelan operations.
Note 2 - Summary of Significant Accounting Policies
Foreign Currency Translation
Financial statements of foreign operations where the local currency is the functional currency are translated using end-of-period exchange rates for assets and liabilities, and average exchange rates during the period for results of operations. Related translation adjustments are reported as a component within accumulated other comprehensive income in the shareholders' equity section of the Consolidated Balance Sheets, except as noted below.
Gains and losses resulting from foreign currency transactions are included in Net earnings (loss). During fiscal 2017 and 2016, foreign currency gains of $5.4 and $4.3, respectively, and foreign currency losses of $33.1 during fiscal 2015, were included within Other expense (income), net. These gains and losses were partially offset by gains and losses from foreign exchange ("FX") instruments as described below and in Note 16 of Notes to Consolidated Financial Statements.
Financial Instruments and Derivative Securities
The Company uses financial instruments, from time to time, in the management of foreign currency, interest rate and other risks that are inherent to its business operations. Such instruments are not held or issued for trading purposes.
FX instruments, including forward currency contracts, are used primarily to reduce cash transaction exposures and, to a lesser extent, to manage other translation exposures. FX instruments used are selected based on their risk reduction attributes, costs and the related market conditions. The Company has designated certain foreign currency contracts as cash flow hedges for accounting purposes as of September 30, 2017.
At September 30, 2017, the Company had $429.7 of variable rate debt outstanding. The Company has, in the past, used interest rate swaps to hedge the risk of variable rate debt. As of September 30, 2017, the Company did not have any interest rate swap agreements outstanding.
For further discussion, see Note 11 and Note 16 of Notes to Consolidated Financial Statements.
Cash Equivalents
Cash equivalents are all considered to be highly liquid investments with a maturity of three months or less when purchased. At September 30, 2017, the Company had $502.9 in available cash and cash equivalents, substantially all of which was outside of the U.S. The Company has extensive operations outside of the U.S., including a significant manufacturing footprint. The Company manages its worldwide cash requirements by reviewing available funds among the many subsidiaries through which it conducts its business and the cost effectiveness with which those funds can be accessed. The repatriation of cash balances from certain of the Company's subsidiaries could have adverse tax consequences or be subject to regulatory capital requirements; however, those balances are generally available without legal restrictions to fund ordinary business operations. U.S. income taxes have not been provided on a significant portion of undistributed earnings of international subsidiaries. The Company's intention is to reinvest these earnings indefinitely.
58
Cash Flow Presentation
The Consolidated Statements of Cash Flows are prepared using the indirect method, which reconciles Net earnings (loss) to Net cash from operating activities. The reconciliation adjustments include the removal of timing differences between the occurrence of operating receipts and payments and their recognition in Net earnings (loss). The adjustments also remove cash flows arising from investing and financing activities, which are presented separately from operating activities. Cash flows from foreign currency transactions and operations are translated at an average exchange rate for the period. Cash flows from hedging activities are included in the same category as the items being hedged, which is primarily operating activities. Cash payments related to income taxes are classified as operating activities.
Cash flow information for fiscal 2015 has not been adjusted for discontinued operations.
Accounts Receivable
Accounts receivable are stated at their net realizable value. The allowance for doubtful accounts reflects the Company's best estimate of probable losses inherent in the receivables portfolio determined on the basis of historical experience, specific allowances for known troubled accounts and other currently available information. Bad debt expense is included in Selling, general and administrative expense ("SG&A"). The Company began an accounts receivable factoring program in September 2017. For further discussion, see Note 10 of Notes to Consolidated Financial Statements.
Inventories
Inventories are valued at the lower of cost or market, with cost generally being determined using average cost or the first-in, first-out ("FIFO") method.
Capitalized Software Costs
Capitalized software costs are included in Property, plant and equipment, net. These costs are amortized using the straight-line method over periods of related benefit ranging from three to seven years. Expenditures related to capitalized software are included within Capital expenditures in the Consolidated Statements of Cash Flows. Amortization expense was $6.0, $5.8, and $6.1 in fiscal 2017, 2016 and 2015, respectively.
Property, Plant and Equipment, net
Property, plant and equipment, net is stated at historical cost. Property, plant and equipment acquired as part of a business combination is recorded at estimated fair value. Expenditures for new facilities and expenditures that substantially increase the useful life of property, including interest during construction, are capitalized and reported as Capital expenditures in the accompanying Consolidated Statements of Cash Flows. Maintenance, repairs and minor renewals are expensed as incurred. When property is retired or otherwise disposed of, the related cost and accumulated depreciation are removed from the accounts, and gains or losses on the disposition are reflected in Net earnings (loss). Depreciation is generally provided on the straight-line basis by charges to earnings at rates based on estimated useful lives. Estimated useful lives range from two to 25 years for machinery and equipment and three to 30 years for buildings and building improvements. Depreciation expense was $74.1 in fiscal 2017, including accelerated depreciation charges of $1.8 related to restructuring. Depreciation expense was $76.3 in fiscal 2016, including accelerated depreciation charges of $3.9 related to restructuring. Depreciation expense in fiscal 2015 was $73.7, including accelerated depreciation charges of $4.6 related to restructuring. See Note 5 of Notes to Consolidated Financial Statements for further information on restructuring.
Estimated useful lives are periodically reviewed and, when appropriate, changes are made prospectively. When certain events or changes in operating conditions occur, asset lives may be adjusted and an impairment assessment may be performed on the recoverability of the carrying amounts.
59
Goodwill and Other Intangible Assets
Goodwill and indefinite-lived intangibles are not amortized, but are evaluated annually for impairment as part of the Company's annual business planning cycle in the fourth fiscal quarter, or when indicators of a potential impairment are present. The estimated fair value of each reporting unit (Wet Shave, Sun Care, Skin Care, Feminine Care, Infant Care and All Other) is estimated using valuation models that incorporate assumptions and projections of expected future cash flows and operating plans. In determining the estimated fair value of the reporting units when performing a quantitative analysis, both the market approach and the income approach are considered, and the weighting of each approach is based on circumstances specific to each reporting unit.
Determining the fair value of a reporting unit requires the use of significant judgments, estimates and assumptions. While the Company believes that the estimates and assumptions underlying the valuation methodology are reasonable, these estimates and assumptions could have a significant impact on whether an impairment charge is recognized, and also on the magnitude of any such charge. The results of an impairment analysis are as of a point in time. There is no assurance that actual future earnings or cash flows of the reporting units will not vary significantly from these projections. The Company will monitor any changes to these assumptions and will evaluate the carrying value of goodwill as deemed warranted during future periods.
The key assumptions and estimates for the market and income approaches used to determine fair value of the reporting units included market data and market multiples, discount rates and terminal growth rates, as well as future levels of revenue growth, operating margins, depreciation, amortization and working capital requirements, which are based upon the Company's strategic plan. The results of current year testing did not indicate that goodwill impairment exists, as of the testing date.
The Company completed impairment testing on goodwill and indefinite-lived intangible assets, which consist of trademarks and brand names used across the Company's segments. The estimated fair value was determined using two income approaches: the multi-period excess earnings method and the relief-from-royalty method, both of which require significant assumptions, including estimates regarding future revenue and operating margin growth, discount rates, contributory asset charges and appropriate royalty rates. Revenue and operating margin growth assumptions are based on historical trends and management's expectations for future growth by brand. The discount rates were based on a weighted-average cost of capital utilizing industry market data of similar companies, in addition to estimated returns on the assets utilized in the operations of the applicable reporting unit, including net working capital, fixed assets and intangible assets. The Company estimated royalty rates based on operating profits of the brand.
During the fourth quarter of fiscal 2015, the Company completed impairment testing on indefinite-lived intangible assets other than goodwill, which consist of trademarks and brand names used across the Company's segments and determined that the carrying values of its Playtex, Wet Ones and Skintimate brand names were above the fair values, resulting in a non-cash asset impairment charge of $318.2. During the fourth quarter of fiscal 2016, the Company completed its annual impairment testing and found the carrying value of its Skintimate brand name to be above the fair value, resulting in an additional non-cash asset impairment charge of $6.5. During the fourth quarter of fiscal 2017, the Company completed its annual impairment testing and found the carrying values of the Playtex and Edge brand names to be above the fair value, resulting in a non-cash asset impairment charge of $312.0 and $7.0, respectively. See Note 8 of Notes to Consolidated Financial Statements for further information on these impairments.
Intangible assets with finite lives, and a remaining weighted-average life of approximately 9 years, are amortized on a straight-line basis over expected lives of five to 20 years. Such intangibles are also evaluated for impairment including ongoing monitoring of potential impairment indicators.
Impairment of Long-Lived Assets
The Company reviews long-lived assets, other than goodwill and other intangible assets for impairment, when events or changes in business circumstances indicate that the remaining useful life may warrant revision or that the carrying amount of the long-lived asset may not be fully recoverable. The Company performs undiscounted cash flow analysis to determine if impairment exists. If impairment is determined to exist, any related impairment loss is calculated based on estimated fair value. Impairment losses on assets to be disposed of, if any, are based on the estimated proceeds to be received, less cost of disposal.
In May 2015, the Company's Board of Directors (the "Board") authorized the strategic decision to exit the Company's industrial business due to a shift of management focus to other products. The Company sold the business to a third-party in September 2015. During fiscal 2015, the Company incurred $21.9 of non-cash asset impairment charges, in addition to a $10.8 loss on the sale of the business, which was recorded as a separate line item. For further information on the sale, refer to Note 3 of Notes to the Consolidated Financial Statements.
60
Revenue Recognition
The Company's revenue is from the sale of its products. Revenue is recognized when title, ownership and risk of loss pass to the customer. Discounts are offered to customers for early payment and an estimate of the discounts is recorded as a reduction of Net sales in the same period as the sale. The Company's standard sales terms are final and returns or exchanges are not permitted unless a special exception is made. Reserves are established and recorded in cases where the right of return does exist for a particular sale.
Under certain circumstances, the Company allows customers to return sun care products that have not been sold by the end of the sun care season, which is normal practice in the sun care industry. The Company records sales at the time the title, ownership and risk of loss pass to the customer. The terms of these sales vary but, in all instances, the following conditions are met: the sales arrangement is evidenced by purchase orders submitted by customers; the selling price is fixed or determinable; title to the product has transferred; there is an obligation to pay at a specified date without any additional conditions or actions required by the Company; and collectability is reasonably assured. Simultaneous with the sale, the Company reduces sales and cost of sales, and reserves amounts on its Consolidated Balance Sheet for anticipated returns based upon an estimated return level, in accordance with GAAP. Customers are required to pay for the sun care product purchased during the season under the required terms. The Company generally receives returns of U.S. sun care products from September through January following the summer sun care season. It estimates the level of sun care returns using a variety of inputs including historical experience, consumption trends during the sun care season, obsolescence factors, including expiration dates, and inventory positions at key retailers as the sun care season progresses. The Company monitors shipment activity and inventory levels at key retailers during the season in an effort to more accurately estimate potential returns. This allows the Company to manage shipment activity to its customers, especially in the latter stages of the sun care season, to reduce the potential for returned product. The Company had a reserve for returns of $53.3 and $49.9 at September 30, 2017 and September 30, 2016, respectively.
The Company offers a variety of programs, such as consumer coupons and rebate programs, primarily to its retail customers, designed to promote sales of its products. Such programs require periodic payments and allowances based on estimated results of specific programs and are recorded as a reduction to Net sales. The Company accrues, at the time of sale, the estimated total payments and allowances associated with each transaction. Additionally, the Company offers programs directly to consumers to promote the sale of its products. Promotions which reduce the ultimate consumer sale prices are recorded as a reduction of Net sales at the time the promotional offer is made using estimated redemption and participation levels. Taxes the Company collects on behalf of governmental authorities, which are generally included in the price to the customer, are also recorded as a reduction of Net sales. The Company continually assesses the adequacy of accruals for customer and consumer promotional program costs not yet paid. To the extent total program payments differ from estimates, adjustments may be necessary. Historically, these adjustments have not been material.
Advertising and Sales Promotion Costs
The Company advertises and promotes its products through national and regional media and expenses such activities as incurred. Advertising and sales promotion expense reported on the Consolidated Statement of Earnings includes advertising costs of $197.4, $201.6 and $219.0, for fiscal 2017, 2016 and 2015, respectively.
Share-Based Payments
The Company grants restricted share equivalent ("RSE") awards, which generally vest over two to four years. A portion of the RSE awards granted provide for the issuance of common stock to certain managerial staff and executive management if the Company achieves specified performance targets. The estimated fair value of each grant issued is estimated on the date of grant based on the current market price of the shares. The total amount of compensation expense recognized reflects the initial assumption that target performance goals will be achieved. Compensation expense may be adjusted during the life of the performance grant based on management's assessment of the probability that performance targets will be achieved. If such targets are not met or it is determined that achievement of performance goals is not probable, compensation expense is adjusted to reflect the reduced expected payout level in the period the determination is made. If it is determined that the performance targets will be exceeded, additional compensation expense is recognized.
61
Non-qualified stock option awards ("share options") are granted at the market price on the grant date and generally vest ratably over three years. The Company calculates the fair value of total share-based compensation for share options using the Black-Scholes option pricing model, which utilizes certain assumptions and estimates that have a material impact on the amount of total compensation cost recognized in the Consolidated Financial Statements, including the expected term, expected share price volatility, risk-free interest rate and expected dividends. An additional assumption is made on the number of awards expected to forfeit prior to vesting. The original estimate of the grant date fair value is not subsequently revised unless the awards are modified, or there is a change in the number of awards expected to forfeit prior to vesting.
Income Taxes
The Company's annual effective income tax rate is determined based on its income, statutory tax rates and the tax impacts of items treated differently for tax purposes than for financial reporting purposes. Tax law requires certain items be included in the tax return at different times than the items are reflected in the financial statements. Some of these differences are permanent, such as expenses that are not deductible in the Company's tax return, and some differences are temporary, reversing over time, such as depreciation expense. These temporary differences create deferred tax assets and liabilities.
Deferred tax assets generally represent the tax effect of items that can be used as a tax deduction or credit in future years for which the Company has already recorded the tax benefit in the Consolidated Statement of Earnings. Deferred tax liabilities generally represent tax expense recognized in the Company's financial statements for which payment has been deferred, the tax effect of expenditures for which a deduction has already been taken in its tax return but has not yet been recognized in its financial statements or assets recorded at estimated fair value in business combinations for which there was no corresponding tax basis adjustment.
The Company generally repatriates a portion of current year earnings from select non-US subsidiaries only if the economic cost of the repatriation is not considered material. The Company's intention is to reinvest earnings of other foreign subsidiaries indefinitely as the repatriation of cash balances could have adverse tax consequences or be subject to regulatory capital requirements; however, those balances are generally available without legal restrictions to fund ordinary business operations. No provision is made for additional taxes on undistributed earnings of foreign affiliates that are intended and planned to be indefinitely invested in foreign affiliates. The Company intends to reinvest these earnings indefinitely in its foreign subsidiaries to fund local operations, fund strategic growth objectives, fund pension and other postretirement obligations and fund capital projects. See Note 6 of Notes to Consolidated Financial Statements for further discussion.
The Company estimates income taxes and the effective income tax rate in each jurisdiction that it operates. This involves estimating taxable earnings, specific taxable and deductible items, the likelihood of generating sufficient future taxable income to utilize deferred tax assets, the portion of the income of foreign subsidiaries that is expected to be remitted to the U.S. and be taxable and possible exposures related to future tax audits. Deferred tax assets are evaluated on a subsidiary by subsidiary basis to ensure that the asset will be realized. Valuation allowances are established when the realization is not deemed to be more likely than not. Future performance is monitored, and when objectively measurable operating trends change, adjustments are made to the valuation allowances accordingly. To the extent the estimates described above change, adjustments to income taxes are made in the period in which the estimate is changed.
The Company operates in multiple jurisdictions with complex tax and regulatory environments, which are subject to differing interpretations by the taxpayer and the taxing authorities. At times, the Company may take positions that management believes are supportable, but are potentially subject to successful challenges by the appropriate taxing authority. The Company evaluates its tax positions and establishes liabilities in accordance with guidance governing accounting for uncertainty in income taxes. The Company reviews these tax uncertainties in light of the changing facts and circumstances, such as the progress of tax audits, and adjusts them accordingly.
Estimated Fair Values of Financial Instruments
Certain financial instruments are required to be recorded at estimated fair value. Changes in assumptions or estimation methods could affect the fair value estimates; however, the Company does not believe any such changes would have a material impact on its financial condition, results of operations or cash flows. Other financial instruments including cash and cash equivalents and short-term borrowings, including notes payable, are recorded at cost, which approximates estimated fair value. The estimated fair values of long-term debt and financial instruments are disclosed in Note 16 of Notes to Consolidated Financial Statements.
62
Recently Issued Accounting Pronouncements
In May 2014, the Financial Accounting Standards Board ("FASB") issued an Accounting Standards Update ("ASU"), which provides a single comprehensive revenue recognition model for all contracts with customers to improve comparability within industries, across industries and across capital markets. During 2016, the FASB issued three ASUs, clarifying the revenue recognition implementation guidance on various topics included within the original ASU. The new guidance will be effective for the Company beginning October 1, 2018, with the option of using either a full retrospective or modified retrospective method. The Company is still evaluating the method of adoption.
During fiscal 2017, the Company established a cross-functional implementation team, including representatives from all of its businesses globally, to analyze the current processes in place for the recognition of revenue and identify potential differences that would result from application of the new guidance. This initial assessment includes analysis of significant types of arrangements, processes and systems, and reviews of representative contracts. Additionally, the Company has begun reviewing the enhanced disclosure requirements under the new standard. Revenues are primarily generated from the sale of finished products to customers. Those sales predominantly contain a single delivery element and revenue is recognized at a single point in time when ownership, risks and rewards transfer. While the assessment is not complete, the timing of revenue recognition is not expected to be materially impacted by the new standard. The Company is still assessing the impact of the standard on its consolidated financial statements and on related disclosures.
In August 2014, the FASB issued a new ASU, which requires management to evaluate whether there are conditions or events, considered in the aggregate, that raise substantial doubt about the entity's ability to continue as a going concern within one year after the date that the financial statements are issued. This evaluation should be based on relevant conditions and events that are known and reasonably knowable at the date that the financial statements are issued. This guidance will be effective for the Company beginning on October 1, 2017, with early adoption permitted. The Company did not early adopt this guidance, and believes its adoption will not have an impact on the financial statements.
In July 2015, the FASB issued a new ASU, which aligns the measurement of inventory under GAAP more closely with International Financial Reporting Standards. Under the new guidance, an entity that measures inventory using FIFO or average cost should measure inventory at the lower of cost and net realizable value. Net realizable value is the estimated selling price in the ordinary course of business, less reasonably predictable costs of completion, disposal and transportation. The new guidance will be effective for the Company beginning October 1, 2017. The Company has evaluated the impact of adopting the new guidance, and does not expect that the impact on its financial statements will be material.
In February 2016, the FASB issued an ASU which amends existing lease accounting guidance to require recognition of lease assets and lease liabilities on the balance sheet for leases previously classified as operating leases. Additionally, this update requires qualitative disclosure along with specific quantitative disclosures. Lessees and lessors will be required to recognize and measure leases at the beginning of the earliest period presented using a modified retrospective approach. The update will be effective for the Company beginning October 1, 2019, with early adoption permitted. The Company does not expect to early adopt this guidance and is in the process of evaluating its impact on the financial statements; however, the Company believes the primary impacts will be a material increase in both assets and liabilities on the Consolidated Balance Sheets.
In March 2016, the FASB issued an ASU designed to simplify several aspects of the accounting for share-based payment transactions, including the income tax consequences, classification of awards as either equity or liabilities and classification on the statement of cash flows. The amendments will be effective for the Company beginning October 1, 2017. The Company has evaluated the impact to the financial statements and does not believe the impact of adoption will be material. The most notable impacts will be to Income tax provision (benefit) and Diluted earnings per share, as well as reclassifications between operating and financing activities on the Condensed Consolidated Statements of Cash Flows.
In June 2016, the FASB issued an ASU intended to improve financial reporting by requiring timelier recording of credit losses on loans and other financial instruments held by financial institutions and other organizations. The new guidance applies to all financial instruments, including trade receivables, and requires the measurement of all expected credit losses for financial assets held at a reporting date to be based on historical experience, current conditions and reasonable and supportable forecasts. Previous guidance did not include forward-looking information. The update will be effective for the Company beginning October 1, 2020 and early adoption is permitted for fiscal years beginning after December 15, 2018. The Company is in the process of evaluating the impact the guidance will have on its financial statements.
In August 2016, the FASB issued an ASU intended to address diversity in how certain cash receipts and cash payments are presented and classified in the statement of cash flows. The amendments provide guidance on specific cash flow issues, including debt prepayment or debt extinguishment costs, contingent consideration payments on business combinations, proceeds from the settlement of insurance claims and distributions received from equity method investees, amongst others. The update will be effective for the Company beginning October 1, 2018 with early adoption permitted. The Company is in the process of evaluating the impact the guidance will have on its financial statements.
63
In October 2016, the FASB issued an ASU intended to improve the accounting for the income tax consequences of intra-entity transfers of assets other than inventory. Under the new guidance, an entity should recognize the income tax consequences of an intra-entity transfer of an asset other than inventory, such as intellectual property and property, plant and equipment, when the transfer occurs. The update will be effective for the Company beginning October 1, 2018 with early adoption permitted. The Company is in the process of evaluating the impact the guidance will have on its financial statements.
In November 2016, the FASB issued an ASU which requires that the statement of cash flows explain the change during the period in the total of cash, cash equivalents and amounts generally described as restricted cash or restricted cash equivalents. These amounts should be included within cash and cash equivalents when reconciling the beginning and ending balances for the periods shown on the statement of cash flows. The ASU requires retrospective application, and will be effective for the Company beginning October 1, 2018, with early adoption permitted. The Company does not expect to early adopt this guidance and the impact on the financial statements is not expected to be material.
In January 2017, the FASB issued new guidance clarifying the definition of a business, reducing the number of transactions that need to be further evaluated and providing a framework to assist entities in evaluating whether both an input and a substantive process are present. The amendments in the ASU specify that when the fair value of the gross assets acquired or disposed of is concentrated in a single identifiable asset or a group of similar identifiable assets, the integrated set of assets and activities is not a business. The guidance also requires that an integrated set of assets and activities must include, at a minimum, an input and a substantive process that together significantly contribute to the ability to create output to be considered a business, and removes the evaluation of whether a market participant could replace the missing elements. The ASU will be effective for transactions occurring after October 1, 2018, with early adoption permitted. The impact of the ASU will be dependent upon the nature of any future acquisitions or dispositions made by the Company.
In January 2017, the FASB issued new guidance which simplifies the subsequent measurement of goodwill by eliminating step 2 from the goodwill impairment test. Under existing guidance, an entity performs procedures to determine the fair value at the impairment testing date of its assets and liabilities following the same procedures required when determining the fair value of assets acquired and liabilities assumed in a business combination. The amended guidance requires an entity to perform its annual, or interim, goodwill impairment test by comparing the fair value of a reporting unit with its carrying amount, and recognize an impairment charge to the extent the carrying amount exceeds the fair value and does not exceed the total amount of goodwill allocated to the reporting unit. The ASU will be effective for the Company beginning October 1, 2020, with early adoption permitted, and should be applied prospectively. The Company is in the process of determining what impact, if any, the new guidance will have on its annual impairment testing and if it will early adopt the new guidance.
In March 2017, the FASB issued new guidance to improve the presentation of net periodic pension and postretirement benefit cost. Under existing guidance, the components of net periodic pension and postretirement benefit cost are aggregated and reported in the same line item as other compensation costs arising from services rendered by the applicable employees during the period. The amendments change these requirements so that only the service cost component is recorded in the same line item as other compensation costs for the applicable employees, and all other components of net periodic pension and postretirement benefit cost are recorded on a separate line item outside of income from operations. The amendments also specify that only the service cost component is eligible for capitalization. The ASU will be effective for the Company beginning October 1, 2018, with early adoption permitted October 1, 2017, and will be applied retrospectively for the presentation of the cost components and prospectively for the capitalization of the service cost component. The Company expects that the retrospective impact of adoption on its Consolidated Statement of Operations for the year ended September 30, 2017 will be an increase in Cost of products sold, Selling, general and administrative expense and Other income, net of $4.7, $2.5 and $7.2, respectively.
In May 2017, the FASB issued new guidance that clarifies the scope of accounting for modifications of share-based payment awards. The amendments provide guidance about which changes to the terms or conditions of a share-based payment award require an entity to apply modification accounting. The ASU will be effective for the Company beginning October 1, 2018, with early adoption permitted. The Company has not determined if it will early adopt the new guidance, but does not expect the impact on its financial statements will be material.
In August 2017, the FASB issued new guidance that eliminates the requirement to separately measure and report hedge ineffectiveness and generally requires, for qualifying hedges, the entire change in the fair value of a hedging instrument to be presented in the same income statement line as the hedged item. The guidance also modifies the accounting for components excluded from the assessment of hedge effectiveness, eases documentation and assessment requirements and modifies certain disclosure requirements. The new standard will be effective beginning October 1, 2019, with early adoption permitted. The Company has not yet determined the impact from adoption of this new accounting pronouncement on its financial statements.
64
Note 3 - Discontinued Operations and Divestiture
Discontinued Operations
On July 1, 2015, the Company completed the Separation; therefore, the Household Products business has been reclassified to discontinued operations on the Consolidated Statement of Earnings for fiscal 2015. Discontinued operations includes the results of the Household Products business, except for certain corporate overhead and other allocations, which remain in continuing operations. The costs to separate New Energizer are primarily reflected in continuing operations; however, certain costs specifically related to New Energizer are included in discontinued operations. The prior year Consolidated Statements of Comprehensive Loss and Cash Flows have not been adjusted to reflect the impact of the Separation for all periods presented. Net sales and earnings from New Energizer's operations were as follows:
Fiscal Year | |||
2015 | |||
Net sales | $ | 1,232.5 | |
Earnings before income taxes from discontinued operations | $ | 91.1 | |
Income tax provision for discontinued operations | 70.3 | ||
Net earnings from discontinued operations, net of tax | $ | 20.8 | |
As a result of the Separation, during fiscal 2015, the Company recorded a $230.6 reduction in retained earnings which included net assets of $8.8. The Separation also resulted in a reduction of Accumulated other comprehensive loss associated with foreign currency translation adjustments and with pension and postretirement benefit plans. The total adjustment to accumulated other comprehensive loss was $221.8 for fiscal 2015. In June 2016, the Company transferred the remaining international pension obligation to New Energizer, which had been pending jurisdictional approval. In connection with the transfer, Accumulated other comprehensive loss was reduced an additional $2.3.
The Company incurred incremental costs to evaluate, plan and execute the Separation. The Company also initiated certain restructuring activities in order to prepare both businesses to operate as stand-alone entities. These charges related to Spin and Spin restructuring initiatives were included in continuing operations as follows:
• | $12.0 for fiscal 2016 ($11.8 included in SG&A and $0.2 included in Cost of products sold); |
• | $170.3 for fiscal 2015 ($137.8 included in SG&A, $4.2 included in Cost of products sold and $28.3 included in Spin restructuring charges); and |
• | $206.7 for the project-to-date ($174.0 included in SG&A, $4.4 included in Cost of products sold and $28.3 included in Spin restructuring charges). |
Of the total Spin and Spin restructuring costs included within continuing operations, $9.7 were non-cash, primarily related to asset impairments and incremental costs associated with the modification of equity awards. The Company does not expect to incur additional Spin or Spin restructuring costs.
In addition to the above costs included in continuing operations, $73.5 and $38.6 of Spin and Spin restructuring costs in fiscal 2015 were included in discontinued operations.
Divestiture
In May 2015, the Board authorized the strategic decision to exit the Company's industrial business, which was part of its All Other segment, due to a shift of management focus to other segment products. The Company finalized the sale of the business in September 2015. The sale impacted operations in Verona, Virginia; Obregon, Mexico; and the U.K. During fiscal 2015, the Company incurred $21.9 of non-cash asset impairment charges and recorded a $10.8 loss on the sale. The operating results of the industrial business were not material to the Company's financial statements during the periods presented.
65
Note 4 - Acquisitions
Bulldog Skincare Holdings Limited
On October 31, 2016, the Company completed the acquisition of Bulldog, a men's grooming and skincare products company based in the U.K., for $34.0, net of cash acquired. The acquisition created opportunities to expand Edgewell's personal care portfolio into a growing global category where it can leverage its international geographic footprint. The acquisition was financed through available foreign cash.
The Company has recognized the assets and liabilities of Bulldog based on estimates of their acquisition date fair values. The determination of the fair values of the acquired assets and assumed liabilities, including goodwill and other intangible assets, requires significant judgment. The Company completed the fair value determinations during the third quarter of fiscal 2017, resulting in immaterial changes. The following presents the purchase price allocation:
Cash | $ | 1.2 | ||
Inventory | 2.5 | |||
Other assets | 3.8 | |||
Goodwill | 16.4 | |||
Other intangible assets | 18.0 | |||
Liabilities | (6.7 | ) | ||
Net assets acquired | $ | 35.2 | ||
The intangible assets acquired consisted of customer relationships and product formulations, with a weighted-average useful life of 14 years, and the Bulldog trade name, which has been classified as an indefinite-lived intangible asset. The excess of the purchase price over net tangible and intangible assets acquired resulted in goodwill of $16.4, which represents the value of the expansion into new markets and the acquired workforce of Bulldog, and is not expected to be deductible for tax purposes. All assets are included in the Company's Sun and Skin Care segment.
Acquisition and integration costs related to the acquisition were not material.
Household Products Acquisition (Discontinued Operations)
In December 2014, the Company completed an acquisition related to the Household Products business for $12.1. The Company developed an estimate of the fair values of assets acquired, which resulted in $2.3 of goodwill, which was fully allocated to the former Household Products segment and distributed with the assets and liabilities of New Energizer.
66
Note 5 - Restructuring Charges
Spin Restructuring
The Company initiated certain restructuring activities related to the Separation in order to prepare both businesses to operate as stand-alone entities. The restructuring activities included efforts to adapt the global go-to-market footprint to adjust to the future strategies and scale of each stand-alone business; centralize certain back-office functions to increase efficiencies; outsource certain non-core transactional activities; and reduce headcount to optimize the cost structures of each stand-alone business. The Company incurred $28.3 of Spin restructuring costs in fiscal 2015. These charges consisted of severance and related benefit costs, non-cash asset write-downs, as well as other exit-related costs. The Company did not incur Spin restructuring costs in fiscal 2017 or 2016. As of September 30, 2017 and 2016, $0.6 and $5.2 of accrued Spin restructuring charges were included within Other current liabilities, respectively.
The Company does not include Spin restructuring costs in the results of its reportable segments. The estimated impact of allocating such charges to segment results for fiscal 2015 would have been as follows:
Fiscal 2015 | |||||||||||||||||||||||
Wet Shave | Sun and Skin Care | Feminine Care | All Other | Corporate | Total | ||||||||||||||||||
Spin Restructuring | |||||||||||||||||||||||
Severance and related benefit costs | $ | 17.3 | $ | 3.9 | $ | 2.1 | $ | 0.4 | $ | 1.3 | $ | 25.0 | |||||||||||
Other exit costs | (1.6 | ) | 0.6 | 2.6 | 1.7 | — | 3.3 | ||||||||||||||||
Total Spin restructuring | $ | 15.7 | $ | 4.5 | $ | 4.7 | $ | 2.1 | $ | 1.3 | $ | 28.3 | |||||||||||
Restructuring
In November 2012, the Board authorized an enterprise-wide restructuring plan (the "Restructuring"). The Restructuring originally included several initiatives focused on reducing costs in general and administrative functions, as well as reducing manufacturing and operating costs associated with the Company's discontinued operations. In January 2014, the Board authorized an expansion of scope of the previously announced Restructuring, which included rationalization and streamlining Edgewell operating facilities and other cost saving initiatives. Restructuring charges specific to Edgewell have primarily related to plant closure and accelerated depreciation charges and severance and related benefit costs. Due to an increase in the Wet Shave footprint costs and a delay in the transition of manufacturing in our Feminine Care segment from Montreal to Dover, Delaware, project costs were higher than expected during fiscal 2017, and include a non-cash charge related to the disposition of real estate.
Expenses incurred under the Restructuring plan are reflected below, including the estimated impact of allocating such charges to segment results. No Restructuring charges have been allocated to the Company's All Other segment. The Company does not include restructuring costs in the results of its reportable segments.
Fiscal 2017 | |||||||||||||||||||
Wet Shave | Sun and Skin Care | Feminine Care | Corporate | Total | |||||||||||||||
Restructuring | |||||||||||||||||||
Severance and related benefit costs | $ | 1.2 | $ | — | $ | 5.3 | $ | — | $ | 6.5 | |||||||||
Accelerated depreciation | 0.1 | — | 6.8 | — | 6.9 | ||||||||||||||
Consulting, program management and other exit costs | 9.0 | 0.2 | 7.0 | — | 16.2 | ||||||||||||||
Total Restructuring | $ | 10.3 | $ | 0.2 | $ | 19.1 | $ | — | $ | 29.6 | |||||||||
67
Fiscal 2016 | |||||||||||||||||||
Wet Shave | Sun and Skin Care | Feminine Care | Corporate | Total | |||||||||||||||
Restructuring | |||||||||||||||||||
Severance and related benefit costs | $ | 10.6 | $ | 0.2 | $ | 6.2 | $ | — | $ | 17.0 | |||||||||
Accelerated depreciation | — | — | 3.9 | — | 3.9 | ||||||||||||||
Consulting, program management and other exit costs | 4.8 | 0.2 | 11.1 | — | 16.1 | ||||||||||||||
Total Restructuring | $ | 15.4 | $ | 0.4 | $ | 21.2 | $ | — | $ | 37.0 | |||||||||
Fiscal 2015 | |||||||||||||||||||
Wet Shave | Sun and Skin Care | Feminine Care | Corporate | Total | |||||||||||||||
Restructuring | |||||||||||||||||||
Severance and related benefit costs | $ | 1.9 | $ | 1.2 | $ | 6.1 | $ | 0.1 | $ | 9.3 | |||||||||
Accelerated depreciation | — | — | 4.6 | — | 4.6 | ||||||||||||||
Consulting, program management and other exit costs | 2.1 | 2.1 | 7.6 | 1.0 | 12.8 | ||||||||||||||
Total Restructuring | $ | 4.0 | $ | 3.3 | $ | 18.3 | $ | 1.1 | $ | 26.7 | |||||||||
In addition, $0.7 and $1.8 for fiscal 2017 and 2016, respectively, associated with obsolescence charges related to the exit of certain non-core product lines as part of the Restructuring were included in Cost of products sold. Costs of $0.3 for fiscal 2015 associated with certain information technology enablement activities related to the Company's Restructuring initiative were included in SG&A. These information technology costs and non-core inventory obsolescence charges are considered part of the total project costs incurred for the Restructuring. Project-to-date restructuring costs inclusive of non-core inventory obsolescence and information technology charges total $170.1.
The following table summarizes the Restructuring activities and related accrual (excluding certain information technology enablement and obsolescence charges related to the Restructuring) for fiscal 2017:
Utilized | |||||||||||||||||||||||
October 1, 2016 | Charge to Income | Other (1) | Cash | Non-Cash | September 30, 2017 | ||||||||||||||||||
Restructuring | |||||||||||||||||||||||
Severance and termination related costs | $ | 16.7 | $ | 6.5 | $ | (0.3 | ) | $ | (20.5 | ) | $ | — | $ | 2.4 | |||||||||
Asset impairment and accelerated depreciation | — | 6.9 | — | — | (6.9 | ) | — | ||||||||||||||||
Other related costs | — | 16.2 | — | (16.2 | ) | — | — | ||||||||||||||||
Total Restructuring | $ | 16.7 | $ | 29.6 | $ | (0.3 | ) | $ | (36.7 | ) | $ | (6.9 | ) | $ | 2.4 | ||||||||
(1) | Includes the impact of currency translation. |
The following table summarizes the Restructuring activities and related accrual (excluding certain information technology enablement and obsolescence charges related to the restructuring) for fiscal 2016:
Utilized | |||||||||||||||||||||||
October 1, 2015 | Charge to Income | Other (1) | Cash | Non-Cash | September 30, 2016 | ||||||||||||||||||
Restructuring | |||||||||||||||||||||||
Severance and termination related costs | $ | 13.7 | $ | 17.0 | $ | 0.6 | $ | (14.6 | ) | $ | — | $ | 16.7 | ||||||||||
Asset impairment and accelerated depreciation | — | 3.9 | — | — | (3.9 | ) | — | ||||||||||||||||
Other related costs | — | 16.1 | — | (16.1 | ) | — | — | ||||||||||||||||
Total Restructuring | $ | 13.7 | $ | 37.0 | $ | 0.6 | $ | (30.7 | ) | $ | (3.9 | ) | $ | 16.7 | |||||||||
(1) | Includes the impact of currency translation. |
68
Note 6 - Income Taxes
The provisions for income taxes from continuing operations consisted of the following:
Fiscal Year | |||||||||||
2017 | 2016 | 2015 | |||||||||
Currently payable: | |||||||||||
United States - Federal | $ | 0.5 | $ | 2.6 | $ | 12.0 | |||||
State | 0.2 | 3.0 | (1.0 | ) | |||||||
Foreign | 27.0 | 24.4 | 45.3 | ||||||||
Total current | 27.7 | 30.0 | 56.3 | ||||||||
Deferred: | |||||||||||
United States - Federal | (79.3 | ) | 4.6 | (194.8 | ) | ||||||
State | (3.8 | ) | 2.5 | 0.5 | |||||||
Foreign | (3.2 | ) | 4.1 | (24.6 | ) | ||||||
Total deferred | (86.3 | ) | 11.2 | (218.9 | ) | ||||||
Provision for income taxes | $ | (58.6 | ) | $ | 41.2 | $ | (162.6 | ) | |||
The source of pre-tax earnings (loss) was:
Fiscal Year | |||||||||||
2017 | 2016 | 2015 | |||||||||
United States | $ | (230.5 | ) | $ | 53.3 | $ | (589.3 | ) | |||
Foreign | 177.6 | 166.6 | 130.6 | ||||||||
Pre-tax earnings (loss) | $ | (52.9 | ) | $ | 219.9 | $ | (458.7 | ) | |||
A reconciliation of income taxes with the amounts computed at the statutory federal income tax rate follows:
Fiscal Year | ||||||||||||||||||||
2017 | 2016 | 2015 | ||||||||||||||||||
Computed tax at federal statutory rate | $ | (18.5 | ) | 35.0 | % | $ | 77.0 | 35.0 | % | $ | (160.5 | ) | 35.0 | % | ||||||
State income taxes, net of federal tax benefit | (2.0 | ) | 3.9 | 1.3 | 0.6 | (9.9 | ) | 2.2 | ||||||||||||
Foreign tax less than the federal rate | (38.0 | ) | 71.8 | (32.5 | ) | (14.8 | ) | (32.2 | ) | 7.0 | ||||||||||
Adjustments to prior years' tax accruals | (6.2 | ) | 11.8 | (4.8 | ) | (2.2 | ) | (3.2 | ) | 0.7 | ||||||||||
Other taxes including repatriation of foreign earnings | 5.0 | (9.5 | ) | 4.4 | 2.0 | 5.4 | (1.2 | ) | ||||||||||||
Nontaxable share option | — | — | — | — | (0.2 | ) | — | |||||||||||||
Venezuela deconsolidation | — | — | — | — | 27.7 | (6.0 | ) | |||||||||||||
Other, net | 1.1 | (2.2 | ) | (4.2 | ) | (1.9 | ) | 10.3 | (2.3 | ) | ||||||||||
Total | $ | (58.6 | ) | 110.8 | % | $ | 41.2 | 18.7 | % | $ | (162.6 | ) | 35.4 | % | ||||||
69
The deferred tax assets and deferred tax liabilities recorded on the balance sheet were as follows, and include current and noncurrent amounts:
September 30, | |||||||
2017 | 2016 | ||||||
Deferred tax liabilities: | |||||||
Depreciation and property differences | $ | (57.0 | ) | $ | (65.2 | ) | |
Intangible assets | (355.0 | ) | (457.3 | ) | |||
Other tax liabilities | (5.8 | ) | (4.0 | ) | |||
Gross deferred tax liabilities | (417.8 | ) | (526.5 | ) | |||
Deferred tax assets: | |||||||
Accrued liabilities | 57.3 | 66.2 | |||||
Deferred and share-based compensation | 31.5 | 47.6 | |||||
Tax loss carryforwards and tax credits | 84.7 | 72.6 | |||||
Postretirement benefits other than pensions | 4.4 | 4.6 | |||||
Pension plans | 59.5 | 73.7 | |||||
Inventory differences | 4.5 | 6.8 | |||||
Other tax assets | 20.4 | 26.9 | |||||
Gross deferred tax assets | 262.3 | 298.4 | |||||
Valuation allowance | (8.4 | ) | (8.5 | ) | |||
Net deferred tax liabilities | $ | (163.9 | ) | $ | (236.6 | ) | |
There were no material tax loss carryforwards that expired in fiscal 2017. Future expirations of tax loss carryforwards and tax credits, if not utilized, are not material from 2018 through 2021. For years subsequent to 2021 or for tax loss carryforwards and tax credits that have no expiration, $76.7 of the value at September 30, 2017 is primarily due to the fiscal 2015 domestic loss which has a 20 year carryforward period and is expected to be fully utilized. The valuation allowance is primarily attributable to tax loss carryforwards and certain deferred tax assets impacted by the deconsolidation of the Company's Venezuelan subsidiaries.
The Company generally repatriates a portion of current year earnings from select non-US subsidiaries only if the economic cost of the repatriation is not considered material. The Company's intention is to reinvest earnings of other foreign subsidiaries indefinitely as the repatriation of cash balances could have adverse tax consequences or be subject to regulatory capital requirements; however, those balances are generally available without legal restrictions to fund ordinary business operations. No provision is made for additional taxes on undistributed earnings of foreign affiliates that are intended and planned to be indefinitely invested in the affiliate. The Company intends to, and has plans to, reinvest these earnings indefinitely in its foreign subsidiaries to, amongst other things, fund local operations, fund pension and other post retirement obligations, fund capital projects and to support foreign growth initiatives including potential acquisitions. At September 30, 2017, approximately $1,167.9 of foreign subsidiary earnings were considered indefinitely invested in those businesses. The Company estimates that the U.S. federal income tax liability that could potentially arise if indefinitely invested earnings of foreign subsidiaries were repatriated in full to the U.S. would be significant. While it is not practical to calculate a specific potential U.S. tax exposure due to changing statutory rates in foreign jurisdictions over time, as well as other factors, the Company estimates the range of potential U.S. tax may be in excess of $279.6, if all undistributed earnings were repatriated assuming foreign cash was available to do so. Applicable U.S. income and foreign withholding taxes would be provided on these earnings in the periods in which they are no longer considered indefinitely reinvested.
Unrecognized tax benefits activity are summarized below:
2017 | 2016 | 2015 | |||||||||
Unrecognized tax benefits, beginning of year | $ | 27.9 | $ | 47.1 | $ | 37.8 | |||||
Additions based on current year tax positions and acquisitions | 1.8 | 6.0 | 17.6 | ||||||||
Reductions for prior year tax positions and dispositions | (0.6 | ) | (8.5 | ) | (8.0 | ) | |||||
Settlements with taxing authorities and statute expirations | (6.4 | ) | (16.7 | ) | (0.3 | ) | |||||
Unrecognized tax benefits, end of year | $ | 22.7 | $ | 27.9 | $ | 47.1 | |||||
70
Included in the unrecognized tax benefits noted above was $19.2 of uncertain tax positions that would affect the Company's effective tax rate, if recognized. The Company does not expect any significant increases or decreases to its unrecognized tax benefits within twelve months of this reporting date. In the Consolidated Balance Sheets, unrecognized tax benefits are classified as Other liabilities (non-current) to the extent that payments are not anticipated within one year.
The Company classifies accrued interest and penalties related to unrecognized tax benefits in the income tax provision. The accrued interest and penalties are not included in the table above. The Company accrued approximately $3.8 of interest, (net of the deferred tax asset of $1.8) at September 30, 2017, and $6.0 of interest, (net of the deferred tax asset of $1.7) at September 30, 2016. Interest was computed on the difference between the tax position recognized in accordance with GAAP and the amount previously taken or expected to be taken in the Company's tax returns.
The Company files income tax returns in the U.S. federal jurisdiction, various cities and states, and more than 50 foreign jurisdictions where the Company has operations. U.S. federal income tax returns for tax years ended September 30, 2014 and after remain subject to examination by the Internal Revenue Service (the "IRS"). With few exceptions, the Company is no longer subject to state and local income tax examinations for years before September 30, 2007. The status of international income tax examinations varies by jurisdiction. At this time, the Company does not anticipate any material adjustments to its financial statements resulting from tax examinations currently in progress.
Note 7 - Earnings (Loss) per Share
Basic earnings (loss) per share is based on the average number of common shares outstanding during the period. Diluted earnings (loss) per share is based on the average number of shares used for the basic earnings (loss) per share calculation, adjusted for the dilutive effect of share options and RSE awards.
Following is the reconciliation between the number of weighted-average shares used in the basic and diluted earnings (loss) per share calculation:
Fiscal Year | ||||||||
2017 | 2016 | 2015 | ||||||
Basic weighted-average shares outstanding | 57.3 | 59.2 | 62.0 | |||||
Effect of dilutive securities: | ||||||||
RSE awards | 0.2 | 0.5 | — | |||||
Total dilutive securities | 0.2 | 0.5 | — | |||||
Diluted weighted-average shares outstanding | 57.5 | 59.7 | 62.0 | |||||
For fiscal 2017, 2016 and 2015, the calculation of diluted weighted-average shares outstanding excludes 0.5, 0.4 and 0.4 of share options because the effect of including these awards was anti-dilutive. For fiscal 2017, the number of RSE awards considered anti-dilutive was immaterial. For fiscal 2016, the calculation of diluted weighted-average shares outstanding excludes 0.2 of RSE awards because the effect of including these awards was anti-dilutive. For fiscal 2015, the calculation of diluted weighted-average shares outstanding excludes 0.5 of RSE awards that would have otherwise been dilutive, because the Company reported a net loss.
Note 8 - Goodwill and Intangible Assets
The following table sets forth goodwill by segment:
Wet Shave | Sun and Skin Care | Feminine Care | All Other | Total | |||||||||||||||
Balance at October 1, 2016 | $ | 965.3 | $ | 178.0 | $ | 207.4 | $ | 69.6 | $ | 1,420.3 | |||||||||
Acquisition of Bulldog | — | 16.4 | — | — | 16.4 | ||||||||||||||
Cumulative translation adjustment | 5.9 | 1.2 | 2.1 | — | 9.2 | ||||||||||||||
Balance at September 30, 2017 | $ | 971.2 | $ | 195.6 | $ | 209.5 | $ | 69.6 | $ | 1,445.9 | |||||||||
71
Total amortizable intangible assets were as follows:
September 30, 2017 | September 30, 2016 | ||||||||||||||||||||||
Gross Carrying Amount | Accumulated Amortization | Net | Gross Carrying Amount | Accumulated Amortization | Net | ||||||||||||||||||
Trade names and brands | $ | 188.6 | $ | 16.0 | $ | 172.6 | $ | 14.6 | $ | 12.2 | $ | 2.4 | |||||||||||
Technology and patents | 77.9 | 74.4 | 3.5 | 76.9 | 69.8 | 7.1 | |||||||||||||||||
Customer related and other | 151.5 | 89.8 | 61.7 | 141.8 | 79.6 | 62.2 | |||||||||||||||||
Total amortizable intangible assets | $ | 418.0 | $ | 180.2 | $ | 237.8 | $ | 233.3 | $ | 161.6 | $ | 71.7 | |||||||||||
Total amortizable intangible assets increased $184.7 primarily as a result of the conversion of the Playtex, Skintimate and Edge tradenames to definite-lived intangible assets and the acquisition of Bulldog, see Note 4 of Notes to Consolidated Financial Statements for more information. Amortization expense for intangible assets was $17.8, $14.4 and $15.1 for fiscal 2017, 2016 and 2015, respectively. Estimated amortization expense for amortizable intangible assets for fiscal 2018, 2019, 2020, 2021 and 2022 is approximately $16.1, $14.8, $14.2, $13.5, and $13.5, respectively, and $165.7 thereafter.
The Company had indefinite-lived intangible assets of $833.9 ($184.0 in Wet Shave, $475.6 in Sun and Skin Care, $30.3 in Feminine Care and $144.0 in All Other) at September 30, 2017, a decrease of $479.5 from September 30, 2016. Indefinite-lived intangible assets decreased $312.0 and $7.0 as a result of the impairments of the Playtex and Edge tradenames, respectively. Additionally, the conversion of Playtex, Edge and Skintimate® brand names to finite-lived intangible assets decreased indefinite-lived intangible assets by $102.8, $40.0 and $30.9, respectively. The decrease in indefinite-lived intangible assets from the conversion were partially offset by the acquisition of the $9.1 indefinite-lived Bulldog trade name. The remaining change in indefinite-lived intangible assets resulted from changes in foreign currency translation rates.
Goodwill and intangible assets deemed to have an indefinite life are not amortized, but reviewed annually in the fourth fiscal quarter for impairment of value or when indicators of a potential impairment are present. The Company continuously monitors changing business conditions, which may indicate that the remaining useful life of goodwill and other intangible assets may warrant revision or carrying amounts may require adjustment.
Indefinite-lived intangible assets
In fiscal 2015, the Company determined that the carrying values of its Playtex, Wet Ones and Skintimate brand names were above the fair values, resulting in a non-cash asset impairment charge of $318.2. This charge, which was shown as a separate line item, is attributable to the Company's segments as follows: $29.6 Wet Shave; $55.8 Sun and Skin Care; $161.3 Feminine Care and $71.5 All Other. The impairment of the Playtex brand in fiscal 2015 was primarily the result of slower adoption of new products and reductions in legacy product sales for certain feminine care products, as well as declines in certain international markets related to the Separation. In addition, the impairment of the Playtex brand was driven by infant care products, where competitive pressures, delays in product launches and loss of licensing drove the sales decline. Both the Wet Ones and Skintimate impairments were primarily related to the introduction of competing products in the market, which resulted in share and margin declines.
During the fourth quarter of fiscal 2016, the Company completed its annual impairment testing and found the carrying value of its Skintimate brand name to be above the fair value, resulting in a non-cash asset impairment charge of $6.5. The fiscal 2016 impairment charge was caused by further market share erosion above previous estimates. Based on the impairments taken in fiscal 2016 and 2015 and continued competitive pressure on this brand, as of October 1, 2016, the Skintimate brand name was converted to a definite-lived asset and assigned a useful life of 20 years. This conversion increased amortization expense by $1.5 during fiscal 2017.
During the fourth quarter of fiscal 2017, the Company completed our annual impairment testing and found the carrying values of the Playtex and Edge brand names to be above the fair value, resulting in a non-cash asset impairment charge of $312.0 and $7.0, respectively.
The 2017 Playtex impairment was largely driven by products in the feminine care reporting unit and to a lesser degree, by Playtex gloves and certain products in the infant care reporting unit. After the initial impairment in 2015, the Company was in the beginning stages of consolidating its feminine care manufacturing operations into one plant in the U.S., with the project expected to deliver significant cost savings for the manufacture of Playtex feminine care products, as well as other feminine care products. The Company had also recently introduced the new Sport Pads and Liners products and was optimistic about future growth as well as the potential for other new Playtex feminine care products in the development pipeline.
72
Sales of the Company's legacy product, Gentle Glide, continued to decline in 2016 and 2017, due to competitive activity and market share declines. The Playtex brand name passed impairment testing in 2016, due to growth expected in Playtex Sport tampons with new media campaigns, new product launch estimates, and ongoing strong equity, as well as margin improvement due to cost savings from the consolidation of manufacturing operations, as well as new Playtex branded feminine care products in the development pipeline.
In early 2017, heightened competitive activity and retail planogram compression led to lower than expected consumption and delistings of the new Sports Pads and Liners products. These products were discontinued in the fourth quarter of 2017.
In the 4th quarter of 2017, consumption, share and net sales declines accelerated due to further heightened competitive activity including product launches directed at the Sport franchise. In addition significant retail channel shifts within the category toward value and club impacted our share position. When the Company completed our projections for the Playtex business in the fourth quarter of fiscal 2017, the future cash flows from its Playtex brands were significantly lower than previous projections due to lower sales as well as reduced profitability driven by higher unit costs. In October 2017, the Company completed the sale of our Playtex gloves business.
The Edge impairment is related to erosion of market share to competing products.
Based upon the impairment in fiscal 2015 for Playtex and the outlook for Edge, both intangible assets are being converted to definite lived intangible assets during the fourth quarter of fiscal 2017 with useful lives of 20 years. The Company recorded amortization of the intangible assets related to the conversion of $1.8 in the fourth quarter of fiscal 2017. The conversion will increase intangible asset amortization by $7.1 for fiscal 2018.
The impairment analysis indicated that the Wet Ones trade name was not impaired during the fiscal 2017 or 2016 testing. The fair value of the brand name was determined to be $189 or approximately 110% of the carrying value. The fair value of the trade name will be sensitive to changes in discount rates and forecasts that could lead to future impairment as the fair value of intangible asset continues to be relatively close to the carrying value due to the assets being written down to their fair value in fiscal 2015.
The table below presents, based on the impairment test performed in the fourth quarter, the change in the fair value of the Playtex and Wet Ones brand name intangible assets given a 0.5% change in the assumed discount rate or the long-term annual revenue growth rate.
Discount rate increased by 0.5% | Discount rate decreased by 0.5% | Long-term growth rate increased by 0.5% | Long-term growth rate decreased by 0.5% | ||||||||||||
Playtex brand name | |||||||||||||||
Change in fair value | $ | (7 | ) | $ | 8 | $ | 6 | $ | (5 | ) | |||||
Wet Ones brand name | |||||||||||||||
Change in fair value | $ | (14 | ) | $ | 17 | $ | 13 | $ | (11 | ) | |||||
Percentage by which fair value exceeds carrying value | 1 | % | 19 | % | 17 | % | 3 | % | |||||||
During fiscal 2015, in connection with the sale of its industrial business, the Company recorded a $2.5 impairment of brand names and a $5.6 impairment of customer-related intangibles. For further information on the sale, refer to Note 3 of Notes to the Consolidated Financial Statements.
Goodwill
The results of current year testing did not indicate that goodwill impairment exists, as of the testing date. The fair values of the Company's Feminine Care and Skin Care reporting units were between 110% and 120% of the respective carrying values. The carrying value of goodwill associated with the Company's Feminine Care and Skin Care reporting units at the time of the impairment testing were $207.8 and $71.6, respectively.
The fair value of the Feminine Care reporting unit was calculated to be $456 during the annual impairment testing. The fair value of Feminine Care exceeded the carrying value by 19%. The carrying value of the Feminine Care reporting unit decreased approximately $198 as a result of the impairment of the Playtex brand name. The fair value could be negatively impacted by changes in assumptions including the discount rate, terminal growth rate, operating margins and market data.
The fair value of the Skin Care reporting unit was calculated to be $269 during the annual impairment testing. The fair value of Skin Care exceeded the carrying value by 11%. A significant portion of the Skin Care reporting unit relates to the Wet Ones brand name. As discussed above, the fair value of the Wet Ones brand name continues to be relatively close to the carrying value and is sensitive to changes in assumptions. See above for further discussion on the valuation of the Wet Ones brand name.
73
Note 9 - Supplemental Balance Sheet Information
September 30, 2017 | September 30, 2016 | ||||||
Inventories | |||||||
Raw materials and supplies | $ | 50.6 | $ | 50.8 | |||
Work in process | 60.9 | 43.9 | |||||
Finished products | 222.0 | 214.5 | |||||
Total inventories | $ | 333.5 | $ | 309.2 | |||
Other Current Assets | |||||||
Miscellaneous receivables | $ | 16.9 | $ | 29.1 | |||
Prepaid expenses | 55.6 | 49.0 | |||||
Value added tax collectible from customers | 25.2 | 22.4 | |||||
Income taxes receivable | 24.7 | 39.3 | |||||
Other | 3.3 | 3.4 | |||||
Total other current assets | $ | 125.7 | $ | 143.2 | |||
Property, Plant and Equipment | |||||||
Land | $ | 19.3 | $ | 27.8 | |||
Buildings | 139.1 | 146.0 | |||||
Machinery and equipment | 947.4 | 913.7 | |||||
Capitalized software costs | 42.3 | 38.4 | |||||
Construction in progress | 49.7 | 36.2 | |||||
Total gross property, plant and equipment | 1,197.8 | 1,162.1 | |||||
Accumulated depreciation | (744.4 | ) | (676.0 | ) | |||
Total property, plant and equipment, net | $ | 453.4 | $ | 486.1 | |||
Other Current Liabilities | |||||||
Accrued advertising, sales promotion and allowances | $ | 32.2 | $ | 46.8 | |||
Accrued trade allowances | 24.6 | 30.1 | |||||
Accrued salaries, vacations and incentive compensation | 40.6 | 56.0 | |||||
Income taxes payable | 18.3 | 19.7 | |||||
Returns reserve | 53.3 | 49.9 | |||||
Restructuring reserve | 3.0 | 21.9 | |||||
Value added tax payable | 5.8 | 25.0 | |||||
Deferred compensation | 13.8 | 26.1 | |||||
Other | 89.8 | 95.9 | |||||
Total other current liabilities | $ | 281.4 | $ | 371.4 | |||
Other Liabilities | |||||||
Pensions and other retirement benefits | $ | 109.4 | $ | 154.9 | |||
Deferred compensation | 47.3 | 58.6 | |||||
Other non-current liabilities | 58.8 | 61.3 | |||||
Total other liabilities | $ | 215.5 | $ | 274.8 | |||
Note 10 - Accounts Receivable Facility
On September 15, 2017, the Company entered into a $150 uncommitted master accounts receivable purchase agreement with The Bank of Tokyo-Mitsubishi UFJ, Ltd., New York Branch, as the purchaser (the "Purchaser"). Under this agreement, the Company can sell a pool of trade receivables of specific customers to the Purchaser on a revolving basis, subject to specific sub-limits for each customer. The Purchaser may purchase receivables at face value less a dilution reserve adjusted annually based on historical data and the discount rate. As of September 30, 2017, the discount rate used to determine the purchase price for the subject receivables is based upon LIBOR plus a margin applicable to the specified obligor.
The term of the receivables purchase agreement will end on September 14, 2018, subject to automatic 364-day extensions unless the Company or Purchaser elects not to extend the term. Additionally, either the Company or Purchaser may terminate the agreement at any time after the initial 364-day term upon 30 days written notice.
74
Transfers under this agreement are accounted for as sales of receivables, resulting in the receivables being de-recognized from the Consolidated Balance Sheet. The Purchaser assumes the credit risk at the time of sale and has the right at any time to assign, transfer or participate any of its rights under the purchased receivables to another bank or financial institution. The purchase and sale of receivables under the agreement is intended to be an absolute and irrevocable transfer without recourse by the Purchaser to the Company for the creditworthiness of any obligor.
The Company continues to have collection and servicing responsibilities for the receivables sold and receives separate compensation for their servicing. The compensation received is considered acceptable servicing compensation and, as such, the Company does not recognize a servicing asset or liability under the facility.
Account receivables sold under this agreement for the year ended September 30, 2017 were $98.1. The Company's operating cash flows were positively impacted by the amount of the trade receivables sold, which remained outstanding with the Purchaser. The trade receivables sold that remained outstanding under this agreement as of September 30, 2017 were $81.7. The dilution reserve for the outstanding receivables was $8.2 and is recognized on the balance sheet as a receivable. The net proceeds received were included in cash provided by operating activities in the consolidated statement of cash flows. The difference between the carrying amount of the trade receivables sold and the sum of the cash received is recorded as a loss on sale of receivables in Other expense (income), net in the Consolidated Statement of Earnings. For the year ended September 30, 2017, the loss on sale of trade receivables was immaterial.
Note 11 - Debt
The detail of long-term debt was as follows:
September 30, 2017 | September 30, 2016 | ||||||
Senior notes, fixed interest rate of 4.7%, due 2021, net (1) | $ | 598.3 | $ | 597.8 | |||
Senior notes, fixed interest rate of 4.7%, due 2022, net (1) (2) | 497.4 | 496.9 | |||||
U.S. revolving credit facility due 2020 (3) | 245.0 | 265.0 | |||||
Netherlands revolving credit facility due 2017 (3) | — | 281.8 | |||||
Term loan due 2019, net (1) (3) | 184.7 | 184.5 | |||||
Total long-term debt, including current maturities | 1,525.4 | 1,826.0 | |||||
Less current portion | — | 281.8 | |||||
Total long-term debt | $ | 1,525.4 | $ | 1,544.2 | |||
(1) | At September 30, 2017, the balance for the senior notes due 2021, the senior notes due 2022 and the term loan are reflected net of debt issuance costs of $1.7, $1.9 and $0.3, respectively. At September 30, 2016, the balance for the senior notes due 2021, the senior notes due 2022 and the term loan are reflected net of debt issuance costs of $2.2, $2.3 and $0.5, respectively. |
(2) | At September 30, 2017 and September 30, 2016, the balance for the senior notes due 2022 is reflected net of discount of $0.7 and $0.8, respectively. |
(3) | Variable-rate debt, based on LIBOR plus applicable margin. |
At September 30, 2017 and 2016, the Company also had outstanding short-term notes payable with financial institutions with original maturities of less than ninety days of $19.4 and $18.5, respectively, and which had weighted-average interest rates of 5.5% and 5.5%, respectively. These notes were primarily outstanding international borrowings.
Netherlands Revolving Credit Facility
On October 20, 2016, the Company terminated its commitments under the Netherlands revolving credit facility and repaid all outstanding loans and other obligations in full, in the amount of $277.0. As of September 30, 2016, the Company had outstanding borrowings of $281.8 under this facility, recorded in Current maturities of long-term debt.
75
U.S. Revolving Credit Facility
On March 13, 2017, the Company entered into Amendment No. 3 to the Credit Agreement (the "Amendment"), amending the Credit Agreement dated June 1, 2015 (as amended, the "Credit Agreement"), and an Increasing Lender Support Supplement to the Credit Agreement (the "Supplement"). The Amendment and the Supplement provide for an increase of $75.0 (from $650.0 to $725.0) in the revolving loans available to the Company. Additionally, certain other changes were made to the Credit Agreement, including allowing the Company to enter into receivables sales facilities for up to $150.0. As of September 30, 2017, the Company had outstanding borrowings of $245.0 under its unsecured revolving credit facility in the U.S., recorded in Long-term debt, and $8.0 of outstanding letters of credit. Taking into account outstanding borrowings and outstanding letters of credit, $472.0 remains available as of September 30, 2017.
For further information on the receivables sales facility, see Note 10 of Notes to Consolidated Financial Statements.
Debt Covenants
The credit agreements governing the Company's outstanding debt at September 30, 2017 contain certain customary representations and warranties, financial covenants, covenants restricting its ability to take certain actions, affirmative covenants and provisions relating to events of default. Under the terms of the Company's credit agreements, the ratio of its indebtedness to its earnings before interest, taxes, depreciation and amortization ("EBITDA"), as defined in the agreement and detailed below, and the ratio of the Company's current year earnings before interest and taxes ("EBIT"), as defined in the agreements, to total interest expense must remain below certain thresholds. Under the credit agreements, EBITDA is defined as net earnings, as adjusted to add-back interest expense, income taxes, depreciation and amortization, all of which are determined in accordance with GAAP. In addition, the credit agreement allows certain non-cash charges such as stock award amortization and asset write-offs including, but not limited to, impairment and accelerated depreciation, to be "added-back" in determining EBITDA for purposes of the indebtedness ratio. EBIT is calculated in a fashion identical to EBITDA except that depreciation and amortization are not "added-back." Total interest expense is calculated in accordance with GAAP. If the Company fails to comply with these covenants or with other requirements of these credit agreements, the lenders may have the right to accelerate the maturity of the debt. Acceleration under one of the Company's facilities would trigger cross defaults on its other borrowings.
As of September 30, 2017, the Company was in compliance with the provisions and covenants associated with its debt agreements.
Debt Maturities
Aggregate maturities of long-term debt, including current maturities, at September 30, 2017 were as follows: $185.0 in two years, $245.0 in three years, $600.0 in four years and $500.0 in five years.
Note 12 - Retirement Plans
Pensions and Postretirement Plans
The Company has several defined benefit pension plans covering employees in the U.S. and certain employees in other countries. The plans provide retirement benefits based on years of service and earnings.
The Company also sponsors or participates in a number of other non-U.S. pension and postretirement arrangements, including various retirement and termination benefit plans, some of which are required by local law or coordinated with government-sponsored plans, which are not significant in the aggregate and, therefore, are not included in the information presented below.
As part of the Separation, and in accordance with an employee matters agreement entered into with New Energizer, certain combined plans were split between Edgewell and New Energizer. Accordingly, the Company transferred to New Energizer pension obligations associated with their active, retired and other former employees for those impacted defined benefit pension plans. The allocation of plan assets was determined in accordance with applicable ERISA (The Employee Retirement Income Security Act of 1974), IRS and other jurisdictional requirements. In June 2016, the Company transferred the remaining international pension obligation to New Energizer, which had been pending jurisdictional approval. In connection with this transfer, the Company's pension liability decreased by approximately $11.6.
The Company funds its pension plans in compliance with ERISA or local funding requirements. The Company evaluated the discretionary funding of certain international defined benefit plans and contributed approximately $100.5 to one of its plans during fiscal 2016. Additionally, the Company remeasured the pension benefit obligation and unrecognized loss in Accumulated other comprehensive loss for the funded plan, using an updated discount rate of 2.40% as of January 31, 2016, increasing the liability and decreasing Accumulated other comprehensive loss by approximately $7.7.
76
The following tables present the benefit obligation, plan assets and funded status of the plans:
As of September 30, | |||||||||||||||
Pension | Postretirement | ||||||||||||||
2017 | 2016 | 2017 | 2016 | ||||||||||||
Change in projected benefit obligation | |||||||||||||||
Benefit obligation at beginning of year | $ | 650.2 | $ | 607.6 | $ | 12.4 | $ | 10.8 | |||||||
Service cost | 7.3 | 5.1 | 0.2 | 0.2 | |||||||||||
Interest cost | 14.7 | 21.9 | 0.3 | 0.4 | |||||||||||
Actuarial (gain) loss | (22.6 | ) | 59.6 | (2.6 | ) | 1.0 | |||||||||
Benefits paid, net | (33.5 | ) | (32.8 | ) | (0.2 | ) | (0.1 | ) | |||||||
Plan curtailments | (1.5 | ) | — | — | — | ||||||||||
Plan settlements | — | (0.9 | ) | — | — | ||||||||||
Expenses paid | (3.2 | ) | — | — | — | ||||||||||
Foreign currency exchange rate changes | 7.6 | 1.3 | 0.5 | 0.1 | |||||||||||
Amounts distributed to New Energizer | — | (11.6 | ) | — | — | ||||||||||
Projected benefit obligation at end of year | 619.0 | 650.2 | 10.6 | 12.4 | |||||||||||
Change in plan assets | |||||||||||||||
Estimated fair value of plan assets at beginning of year | 508.0 | 373.6 | — | — | |||||||||||
Actual return on plan assets | 37.9 | 51.3 | — | — | |||||||||||
Company contributions | 5.8 | 115.1 | 0.2 | 0.1 | |||||||||||
Plan settlements | — | (0.9 | ) | — | — | ||||||||||
Benefits paid | (33.4 | ) | (32.8 | ) | (0.2 | ) | (0.1 | ) | |||||||
Expenses paid | (3.2 | ) | — | — | — | ||||||||||
Foreign currency exchange rate changes | 8.0 | 1.7 | — | — | |||||||||||
Estimated fair value of plan assets at end of year | 523.1 | 508.0 | — | — | |||||||||||
Funded status at end of year | $ | (95.9 | ) | $ | (142.2 | ) | $ | (10.6 | ) | $ | (12.4 | ) | |||
The following table presents the amounts recognized in the Consolidated Balance Sheets and Consolidated Statement of Changes in Shareholders' Equity:
As of September 30, | |||||||||||||||
Pension | Postretirement | ||||||||||||||
2017 | 2016 | 2017 | 2016 | ||||||||||||
Amounts recognized in the Consolidated Balance Sheets | |||||||||||||||
Noncurrent assets | $ | 5.1 | $ | 1.0 | $ | — | $ | — | |||||||
Current liabilities | (3.3 | ) | (1.7 | ) | (0.3 | ) | (0.3 | ) | |||||||
Noncurrent liabilities | (97.7 | ) | (141.5 | ) | (10.3 | ) | (12.1 | ) | |||||||
Net amount recognized | $ | (95.9 | ) | $ | (142.2 | ) | $ | (10.6 | ) | $ | (12.4 | ) | |||
Amounts recognized in Accumulated other comprehensive loss | |||||||||||||||
Net loss (gain) | $ | 162.3 | $ | 198.0 | $ | (3.1 | ) | $ | (0.7 | ) | |||||
Prior service credit | — | — | — | — | |||||||||||
Net amount recognized, pre-tax | $ | 162.3 | $ | 198.0 | $ | (3.1 | ) | $ | (0.7 | ) | |||||
77
Pre-tax changes recognized in other comprehensive income for fiscal 2017 were as follows:
Pension | Post- retirement | ||||||
Changes in plan assets and benefit obligations recognized in other comprehensive income | |||||||
Net loss arising during the year | $ | (30.1 | ) | $ | (2.6 | ) | |
Effect of exchange rates | 1.3 | (0.1 | ) | ||||
Amounts recognized as a component of net periodic benefit cost | |||||||
Amortization or curtailment recognition of prior service cost | — | — | |||||
Amortization or settlement recognition of net (loss) gain | (6.6 | ) | 0.4 | ||||
Total recognized in other comprehensive income | $ | (35.4 | ) | $ | (2.3 | ) | |
The minimum required contribution to our pension and post retirement plans in fiscal 2018 is $9.3 and $0.3, respectively; however, discretionary contributions may also be made.
The Company's expected future benefit payments are as follows:
Pension | Post- retirement | ||||||
Fiscal 2018 | $ | 38.0 | $ | 0.3 | |||
Fiscal 2019 | 36.9 | 0.4 | |||||
Fiscal 2020 | 36.6 | 0.4 | |||||
Fiscal 2021 | 36.4 | 0.4 | |||||
Fiscal 2022 | 36.5 | 0.4 | |||||
Fiscal 2023 to 2027 | 175.9 | 2.3 | |||||
The accumulated benefit obligation for defined benefit pension plans was $606.3 and $633.1 at September 30, 2017 and 2016, respectively. The following table shows pension plans with an accumulated benefit obligation in excess of plan assets:
As of September 30, | |||||||
2017 | 2016 | ||||||
Projected benefit obligation | $ | 468.6 | $ | 628.1 | |||
Accumulated benefit obligation | 468.5 | 612.5 | |||||
Estimated fair value of plan assets | 367.6 | 485.0 | |||||
Pension plan assets in the U.S. plan represent approximately 69% of assets in all of the Company's defined benefit pension plans. Investment policy for the U.S. plan includes a mandate to diversify assets and invest in a variety of asset classes to achieve that goal. The U.S. plan's assets are currently invested in several funds representing most standard equity and debt security classes. The broad target allocations are: (a) equities, including U.S. and foreign: approximately 50% and (b) debt securities, including U.S. bonds: approximately 50%. Actual allocations at September 30, 2017 approximated these targets. The U.S. plan held no shares of Company common stock at September 30, 2017. Investment objectives are similar for non-U.S. pension arrangements, subject to local regulations.
78
The following table presents pension and postretirement expense:
Fiscal Year | |||||||||||||||||||||||
Pension | Postretirement | ||||||||||||||||||||||
2017 | 2016 | 2015 | 2017 | 2016 | 2015 | ||||||||||||||||||
Service cost | $ | 7.3 | $ | 5.1 | $ | 8.1 | $ | 0.2 | $ | 0.2 | $ | 0.5 | |||||||||||
Interest cost | 14.7 | 21.9 | 41.5 | 0.3 | 0.4 | 0.5 | |||||||||||||||||
Expected return on plan assets | (31.9 | ) | (31.0 | ) | (59.9 | ) | — | — | — | ||||||||||||||
Amortization of unrecognized prior service cost | — | — | 0.2 | — | (0.1 | ) | (0.1 | ) | |||||||||||||||
Recognized net actuarial loss (gain) | 6.6 | 5.3 | 8.1 | (0.4 | ) | (1.0 | ) | (0.8 | ) | ||||||||||||||
Settlement loss recognized | 0.3 | — | — | — | — | — | |||||||||||||||||
Net periodic benefit cost (credit) | (3.0 | ) | 1.3 | (2.0 | ) | 0.1 | (0.5 | ) | 0.1 | ||||||||||||||
Net periodic benefit (credit) cost associated with New Energizer | — | — | (5.9 | ) | — | — | — | ||||||||||||||||
Net periodic benefit cost (credit) included in continuing operations | $ | (3.0 | ) | $ | 1.3 | $ | 3.9 | $ | 0.1 | $ | (0.5 | ) | $ | 0.1 | |||||||||
In fiscal 2017, the Company changed the methodology used to estimate the service and interest components of net periodic benefit (credit) cost for its pension and postretirement benefits, which resulted in a decrease in expense of approximately $4 during fiscal 2017. The Company believes the spot discount rate approach, which applies the specific spot rates along the yield curve used in the determination of the benefit obligations to the relevant cash flows, is a more precise application of the yield curve spot rates used in the traditional single discount rate approach. The change was accounted for prospectively as a change in accounting estimate.
Amounts expected to be amortized from accumulated other comprehensive loss into net periodic benefit cost (credit) during fiscal 2018, are as follows:
Pension | Post- retirement | ||||||
Net actuarial (loss) gain | $ | (4.7 | ) | $ | 0.1 | ||
Prior service (cost) credit | $ | — | $ | — | |||
The following table presents assumptions, which reflect weighted-averages for the component plans, used in determining the above information:
Fiscal Year | |||||||||||||||||
Pension | Postretirement | ||||||||||||||||
2017 | 2016 | 2015 | 2017 | 2016 | 2015 | ||||||||||||
Plan obligations: | |||||||||||||||||
Discount rate | 3.3 | % | 3.0 | % | 3.8 | % | 3.7 | % | 2.8 | % | 3.5 | % | |||||
Compensation increase rate | 2.5 | % | 2.5 | % | 2.5 | % | N/A | N/A | N/A | ||||||||
Net periodic benefit cost: | |||||||||||||||||
Discount rate | 3.0 | % | 3.8 | % | 3.8 | % | 2.8 | % | 3.5 | % | 3.7 | % | |||||
Expected long-term rate of return on plan assets | 6.5 | % | 7.4 | % | 7.6 | % | N/A | N/A | N/A | ||||||||
Compensation increase rate | 2.5 | % | 2.5 | % | 2.6 | % | N/A | N/A | N/A | ||||||||
The expected return on plan assets was determined based on historical and expected future returns of the various asset classes, using the target allocations described above.
79
The following table sets forth the estimated fair value of the Company's pension assets segregated by level within the estimated fair value hierarchy. Refer to Note 16 of Notes to Consolidated Financial Statements for further discussion on the estimated fair value hierarchy and estimated fair value principles.
As of September 30, 2017 | |||||||||||
Pension assets at estimated fair value | Level 1 | Level 2 | Total | ||||||||
Equity | |||||||||||
U.S. equity | $ | 91.0 | $ | — | $ | 91.0 | |||||
International equity | 63.6 | — | 63.6 | ||||||||
Debt | |||||||||||
U.S. government | — | 172.8 | 172.8 | ||||||||
Other government | — | 6.0 | 6.0 | ||||||||
Corporate | — | 67.3 | 67.3 | ||||||||
Cash and cash equivalents | 1.8 | 1.3 | 3.1 | ||||||||
Other | — | 21.1 | 21.1 | ||||||||
Total, excluding investments valued at net asset value ("NAV") | $ | 156.4 | $ | 268.5 | $ | 424.9 | |||||
Investments valued at NAV | 98.2 | ||||||||||
Total | $ | 156.4 | $ | 268.5 | $ | 523.1 | |||||
As of September 30, 2016 | |||||||||||
Pension assets at estimated fair value | Level 1 | Level 2 | Total | ||||||||
Equity | |||||||||||
U.S. equity | $ | 111.5 | $ | — | $ | 111.5 | |||||
International equity | 54.0 | — | 54.0 | ||||||||
Debt | |||||||||||
U.S. government | — | 201.6 | 201.6 | ||||||||
Other government | — | 7.0 | 7.0 | ||||||||
Corporate | — | 1.3 | 1.3 | ||||||||
Cash and cash equivalents | 5.1 | 1.7 | 6.8 | ||||||||
Other | — | 18.5 | 18.5 | ||||||||
Total, excluding investments valued at NAV | $ | 170.6 | $ | 230.1 | $ | 400.7 | |||||
Investments valued at NAV | 107.3 | ||||||||||
Total | $ | 170.6 | $ | 230.1 | $ | 508.0 | |||||
The following table sets forth the estimated fair value of the Company's pension assets valued at NAV:
As of September 30, | |||||||
2017 | 2016 | ||||||
Pension assets valued at NAV estimated at fair value | |||||||
Equity | |||||||
U.S. equity | $ | 11.8 | $ | 16.8 | |||
International equity | 86.4 | 90.5 | |||||
Total investments valued at NAV | $ | 98.2 | $ | 107.3 | |||
There were no Level 3 pension assets as of September 30, 2017 and 2016.
The Company had no postretirement plan assets as of September 30, 2017 and 2016.
80
The Company's investment objective for defined benefit retirement plan assets is to satisfy the current and future pension benefit obligations. The investment philosophy is to achieve this objective through diversification of the retirement plan assets. The goal is to earn a suitable return with an appropriate level of risk while maintaining adequate liquidity to distribute benefit payments. The diversified asset allocation includes equity positions as well as fixed income investments. The increased volatility associated with equities is offset with higher expected returns, while the long duration fixed income investments help dampen the volatility of the overall portfolio. Risk exposure is controlled by re-balancing the retirement plan assets back to target allocations, as needed. Investment firms managing retirement plan assets carry out investment policy within their stated guidelines. Investment performance is monitored against benchmark indices, which reflect the policy and target allocation of the retirement plan assets.
Defined Contribution Plan
The Company sponsors a defined contribution plan, which extends participation eligibility to the vast majority of U.S. employees. Effective January 1, 2014, the Company matches 100% of participant's before-tax or Roth contributions up to 6% of eligible compensation. Amounts charged to expense during fiscal 2017, 2016, and 2015 were $11.2, $10.1, and $14.5, respectively, and are reflected in SG&A and Cost of products sold.
Note 13 - Share-Based Payments
As of September 30, 2017, the Company had two share-based compensation plans - the Second Amended and Restated 2009 Incentive Stock Plan (the "2009 Plan") and the Incentive Stock Plan. The Incentive Stock Plan was superseded by the 2009 Plan, and new awards granted after January 2009 are issued under the 2009 Plan. The 2009 Plan provides for the award of restricted stock, RSE awards or share options to purchase the Company's common stock to directors, officers and employees of the Company. The maximum number of shares authorized for issuance under the 2009 Plan is 12.0, of which 5.8 were available for future awards as of September 30, 2017.
Share options are granted at the market price on the grant date and generally vest ratably over three years. These awards typically have a maximum term of ten years. Restricted stock and RSE awards may also be granted. Option shares and prices, and restricted stock and RSE awards, are adjusted in conjunction with stock splits and other recapitalizations, including the Separation, so that the holder is in the same economic position before and after these equity transactions.
The Company uses the straight-line method of recognizing compensation cost. Total compensation costs charged against income from continuing operations for the Company's share-based compensation arrangements were $22.2, $25.6 and $33.1 for fiscal 2017, 2016 and 2015, respectively, and were recorded in SG&A. The total income tax benefit recognized for share-based compensation arrangements was $8.3, $9.6 and $12.3, for fiscal 2017, 2016 and 2015, respectively. Restricted stock issuance and shares issued for share option exercises under the Company's share-based compensation program are generally issued from treasury shares.
Share Options
The following table summarizes share option activity during fiscal 2017:
Shares | Weighted-Average Exercise Price | Weighted-Average Remaining Contractual Term (in years) | Aggregate Intrinsic Value | |||||||||
Outstanding on October 1, 2016 | 0.4 | $ | 100.68 | |||||||||
Granted | 0.2 | 74.70 | ||||||||||
Canceled | (0.1 | ) | 88.72 | |||||||||
Exercised | — | — | ||||||||||
Outstanding on September 30, 2017 | 0.5 | $ | 94.12 | 8.1 | $ | — | ||||||
Vested and unvested expected to vest as of September 30, 2017 | 0.5 | $ | 94.12 | 8.1 | $ | — | ||||||
Exercisable on September 30, 2017 | 0.3 | 100.68 | ||||||||||
81
No share options were exercised in fiscal 2017 or 2016. The total intrinsic value of share option awards at the time of exercise for 2015 was $4.5.
The Company estimates the grant-date fair value of share option awards using the Black-Scholes option pricing model. During fiscal 2017 and 2015, the Company granted 0.2 and 0.4 non-qualified share option awards to certain executives and employees with a grant-date fair value of $3.2 and $12.2, respectively. No share option awards were granted during fiscal 2016. The following table presents the Company's weighted average fair value per option and the assumptions utilized in the Black-Scholes option pricing model.
2017 | 2015 | ||||||
Weighted-average fair value per share option | $ | 19.96 | $ | 28.77 | |||
Expected volatility | 24.00 | % | 25.00 | % | |||
Risk-free interest rate | 1.53 | % | 1.94 | % | |||
Expected share option life (in years) | 6.0 | 6.0 | |||||
Dividend yield | — | % | — | % | |||
As of September 30, 2017, there was an estimated $4.1 of total unrecognized compensation costs related to share option awards, which will be recognized over a weighted-average period of approximately 1.3 years.
Restricted Share Equivalents
The following table summarizes RSE award activity during fiscal 2017:
Shares | Weighted-Average Grant Date Estimated Fair Value | |||||
Non-vested at October 1, 2016 | 0.5 | $ | 99.14 | |||
Granted | 0.3 | 74.71 | ||||
Vested | (0.3 | ) | 88.26 | |||
Canceled | — | 83.00 | ||||
Non-vested at September 30, 2017 | 0.5 | 83.19 | ||||
The Company records estimated expense for performance-based grants based on target achievement of performance metrics for the three-year period for each respective program, unless evidence exists that achievement above or below target for the applicable performance metric is more likely to occur. The estimated fair value of the award is determined using the closing share price of the Company's common stock on the date of grant. As of September 30, 2017, there were 0.1 performance-based RSE awards outstanding, which are included in the table above.
As of September 30, 2017, there was an estimated $23.8 of total unrecognized compensation costs related to RSE awards, which will be recognized over a weighted-average period of approximately 2.1 years. The weighted-average estimated fair value per RSE award granted in fiscal 2017, 2016 and 2015 was $74.71, $84.92, and $112.58, respectively. The estimated fair value of RSE awards vested in fiscal 2017, 2016 and 2015 was $24.9, $44.1, and $57.1, respectively.
Note 14 - Shareholders' Equity
At September 30, 2017, there were 300.0 shares of the Company's common stock authorized, of which 1.1 shares were reserved for outstanding awards under the 2009 and Incentive Stock Plans. The Company's Articles of Incorporation authorize it to issue up to 10.0 shares of $0.01 par value of preferred stock. As of September 30, 2017, there were no shares of preferred stock issued or outstanding.
In May 2015, the Board approved an authorization to repurchase up to 10.0 shares of the Company's common stock. This authorization replaced a prior share repurchase authorization. During fiscal 2017, the Company repurchased 2.2 shares of its common stock for $165.4, all of which were purchased under this authorization. The Company has 3.3 shares remaining under the Board authorization to repurchase its common shares in the future. Future share repurchases, if any, would be made in the
82
open market, privately negotiated transactions or otherwise, in such amounts and at such times as the Company deems appropriate based upon prevailing market conditions, business needs and other factors.
During fiscal 2017, 0.2 shares were purchased related to the surrender of shares of common stock to satisfy tax withholding obligations in connection with the vesting of RSE awards.
During fiscal 2017 and 2016, the Company paid $1.6 and $0.6, respectively, of cash dividends related to the vesting of RSE awards, which had been declared and accrued during prior fiscal years. In fiscal 2015, the Company declared cash dividends of $94.2, or $1.50 per share. The Company has not declared any dividends since the third quarter of fiscal 2015, and does not currently intend to declare dividends in the foreseeable future. Any future dividends are dependent on future earnings, capital requirements and the Company's financial condition and will be declared at the sole discretion of the Board.
Note 15 - Accumulated Other Comprehensive Loss
The following table presents the changes in accumulated other comprehensive loss ("AOCI"), net of tax, by component:
Foreign Currency Translation Adjustments | Pension and Post-retirement Activity | Hedging Activity | Total | ||||||||||||
Balance at October 1, 2015 | $ | (69.1 | ) | $ | (105.7 | ) | $ | 3.3 | $ | (171.5 | ) | ||||
OCI before reclassifications (1) | 1.0 | (25.6 | ) | (7.2 | ) | (31.8 | ) | ||||||||
Amounts distributed to New Energizer | — | 2.3 | — | 2.3 | |||||||||||
Reclassifications to earnings | — | 2.7 | 1.1 | 3.8 | |||||||||||
Balance at September 30, 2016 | (68.1 | ) | (126.3 | ) | (2.8 | ) | (197.2 | ) | |||||||
OCI before reclassifications (1) | 39.1 | 20.8 | (0.1 | ) | 59.8 | ||||||||||
Reclassifications to earnings | — | 4.2 | 1.8 | 6.0 | |||||||||||
Balance at September 30, 2017 | $ | (29.0 | ) | $ | (101.3 | ) | $ | (1.1 | ) | $ | (131.4 | ) | |||
(1) | OCI is defined as other comprehensive income (loss). |
The following table presents the reclassifications out of AOCI:
Fiscal Year | ||||||||||
Details of AOCI Components | 2017 | 2016 | Affected Line Item in the Consolidated Statements of Earnings | |||||||
Gains and losses on cash flow hedges | ||||||||||
Foreign exchange contracts | $ | 2.6 | $ | 1.2 | Other expense (income), net | |||||
2.6 | 1.2 | Total before tax | ||||||||
(0.8 | ) | (0.1 | ) | Tax expense | ||||||
$ | 1.8 | $ | 1.1 | Net of tax | ||||||
Amortization of defined benefit pension and postretirement items | ||||||||||
Prior service costs | $ | — | $ | (0.1 | ) | (1) | ||||
Actuarial losses | 6.2 | 4.3 | (1) | |||||||
Settlements | 0.3 | — | (1) | |||||||
6.5 | 4.2 | Total before tax | ||||||||
(2.3 | ) | (1.5 | ) | Tax expense | ||||||
$ | 4.2 | $ | 2.7 | Net of tax | ||||||
Total reclassifications for the period | $ | 6.0 | $ | 3.8 | Net of tax | |||||
(1) | These AOCI components are included in the computation of net periodic benefit cost. See Note 12 of Notes to Consolidated Financial Statements. |
83
Note 16 - Financial Instruments and Risk Management
At times, the Company enters into contractual arrangements (derivatives) to reduce its exposure to foreign currency and interest rate risks. The section below outlines the types of derivatives that existed at September 30, 2017 and 2016, as well as the Company's objectives and strategies for holding derivative instruments.
Foreign Currency Risk
A significant share of the Company's sales are tied to currencies other than the U.S. dollar, the Company's reporting currency. As such, a weakening of currencies relative to the U.S. dollar can have a negative impact to reported earnings. Conversely, strengthening of currencies relative to the U.S. dollar can improve reported results. The primary currencies to which the Company is exposed include the Euro, the Japanese Yen, the British Pound, the Canadian Dollar and the Australian Dollar.
Additionally, the Company's foreign subsidiaries enter into internal and external transactions that create non-functional currency balance sheet positions at the foreign subsidiary level. These exposures are generally the result of intercompany purchases, intercompany loans and, to a lesser extent, external purchases, and are revalued in the foreign subsidiary's local currency at the end of each period. Changes in the value of the non-functional currency balance sheet positions in relation to the foreign subsidiary's local currency results in an exchange gain or loss recorded in Other expense (income), net. The primary currency to which the Company's foreign subsidiaries are exposed is the U.S. dollar.
Interest Rate Risk
The Company has interest rate risk with respect to interest expense on variable rate debt. At September 30, 2017, the Company had $429.7 of variable rate debt outstanding, which consisted primarily of outstanding borrowings under the Company's revolving credit facilities in the U.S. and term loan.
Other Risks
Customer Concentration. Financial instruments that potentially subject the Company to concentrations of credit risk primarily consist of accounts receivable. The Company generally does not require collateral from customers. The Company's largest customer, Wal-Mart Stores, Inc. and its affiliates (collectively, "Wal-Mart"), accounted for approximately 23% of net sales in fiscal 2017. No other customer accounted for more than 10.0% of the Company's consolidated net sales. Purchases by Wal-Mart included products from all of the Company's segments. Additionally, in fiscal 2017, Target Corporation represented approximately 10% and 14% of net sales for the Company's Sun and Skin Care and All Other segments, respectively.
Product Concentration. Within the Wet Shave segment, the Company's razor and blades represented 53%, 53% and 53% of net sales and within the Sun and Skin Care segment, sun care products represented 15%, 14% and 13% of net sales during fiscal 2017, 2016 and 2015, respectively.
Cash Flow Hedges
At September 30, 2017, the Company maintained a cash flow hedging program related to foreign currency risk. These derivative instruments have a high correlation to the underlying exposure being hedged and have been deemed highly effective for accounting purposes in offsetting the associated risk.
The Company entered into a series of forward currency contracts to hedge cash flow uncertainty associated with currency fluctuations. These transactions are accounted for as cash flow hedges. The Company had unrealized pre-tax losses of $1.6 and $4.3 at September 30, 2017 and 2016, respectively, on these forward currency contracts accounted for as cash flow hedges included in AOCI. Assuming foreign exchange rates versus the U.S. dollar remain at September 30, 2017 levels over the next twelve months, approximately $1.6 of the pre-tax loss included in AOCI at September 30, 2017 is expected to be included in Other expense (income), net. Contract maturities for these hedges extend into fiscal year 2019. There were 63 open foreign currency contracts at September 30, 2017 with a total notional value of $130.9.
84
Derivatives not Designated as Hedges
The Company entered into foreign currency derivative contracts which are not designated as cash flow hedges for accounting purposes to hedge balance sheet exposures. Any gains or losses on these contracts are expected to be offset by exchange gains or losses on the underlying exposures, thus they are not subject to significant market risk. The change in estimated fair value of the foreign currency contracts for fiscal 2017 resulted in a gain of $2.4 and for fiscal 2016 resulted in a loss of $10.1, which were recorded in Other expense (income), net. There were six open foreign currency derivative contracts which were not designated as cash flow hedges at September 30, 2017, with a total notional value of $100.3.
The following table provides estimated fair values of derivative instruments:
Fair Value of Asset (Liability) (1) | |||||||
September 30, 2017 | September 30, 2016 | ||||||
Derivatives designated as cash flow hedging relationships: | |||||||
Foreign currency contracts | $ | (1.6 | ) | $ | (4.3 | ) | |
Derivatives not designated as cash flow hedging relationships: | |||||||
Foreign currency contracts | $ | 0.4 | $ | (1.3 | ) | ||
(1) | All derivative assets are presented in Other current assets or Other assets. All derivative liabilities are presented in Other current liabilities or Other liabilities. |
The following table provides the amounts of gains and losses on derivative instruments:
Fiscal Year | |||||||||||
2017 | 2016 | 2015 | |||||||||
Derivatives designated as cash flow hedging relationships: | |||||||||||
Foreign currency contracts | |||||||||||
Gain (loss) recognized in OCI (1) | $ | 5.4 | $ | (7.7 | ) | $ | 20.0 | ||||
Gain reclassified from AOCI into income (effective portion) (1) (2) | 2.7 | 1.2 | 29.9 | ||||||||
Derivatives not designated as cash flow hedging relationships: | |||||||||||
Foreign currency contracts | |||||||||||
Gain (loss) recognized in income (2) | $ | 2.4 | $ | (10.1 | ) | $ | 13.1 | ||||
Share option | |||||||||||
Gain recognized in income (3) | $ | — | $ | — | $ | 0.5 | |||||
(1) | Each of these derivative instruments had a high correlation to the underlying exposure being hedged for the periods indicated and had been deemed highly effective in offsetting associated risk. |
(2) | Gain (loss) was recorded in Other (income) expense, net. |
(3) | The Company held a share option with a major financial institution, which matured in November 2014 and was subsequently not renewed. Gain (loss) was recorded in Selling, general and administrative expense for the share option. |
The following table provides financial assets and liabilities for balance sheet offsetting:
As of September 30, 2017 | As of September 30, 2016 | ||||||||||||||
Assets (1) | Liabilities (2) | Assets (1) | Liabilities (2) | ||||||||||||
Foreign currency contracts | |||||||||||||||
Gross amounts of recognized assets (liabilities) | $ | 2.5 | $ | (3.7 | ) | $ | 1.7 | $ | (6.2 | ) | |||||
Gross amounts offset in the balance sheet | (0.1 | ) | 0.1 | — | 0.2 | ||||||||||
Net amounts of assets (liabilities) presented in the balance sheet | $ | 2.4 | $ | (3.6 | ) | $ | 1.7 | $ | (6.0 | ) | |||||
(1) | All derivative assets are presented in Other current assets or Other assets. |
(2) | All derivative liabilities are presented in Other current liabilities or Other liabilities. |
85
Fair Value Hierarchy
Accounting guidance on fair value measurements for certain financial assets and liabilities requires that assets and liabilities carried at fair value be classified in one of the following three categories:
Level 1: Quoted market prices in active markets for identical assets or liabilities.
Level 2: Observable market based inputs or unobservable inputs that are corroborated by market data.
Level 3: Unobservable inputs reflecting the reporting entity's own assumptions or external inputs from inactive markets.
Under the fair value accounting guidance hierarchy, an entity is required to maximize the use of quoted market prices and minimize the use of unobservable inputs. The following table sets forth the Company's financial assets and liabilities, which are carried at fair value, that are measured on a recurring basis during the period, all of which are classified as Level 2 within the fair value hierarchy:
As of September 30, | |||||||
2017 | 2016 | ||||||
Assets (Liabilities) at estimated fair value: | |||||||
Deferred compensation | $ | (60.9 | ) | $ | (84.5 | ) | |
Derivatives - foreign currency contracts | (1.2 | ) | (5.6 | ) | |||
Net liabilities at estimated fair value | $ | (62.1 | ) | $ | (90.1 | ) | |
At September 30, 2017 and 2016, the Company had no Level 1 or Level 3 financial assets or liabilities, other than pension plan assets.
At September 30, 2017 and 2016, the fair market value of fixed rate long-term debt was $1,143.8 and $1,106.2, respectively, compared to its carrying value of $1,095.7 and $1,094.7, respectively. The estimated fair value of the fixed-rate long-term debt is estimated using yields obtained from independent pricing sources for similar types of borrowing arrangements. The estimated fair value of variable-rate debt, excluding revolving credit facilities, which consists of bank debt, was $185.0 compared to its carrying value of $184.7 and $184.5 at September 30, 2017 and 2016. The estimated fair value is equal to the face value of the debt. The estimated fair values of long-term debt, excluding revolving credit facilities, have been determined based on level 2 inputs.
Due to the nature of cash and cash equivalents and short-term borrowings, including notes payable, carrying amounts on the balance sheets approximate fair value. Additionally, the carrying amounts of the Company's revolving credit facilities, which are classified as long-term debt on the balance sheet, approximate fair value due to the revolving nature of the balances. The estimated fair value of cash and cash equivalents, short-term borrowings and the revolving credit agreements have been determined based on level 2 inputs.
At September 30, 2017, the estimated fair value of foreign currency contracts is the amount that the Company would receive or pay to terminate the contracts, considering first the quoted market prices of comparable agreements or, in the absence of quoted market prices, factors such as interest rates, currency exchange rates and remaining maturities. The estimated fair value of the deferred compensation liability is determined based upon the quoted market prices of the investment options that are offered under the plan.
Note 17 - Commitments and Contingencies
Operating Leases
Total rental expense less sublease rental income for all operating leases was $15.9, $13.1 and $12.9 in fiscal 2017, 2016 and 2015, respectively. Future minimum rental commitments under non-cancellable operating leases in effect as of September 30, 2017, were $12.8 in fiscal 2018, $9.1 in fiscal 2019, $6.9 in fiscal 2020, $3.2 in fiscal 2021, $2.5 in fiscal 2022 and $1.7 thereafter. These leases are primarily for office facilities.
86
Government Regulation and Environmental Matters
The operations of the Company are subject to various federal, state, foreign and local laws and regulations intended to protect the public health and environment.
Contamination has been identified at certain of the Company's current and former facilities, as well as third-party waste disposal sites, and the Company is conducting investigation and remediation activities in relation to such properties. In connection with certain sites, the Company has received notices from the U.S. Environmental Protection Agency, state agencies and private parties seeking contribution, that it has been identified as a potentially responsible party ("PRP") under the Comprehensive Environmental Response, Compensation and Liability Act, and may be required to share in the cost of cleanup with respect to a number of federal "Superfund" sites. The Company may also be required to share in the cost of cleanup with respect to state-designated sites, and certain international locations, as well as any of its own properties.
The amount of the Company's ultimate liability in connection with those sites may depend on many factors, including the volume and toxicity of material contributed to the site, the number of other PRPs and their financial viability, and the remediation methods and technology to be used. Total environmental capital expenditures and operating expenses are not expected to have a material effect on the Company's total capital and operating expenditures, cash flows, earnings or competitive position. Current environmental spending estimates could be modified as a result of changes in the Company's plans or its understanding of the underlying facts, changes in legal requirements, including any requirements related to global climate change, or other factors.
Many European countries, as well as the European Union, have been very active in adopting and enforcing environmental regulations. As such, it is possible that new regulations may increase the risk and expense of doing business in such countries.
Certain of the Company's products are subject to regulation under the U.S. Federal Food, Drug and Cosmetic Act and are regulated by the U.S. Food and Drug Administration.
Legal Proceedings
The Company and its affiliates are subject to a number of legal proceedings in various jurisdictions arising out of its operations during the ordinary course of business. Many of these legal matters are in preliminary stages and involve complex issues of law and fact, and may proceed for protracted periods of time. The amount of liability, if any, from these proceedings cannot be determined with certainty. The Company reviews its legal proceedings and claims, regulatory reviews and inspections and other legal proceedings on an ongoing basis and follows appropriate accounting guidance when making accrual and disclosure decisions. The Company establishes accruals for those contingencies when the incurrence of a loss is probable and can be reasonably estimated, and discloses the amount accrued and the amount of a reasonably possible loss in excess of the amount accrued, if such disclosure is necessary for its financial statements to not be misleading. The Company does not record liabilities when the likelihood that the liability has been incurred is probable, but the amount cannot be reasonably estimated. Based upon present information, the Company believes that its liability, if any, arising from such pending legal proceedings, asserted legal claims and known potential legal claims, which are likely to be asserted, is not reasonably likely to be material to its financial position, results of operations or cash flows, taking into account established accruals for estimated liabilities.
Note 18 - Segment and Geographical Data
The Company conducts its business in the following four segments:
• | Wet Shave consists of products sold under the Schick, Wilkinson Sword, Edge, Skintimate, Shave Guard and Personna brands, as well as non-branded products. The Company's wet shave products include razor handles and refillable blades, disposable shave products and shaving gels and creams. |
• | Sun and Skin Care consists of Banana Boat and Hawaiian Tropic sun care products and Bulldog men's skin care products, as well as Wet Ones wipes and Playtex household gloves until the sale of the gloves business in October 2017. |
• | Feminine Care includes tampons, pads and liners sold under the Playtex Gentle Glide and Sport, Stayfree, Carefree and o.b. brands, as well as personal cleansing wipes under the Playtex brand. |
• | All Other includes infant care products, such as bottles, cups and pacifiers, under the Playtex, OrthoPro and Binky brand names, as well as the Diaper Genie and Litter Genie disposal systems. |
87
Segment performance is evaluated based on segment profit, exclusive of general corporate expenses, share-based compensation costs, costs associated with restructuring initiatives, the Venezuela deconsolidation charge, the sale of the industrial blade business, Cost of early debt retirements, and the amortization and impairment of intangible assets. Financial items, such as interest income and expense, are managed on a global basis at the corporate level. The exclusion of such charges from segment results reflects management's view on how it evaluates segment performance.
The Company's operating model includes some shared business functions across the segments, including product warehousing and distribution, transaction processing functions, and in most cases a combined sales force and management teams. The Company applies a fully allocated cost basis, in which shared business functions are allocated among the segments. Such allocations are estimates, and do not represent the costs of such services if performed on a stand-alone basis.
Prior periods have been recast to reflect the Company's current segment reporting.
Segment net sales and profitability are presented below:
Fiscal Year | |||||||||||
2017 | 2016 | 2015 | |||||||||
Net Sales | |||||||||||
Wet Shave | $ | 1,375.3 | $ | 1,425.8 | $ | 1,441.3 | |||||
Sun and Skin Care | 440.4 | 414.9 | 403.6 | ||||||||
Feminine Care | 351.6 | 388.9 | 398.2 | ||||||||
All Other | 131.1 | 132.4 | 178.1 | ||||||||
Total net sales | $ | 2,298.4 | $ | 2,362.0 | $ | 2,421.2 | |||||
Segment Profit | |||||||||||
Wet Shave | $ | 294.9 | $ | 290.2 | $ | 308.7 | |||||
Sun and Skin Care | 98.8 | 89.5 | 71.5 | ||||||||
Feminine Care | 28.9 | 39.1 | 48.7 | ||||||||
All Other | 26.6 | 28.4 | 24.6 | ||||||||
Total segment profit | 449.2 | 447.2 | 453.5 | ||||||||
General corporate and other expenses | (76.0 | ) | (80.4 | ) | (122.0 | ) | |||||
Impairment charges | (319.0 | ) | (6.5 | ) | (318.2 | ) | |||||
Venezuela deconsolidation charge | — | — | (79.3 | ) | |||||||
Spin costs (1) | — | (12.0 | ) | (142.0 | ) | ||||||
Spin restructuring charges | — | — | (28.3 | ) | |||||||
Restructuring and related costs (2) | (30.3 | ) | (38.8 | ) | (27.0 | ) | |||||
Industrial sale charges | — | (0.2 | ) | (32.7 | ) | ||||||
Amortization of intangibles | (17.8 | ) | (14.4 | ) | (15.1 | ) | |||||
Cost of early debt retirements | — | — | (59.6 | ) | |||||||
Interest and other expense, net | (59.0 | ) | (75.0 | ) | (88.0 | ) | |||||
Total (loss) earnings from continuing operations before income taxes | $ | (52.9 | ) | $ | 219.9 | $ | (458.7 | ) | |||
Depreciation and amortization | |||||||||||
Wet Shave | $ | 46.6 | $ | 45.8 | $ | 44.0 | |||||
Sun and Skin Care | 12.9 | 11.3 | 10.5 | ||||||||
Feminine Care | 14.0 | 19.3 | 15.0 | ||||||||
All Other | 5.0 | 5.1 | 4.9 | ||||||||
Total segment depreciation and amortization | 78.5 | 81.5 | 74.4 | ||||||||
Corporate | 17.7 | 15.0 | 16.9 | ||||||||
Total depreciation and amortization | $ | 96.2 | $ | 96.5 | $ | 91.3 | |||||
88
Fiscal Year | |||||||||||
2017 | 2016 | 2015 | |||||||||
Total Assets | |||||||||||
Wet Shave | $ | 755.5 | $ | 757.4 | |||||||
Sun and Skin Care | 159.1 | 164.9 | |||||||||
Feminine Care | 206.9 | 253.3 | |||||||||
All Other | 36.0 | 34.5 | |||||||||
Total segment assets | 1,157.5 | 1,210.1 | |||||||||
Corporate (3) | 513.7 | 756.0 | |||||||||
Goodwill and other intangible assets, net | 2,517.6 | 2,805.4 | |||||||||
Total assets | $ | 4,188.8 | $ | 4,771.5 | |||||||
Capital Expenditures | |||||||||||
Wet Shave | $ | 40.7 | $ | 39.9 | $ | 43.0 | |||||
Sun and Skin Care | 12.8 | 12.4 | 13.2 | ||||||||
Feminine Care | 11.2 | 12.6 | 14.0 | ||||||||
All Other | 4.3 | 4.2 | 6.9 | ||||||||
Total segment capital expenditures | 69.0 | 69.1 | 77.1 | ||||||||
Corporate | — | 0.4 | — | ||||||||
Total capital expenditures | $ | 69.0 | $ | 69.5 | $ | 77.1 | |||||
(1) | Includes SG&A of $11.8 and $137.8 for fiscal 2016 and 2015, respectively, and Cost of products sold of $0.2 and $4.2 for fiscal 2016 and 2015, respectively. |
(2) | Includes SG&A of $0.3 for fiscal 2015. Also includes Cost of products sold of $0.7 and $1.8 for fiscal 2017 and 2016, respectively. |
(3) | Corporate assets include all cash and cash equivalents, financial instruments and deferred tax assets that are managed outside of operating segments. |
The following table presents the Company's net sales and long-lived assets by geographic area:
Fiscal Year | |||||||||||
2017 | 2016 | 2015 | |||||||||
Net Sales to Customers | |||||||||||
United States | $ | 1,330.5 | $ | 1,392.0 | $ | 1,403.6 | |||||
International | 967.9 | 970.0 | 1,017.6 | ||||||||
Total net sales | $ | 2,298.4 | $ | 2,362.0 | $ | 2,421.2 | |||||
Long-lived Assets | |||||||||||
United States | $ | 335.7 | $ | 343.7 | |||||||
Germany | 38.7 | 39.1 | |||||||||
Canada | 1.3 | 34.3 | |||||||||
Other International | 77.7 | 69.0 | |||||||||
Total long-lived assets excluding goodwill and other intangibles, net | $ | 453.4 | $ | 486.1 | |||||||
The Company's international net sales are derived from customers in numerous countries, with no sales to any individual foreign country exceeding 10% of the Company's total net sales. For information on customer concentration and product concentration risk, see Note 16 of Notes to Consolidated Financial Statements.
89
Supplemental product information is presented below for net sales:
Fiscal Year | |||||||||||
2017 | 2016 | 2015 | |||||||||
Razors and blades | $ | 1,222.0 | $ | 1,259.5 | $ | 1,278.2 | |||||
Sun care products | 353.1 | 337.7 | 320.1 | ||||||||
Tampons, pads and liners | 351.6 | 388.9 | 398.2 | ||||||||
Shaving gels and creams | 153.3 | 166.3 | 163.1 | ||||||||
Infant care and other | 131.1 | 132.4 | 178.1 | ||||||||
Skin care products | 87.3 | 77.2 | 83.5 | ||||||||
Total net sales | $ | 2,298.4 | $ | 2,362.0 | $ | 2,421.2 | |||||
Note 19 - Guarantor and Non-Guarantor Financial Information
The Company's senior notes issued in May 2011 and May 2012 (collectively, the "Notes") are fully and unconditionally guaranteed on a joint and several basis by the Company's existing and future direct and indirect domestic subsidiaries that are guarantors of any of the Company's credit agreements or other indebtedness for borrowed money (the "Guarantors"). The Guarantors are 100% owned either directly or indirectly by the Company and jointly and severally guarantee the Company's obligations under the Notes and substantially all of the Company's other outstanding indebtedness. The Company's subsidiaries organized outside of the U.S. and certain domestic subsidiaries which are not guarantors of any of the Company's other indebtedness (collectively, the "Non-Guarantors"), do not guarantee the Notes. The subsidiary guarantee with respect to the Notes is subject to release upon sale of all of the capital stock of the subsidiary guarantor; if the guarantee under the Company's credit agreements and other indebtedness for borrowed money is released or discharged (other than due to payment under such guarantee); or when the requirements for legal defeasance are satisfied or the obligations are discharged in accordance with the indenture.
Set forth below are the condensed consolidating financial statements presenting the results of operations, financial position and cash flows of the Parent Company, Edgewell Personal Care Company, the Guarantors on a combined basis, the Non-Guarantors on a combined basis and eliminations necessary to arrive at the information for the Company as reported, on a consolidated basis. Eliminations represent adjustments to eliminate investments in subsidiaries and intercompany balances and transactions between or among the Parent Company, the Guarantors and the Non-Guarantors.
As described in Note 1, the Company completed the Separation of its Household Products business into a separate publicly-traded company on July 1, 2015. Certain legal entities that are now part of New Energizer were subsidiary guarantors under the terms of the Company's credit agreements. As a result of the Separation, those entities have been released as Guarantors. The financial statements below reflect those entities as Guarantors through the date of the Separation. On the Consolidating Statements of Earnings, results related to the entities that are now a part of New Energizer are reflected in Earnings from discontinued operations, net of tax.
90
EDGEWELL PERSONAL CARE COMPANY
CONDENSED CONSOLIDATING STATEMENTS OF EARNINGS AND COMPREHENSIVE INCOME
Fiscal Year Ended September 30, 2017
Parent Company | Guarantors | Non-Guarantors | Eliminations | Total | |||||||||||||||
Net sales | $ | — | $ | 1,578.2 | $ | 1,080.4 | $ | (360.2 | ) | $ | 2,298.4 | ||||||||
Cost of products sold | — | 908.4 | 619.6 | (360.2 | ) | 1,167.8 | |||||||||||||
Gross profit | — | 669.8 | 460.8 | — | 1,130.6 | ||||||||||||||
Selling, general and administrative expense | — | 248.1 | 141.9 | — | 390.0 | ||||||||||||||
Advertising and sales promotion expense | — | 207.4 | 110.9 | — | 318.3 | ||||||||||||||
Research and development expense | — | 67.0 | 0.6 | — | 67.6 | ||||||||||||||
Impairment charge | — | 319.0 | — | — | 319.0 | ||||||||||||||
Restructuring charges | — | 9.7 | 19.9 | — | 29.6 | ||||||||||||||
Interest expense associated with debt | 53.5 | 14.4 | 1.3 | — | 69.2 | ||||||||||||||
Other income, net | — | — | (10.2 | ) | — | (10.2 | ) | ||||||||||||
Intercompany service fees | — | (20.0 | ) | 20.0 | — | — | |||||||||||||
Equity in earnings of subsidiaries | (39.2 | ) | (153.0 | ) | — | 192.2 | — | ||||||||||||
(Loss) earnings before income taxes | (14.3 | ) | (22.8 | ) | 176.4 | (192.2 | ) | (52.9 | ) | ||||||||||
Income tax (benefit) provision | (20.0 | ) | (62.0 | ) | 23.4 | — | (58.6 | ) | |||||||||||
Net earnings | $ | 5.7 | $ | 39.2 | $ | 153.0 | $ | (192.2 | ) | $ | 5.7 | ||||||||
Statement of Comprehensive Income: | |||||||||||||||||||
Net earnings | $ | 5.7 | $ | 39.2 | $ | 153.0 | $ | (192.2 | ) | $ | 5.7 | ||||||||
Other comprehensive income, net of tax | 65.8 | 65.8 | 57.2 | (123.0 | ) | 65.8 | |||||||||||||
Total comprehensive income | $ | 71.5 | $ | 105.0 | $ | 210.2 | $ | (315.2 | ) | $ | 71.5 | ||||||||
91
EDGEWELL PERSONAL CARE COMPANY
CONDENSED CONSOLIDATING STATEMENTS OF EARNINGS AND COMPREHENSIVE INCOME
Fiscal Year Ended September 30, 2016
Parent Company | Guarantors | Non-Guarantors | Eliminations | Total | |||||||||||||||
Net sales | $ | — | $ | 1,627.9 | $ | 1,141.6 | $ | (407.5 | ) | $ | 2,362.0 | ||||||||
Cost of products sold | — | 942.6 | 667.0 | (407.5 | ) | 1,202.1 | |||||||||||||
Gross profit | — | 685.3 | 474.6 | — | 1,159.9 | ||||||||||||||
Selling, general and administrative expense | 5.3 | 264.3 | 143.1 | — | 412.7 | ||||||||||||||
Advertising and sales promotion expense | — | 224.4 | 112.3 | — | 336.7 | ||||||||||||||
Research and development expense | — | 70.4 | 1.5 | — | 71.9 | ||||||||||||||
Impairment charge | — | 6.5 | — | — | 6.5 | ||||||||||||||
Restructuring charges | — | 15.0 | 22.0 | — | 37.0 | ||||||||||||||
Industrial sale charges | — | 0.2 | — | — | 0.2 | ||||||||||||||
Interest expense associated with debt | 54.5 | 10.2 | 7.1 | — | 71.8 | ||||||||||||||
Other (income) expense, net | — | (1.3 | ) | 4.5 | — | 3.2 | |||||||||||||
Intercompany service fees | — | (17.5 | ) | 17.5 | — | — | |||||||||||||
Equity in earnings of subsidiaries | (216.2 | ) | (112.6 | ) | — | 328.8 | — | ||||||||||||
Earnings before income taxes | 156.4 | 225.7 | 166.6 | (328.8 | ) | 219.9 | |||||||||||||
Income tax (benefit) provision | (22.3 | ) | 22.7 | 40.8 | — | 41.2 | |||||||||||||
Net earnings | $ | 178.7 | $ | 203.0 | $ | 125.8 | $ | (328.8 | ) | $ | 178.7 | ||||||||
Statement of Comprehensive Income: | |||||||||||||||||||
Net earnings | $ | 178.7 | $ | 203.0 | $ | 125.8 | $ | (328.8 | ) | $ | 178.7 | ||||||||
Other comprehensive loss, net of tax | (28.0 | ) | (29.4 | ) | (18.4 | ) | 47.8 | (28.0 | ) | ||||||||||
Total comprehensive income | $ | 150.7 | $ | 173.6 | $ | 107.4 | $ | (281.0 | ) | $ | 150.7 | ||||||||
92
EDGEWELL PERSONAL CARE COMPANY
CONDENSED CONSOLIDATING STATEMENTS OF EARNINGS AND COMPREHENSIVE INCOME
Fiscal Year Ended September 30, 2015
Parent Company | Guarantors | Non-Guarantors | Eliminations | Total | |||||||||||||||
Net sales | $ | — | $ | 1,674.0 | $ | 977.2 | $ | (230.0 | ) | $ | 2,421.2 | ||||||||
Cost of products sold | — | 1,025.3 | 445.8 | (233.7 | ) | 1,237.4 | |||||||||||||
Gross profit | — | 648.7 | 531.4 | 3.7 | 1,183.8 | ||||||||||||||
Selling, general and administrative expense | 95.5 | 276.1 | 200.0 | — | 571.6 | ||||||||||||||
Advertising and sales promotion expense | — | 243.8 | 124.1 | (0.8 | ) | 367.1 | |||||||||||||
Research and development expense | — | 68.9 | 2.1 | — | 71.0 | ||||||||||||||
Impairment charge | — | 318.2 | — | — | 318.2 | ||||||||||||||
Venezuela deconsolidation charge | — | 66.7 | 12.6 | — | 79.3 | ||||||||||||||
Spin restructuring charges | — | 3.8 | 24.5 | — | 28.3 | ||||||||||||||
Restructuring charges | — | 11.2 | 15.5 | — | 26.7 | ||||||||||||||
Industrial sale charges | — | 33.0 | (0.3 | ) | — | 32.7 | |||||||||||||
Interest expense associated with debt | 95.0 | (0.3 | ) | 5.1 | — | 99.8 | |||||||||||||
Cost of early debt retirements | 59.6 | — | — | — | 59.6 | ||||||||||||||
Intercompany interest (income) expense | (73.5 | ) | 73.8 | (0.3 | ) | — | — | ||||||||||||
Other expense (income), net | — | 0.1 | (11.9 | ) | — | (11.8 | ) | ||||||||||||
Intercompany service fees | — | 7.9 | (7.9 | ) | — | — | |||||||||||||
Equity in loss (earnings) of subsidiaries | 142.7 | (135.4 | ) | — | (7.3 | ) | — | ||||||||||||
(Loss) earnings from continuing operations before income taxes | (319.3 | ) | (319.1 | ) | 167.9 | 11.8 | (458.7 | ) | |||||||||||
Income tax (benefit) provision | (43.7 | ) | (155.4 | ) | 32.0 | 4.5 | (162.6 | ) | |||||||||||
(Loss) earnings from continuing operations | (275.6 | ) | (163.7 | ) | 135.9 | 7.3 | (296.1 | ) | |||||||||||
Earnings from discontinued operations | 0.3 | 9.6 | 10.9 | — | 20.8 | ||||||||||||||
Net (loss) earnings | $ | (275.3 | ) | $ | (154.1 | ) | $ | 146.8 | $ | 7.3 | $ | (275.3 | ) | ||||||
Statement of Comprehensive (Loss) Income: | |||||||||||||||||||
Net (loss) earnings | $ | (275.3 | ) | $ | (154.1 | ) | $ | 146.8 | $ | 7.3 | $ | (275.3 | ) | ||||||
Other comprehensive loss, net of tax | (122.2 | ) | (77.6 | ) | (117.5 | ) | 195.1 | (122.2 | ) | ||||||||||
Total comprehensive (loss) income | $ | (397.5 | ) | $ | (231.7 | ) | $ | 29.3 | $ | 202.4 | $ | (397.5 | ) | ||||||
93
EDGEWELL PERSONAL CARE COMPANY
CONDENSED CONSOLIDATING BALANCE SHEETS
September 30, 2017
Parent Company | Guarantors | Non-Guarantors | Eliminations | Total | |||||||||||||||
Assets | |||||||||||||||||||
Current assets | |||||||||||||||||||
Cash and cash equivalents | $ | — | $ | 6.4 | $ | 496.5 | $ | — | $ | 502.9 | |||||||||
Trade receivables, net | — | 34.4 | 189.7 | — | 224.1 | ||||||||||||||
Inventories | — | 198.7 | 134.8 | — | 333.5 | ||||||||||||||
Other current assets | — | 46.3 | 79.4 | — | 125.7 | ||||||||||||||
Total current assets | — | 285.8 | 900.4 | — | 1,186.2 | ||||||||||||||
Investment in subsidiaries | 3,554.1 | 1,363.2 | — | (4,917.3 | ) | — | |||||||||||||
Intercompany receivables, net (1) | — | 644.2 | 54.7 | (698.9 | ) | — | |||||||||||||
Property, plant and equipment, net | — | 335.7 | 117.7 | — | 453.4 | ||||||||||||||
Goodwill | — | 1,061.9 | 384.0 | — | 1,445.9 | ||||||||||||||
Other intangible assets, net | — | 900.3 | 171.4 | — | 1,071.7 | ||||||||||||||
Other assets | 1.6 | 0.1 | 29.9 | — | 31.6 | ||||||||||||||
Total assets | $ | 3,555.7 | $ | 4,591.2 | $ | 1,658.1 | $ | (5,616.2 | ) | $ | 4,188.8 | ||||||||
Liabilities and Shareholders' Equity | |||||||||||||||||||
Current liabilities | $ | 19.3 | $ | 259.8 | $ | 245.3 | $ | — | $ | 524.4 | |||||||||
Intercompany payables, net (1) | 698.9 | — | — | (698.9 | ) | — | |||||||||||||
Long-term debt | 1,095.4 | 430.0 | — | — | 1,525.4 | ||||||||||||||
Deferred income tax liabilities | — | 147.6 | 34.2 | — | 181.8 | ||||||||||||||
Other liabilities | 0.4 | 199.7 | 15.4 | — | 215.5 | ||||||||||||||
Total liabilities | 1,814.0 | 1,037.1 | 294.9 | (698.9 | ) | 2,447.1 | |||||||||||||
Total shareholders' equity | 1,741.7 | 3,554.1 | 1,363.2 | (4,917.3 | ) | 1,741.7 | |||||||||||||
Total liabilities and shareholders' equity | $ | 3,555.7 | $ | 4,591.2 | $ | 1,658.1 | $ | (5,616.2 | ) | $ | 4,188.8 | ||||||||
(1) | Intercompany activities include product purchases between Guarantors and Non-Guarantors, charges for services provided by the Parent Company and various subsidiaries to other affiliates within the consolidated entity and other intercompany activities in the normal course of business. |
94
EDGEWELL PERSONAL CARE COMPANY
CONDENSED CONSOLIDATING BALANCE SHEETS
September 30, 2016
Parent Company | Guarantors | Non-Guarantors | Eliminations | Total | |||||||||||||||
Assets | |||||||||||||||||||
Current assets | |||||||||||||||||||
Cash and cash equivalents | $ | — | $ | 5.8 | $ | 733.1 | $ | — | $ | 738.9 | |||||||||
Trade receivables, net | — | 108.9 | 151.8 | — | 260.7 | ||||||||||||||
Inventories | — | 187.7 | 121.5 | — | 309.2 | ||||||||||||||
Other current assets | — | 43.7 | 99.5 | — | 143.2 | ||||||||||||||
Total current assets | — | 346.1 | 1,105.9 | — | 1,452.0 | ||||||||||||||
Investment in subsidiaries | 3,483.7 | 825.0 | — | (4,308.7 | ) | — | |||||||||||||
Intercompany receivables, net (1) | — | 487.6 | 53.5 | (541.1 | ) | — | |||||||||||||
Intercompany notes receivable (1) | — | 1.9 | — | (1.9 | ) | — | |||||||||||||
Property, plant and equipment, net | — | 343.8 | 142.3 | — | 486.1 | ||||||||||||||
Goodwill | — | 1,061.9 | 358.4 | — | 1,420.3 | ||||||||||||||
Other intangible assets, net | — | 1,235.1 | 150.0 | — | 1,385.1 | ||||||||||||||
Other assets | 2.0 | 0.1 | 25.9 | — | 28.0 | ||||||||||||||
Total assets | $ | 3,485.7 | $ | 4,301.5 | $ | 1,836.0 | $ | (4,851.7 | ) | $ | 4,771.5 | ||||||||
Liabilities and Shareholders' Equity | |||||||||||||||||||
Current liabilities | $ | 21.4 | $ | 288.4 | $ | 558.4 | $ | — | $ | 868.2 | |||||||||
Intercompany payables, net (1) | 541.1 | — | — | (541.1 | ) | — | |||||||||||||
Intercompany notes payable (1) | — | — | 1.9 | (1.9 | ) | — | |||||||||||||
Long-term debt | 1,094.2 | 450.0 | — | — | 1,544.2 | ||||||||||||||
Deferred income tax liabilities | — | 232.4 | 22.9 | — | 255.3 | ||||||||||||||
Other liabilities | — | 236.3 | 38.5 | — | 274.8 | ||||||||||||||
Total liabilities | 1,656.7 | 1,207.1 | 621.7 | (543.0 | ) | 2,942.5 | |||||||||||||
Total shareholders' equity | 1,829.0 | 3,094.4 | 1,214.3 | (4,308.7 | ) | 1,829.0 | |||||||||||||
Total liabilities and shareholders' equity | $ | 3,485.7 | $ | 4,301.5 | $ | 1,836.0 | $ | (4,851.7 | ) | $ | 4,771.5 | ||||||||
(1) | Intercompany activities include product purchases between Guarantors and Non-Guarantors, charges for services provided by the Parent Company and various subsidiaries to other affiliates within the consolidated entity and other intercompany activities in the normal course of business. |
95
EDGEWELL PERSONAL CARE COMPANY
CONDENSED CONSOLIDATING STATEMENTS OF CASH FLOWS
Fiscal Year Ended September 30, 2017
Parent Company | Guarantors | Non-Guarantors | Eliminations | Total | |||||||||||||||
Net cash from operating activities | $ | 165.5 | $ | 63.1 | $ | 142.6 | $ | (75.0 | ) | $ | 296.2 | ||||||||
Cash Flow from Investing Activities | |||||||||||||||||||
Capital expenditures | — | (51.7 | ) | (17.3 | ) | — | (69.0 | ) | |||||||||||
Proceeds on sale of fixed assets | — | 5.9 | 12.5 | — | 18.4 | ||||||||||||||
Acquisition, net of cash acquired | — | — | (34.0 | ) | — | (34.0 | ) | ||||||||||||
Proceeds from intercompany notes | — | 1.9 | — | (1.9 | ) | — | |||||||||||||
Net cash used by investing activities | — | (43.9 | ) | (38.8 | ) | (1.9 | ) | (84.6 | ) | ||||||||||
Cash Flow from Financing Activities | |||||||||||||||||||
Cash proceeds from issuance of debt with original maturities greater than 90 days | — | 271.0 | — | — | 271.0 | ||||||||||||||
Cash payments on debt with original maturities greater than 90 days | — | (291.0 | ) | (277.0 | ) | — | (568.0 | ) | |||||||||||
Net increase in debt with original maturity days of 90 or less | — | 1.4 | 0.6 | — | 2.0 | ||||||||||||||
Payments for intercompany notes | — | — | (1.9 | ) | 1.9 | — | |||||||||||||
Common shares purchased | (165.4 | ) | — | — | — | (165.4 | ) | ||||||||||||
Intercompany dividend | — | — | (75.0 | ) | 75.0 | — | |||||||||||||
Other, net | (0.1 | ) | — | (0.1 | ) | — | (0.2 | ) | |||||||||||
Net cash used by financing activities | (165.5 | ) | (18.6 | ) | (353.4 | ) | 76.9 | (460.6 | ) | ||||||||||
Effect of exchange rate changes on cash | — | — | 13.0 | — | 13.0 | ||||||||||||||
Net increase (decrease) in cash and cash equivalents | — | 0.6 | (236.6 | ) | — | (236.0 | ) | ||||||||||||
Cash and cash equivalents, beginning of period | — | 5.8 | 733.1 | — | 738.9 | ||||||||||||||
Cash and cash equivalents, end of period | $ | — | $ | 6.4 | $ | 496.5 | $ | — | $ | 502.9 | |||||||||
96
EDGEWELL PERSONAL CARE COMPANY
CONDENSED CONSOLIDATING STATEMENTS OF CASH FLOWS
Fiscal Year Ended September 30, 2016
Parent Company | Guarantors | Non-Guarantors | Eliminations | Total | |||||||||||||||
Net cash from (used by) operating activities | $ | 207.8 | $ | (47.0 | ) | $ | 47.4 | $ | (31.8 | ) | $ | 176.4 | |||||||
Cash Flow from Investing Activities | |||||||||||||||||||
Capital expenditures | — | (51.8 | ) | (17.7 | ) | — | (69.5 | ) | |||||||||||
Payment for equity contributions | (10.6 | ) | (11.1 | ) | — | 21.7 | — | ||||||||||||
Net cash used by investing activities | (10.6 | ) | (62.9 | ) | (17.7 | ) | 21.7 | (69.5 | ) | ||||||||||
Cash Flow from Financing Activities | |||||||||||||||||||
Cash proceeds from debt with original maturities greater than 90 days | — | 746.0 | 10.3 | — | 756.3 | ||||||||||||||
Cash payments on debt with original maturities greater than 90 days | — | (631.0 | ) | — | — | (631.0 | ) | ||||||||||||
Net (decrease) increase in debt with original maturity days of 90 or less | — | (12.8 | ) | 1.7 | — | (11.1 | ) | ||||||||||||
Deferred finance expense | (0.6 | ) | — | — | — | (0.6 | ) | ||||||||||||
Common shares purchased | (196.6 | ) | — | — | — | (196.6 | ) | ||||||||||||
Proceeds from equity contributions | — | 10.6 | 11.1 | (21.7 | ) | — | |||||||||||||
Intercompany dividend | — | — | (31.8 | ) | 31.8 | — | |||||||||||||
Net cash (used by) from financing activities | (197.2 | ) | 112.8 | (8.7 | ) | 10.1 | (83.0 | ) | |||||||||||
Effect of exchange rate changes on cash | — | — | 2.9 | — | 2.9 | ||||||||||||||
Net increase in cash and cash equivalents | — | 2.9 | 23.9 | — | 26.8 | ||||||||||||||
Cash and cash equivalents, beginning of period | $ | — | 2.9 | 709.2 | — | 712.1 | |||||||||||||
Cash and cash equivalents, end of period | $ | — | $ | 5.8 | $ | 733.1 | $ | — | $ | 738.9 | |||||||||
97
EDGEWELL PERSONAL CARE COMPANY
CONDENSED CONSOLIDATING STATEMENTS OF CASH FLOWS
Fiscal Year Ended September 30, 2015
Parent Company | Guarantors | Non-Guarantors | Eliminations | Total | |||||||||||||||
Net cash (used by) from operating activities | $ | (178.9 | ) | $ | (24.2 | ) | $ | 351.9 | $ | — | $ | 148.8 | |||||||
Cash Flow from Investing Activities | |||||||||||||||||||
Capital Expenditures | — | (75.2 | ) | (24.2 | ) | — | (99.4 | ) | |||||||||||
Proceeds from sale of assets | — | 2.5 | 14.1 | — | 16.6 | ||||||||||||||
Change related to Venezuela operations | — | — | (93.8 | ) | — | (93.8 | ) | ||||||||||||
Acquisitions, net of cash acquired | — | (12.1 | ) | — | — | (12.1 | ) | ||||||||||||
Proceeds from intercompany notes | 1,350.0 | — | 100.0 | (1,450.0 | ) | — | |||||||||||||
Payments for intercompany notes | (499.1 | ) | — | (100.0 | ) | 599.1 | — | ||||||||||||
Intercompany receivable/payable, net | — | (294.6 | ) | — | 294.6 | — | |||||||||||||
Investment in subsidiaries | — | 270.0 | (270.0 | ) | — | — | |||||||||||||
Payment for equity contributions | — | (16.1 | ) | — | 16.1 | — | |||||||||||||
Change in restricted cash | — | — | 13.9 | — | 13.9 | ||||||||||||||
Net cash from (used by) investing activities | 850.9 | (125.5 | ) | (360.0 | ) | (540.2 | ) | (174.8 | ) | ||||||||||
Cash Flow from Financing Activities | |||||||||||||||||||
Cash proceeds from issuance of debt with original maturities greater than 90 days | 1,335.0 | 999.0 | 270.2 | — | 2,604.2 | ||||||||||||||
Cash payments on debt with original maturities greater than 90 days | (1,900.0 | ) | — | — | — | (1,900.0 | ) | ||||||||||||
Net (decrease) increase in debt with original maturity days of 90 or less | (135.0 | ) | 11.6 | (129.2 | ) | — | (252.6 | ) | |||||||||||
Payment of debt issue cost | (2.6 | ) | (12.3 | ) | (0.2 | ) | — | (15.1 | ) | ||||||||||
Proceeds from intercompany notes | — | 599.1 | — | (599.1 | ) | — | |||||||||||||
Payments for intercompany notes | — | (1,450.0 | ) | — | 1,450.0 | — | |||||||||||||
Common shares purchased | (175.2 | ) | — | — | — | (175.2 | ) | ||||||||||||
Cash dividends paid | (93.2 | ) | — | — | — | (93.2 | ) | ||||||||||||
Transfer of cash and cash equivalents to New Energizer | — | (12.4 | ) | (487.3 | ) | — | (499.7 | ) | |||||||||||
Proceeds from issuance of common stock | 4.4 | — | — | — | 4.4 | ||||||||||||||
Excess tax benefits from share-based payments | — | — | — | — | — | ||||||||||||||
Intercompany receivable/payable, net | 294.6 | — | — | (294.6 | ) | — | |||||||||||||
Proceeds from equity contribution | — | — | 16.1 | (16.1 | ) | — | |||||||||||||
Intercompany dividend | — | 14.3 | (14.3 | ) | — | — | |||||||||||||
Net cash (used by) from financing activities | (672.0 | ) | 149.3 | (344.7 | ) | 540.2 | (327.2 | ) | |||||||||||
Effect of exchange rate changes on cash | — | — | (63.7 | ) | — | (63.7 | ) | ||||||||||||
Net decrease in cash and cash equivalents | — | (0.4 | ) | (416.5 | ) | — | (416.9 | ) | |||||||||||
Cash and cash equivalents, beginning of period | — | 3.3 | 1,125.7 | — | 1,129.0 | ||||||||||||||
Cash and cash equivalents, end of period | $ | — | $ | 2.9 | $ | 709.2 | $ | — | $ | 712.1 | |||||||||
98
Note 20 - Quarterly Financial Information (Unaudited)
Fiscal 2017 (by quarter) | |||||||||||||||
Q1 | Q2 | Q3 | Q4 | ||||||||||||
Net sales | $ | 485.0 | $ | 611.0 | $ | 637.5 | $ | 564.9 | |||||||
Gross profit | 228.0 | 309.6 | 322.1 | 270.9 | |||||||||||
Net earnings (loss) (1)(2) | 33.5 | 65.7 | 54.9 | (148.4 | ) | ||||||||||
Basic earnings per share (4) | 0.58 | 1.14 | 0.96 | (2.61 | ) | ||||||||||
Diluted earnings per share (4) | 0.58 | 1.14 | 0.95 | (2.61 | ) | ||||||||||
Fiscal 2016 (by quarter) | |||||||||||||||
Q1 | Q2 | Q3 | Q4 | ||||||||||||
Net sales | $ | 495.1 | $ | 611.2 | $ | 645.1 | $ | 610.6 | |||||||
Gross profit | 227.5 | 311.1 | 311.2 | 310.1 | |||||||||||
Net earnings (1) (2) (3) | 23.7 | 66.1 | 36.7 | 52.2 | |||||||||||
Basic earnings per share (4) | 0.40 | 1.11 | 0.62 | 0.89 | |||||||||||
Diluted earnings per share (4) | 0.39 | 1.10 | 0.61 | 0.88 | |||||||||||
(1) | Restructuring and related costs were $7.2, $5.6, $12.8 and $4.7 for the first, second, third and fourth quarters of fiscal 2017, respectively, and $18.5, $5.1, $5.8 and $9.4 for the first, second, third and fourth quarters of fiscal 2016, respectively. See Note 5 of Notes to Consolidated Financial Statements. |
(2) | The fourth quarter of fiscal 2017 and 2016 includes a non-cash impairment charge of $319.0 and $6.5 related to intangible assets, respectively. See Note 8 of Notes to Consolidated Financial Statements. |
(3) | Separation related costs were $7.5, $1.7 and $2.8 for the first, second and third quarters of fiscal 2016, respectively. See Note 3 of Notes to Consolidated Financial Statements. |
(4) | Quarterly and annual computations are prepared independently. Therefore, the sum of each quarter may not necessarily total the fiscal period amounts noted elsewhere within this Annual Report on Form 10-K. |
Note 21 - Subsequent Event
On October 3, 2017, the Company entered into an agreement to sell its Playtex® Gloves business to a household products company (the “Acquirer”) for $19. The agreement also provides the Acquirer with indefinite and exclusive worldwide rights to the Playtex trademark for gloves. The strategic sale of the Playtex Gloves business will allow the Company to better focus and utilize its resources on its other product lines. The sale closed on October 26, 2017. Total assets sold were approximately $3 resulting in a pre-tax gain on sale of $16.
Item 9. Changes in and Disagreements With Accountants on Accounting and Financial Disclosure.
None.
Item 9A. Controls and Procedures.
Evaluation of Disclosure Controls and Procedures
We maintain disclosure controls and procedures designed to ensure that information required to be disclosed in reports filed under the Securities Act of 1934, as amended (the "Exchange Act"), is recorded, processed, summarized and reported within the specified time periods, and that such information is accumulated and communicated to management, including our Chief Executive Officer ("CEO") and Chief Financial Officer ("CFO"), as appropriate, to allow timely decisions regarding required disclosure.
Our management, with the participation of our CEO and CFO, evaluated the effectiveness of our disclosure controls and procedures (as defined in Rules 13a-15(e) and 15d-15(e) under the Exchange Act) as of September 30, 2017. Based on that evaluation, our CEO and CFO concluded that, as of that date, our disclosure controls and procedures were effective.
99
Management's Report on Internal Control Over Financial Reporting
Our management is responsible for establishing and maintaining adequate control over financial reporting, as defined under Exchange Act rules 13a-15(f) and 15d-15(f). Under the supervision and with the participation of our management, including our CEO and CFO, we conducted an evaluation of the effectiveness of our internal control over financial reporting based on the framework in Internal Control - Integrated Framework (2013) issued by the Committee of Sponsoring Organizations of the Treadway Commission. Management's assessment included an evaluation of the design of our internal control over financial reporting and testing of the operational effectiveness of our internal control over financial reporting. Based on this assessment, management determined that our internal control over financial reporting was effective as of September 30, 2017.
The effectiveness of our internal control over financial reporting as of September 30, 2017 has been audited by PricewaterhouseCoopers LLP, an independent registered public accounting firm, as stated in their report which is included herein.
Changes in Internal Control over Financial Reporting
There were no changes in our internal control over financial reporting during the quarter ended September 30, 2017 that have materially affected, or are likely to materially affect, our internal control over financial reporting.
Item 9B. Other Information.
None.
PART III
Item 10. Directors, Executive Officers and Corporate Governance.
Information regarding our directors will be included in our definitive proxy statement for our annual meeting of shareholders, which will be filed with the United States Securities and Exchange Commission ("SEC") within 120 days after September 30, 2017.
Information regarding our executive officers is included in Item 1. Business of this Annual Report on Form 10-K.
We have adopted business practices and standards of conduct that are applicable to all employees, including our Chief Executive Officer, Chief Financial Officer and Chief Accounting Officer. We have also adopted a code of business conduct applicable to our Board of Directors. The codes have been posted on the Investor section of our website at www.edgewell.com. In the event that an amendment to, or a waiver from, a provision of one of the codes of ethics occurs and it is determined that such amendment or waiver is subject to the disclosure provisions of Item 5.05 of Current Report on Form 8-K, we intend to satisfy such disclosure by posting such information on our website for at least a 12-month period.
Item 11. Executive Compensation.
Information regarding the compensation of our named executive officers and directors will be included in our definitive proxy statement for our annual meeting of shareholders, which will be filed with the SEC within 120 days after September 30, 2017.
Item 12. Security Ownership of Certain Beneficial Owners and Management and Related Stockholder Matters.
Information regarding individuals or groups that own more than 5% of our common shares, as well as information regarding the security ownership of our executive officers and directors, information relating to securities authorized for issuance under equity compensation plans and other shareholder matters will be included in our definitive proxy statement for our annual meeting of shareholders, which will be filed with the SEC within 120 days after September 30, 2017.
Item 13. Certain Relationships and Related Transactions, and Director Independence.
Information regarding transactions with related parties and director independence will be included in our definitive proxy statement for our annual meeting of shareholders, which will be filed with the SEC within 120 days after September 30, 2017.
100
Item 14. Principal Accounting Fees and Services.
Information regarding the services provided by and fees paid to PricewaterhouseCoopers LLP, our independent auditors, will be included in our definitive proxy statement for our annual meeting of shareholders, which will be filed with the SEC within 120 days after September 30, 2017.
101
PART IV
Item 15. Exhibits, Financial Statement Schedules.
Documents filed as part of this report:
1) | Financial Statements. The following are included within Item 8. Financial Statements and Supplementary Data of this Annual Report on Form 10-K. |
• | Report of Independent Registered Public Accounting Firm. |
• | Consolidated Statements of Earnings and Comprehensive Income (Loss) for the fiscal years ended September 30, 2017, 2016 and 2015. |
• | Consolidated Balance Sheets as of September 30, 2017 and 2016. |
• | Consolidated Statements of Cash Flows for the fiscal years ended September 30, 2017, 2016 and 2015. |
• | Consolidated Statement of Changes in Shareholders' Equity for the period from October 1, 2014 to September 30, 2017. |
• | Notes to Consolidated Financial Statements. |
2) | Financial Statement Schedules. |
Schedule II - Valuation and Qualifying Accounts
Fiscal Year | ||||||||||||
2017 | 2016 | 2015 | ||||||||||
Allowance for Doubtful Accounts | ||||||||||||
Balance at beginning of year | $ | 4.9 | $ | 5.4 | $ | 13.4 | ||||||
Provision charged to expense, net of reversals | (0.4 | ) | (0.3 | ) | 0.9 | |||||||
Write-offs, less recoveries, translation, other | (0.2 | ) | (0.2 | ) | (2.9 | ) | ||||||
Amounts distributed to New Energizer | — | — | (6.0 | ) | ||||||||
Balance at end of year | $ | 4.3 | $ | 4.9 | $ | 5.4 | ||||||
Income Tax Valuation Allowance | ||||||||||||
Balance at beginning of year | $ | 8.5 | $ | 8.4 | $ | 13.3 | ||||||
Provision charged to expense | 0.1 | — | 9.6 | |||||||||
Write-offs, less recoveries, translation, other | (0.2 | ) | 0.1 | — | ||||||||
Amounts distributed to New Energizer | — | — | (14.5 | ) | ||||||||
Balance at end of year | $ | 8.4 | $ | 8.5 | $ | 8.4 | ||||||
3) | Exhibits. The exhibits are included in the Exhibit Index that appears at the end of this Annual Report on Form 10-K. |
102
SIGNATURES
Pursuant to the requirements of Section 13 or 15(d) of the Securities Exchange Act of 1934, the registrant has duly caused this report to be signed on its behalf by the undersigned, thereunto duly authorized.
EDGEWELL PERSONAL CARE COMPANY | |||
By | /s/ David P. Hatfield | ||
David P. Hatfield | |||
Chief Executive Officer | |||
Date: November 17, 2017
Pursuant to the requirements of the Securities Exchange Act of 1934, this report has been signed below by the following persons on behalf of the registrant and in the capacities and as of the date indicated.
Signature | Title |
/s/ David P. Hatfield | |
David P. Hatfield (principal executive officer) | Chief Executive Officer and Chairman of the Board |
/s/ Sandra J. Sheldon | |
Sandra J. Sheldon (principal financial officer) | Chief Financial Officer |
/s/ Elizabeth E. Dreyer | |
Elizabeth E. Dreyer (principal accounting officer) | Chief Accounting Officer and Vice President, Controller |
/s/ Daniel J. Heinrich | |
Daniel J. Heinrich | Director |
/s/ Carla C. Hendra | |
Carla C. Hendra | Director |
/s/ R. David Hoover | |
R. David Hoover | Director |
/s/ John C. Hunter | |
John C. Hunter | Director |
/s/ James C. Johnson | |
James C. Johnson | Director |
/s/ Elizabeth Valk Long | |
Elizabeth Valk Long | Director |
/s/ Rakesh Sachdev | |
Rakesh Sachdev | Director |
Date: November 17, 2017 | |
103
EXHIBIT INDEX
Exhibit Number | Exhibit |
2.1*** | |
2.2*** | |
2.3*** | |
2.4*** | |
2.5*** | |
3.1 | |
3.2 | |
3.3 | |
4.1 | |
4.2 | |
4.3 | |
10.1 | |
10.2 | |
10.3 | |
10.4 | |
10.5 | |
104
10.6 | |
10.7 | |
10.8 | |
10.9 | |
10.10 | |
10.11 | |
10.12** | |
10.13** | |
10.14** | |
10.15** | |
10.16** | |
10.17** | |
10.18** | |
10.19** | |
10.20** | |
10.21** | |
10.22** | |
10.23** | |
10.24** | |
10.25** | |
10.26** | |
10.27** | |
105
10.28** | |
10.29** | |
10.30** | |
10.31** | |
10.32** | |
10.33** | |
10.34** | |
10.35** | |
10.36** | |
10.37** | |
10.38** | |
10.39*,** | |
10.40** | |
12* | |
21.1* | |
23.1* | |
31.1* | |
31.2* | |
32.1* | |
32.2* | |
101* | The following materials from the Edgewell Personal Care Company Annual Report on Form 10-K formatted in eXtensible Business Reporting Language (XBRL): (i) the Consolidated Statements of Earnings and Comprehensive Income (Loss) for the years ended September 30, 2015, 2016 and 2017, (ii) the Consolidated Balance Sheets at September 30, 2016 and 2017, (iii) the Consolidated Statements of Cash Flows for the years ended September 30, 2015, 2016 and 2017, (iv) Consolidated Statement of Changes in Shareholders' Equity for the period from October 1, 2014 to September 30, 2017, and (v) Notes to Consolidated Financial Statements for the year ended September 30, 2017. |
*Filed herewith.
**Denotes a management contract or compensatory plan or arrangement.
***The Company hereby undertakes to furnish supplementally a copy of any omitted schedule or exhibit to such agreement to the Securities and Exchange Commission upon request.
106