Attached files
| file | filename |
|---|---|
| EX-32.1 - 906 CERTIFICATION - Post Holdings, Inc. | post2017930ex321.htm |
| EX-31.2 - CERTIFICATION OF CFO - Post Holdings, Inc. | post2017930ex312.htm |
| EX-31.1 - CERTIFICATION OF CEO - Post Holdings, Inc. | post2017930ex311.htm |
| EX-23.1 - CONSENT OF PWC - Post Holdings, Inc. | ex231consentofindependenta.htm |
| EX-21.1 - SUBSIDIARIES - Post Holdings, Inc. | ex21-1xsubsidiariesofphi09.htm |
UNITED STATES
SECURITIES AND EXCHANGE COMMISSION
Washington, D.C. 20549
_______________________
FORM 10-K
_______________________
(Mark One)
x | ANNUAL REPORT PURSUANT TO SECTION 13 OR 15(d) OF THE SECURITIES EXCHANGE ACT OF 1934 |
For the fiscal year ended September 30, 2017
or
¨ | TRANSITION REPORT PURSUANT TO SECTION 13 OR 15(d) OF THE SECURITIES EXCHANGE ACT OF 1934 |
Commission file number: 1-35305
______________________
POST HOLDINGS, INC.
(Exact name of registrant as specified in its charter)
_______________________
Missouri | 45-3355106 | |
(State or other jurisdiction of incorporation or organization) | (I.R.S. Employer Identification No.) | |
2503 S. Hanley Road, St. Louis, Missouri | 63144 | |
(Address of principal executive offices) | (Zip Code) | |
Registrant’s telephone number, including area code: (314) 644-7600
_______________________
Securities registered pursuant to Section 12(b) of the Act:
Title of each class | Name of each exchange on which registered | |
Common Stock, $.01 par value | New York Stock Exchange, Inc. | |
Securities registered pursuant to Section 12(g) of the Act: None
_______________________
Indicate by check mark if the registrant is a well-known seasoned issuer, as defined in Rule 405 of the Securities Act. x Yes ¨ No
Indicate by check mark if the registrant is not required to file reports pursuant to Section 13 or Section 15(d) of the Act. ¨ Yes x No
Indicate by check mark whether the registrant (1) has filed all reports required to be filed by Section 13 or 15(d) of the Securities Exchange Act of 1934 during the preceding 12 months (or for such shorter period that the registrant was required to file such reports), and (2) has been subject to such filing requirements for the past 90 days. x Yes ¨ No
Indicate by check mark whether the registrant has submitted electronically and posted on its corporate Web site, if any, every Interactive Data File required to be submitted and posted pursuant to Rule 405 of Regulation S-T (§232.405 of this chapter) during the preceding 12 months (or for such shorter period that the registrant was required to submit and post such files). x Yes ¨ No
Indicate by check mark if disclosure of delinquent filers pursuant to Item 405 of Regulation S-K (§232.405 of this chapter) is not contained herein, and will not be contained, to the best of registrant’s knowledge, in definitive proxy or information statements incorporated by reference in Part III of this Form 10-K or any amendment to this Form 10-K. ¨
Indicate by check mark whether the registrant is a large accelerated filer, an accelerated filer, a non-accelerated filer, a smaller reporting company, or an emerging growth company. See the definitions of “large accelerated filer,” “accelerated filer,” “smaller reporting company,” and “emerging growth company” in Rule 12b-2 of the Exchange Act.
Large accelerated filer | x | Accelerated filer | ¨ | |||
Non-accelerated filer | ¨ | Smaller reporting company | ¨ | |||
Emerging growth company | ¨ | |||||
If an emerging growth company, indicate by check mark if the registrant has elected not to use the extended transition period for complying with any new or revised financial accounting standards provided pursuant to Section 13(a) of the Exchange Act. ¨
Indicate by check mark whether the registrant is a shell company (as defined in Rule 12b-2 of the Act). ¨ Yes x No
The aggregate market value of the registrant’s Common Stock held by non-affiliates of the registrant as of March 31, 2017, the last day of the registrant’s second quarter, was $5,522,477,167.
Number of shares of Common Stock, $.01 par value, outstanding as of November 13, 2017: 66,120,127
DOCUMENTS INCORPORATED BY REFERENCE
Certain portions of the registrant’s definitive proxy statement for its 2018 annual meeting of shareholders, to be filed with the Securities and Exchange Commission within 120 days after September 30, 2017, are incorporated by reference into Part III of this report.
TABLE OF CONTENTS
PART I | ||
PART II | ||
PART III | ||
PART IV | ||
i
CAUTIONARY STATEMENT ON FORWARD-LOOKING STATEMENTS
Forward-looking statements, within the meaning of Section 27A of the Securities Act of 1933, as amended (the “Securities Act”), and Section 21E of the Securities Exchange Act of 1934, as amended (the “Exchange Act”), are made throughout this report. These forward-looking statements are sometimes identified from the use of forward-looking words such as “believe,” “should,” “could,” “potential,” “continue,” “expect,” “project,” “estimate,” “predict,” “anticipate,” “aim,” “intend,” “plan,” “forecast,” “target,” “is likely,” “will,” “can,” “may,” “would,” or the negative of these terms and similar expressions elsewhere in this report. Our results of operations and financial condition may differ materially from those in the forward-looking statements. Such statements are based on management’s current views and assumptions, and involve risks and uncertainties that could affect expected results. Those risks and uncertainties include but are not limited to the following:
• | our high leverage, our ability to obtain additional financing (including both secured and unsecured debt), and our ability to service our outstanding debt (including covenants that restrict the operation of our business); |
• | our ability to continue to compete in our product markets and our ability to retain our market position; |
• | our ability to anticipate and respond to changes in consumer preferences and trends and introduce new products; |
• | our ability to identify, complete and integrate acquisitions and manage our growth; |
• | our ability to promptly and effectively integrate the Weetabix business and obtain expected cost savings and synergies of the acquisition within the expected timeframe; |
• | significant volatility in the costs of certain raw materials, commodities, packaging or energy used to manufacture our products; |
• | our ability to successfully implement business strategies to reduce costs; |
• | our ability to comply with increased regulatory scrutiny related to certain of our products and/or international sales; |
• | allegations that our products cause injury or illness, product recalls and product liability claims and other litigation; |
• | legal and regulatory factors, including advertising and labeling laws, changes in food safety and laws and regulations governing animal feeding and housing operations; |
• | the loss or bankruptcy of a significant customer; |
• | consolidations in the retail grocery and foodservice industries; |
• | the ability and timing to close the proposed acquisition of Bob Evans Farms, Inc. (“Bob Evans”), including obtaining the approval of Bob Evans’s stockholders for the proposed acquisition, the required regulatory approvals and the satisfaction of other closing conditions to the merger agreement; |
• | our ability to promptly and effectively integrate the Bob Evans business after the acquisition has closed, including the risk of our or Bob Evans’s respective businesses experiencing disruptions from ongoing business operations which may make it more difficult than expected to maintain relationships with employees, business partners or governmental entities, and our ability to obtain expected cost savings and synergies of the acquisition within the expected timeframe; |
• | the ability of our private label products to compete with nationally branded products; |
• | disruptions or inefficiencies in supply chain; |
• | our reliance on third party manufacturers for certain of our products; |
• | the ultimate impact litigation may have on us; |
• | our ability to successfully operate our international operations in compliance with applicable laws and regulations; |
• | changes in economic conditions, disruptions in the U.S. and global capital and credit markets, and fluctuations in foreign currency exchange rates; |
• | the impact of the United Kingdom’s exit from the European Union (commonly known as “Brexit”) on us and our operations; |
• | impairment in the carrying value of goodwill or other intangibles; |
• | changes in estimates in critical accounting judgments and changes to or new laws and regulations affecting our business, including proposed tax reform; |
• | changes in weather conditions, natural disasters, disease outbreaks and other events beyond our control; |
1
• | loss of key employees, labor strikes, work stoppages or unionization efforts; |
• | losses or increased funding and expenses related to our qualified pension and other post-retirement plans; |
• | costs, business disruptions and reputational damage associated with information technology failures and/or information security breaches; |
• | our ability to protect our intellectual property and other assets; |
• | significant differences in our actual operating results from our guidance regarding our future performance; |
• | our ability to satisfy the requirements of Section 404 of the Sarbanes-Oxley Act of 2002, including with respect to acquired businesses; and |
• | other risks and uncertainties included under “Risk Factors” in this document. |
You should not rely upon forward-looking statements as predictions of future events. Although we believe that the expectations reflected in the forward-looking statements are reasonable, we cannot guarantee that the future results, levels of activity, performance or events and circumstances reflected in the forward-looking statements will be achieved or occur. Moreover, we undertake no obligation to update publicly any forward-looking statements for any reason after the date of this document to conform these statements to actual results or to changes in our expectations.
2
PART I
ITEM 1. BUSINESS
INTRODUCTION
Post Holdings, Inc. is a Missouri corporation incorporated on September 22, 2011. Our principal executive offices are located at 2503 S. Hanley Road, St. Louis, Missouri 63144. We are a consumer packaged goods holding company, operating in the center-of-the-store, foodservice, ingredient, refrigerated, active nutrition and private label food categories. Unless otherwise stated or the context otherwise indicates, all references in this Form 10-K to “Post,” “the Company,” “us,” “our” or “we” mean Post Holdings, Inc. and its consolidated subsidiaries.
On February 3, 2012, Post completed its legal separation via a tax free spin-off (the “Spin-Off”) from our former parent company. On February 6, 2012, Post common stock began trading on the New York Stock Exchange under the ticker symbol “POST.” Post operates in five reportable segments:
• | Post Consumer Brands: Includes branded and private label ready-to-eat (“RTE”) cereal operations of Post Foods, LLC (“Post Foods”), MOM Brands Company (“MOM Brands”) and Weetabix North America (“Weetabix NA”), as well as the business of Attune Foods, LLC (“Attune Foods”), which produces premium natural and organic granola, cereals and snacks. |
• | Michael Foods Group: Comprised of MFI Holding Corporation (“Michael Foods”), Dakota Growers Pasta Company, Inc. (“Dakota Growers”), Willamette Egg Farms (“WEF”) and National Pasteurized Eggs, Inc. (“NPE”), and includes businesses focused on value-added egg products, refrigerated potato products, cheese and other dairy case products and pasta products for the foodservice, retail and food ingredient channels; |
• | Active Nutrition: Includes the protein shakes, bars and powders and nutritional supplement businesses of Premier Nutrition Corporation (“PNC”), Dymatize Enterprises, LLC (“Dymatize”) and Active Nutrition International (“ANI”), as well as the PowerBar brand; |
• | Private Brands: Includes the businesses of Golden Boy Foods Ltd. (“Golden Boy”) and American Blanching Company (“ABC”), which produce private label peanut and other nut butters, dried fruits and nuts, and provide peanut blanching, granulation and roasting services for the commercial peanut industry; and |
• | Weetabix: Includes the businesses of Weetabix Limited and its direct subsidiaries (“Weetabix”), which produce and distribute branded and private label RTE cereal, hot cereals and other cereal-based food products, breakfast drinks and muesli primarily outside of North America. |
On September 19, 2017, we announced that we had entered into a definitive agreement to acquire Bob Evans, a producer of refrigerated potato, pasta and vegetable-based side dishes, pork sausage, and a variety of refrigerated and frozen convenience food items. Bob Evans also has a growing foodservice business which sells a range of products, including sausage, sausage gravy, breakfast sandwiches and side dishes.
Financial information for the five reportable segments for fiscal 2017 is contained in this report. “Management’s Discussion and Analysis of Financial Condition and Results of Operations,” which we refer to as MD&A, under Item 7 of this report contains financial and other information concerning our business developments and operations and is incorporated into this Item 1. Financial information about geographic areas is set out below under Note 21 of “Notes to Consolidated Financial Statements” contained in this report and is incorporated into this Item 1.
Additional information about us, including our Form 10, Forms 10-K, Forms 10-Q, Forms 8-K, other securities filings (and amendments thereto), press releases and other important announcements, is available at our website at www.postholdings.com or the Securities and Exchange Commission’s (“SEC”) website at www.sec.gov (for securities filings only). These documents can be printed free of charge as soon as reasonably practicable after their electronic filing with the SEC. Our Corporate Governance Guidelines, Code of Conduct for Officers and Employees, Board of Directors Code of Ethics, and the charters of the Audit and Corporate Governance and Compensation Committees of our Board of Directors also are available on our website, where they can be printed free of charge. All of these documents also are available to shareholders at no charge upon request sent to our corporate secretary (2503 S. Hanley Road, St. Louis, Missouri 63144-2503, Telephone: 314-644-7600). The information on our website is not part of this report.
Our Businesses
Post Consumer Brands
Post Consumer Brands includes our North America cereal business which manufactures, markets and sells branded and private label RTE cereal and hot cereal products. The RTE cereal category is one of the most prominent categories in the food industry. According to Nielsen’s expanded All Outlets Combined (xAOC) information, the category was approximately $8.4 billion for the
3
52-week period ending October 28, 2017. We have leveraged the strength of our brands, category expertise, and over a century of institutional knowledge to create a diverse portfolio of cereals. Post Consumer Brands is the third largest seller of RTE cereals in the United States with a 19.1% share of retail dollar sales and a 21.9% share of retail pound sales for the 52-week period ending October 28, 2017, based on Nielsen’s xAOC information. Nielsen’s xAOC is representative of food, drug and mass merchandisers (including Walmart), some club retailers (including Sam’s Club and BJs), some dollar retailers (including Dollar General, Family Dollar, and Fred’s Super Dollar) and military. Our RTE cereal brands include Honey Bunches of Oats, Pebbles, Oreo O’s, Great Grains, Grape-Nuts, Post Shredded Wheat, Oh’s, Honeycomb, Golden Crisp, Post Raisin Bran, Alpha-Bits, Shreddies, Malt-O-Meal branded bagged cereal and Mom’s Best. Our hot cereal brands include Malt-O-Meal Hot Wheat, Coco Wheats, Better Oats and Mom’s Best Oatmeal. These products are primarily manufactured through a flexible production platform at ten owned facilities in the United States and Canada.
Our Post Consumer Brands segment also includes the business of Attune Foods. Through this business, we manufacture and market branded premium natural and organic cereals and snacks, including Uncle Sam high fiber cereals, Attune chocolate probiotic bars and Erewhon gluten-free cereals. Attune Foods also includes the Golden Temple, Peace Cereal, Sweet Home Farm and Willamette Valley Granola Company brands as well as a private label granola business. Attune Foods’ products are largely sold through the natural/specialty channels, as well as in the bulk foods section of both conventional and natural/specialty retailers. Our manufacturing facility in Eugene, Oregon provides us the ability to manufacture a wide variety of product and package formats. Additionally, some products are manufactured under co-manufacturing agreements at various third party facilities located in the United States.
After we completed the acquisition of Weetabix on July 3, 2017, we added the Weetabix NA business to Post Consumer Brands. In North America, Weetabix operates a natural and organic RTE cereal and snacking platform in both branded and private label, led by the Weetabix and Barbara’s brands and the Puffins sub-brand, serving the natural and specialty channels and conventional retailers. These products are primarily manufactured at two facilities, one in the United States and one in Canada.
Michael Foods Group
Through our Michael Foods Group segment, we produce and/or distribute egg products, refrigerated potato products, cheese and other dairy case products and pasta products. Our egg products business produces and distributes numerous egg products under the Better’n Eggs, All Whites, Papetti’s, Abbotsford Farms, Emulsa, EasyEggs, Table Ready, and Davidson’s Safest Choice brands, among others. Through this business, we operate thirteen egg products production facilities in the United States, some of which are fully integrated, from the maintenance of laying flocks through the processing of egg products. For fiscal years 2017, 2016 and 2015, egg and egg products contributed 27.2%, 28.2% and 32.5%, respectively, to our consolidated revenue. Refrigerated potato products are marketed primarily under the Simply Potatoes and Diner’s Choice brands; this business maintains a main processing facility in Minnesota, with a smaller facility located in Nevada. Our cheese and other dairy-case products are marketed principally under the Crystal Farms brand, and other trademarks include Crescent Valley, Westfield Farms and David’s Deli. Through this business, we operate a cheese packaging facility in Lake Mills, Wisconsin, which processes and packages various cheese products for the Crystal Farms brand and for private label customers. Our pasta business, Dakota Growers, has vertically integrated durum wheat milling and pasta production capabilities and produces over 150 different shapes of pasta products at two manufacturing plants. The Michael Foods Group sells products to the foodservice, food ingredient and retail grocery markets. Major customers include foodservice distributors, restaurant chains, major retail grocery chains and other packaged food manufacturers.
Active Nutrition
Our Active Nutrition segment markets and distributes ready-to-drink beverages, bars, powders and other nutritional supplements under the Premier Protein, Dymatize, PowerBar, Supreme Protein and Joint Juice brands. The Active Nutrition segment’s products are primarily manufactured under co-manufacturing agreements at various third party facilities located in the United States and Europe. We also own a facility in Germany that primarily manufactures bar products for our PowerBar brand and private label customers. Our Active Nutrition products are primarily sold in club, mass merchandise, grocery, drug, specialty and convenience stores as well as online. For fiscal years 2017, 2016 and 2015, protein-based products and supplements contributed 13.6%, 11.4% and 11.9%, respectively, to our consolidated revenue.
Private Brands
Our Private Brands segment manufactures and distributes organic and conventional private label peanut butter and other nut butters, baking nuts, dried fruit and trail mixes, with sales to grocery retailers and customers in the food ingredient and foodservice channels primarily in the United States and Canada, and also in the European Union and the Middle East. We also co-manufacture peanut butter and other nut butters for national brands, private label retail and industrial markets. Our Private Brands business also provides peanut blanching, granulation and roasting services for the commercial peanut industry.
4
Weetabix
Our Weetabix segment primarily markets and distributes branded and private label RTE cereal products. Weetabix holds the number two overall position in the United Kingdom (the “U.K.”) RTE cereal category. Its portfolio includes the Weetabix brand, which holds the number one brand position in the U.K. RTE cereal category, as well as Alpen (the number one muesli brand in the U.K.), Weetos, Ready Brek and Weetabix On The Go. Its main markets are the U.K. and the Republic of Ireland where Weetabix has deep relationships with all key retailers and key players in wholesale and foodservice. Weetabix also distributes products to multiple countries throughout the world, mainly through a network of third party distributors in the respective markets. Additionally, Weetabix has operations in Africa through two joint ventures.
For fiscal years 2017, 2016 and 2015, cereal and granola products sold by our Post Consumer Brands and Weetabix segments together contributed 37.6%, 36.6% and 29.4%, respectively, to our consolidated revenue.
Sales and Marketing
Each of our businesses has developed marketing strategies specific to its product lines. For certain of our products, we have consumer-targeted marketing campaigns, which include television, digital and print advertisements, coupon offers, co-marketing arrangements with complementary consumer product and entertainment companies and joint advertising with select retail customers. We also use traditional outdoor, print and digital advertising and social media, as well as more targeted grass roots programs such as sampling events and business drops, in order to increase brand awareness and loyalty at both national and local levels. Our internet and social media efforts are used to educate consumers about the nutritional value of our products and for product promotion and consumer entertainment.
Our Post Consumer Brands segment sells products primarily through an internal sales staff and broker organizations. We also sell Post Consumer Brands products to military, e-commerce and foodservice channels and may utilize distribution or similar arrangements for sales of Post Consumer Brands products. Our Michael Foods Group segment aligns its sales and marketing efforts by distribution channel, with a dedicated team for each of the commercial and retail channels. Our Active Nutrition segment uses a flexible sales model that combines a national direct sales force, broker network and distributors. Our Private Brands segment primarily sells its products through internal sales staff and broker organizations, including a strong broker network that services the natural/specialty and conventional grocery channels. Our Weetabix segment services its key U.K. domestic markets through a centralized commercial team which manages relationships with customers at the corporate level while a third party sales force operates at the store level to ensure maximum availability and compliance with agreed plans.
Research and Development
Our research and development efforts span our business segments. These capabilities extend to ingredients and packaging technologies; new product and process development, as well as analytical support; bench-top and pilot plant capabilities; and research support to operations. We incurred expenses of approximately $18.6 million, $16.3 million and $16.8 million during the fiscal years ended September 30, 2017, 2016 and 2015, respectively, for research and development activities.
Raw Materials
Raw materials used in our businesses (purchased from local, regional and international suppliers) consist of ingredients and packaging materials. The principal ingredients for most of our businesses are agricultural commodities, including wheat, oats, other grain products, vegetable oils, fruits, peanuts, almonds and other tree nuts, dairy and soy-based proteins, cocoa, corn syrup and sugar. We also buy significant amounts of grain to feed layer hens. Additionally, the principal ingredients for the Michael Foods business are eggs, potatoes and cheese. A portion of the segment’s egg needs comes from Company-owned hens, and the balance is purchased under third party contracts and in the spot market. Principal ingredients for the Active Nutrition business are protein and protein blends. Certain of our segments, such as Post Consumer Brands, Active Nutrition, Private Brands and Weetabix, utilize raw material sources that ensure that their products meet standards and certification requirements for non-GMO, organic and/or gluten-free. The principal packaging materials used by the Company are linerboard cartons, corrugated boxes, plastic containers, flexible and beverage packaging and cartonboard.
Supply availability and prices paid for raw materials can fluctuate widely due to weather conditions, feed costs, labor disputes, government policies and regulations, industry consolidation, economic climate, energy shortages, transportation delays, commodity market prices, currency fluctuations and other unforeseen circumstances, such as avian influenza which could affect the domestic poultry industry and our egg supply. We continuously monitor worldwide supply and cost trends of these raw materials to enable us to take appropriate action to obtain ingredients and packaging needed for production. Although the prices of the principal raw materials can be expected to fluctuate, we believe such raw materials to be in adequate supply and generally available from numerous sources.
Cereal processing ovens and most of the Michael Foods production facilities are generally fueled by natural gas or propane, which are obtained from local utilities or other local suppliers. Electricity and steam (generated in on-site, gas-fired boilers) also are used in our processing facilities. Short-term standby propane storage exists at several plants for use in the event of an interruption
5
in natural gas supplies. Oil also may be used to fuel certain operations at various plants in the event of natural gas shortages or when its use presents economic advantages. In addition, considerable amounts of diesel fuel are used in connection with the distribution of our products. Weetabix owns and operates its own combined heat and power generation unit, which is capable of supplying the majority of the requirements of its main operation site with power and steam and can be operated using either natural gas or oil.
Trademarks and Intellectual Property
We own a number of trademarks that are critical to the success of our businesses. Our Post Consumer Brands business’ key trademarks include Post®, Honey Bunches of Oats®, Great Grains®, Post® Shredded Wheat, Spoon Size® Shredded Wheat, Golden Crisp®, Alpha-Bits®, Oh's®, ShreddiesTM, Post® Raisin Bran, Grape-Nuts®, Honeycomb®, Frosted Mini Spooners®, Golden Puffs®, Cinnamon Toasters®, Fruity Dyno-Bites®, Cocoa Dyno-Bites®, Berry Colossal Crunch®, Malt-O-Meal®, Farina®, Dyno-Bites®, MOM’s Best®, Better OatsTM, CoCo WheatsTM, Weetabix®, Barbara’s®, Puffins®, SnackimalsTM, Attune®, Uncle Sam®, Erewhon®, Willamette Valley Granola CompanyTM, Peace Cereal® and Sweet Home Farm®. The key trademarks for Michael Foods Group include Crystal Farms®, All Whites®, Papetti’s®, Better’n Eggs®, Easy Eggs®, Emulsa®, Table Ready®, Davidson’s Safest Choice®, Abbotsford Farms®, Simply Potatoes®, Diner’s Choice®, Crescent Valley®, Westfield Farms® and David’s Deli®. Our Active Nutrition segment’s key trademarks include Premier Protein®, Joint Juice®, Dymatize®, ISO.100®, Supreme Protein® and PowerBar®. Our Private Brands business’ key trademarks include Golden BoyTM, Golden Organics® and Country OrchardTM. Our Weetabix segment’s key trademarks include Weetabix®, Alpen®, WeetosTM, Ready BrekTM, Weetabix On the GoTM and OatbixTM. Our trademarks are, in most cases, protected through registration in the United States or the United Kingdom, as well as in many other countries where the related products are sold.
Certain of our products, such as Pebbles™ and Oreo O’s®, are sold under trademarks that have been licensed from third parties pursuant to a long-term license agreement that covers the sale of such branded products in the United States, Canada and several other international markets.
Similarly, we own several patents in North America and elsewhere. While our patent portfolio as a whole is material to our business, no one patent or group of related patents is material to our business. In addition, we have proprietary trade secrets, technology, know-how processes, and other intellectual property rights that are not registered.
Seasonality
Demand for certain of our products may be influenced by holidays, changes in seasons or other events. For example, demand for our egg products, cheese and snacking and baking nuts tends to increase during the Thanksgiving, Christmas and other holiday seasons, which may result in increased net sales during the first quarter of our fiscal year. Demand for our Malt-O-Meal hot wheat and Ready Brek hot oats cereals also tends to be seasonably skewed towards the colder winter season. However, on a consolidated basis our revenues and results of operations are distributed relatively evenly over the quarters of our fiscal year.
Working Capital
A description of our working capital practices is included in the Liquidity and Capital Resources section of MD&A in Item 7 of this report. Cash receipts from goods sold, supplemented as required by borrowings, provide for our operating expenses and working capital needs.
Customers
We sell Post Consumer Brands products primarily to grocery, mass merchandise, supercenters, club stores, natural/specialty and drug store customers. We also sell to military, e-commerce and foodservice channels. Our Michael Foods Group’s primary customers include foodservice distributors, national restaurant chains, retail grocery stores and major food manufacturers and processors. Our Active Nutrition segment’s customers are predominately warehouse club stores, mass merchandise, grocery stores, drug stores, convenience stores, specialty retailers, supplement stores and online retailers. Our Private Brands segment’s products are sold primarily to the natural/specialty and conventional grocery stores and foodservice and food ingredient customers. Our Weetabix segment’s products are primarily sold to grocery stores, discounters, wholesalers and convenience stores.
Our largest customer, Walmart, accounted for approximately 13% of our consolidated net sales in fiscal 2017. No other customer accounted for more than 10% of our fiscal 2017 consolidated net sales, but certain of our segments depend on sales to large customers. For example, the largest customer of our Post Consumer Brands segment, Walmart, accounted for approximately 29% of Post Consumer Brands’ net sales in fiscal 2017. Additionally, the largest customers of our Michael Foods Group segment, Sysco and US Foods, accounted for approximately 27% of the segment’s net sales in fiscal 2017, and the largest customers of our Active Nutrition business, Costco and Sam’s Club, accounted for approximately 57% of the Active Nutrition segment’s net sales in fiscal 2017. The largest customers of our Private Brands segment, Whole Foods and Aldi, accounted for approximately 26% of Private Brands’ net sales in fiscal 2017. The largest customers of our Weetabix segment, Tesco and Asda, accounted for approximately 32% of Weetabix’s net sales in fiscal 2017.
6
For the fiscal years ended September 30, 2017, 2016 and 2015, sales to locations outside of the United States were approximately 8%, 7% and 9% of total net sales, respectively.
Competition
The consumer food and beverage, sports nutrition, and sports supplement categories in which we operate are highly competitive and highly sensitive to both pricing and promotion. Many of our principal competitors in these categories may have substantially more financial, marketing and other resources. Competition is based on product quality, price, effective promotional activities, and the ability to identify and satisfy dynamic, emerging consumer preferences. Our principal strategies for competing in each of our segments include effective customer relationship management, category insights, superior product quality and food safety, product innovation, an efficient supply chain and competitive pricing. In addition, in many of our product categories, we compete not only with widely advertised branded products, but also with private label products. The industries in which we operate are expected to remain highly competitive for the foreseeable future.
Governmental Regulation and Environmental Matters
We are subject to regulation by federal, state, local and foreign governmental entities and agencies. Our activities in Canada and Europe are subject to regulations similar to those applicable to our business in the United States. As a producer and distributor of goods for human consumption, our operations must comply with stringent production, storage, distribution, labeling and marketing standards administered by the Food and Drug Administration (“FDA”) and the Federal Trade Commission in the United States as well as similar regulatory agencies in Canada, Mexico, the United Kingdom and the European Union. Products that do not meet regulatory standards may be considered to be adulterated and/or misbranded and subject to recall. Additionally, following the recent adoption of the Food Safety Modernization Act, the FDA is implementing additional regulations focused on prevention of food contamination, more frequent inspection of high-risk facilities, increased record-keeping and improved tracing of food.
Certain egg products produced by our Michael Foods Group segment are under the jurisdiction of the U.S. Department of Agriculture (“USDA”) and its regulations regarding quality, labeling and sanitary control, rather than FDA regulations. The Michael Foods egg processing plants that break eggs, and some of our other egg-processing operations, are subject to continuous on-site USDA inspection. Our other U.S. facilities are subject to periodic inspection by the USDA, FDA and/or state regulatory authorities, such as state departments of agriculture.
Our facilities, like those of similar businesses, are subject to certain safety regulations, including regulations issued pursuant to the U.S. Occupational Safety and Health Act and similar regulatory agencies in Canada, the United Kingdom and Germany. These regulations require us to comply with certain manufacturing safety standards to protect our employees from accidents. Additionally, some of the food commodities on which our business relies are subject to governmental agricultural programs (e.g., subsidies and import/export regulations), which have substantial effects on prices and supplies of these commodities.
Our operations also are subject to various federal, state and local laws and regulations with respect to environmental matters, including air quality, wastewater pretreatment and discharge, storm water, waste handling and disposal, and other regulations intended to protect public health and the environment. In the United States, the laws and regulations include the Clean Air Act, the Clean Water Act and the Resource Conservation and Recovery Act. Our foreign facilities are subject to local and national regulations similar to those applicable to us in the United States. Additionally, Michael Foods Group layer farms dispose of animal waste primarily by transferring it to farmers for use as fertilizer, and Michael Foods Group potato product facilities dispose of solid vegetable waste primarily by transferring it to processors who convert it to animal feed. We have made, and will continue to make, expenditures to ensure environmental compliance.
Employees
We have approximately 11,410 employees as of November 1, 2017, of which approximately 9,140 are in the United States, approximately 1,060 are in the United Kingdom, approximately 830 are in Canada and approximately 380 are located in other jurisdictions, including the Weetabix Africa joint ventures. Currently, approximately 18% of our employees are unionized. We have entered into several collective bargaining agreements on terms that we believe are typical for the industries in which we operate. Most of the unionized workers at our facilities are represented under contracts which expire at various times throughout the next several years. As these agreements expire, we believe that the agreements can be renegotiated on terms satisfactory to us. We believe that overall we have good relationships with employees and their representative organizations.
Executive Officers of the Registrant
The section below provides information regarding our executive officers as of November 14, 2017:
Robert V. Vitale, age 51, has served as our President and Chief Executive Officer since November 2014 and serves as our principal executive officer. Mr. Vitale also has been a member of our Board of Directors since November 2014. Previously, Mr. Vitale served as our Chief Financial Officer from October 2011 until November 1, 2014. He previously served as President and Chief Executive Officer of AHM Financial Group, LLC, a diversified provider of insurance brokerage and wealth management
7
services, from 2006 until 2011 and previously was a partner of Westgate Equity Partners, LLC, a consumer-oriented private equity firm. Mr. Vitale also serves on the board of directors of Energizer Holdings, Inc.
Jeff A. Zadoks, age 52, has served as an Executive Vice President since November 2017 and as our Chief Financial Officer since November 2014, and is the Company’s principal financial and accounting officer. Mr. Zadoks previously served as our Senior Vice President and Chief Financial Officer from November 2014 until November 2017. Mr. Zadoks served as our Senior Vice President and Chief Accounting Officer from January 2014 until November 1, 2014, and our Corporate Controller from October 2011 until November 2014. Prior to joining Post, Mr. Zadoks served as Senior Vice President and Chief Accounting Officer at RehabCare Group, Inc., a leading provider of post-acute care in hospitals and skilled nursing facilities, from February 2010 to September 2011, and as Vice President and Corporate Controller of RehabCare Group from December 2003 until January 2010.
James E. Dwyer, Jr., age 59, has served as our President and Chief Executive Officer, Michael Foods Group since November 2014. Previously, Mr. Dwyer served as the President and Chief Executive Officer of our Michael Foods Group business beginning in June 2014, when Post acquired Michael Foods. Prior to the acquisition, Mr. Dwyer served as the Chief Executive Officer of Michael Foods since October 2009 and its Chairman since July 2013. Mr. Dwyer is a member of the Board of Directors of Grocery Manufacturers Association and the Andersen Window Corporation, and serves on the Board of Trustees for Minnesota Public Radio and American Public Media.
Christopher J. Neugent, age 56, has served as our President and CEO, Post Consumer Brands since November 2015. Previously, Mr. Neugent served as the President and Chief Executive Officer of MOM Brands Company since May 2015, when Post acquired MOM Brands Company. From 2001 until the acquisition, Mr. Neugent served in various roles at MOM Brands Company, most recently as Chairman and CEO.
Diedre J. Gray, age 39, has served as an Executive Vice President since November 2017 and as our General Counsel and Chief Administrative Officer since November 2014. She has served as our Corporate Secretary since January 2012. Ms. Gray previously served as our Senior Vice President, General Counsel and Chief Administrative Officer from November 2014 until November 2017. Ms. Gray served as our Senior Vice President-Legal starting in December 2011 and was promoted to Senior Vice President, General Counsel in September 2012. Prior to joining Post, Ms. Gray served as Associate General Counsel and Assistant Secretary at MEMC Electronic Materials, Inc. (now SunEdison, Inc.), a semiconductor and solar wafer manufacturing company, from 2010 to 2011. Previously, Ms. Gray was an attorney at Bryan Cave LLP from 2003 to 2010.
Available Information
We make available free of charge through our website (www.postholdings.com) reports we file with the SEC, including our annual reports on Form 10-K, quarterly reports on Form 10-Q, current reports on Form 8-K and amendments to those reports filed or furnished pursuant to Section 13(a) or 15(d) of the Exchange Act, as soon as reasonably practicable after we electronically file such material with, or furnish it to, the SEC. The SEC maintains an internet site containing these reports, proxy and information statements, and other information regarding issuers that file electronically with the SEC at http://www.sec.gov. Any materials we file can be read and copied online at that site or at the SEC’s Public Reference Room at 100 F Street, NE, Washington, D.C. 20549. Information on the operation of the Public Reference Room can be obtained by calling the SEC at 1-800-SEC-0330.
8
ITEM 1A. RISK FACTORS
In addition to the factors discussed elsewhere in this report, the following risks and uncertainties could have a material adverse effect on our business, financial condition and results of operations. Additional risks and uncertainties not presently known to us or that we currently deem immaterial also may impair our business operations, financial condition or results.
Risks Related to Our Business
We operate in categories with strong competition.
The consumer food and beverage, sports nutrition, and sports supplement categories are highly competitive. Our competitors may have substantial financial, marketing and other resources. Increased competition can reduce our sales due to loss of market share or the need to reduce prices to respond to competitive and customer pressures. In most product categories, we compete not only with widely advertised branded products, but also with private label and store brand products. A strong competitive response from one or more of our competitors to our marketplace efforts, or a shift in consumer preferences to competitors’ products, could result in us reducing pricing, increasing marketing or other expenditures or losing market share. Our profits could decrease if a reduction in prices or increased costs are not counterbalanced with increased sales volume.
We must identify changing consumer preferences and develop and offer food products to meet these preferences.
Consumer and customer preferences evolve over time. The success of our food products depends on our ability to identify these changing preferences and to offer products that appeal to consumers and our customers. Consumer preference changes include dietary trends, attention to different nutritional aspects of foods and beverages, concerns regarding the health effects of certain foods and sourcing practices relating to ingredients, and animal welfare concerns.
Our Michael Foods Group business is and will continue to be affected by changing preferences as to the housing of egg-laying hens. Many restaurant chains, foodservice companies and grocery chains have announced goals to transition to a cage-free egg supply by specified future dates. Meeting anticipated customer demand has resulted, and will continue to result, in additional operating and capital costs to procure cage-free eggs, to modify existing layer facilities and to construct new cage-free layer housing. These changing preferences also could require us to use specially sourced ingredients that may be more difficult to source and/or entail a higher cost or incremental capital investment which we may not be able to pass on to customers.
Our business strategy depends on us identifying and completing additional acquisitions and other strategic transactions. We may not be able to successfully consummate favorable transactions.
We continuously evaluate and may in the future enter into additional strategic transactions. Any such transaction could happen at any time, could be material to our business and could take any number of forms, including, for example, an acquisition, investment or merger, for cash or in exchange for our equity securities, or a divestiture.
Evaluating potential transactions, including divestitures, requires additional expenditures (including legal, accounting and due diligence expenses, higher administrative costs to support the acquired entities, information technology, personnel and other integration expenses) and may divert the attention of our management from ordinary operating matters.
Our corporate development activities may present financial and operational risks, and may have adverse effects on existing business relationships with suppliers and customers. Future acquisitions also could result in potentially dilutive issuances of equity securities, the incurrence of debt, contingent liabilities and/or amortization expenses related to certain intangible assets and increased operating expenses, all of which could singly or collectively adversely affect our results of operations and financial condition.
We may be unable to integrate the Weetabix Group business successfully and realize the anticipated benefits of the acquisition.
The acquisition of Latimer Newco 2 Limited and all of Latimer’s direct and indirect subsidiaries at the time of acquisition, including Weetabix Limited (collectively, the “Weetabix Group”) involves the combination of two companies that have operated independently. We will be required to devote significant management attention and resources to integrating business practices, cultures and operations of each business, in particular, our Post Consumer Brands business and Weetabix NA’s business operations. Potential difficulties we may encounter as part of the integration process include the following:
• | the inability to successfully combine our business with that of the Weetabix Group in a manner that permits us to achieve the synergies and other benefits anticipated to result from the acquisition; |
• | the challenge of integrating complex systems, operating procedures, regulatory compliance programs, technology, networks and other assets of the Weetabix Group in a seamless manner that minimizes any adverse impact on customers, suppliers, employees and other constituencies; |
• | potential unknown liabilities, liabilities that are significantly larger than we currently anticipate and unforeseen increased expenses or delays associated with the acquisition, including cash costs to integrate the two businesses that may exceed the cash costs that we currently anticipate; and |
9
• | although the warranties regarding the business and operations of the Weetabix Group made by certain of the sellers who are members of the Weetabix Group’s management survive the closing and we have indemnification rights against these members of management in the event any of such warranties prove to have been inaccurate or breached, the liability of these members of management for such claims is capped at £2.2 million in the aggregate, and no portion of the purchase price for the transaction is held in escrow for the purpose of funding indemnification claims, so we may not be able to collect any damages we may incur for inaccuracies or breaches in warranties from these members of management after closing. |
Accordingly, the contemplated benefits of the Weetabix Group acquisition may not be realized fully, or at all, or may take longer to realize than expected.
We may experience difficulties in integrating acquired businesses, or acquisitions may not perform as expected.
We have acquired multiple businesses, and we may continue to acquire other businesses. The successful integration of these acquisitions depends on our ability to manage the operations and personnel of the acquired businesses. Integrating operations is complex and requires significant efforts and expenses on the part of both us and the acquired businesses. Potential difficulties we may encounter as part of the integration process include, but are not limited to, the following:
• | employees may voluntarily or involuntarily separate employment from us or the acquired businesses because of the acquisitions; |
• | our management may have its attention diverted while trying to integrate the acquired businesses; |
• | we may encounter obstacles when incorporating the acquired businesses into our operations and management, including integrating or separating personnel, financial systems, operating procedures, regulatory compliance programs, technology, networks and other assets in a seamless manner that minimizes any adverse impact on customers, suppliers, employees and other constituencies; |
• | differences in business backgrounds, corporate cultures and management philosophies; |
• | integration may be more costly or more time consuming and complex or less effective than anticipated; |
• | inability to maintain uniform standards, controls and procedures; and |
• | we may discover previously undetected operational or other issues, such as fraud. |
Any of these factors could adversely affect our and the acquired businesses’ ability to maintain relationships with customers, suppliers, employees and other constituencies.
In addition, the success of these acquired businesses will depend, in part, on our ability to realize the anticipated growth opportunities and cost synergies through the successful integration of the businesses we acquire with our existing businesses. Even if we are successful in integrating acquired businesses, we cannot assure you that these integrations will result in the realization of the full benefit of any anticipated growth opportunities or cost synergies or that these benefits will be realized within the expected time frames. In addition, acquired businesses may have unanticipated liabilities or contingencies.
Economic downturns could limit consumer demand for our products.
The willingness of consumers to purchase our products depends in part on general or local economic conditions. In periods of economic uncertainty, consumers may purchase less of our products and may forego certain purchases altogether. In those circumstances, we could experience a reduction in sales of our products. In addition, as a result of economic conditions or competitive actions, we may be unable to raise our prices sufficiently to protect profit margins. Any of these events could have an adverse effect on our results of operations.
Commodity price volatility and higher energy costs could negatively impact profits.
The primary commodities used by our businesses include wheat, oats, other grain products, vegetable oils, fruits, peanuts, almonds and other tree nuts, dairy and soy-based proteins, whey, cocoa, corn syrup and sugar. The supply and price of these ingredients are subject to market conditions and are influenced by many factors beyond our control, including weather patterns affecting ingredient production, governmental programs and regulations, insects, and plant diseases. Our primary packaging includes linerboard cartons, corrugated boxes, plastic containers, flexible and beverage packaging and cartonboard. In addition, our manufacturing operations use large quantities of natural gas, propane and electricity. The cost of such commodities may fluctuate widely, and we may experience shortages in commodity items as a result of commodity market fluctuations, availability, increased demand, weather conditions and natural disasters, as well as other factors outside of our control. Higher prices for natural gas, propane, electricity and fuel also may increase our production and delivery costs. Changes in the prices charged for our products may lag behind changes in our energy and commodity costs. Accordingly, changes in commodity or energy costs may limit our ability to maintain existing margins and have a material adverse effect on our operating profits. Competitive pressures often limit our ability to increase prices in response to higher input costs. If we fail to hedge and prices subsequently increase, or if we institute
10
a hedge and prices subsequently decrease, our costs may be greater than anticipated or greater than our competitors’ costs, and our financial results could be adversely affected.
Michael Foods’ operating results are significantly affected by egg, potato and cheese prices and the prices of corn and soybean meal, which are the primary grains fed to laying hens. Historically, the prices of these raw materials have fluctuated widely. In addition, Michael Foods’ cheese and butter products are affected by milk price supports established by the USDA. Although steps can be taken to mitigate the effects of changes in raw material costs, fluctuations in prices are outside of the control of the Michael Foods business, and changes in the price of such items may have a material adverse effect on the Michael Foods business, prospects, results of operations and financial condition. Certain supply and demand disruptions, such as those experienced with the 2015 avian influenza outbreak, could create an inability to keep selling prices in line with input costs and may result in significant fluctuations in operating profit margins.
Unsuccessful implementation of business strategies to reduce costs may adversely affect our results of operations.
Many of our costs, such as raw materials, energy and freight, are outside of our control. Therefore, we must seek to reduce costs in other areas, such as through operating efficiency. If we are not able to complete projects designed to reduce costs and increase operating efficiency on time or within budget, our operating profits may be adversely impacted. In addition, if the cost-saving initiatives we have implemented, or any future cost-saving initiatives, do not generate the expected cost savings and synergies, our results of operations may be adversely affected.
Our Active Nutrition and Michael Foods Group products are subject to a higher level of regulatory scrutiny, resulting in increased costs of operations and delays in product sales.
Our products and operations are subject to the laws and regulations of the FDA and/or the USDA, as well as other applicable laws and regulations. Some of our Active Nutrition products are regulated by the FDA as dietary supplements, which are subject to different FDA regulations and levels of regulatory scrutiny. Certain of Michael Foods’ egg products are subject to continuous on-site inspections by the USDA. It also is possible that federal, state or foreign enforcement authorities might take regulatory or enforcement action, which could result in significant fines or penalties. If we are found to be significantly out of compliance, the FDA could issue a warning letter and/or institute enforcement actions that could result in additional costs, substantial delays in production or even a temporary shutdown in manufacturing and product sales while the non-conformances are rectified. Also, we may have to recall products or otherwise remove product from the market, and temporarily cease its manufacture and distribution, which would increase our costs and reduce our revenues. Any product liability claims resulting from the failure to comply with applicable laws and regulations would be expensive to defend and could result in substantial damage awards against us or harm our reputation. Any of these events would negatively impact our revenues and costs of operations.
If our products become adulterated, misbranded or mislabeled or become contaminated, we might need to recall those items and may experience product liability claims if consumers are injured.
Selling food products and nutritional supplements involves a number of legal and other risks, including product contamination, spoilage, product tampering, allergens or other adulteration. Additionally, many of the raw materials used to make certain of our products, particularly eggs, raw potatoes, peanuts and tree nuts, are vulnerable to contamination by naturally occurring pathogens, such as salmonella. We may need to recall some or all of our products if they become adulterated, mislabeled or misbranded, whether caused by us or someone in our supply chain. A recall could result in destruction of product inventory, negative publicity, temporary plant closings, supply chain interruption, substantial costs of compliance or remediation, fines and increased scrutiny by federal, state and foreign regulatory agencies. Should consumption of any product cause injury, we may be liable for monetary damages as a result of a judgment against us. In addition, adverse publicity, including claims, whether or not valid, that our products or ingredients are unsafe or of poor quality, may discourage consumers from buying our products or cause production and delivery disruptions. Any of these events, including a significant product liability claim against us, could result in a loss of consumer confidence in our food products. Although we have various insurance programs in place, any of these events and/or a loss of consumer confidence could have an adverse effect on our financial condition, results of operations and/or cash flows.
Violations of laws or regulations, as well as new laws or regulations or changes to existing laws or regulations, could adversely affect our business.
The food industry is subject to a variety of federal, state and foreign laws and regulations, including food safety requirements related to the ingredients, manufacturing, processing, storage, marketing, advertising, labeling and distribution of our products as well as those related to worker health and workplace safety. Our activities, both inside and outside of the U.S., are subject to extensive regulation. In the U.S. we are regulated by, among other federal and state authorities, the FDA, the USDA, the Federal Trade Commission and the Occupational Safety and Health Administration. In Europe, we are regulated by, among other authorities, the United Kingdom’s Food Standards Agency, Health and Safety Executive, Environment Agency, Environmental Health Officers, Trading Standards Officers, and their equivalent in other European Union member states. We also are regulated by similar authorities elsewhere in the world. Governmental regulations also affect taxes and levies, healthcare costs, energy usage, immigration and labor issues, any or all of which may have a direct or indirect effect on our business or those of our customers or suppliers. In
11
addition, because we market and advertise our products, we could be the target of claims relating to alleged false or deceptive advertising under federal, state and foreign laws and regulations and may be subject to initiatives to limit or prohibit the marketing and advertising of our products to children. Changes in these laws or regulations or the introduction of new laws or regulations could increase the costs of doing business for us or our customers or suppliers, causing our results of operations to be adversely affected. As a specific example, some states have passed laws that mandate specific housing requirements for layer hens. Further, if we are found to be out of compliance with applicable laws and regulations in these areas, we could be subject to civil remedies, including fines, injunctions or recalls, as well as potential criminal sanctions, any or all of which could have a material adverse effect on our business.
U.S. tax reform, if enacted, could have an adverse impact on our future results of operations, profitability and financial condition. In addition, the United States government has initiated renegotiation of the North American Free Trade Agreement (“NAFTA”). Any changes to NAFTA could adversely impact our North American operations.
Our inability to raise prices may adversely affect our results of operations.
Our ability to raise prices for our products may be adversely affected by a number of factors, including but not limited to industry supply, market demand and promotional and other pricing activity by competitors. If we are unable to increase prices for our products as may be necessary to cover cost increases, our results of operations could be adversely affected. In addition, price increases typically generate lower sales volumes as customers purchase fewer units. If these losses are greater than expected or if we lose distribution as a result of a price increase, our results of operations could be adversely affected.
Loss of a significant customer may adversely affect our results of operations.
A limited number of customer accounts represents a large percentage of our consolidated net sales. Our largest customer, Walmart, accounted for approximately 13% of our net sales in fiscal 2017. Walmart is also the largest customer of our Post Consumer Brands segment, accounting for approximately 29% of Post Consumer Brands’ net sales in fiscal 2017. Additionally, the largest customers of our Michael Foods Group segment, Sysco and US Foods, accounted for approximately 27% of its net sales in fiscal 2017, and the largest customers of our Active Nutrition segment, Costco and Sam’s Club, accounted for approximately 57% of the Active Nutrition segment’s net sales in fiscal 2017. The largest customers of our Private Brands segment, Whole Foods and Aldi, accounted for approximately 26% of Private Brands’ net sales in fiscal 2017. The largest customers of our Weetabix segment, Tesco and Asda, accounted for approximately 32% of Weetabix’s net sales in fiscal 2017.
The success of our businesses depends, in part, on our ability to maintain our level of sales and product distribution through high-volume food distributors, retailers, super centers and mass merchandisers. The competition to supply products to these high-volume stores is intense. Currently, we do not have long-term supply agreements with a substantial number of our retail customers, including our largest customers. These high-volume stores and mass merchandisers frequently reevaluate the products they carry. A decision by our major customers to decrease the amount of merchandise purchased from us, sell a national brand on an exclusive basis or change the manner of doing business with us could reduce our revenues and materially adversely affect our results of operations. In addition, our customers offer branded and private label products that compete directly with our products for retail shelf space and consumer purchases. Accordingly, there is a risk that our customers may give higher priority to their own products or to the products of our competitors. In the event of a loss of any of our large customers, or the bankruptcy or serious financial difficulty of any of our large customers, our sales may be adversely affected.
Consolidation among the retail grocery and foodservice industries may hurt profit margins.
Over the past several years, the retail grocery and foodservice industries have undergone significant consolidations and mass merchandisers and non-traditional grocers are gaining market share. As this trend continues and such customers grow larger, they may seek to use their position to improve their profitability through improved efficiency, lower pricing, increased reliance on their own brand name products, increased emphasis on generic and other value brands and increased promotional programs. If we are unable to respond to these requirements, our profitability or volume growth could be negatively impacted. Additionally, if the surviving entity is not a customer, we may lose significant business once held with the acquired retailer.
Our Post Consumer Brands and Weetabix segments operate in the mature RTE cereal category, and the failure or weakening of this category could materially adversely affect our financial results.
Our Post Consumer Brands and Weetabix segments together produce and distribute branded, licensed and private label RTE cereal and hot cereals, other cereal-based food products and muesli, selling products to grocery stores, discounters, big box retailers, foodservice distributors, wholesalers and convenience stores across the United States, Puerto Rico, Canada, Mexico, the United Kingdom, Ireland and the rest of the world. The RTE cereal category has experienced weakness in recent years, and we expect this trend may continue. Although we expect to achieve synergies in connection with our acquisition of the Weetabix Group, continuing weakness in the RTE cereal category, or the weakening of our major products competing in this category, could have a material adverse impact on our business.
12
Our private label products may not be able to compete successfully with nationally branded products.
Our Private Brands segment, and several of our other segments, produce and distribute private label products. In many cases, competitors with nationally branded products have a competitive advantage over private label products due to name recognition. In addition, when branded competitors focus on price and promotion, the environment for private label producers becomes more challenging because the price differential between private label products and branded products may become less significant. Competitive pressures or promotions of branded products could cause us to lose sales, which may require us to lower prices or increase the use of our own discounting or promotional programs, each of which would adversely affect our margins and could result in a decrease in our operating results and profitability.
Disruption of our supply chain and changes in weather conditions could have an adverse effect on our business, financial condition and results of operations.
In coordination with our suppliers, business partners and contract manufacturers, our ability to make, move and sell products is critical to our success. Damage or disruption to our collective manufacturing or distribution capabilities resulting from weather, any potential effects of climate change, natural disaster, disease, fire, explosion, terrorism, pandemics, strikes, repairs or enhancements at our facilities, or other reasons, could impair our ability to manufacture or sell our products.
Changes in weather conditions and natural disasters, such as floods, droughts, frosts, earthquakes, hurricanes, tornadoes, fires or pestilence, also may affect the cost and supply of commodities and raw materials, including grains, eggs, potatoes, tree nuts, corn syrup and sugar. Additionally, these events can result in reduced supplies of raw materials and lower recoveries of usable raw materials. Competing manufacturers can be affected differently by weather conditions and natural disasters depending on the location of their suppliers and operations. Failure to take adequate steps to reduce the likelihood or mitigate the potential impact of such events, or to effectively manage such events if they occur, particularly when a product is sourced from a single location, could adversely affect our business and results of operations, and/or require additional resources to restore our supply chain.
We are currently dependent on third party manufacturers to manufacture many products for our business. Our business could suffer as a result of a third party manufacturer’s inability to produce our products for us on time and to our specifications.
Our business relies on independent third parties for the manufacture of many products, such as protein bars, shakes and powders, breakfast drinks and certain cereal and granola products. Our business could be materially affected if we fail to develop or maintain our relationships with these third parties, if these third parties fail to comply with governmental regulations applicable to the manufacturing of our products, or if any of these third parties ceases doing business with us or goes out of business. Additionally, we cannot be certain that we will not experience operational difficulties with these third party manufacturers, such as increases in manufacturing costs, reductions in the availability of production capacity, errors in complying with merchandise specifications, insufficient quality control and failure to meet production deadlines. The inability of a third party manufacturer to ship orders in a timely manner, in desirable quantities or to meet our safety, quality and social compliance standards or regulatory requirements could have a material adverse impact on our business.
Termination of our material licenses would have a material adverse effect on our business.
We market certain of our products in the United States, Canada, the United Kingdom and several other locations pursuant to intellectual property license agreements. These licenses give us the right to use certain names, characters and logos in connection with our products and to sell the products in certain regions. If we were to breach any material term of these license agreements and not timely cure the breach, the licensor could terminate the agreement. If the licensor were to terminate our rights to use the names, characters and logos for this reason or any other reason, the loss of such rights could have a material adverse effect on our business.
Pending and future litigation may lead us to incur significant costs.
We are, or may become, party to various lawsuits and claims arising in the normal course of business, which may include lawsuits or claims relating to contracts, intellectual property, product recalls, product liability, false or deceptive advertising, employment matters, environmental matters or other aspects of our business. In addition, we may be required to pay damage awards or settlements or become subject to injunctions or other equitable remedies, which could have a material adverse effect on our financial position, cash flows or results of operations. The outcome of litigation is often difficult to predict, and the outcome of pending or future litigation may have a material adverse effect on our financial position, cash flows or results of operations.
Although we have various insurance programs in place, the potential liabilities associated with these litigation matters, or those that could arise in the future, could be excluded from coverage or, if covered, could exceed the coverage provided by such programs. In addition, insurance carriers may seek to rescind or deny coverage with respect to pending or future claims or lawsuits. If we do not have sufficient coverage under our policies, or if coverage is denied, we may be required to make material payments to settle litigation or satisfy any judgment. Any of these consequences could have a material adverse effect on our business, financial condition and results of operations.
13
Our international operations subject us to additional risks.
As a result of various acquisitions, we now have larger operations outside of the U.S. We are accordingly subject to a number of risks related to doing business internationally, any of which could significantly harm our business. These risks include:
• | restriction on the transfer of funds to and from foreign countries, including potentially negative tax consequences; |
• | foreign exchange controls and currency exchange rates; |
• | increased exposure to general market and economic conditions outside of the U.S.; |
• | political uncertainty and volatility; |
• | compliance with anti-corruption regulations (including the U.S. Foreign Corrupt Practices Act and the U.K. Bribery Act); |
• | data security; and |
• | unfavorable and/or changing foreign tax treaties and policies. |
Our financial performance on a U.S. dollar denominated basis is subject to fluctuations in currency exchange rates. Our principal exposure is to the British pound sterling, the Canadian dollar and the Euro.
Global capital and credit market issues could negatively affect our liquidity, increase our costs of borrowing and disrupt the operations of our suppliers and customers.
U.S. and global credit markets have, from time to time, experienced significant dislocations and liquidity disruptions which caused the spreads on prospective debt financings to widen considerably. These circumstances materially impacted liquidity in the debt markets, making financing terms for borrowers less attractive and in certain cases resulted in the unavailability of certain types of debt financing. Events affecting the credit markets also have had an adverse effect on other financial markets in the U.S., which may make it more difficult or costly for us to raise capital through the issuance of common stock or other equity securities or refinance our existing debt, sell our assets or borrow more money if necessary. Our business also could be negatively impacted if our suppliers or customers experience disruptions resulting from tighter capital and credit markets or a slowdown in the general economy. Any of these risks could impair our ability to fund our operations or limit our ability to expand our business or increase our interest expense, which could have a material adverse effect on our financial results.
Changing currency exchange rates may adversely affect our earnings and financial position.
We have operations and assets in the U.S. as well as foreign jurisdictions, and a portion of our contracts and revenues are denominated in foreign currencies. Our consolidated financial statements are presented in U.S. dollars. We therefore must translate our foreign assets, liabilities, revenue and expenses into U.S. dollars at applicable exchange rates. Consequently, fluctuations in the value of foreign currencies relative to the U.S. dollar may negatively affect the value of these items in our consolidated financial statements. To the extent we fail to manage our foreign currency exposure adequately, we may suffer losses in value of our net foreign currency investment, and our consolidated results of operations and financial position may be negatively affected.
The uncertainty surrounding the implementation and effect of Brexit may cause increased economic volatility, affecting our operations and business.
The results of the referendum relating to the membership of the United Kingdom in the European Union, advising for the exit of the United Kingdom from the European Union (“Brexit”), may cause disruptions to and create uncertainty surrounding our business, including affecting our relationships with our existing and future customers, suppliers and employees. The effects of Brexit will depend on any agreements the United Kingdom makes to retain access to European Union markets either during a transitional period or more permanently. The measures could potentially disrupt the markets we serve and may cause us to lose customers, suppliers and employees. In addition, Brexit could lead to legal uncertainty and potentially divergent national laws and regulations as the United Kingdom determines which European Union laws to replace or replicate.
These developments may have a material adverse effect on global economic conditions and the stability of global financial markets, and may significantly reduce global market liquidity and restrict the ability of key market participants to operate in certain financial markets. Any of these factors could depress economic activity and restrict our access to capital, which could have a material adverse effect on our business, financial condition and results of operations.
Impairment in the carrying value of intangible assets could negatively impact our net worth. If our goodwill, other intangible assets or other long-term assets become impaired, we will be required to record additional impairment charges, which may be significant.
Our balance sheet includes a significant amount of intangible assets, including goodwill, trademarks, trade names and other acquired intangibles. Intangibles and goodwill expected to contribute indefinitely to our cash flows are not amortized, but our management reviews them for impairment on an annual basis or whenever events or changes in circumstances indicate that their carrying value may be impaired. Impairments to intangible assets may be caused by factors outside of our control, such as increasing
14
competitive pricing pressures, lower than expected revenue and profit growth rates, changes in industry EBITDA and revenue multiples, changes in discount rates based on changes in cost of capital (interest rates, etc.) or the bankruptcy of a significant customer. These factors, along with other internal and external factors, could negatively impact our net worth and could have a significant impact on our fair value determination, which could then result in a material impairment charge in our results of operations. In fiscal 2017, we had an impairment of goodwill and no impairment of intangible assets. In fiscal 2016, we had no impairments of goodwill or intangible assets. During fiscal 2015, we had an impairment of both goodwill and trademark intangible assets. We could have additional impairments in the future. See further discussion of these impairments in MD&A and Notes 2 and 6 of “Notes to Consolidated Financial Statements” contained in this report.
Unusual agricultural diseases (such as avian influenza) and/or pests could harm our business.
Many of our business activities are subject to a variety of agricultural risks, including disease and pests, which can adversely affect the quality and quantity of the raw materials we use, as well as the food products we produce and distribute. Any actual or potential contamination of our products could result in product recalls, market withdrawals, safety alerts, cessation of manufacturing and/or distribution or, if we fail to comply with applicable FDA, USDA or other regulatory authority requirements, enforcement actions. We also could be subject to product liability claims or adverse publicity if any of our products are alleged to have caused illness or injury.
Avian influenza occasionally affects the domestic poultry industry, leading to hen deaths. In 2015, an avian influenza outbreak occurred in the midwest of the United States affecting a substantial portion of our Michael Foods Group’s owned and third party contracted flocks. Although we utilize biosecurity measures at our layer locations to protect against disease exposures, if our facilities are exposed to diseases and pests, such exposure could affect a substantial portion of our production facilities in any year and could have a material adverse effect on our business, prospects, results of operations and financial condition.
We may not be able to operate successfully if we lose key personnel, are unable to hire qualified additional personnel or experience turnover of our management team.
We are highly dependent on our ability to attract and retain qualified personnel to operate and expand our business. If we lose one or more members of our senior management team, or if we fail to attract new employees, our business and financial position, results of operations or cash flows could be harmed.
Labor strikes or work stoppages by our employees could harm our business.
Some of our full-time production and maintenance employees are covered by collective bargaining agreements. A dispute with a union or employees represented by a union could result in production interruptions caused by work stoppages. If a strike or work stoppage were to occur, our results of operations could be adversely affected. In addition, we could be subject to unionization efforts at our non-union facilities. Increased unionization of our workforce could lead to disruptions in our business, increases in our operating costs and/or constraints on our operating flexibility.
In the event of a work stoppage, we have contingency plans in place to manufacture products in other locations to mitigate disruption to the business. However, there are limitations inherent in any plan to mitigate disruption to our business in the event of a work stoppage and, particularly in the case of a prolonged work stoppage, there can be no assurance that it would not have a material adverse effect on our results of operations.
We may experience losses or be subject to increased funding and expenses to our qualified pension and other post-retirement plans, which could negatively impact profits.
We maintain qualified defined benefit plans in the United States, Canada and the United Kingdom primarily for our Post Consumer Brands and Weetabix businesses, and we are obligated to ensure that these plans are funded or paid in accordance with applicable regulations. In the event the assets in which we invest do not perform according to expectations, or the valuation of the projected benefit obligation increases due to changes in interest rates or other factors, we may be required to make significant cash contributions to these plans and recognize increased expense on our financial statements.
Increases in costs of medical and other employee health and welfare benefits may reduce our profitability.
With approximately 11,410 employees, our profitability is substantially affected by costs of medical and other health and welfare benefits for these employees as well as certain former employees. These costs can vary substantially as a result of changes in health care laws, costs and experience. These factors may increase the cost of providing medical and other employee health and welfare benefits. We can provide no assurance that we will succeed in limiting future cost increases. If we do not succeed, our profitability could be negatively affected.
Technology failures and corruption of our data privacy protections could disrupt our operations and negatively impact our business.
We rely on information technology networks and systems to process, transmit and store electronic and financial information, to manage and support a variety of business processes and activities, and to comply with regulatory, legal and tax requirements.
15
For example, our production and distribution facilities and inventory management utilize information technology to increase efficiencies and limit costs. Furthermore, a significant portion of the communications between our personnel, customers and suppliers depends on information technology. Some of our information technology needs are outsourced to third parties. Our and our third party vendors’ information technology systems may be vulnerable to a variety of interruptions due to events beyond our or their control, including, but not limited to, natural disasters, terrorist attacks, telecommunications failures, computer viruses, hackers and other security issues. Such interruptions could negatively impact our business.
If we do not allocate and effectively manage the resources necessary to build and sustain the proper technology infrastructure and to maintain and protect the related automated and manual control processes, or if one of our third party service providers fails to provide the services we require, we could be subject to billing and collection errors, business disruptions or damage resulting from security breaches. If any of our significant information technology systems suffers severe damage, disruption or shutdown, and our business continuity plans do not effectively resolve the issues in a timely manner, our product sales, financial condition and results of operations may be materially and adversely affected, and we could experience delays in reporting our financial results. In addition, there is a risk of business interruption, litigation and reputational damage from leaks of confidential or personal information. Although we have not detected a material security breach to date, we have been the target of events of this nature and expect them to continue.
We also are subject to an evolving body of federal, state and foreign laws, regulations, guidelines and principles regarding data privacy and security. A data breach or inability on our part to comply with such laws, regulations, guidelines and principles, or to quickly adapt our practices to reflect them as they develop, could potentially subject us to significant liabilities and reputational harm. Several foreign governments, including the European Union, have regulations dealing with the collection and use of personal information obtained from their citizens, and we cannot assure you that we, our business partners or third parties engaged by us will successfully comply with such laws.
Our intellectual property rights are valuable and any inability to protect them could reduce the value of our products and brands.
We consider our intellectual property rights, particularly our trademarks, but also our patents, trade secrets, copyrights and licenses, to be a significant and valuable asset of our business. We attempt to protect our intellectual property rights through a combination of patent, trademark, copyright and trade secret laws, as well as licensing agreements, third party nondisclosure and assignment agreements and the policing of third party misuses of our intellectual property. Our failure to obtain or maintain adequate protection of our intellectual property rights, or any change in law or other changes that serve to lessen or remove the current legal protections of intellectual property, may diminish our competitiveness and could materially harm our business.
We face the risk of claims that we have infringed third parties’ intellectual property rights. Any claims of intellectual property infringement, even those without merit, could be expensive and time consuming to defend; cause us to cease making, licensing or using products that incorporate the challenged intellectual property; require us to redesign or rebrand our products or packaging, if feasible; divert management’s attention and resources; or require us to enter into royalty or licensing agreements in order to obtain the right to use a third party’s intellectual property. Any royalty or licensing agreements, if required, may not be available to us on acceptable terms or at all. Additionally, a successful claim of infringement against us could result in our being required to pay significant damages, enter into costly license or royalty agreements or stop the sale of certain products, any or all of which could have a negative impact on our operating profits and harm our future prospects.
Media campaigns related to food production and the use or misuse of social media may have an adverse effect on our business and financial results.
Media outlets, including new social media platforms, provide the opportunity for individuals or organizations to publicize inappropriate or inaccurate stories or perceptions about us or the food industry. Such practices have the ability to cause damage to our brands, the industry generally, or consumers’ perceptions of us or the food production industry and may result in negative publicity and adversely affect our financial results. In addition, our competitors are increasingly using social media networks to advertise products. If we are unable to compete in this environment, it could adversely affect our financial results.
We are subject to environmental laws and regulations that can impose significant costs and expose us to potential financial liabilities.
We are subject to extensive federal, state, local and foreign laws and regulations relating to the protection of human health and the environment, including those limiting the discharge and release of pollutants into the environment and those regulating the transport, storage, disposal and remediation of, and exposure to, solid and hazardous wastes. In addition, our Michael Foods business is subject to particular federal and state requirements governing animal feeding operations and the management of animal waste. Certain environmental laws and regulations can impose joint and several liability without regard to fault on responsible parties, including past and present owners and operators of sites, related to cleaning up sites at which hazardous materials were disposed of or released. Failure to comply with environmental laws and regulations could result in severe fines and penalties by governments or courts of law. In addition, future laws may more stringently regulate the emission of greenhouse gases, particularly carbon dioxide
16
and methane. We cannot predict the impact that such regulation may have, or that climate change may otherwise have, on our business.
Future events, such as new or more stringent environmental laws and regulations, new environmental claims, the discovery of currently unknown environmental conditions requiring response action or more vigorous interpretations or enforcement of existing environmental laws and regulations, might require us to incur additional costs that could have a material adverse effect on our financial results.
Climate change, or legal or market measures to address climate change, may negatively affect our business and operations.
There is growing concern that carbon dioxide and other greenhouse gases in the atmosphere may have an adverse impact on global temperatures, weather patterns, and the frequency and severity of extreme weather and natural disasters. If any of these climate changes has a negative effect on agricultural productivity, we may be subject to decreased availability or less favorable pricing for certain commodities that are necessary for our products, such as wheat, oats and other grain products. The increasing concern over climate change also may result in more federal, state, local and/or foreign legal requirements to reduce or mitigate the effects of greenhouse gases. In the event that such laws are enacted, we may experience significant increases in our costs of operation and delivery. As a result, climate change could negatively affect our business and operations.
Our actual operating results may differ significantly from our guidance.
From time to time, we release guidance regarding our future performance or the expected future performance of companies or businesses that we have agreed to acquire. This guidance, which consists of forward-looking statements, is prepared by our management and is qualified by, and subject to, the assumptions and the other information contained or referred to in such release and the factors described under “Forward-Looking Statements” in our current and periodic reports filed with the SEC. Our guidance is not prepared with a view toward compliance with published guidelines of the American Institute of Certified Public Accountants, and neither our independent registered public accounting firm nor any other independent expert or outside party compiles or examines the guidance and, accordingly, no such person expresses any opinion or any other form of assurance with respect thereto.
Guidance is based upon a number of assumptions and estimates that, although presented with numerical specificity, are inherently subject to business, economic and competitive uncertainties and contingencies, many of which are beyond our control and are based upon specific assumptions with respect to future business decisions, some of which will change. We generally state possible outcomes as high and low ranges which are intended to provide a sensitivity analysis as variables are changed but are not intended to represent that actual results could not fall outside of the suggested ranges. The principal reason that we release this data is to provide a basis for our management to discuss our business outlook with analysts and investors. We do not accept any responsibility for any projections or reports published by any such persons.
Guidance is necessarily speculative in nature, and it can be expected that some or all of the assumptions of the guidance furnished by us will not materialize or will vary significantly from actual results. Accordingly, our guidance is only an estimate of what management believes is realizable as of the date of release. Actual results will vary from the guidance. Investors also should recognize that the reliability of any forecasted financial data diminishes the farther in the future that the data is forecast. In light of the foregoing, investors are urged to put the guidance in context and not to place undue reliance on it.
Any failure to successfully implement our operating strategy or the occurrence of any of the events or circumstances set forth in this report could result in actual operating results being different than the guidance, and such differences may be adverse and material.
If we are unable to continue to satisfy the requirements of Section 404 of the Sarbanes-Oxley Act of 2002, or our internal control over financial reporting is not effective, the reliability of our financial statements may be questioned, and our stock price may suffer.
Section 404 of the Sarbanes-Oxley Act of 2002 (“SOX”) requires any company subject to the reporting requirements of the U.S. securities laws to perform a comprehensive evaluation of its and its consolidated subsidiaries’ internal control over financial reporting. To comply with this statute, we are required to document and test our internal control procedures, our management is required to assess and issue a report concerning our internal control over financial reporting, and our independent registered public accounting firm is required to issue an opinion on its audit of our internal control over financial reporting.
The rules governing the standards that must be met for management to assess our internal control over financial reporting are complex and require significant documentation, testing and possible remediation to meet the detailed standards under the rules. During the course of its testing, our management may identify material weaknesses or significant deficiencies which may not be remedied in time to meet the annual deadline imposed by SOX. If our management cannot favorably assess the effectiveness of our internal control over financial reporting or our independent registered public accounting firm identifies material weaknesses in our internal controls, investor confidence in our financial results may weaken, and our stock price may consequently suffer. As of September 30, 2017, management determined that our internal control over financial reporting was effective.
17
We have recently acquired a company that was not subject to SOX regulations and, therefore, it may lack the internal controls of a U.S. public company, which could ultimately affect our ability to ensure compliance with the requirements of Section 404 of SOX.
We have recently acquired a company that was not previously subject to SOX regulations and accordingly was not required to establish and maintain an internal control infrastructure meeting the standards promulgated under SOX. Our assessment of and conclusion on the effectiveness of our internal control over financial reporting as of September 30, 2017 did not include the internal controls of the Weetabix Group, which was acquired during our fiscal year ended September 30, 2017 and will be included in our assessment of and conclusion on the effectiveness of our internal control over financial reporting for the fiscal year ending September 30, 2018.
Although our management will continue to review and evaluate the effectiveness of our internal controls in light of this acquisition, we cannot provide any assurances that there will be no significant deficiencies or material weaknesses in our internal control over financial reporting. Any significant deficiencies or material weaknesses in the internal control structure of our acquired businesses may cause significant deficiencies or material weaknesses in our internal control over financial reporting, which could have a material adverse effect on our business and our ability to comply with Section 404 of SOX.
Actions of shareholders could cause us to incur substantial costs, divert management’s attention and resources, and have an adverse effect on our business.
From time to time, we may be subject to proposals and other requests from shareholders urging us to take certain corporate actions, including proposals seeking to influence our corporate policies or effecting a change in our management. In the event of such shareholder proposals, particularly with respect to matters which our management and Board of Directors, in exercising their fiduciary duties, disagree with or have determined not to pursue, our business could be adversely affected because responding to actions and requests of shareholders can be costly and time-consuming, disrupting our operations and diverting the attention of management and our employees. Additionally, perceived uncertainties as to our future direction may result in the loss of potential business opportunities and may make it more difficult to attract and retain qualified personnel, business partners and customers.
Risks Related to the Bob Evans Acquisition
Our pending acquisition of Bob Evans is subject to the satisfaction of certain conditions, including the approval of Bob Evans’s stockholders, and may not be consummated, and if not consummated under certain circumstances, we may be subject to monetary or other damages under the merger agreement.
On September 19, 2017, we announced that we had entered into a definitive merger agreement to acquire Bob Evans. Completion of this acquisition is subject to certain conditions, including the approval of Bob Evans’s stockholders and the expiration of any waiting periods under the Hart-Scott-Rodino Antitrust Improvements Act of 1976 (the “HSR Act”). Our obligation to complete the acquisition is also subject to certain additional customary conditions, including, subject to specific standards, the accuracy of Bob Evans’s representations and warranties, performance in all material respects by Bob Evans of its obligations under the merger agreement and the absence of any “Company Material Adverse Effect” (as defined in the merger agreement) with respect to Bob Evans since the date of the merger agreement. Completion of the acquisition is not subject to a vote of our shareholders.
The Bob Evans acquisition is expected to be completed in the first calendar quarter of 2018, the second quarter of our fiscal year 2018. There can be no assurance, however, that all of the closing conditions for the acquisition will be satisfied and, if they are satisfied, that they will be satisfied in time for the closing to occur during the period noted above. In addition, stockholders of Bob Evans have brought litigation against Bob Evans and us in connection with the acquisition. Shareholder litigation has the potential to delay the timing or occurrence of the acquisition. The merger agreement contains certain termination rights, including that either we or Bob Evans may terminate the merger agreement if (i) the acquisition is not completed on or prior to September 18, 2018, subject to extension for an additional three-month period for the purpose of obtaining regulatory approvals and/or addressing certain impediments to the acquisition, (ii) a governmental entity has issued an order or taken any other action permanently restraining, enjoining or otherwise prohibiting the acquisition and such order or other action has become final and non-appealable or (iii) the acquisition is not approved by the stockholders of Bob Evans at its stockholders’ meeting.
Our ability to obtain any financing to fund a portion of the purchase price is not a condition to closing under the merger agreement. However, if we are unable to obtain sufficient financing or experience a significant diminution of our existing cash and cash equivalents or other sources of capital, and as a result we do not have sufficient funds to complete the acquisition of Bob Evans, we may be subject to monetary or other damages under the merger agreement as a result of our failure to complete the acquisition.
We may be unable to obtain the regulatory clearances required to complete the Bob Evans acquisition or, in order to do so, we or Bob Evans may be required to comply with material restrictions or satisfy material conditions.
The Bob Evans acquisition is subject to review by the U.S. Department of Justice and the Federal Trade Commission under the HSR Act. The closing of the acquisition is subject to the condition that the applicable waiting period, and any applicable
18
extensions thereof, under the HSR Act have expired or been duly terminated. We cannot provide any assurance that all required HSR Act clearances will be obtained. There can be no assurance as to the cost, scope or impact of the actions that may be required to obtain antitrust approval. In addition, the merger agreement provides that we are not required to commit to dispositions of assets in order to obtain regulatory clearance. If we determine to take such actions in order to close the acquisition, it could be detrimental to the combined organization following the consummation of the acquisition. Furthermore, these actions could have the effect of delaying or preventing completion of the proposed acquisition or imposing additional costs on or limiting the revenues or cash of the combined organization following the consummation of the acquisition. However, if clearance under the HSR Act is not obtained and the merger agreement is terminated under specified circumstances, we could be liable to Bob Evans for a reverse termination fee of $50.0 million.
Even if the parties receive early termination of the statutory waiting period under the HSR Act or the waiting period required expires, the Department of Justice, the Federal Trade Commission, or other regulatory authorities could take action under the antitrust laws to prevent or rescind the acquisition, require the divestiture of assets or seek other remedies. Additionally, state attorneys general could seek to block or challenge the Bob Evans acquisition as they deem necessary or desirable in the public interest at any time, including after completion of the transaction. In addition, in some circumstances, a third party could initiate a private action under antitrust laws challenging or seeking to enjoin the merger, before or after it is completed. We may not prevail and may incur significant costs in defending or settling any action under the antitrust laws.
We may be unable to integrate the Bob Evans business successfully and realize the anticipated benefits of the acquisition.
The pending acquisition of Bob Evans involves the combination of two companies that have operated independently. We will be required to devote significant management attention and resources to integrating business practices, cultures and operations of each business. The reorganization of the structure of our Michael Foods business and Bob Evans to combine the refrigerated retail businesses of Michael Foods and Bob Evans as a single operating unit and the commercial foodservice businesses of Michael Foods and Bob Evans as a separate single operating unit will be particularly complex. Potential difficulties we may encounter as part of the integration process include the following:
• | the inability to successfully combine our business with that of Bob Evans in a manner that permits us to achieve the synergies and other benefits anticipated to result from the acquisition; |
• | the challenge of integrating complex systems, operating procedures, regulatory compliance programs, technology, networks and other assets of Bob Evans in a seamless manner that minimizes any adverse impact on customers, suppliers, employees and other constituencies; |
• | potential unknown liabilities, liabilities that are significantly larger than we currently anticipate and unforeseen increased expenses or delays associated with the acquisition, including cash costs to integrate the two businesses that may exceed the cash costs that we currently anticipate; and |
• | we have no post-closing indemnification or similar rights under the merger agreement we entered into with Bob Evans with respect to the representations and warranties Bob Evans made in the merger agreement with respect to its business, so we will have no recourse against Bob Evans’s management or stockholders in the event any of the representations or warranties made by Bob Evans in the merger agreement prove to be inaccurate or are breached. |
Accordingly, the contemplated benefits of the pending Bob Evans acquisition may not be realized fully, or at all, or may take longer to realize than expected.
Failure to complete the Bob Evans acquisition could impact our stock price and our future business and financial results.
If the acquisition of Bob Evans is not completed, our ongoing business and financial results may be adversely affected and we will be subject to a number of risks, including the following:
• | depending on the reasons for the failure to complete the Bob Evans acquisition, we could be liable to Bob Evans for monetary or other damages in connection with the termination or breach of the merger agreement, including a reverse termination fee of $50.0 million; |
• | we have dedicated significant time and resources, financial and otherwise, in planning for the acquisition and the associated integration, of which we would lose the benefit if the acquisition is not completed; |
• | we are responsible for certain transaction costs relating to the Bob Evans acquisition, whether or not the acquisition is completed; |
• | while the merger agreement is in force, we are subject to certain restrictions on the conduct of our business, including our ability to make any other significant acquisition which would reasonably be expected to prevent or delay, or otherwise materially increase the risk of preventing or delaying, the consummation of the Bob Evans acquisition, which restrictions may adversely affect our ability to execute certain of our business strategies; and |
19
• | matters relating to the acquisition (including integration planning) may require substantial commitments of time and resources by our management, whether or not the acquisition is completed, which could otherwise have been devoted to other opportunities that may have been beneficial to us. |
In addition, if the Bob Evans acquisition is not completed, we may experience negative reactions from the financial markets and from our customers and employees. We also may be subject to litigation related to any failure to complete the acquisition or to enforcement proceedings commenced against us to perform our obligations under the merger agreement. If the acquisition is not completed, these risks may materialize and may adversely affect our business, financial results and financial condition, as well as the price of our common stock.
Risks Related to our Indebtedness
We have substantial debt and high leverage, which could have a negative impact on our financing options and liquidity position and which could adversely affect our business.
We have a significant amount of debt. We had $7,212.2 million in aggregate principal amount of total debt as of September 30, 2017. Additionally, our secured revolving credit facility has borrowing capacity of $790.0 million at September 30, 2017 (all of which would be secured when drawn).
Our overall leverage and the terms of our financing arrangements could:
• | limit our ability to obtain additional financing in the future for working capital, capital expenditures, acquisitions, to fund growth or for general corporate purposes, even when necessary to maintain adequate liquidity, particularly if any ratings assigned to our debt securities by rating organizations were revised downward; |
• | make it more difficult for us to satisfy our obligations under the terms of our financing arrangements; |
• | limit our ability to refinance our indebtedness on terms acceptable to us or at all; |
• | limit our flexibility to plan for and to adjust to changing business and market conditions in the industries in which we operate and increase our vulnerability to general adverse economic and industry conditions; |
• | require us to dedicate a substantial portion of our cash flow from operations to make interest and principal payments on our debt, thereby limiting the availability of our cash flow to fund future investments, capital expenditures, working capital, business activities and other general corporate requirements; |
• | increase our vulnerability to adverse economic or industry conditions; and |
• | subject us to higher levels of indebtedness than our competitors, which may cause a competitive disadvantage and may reduce our flexibility in responding to increased competition. |
Our ability to meet expenses and debt service obligations will depend on our future performance, which will be affected by financial, business, economic and other factors, including potential changes in consumer preferences, the success of product and marketing innovation and pressure from competitors. If we do not generate enough cash to pay our debt service obligations, we may be required to refinance all or part of our existing debt, sell assets, borrow more money or raise additional equity.
Despite our current level of indebtedness, we may be able to incur substantially more debt, which could further exacerbate the risks described above.
We may be able to incur significant additional indebtedness in the future. Although the financing arrangements governing our indebtedness contain restrictions on our ability to incur additional indebtedness, these restrictions are subject to a number of qualifications and exceptions, and the additional indebtedness incurred in compliance with these restrictions could be substantial. These restrictions also will not prevent us from incurring obligations that do not constitute indebtedness, as defined in the documents governing our indebtedness.
The agreements governing our debt, including the indentures governing our senior notes, contain, or may in future financings contain, various covenants that limit our ability to take certain actions and also require us to meet financial maintenance tests, and failure to comply with these covenants could have a material adverse effect on us.
Our financing arrangements contain restrictions, covenants and events of default that, among other things, require us to satisfy certain financial tests and maintain certain financial ratios and restrict our ability to incur additional indebtedness and to refinance our existing indebtedness. Financing arrangements which we enter into in the future could contain similar restrictions and could additionally require us to comply with similar, new or additional financial tests or to maintain similar, new or additional financial ratios. The terms of our financing arrangements, financing arrangements which we enter into in the future and any future indebtedness may impose various restrictions and covenants on us that could limit our ability to pay dividends, respond to market conditions, provide for capital investment needs or take advantage of business opportunities by limiting the amount of additional borrowings
20
we may incur. These restrictions include compliance with, or maintenance of, certain financial tests and ratios and may limit or prohibit our ability to, among other things:
• | borrow money or guarantee debt; |
• | create liens; |
• | pay dividends on or redeem or repurchase stock or other securities; |
• | make investments and acquisitions; |
• | enter into or permit to exist contractual limits on the ability of our subsidiaries to pay dividends to us; |
• | enter into new lines of business; |
• | enter into transactions with affiliates; and |
• | sell assets or merge with other companies. |
Various risks, uncertainties and events beyond our control could affect our ability to comply with these restrictions and covenants. Failure to comply with any of the restrictions and covenants in our existing or future financing arrangements could result in a default under those arrangements and under other arrangements containing cross-default provisions.
Our credit agreement contains customary financial covenants, including a covenant requiring us to maintain a senior secured leverage ratio not to exceed 4.25 to 1.00, measured as of the last day of any fiscal quarter if, as of the last day of such fiscal quarter, the aggregate outstanding amount of all revolving credit loans, swing line loans and letter of credit obligations (subject to certain exceptions specified in the credit agreement) exceeds 30% of our revolving credit commitments. Our credit agreement permits us, subject to certain exceptions, to incur additional unsecured debt only if, among other conditions, our consolidated interest coverage ratio, calculated as provided in our credit agreement, would be greater than or equal to 2.00 to 1.00 after giving effect to such new debt. The indentures that govern our senior notes contain a similar restriction.
A default would permit lenders to accelerate the maturity of the debt under these arrangements and to foreclose upon any collateral securing the debt. Under these circumstances, we might not have sufficient funds or other resources to satisfy all of our obligations, including our obligations under our indentures, credit agreement and convertible preferred stock. In addition, the limitations imposed by financing agreements on our ability to incur additional debt and to take other actions might significantly impair our ability to obtain other financing.
To service our indebtedness and other cash needs, we will require a significant amount of cash. Our ability to generate cash depends on many factors beyond our control.
Our ability to pay interest on our outstanding senior notes, to satisfy our other debt obligations, and to fund any planned capital expenditures, dividends and other cash needs will depend in part upon the future financial and operating performance of our subsidiaries and upon our ability to renew or refinance borrowings. Prevailing economic conditions and financial, business, competitive, legislative, regulatory and other factors, many of which are beyond our control, will affect our ability to make these payments.
If we are unable to make payments or refinance our debt or obtain new financing under these circumstances, we may consider other options, including:
• | sales of assets; |
• | sales of equity; |
• | reduction or delay of capital expenditures, strategic acquisitions, investments and alliances; or |
• | negotiations with our lenders to restructure the applicable debt. |
Our business may not generate sufficient cash flow from operations, and future borrowings may not be available to us in an amount sufficient to enable us to pay our indebtedness, including the senior notes and our other debt obligations, or to fund our other liquidity needs. We may need to refinance all or a portion of our indebtedness on or before maturity. We may not be able to refinance any of our debt on commercially reasonable terms or at all.
Risks Related to Our Common Stock
Your percentage ownership in Post may be diluted in the future.
As with any publicly traded company, our shareholders’ percentage ownership in Post may be diluted in the future because of equity issuances for acquisitions, capital market transactions or otherwise, including equity awards that we expect will be granted to our directors, officers and employees and the accelerated vesting of other equity awards. For a more detailed description of our equity incentive plan, see “Executive Compensation.”
21
The market price and trading volume of our common stock may be volatile.
The market price of our common stock could fluctuate significantly for many reasons, including in response to the risk factors listed in this report or for reasons unrelated to our performance, such as reports by industry analysts, investor perceptions or negative developments relating to our customers, competitors or suppliers, as well as general economic and industry conditions.
Provisions in our articles of incorporation and bylaws and provisions of Missouri law may prevent or delay an acquisition of our Company, which could decrease the trading price of our common stock.
Our articles of incorporation, bylaws and Missouri law contain provisions intended to deter coercive takeover practices and inadequate takeover bids by making such practices or bids unacceptably expensive and incentivizing prospective acquirers to negotiate with our Board of Directors rather than to attempt a hostile takeover. These provisions include, among others:
• | the Board of Directors is divided into three classes with staggered terms; |
• | the Board of Directors fixes the number of members on the Board; |
• | elimination of the rights of our shareholders to act by written consent (except when such consent is unanimous) and to call shareholder meetings; |
• | rules regarding how shareholders may present proposals or nominate directors for election at shareholder meetings; |
• | the right of our Board of Directors to issue preferred stock without shareholder approval; |
• | supermajority vote requirements for certain amendments to our articles of incorporation and bylaws; |
• | anti-takeover provisions of Missouri law which may prevent us from engaging in a business combination with an interested shareholder, or which may deter third parties from acquiring amounts of our common stock above certain thresholds; and |
• | limitations on the right of shareholders to remove directors. |
ITEM 1B. UNRESOLVED STAFF COMMENTS
Not applicable.
ITEM 2. PROPERTIES
We own our principal executive offices and lease corporate administrative offices in St. Louis, Missouri. The general offices and location of our principal operations for each of our businesses are set forth in the summary below. We also lease sales offices mainly in the United States and maintain a number of stand-alone distribution facilities. In addition, there is on-site warehouse space available at many of our manufacturing facilities. Utilization of manufacturing capacity varies by manufacturing plant based upon the type of products assigned and the level of demand for those products.
We own many of our manufacturing facilities. Certain of our owned real properties are subject to mortgages or other applicable security interests pursuant to our financing arrangements. Management believes our facilities are suitable and adequate for the purposes for which they are used and are adequately maintained. We generally believe each location or facility provides adequate capacity for current and anticipated future customer demand.
Post Consumer Brands
The main administrative office for Post Consumer Brands, which we own, is located in Lakeville, Minnesota. Post Consumer Brands also leases administrative office space in Bentonville, Arkansas; Toronto, Canada; Marlborough, Massachusetts; Eugene, Oregon and Scottsdale, Arizona.
Post Consumer Brands has ten owned manufacturing facilities located in Battle Creek, Michigan; Jonesboro, Arkansas; Niagara Falls, Ontario; Asheboro, North Carolina; Tremonton, Utah; St. Ansgar, Iowa; Clinton, Massachusetts; Eugene, Oregon and two facilities, in addition to warehouse space, in Northfield, Minnesota. Post Consumer Brands also leases land for another owned manufacturing facility located in Cobourg, Ontario. Post Consumer Brands maintains approximately 5.8 million square feet of warehouse and distribution space throughout the United States and Canada, approximately 0.8 million of which is owned by us, approximately 1.8 million of which is directly leased by us and approximately 3.2 million of which we contract with third party logistics providers who operate warehouse and distribution space on our behalf.
Michael Foods Group
22
The Michael Foods Group’s primary administrative offices, which are leased, are located in Minnetonka, Minnesota. Michael Foods owns eight egg products production facilities in Iowa, Minnesota, Nebraska, Illinois and Oregon, and leases facilities for egg products production in New Jersey, Pennsylvania, Iowa and South Dakota. Additionally, the egg products business owns eight layer facilities in the United States. The refrigerated potato products business’ main processing facility is located in Chaska, Minnesota, which is owned, and the business also leases a smaller processing facility in North Las Vegas, Nevada. The Michael Foods Group also owns a cheese packaging facility and warehouse in Lake Mills, Wisconsin for its cheese and other dairy-case products business. Finally, Dakota Growers, which is reported in our Michael Foods Group segment, owns pasta production facilities in Carrington, North Dakota and New Hope, Minnesota.
Active Nutrition
The Active Nutrition segment’s PNC administrative offices, which are leased, are located in Emeryville, California. PNC also leases offices and a development kitchen in Boise, Idaho. The Dymatize business has a leased administrative office in Dallas, Texas. Additionally, we own a manufacturing facility in Voerde, Germany and lease office space in Munich, Germany; Bern, Switzerland and Manchester in the United Kingdom for Active Nutrition’s international operations.
Private Brands
Our Private Brands business owns manufacturing facilities in Fitzgerald, Georgia, which are used for peanut butter production and peanut blanching. Additionally, the Private Brands business leases manufacturing facilities in Troy, Alabama; Blaine, Washington; Markham, Ontario; Brampton, Ontario and Burnaby, British Columbia for nut butter and fruit and nut production. We also lease an administrative office in Burnaby, British Columbia.
Weetabix
Weetabix has four owned manufacturing facilities in the United Kingdom in Burton Latimer, Corby and Ashton-under-Lyne. In addition, Weetabix’s joint ventures in Kenya and South Africa each own a manufacturing facility in those respective countries. Weetabix also leases office space in the United Arab Emirates, Spain and China, and leases warehouse space in China. Weetabix contracts with a third party logistics provider in Spain who operates warehouse space on Weetabix’s behalf.
ITEM 3. LEGAL PROCEEDINGS
Antitrust claims: In late 2008 and early 2009, some 22 class action lawsuits were filed in various federal courts against Michael Foods, Inc. and some 20 other defendants (producers of shell eggs and egg products, and egg industry organizations), alleging violations of federal and state antitrust laws in connection with the production and sale of shell eggs and egg products, and seeking unspecified damages. All cases were transferred to the Eastern District of Pennsylvania for coordinated and/or consolidated pretrial proceedings.
The case involves three plaintiff groups: (1) direct purchasers of eggs and egg products; (2) companies (primarily large grocery chains and food companies that purchase considerable quantities of eggs) that opted out of any eventual class and brought their own separate actions against the defendants (“opt-out plaintiffs”); and (3) indirect purchasers of shell eggs.
Motions related to class certification: In September 2015, the court granted the motion of the direct purchaser plaintiffs to certify a shell-egg subclass, but denied their motion to certify an egg-products subclass. Also in September 2015, the court denied the motion of the indirect purchaser plaintiffs for class certification. The indirect purchaser plaintiffs subsequently filed an alternative motion for certification of an injunctive class, and that motion was denied on June 27, 2017.
Motions for summary judgment: In September 2016, the court granted the defendants’ motion for summary judgment based on purchases of egg products, thereby limiting all claims to shell eggs. Also in September 2016, the court denied individual motions for summary judgment made by Michael Foods and three other defendants that had sought the dismissal of all claims against them.
Settlements by Michael Foods: On December 8, 2016, Michael Foods reached an agreement to settle all class claims asserted against it by the direct purchaser plaintiffs for a payment of $75.0 million. The Company has paid such amount into escrow. This settlement is awaiting court approval. Although the Company expects the settlement will receive the needed approval, there can be no assurance that the court will approve the agreement as proposed by the parties.
On January 19, 2017, Michael Foods entered into a settlement, the details of which are confidential, with the opt-out plaintiffs (excluding those opt-out plaintiffs whose claims relate primarily or exclusively to egg products; several of those plaintiffs are now appealing the dismissal of the egg -products claims). This settlement was paid by the Company as of September 30, 2017. Michael Foods has at all times denied liability in this matter, and neither settlement contains any admission of liability by Michael Foods. Under current law, any settlement paid, including the settlement with the direct purchaser plaintiffs and the settlement with the opt-out plaintiffs, is deductible for federal income tax purposes.
23
Remaining portions of the case: The Third Circuit Court of Appeals has denied the motions of the indirect purchaser plaintiffs to immediately appeal the court’s denial of their motions for class certification. Additionally, the elimination of egg products from the case is being appealed by opt-out plaintiffs who purchased egg products. The appeal is fully submitted to the Third Circuit Court of Appeals.
Although the likelihood of a material adverse outcome in the egg antitrust litigation has been significantly reduced as a result of the Michael Foods settlements described above, there is still a possibility of an adverse outcome following appellate review of the remaining portions of the case. At this time, however, we do not believe it is possible to estimate any loss in connection with these remaining portions of the egg antitrust litigation. Accordingly, we cannot predict what impact, if any, these remaining matters and any results from such matters could have on our future results of operations.
At September 30, 2016, the Company had accrued $28.5 million for this matter. There were no accruals for these matters at September 30, 2017. We record reserves for litigation losses in accordance with Accounting Standards Codification Topic 450, “Contingencies” (“ASC 450”). Under ASC 450, a loss contingency is recorded if a loss is probable and can be reasonably estimated. We record probable loss contingencies based on the best estimate of the loss. If a range of loss can be reasonably estimated, but no single amount within the range appears to be a better estimate than any other amount within the range, the minimum amount in the range is accrued. These estimates are often initially developed earlier than when the ultimate loss is known, and the estimates are adjusted if additional information becomes known.
Although the Company believes its accruals for this matter are appropriate, the final amounts required to resolve such matters could differ materially from recorded estimates and the Company's results of operations and cash flows could be materially affected. Accordingly, the Company cannot predict what impact, if any, these matters and any results from such matters could have on the future results of operations.
During the years ended September 30, 2017 and 2016, the Company expensed $74.5 million and $28.5 million related to these settlements, respectively, which was included in “Selling, general and administrative expenses” in the Consolidated Statements of Operations. No expense related to these settlements was recorded during the year ended September 30, 2015.
Other: The Company is subject to various other legal proceedings and actions arising in the normal course of business. In the opinion of management, based upon the information presently known, the ultimate liability, if any, arising from such pending legal proceedings, as well as from asserted legal claims and known potential legal claims which are likely to be asserted, taking into account established accruals for estimated liabilities (if any), are not expected to be material individually or in the aggregate to the consolidated financial position, results of operations or cash flows of the Company. In addition, although it is difficult to estimate the potential financial impact of actions regarding expenditures for compliance with regulatory matters, in the opinion of management, based upon the information currently available, the ultimate liability arising from such compliance matters is not expected to be material to the consolidated financial position, results of operations or cash flows of the Company.
ITEM 4. MINE SAFETY DISCLOSURE
Not applicable.
24
PART II
ITEM 5. | MARKET FOR REGISTRANT’S COMMON EQUITY, RELATED SHAREHOLDER MATTERS AND ISSUER PURCHASES OF EQUITY SECURITIES |
Common Stock Market Prices and Dividends
Our common stock is traded on the New York Stock Exchange (“NYSE”) under the symbol “POST.” There were approximately 5,337 shareholders of record on November 1, 2017. We did not pay any cash dividends on our common stock during the fiscal years ended September 30, 2017 or 2016. We have no plans to pay cash dividends on our common stock in the foreseeable future, and the indentures governing our debt securities and our credit facilities restrict our ability to pay dividends. The range of high and low sale prices of our common stock as reported by the NYSE is set forth in the table below.
Year Ended September 30, | |||||||||||||||
2017 | 2016 | ||||||||||||||
High | Low | High | Low | ||||||||||||
First Quarter | $ | 82.07 | $ | 68.76 | $ | 71.39 | $ | 57.29 | |||||||
Second Quarter | 88.43 | 80.29 | 72.64 | 50.93 | |||||||||||
Third Quarter | 89.04 | 75.76 | 83.42 | 68.08 | |||||||||||
Fourth Quarter | 88.58 | 76.12 | 89.00 | 75.52 | |||||||||||
Issuer Purchases of Equity Securities
Period | Total Number of Shares Purchased (a) | Average Price Paid per Share (b) | Total Number of Shares Purchased as Part of Publicly Announced Plans or Programs (c) | Approximate Dollar Value of Shares that may yet be Purchased Under the Plans or Programs (b) (c) | ||||
July 1, 2017 - July 31, 2017 | — | — | — | — | ||||
August 1, 2017 - August 31, 2017 | 47,000 | $84.83 | 47,000 | $232,284,008 | ||||
September 1, 2017 - September 30, 2017 | — | — | — | — | ||||
Total | 47,000 | $84.83 | 47,000 | $232,284,008 | ||||
(a) | The total number of shares purchased includes shares purchased on the open market. |
(b) | Does not include brokers’ commissions. |
(c) | On June 6, 2017, our Board of Directors authorized the Company to repurchase up to $250,000,000 of shares of our common stock. The authorization expires on June 6, 2019. |
Performance Graph
The following performance graph compares the changes, for the period indicated, in the cumulative total value of $100 hypothetically invested in each of (a) Post common stock, (b) the Russell 1000 index, (c) the Russell 2000 index and (d) a peer group composed of 13 U.S.-based public companies in the food and consumer packaged goods industries.
In June 2016, Post common stock became a component of the Russell 1000 index. Previously, Post common stock was a component of the Russell 2000 index. As such, the Russell 1000 index has been deemed to be the more comparable index going forward.
The peer group companies are: B&G Foods, Inc.; Brown-Forman Corporation; Coca-Cola Bottling Co.; Cott Corporation; Darling International Inc.; Flowers Foods, Inc.; The Hain Celestial Group, Inc.; J&J Snack Foods Corp.; Pinnacle Foods Inc.; Sanderson Farms, Inc.; Snyder’s-Lance, Inc.; Sunopta Inc. and TreeHouse Foods Inc.
This graph covers the period from September 28, 2012 through September 29, 2017.
25
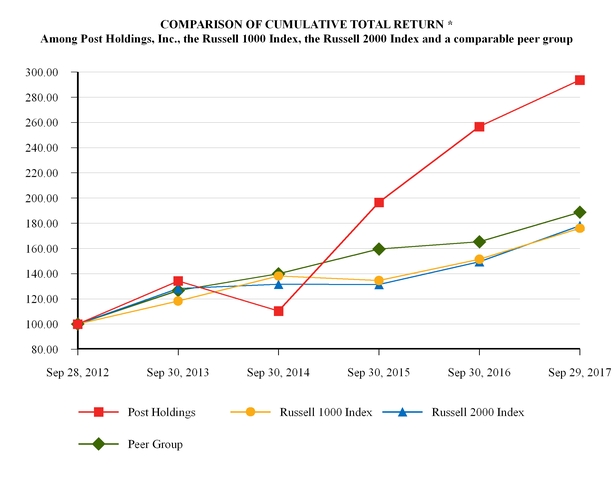
* $100 invested on 9/28/12 in stock or index.
Performance Graph Data
Post ($) | Russell 1000 Index ($) | Russell 2000 Index ($) | Peer Group ($) | ||||||||
9/28/2012 | 100.00 | 100.00 | 100.00 | 100.00 | |||||||
9/30/2013 | 134.30 | 118.36 | 128.22 | 126.63 | |||||||
9/30/2014 | 110.38 | 138.13 | 131.55 | 139.88 | |||||||
9/30/2015 | 196.61 | 134.61 | 131.43 | 159.55 | |||||||
9/30/2016 | 256.72 | 151.47 | 149.46 | 165.31 | |||||||
9/29/2017 | 293.65 | 175.99 | 178.02 | 188.77 | |||||||
The stock price performance included in this graph is not necessarily indicative of future stock price performance.
This performance graph shall not be deemed “filed” for purposes of Section 18 of the Exchange Act or incorporated by reference into any of our filings under the Securities Act or the Exchange Act, except as shall be expressly set forth by specific reference in such filing.
The information required under this Item 5 concerning equity compensation plan information is set out below under Item 12 and is incorporated herein by this reference.
26
ITEM 6. SELECTED FINANCIAL DATA
FIVE YEAR FINANCIAL SUMMARY
(in millions, except per share data)
Year Ended September 30, | ||||||||||||||||||||
(dollars in millions, except per share data) | 2017 (a) | 2016 (a) | 2015 (a) | 2014 (a) | 2013 (a) | |||||||||||||||
Statements of Operations Data | ||||||||||||||||||||
Net sales | $ | 5,225.8 | $ | 5,026.8 | $ | 4,648.2 | $ | 2,411.1 | $ | 1,034.1 | ||||||||||
Cost of goods sold | 3,651.7 | 3,479.4 | 3,473.8 | 1,789.9 | 609.2 | |||||||||||||||
Gross profit | 1,574.1 | 1,547.4 | 1,174.4 | 621.2 | 424.9 | |||||||||||||||
Selling, general and administrative expenses | 867.4 | 839.7 | 734.1 | 459.5 | 298.2 | |||||||||||||||
Amortization of intangible assets | 159.1 | 152.6 | 141.7 | 70.8 | 14.6 | |||||||||||||||
Impairment of goodwill and other intangible assets (b) | 26.5 | — | 60.8 | 295.6 | 2.9 | |||||||||||||||
Other operating expenses, net (c) | 0.8 | 9.4 | 25.1 | 3.0 | 1.4 | |||||||||||||||
Operating profit (loss) | 520.3 | 545.7 | 212.7 | (207.7 | ) | 107.8 | ||||||||||||||
Interest expense, net | 314.8 | 306.5 | 257.5 | 183.7 | 85.5 | |||||||||||||||
Loss on extinguishment of debt, net (d) | 222.9 | 86.4 | 30.0 | — | — | |||||||||||||||
Other (income) expense, net | (91.8 | ) | 182.9 | 92.5 | 35.5 | — | ||||||||||||||
Earnings (loss) before income taxes | 74.4 | (30.1 | ) | (167.3 | ) | (426.9 | ) | 22.3 | ||||||||||||
Income tax expense (benefit) | 26.1 | (26.8 | ) | (52.0 | ) | (83.7 | ) | 7.1 | ||||||||||||
Net earnings (loss) including noncontrolling interest | 48.3 | (3.3 | ) | (115.3 | ) | (343.2 | ) | 15.2 | ||||||||||||
Less: Net loss attributable to noncontrolling interest (e) | — | — | — | — | — | |||||||||||||||
Net earnings (loss) | 48.3 | (3.3 | ) | (115.3 | ) | (343.2 | ) | 15.2 | ||||||||||||
Preferred stock dividends | (13.5 | ) | (25.1 | ) | (17.0 | ) | (15.4 | ) | (5.4 | ) | ||||||||||
Net earnings (loss) available to common shareholders | $ | 34.8 | $ | (28.4 | ) | $ | (132.3 | ) | $ | (358.6 | ) | $ | 9.8 | |||||||
Earnings (Loss) Per Share | ||||||||||||||||||||
Basic | $ | 0.51 | $ | (0.41 | ) | $ | (2.33 | ) | $ | (9.03 | ) | $ | 0.30 | |||||||
Diluted | $ | 0.50 | $ | (0.41 | ) | $ | (2.33 | ) | $ | (9.03 | ) | $ | 0.30 | |||||||
Statements of Cash Flows Data | ||||||||||||||||||||
Depreciation and amortization | $ | 323.1 | $ | 302.8 | $ | 272.8 | $ | 155.8 | $ | 76.8 | ||||||||||
Cash provided (used) by: | ||||||||||||||||||||
Operating activities (f) | $ | 386.7 | $ | 502.4 | $ | 451.6 | $ | 163.0 | $ | 84.1 | ||||||||||
Investing activities | (2,090.8 | ) | (196.1 | ) | (1,248.7 | ) | (3,793.6 | ) | (423.8 | ) | ||||||||||
Financing activities (f) | 2,053.1 | (4.5 | ) | 1,372.4 | 3,504.3 | 683.9 | ||||||||||||||
Balance Sheet Data | ||||||||||||||||||||
Cash and cash equivalents | $ | 1,525.9 | $ | 1,143.6 | $ | 841.4 | $ | 268.4 | $ | 402.0 | ||||||||||
Working capital (excluding cash, cash equivalents, restricted cash and current portion of long-term debt) | 403.5 | 303.2 | 317.6 | 362.3 | 79.5 | |||||||||||||||
Total assets | 11,876.8 | 9,360.6 | 9,163.9 | 7,669.0 | 3,453.0 | |||||||||||||||
Debt, including short-term portion | 7,171.2 | 4,563.5 | 4,470.9 | 3,794.0 | 1,387.8 | |||||||||||||||
Other liabilities | 327.8 | 440.3 | 290.2 | 182.4 | 116.3 | |||||||||||||||
Total equity | 2,789.7 | 3,008.6 | 2,976.0 | 2,283.2 | 1,498.6 | |||||||||||||||
____________
(a) | The data in these columns include results from the fiscal 2017, 2016, 2015, 2014 and 2013 acquisitions from the respective date of acquisition through September 30, 2017. For more information on our 2017, 2016 and 2015 acquisitions, see Note 5 of “Notes to Consolidated Financial Statements.” In fiscal 2014, Post acquired Dakota Growers, Dymatize, Golden Boy and Michael Foods. In fiscal 2013, Post acquired Attune Foods, Inc., Hearthside Food Solutions and Premier Nutrition Corporation. |
(b) | For information about the impairment of goodwill and other intangible assets, see “Critical Accounting Policies and Estimates” and Notes 2 and 6 of “Notes to Consolidated Financial Statements.” |
(c) | For information about other income (expense), net, see “Management’s Discussion and Analysis of Financial Condition and Results of Operations” and Note 13 of “Notes to Consolidated Financial Statements.” |
(d) | For information about losses on extinguishment of debt, net, see Note 15 of “Notes to Consolidated Financial Statements.” |
(e) | For information about investments in joint ventures, see Note 7 of “Notes to Consolidated Financial Statements.” |
(f) | In connection with the adoption of Accounting Standards Update 2015-03, prior year amounts have been restated to conform with the 2017 presentation. |
27
ITEM 7. | MANAGEMENT’S DISCUSSION AND ANALYSIS OF FINANCIAL CONDITION AND RESULTS OF OPERATIONS |
The following discussion summarizes the significant factors affecting the consolidated operating results, financial condition, liquidity, and capital resources of Post Holdings, Inc. This discussion should be read in conjunction with the financial statements under Item 8, and the “Cautionary Statement on Forward-Looking Statements” on page 1.
OVERVIEW
We are a consumer packaged goods holding company operating in five reportable segments: Post Consumer Brands, Michael Foods Group, Active Nutrition, Private Brands and Weetabix. Our products are sold through a variety of channels such as grocery, club and drug stores, mass merchandisers, foodservice, ingredient and e-commerce.
Acquisitions
We have completed the following acquisitions during fiscal 2017, 2016 and 2015:
Fiscal 2017
• | National Pasteurized Eggs, Inc. (“NPE”), acquired October 3, 2016 and |
• | Latimer Newco 2 Limited, a company registered in England and Wales (“Latimer”), and all of Latimer’s direct and indirect subsidiaries at the time of acquisition, including Weetabix Limited (collectively the “Weetabix Group”), acquired July 3, 2017. |
Fiscal 2016
• | Willamette Egg Farms (“WEF”), acquired October 3, 2015. |
Fiscal 2015
• | PowerBar and Musashi brands (“PowerBar”), acquired October 1, 2014; |
• | American Blanching Company (“ABC”), acquired November 1, 2014; and |
• | MOM Brands Company (“MOM Brands”), acquired May 4, 2015. |
Divestitures
We completed the following divestitures in fiscal 2016 and 2015:
• | Certain assets of our Michael Foods Canadian egg business, sold March 1, 2016 and |
• | PowerBar Australia assets and Musashi trademark, sold July 1, 2015. |
Due to the level of integration within the existing businesses, certain discrete financial data for businesses acquired in fiscal 2017, 2016 and 2015 is not available for the years ended September 30, 2017 and 2016.
Segment Reorganization
During the fourth quarter of fiscal 2017, we reorganized our reportable segments in accordance with Accounting Standards Codification (“ASC”) Topic 280, “Segment Reporting.” At September 30, 2017, our reportable segments were as follows:
• | Post Consumer Brands: North American ready-to-eat (“RTE”) cereal and granola businesses, inclusive of the recently acquired Weetabix North American RTE cereal business; |
• | Michael Foods Group: eggs, potatoes, cheese and pasta; |
• | Active Nutrition: protein shakes, bars and powders and nutritional supplements; |
• | Private Brands: peanut and other nut butters and dried fruit and nuts; and |
• | Weetabix: the Weetabix branded and private label RTE cereal and Alpen branded muesli business sold and distributed primarily outside of North America. |
All segment results reported herein have been reclassified to conform with the September 30, 2017 presentation.
28
RESULTS OF OPERATIONS
Fiscal 2017 compared to 2016 | Fiscal 2016 compared to 2015 | ||||||||||||||||||||||||||||
dollars in millions; favorable/(unfavorable) | 2017 | 2016 | $ Change | % Change | 2016 | 2015 | $ Change | % Change | |||||||||||||||||||||
Net Sales | $ | 5,225.8 | $ | 5,026.8 | $ | 199.0 | 4 | % | $ | 5,026.8 | $ | 4,648.2 | $ | 378.6 | 8 | % | |||||||||||||
Operating Profit | $ | 520.3 | $ | 545.7 | $ | (25.4 | ) | (5 | )% | $ | 545.7 | $ | 212.7 | $ | 333.0 | 157 | % | ||||||||||||
Interest expense, net | 314.8 | 306.5 | (8.3 | ) | (3 | )% | 306.5 | 257.5 | (49.0 | ) | (19 | )% | |||||||||||||||||
Loss on extinguishment of debt, net | 222.9 | 86.4 | (136.5 | ) | (158 | )% | 86.4 | 30.0 | (56.4 | ) | (188 | )% | |||||||||||||||||
Other (income) expense, net | (91.8 | ) | 182.9 | 274.7 | 150 | % | 182.9 | 92.5 | (90.4 | ) | (98 | )% | |||||||||||||||||
Income tax expense (benefit) | 26.1 | (26.8 | ) | (52.9 | ) | (197 | )% | (26.8 | ) | (52.0 | ) | (25.2 | ) | (48 | )% | ||||||||||||||
Less: Net loss attributable to noncontrolling interest | — | — | — | n/a | $ | — | — | — | n/a | ||||||||||||||||||||
Net Earnings (Loss) | $ | 48.3 | $ | (3.3 | ) | $ | 51.6 | 1,564 | % | $ | (3.3 | ) | $ | (115.3 | ) | $ | 112.0 | 97 | % | ||||||||||
Net Sales
Fiscal 2017 compared to 2016
Net sales increased $199.0 million, or 4%, during the year ended September 30, 2017. These increases were primarily due to the inclusion of incremental contributions from fiscal 2017 and 2016 acquisitions and net sales growth in our Premier Protein branded products, as well as increased net sales in our Pebbles and Malt-O-Meal RTE cereal brands, our potato business and our traditional and organic peanut butter products. The net sales growth was partially offset by reduced net sales in our other RTE cereal brands, egg, cheese, pasta, other protein powder and bar brands, dried fruit and nut and tree nut butter products. For further discussion, refer to “Segment Results” within this section.
Fiscal 2016 compared to 2015
Net sales increased $378.6 million, or 8%, during the year ended September 30, 2016. These increases were primarily due to the inclusion of incremental contributions from fiscal 2016 and 2015 acquisitions and net sales growth in our Premier Protein branded products, as well as our legacy RTE cereal, peanut butter and private brand granola. The net sales growth was partially offset by the absence of net sales in fiscal 2016 attributable to businesses sold in fiscal 2016 and 2015, as well as reduced net sales in our egg, potato, cheese, pasta other protein powder and bar brands and tree nut butter products. For further discussion, refer to “Segment Results” within this section.
Operating Profit
Fiscal 2017 compared to 2016
Operating profit decreased $25.4 million, or 5%, for the year ended September 30, 2017. Operating profit was impacted in the year ended September 30, 2017 by losses related to the impairment of goodwill of $26.5 million, a provision for legal settlement of $74.5 million (compared to $28.5 million in the year ended September 30, 2016) in the Michael Foods Group and net foreign currency gains of $30.0 million related to cash held in pounds sterling (GBP) to fund the acquisition of the Weetabix Group. Excluding these impacts in both years, operating profit increased $17.1 million, or 3%, primarily resulting from the inclusion of incremental segment profit contributions from current and prior year acquisitions, as well as increased segment profit within our Post Consumer Brands, Active Nutrition and Private Brands segments for the year ended September 30, 2017, partially offset by a decrease in segment profit within our Michael Foods Group segment. In addition, general corporate expenses and other, excluding the previously described foreign currency gains, were higher in the year ended September 30, 2017. For further discussion, refer to “Segment Results” within this section.
Fiscal 2016 compared to 2015
Operating profit increased $333.0 million, or 157%, for the year ended September 30, 2016. Operating profit was negatively impacted in the year ended September 30, 2015 by losses related to the impairment of goodwill and indefinite-lived intangible assets of $60.8 million. Excluding this fiscal 2015 impact, operating profit increased $272.2 million, or 100%, primarily resulting from the inclusion of incremental segment profit contributions from fiscal 2016 and 2015 acquisitions, as well as increased segment profit within all of our segments for the year ended September 30, 2016. In addition, general corporate expenses and other were significantly lower for the year ended September 30, 2016. For further discussion, refer to “Segment Results” within this section.
29
Interest Expense, net
Interest expense increased $8.3 million, or 3%, for the year ended September 30, 2017 compared to the prior year. The increase was driven primarily by the increase in the principal balance of debt outstanding from debt issued in 2017 and 2016, partially offset by a decrease in our weighted-average interest rate resulting from a change in debt mix. Our weighted-average interest rate on our total outstanding debt was 4.9% and 6.3% at September 30, 2017 and 2016, respectively.
Interest expense increased $49.0 million, or 19%, for the year ended September 30, 2016, compared to the prior year. The increase was driven primarily by the increase in the principal balance of debt outstanding from debt issued in 2016 and 2015, partially offset by a decrease in our weighted-average interest rate resulting from a change in debt mix. Our weighted-average interest rate on our total outstanding debt was 6.3% and 6.9% at September 30, 2016 and 2015, respectively.
For additional information on our debt, refer to Note 15 in the “Notes to Consolidated Financial Statements” and “Quantitative and Qualitative Disclosures About Market Risk” in Item 7A.
Loss on Extinguishment of Debt, net
During the years ended September 30, 2017, 2016 and 2015, we recognized losses of $222.9 million, $86.4 million and $30.0 million, respectively, related to the extinguishment of debt. The loss in 2017 was related to the extinguishment of the entire remaining principal balances of our 7.75%, 7.375% and 6.75% senior notes and a portion of the principal balance of our 8.00% senior notes. The loss included premiums of $219.8 million and the write-off of debt issuance costs of $18.6 million, partially offset by the write-off of unamortized debt premium of $15.5 million. The loss in 2016 was related to the extinguishment of a portion of our 7.375% senior notes and the remaining balance of our prior term loan. The loss included a tender premium of $88.0 million and the write-off of debt issuance costs of $18.8 million, partially offset by the write-off of net unamortized debt premium and discount of $20.4 million. In 2015, the loss included the write-off of deferred financing fees of $24.6 million and unamortized debt discount of $5.4 million recorded in connection with the repayment of a portion of our prior term loan. For additional information on our debt, refer to Note 15 in the “Notes to Consolidated Financial Statements.”
Other (Income) Expense, net
During the years ended September 30, 2017, 2016 and 2015, we recognized (gains) losses of $(91.8) million, $182.9 million and $92.5 million, respectively, on our interest rate swaps and cross-currency foreign exchange contracts. Of the total gains recognized in the year ended September 30, 2017, $(93.6) million related to non-cash mark-to-market adjustments on our interest rate swaps, cross-currency swaps and foreign exchange forward contracts and $1.8 million related to cash settlements on our interest rate swaps. Of the total losses recognized in the year ended September 30, 2016, $182.4 million related to non-cash mark-to-market adjustments and $0.5 million related to cash settlements, both of which related to our interest rate swaps. For the year ended September 30, 2015, the entire loss was related to non-cash mark-to-market adjustments on our interest rate swaps. For additional information on our interest rate swaps and cross-currency foreign exchange contracts, refer to Note 13 in the “Notes to Consolidated Financial Statements” and “Quantitative and Qualitative Disclosures About Market Risk” in Item 7A.
30
Income Taxes
Our effective tax rate for fiscal 2017 was 35.1% compared to 89.0% for fiscal 2016 and 31.1% for fiscal 2015. A reconciliation of income tax expense (benefit) with amounts computed at the statutory federal rate follows:
Year Ended September 30, | |||||||||||
(dollars in millions) | 2017 | 2016 | 2015 | ||||||||
Computed tax at federal statutory rate (35%) | $ | 26.1 | $ | (10.5 | ) | $ | (58.6 | ) | |||
Non-deductible goodwill impairment loss | 7.2 | — | 16.5 | ||||||||
Non-deductible compensation | 1.8 | 2.6 | 0.4 | ||||||||
Non-deductible transaction costs | 2.9 | — | 0.6 | ||||||||
Domestic production activities deduction | — | (4.3 | ) | (5.9 | ) | ||||||
State income taxes, net of effect on federal tax | 0.8 | (6.2 | ) | (7.2 | ) | ||||||
Non-taxable interest income | (3.4 | ) | (2.6 | ) | (2.7 | ) | |||||
Valuation allowances | 4.8 | 3.8 | 6.7 | ||||||||
Change in deferred tax rates | — | (2.0 | ) | 4.9 | |||||||
Uncertain tax positions | (0.5 | ) | (2.0 | ) | (3.4 | ) | |||||
Sale and liquidation of Michael Foods Canadian egg business | — | (3.6 | ) | — | |||||||
Enacted tax law and changes | — | 0.7 | (0.4 | ) | |||||||
Income tax credits | (1.4 | ) | (1.5 | ) | (0.4 | ) | |||||
Rate differential on foreign income | (6.8 | ) | (1.8 | ) | (1.4 | ) | |||||
Excess tax benefits for share-based payments | (6.2 | ) | — | — | |||||||
Other, net (none in excess of 5% of statutory tax) | 0.8 | 0.6 | (1.1 | ) | |||||||
Income tax expense (benefit) | $ | 26.1 | $ | (26.8 | ) | $ | (52.0 | ) | |||
SEGMENT RESULTS
We evaluate each segment’s performance based on its segment profit, which is its operating profit before impairments, facility closure related costs, restructuring expenses, losses on assets held for sale, gain on sale of plant and other unallocated corporate income and expenses.
Post Consumer Brands
Fiscal 2017 compared to 2016 | Fiscal 2016 compared to 2015 | ||||||||||||||||||||||||||||
dollars in millions; favorable/(unfavorable) | 2017 | 2016 | $ Change | % Change | 2016 | 2015 | $ Change | % Change | |||||||||||||||||||||
Net Sales | $ | 1,851.5 | $ | 1,838.5 | $ | 13.0 | 1 | % | $ | 1,838.5 | $ | 1,365.9 | $ | 472.6 | 35 | % | |||||||||||||
Segment Profit | $ | 359.0 | $ | 302.9 | $ | 56.1 | 19 | % | $ | 302.9 | $ | 219.5 | $ | 83.4 | 38 | % | |||||||||||||
Segment Profit Margin | 19 | % | 16 | % | 16 | % | 16 | % | |||||||||||||||||||||
Fiscal 2017 compared to 2016
Net sales for the Post Consumer Brands segment increased $13.0 million, or 1%, for the year ended September 30, 2017 primarily due to the inclusion of the Weetabix North American business (“Weetabix NA”), which was acquired in July 2017, in the Post Consumer Brands segment. Excluding this impact, net sales decreased $15.1 million, or 1%. This decrease was primarily driven by 1% lower volumes. Volume declines were primarily due to reductions in government bid business, co-manufacturing, Honey Bunches of Oats and adult and kid classic brands, partially offset by increases in Pebbles, Malt-O-Meal, Oreo O’s and Honey Maid branded products. Average net selling prices increased driven by a favorable sales mix as branded volumes increased and lower margin co-manufacturing and governmental bid business volumes decreased, partially offset by higher trade spending.
Segment profit for the year ended September 30, 2017 increased $56.1 million, or 19%, compared to the prior year. The year ended September 30, 2017 included an operating loss of $6.4 million attributable to Weetabix NA. Excluding this impact, segment profit increased $62.5 million, or 21%, when compared to the prior year. The increase in segment profit was primarily due to a 356 basis point improvement in segment profit margin excluding Weetabix NA. This improvement was driven by reduced advertising and promotional spending of $30.6 million, lower material and manufacturing costs of $20.9 million and $11.6 million lower integration costs in the year ended September 30, 2017 as compared to the prior year. These positive impacts were partially offset by increased co-manufacturing costs related to constrained granola production capacity.
31
Fiscal 2016 compared to 2015
Net sales for the Post Consumer Brands segment increased $472.6 million, or 35%, for the year ended September 30, 2016, primarily due to the acquisition of MOM Brands in May 2015. Excluding this impact, net sales increased $25.5 million or 2%. This increase was primarily driven by 2% higher volumes. Volume increases were primarily the result of increases in Pebbles, Honey Bunches of Oats, co-manufacturing and granola volumes, partially offset by declines in Great Grains, Post Shredded Wheat, Grape-Nuts and Post Raisin Bran. Average net selling prices and trade spending levels within the legacy Post Foods business were relatively flat for the year ended September 30, 2016. Compared to the fiscal 2015 (partially pre-acquisition) period, net sales for our MOM Brands business were down slightly as a result of 1% lower volumes, as well as lower net selling prices resulting from an increase in the lower margin private label business.
Segment profit for the year ended September 30, 2016 increased $83.4 million, or 38%, when compared to the prior year. The increase was primarily the result of the acquisition of MOM Brands and increased sales in our legacy Post Foods and granola businesses, as previously discussed. Segment profit margin for the year ended September 30, 2016 was flat as a result of the positive impact of synergies achieved through the combination of the Post Foods and MOM Brands businesses offset by the inclusion of seven additional months in fiscal 2016 of the lower margin MOM Brands business and increased expenses related to co-manufacturing agreements. Segment profit was also negatively impacted in the years ended September 30, 2016 and 2015 by $19.3 million and $8.6 million of integration costs, respectively, and by a $17.0 million acquisition accounting related inventory valuation adjustment in the year ended September 30, 2015.
Michael Foods Group
Fiscal 2017 compared to 2016 | Fiscal 2016 compared to 2015 | ||||||||||||||||||||||||||||
dollars in millions; favorable/(unfavorable) | 2017 | 2016 | $ Change | % Change | 2016 | 2015 | $ Change | % Change | |||||||||||||||||||||
Net Sales | $ | 2,116.2 | $ | 2,184.7 | $ | (68.5 | ) | (3 | )% | $ | 2,184.7 | $ | 2,305.7 | $ | (121.0 | ) | (5 | )% | |||||||||||
Segment Profit | $ | 133.1 | $ | 276.6 | $ | (143.5 | ) | (52 | )% | $ | 276.6 | $ | 188.2 | $ | 88.4 | 47 | % | ||||||||||||
Segment Profit Margin | 6 | % | 13 | % | 13 | % | 8 | % | |||||||||||||||||||||
Fiscal 2017 compared to 2016
Net sales for the Michael Foods Group segment decreased $68.5 million, or 3%, for the year ended September 30, 2017. Egg product sales, including the impact of the current year acquisition of NPE, were up 1%, with volume up 10%. Volumes increased due to incremental volume from NPE, as well as the impact of egg supply returning to levels consistent with those prior to the outbreak of avian influenza (“AI”) in 2015. Egg revenues increased due to incremental sales from NPE, offset by lower selling prices resulting from the reversal of price increases taken in the prior year to offset higher costs incurred as a result of AI and lower market-based egg prices. Refrigerated potato products sales were up 7%, with volume up 8%, primarily due to volume gains in the foodservice channel. Pasta sales were down 8% on 4% lower volumes, primarily due to lower ingredient volumes and government bid business combined with the pass through of lower wheat ingredient costs to customers. Cheese and other dairy case products sales were down 21% on 21% lower volumes, primarily due to branded cheese distribution losses and losses within the low-margin private label cheese business. Net sales for the Michael Foods Group were also impacted in the year ended September 30, 2017 by the absence of sales from our Michael Foods Canadian egg business ($9.6 million for the year ended September 30, 2016) which was sold in the second quarter of fiscal 2016.
Segment profit decreased $143.5 million, or 52%, for the year ended September 30, 2017. The decrease in segment profit is primarily due to provisions for legal settlements of $74.5 million in the current year, compared to $28.5 million in the year ended September 30, 2016 (for additional information, refer to Item 3 and Note 16 in the “Notes to Consolidated Financial Statements”). In addition, egg results decreased compared to fiscal 2016 due to lower net selling prices, as previously discussed. Cheese and dairy results decreased $9.5 million as a result of lost volume, as previously discussed. Pasta results were down year over year driven by lower volumes and higher manufacturing costs. These decreases were partially offset by favorable potato results compared to the prior year.
Fiscal 2016 compared to 2015
Net sales for the Michael Foods Group segment decreased $121.0 million, or 5%, for the year ended September 30, 2016. Excluding the impact of the fiscal 2016 acquisition of WEF, net sales decreased $209.3 million, or 9%. Excluding the fiscal 2016 impact of WEF, egg product sales were down 12%, with volume down 14%. Lower volumes were due to the impacts of the 2015 outbreak of AI which reduced our egg supply available for sale during the year ended September 30, 2016. Despite lower volumes, revenues decreased less as a result of higher average selling prices resulting from price increases taken to offset higher costs incurred as a result of AI as well as a shift to higher priced products. These price increases were partially reversed during the second half of fiscal 2016. Refrigerated potato products sales were down 1%, with volume down 4%, and cheese and other dairy case products sales were down 6%, with volume down 5%. Pasta volumes increased 7%, however, net sales were down 2%, as
32
lower durum wheat input costs were passed through to customers. Net sales for the Michael Foods Group were also impacted in the year ended September 30, 2016 by the reduction of sales from our Michael Foods Canadian egg business ($9.6 million and $28.1 million for the years ended September 30, 2016 and 2015, respectively) which was sold in the second quarter of fiscal 2016.
Segment profit increased $88.4 million, or 47%, for the year ended September 30, 2016. Excluding the impact of the fiscal 2016 acquisition of WEF, segment profit increased $73.8 million, or 39%. The increase in segment profit resulted from improvements in all businesses within the segment. Egg results improved compared to fiscal 2015, driven by aggressive cost containment, price increases taken to offset AI related costs and a shift to higher margin products. In addition, fiscal 2015 results for our egg business were negatively impacted by $5.1 million of costs accrued for corrective actions in connection with isolated product quality issues. Cheese and dairy results improved as pricing was favorable relative to the underlying commodity costs as compared to the year ended September 30, 2015. Potato results improved in fiscal 2016 due to a favorable channel mix resulting from increased retail volumes and decreased foodservice volumes. Improved raw potato quality also contributed to reduced costs within the potato manufacturing operation. Pasta results were strong year over year driven by volume increases, higher pricing relative to underlying commodity costs and a favorable mix with increased retail volumes and a decrease in lower margin governmental bid volumes. Segment profit was negatively impacted in the year ended September 30, 2016 by the accrual of a $28.5 million provision for a potential legal settlement.
Active Nutrition
Fiscal 2017 compared to 2016 | Fiscal 2016 compared to 2015 | ||||||||||||||||||||||||||||
dollars in millions; favorable/(unfavorable) | 2017 | 2016 | $ Change | % Change | 2016 | 2015 | $ Change | % Change | |||||||||||||||||||||
Net Sales | $ | 713.2 | $ | 574.7 | $ | 138.5 | 24 | % | $ | 574.7 | $ | 555.0 | $ | 19.7 | 4 | % | |||||||||||||
Segment Profit (Loss) | $ | 96.4 | $ | 44.7 | $ | 51.7 | 116 | % | $ | 44.7 | $ | (13.8 | ) | $ | 58.5 | 424 | % | ||||||||||||
Segment Profit (Loss) Margin | 14 | % | 8 | % | 8 | % | (2 | )% | |||||||||||||||||||||
Fiscal 2017 compared to 2016
Net sales for the Active Nutrition segment increased $138.5 million, or 24%, for the year ended September 30, 2017, primarily attributable to protein shake and other ready-to-drink (“RTD”) volumes, which were up 51%, fueled by increased consumption and distribution of protein shakes, as well as new product introductions. Volumes for bars were down 6% and down 1% for powders. Average net selling prices for the Active Nutrition segment were down primarily due to price reductions and higher trade spending in the year ended September 30, 2017.
Segment profit increased $51.7 million, or 116%, for the year ended September 30, 2017. This increase was driven by higher volumes, as previously described, and favorable input costs of $24.9 million, partially offset by $6.4 million higher advertising and promotion spending and increased employee-related expenses resulting from increased headcount to support growth.
Fiscal 2016 compared to 2015
Net sales for the Active Nutrition segment increased $19.7 million, or 4%, for the year ended September 30, 2016. This increase was primarily attributable to strong growth in our Premier Protein branded products, where net sales were up 42%, on higher protein shake volumes. This increase was partially offset by 25% lower net sales within our Dymatize business, primarily driven by the fiscal 2015 decision to exit Dymatize’s private label business, inventory supply issues during the first half of 2016 and overall soft international sales. Net sales were also negatively impacted by volume declines in the PowerBar business and the absence of sales for Musashi branded products in fiscal 2016 ($16.8 million for the year ended September 30, 2015) as the Australian Musashi business was sold in the fourth quarter of fiscal 2015.
Segment profit for the year ended September 30, 2016 was $44.7 million compared to a segment loss of $13.8 million in the prior year. This improvement was driven by higher protein shake volumes, as previously described, favorable raw material costs of $23.9 million and lower manufacturing costs of $22.8 million, largely resulting from the prior year closure of our Boise, Idaho and Farmers Branch, Texas facilities as well as a fiscal 2015 write-off of unsalable inventory of approximately $9.2 million resulting from plant operational and quality issues and unfavorable manufacturing and warehousing costs. These favorable impacts were partially offset by $7.5 million higher advertising and promotion spending and a $5.5 million accrued legal settlement. Segment profit was negatively impacted in the year ended September 30, 2015 by $5.0 million of PowerBar integration costs, a $1.9 million acquisition accounting related inventory valuation adjustment and a $3.3 million loss attributable to the Australian Musashi business which was sold in the fourth quarter of fiscal 2015.
33
Private Brands
Fiscal 2017 compared to 2016 | Fiscal 2016 compared to 2015 | ||||||||||||||||||||||||||||
dollars in millions; favorable/(unfavorable) | 2017 | 2016 | $ Change | % Change | 2016 | 2015 | $ Change | % Change | |||||||||||||||||||||
Net Sales | $ | 432.5 | $ | 429.1 | $ | 3.4 | 1 | % | $ | 429.1 | $ | 421.7 | $ | 7.4 | 2 | % | |||||||||||||
Segment Profit | $ | 31.5 | $ | 28.0 | $ | 3.5 | 13 | % | $ | 28.0 | $ | 27.5 | $ | 0.5 | 2 | % | |||||||||||||
Segment Profit Margin | 7 | % | 7 | % | 7 | % | 7 | % | |||||||||||||||||||||
Fiscal 2017 compared to 2016
Net sales for the Private Brands segment increased $3.4 million, or 1%, for the year ended September 30, 2017. Net sales were positively impacted by a favorable sales mix with increases in higher-margin organic and traditional peanut butter volumes and decreases in lower-margin roasting and granulation volumes. Volumes remained flat as higher traditional and organic peanut butter and tree-nut butter volumes were offset by lower dried fruit and nut volumes. Average net selling prices were lower in the year ended September 30, 2017 resulting from raw material cost savings being passed through to customers.
Segment profit increased $3.5 million, or 13%, for the year ended September 30, 2017 primarily due to higher net sales and a favorable sales mix, as previously discussed, as well as favorable raw materials costs. These positive impacts were partially offset by unfavorable manufacturing and selling, general and administrative expenses. Segment profit was also negatively impacted in the prior year by losses of $0.6 million on the disposal of fixed assets.
Fiscal 2016 compared to 2015
Net sales for the Private Brands segment increased $7.4 million, or 2%, for the year ended September 30, 2016. This increase was due to the inclusion of an additional month of results in the year ended September 30, 2016, as compared to the prior year, related to the November 1, 2014 acquisition of ABC. Excluding this impact, sales were down slightly from fiscal 2015. Volumes within the Private Brands segment increased due to higher peanut butter volumes, partially offset by declines in tree nut butter and dried fruit and nut. Net sales were negatively impacted in the year ended September 30, 2016 by an unfavorable sales mix resulting from lower sales of higher-priced tree nut butters as compared to the prior year and unfavorable changes in foreign exchange rates.
Segment profit increased $0.5 million, or 2%, for the year ended September 30, 2016. This increase includes an additional month of results for ABC in the year ended September 30, 2016, as compared to the prior year, as previously discussed. Segment profit was negatively impacted by higher compensation costs as a result of increased headcount, unfavorable changes in foreign exchange rates and losses of $0.6 million on the disposal of fixed assets in the year ended September 30, 2016. These negative impacts were partially offset by lower peanut costs. Segment profit was also negatively impacted by an acquisition accounting related inventory valuation adjustment of $1.3 million in the year ended September 30, 2015.
34
Weetabix
dollars in millions | 2017 | ||
Net Sales | $ | 112.4 | |
Segment Profit | $ | 14.5 | |
Segment Profit Margin | 13 | % | |
The Weetabix segment, acquired on July 3, 2017, consists of the international (primarily United Kingdom) RTE cereal and muesli business. For the year ended September 30, 2017, the Weetabix segment contributed $112.4 million of net sales and $14.5 million of segment profit. Weetabix experienced strong volume growth in its branded business compared to the same period (pre-acquisition) in the prior year, driven by higher volumes of Weetabix branded cereal and on-the-go drink products. Private label volumes were flat as compared to the same period (pre-acquisition) in the prior year. Segment profit was positively impacted in the current year by increased volumes, as previously discussed, and negatively impacted by an acquisition accounting related inventory valuation adjustment of $15.2 million, increased warehousing costs and start-up costs for a new sales office.
Other Items
General Corporate Expenses and Other
Fiscal 2017 compared to 2016 | Fiscal 2016 compared to 2015 | ||||||||||||||||||||||||||||
dollars in millions; favorable/(unfavorable) | 2017 | 2016 | $ Change | % Change | 2016 | 2015 | $ Change | % Change | |||||||||||||||||||||
General corporate expenses and other | $ | 87.7 | $ | 106.5 | $ | 18.8 | 18 | % | $ | 106.5 | $ | 147.9 | $ | 41.4 | 28 | % | |||||||||||||
Fiscal 2017 compared to 2016
General corporate expenses and other decreased $18.8 million, or 18%, during the year ended September 30, 2017. The decrease was primarily due to net foreign currency gains of $30.0 million related to cash held in GBP to fund the purchase of the Weetabix Group, lower restructuring and plant closure costs of $6.1 million and lower outside professional services costs of $2.4 million. In addition, a gain on assets held for sale of $0.2 million was recorded in the year ended September 30, 2017 to adjust the carrying value of the assets to their final fair value less estimated selling costs compared to losses on assets held for sale of $9.3 million in the prior year. These decreases were partially offset by increased third party acquisition and divestiture related costs of $22.0 million primarily related to success fees expensed in conjunction with the Weetabix Group acquisition, higher stock-based compensation of $6.5 million and decreased gains related to mark-to-market adjustments on commodity hedges of $0.5 million.
Fiscal 2016 compared to 2015
General corporate expenses and other decreased $41.4 million, or 28%, during the year ended September 30, 2016. The decrease was due to a $19.3 million reduction in restructuring and plant closure costs, reduced transaction related costs of $5.6 million, lower stock-based compensation of $4.7 million, driven primarily by reduced accelerated expense in the year ended September 30, 2016, and higher net mark-to-market gains (compared to net losses in fiscal 2015) on commodity hedges of $4.0 million. In addition, losses on assets held for sale of $9.3 million were recorded in the year ended September 30, 2016 compared to $34.2 million in the prior year.
Restructuring and Plant Closure
The table below shows the amount of restructuring and plant closure costs attributable to each segment. These amounts are excluded from the measure of segment profit but are included in general corporate expenses and other.
Fiscal 2017 compared to 2016 | Fiscal 2016 compared to 2015 | ||||||||||||||||||||||
dollars in millions; favorable/(unfavorable) | 2017 | 2016 | $ Change | 2016 | 2015 | $ Change | |||||||||||||||||
Post Consumer Brands | $ | — | $ | 1.3 | $ | 1.3 | $ | 1.3 | $ | 10.1 | $ | 8.8 | |||||||||||
Active Nutrition | 0.2 | 5.0 | 4.8 | 5.0 | 15.5 | 10.5 | |||||||||||||||||
$ | 0.2 | $ | 6.3 | $ | 6.1 | $ | 6.3 | $ | 25.6 | $ | 19.3 | ||||||||||||
35
Assets Held for Sale
The table below shows the amount of net (gains) losses on assets held for sale attributable to each segment. These amounts are excluded from the measure of segment profit but are included in General Corporate Expenses and Other.
Fiscal 2017 compared to 2016 | Fiscal 2016 compared to 2015 | ||||||||||||||||||||||
dollars in millions; favorable/(unfavorable) | 2017 | 2016 | $ Change | 2016 | 2015 | $ Change | |||||||||||||||||
Post Consumer Brands | $ | — | $ | 4.8 | $ | 4.8 | $ | 4.8 | $ | 7.1 | $ | 2.3 | |||||||||||
Active Nutrition | (0.2 | ) | 4.5 | 4.7 | 4.5 | 11.7 | 7.2 | ||||||||||||||||
Private Brands | — | — | — | — | 15.4 | 15.4 | |||||||||||||||||
$ | (0.2 | ) | $ | 9.3 | $ | 9.5 | $ | 9.3 | $ | 34.2 | $ | 24.9 | |||||||||||
Impairment of Goodwill and Other Intangible Assets
Fiscal 2017 compared to 2016 | Fiscal 2016 compared to 2015 | ||||||||||||||||||||||
dollars in millions; favorable/(unfavorable) | 2017 | 2016 | $ Change | 2016 | 2015 | $ Change | |||||||||||||||||
Impairment of goodwill and other intangible assets | $ | 26.5 | $ | — | $ | (26.5 | ) | $ | — | $ | 60.8 | $ | 60.8 | ||||||||||
During the year ended September 30, 2017, we recorded a non-cash goodwill impairment charge totaling $26.5 million. The goodwill impairment charge related to Dymatize, which is reported in the Active Nutrition segment.
During the year ended September 30, 2015, we recorded non-cash impairment charges totaling $60.8 million. These charges consisted of a goodwill impairment of $57.0 million and indefinite-lived trademark impairment charges of $3.8 million. The goodwill impairment charge related to Dymatize, which is reported in the Active Nutrition segment. Trademark impairment charges consisted of $3.7 million for our Grape-Nuts brand and $0.1 million for our 100% Bran brand, which are reported in our Post Consumer Brands segment.
LIQUIDITY AND CAPITAL RESOURCES
In connection with funding acquisitions and managing our capital structure, we completed the following transactions (for additional information see Note 15 and Note 20 in the “Notes to Consolidated Financial Statements”):
Fiscal 2017
• | $317.8 million paid for repurchase of 4.0 million shares of the Company’s common stock |
• | $1,500.0 million principal value of 5.75% senior notes issued, $41.2 million premium received |
• | $1,000.0 million principal value of 5.50% senior notes issued |
• | $2,200.0 million principal value term loan issued |
• | $2,070.5 million principal payment and $219.8 million premium payment made on extinguishment of the 6.75%, 7.375% and 7.75% senior notes and a portion of the 8.00% senior notes |
• | Amended and restated our credit agreement which provides for a revolving credit facility in an aggregate available principal amount of $800.0 million, currently with outstanding letters of credit of $10.0 million which reduced the available borrowing capacity to $790.0 million at September 30, 2017 |
• | In September 2017, we announced we intend to purchase Bob Evans Farms, Inc. for $77.00 per share. We expect to finance the purchase with cash on hand and through borrowings under our revolving credit facility. |
Fiscal 2016
• | $1,750.0 million principal value of 5.00% senior notes issued |
• | $1,242.0 million principal payment and $88.0 million tender offer premium payment made on extinguishment of a portion of the 7.375% senior notes |
• | $374.4 million term loan principal payoff |
36
Fiscal 2015
• | $341.4 million net proceeds received through the issuance of 7.475 million shares of common stock, par value $0.01 per share, at a price to the public of $47.50 per share |
• | $700.0 million principal value term loan issued |
• | $391.3 million net proceeds received through the issuance of 6.73 million shares of common stock, par value $0.01 per share, at a price to the public of $60.00 per share |
• | $800.0 million principal value of 7.75% senior notes issued |
• | $400.0 million principal value of 8.00% senior notes issued |
• | $1,200.0 million principal payment made on the term loan |
The following table shows cash flow data for fiscal years 2017, 2016 and 2015, which is discussed below.
Year ended September 30, | |||||||||||
(dollars in millions) | 2017 | 2016 | 2015 | ||||||||
Cash provided by operating activities | $ | 386.7 | $ | 502.4 | $ | 451.6 | |||||
Cash used in investing activities | (2,090.8 | ) | (196.1 | ) | (1,248.7 | ) | |||||
Cash provided by (used in) financing activities | 2,053.1 | (4.5 | ) | 1,372.4 | |||||||
Effect of exchange rate changes on cash and cash equivalents | 33.3 | 0.4 | (2.3 | ) | |||||||
Net increase in cash and cash equivalents | $ | 382.3 | $ | 302.2 | $ | 573.0 | |||||
Historically, we have generated and expect to continue generating positive cash flows from operations. We believe our cash on hand, cash flows from operations and our current and possible future credit facilities will be sufficient to satisfy our future working capital requirements, interest payments, research and development activities, capital expenditures, pension contributions and other financing requirements for the foreseeable future. Our ability to generate positive cash flows from operations is dependent on general economic conditions, competitive pressures and other business risk factors. If we are unable to generate sufficient cash flows from operations, or to otherwise comply with the terms of our credit facilities, we may be required to seek additional financing alternatives or waivers under our credit agreement and indentures governing our senior notes. There can be no assurance that we would be able to obtain additional financing or any such waivers on terms acceptable to us or at all.
Short-term financing needs primarily consist of working capital requirements, principal and interest payments on our long-term debt and dividend payments on our cumulative preferred stock. Long-term financing needs will depend largely on potential growth opportunities, including acquisition activity and repayment or refinancing of our long-term debt obligations.
Operating Activities
Fiscal 2017 compared to 2016
Cash provided by operating activities for the year ended September 30, 2017 decreased by $115.7 million compared to the year ended September 30, 2016. This decrease was driven by $103.0 million of legal settlements paid in the current year period, increased payments of advertising and promotional expenses in the current year, increased incentive payments paid in the current year on above target fiscal 2016 performance and increased interest payments of $24.0 million, partially offset by lower payments for income taxes of $43.8 million.
Fiscal 2016 compared to 2015
Cash provided by operating activities for the year ended September 30, 2016 increased by $50.8 million compared to the year ended September 30, 2015. This increase was driven by incremental cash flows from the operations of our 2016 and 2015 acquisitions as well as increased net earnings attributable to organic growth within our Post Consumer Brands, Michael Foods Group and Active Nutrition segments, partially offset by $184.9 million of unfavorable working capital changes during the year ended September 30, 2016 when compared to working capital changes in the prior year. The unfavorable change in working capital was primarily due to an increase in inventory at Michael Foods, as supply returned to pre-AI levels as well as higher payments for income taxes in fiscal 2016 and the collection of a $55.5 million income tax receivable in fiscal 2015.
Investing Activities
Fiscal 2017 compared to 2016
Cash used in investing activities for fiscal 2017 increased by $1,894.7 million compared to fiscal 2016. The increased cash outflow was driven by an increase in cash paid for acquisitions of $1,820.8 million and an increase in capital expenditures of $68.9 million, partially offset by an increase in proceeds received from the sale of property and assets held for sale of $8.5 million.
37
Cash used in investing activities was also impacted in fiscal 2016 by net proceeds received from the sale of businesses of $7.3 million and changes in restricted cash related to pledged collateral for our commodity and energy derivative contracts.
Capital expenditures were $190.4 million and $121.5 million in fiscal years 2017 and 2016, respectively. The increase is primarily related to the cage-free housing conversion at the Michael Foods Bloomfield, Nebraska facility, as well as capital expenditures related to businesses acquired in 2017.
Fiscal 2016 compared to 2015
Cash used in investing activities during fiscal 2016 decreased by $1,052.6 million compared to fiscal 2015. The decrease was driven by the reduction of cash paid for acquisitions of $1,144.8 million and an increase in net proceeds received from the sale of businesses of $3.5 million, partially offset by an increase in capital expenditures of $13.6 million and a decrease in proceeds received from the sale of property and assets held for sale of $18.3 million. Cash used in investing activities was also impacted in fiscal 2016 by escrow deposits of $0.6 million, classified as restricted cash, related to the fiscal 2017 acquisition of National Pasteurized Eggs, Inc. and in 2015 by escrow deposits of $55.0 million and $14.0 million, classified as restricted cash, related to the acquisitions of PowerBar and ABC, respectively.
Capital expenditures were $121.5 million and $107.9 million in fiscal years 2016 and 2015, respectively.The increase was primarily due to an increase in capital expenditures during 2016 related to acquired businesses.
Financing Activities
Fiscal 2017 compared to 2016
Cash provided by financing activities was $2,053.1 million for fiscal 2017 compared to cash used in financing activities of $4.5 million in 2016. In fiscal 2017, we received proceeds from the issuance of long-term debt of $4,700.0 million related to the issuance of $2,500.0 million principal of 5.50% and 5.75% senior notes and $2,200.0 million under our term loan. A premium of $41.2 million was received related to the 5.75% senior notes. A portion of the proceeds from the issuances were used to repay the outstanding principal balances of our 6.75%, 7.375% and 7.75% senior notes and a portion of our 8.00% senior notes, which resulted in a total principal payment of $2,070.5 million. Related to the repayments of long-term debt, we paid tender premiums of $219.8 million for the early extinguishment of the senior notes. For the issuance of the new senior notes, the amendment and restatement of our prior credit agreement and the borrowings under our term loan, we paid $59.0 million in debt issuance costs and deferred financing fees. We also repurchased 4.0 million shares of our common stock at a total cost of $317.8 million, including brokers’ commissions, during the year ended September 30, 2017.
During fiscal 2016, we completed a debt refinancing in which we issued $1,750.0 million principal value of 5.00% senior notes and utilized the proceeds to fund a tender offer of our 7.375% senior notes, which resulted in a principal payment of $1,242.0 million (or 90% of the total outstanding principal balance). Additionally, we repaid the outstanding balance $374.4 million of our prior term loan. Related to the refinancing, we paid a tender premium $88.0 million for the early extinguishment of the 7.375% senior notes. Also in fiscal 2016, we made a $10.9 million payment related to the December 2015 conversion of 0.9 million shares of our 3.75% Series B Cumulative Perpetual Convertible Preferred Stock (see Note 20 in the “Notes to Consolidated Financial Statements”).
Fiscal 2016 compared to 2015
Cash used in financing activities was $4.5 million for fiscal 2016 compared to cash provided by financing activities of $1,372.4 million in 2015. During fiscal 2016, we completed a debt refinancing in which we issued $1,750.0 million principal value of 5.00% senior notes and utilized the proceeds to fund a tender offer of our 7.375% senior notes, which resulted in a principal payment of $1,242.0 million (or 90% of the total outstanding principal balance). Additionally, we repaid the outstanding balance of $374.4 million of our prior term loan. We paid a tender premium of $88.0 million for the early extinguishment of the 7.375% senior notes. Also in fiscal 2016, we made a $10.9 million payment related to the December 2015 conversion of 0.9 million shares of our 3.75% Series B Cumulative Perpetual Convertible Preferred Stock (Note 20 in the “Notes to Consolidated Financial Statements”). The prior year inflow was driven by net proceeds from the issuance of common stock of $732.7 million as well as the issuance of new debt as listed above.
38
Debt Covenants
Under the terms of our credit agreement, we are required to comply with a financial covenant consisting of a ratio for quarterly maximum senior secured leverage (as defined in the credit agreement) not to exceed 4.25 to 1.00, measured as of the last day of any fiscal quarter if, as of the last day of such fiscal quarter, the aggregate outstanding amount of all revolving credit loans, swing line loans and letter of credit obligations (subject to certain exceptions specified in the credit agreement) exceeds 30% of the Company’s revolving credit commitments. As of September 30, 2017, we were not required to comply with such financial covenant as the aggregate amount of the aforementioned obligations did not exceed 30%. We do not believe non-compliance is reasonably likely in the foreseeable future.
Our credit agreement permits us to incur additional unsecured debt if, among other conditions, our pro forma consolidated interest coverage ratio, calculated as provided in the credit agreement, would be greater than or equal to 2.00 to 1.00 after giving effect to such new debt. As of September 30, 2017, our pro forma consolidated interest coverage ratio exceeded this threshold.
Contractual Obligations
In the normal course of business, we enter into contracts and commitments which obligate us to make payments in the future. The table below sets forth our significant future obligations by time period as of September 30, 2017. For consideration of the table below, “Less Than 1 Year” refers to obligations due between October 1, 2017 and September 30, 2018, “1-3 Years” refers to obligations due between October 1, 2018 and September 30, 2020, “3-5 Years” refers to obligations due between October 1, 2020 and September 30, 2022, and “More Than 5 Years” refers to any obligations due after September 30, 2022.
(dollars in millions) | Total (f) | Less Than 1 Year | 1-3 Years | 3-5 Years | More Than 5 Years | ||||||||||||||
Debt | $ | 7,212.2 | $ | 22.1 | $ | 44.1 | $ | 44.0 | $ | 7,102.0 | |||||||||
Interest on long-term debt(a) | 2,773.5 | 350.1 | 697.9 | 694.8 | 1,030.7 | ||||||||||||||
Operating lease obligations(b) | 152.9 | 22.4 | 49.0 | 43.4 | 38.1 | ||||||||||||||
Purchase obligations(c) | 3,114.6 | 1,125.4 | 896.9 | 523.1 | 569.2 | ||||||||||||||
Deferred compensation obligations(d) | 22.5 | 0.6 | 3.2 | 5.4 | 13.3 | ||||||||||||||
Net benefit obligations(e) | 317.0 | 25.7 | 54.9 | 58.8 | 177.6 | ||||||||||||||
Total | $ | 13,592.7 | $ | 1,546.3 | $ | 1,746.0 | $ | 1,369.5 | $ | 8,930.9 | |||||||||
____________
(a) | As of September 30, 2017, we had interest rate swaps with a notional value of $2,725.4 million consisting of: |
• | $76.1 million which will result in cash payments which began in July 2016 and will continue through May 2021; |
• | $750.0 million which will result in three net settlements with the first occurring in July 2018 and the last in July 2020; |
• | $899.3 million which will result in a net settlement in December 2019; and |
• | $1,000.0 million that obligates us to pay a fixed rate and receive one-month LIBOR, and requires monthly cash settlements that began in June 2017 and end in May 2024. |
Those payments have been excluded from this table. For additional information on our interest rate swaps, refer to “Quantitative and Qualitative Disclosures About Market Risk” in Item 7A and Note 13 of “Notes to Consolidated Financial Statements.”
(b) | Operating lease obligations consist of minimum rental payments under noncancelable operating leases, as shown in Note 16 of “Notes to Consolidated Financial Statements.” |
(c) | Purchase obligations are legally binding agreements to purchase goods, services or equipment that specify all significant terms, including: fixed or minimum quantities to be purchased and/or penalties imposed for failing to meet contracted minimum purchase quantities; fixed, minimum or variable price provisions; and the approximate timing of the transaction. Estimates of future open market egg prices and feed costs were used to derive the amounts reported for our egg contracts. |
(d) | Deferred compensation obligations were allocated to time periods based on existing payment plans for terminated and severed employees, the estimated timing of distributions to current employees based on age and expected service term for members of the Board of Directors. |
(e) | Benefit obligations consist of future payments related to pension and other postretirement benefits as estimated by an actuarial valuation and shown in Note 17 of “Notes to Consolidated Financial Statements.” |
(f) | We have excluded from the table above $11.3 million, which includes interest and penalties, for certain provisions of ASC Topic 740 “Income Taxes” associated with liabilities for uncertain tax positions due to the uncertainty as to the amount and timing of payments, if any. In addition, we have excluded payments for workers compensation, general liability and auto liability claim losses for which we had a liability recorded of $14.8 million at September 30, 2017, of which $6.2 million was classified as current, due to the uncertainty of the amount and timing of payments. |
39
COMMODITY TRENDS AND SEASONALITY
Our Company is exposed to price fluctuations primarily from purchases of raw and packaging materials, fuel, and energy. Primary exposures include corn, wheat, soybean oil and meal, nuts, eggs, dairy, durum wheat, whey protein, milk protein concentrate, natural gas, diesel fuel, linerboard and resin. These costs have been volatile in recent years and future changes in such costs may cause our results of operations and our operating margins to fluctuate significantly. We manage the impact of cost increases, wherever possible, on commercially reasonable terms, by locking in prices on the quantities required to meet our production requirements. In addition, we offset the effect of increased costs by raising prices to our customers. However, for competitive reasons, we may not be able to pass along the full effect of increases in raw materials and other input costs as we incur them. In addition, inflationary pressures can have an adverse effect on the Company through higher raw material and fuel costs. We believe that inflation has not had a material adverse impact on our operations for the years ended September 30, 2017, 2016 and 2015, but could have a material impact in the future if inflation rates were to significantly exceed our ability to achieve price increases.
Demand for certain of our products may be influenced by holidays, changes in seasons or other events. For example, demand for our egg products, cheese and snacking and baking nuts tends to increase during the Thanksgiving, Christmas and other holiday seasons, which may result in increased net sales in certain of our segments during the first quarter of our fiscal year. Demand for our Malt-O-Meal hot wheat and Ready Brek hot oats cereals also tends to be seasonably biased towards the colder winter season. On a consolidated basis, our revenues and results of operations are distributed relatively evenly over the quarters in our fiscal year.
CURRENCY
Certain sales and costs of our foreign operations were denominated in Canadian Dollars, Euros, Pounds Sterling, South African Rand, Kenyan Shilling, Mexican Peso, Chinese Yuan and United Arab Emirates Dirham. Consequently, profits from these businesses can be impacted by fluctuations in the value of these currencies relative to the United States Dollar.
OFF-BALANCE SHEET ARRANGEMENTS
As of September 30, 2017 and September 30, 2016, we did not have any off-balance sheet arrangements as defined in Item 303(a)(4) of Regulation S-K that are likely to have a material impact on our financial position or results of operations.
CRITICAL ACCOUNTING ESTIMATES
The preparation of financial statements in accordance with accounting principles generally accepted in the United States requires the use of judgment, estimates and assumptions. We make these subjective determinations after considering our historical performance, management’s experience, current economic trends and events and information from outside sources. Inherent in this process is the possibility that actual results could differ from these estimates and assumptions for any particular period.
Our significant accounting policies are described in Note 2 of “Notes to Consolidated Financial Statements.” Our critical accounting estimates are those that have a meaningful impact on the reporting of our financial condition and results of operations.
Revenue Recognition - Revenue is recognized when title of goods is transferred to the customer, as specified by the shipping terms. Net sales reflect gross sales, including amounts billed to customers for shipping and handling, less sales discounts and trade allowances (including promotional price buy downs and new item promotional funding). Customer trade allowances are generally computed as a percentage of gross sales. Products are generally sold with no right of return except in the case of goods which do not meet product specifications or are damaged and related reserves are maintained based on return history. If additional rights of return are granted, revenue recognition is deferred. Estimated reductions to revenue for customer incentive offerings are based upon customer redemption history.
Business Combinations - We use the acquisition method in accounting for acquired businesses. Under the acquisition method, our financial statements reflect the operations of an acquired business starting from the completion of the acquisition. The assets acquired and liabilities assumed are recorded at their respective estimated fair values at the date of the acquisition. Any excess of the purchase price over the estimated fair values of the identifiable net assets acquired is recorded as goodwill. Significant judgment is often required in estimating the fair value of assets acquired, particularly intangible assets. As a result, in the case of significant acquisitions we normally obtain the assistance of a third party valuation specialist in estimating fair values of tangible and intangible assets. The fair value estimates are based on available historical information and on expectations and assumptions about the future, considering the perspective of marketplace participants. While we believe those expectations and assumptions are reasonable, they are inherently uncertain. Unanticipated market or macroeconomic events and circumstances may occur, which could affect the accuracy or validity of the estimates and assumptions.
Long-Lived Assets - We review long-lived assets, including leasehold improvements, property and equipment, and amortized intangible assets for impairment whenever events or changes in business circumstances indicate that the carrying amount of the assets may not be fully recoverable. Long-lived assets to be disposed of are reported at the lower of the carrying amount or fair
40
value less the cost to sell. Recoverability of assets held for sale is measured by a comparison of the carrying amount of an asset or asset group to their fair value less estimated costs to sell. Estimating future cash flows and calculating the fair value of assets requires significant estimates and assumptions by management.
Indefinite Lived Assets - Trademarks with indefinite lives are reviewed for impairment during the fourth quarter of each fiscal year following the annual forecasting process, or more frequently if facts and circumstances indicate the trademark may be impaired. In assessing other intangible assets not subject to amortization for impairment, we have the option to perform a qualitative assessment to determine whether the existence of events or circumstances leads to a determination that it is more likely than not that the fair value of such an intangible asset is less than its carrying amount. If we determine that it is not more likely than not that the fair value of such an intangible asset is less than its carrying amount, then we are not required to perform any additional tests for assessing intangible assets for impairment. However, if we conclude otherwise or elect not to perform the qualitative assessment, then we are required to perform a quantitative impairment test that involves a comparison of the estimated fair value of the intangible asset with its carrying value. If the carrying value of the intangible asset exceeds its fair value, an impairment loss is recognized in an amount equal to that excess.
In fiscal years 2017, 2016 and 2015, we elected not to perform a qualitative assessment and instead performed a quantitative impairment test. The estimated fair value is determined using an income-based approach (the relief-from-royalty method), which requires significant assumptions for each brand, including estimates regarding future revenue growth, discount rates, and appropriate royalty rates. We estimated royalty rates based on consideration of several factors for each brand, including profit levels, research of external royalty rates by third party experts, and the relative importance of each brand to the Company. Revenue growth assumptions are based on historical trends and management’s expectations for future growth by brand. The discount rates are based on a weighted-average cost of capital utilizing industry market data of similar companies.
For the year ended September 30, 2017, the Company conducted an impairment review and concluded there was no impairment of other indefinite-lived intangible assets as of September 30, 2017. At September 30, 2017, the fair value of the Honey Bunches of Oats brand exceeded its carrying value of $243.9 million, or by 8%. Due to declining sales, as discussed in Segment Results above, the fair value of the brand decreased as compared to prior year. A 75 basis point reduction to the estimated growth rate would have resulted in an immaterial impairment. At September 30, 2017, the estimated fair values of all other indefinite-lived intangible assets exceeded their carrying values by at least 15%, (the Great Grains brand being the lowest) with the exception of the recently acquired Weetabix brand, whose fair value exceeded its carrying value by 3%.
For the year ended September 30, 2016, the Company conducted an impairment review and concluded there was no impairment of other indefinite-lived intangible assets as of September 30, 2016. At September 30, 2016, the estimated fair values of all other indefinite-lived intangible assets exceeded their carrying values by at least 36%.
At September 30, 2015, Post recorded impairment losses in the Post Consumer Brands segment of $3.7 million for the Grape-Nuts brand and $0.1 million for the 100% Bran brand to record these trademarks at their estimated current fair values of $11.2 million and zero, respectively. Impairment charges of these Post Foods brands were primarily the result of declines within the branded RTE cereal category and as a result, management’s decisions to reduce advertising and consumer spend for the brands and to no longer pursue product adjacencies related to Grape-Nuts. A change to the management team for the Post Consumer Brands segment occurred in May 2015, and at that time a comprehensive reassessment of brand strategies was performed which resulted in the fourth quarter decisions that triggered the impairments. Due to repeated past impairments, continued weakness in the brand forecasts and a lack of sales growth from recent brand support efforts, as of October 1, 2015, the Grape-Nuts brand was converted to a definite-lived asset and assigned a 20 year useful life.
Goodwill - Goodwill represents the excess of the cost of acquired businesses over the fair market value of their identifiable net assets. We conduct a goodwill impairment qualitative assessment during the fourth quarter of each fiscal year following the annual forecasting process, or more frequently if facts and circumstances indicate that goodwill may be impaired. The goodwill impairment qualitative assessment requires us to perform an assessment to determine if it is more likely than not that the fair value of the business is less than its carrying amount. The qualitative assessment considers various factors, including the macroeconomic environment, industry and market specific conditions, financial performance, cost impacts, and issues or events specific to the business. If adverse qualitative trends are identified that could negatively impact the fair value of the business, we perform a quantitative goodwill impairment test. In fiscal years 2017, 2016 and 2015, we elected not to perform a qualitative assessment and instead performed a quantitative impairment test for all reporting units.
Under Accounting Standards Update (“ASU”) 2017-04, which was early adopted on a prospective basis in the fourth quarter of fiscal 2017, the goodwill impairment test requires an entity to compare the fair value of each reporting unit with its carrying amount. An impairment charge should be recognized for the amount by which the carrying amount of goodwill exceeds the reporting unit’s fair value with the loss not exceeding the total amount of goodwill allocated to that reporting unit.The estimated fair values of each reporting unit were determined using a combined income and market approach with a greater weighting on the income approach (75% of the calculation for all reporting units, excluding Dymatize which is 100%). The income approach is based on discounted future cash flows and requires significant assumptions, including estimates regarding future revenue, profitability, and capital requirements. The market approach (25% of the calculation for all reporting units, excluding Dymatize
41
which is 0%) is based on a market multiple (revenue and EBITDA which stands for earnings before interest, income taxes, depreciation, and amortization) and requires an estimate of appropriate multiples based on market data. Revenue growth assumptions (along with profitability and cash flow assumptions) were based on historical trends for the reporting units and management's expectations for future growth. The discount rates were based on a risk adjusted weighted-average cost of capital utilizing industry market data of businesses similar to the reporting units and based upon management judgment. For the market approach, we used estimated EBITDA and revenue multiples based on industry market data. For the Dymatize unit, the market approach was not used as it was concluded that the selected industry market data was not consistent with a business with the future growth expectations of this reporting unit.
Prior to the adoption of ASU 2017-04 in fiscal 2017, the impairment test required a two-step quantitative evaluation. Step one of the evaluation involved comparing the current fair value of each reporting unit to its carrying value, including goodwill, consistent with as described above. If the fair value of a reporting unit determined in step one of the evaluation was lower than its carrying value, we proceeded to step two, which compared the carrying value of goodwill to its implied fair value. In estimating the implied fair value of goodwill for a reporting unit, we assigned the fair value of the reporting unit (as determined in the first step) to the assets and liabilities associated with the reporting unit as if the reporting unit had been acquired in a business combination. Any excess of the carrying value of goodwill of the reporting unit over its implied fair value was recorded as impairment.
For the year ended September 30, 2017, we recorded a charge of $26.5 million for the impairment of goodwill. The impairment charge related to our Dymatize reporting unit which is included in the Active Nutrition segment. In fiscal 2017, consistent with the prior year, the specialty sports nutrition channel, in which Dymatize sells the majority of its products, continued to experience weak sales which resulted in management lowering its long-term expectations for the Dymatize reporting unit. After conducting step one of the impairment analysis, it was determined that the carrying value of the Dymatize reporting unit exceeded its fair value by $76.6 million. As the application of ASU 2017-04 does not allow for step two of the analysis prescribed prior to the adoption of ASU 2017-04, we recorded an impairment charge for of goodwill down to the fair value. At the time of the analysis, the Dymatize reporting unit had $26.5 million of remaining goodwill, and we therefore recorded an impairment charge for the entire goodwill balance of $26.5 million. At September 30, 2017, the estimated fair values of all other reporting units exceeded their carrying values by at least 25%, with the exception of the recently acquired Weetabix business unit, whose fair value exceeded its carrying value by 1%.
We did not record a goodwill impairment charge as of September 30, 2016. With the exception of Dymatize, all reporting units passed the first step of the impairment test. Dymatize failed step one and accordingly, we proceeded to perform step two of the analysis. Based on the results of step two, we determined that the fair value of the goodwill allocated to the Dymatize reporting unit exceeded its carrying value by approximately $36.0 million and was therefore not impaired as of September 30, 2016. At September 30, 2016, the estimated fair values of all other reporting units exceeded their carrying values by at least 33%.
As of September 30, 2015, we recorded a total charge of $57.0 million for the impairment of goodwill. The impairment charge related to the Active Nutrition segment and was primarily the result of fourth quarter production issues at Dymatize which resulted in the Company’s decision to close its manufacturing facility and permanently transfer production to third party facilities under co-manufacturing agreements. At September 30, 2015, the estimated fair values of the remaining unimpaired reporting units exceeded their carrying values in excess of 15%.
Pension and Other Postretirement Benefits - Pension assets and liabilities are determined on an actuarial basis and are affected by the estimated market-related value of plan assets, estimates of the expected return on plan assets, discount rates, future salary increases, and other assumptions inherent in these valuations. We annually review the assumptions underlying the actuarial calculations and make changes to these assumptions, based on current market conditions and historical trends, as necessary. Differences between the actual return on plan assets and the expected return on plan assets and changes to projected future rates of return on plan assets will affect the amount of pension expense or income ultimately recognized. The other postretirement benefits liability (partially subsidized retiree health and life insurance) is also determined on an actuarial basis and is affected by assumptions including the discount rate and expected trends in healthcare costs. Changes in the discount rate and differences between actual and expected healthcare costs will affect the recorded amount of other postretirement benefits expense. For both pensions and other postretirement benefit calculations, the assumed discount rate is determined by projecting the plans’ expected future benefit payments as defined for the projected benefit obligation or accumulated postretirement benefit obligation, discounting those expected payments using a theoretical zero-coupon spot yield curve derived from a universe of high-quality (rated AA or better by Moody’s Investor Service) corporate bonds as of the measurement date, and solving for the single equivalent discount rate that results in the same present value. A 1% decrease in the assumed discount rate (from 3.86% to 2.86% for U.S. pension; from 3.77% to 2.77% for U.S. other postretirement benefits; from 3.63% to 2.63% for Canadian pension; from 3.69% to 2.69% for Canadian other postretirement benefits; and from 2.72% to 1.72% for Other International pension) would have increased the recorded benefit obligations at September 30, 2017 by approximately $176.3 million for pensions and approximately $9.8 million for other postretirement benefits. The expected return on plan assets was determined based on historical and expected future returns of the various asset classes, using the target allocations of the plans. A 1% decrease in the assumed return on plan assets (from 5.33% to 4.23% for U.S., from 6.00% to 5.00% for Canadian and from 3.52% to 2.52% for Other
42
International) would have increased the net periodic benefit cost for the pension plans by approximately $2.7 million. We expect to contribute $14.8 million to the combined pension plans in fiscal 2018. No contributions to our postretirement medical benefit plans are expected in fiscal 2017. Contributions beyond 2017 remain uncertain and will significantly depend on changes in actuarial assumptions, actual return on plan assets and any legislative or regulatory changes that may affect plan funding requirements. See Note 17 of “Notes to Consolidated Financial Statements” for more information about pension and other postretirement benefit assumptions.
Income Tax - We estimate income tax expense based on taxes in each jurisdiction. We estimate current tax exposures together with temporary differences resulting from differing treatment of items for tax and financial reporting purposes. These temporary differences result in deferred tax assets and liabilities. We believe that sufficient income will be generated in the future to realize the benefit of most of our deferred tax assets. Where there is not sufficient evidence that such income is likely to be generated, we establish a valuation allowance against the related deferred tax assets. We are subject to periodic audits by governmental tax authorities of our income tax returns. These audits generally include questions regarding our tax filing positions, including the amount and timing of deductions and the allocation of income among various tax jurisdictions. We evaluate our exposures associated with our tax filing positions, including state and local taxes, and record reserves for estimated exposures.
United States federal, United States state and Canadian income tax returns for the tax years ended September 30, 2016, 2015 and 2014 are subject to examination by the tax authorities in each respective jurisdiction. The Michael Foods tax return for the short year ended June 2, 2014 was examined by the Internal Revenue Service without adjustment.
For the NPE acquisition made in 2017 and acquisitions made in 2015, the seller generally retained responsibility for all income tax liabilities through the date of acquisition. With respect to the acquisition of the Weetabix Group, the Company assumed substantially all income tax liabilities for those jurisdictions which remain subject to examination. With respect to the Michael Foods acquisition, we assumed all income tax liabilities for those jurisdictions which remain subject to examination, consisting primarily of the short tax year ended June 2, 2014, the date of acquisition. We did not assume any pre-acquisition tax liabilities related to the 2016 acquisition of WEF.
See Note 8 of “Notes to Consolidated Financial Statements” for more information about estimates affecting income taxes.
RECENTLY ISSUED AND ADOPTED ACCOUNTING STANDARDS
See Note 3 of “Notes to Consolidated Financial Statements” for a discussion regarding recently issued and adopted accounting standards.
ITEM 7A. QUANTITATIVE AND QUALITATIVE DISCLOSURES ABOUT MARKET RISK
Commodity Price Risk
In the ordinary course of business, we are exposed to commodity price risks relating to the acquisition of raw materials and fuels. We use futures contracts, options and swaps to manage certain of these exposures when it is practical to do so. For more information, see “Commodity Trends and Seasonality” and Note 13 of “Notes to Consolidated Financial Statements.”
Foreign Currency Risk
Related to its foreign subsidiaries, the Company is exposed to risks of fluctuations in future cash flows and earnings due to changes in exchange rates. To mitigate these risks, the Company uses a combination of foreign exchange contracts which may consist of options, forward contracts and currency swaps. At Sepetember 30, 2017, the Company had a total notional amount of $473.4 million of such instruments outstanding, a portion of which are designated as cash flow and net investment hedges. The fair value of foreign exchange contracts consists of assets of $1.6 million and liabilities of $25.1 million. For additional information, refer to Note 13 of the “Notes to Consolidated Financial Statements.”
Interest Rate Risk
As of September 30, 2017, we have principal value of indebtedness of $7,212.2 million related to our senior notes, term loan, capital lease and an undrawn $800.0 million revolving credit facility. The revolving credit facility has outstanding letters of credit of $10.0 million which reduced the available borrowing capacity to $790.0 million at September 30, 2017. Of the total $7,212.2 million outstanding indebtedness, $5,017.7 million bears interest at a weighted-average fixed interest rate of 5.5%.
As of September 30, 2017, we had interest rate swaps with a notional value of $2,725.4 million consisting of:
• | $76.1 million resulting in cash payments which began in July 2016 and will continue through May 2021; |
• | $750.0 million which will result in three net settlements with the first occurring in July 2018 and the last in July 2020; |
• | $899.3 million which will result in a net settlement in December 2019; and |
43
• | $1,000.0 million that obligates us to pay a fixed rate and receive one-month LIBOR, and requires monthly cash settlements that began in June 2017 and end in May 2024. |
Borrowings under the revolving credit facility will bear interest, at our option, at an annual rate equal to either the Base Rate, Eurodollar Rate or Canadian Dollar Offered Rate (“CDOR Rate”) plus an applicable margin ranging from 1.75% to 2.25% for Eurodollar Rate-based loans and CDOR Rate-based loans and from 0.75% to 1.25% for Base Rate-based loans, depending in each case on our senior secured leverage ratio.
44
ITEM 8. FINANCIAL STATEMENTS AND SUPPLEMENTARY DATA
INDEX TO FINANCIAL STATEMENTS
Audited Consolidated Financial Statements | |
Report of Independent Registered Public Accounting Firm | |
Consolidated Statements of Operations for the Fiscal Years Ended September 30, 2017, 2016 and 2015 | |
Consolidated Statements of Comprehensive Income (Loss) for the Fiscal Years Ended September 30, 2017, 2016 and 2015 | |
Consolidated Balance Sheets as of September 30, 2017 and 2016 | |
Consolidated Statements of Cash Flows for the Fiscal Years Ended September 30, 2017, 2016 and 2015 | |
Consolidated Statements of Shareholders’ Equity for the Fiscal Years Ended September 30, 2017, 2016 and 2015 | |
Notes to Consolidated Financial Statements | |
45
Report of Independent Registered Public Accounting Firm
To the Board of Directors and Shareholders of Post Holdings, Inc.,
In our opinion, the accompanying consolidated balance sheets and the related consolidated statements of operations, comprehensive income (loss), shareholders’ equity and cash flows present fairly, in all material respects, the financial position of Post Holdings, Inc. and its subsidiaries as of September 30, 2017 and 2016 and the results of their operations and their cash flows for each of the three years in the period ended September 30, 2017 in conformity with accounting principles generally accepted in the United States of America. Also in our opinion, the Company maintained, in all material respects, effective internal control over financial reporting as September 30, 2017, based on criteria established in Internal Control - Integrated Framework (2013) issued by the Committee of Sponsoring Organizations of the Treadway Commission (COSO). The Company's management is responsible for these financial statements, for maintaining effective internal control over financial reporting and for its assessment of the effectiveness of internal control over financial reporting, included in Management's Report on Internal Control over Financial Reporting. Our responsibility is to express opinions on these financial statements and on the Company's internal control over financial reporting based on our integrated audits. We conducted our audits in accordance with the standards of the Public Company Accounting Oversight Board (United States). Those standards require that we plan and perform the audits to obtain reasonable assurance about whether the financial statements are free of material misstatement and whether effective internal control over financial reporting was maintained in all material respects. Our audits of the financial statements included examining, on a test basis, evidence supporting the amounts and disclosures in the financial statements, assessing the accounting principles used and significant estimates made by management, and evaluating the overall financial statement presentation. Our audit of internal control over financial reporting included obtaining an understanding of internal control over financial reporting, assessing the risk that a material weakness exists, and testing and evaluating the design and operating effectiveness of internal control based on the assessed risk. Our audits also included performing such other procedures as we considered necessary in the circumstances. We believe that our audits provide a reasonable basis for our opinions.
As discussed in Note 3 to the consolidated financial statements, the Company changed the manner in which it accounts for goodwill impairment charges in 2017.
A company’s internal control over financial reporting is a process designed to provide reasonable assurance regarding the reliability of financial reporting and the preparation of financial statements for external purposes in accordance with generally accepted accounting principles. A company’s internal control over financial reporting includes those policies and procedures that (i) pertain to the maintenance of records that, in reasonable detail, accurately and fairly reflect the transactions and dispositions of the assets of the company; (ii) provide reasonable assurance that transactions are recorded as necessary to permit preparation of financial statements in accordance with generally accepted accounting principles, and that receipts and expenditures of the company are being made only in accordance with authorizations of management and directors of the company; and (iii) provide reasonable assurance regarding prevention or timely detection of unauthorized acquisition, use, or disposition of the company’s assets that could have a material effect on the financial statements.
Because of its inherent limitations, internal control over financial reporting may not prevent or detect misstatements. Also, projections of any evaluation of effectiveness to future periods are subject to the risk that controls may become inadequate because of changes in conditions, or that the degree of compliance with the policies or procedures may deteriorate.
As described in Management’s Report on Internal Control over Financial Reporting, management has excluded Latimer Newco 2 Limited (“Latimer”) and all of Latimer’s direct and indirect subsidiaries, including Weetabix Limited (collectively the “Weetabix Group”), from its assessment of internal control over financial reporting as of September 30, 2017, because it was acquired by the Company in a purchase business combination during fiscal year 2017. We have also excluded the Weetabix Group from our audit of internal control over financial reporting. The Weetabix Group is made up of wholly-owned subsidiaries whose total assets and total revenues excluded from management’s assessment and our audit of internal control over financial reporting represent $596.0 million or 5% and $140.5 million or 3%, respectively, of the related consolidated financial statement amounts as of and for the year ended September 30, 2017.
/s/PricewaterhouseCoopers LLP
St. Louis, Missouri
November 17, 2017
46
POST HOLDINGS, INC.
CONSOLIDATED STATEMENTS OF OPERATIONS
(in millions, except per share data)
Year Ended September 30, | |||||||||||
2017 | 2016 | 2015 | |||||||||
Net Sales | $ | 5,225.8 | $ | 5,026.8 | $ | 4,648.2 | |||||
Cost of goods sold | 3,651.7 | 3,479.4 | 3,473.8 | ||||||||
Gross Profit | 1,574.1 | 1,547.4 | 1,174.4 | ||||||||
Selling, general and administrative expenses | 867.4 | 839.7 | 734.1 | ||||||||
Amortization of intangible assets | 159.1 | 152.6 | 141.7 | ||||||||
Impairment of goodwill and other intangible assets | 26.5 | — | 60.8 | ||||||||
Other operating expenses, net | 0.8 | 9.4 | 25.1 | ||||||||
Operating Profit | 520.3 | 545.7 | 212.7 | ||||||||
Interest expense, net | 314.8 | 306.5 | 257.5 | ||||||||
Loss on extinguishment of debt, net | 222.9 | 86.4 | 30.0 | ||||||||
Other (income) expense, net | (91.8 | ) | 182.9 | 92.5 | |||||||
Earnings (Loss) before Income Taxes | 74.4 | (30.1 | ) | (167.3 | ) | ||||||
Income tax expense (benefit) | 26.1 | (26.8 | ) | (52.0 | ) | ||||||
Net Earnings (Loss) Including Noncontrolling Interest | 48.3 | (3.3 | ) | (115.3 | ) | ||||||
Less: Net loss attributable to noncontrolling interest | — | — | — | ||||||||
Net Earnings (Loss) | 48.3 | (3.3 | ) | (115.3 | ) | ||||||
Preferred stock dividends | (13.5 | ) | (25.1 | ) | (17.0 | ) | |||||
Net Earnings (Loss) Available to Common Shareholders | $ | 34.8 | $ | (28.4 | ) | $ | (132.3 | ) | |||
Earnings (Loss) per share: | |||||||||||
Basic | $ | 0.51 | $ | (0.41 | ) | $ | (2.33 | ) | |||
Diluted | $ | 0.50 | $ | (0.41 | ) | $ | (2.33 | ) | |||
Weighted-Average Common Shares Outstanding: | |||||||||||
Basic | 67.8 | 68.8 | 56.7 | ||||||||
Diluted | 69.9 | 68.8 | 56.7 | ||||||||
See accompanying Notes to Consolidated Financial Statements.
47
POST HOLDINGS, INC.
CONSOLIDATED STATEMENTS OF COMPREHENSIVE INCOME (LOSS)
(in millions)
Year Ended September 30, | |||||||||||
2017 | 2016 | 2015 | |||||||||
Net Earnings (Loss) | $ | 48.3 | $ | (3.3 | ) | $ | (115.3 | ) | |||
Pension and postretirement benefits adjustments: | |||||||||||
Unrealized pension and postretirement benefit obligations | 47.8 | 6.2 | (9.5 | ) | |||||||
Reclassifications to net earnings (loss) | (2.3 | ) | (0.8 | ) | 1.0 | ||||||
Unrealized gain on plan amendment (see Note 17) | — | 35.6 | — | ||||||||
Hedging adjustments: | |||||||||||
Unrealized net (loss) on derivatives (see Note 13) | (18.8 | ) | — | — | |||||||
Reclassifications to net earnings (loss) (see Note 13) | 0.7 | — | — | ||||||||
Foreign currency translation adjustments: | |||||||||||
Unrealized foreign currency translation adjustments | (5.7 | ) | 5.5 | (56.3 | ) | ||||||
Reclassifications to net loss (see Note 5) | — | (1.3 | ) | — | |||||||
Tax (expense) benefit on other comprehensive income (loss): | |||||||||||
Pension and postretirement benefits | (8.3 | ) | (16.5 | ) | 3.3 | ||||||
Hedging | 7.0 | — | — | ||||||||
Total Comprehensive Income (Loss) | $ | 68.7 | $ | 25.4 | $ | (176.8 | ) | ||||
See accompanying Notes to Consolidated Financial Statements.
48
POST HOLDINGS, INC.
CONSOLIDATED BALANCE SHEETS
(in millions, except par value)
September 30, | |||||||
2017 | 2016 | ||||||
ASSETS | |||||||
Current Assets | |||||||
Cash and cash equivalents | $ | 1,525.9 | $ | 1,143.6 | |||
Restricted cash | 4.2 | 8.4 | |||||
Receivables, net | 480.6 | 385.0 | |||||
Inventories | 573.5 | 503.1 | |||||
Prepaid expenses and other current assets | 31.7 | 36.8 | |||||
Total Current Assets | 2,615.9 | 2,076.9 | |||||
Property, net | 1,690.7 | 1,354.4 | |||||
Goodwill | 4,032.0 | 3,079.7 | |||||
Other intangible assets, net | 3,353.9 | 2,833.7 | |||||
Other assets | 184.3 | 15.9 | |||||
Total Assets | $ | 11,876.8 | $ | 9,360.6 | |||
LIABILITIES AND SHAREHOLDERS’ EQUITY | |||||||
Current Liabilities | |||||||
Current portion of long-term debt | $ | 22.1 | $ | 12.3 | |||
Accounts payable | 336.0 | 264.4 | |||||
Other current liabilities | 346.3 | 357.3 | |||||
Total Current Liabilities | 704.4 | 634.0 | |||||
Long-term debt | 7,149.1 | 4,551.2 | |||||
Deferred income taxes | 905.8 | 726.5 | |||||
Other liabilities | 327.8 | 440.3 | |||||
Total Liabilities | 9,087.1 | 6,352.0 | |||||
Commitments and Contingencies (See Note 16) | |||||||
Shareholders’ Equity | |||||||
Preferred Stock, $0.01 par value, 50.0 shares authorized | |||||||
3.75% Series B, 1.5 shares issued and outstanding in each year | — | — | |||||
2.50% Series C, 3.2 shares issued and outstanding in each year | |||||||
Common stock, $0.01 par value, 300.0 shares authorized, 66.1 and 64.9 shares outstanding, respectively | 0.7 | 0.7 | |||||
Additional paid-in capital | 3,566.5 | 3,546.0 | |||||
Accumulated deficit | (376.0 | ) | (424.3 | ) | |||
Accumulated other comprehensive loss | (40.0 | ) | (60.4 | ) | |||
Treasury stock, at cost, 5.8 and 1.8 shares, respectively | (371.2 | ) | (53.4 | ) | |||
Total Shareholders’ Equity Excluding Noncontrolling Interest | 2,780.0 | 3,008.6 | |||||
Noncontrolling interest | 9.7 | — | |||||
Total Shareholders’ Equity | 2,789.7 | 3,008.6 | |||||
Total Liabilities and Shareholders’ Equity | $ | 11,876.8 | $ | 9,360.6 | |||
See accompanying Notes to Consolidated Financial Statements.
49
POST HOLDINGS, INC.
CONSOLIDATED STATEMENTS OF CASH FLOWS
(in millions)
Year Ended September 30, | |||||||||||
2017 | 2016 | 2015 | |||||||||
Cash Flows from Operating Activities | |||||||||||
Net earnings (loss) | $ | 48.3 | $ | (3.3 | ) | $ | (115.3 | ) | |||
Adjustments to reconcile net earnings (loss) to net cash flow provided by operating activities: | |||||||||||
Depreciation and amortization | 323.1 | 302.8 | 272.8 | ||||||||
Loss on extinguishment of debt, net | 222.9 | 86.4 | 30.0 | ||||||||
(Gain) loss on foreign currency | (30.8 | ) | (0.2 | ) | 4.3 | ||||||
Impairment of goodwill and other intangible assets | 26.5 | — | 60.8 | ||||||||
Unrealized (gain) loss on interest rate swaps and cross-currency swaps, net | (93.6 | ) | 182.4 | 92.5 | |||||||
Assets held for sale | (0.2 | ) | 9.3 | 34.2 | |||||||
Non-cash stock-based compensation expense | 23.6 | 17.2 | 22.7 | ||||||||
Deferred income taxes | 17.4 | (74.6 | ) | (120.1 | ) | ||||||
Other, net | 4.4 | 0.8 | 9.1 | ||||||||
Other changes in current assets and liabilities, net of business acquisitions: | |||||||||||
(Increase) decrease in receivables | (52.1 | ) | (4.0 | ) | 89.5 | ||||||
(Increase) decrease in inventories | (2.5 | ) | (37.2 | ) | 30.5 | ||||||
Decrease (increase) in prepaid expenses and other current assets | 3.7 | (3.5 | ) | (7.0 | ) | ||||||
(Decrease) increase in accounts payable and other current liabilities | (109.0 | ) | 18.8 | 46.0 | |||||||
Increase in non-current liabilities | 5.0 | 7.5 | 1.6 | ||||||||
Net Cash Provided by Operating Activities | 386.7 | 502.4 | 451.6 | ||||||||
Cash Flows from Investing Activities | |||||||||||
Business acquisitions, net of cash acquired | (1,915.2 | ) | (94.4 | ) | (1,239.2 | ) | |||||
Additions to property | (190.4 | ) | (121.5 | ) | (107.9 | ) | |||||
Restricted cash | 4.2 | 10.4 | 72.1 | ||||||||
Proceeds from sale of property and assets held for sale | 10.6 | 2.1 | 20.4 | ||||||||
Proceeds from sale of businesses | — | 7.3 | 3.8 | ||||||||
Insurance proceeds on property losses | — | — | 2.1 | ||||||||
Net Cash Used in Investing Activities | (2,090.8 | ) | (196.1 | ) | (1,248.7 | ) | |||||
Cash Flows from Financing Activities | |||||||||||
Proceeds from issuance of long-term debt | 4,700.0 | 1,750.0 | 1,896.5 | ||||||||
Proceeds from issuance of common stock, net of issuance costs | — | — | 732.7 | ||||||||
Repayments of long-term debt | (2,088.4 | ) | (1,632.2 | ) | (1,225.1 | ) | |||||
Purchases of treasury stock | (317.8 | ) | — | — | |||||||
Payments of preferred stock dividends | (13.5 | ) | (14.4 | ) | (17.1 | ) | |||||
Premium from issuance of long-term debt | 41.2 | — | — | ||||||||
Preferred stock conversion | — | (10.9 | ) | — | |||||||
Payments of debt issuance costs | (59.0 | ) | (24.3 | ) | (31.5 | ) | |||||
Payment of premium on debt extinguishment | (219.8 | ) | (88.0 | ) | — | ||||||
Proceeds from exercise of stock awards | 13.4 | 6.6 | 15.5 | ||||||||
Net cash received from stock repurchase contracts | — | 1.1 | — | ||||||||
Other, net | (3.0 | ) | 7.6 | 1.4 | |||||||
Net Cash Provided by (Used in) Financing Activities | 2,053.1 | (4.5 | ) | 1,372.4 | |||||||
Effect of Exchange Rate Changes on Cash and Cash Equivalents | 33.3 | 0.4 | (2.3 | ) | |||||||
Net Increase in Cash and Cash Equivalents | 382.3 | 302.2 | 573.0 | ||||||||
Cash and Cash Equivalents, Beginning of Year | 1,143.6 | 841.4 | 268.4 | ||||||||
Cash and Cash Equivalents, End of Year | $ | 1,525.9 | $ | 1,143.6 | $ | 841.4 | |||||
See accompanying Notes to Consolidated Financial Statements.
50
POST HOLDINGS, INC.
CONSOLIDATED STATEMENTS OF SHAREHOLDERS’ EQUITY
(in millions)
Preferred Stock | Common Stock | Accumulated Other Comprehensive Loss | |||||||||||||||||||||||||||||||||||||||||||
Shares | Amount | Shares | Amount | Additional Paid-in Capital | Accumulated Deficit | Retirement Benefit Adjustments, net of tax | Hedging Adjustments, net of tax | Foreign Currency Translation Adjustments | Treasury Stock | Non-Controlling Interest | Total Shareholders’ Equity | ||||||||||||||||||||||||||||||||||
Balance, September 30, 2014 | 5.6 | $ | 0.1 | 44.8 | $ | 0.5 | $ | 2,669.3 | $ | (305.7 | ) | $ | (21.4 | ) | $ | — | $ | (6.2 | ) | $ | (53.4 | ) | $ | — | $ | 2,283.2 | |||||||||||||||||||
Net loss | — | — | — | — | — | (115.3 | ) | — | — | — | — | — | (115.3 | ) | |||||||||||||||||||||||||||||||
Preferred stock dividends declared | — | — | — | — | (17.1 | ) | — | — | — | — | — | — | (17.1 | ) | |||||||||||||||||||||||||||||||
Issuance of common stock | — | — | 16.7 | 0.1 | 847.0 | — | — | — | — | — | — | 847.1 | |||||||||||||||||||||||||||||||||
Activity under stock and deferred compensation plans | — | — | 0.6 | — | 16.9 | — | — | — | — | — | — | 16.9 | |||||||||||||||||||||||||||||||||
Stock-based compensation expense | — | — | — | — | 22.7 | — | — | — | — | — | — | 22.7 | |||||||||||||||||||||||||||||||||
Net change in retirement benefits, net of tax | — | — | — | — | — | — | (5.2 | ) | — | — | — | — | (5.2 | ) | |||||||||||||||||||||||||||||||
Foreign currency translation adjustments | — | — | — | — | — | — | — | — | (56.3 | ) | — | — | (56.3 | ) | |||||||||||||||||||||||||||||||
Balance, September 30, 2015 | 5.6 | $ | 0.1 | 62.1 | $ | 0.6 | $ | 3,538.8 | $ | (421.0 | ) | $ | (26.6 | ) | $ | — | $ | (62.5 | ) | $ | (53.4 | ) | $ | — | $ | 2,976.0 | |||||||||||||||||||
Net loss | — | — | — | — | — | (3.3 | ) | — | — | — | — | — | (3.3 | ) | |||||||||||||||||||||||||||||||
Preferred stock dividends declared | — | — | — | — | (14.4 | ) | — | — | — | — | — | — | (14.4 | ) | |||||||||||||||||||||||||||||||
Preferred stock conversion (see Note 20) | (0.9 | ) | (0.1 | ) | 2.0 | 0.1 | (10.9 | ) | — | — | — | — | — | — | (10.9 | ) | |||||||||||||||||||||||||||||
Activity under stock and deferred compensation plans | — | — | 0.6 | — | 14.2 | — | — | — | — | — | — | 14.2 | |||||||||||||||||||||||||||||||||
Stock-based compensation expense | — | — | — | — | 17.2 | — | — | — | — | — | — | 17.2 | |||||||||||||||||||||||||||||||||
Net cash received from stock repurchase contracts (see Note 20) | — | — | — | — | 1.1 | — | — | — | — | — | — | 1.1 | |||||||||||||||||||||||||||||||||
Tangible equity units conversion | — | — | 0.2 | — | — | — | — | — | — | — | — | — | |||||||||||||||||||||||||||||||||
Net change in retirement benefits, net of tax | — | — | — | — | — | — | 24.5 | — | — | — | — | 24.5 | |||||||||||||||||||||||||||||||||
Foreign currency translation adjustments | — | — | — | — | — | — | — | — | 4.2 | — | — | 4.2 | |||||||||||||||||||||||||||||||||
Balance, September 30, 2016 | 4.7 | $ | — | 64.9 | $ | 0.7 | $ | 3,546.0 | $ | (424.3 | ) | $ | (2.1 | ) | $ | — | $ | (58.3 | ) | $ | (53.4 | ) | $ | — | $ | 3,008.6 | |||||||||||||||||||
Net earnings | — | — | — | — | — | 48.3 | — | — | — | — | — | 48.3 | |||||||||||||||||||||||||||||||||
Preferred stock dividends declared | — | — | — | — | (13.5 | ) | — | — | — | — | — | — | (13.5 | ) | |||||||||||||||||||||||||||||||
Activity under stock and deferred compensation plans | — | — | 0.5 | — | 10.4 | — | — | — | — | — | — | 10.4 | |||||||||||||||||||||||||||||||||
51
Stock-based compensation expense | — | — | — | — | 23.6 | — | — | — | — | — | — | 23.6 | |||||||||||||||||||||||||||||||||
Purchases of treasury stock | — | — | (4.0 | ) | — | — | — | — | — | — | (317.8 | ) | — | (317.8 | ) | ||||||||||||||||||||||||||||||
Non-controlling interest in acquisition | — | — | — | — | — | — | — | — | — | — | 9.7 | 9.7 | |||||||||||||||||||||||||||||||||
Tangible equity units conversion | — | — | 4.7 | — | — | — | — | — | — | — | — | — | |||||||||||||||||||||||||||||||||
Net change in retirement benefits, net of tax | — | — | — | — | — | — | 37.2 | — | — | — | — | 37.2 | |||||||||||||||||||||||||||||||||
Net change in hedges, net of tax | — | — | — | — | — | — | — | (11.1 | ) | — | — | — | (11.1 | ) | |||||||||||||||||||||||||||||||
Foreign currency translation adjustments | — | — | — | — | — | — | — | — | (5.7 | ) | — | — | (5.7 | ) | |||||||||||||||||||||||||||||||
Balance, September 30, 2017 | 4.7 | $ | — | 66.1 | $ | 0.7 | $ | 3,566.5 | $ | (376.0 | ) | $ | 35.1 | $ | (11.1 | ) | $ | (64.0 | ) | $ | (371.2 | ) | $ | 9.7 | $ | 2,789.7 | |||||||||||||||||||
See accompanying Notes to Consolidated Financial Statements.
52
POST HOLDINGS, INC.
NOTES TO CONSOLIDATED FINANCIAL STATEMENTS
(dollars in millions, except per share data or where indicated otherwise)
NOTE 1 — BACKGROUND
Post Holdings, Inc. (“Post” or the “Company”) is a consumer packaged goods holding company operating in the center-of-the-store, foodservice, food ingredient, refrigerated, active nutrition and private brand food categories. The Company’s products are sold through a variety of channels such as grocery, club and drug stores, mass merchandisers, foodservice, ingredient and via the internet. Post operates in five reportable segments: Post Consumer Brands, Michael Foods Group, Active Nutrition, Private Brands and Weetabix. The Post Consumer Brands segment includes the North American ready-to-eat (“RTE”) cereal and granola businesses, inclusive of the recently acquired Weetabix North American RTE cereal business, the Michael Foods Group segment includes predominantly foodservice and food ingredient egg, potato and pasta businesses and a retail cheese business, the Active Nutrition segment includes protein shakes, bars and powders and nutritional supplements, the Private Brands segment primarily consists of peanut and other nut butters and dried fruit and nuts and the Weetabix segment includes the international (primarily United Kingdom) RTE cereal and muesli business.
On February 6, 2012, Post common stock began trading on the New York Stock Exchange under the ticker symbol “POST.”
Unless otherwise stated or the context otherwise indicates, all references in this Form 10-K to “Post,” “the Company,” “us,” “our” or “we” mean Post Holdings, Inc. and its consolidated and non-consolidated subsidiaries. Certain prior year amounts have been reclassified to conform with the 2017 presentation. These reclassifications had no impact on Net Loss or Shareholders’ Equity, as previously reported.
NOTE 2 — SUMMARY OF SIGNIFICANT ACCOUNTING POLICIES
Principles of Consolidation — The consolidated financial statements include the operations of Post and its wholly-owned and majority-owned subsidiaries. All intercompany transactions have been eliminated.
Use of Estimates and Allocations — The consolidated financial statements of the Company are prepared in conformity with accounting principles generally accepted in the United States of America (“GAAP”), which require certain elections as to accounting policy, estimates and assumptions that affect the reported amounts of assets, liabilities, the disclosure of contingent liabilities at the dates of the financial statements and the reported amount of net revenues and expenses during the reporting periods. Significant accounting policy elections, estimates and assumptions include, among others, pension and benefit plan assumptions, valuation assumptions of goodwill and other intangible assets, marketing programs, self insurance reserves and income taxes. Actual results could differ from those estimates.
Business Combinations — The Company uses the acquisition method in accounting for acquired businesses. Under the acquisition method, our financial statements reflect the operations of an acquired business starting from the completion of the acquisition. The assets acquired and liabilities assumed are recorded at their respective estimated fair values at the date of the acquisition. Any excess of the purchase price over the estimated fair values of the identifiable net assets acquired is recorded as goodwill.
Cash Equivalents — Cash equivalents include all highly liquid investments with original maturities of less than three months.
Restricted Cash — Restricted cash includes items such as cash deposits which serve as collateral for certain commodity hedging contracts as well as the Company's high deductible workers’ compensation insurance program. In addition, restricted cash at September 30, 2016 included deposits with third party escrow agents in connection with an acquisition that was credited against the purchase price when the transaction closed.
Receivables — Receivables are reported at net realizable value. This value includes appropriate allowances for doubtful accounts, cash discounts, and other amounts which the Company does not ultimately expect to collect. The Company determines its allowance for doubtful accounts based on historical losses as well as the economic status of, and its relationship with its customers, especially those identified as “at risk.” A receivable is considered past due if payments have not been received within the agreed upon invoice terms. Receivables are written off against the allowance when the customer files for bankruptcy protection or are otherwise deemed to be uncollectible based upon the Company’s evaluation of the customer’s solvency. The Weetabix Group, acquired July 3, 2017 (as defined and described in Note 5), sells certain receivables to third party institutions without recourse. The amount sold from the date of acquisition through September 30, 2017 was $37.3.
Inventories — Inventories, other than flocks, are generally valued at the lower of average cost (determined on a first-in, first-out basis) or net realizable value. Reported amounts have been reduced by an allowance for obsolete product and packaging materials based on a review of inventories on hand compared to estimated future usage and sales. Flock inventory represents the cost of purchasing and raising chicken flocks to egg laying maturity. The costs included in our flock inventory include the costs
53
of the chicks, the feed fed to the birds and the labor and overhead costs incurred to operate the pullet facilities until the birds are transferred into the laying facilities, at which time their cost is amortized to operations, as cost of goods sold, over their expected useful lives of one to two years.
Restructuring Expenses and Assets Held for Sale — Restructuring charges principally consist of severance, accelerated stock compensation and other employee separation costs, accelerated depreciation and certain long-lived asset impairments. The Company recognizes restructuring obligations and liabilities for exit and disposal activities at fair value in the period the liability is incurred. Employee severance costs are expensed when they become probable and reasonably estimable under established severance plans. Depreciation expense related to assets that will be disposed of or idled as a part of the restructuring activity is accelerated through the expected date of the asset shut down. Assets are classified as held for sale if the Company has committed to a plan for selling the assets, is actively and reasonably marketing them, and sale is reasonably expected within one year. The carrying value of assets held for sale is included in “Prepaid expenses and other current assets” on the Consolidated Balance Sheets. See Note 4 for information about restructuring expenses and assets held for sale.
Property — Property is recorded at cost, and depreciation expense is generally provided on a straight-line basis over the estimated useful lives of the properties. Estimated useful lives range from 1 to 20 years for machinery and equipment; 1 to 40 years for buildings, building improvements and leasehold improvements; and 1 to 5 years for software. Total depreciation expense was $164.0, $150.2 and $131.1 in fiscal 2017, 2016 and 2015, respectively. Any gains and losses incurred on the sale or disposal of assets are included in "Other operating expenses, net” in the Consolidated Statements of Operations. Repair and maintenance costs incurred in connection with on-going and planned major maintenance activities are accounted for under the direct expensing method. Property consisted of:
September 30, | |||||||
2017 | 2016 | ||||||
Land and land improvements | $ | 90.9 | $ | 58.0 | |||
Buildings and leasehold improvements | 699.4 | 618.2 | |||||
Machinery and equipment | 1,439.3 | 1,094.5 | |||||
Software | 64.5 | 50.4 | |||||
Construction in progress | 100.0 | 79.2 | |||||
2,394.1 | 1,900.3 | ||||||
Accumulated depreciation | (703.4 | ) | (545.9 | ) | |||
$ | 1,690.7 | $ | 1,354.4 | ||||
Other Intangible Assets — Other intangible assets consist primarily of customer relationships and trademarks/brands acquired in business combinations and includes both indefinite and definite-lived assets. Amortization expense related to definite-lived intangible assets, which is provided on a straight-line basis over the estimated useful lives of the assets, was $159.1, $152.6, and $141.7 in fiscal 2017, 2016 and 2015, respectively. For the definite-lived intangible assets recorded as of September 30, 2017, amortization expense of $167.5, $166.6, $166.5, $166.5 and $163.8 is expected for fiscal 2018, 2019, 2020, 2021 and 2022, respectively. Other intangible assets consisted of:
September 30, 2017 | September 30, 2016 | ||||||||||||||||||||||
Carrying Amount | Accum. Amort. | Net Amount | Carrying Amount | Accum. Amort. | Net Amount | ||||||||||||||||||
Subject to amortization: | |||||||||||||||||||||||
Customer relationships | $ | 2,249.3 | $ | (416.7 | ) | $ | 1,832.6 | $ | 2,012.7 | $ | (302.0 | ) | $ | 1,710.7 | |||||||||
Trademarks/brands | 834.1 | (162.9 | ) | 671.2 | 795.1 | (120.6 | ) | 674.5 | |||||||||||||||
Other | 21.7 | (9.8 | ) | 11.9 | 21.7 | (7.7 | ) | 14.0 | |||||||||||||||
3,105.1 | (589.4 | ) | 2,515.7 | 2,829.5 | (430.3 | ) | 2,399.2 | ||||||||||||||||
Not subject to amortization: | |||||||||||||||||||||||
Trademarks/brands | 838.2 | — | 838.2 | 434.5 | — | 434.5 | |||||||||||||||||
$ | 3,943.3 | $ | (589.4 | ) | $ | 3,353.9 | $ | 3,264.0 | $ | (430.3 | ) | $ | 2,833.7 | ||||||||||
Recoverability of Assets — The Company continually evaluates whether events or circumstances have occurred which might impair the recoverability of the carrying value of its assets, including property, identifiable intangibles and goodwill. Trademarks with indefinite lives are reviewed for impairment during the fourth quarter of each fiscal year following the annual forecasting process, or more frequently if facts and circumstances indicate the trademark may be impaired. The trademark impairment tests require us to estimate the fair value of the trademark and compare it to its carrying value. The estimated fair value is determined using an income-based approach (the relief-from-royalty method), which requires significant assumptions for each brand, including estimates regarding future revenue growth, discount rates, and appropriate royalty rates. Assumptions are determined after
54
consideration of several factors for each brand, including profit levels, research of external royalty rates by third party experts and the relative importance of each brand to the Company. Revenue growth assumptions are based on historical trends and management’s expectations for future growth by brand. The discount rate is based on a weighted-average cost of capital utilizing industry market data of similar companies.
In addition, definite-lived assets and indefinite-lived intangible assets are reassessed as needed when information becomes available that is believed to negatively impact the fair market value of an asset. In general, an asset is deemed impaired and written down to its fair value if estimated related future cash flows are less than its carrying amount. See Note 6 for information about goodwill impairments.
For the year ended September 30, 2017, the Company conducted an impairment review and concluded there was no impairment of other intangible assets as of September 30, 2017. At September 30, 2017, the fair value of the Honey Bunches of Oats brand exceeded its carrying value of $243.9 by 8%.
For the year ended September 30, 2016, the Company conducted an impairment review and concluded there was no impairment of other intangible assets as of September 30, 2016. At September 30, 2016, the estimated fair values of all other intangible assets exceeded their carrying value by at least 36%.
At September 30, 2015, Post recorded impairment losses in the Post Consumer Brands segment of $3.7 for the Grape-Nuts brand and $0.1 for the 100% Bran brand to record these trademarks at their estimated current fair values of $11.2 and zero, respectively. Due to repeated past impairments, continued weakness in the brand forecasts and a lack of sales growth from recent brand support efforts, as of October, 1 2015, the Grape-Nuts brand was converted to a definite-lived asset and assigned a 20 year useful life.
These fair value measurements fell within Level 3 of the fair value hierarchy as described in Note 14. The trademark impairment losses are reported in “Impairment of goodwill and other intangible assets” on the Consolidated Statements of Operations.
Deferred Compensation Investments — The Company funds a portion of its deferred compensation liability by investing in certain mutual funds in the same amounts as selected by the participating employees. Because management’s intent is to invest in a manner that matches the deferral options chosen by the participants and those participants can elect to transfer amounts in or out of each of the designated deferral options at any time, these investments have been classified as trading assets and are stated at fair value in “Prepaid expenses and other current assets” and “Other Assets” (see Note 14). Both realized and unrealized gains and losses on these assets are included in “Selling, general and administrative expenses” and offset the related change in the deferred compensation liability.
Revenue — Revenue is recognized when title of goods and risk of loss is transferred to the customer, as specified by the shipping terms. Net sales reflect gross sales, including amounts billed to customers for shipping and handling, less sales discounts and trade allowances (including promotional price buy downs and new item promotional funding). Customer trade allowances are generally computed as a percentage of gross sales. Products are generally sold with no right of return except in the case of goods which do not meet product specifications or are damaged, and related reserves are maintained based on return history. If additional rights of return are granted, revenue recognition is deferred. Estimated reductions to revenue for customer incentive offerings are based upon customer redemption history.
Cost of Goods Sold — Cost of goods sold includes, among other things, inbound and outbound freight costs and depreciation expense related to assets used in production, while storage and other warehousing costs are included in “Selling, general and administrative expenses” in the Consolidated Statement of Operations. Storage and other warehousing costs totaled $142.9, $124.1 and $103.4 in fiscal 2017, 2016 and 2015, respectively.
Advertising — Advertising costs are expensed as incurred except for costs of producing media advertising such as television commercials or magazine advertisements, which are deferred until the first time the advertising takes place. The amounts reported as assets on the balance sheet as “Prepaid expenses and other current assets” were $1.3 and $1.6 as of September 30, 2017 and 2016, respectively.
Stock-based Compensation — The Company recognizes the cost of employee services received in exchange for awards of equity instruments based on the grant-date fair value of equity awards and the fair market value at each quarterly reporting date for liability awards. That cost is recognized over the period during which an employee is required to provide service in exchange for the award — the requisite service period (usually the vesting period). See Note 18 for disclosures related to stock-based compensation.
Income Tax Expense (Benefit) — Income tax expense (benefit) is estimated based on income taxes in each jurisdiction and includes the effects of both current tax exposures and the temporary differences resulting from differing treatment of items for tax and financial reporting purposes. These temporary differences result in deferred tax assets and liabilities. A valuation allowance is established against the related deferred tax assets to the extent that it is not more likely than not that the future benefits will be
55
realized. Reserves are recorded for estimated exposures associated with the Company’s tax filing positions, which are subject to periodic audits by governmental taxing authorities. Interest due to an underpayment of income taxes is classified as income taxes. The Company considers the undistributed earnings of its foreign subsidiaries to be permanently reinvested, so no U.S. taxes have been provided in relation to the Company's investment in its foreign subsidiaries. See Note 8 for disclosures related to income taxes.
NOTE 3 — RECENTLY ISSUED AND ADOPTED ACCOUNTING STANDARDS
The Company has considered all new accounting pronouncements, and has concluded there are no new pronouncements (other than the ones described below) that had or will have an impact on the results of operations, other comprehensive income (“OCI”), financial condition, cash flows or shareholders’ equity based on current information.
Recently Issued
In March 2017, the Financial Accounting Standards Board (“FASB”) issued Accounting Standards Update (“ASU”) 2017-07, “Compensation - Retirement Benefits (Topic 715): Improving the Presentation of Net Periodic Pension Cost and Net Periodic Postretirement Benefit Cost.” ASU 2017-07 requires an entity to report the service cost component of periodic net benefit cost as an operating expense in the same line item or items as other compensation costs arising from services rendered by employees during the period. Other components of net benefit cost are to be presented outside of income from operations in the income statement separately from the service cost component. The amendments in this ASU also allow only the service cost component to be eligible for capitalization when applicable. This ASU is effective for annual periods beginning after December 15, 2017 and interim periods therein (i.e., Post’s financial statements for the year ending September 30, 2019), with early adoption permitted. Additionally, this ASU requires a retrospective method of adoption. The adoption of this ASU will result in a change in operating profit and a corresponding change to other (income) expense, net to reflect the exclusion of all components of net benefit cost, with the exception of service cost, from operating profit. For the year ended September 30, 2017, the reclassification would have resulted in a decrease in operating profit of $3.6.
In February 2016, the FASB issued ASU 2016-02, “Leases (Topic 842).” This standards update requires a company to recognize right-of-use assets and lease liabilities on its balance sheet and disclose key information about leasing arrangements. ASU 2016-02 offers specific accounting guidance for lessees, lessors and sale and leaseback transactions. Lessees and lessors are required to disclose qualitative and quantitative information about leasing arrangements to enable a user of the financial statements to assess the amount, timing and uncertainty of cash flows arising from leases. This ASU is effective for annual periods beginning after December 15, 2018 and interim periods therein (i.e., Post’s financial statements for the year ending September 30, 2020), with early adoption permitted. At adoption, this update will be applied using a modified retrospective approach. The Company is currently evaluating the impact and timing of adopting this guidance, however, an increase in both assets and liabilities is expected.
In January 2017, the FASB issued ASU 2017-01, “Business Combinations (Topic 805): Clarifying the Definition of a Business.” ASU 2017-01 adds guidance to assist entities with evaluating whether transactions should be accounted for as acquisitions (or disposals) of assets or businesses by providing a more specific definition of a business. This ASU is effective for annual periods beginning after December 15, 2017 and interim periods therein (i.e., Post’s financial statements for the year ending September 30, 2019), with early adoption permitted. This ASU currently has no impact on the Company, however, Post will evaluate the impact of this ASU on future business acquisitions and disposals.
In December 2016, the FASB issued ASU 2016-20, “Technical Corrections and Improvements to Topic 606, Revenue from Contracts with Customers.” ASU 2016-20 is intended to clarify and suggest improvements to the application of current standards under Topic 606 and other Topics amended by ASU 2014-09, “Revenue from Contracts with Customers (Topic 606).” The effective date of this ASU is the same as the effective date for ASU 2014-09 (i.e., Post’s financial statements for the year ending September 30, 2019). The Company is assessing the impact that the standard will have on its accounting policies, processes, system requirements, internal controls and disclosures. Internal resources have been assigned to this assessment, and the Company has engaged a third party to assist in the assessment and implementation. The Company has established a project plan, identified key revenue streams, completed an initial review of its customer contracts and is considering impacted policies and processes. The Company will adopt the standard on October 1, 2018 and expects to use the modified retrospective transition method of adoption. The Company continues to evaluate the effect that ASU 2014-09 will have on the consolidated financial statements and related disclosures.
In November 2016, the FASB issued ASU 2016-18, “Statement of Cash Flows (Topic 230): Restricted Cash.” ASU 2016-18 requires that a statement of cash flows explain the change in the total of cash, cash equivalents and amounts generally described as restricted cash or restricted cash equivalents, and therefore, restricted cash and restricted cash equivalents should be included with cash and cash equivalents when reconciling the beginning of year cash balance to the end of year cash balance as shown on the statement of cash flows. This ASU is effective for annual periods beginning after December 15, 2017 and interim periods therein (i.e., Post’s financial statements for the year ending September 30, 2019), with early adoption permitted. The Company currently classifies changes in restricted cash as an investing activity in the Condensed Consolidated Statements of Cash Flows,
56
not as a component of cash and cash equivalents as required by this ASU. Based on the historical balances of restricted cash on the Consolidated Balance Sheets, the change is not expected to be material. The Company is currently evaluating the timing of adopting this ASU.
Recently Adopted
In August 2017, the FASB issued ASU 2017-12, “Derivatives and Hedging (Topic 715): Targeted Improvements to Accounting for Hedging Activities.” ASU 2017-12 amends and simplifies existing guidance in order to allow companies to more accurately present the economic effects of risk management activities in the financial statements. This ASU requires a cumulative-effect adjustment related to eliminating the separate measurement of ineffectiveness to accumulated OCI with a corresponding adjustment to the opening balance of retained earnings as of the beginning of the fiscal year that a company adopts the ASU. In addition, this ASU requires amended presentation and disclosure guidance to be applied prospectively. The Company early adopted this ASU in fiscal 2017, as permitted by the standard. The adoption of this guidance modified the presentation of disclosures in Note 13, but did not have an impact on the Company’s financial statements.
In January 2017, the FASB issued ASU 2017-04, “Intangibles - Goodwill and Other (Topic 350): Simplifying the Test for Goodwill Impairment.” ASU 2017-04 eliminates step two of the goodwill impairment test, which requires the calculation of the implied fair value of goodwill to measure a goodwill impairment charge. Under this ASU, an entity should perform its annual or interim goodwill impairment test by comparing the fair value of the reporting unit with its carrying amount, and should recognize an impairment charge for the amount by which the carrying amount exceeds the reporting unit’s fair value with the loss not exceeding the total amount of goodwill allocated to that reporting unit. The Company early adopted this ASU using a prospective approach during the fourth quarter of fiscal 2017, as permitted by the standard. The adoption of this ASU resulted in an impairment of goodwill of $26.5 in the Active Nutrition segment in the year ended September 30, 2017. See Note 6 for further discussion of this impairment.
In March 2016, the FASB issued ASU 2016-09, “Compensation - Stock Compensation (Topic 718): Improvement to Employee Share-Based Payment Accounting.” The updated guidance changes the accounting for certain aspects of share-based payment awards to employees, including the accounting for income taxes, forfeitures, and statutory tax withholding requirements, as well as classification of certain items in the statement of cash flows. The Company early adopted this ASU during fiscal 2017, as permitted by the standard. The adoption of this ASU did not have a material impact on the Company’s Consolidated Financial Statements and included the following items: (i) adoption on a prospective basis of the recognition of excess tax benefits and tax deficiencies in income tax expense (benefit) in the Consolidated Statement of Operations for vested and exercised equity awards as discrete items in the period in which they occur; (ii) adoption on a modified retrospective basis of recording forfeitures for share based awards as they occur rather than estimating future forfeitures and their effect on expense; (iii) adoption on a prospective basis of the classification of excess tax benefits in cash flows from operations in the Company’s Consolidated Statements of Cash Flows resulting in reclassifications of $6.2 of excess tax benefits from the exercise of stock awards in the Consolidated Statements of Cash Flows from “Other, net” within financing activities to “Other, net” within operating activities for the year ended September 30, 2017 ($9.6 and $3.3 for the years ended September 30, 2016 and 2015, respectively, had the standard been adopted retrospectively), as well as from “Additional paid-in capital” on the Consolidated Balance Sheets to “Income tax expense (benefit)” on the Consolidated Statements of Operations; and (iv) adoption on a prospective basis for the exclusion of the amount of excess tax benefits when applying the treasury stock method for the Company’s diluted earnings per share calculation.
NOTE 4 — RESTRUCTURING
In September 2015, the Company announced its plan to close its Dymatize manufacturing facility located in Farmers Branch, Texas and permanently transfer production to third party facilities under co-manufacturing agreements. Plant production ceased in the fourth quarter of 2015, and the facility was sold in December 2016. No additional restructuring costs were incurred in fiscal 2017.
In May 2015, the Company announced its plan to consolidate its cereal business administrative offices into its Lakeville, Minnesota location. In connection with the consolidation, the Company closed its office located in Parsippany, New Jersey and relocated those functions as well as certain functions located in Battle Creek, Michigan to the Lakeville office. The Parsippany office closure was completed during fiscal 2016. No additional restructuring costs were incurred in fiscal 2017.
In March 2015, the Company announced its plan to close its facility in Boise, Idaho, which manufactured certain PowerBar products distributed in North America. Plant production ceased in June 2015 and the facility was sold in September 2015. No additional restructuring costs were incurred in fiscal 2017 or 2016.
In April 2013, the Company announced management’s decision to close its cereal plant located in Modesto, California as part of a cost savings and capacity rationalization effort. The transfer of production capabilities and closure of the plant was completed during September 2014, the facility was sold in March 2017 and no additional restructuring costs were incurred in fiscal 2017, 2016 or 2015.
57
Amounts related to the restructuring events are shown in the following table. Costs are recognized in “Selling, general and administrative expenses” in the Consolidated Statements of Operations. These expenses are not included in the measure of segment performance for any segment (see Note 21).
Employee-Related Costs | Pension Curtailment | Accelerated Depreciation | Total | ||||||||||||
Balance, September 30, 2014 | $ | 0.7 | $ | — | $ | — | $ | 0.7 | |||||||
Charge to expense | 13.2 | — | 2.1 | 15.3 | |||||||||||
Cash payments | (3.4 | ) | — | — | (3.4 | ) | |||||||||
Non-cash charges | — | — | (2.1 | ) | (2.1 | ) | |||||||||
Balance, September 30, 2015 | $ | 10.5 | $ | — | $ | — | $ | 10.5 | |||||||
Charge to expense | 2.1 | — | 0.4 | 2.5 | |||||||||||
Cash payments | (10.6 | ) | — | — | (10.6 | ) | |||||||||
Non-cash charges | (0.9 | ) | — | (0.4 | ) | (1.3 | ) | ||||||||
Balance, September 30, 2016 | $ | 1.1 | $ | — | $ | — | $ | 1.1 | |||||||
Charge to expense | — | — | — | — | |||||||||||
Cash payments | (1.1 | ) | — | — | (1.1 | ) | |||||||||
Non-cash charges | — | — | — | — | |||||||||||
Balance, September 30, 2017 | $ | — | $ | — | $ | — | $ | — | |||||||
Total expected restructuring charge | $ | 18.5 | $ | 1.7 | $ | 20.1 | $ | 40.3 | |||||||
Cumulative incurred to date | 18.5 | 1.7 | 20.1 | 40.3 | |||||||||||
Remaining expected restructuring charge | $ | — | $ | — | $ | — | $ | — | |||||||
Assets Held for Sale
Related to the closure of its Modesto, California facility in September 2014, the Company had land, building and equipment classified as assets held for sale at September 30, 2016. The carrying value of the assets included in “Prepaid expenses and other current assets” in the Consolidated Balance Sheets was $4.3 as of September 30, 2016. The land, building and equipment were sold in March 2017. Related to the manufacturing shutdown of its Farmers Branch, Texas facility in September 2015, the Company had land and buildings classified as assets held for sale at September 30, 2016. The carrying value of the assets included in “Prepaid expenses and other current assets” on the Consolidated Balance Sheets was $5.8 as of September 30, 2016. The land and buildings were sold in December 2016. There were no assets held for sale at September 30, 2017. Held for sale net (gains) and losses of $(0.2), $9.3 and $34.2 were recorded in fiscal 2017, 2016 and 2015, respectively, to adjust the carrying value of the assets to their fair value less estimated selling costs. The net gains recorded in fiscal 2017 related to the Farmers Branch, Texas facility. The losses recorded in fiscal 2016 included amounts related to the Modesto, California and Farmers Branch, Texas facilities. The losses recorded in fiscal 2015 included amounts related to the closure of the Modesto, California and Farmers Branch, Texas facilities, as well as the sale of a Boise, Idaho manufacturing facility, the sale of a peanut butter manufacturing facility located in Portales, New Mexico and the sale of the Australian business and Musashi trademark. The net gains and losses are reported as “Other operating expenses, net” on the Consolidated Statements of Operations.
NOTE 5 — BUSINESS COMBINATIONS AND DIVESTITURES
The Company accounts for acquisitions using the acquisition method of accounting, whereby the results of operations are included in the financial statements from the date of acquisition. The purchase price is allocated to acquired assets and assumed liabilities based on their estimated fair values at the date of acquisition, and any excess is allocated to goodwill. Goodwill represents the value the Company expects to achieve through the implementation of operational synergies and the expansion of the business into new or growing segments of the industry.
Fiscal 2017
Acquisitions
On July 3, 2017, the Company completed its acquisition of Latimer Newco 2 Limited, a company registered in England and Wales (“Latimer”), and all of Latimer’s direct and indirect subsidiaries at the time of acquisition, including Weetabix Limited (collectively the “Weetabix Group”) for a purchase price of approximately £1,400.0 with a payment at closing of £1,454.1, excluding £48.0 of cash acquired (approximately $1,887.2, excluding $62.2 of cash acquired). The Weetabix Group is a packaged food
58
company that primarily produces branded and private label RTE cereal and muesli products. The Weetabix Group is reported in two reportable segments. The results of the Weetabix operations outside of North America (“Weetabix”) are reported in the Weetabix segment, and the Weetabix North American operations (“Weetabix NA”) are reported in the Post Consumer Brands segment (see Note 21). Based on the preliminary purchase price allocation of Weetabix, the Company recorded $172.8 of customer relationships to be amortized over a weighted-average period of approximately 20 years, $30.5 to definite-lived trademarks and brands to be amortized over a weighted-average period of 16 years and $391.0 of indefinite-lived trademarks. Based on the preliminary purchase price allocation of Weetabix NA, the Company recorded $14.1 of customer relationships to be amortized over a weighted-average period of 21 years. Net sales and operating profit for Weetabix included in the Consolidated Statements of Operations were $112.4 and $14.5, respectively, for the year ended September 30, 2017. Net sales and operating loss for Weetabix NA included in the Consolidated Statements of Operations were $28.1 and $6.4, respectively, for the year ended September 30, 2017.
On October 3, 2016, the Company completed its acquisition of National Pasteurized Eggs, Inc. (“NPE”) for $93.5, subject to working capital and other adjustments, resulting in a payment at closing of $97.0. In February 2017, a final settlement of net working capital and other adjustments was reached, resulting in an amount back to the Company of $1.2. In addition, the Company acquired an income tax receivable of $0.7 that is due back to the sellers. NPE is a producer of pasteurized shell eggs, including cage-free eggs, and is reported in the Michael Foods Group segment (see Note 21). Based upon the purchase price allocation, the Company recorded $43.9 of customer relationships to be amortized over a weighted-average period of 16 years and $7.5 of trademarks and brands to be amortized over a weighted-average period of 20 years. NPE operations have been integrated into the Michael Foods business, and due to the level of integration, discrete sales and operating profit data for the year ended September 30, 2017 is not available for NPE.
The following table provides the allocation of the purchase price related to the fiscal 2017 acquisitions of NPE and the preliminary purchase price related to the acquisition of the Weetabix Group based upon the fair value of assets and liabilities assumed. Certain preliminary values of the Weetabix Group acquisition, including receivables, inventory, property, goodwill, other intangible assets, other assets, other current liabilities, deferred taxes and other liabilities, are not yet finalized pending the final purchase price allocation and are subject to change once additional information is obtained. Measurement period adjustments have been made to the allocation of purchase price for the acquisition of NPE since the date of acquisition related to working capital settlements, updated valuations of property and intangibles, income tax receivable and deferred taxes. The fair value of goodwill related to the acquisition of NPE will not be deductible for U.S. income tax purposes. The Company does not expect the final fair value of goodwill related to the acquisition of the Weetabix Group to be deductible for U.S. income tax purposes.
NPE | The Weetabix Group | ||||||
Cash and cash equivalents | $ | 5.6 | $ | 62.2 | |||
Receivables | 8.5 | 39.7 | |||||
Inventories | 2.1 | 63.4 | |||||
Prepaid expenses and other current assets | 0.4 | 1.2 | |||||
Property | 10.4 | 283.9 | |||||
Goodwill | 46.3 | 969.3 | |||||
Other intangible assets | 51.4 | 608.4 | |||||
Other assets | — | 112.0 | |||||
Current portion of capital lease | (0.1 | ) | — | ||||
Accounts payable | (6.3 | ) | (66.3 | ) | |||
Other current liabilities | (2.9 | ) | (28.4 | ) | |||
Long-term capital lease | (0.2 | ) | — | ||||
Deferred tax liability - long-term | (18.7 | ) | (137.6 | ) | |||
Other liabilities | — | (10.9 | ) | ||||
Noncontrolling interest | — | (9.7 | ) | ||||
Total acquisition cost | $ | 96.5 | $ | 1,887.2 | |||
Fiscal 2016
Acquisitions
On October 3, 2015, the Company completed its acquisition of Willamette Egg Farms (“WEF”) for $90.0, subject to working capital and other adjustments, resulting in a payment at closing of $109.0. In December 2015, a final settlement of net working
59
capital and other adjustments was reached, resulting in an additional amount paid by the Company of $4.6. WEF is a producer, processor and wholesale distributor of eggs and egg products and is reported in the Michael Foods Group segment (see Note 21). Based upon the purchase price allocation, the Company recorded $12.7 of customer relationships to be amortized over a weighted-average period of 20 years and $2.5 to trademarks and brands to be amortized over a weighted-average period of 20 years.
The following table provides the allocation of the purchase price related to the fiscal 2016 acquisition of WEF based upon the fair value of assets and liabilities assumed. The Company expects the final fair value of goodwill related to the acquisition of WEF to be deductible for U.S. income tax purposes.
WEF | |||
Cash and cash equivalents | $ | 19.2 | |
Receivables | 11.1 | ||
Inventories | 10.3 | ||
Prepaid expenses and other current assets | 0.5 | ||
Property | 56.2 | ||
Goodwill | 4.2 | ||
Other intangible assets | 15.2 | ||
Other assets | 0.1 | ||
Accounts payable | (2.2 | ) | |
Other current liabilities | (1.0 | ) | |
Total acquisition cost | $ | 113.6 | |
Divestitures
In March 2016, the Company sold certain assets of its Michael Foods Canadian egg business, included in the Michael Foods Group segment (see Note 21), to a third party for $6.9, subject to working capital and other adjustments, resulting in net cash received of $6.4. In May 2016, a final settlement of net working capital and other adjustments was reached, resulting in additional cash received by the Company of $0.5. During the year ended September 30, 2016, the Company recorded a gain of $2.0 related to the transaction, which includes $1.3 of foreign exchange gains that were previously included in accumulated OCI. This gain is reported as “Other operating expenses, net” in the Consolidated Statements of Operations.
Fiscal 2015
Acquisitions
On October 1, 2014, the Company completed its acquisition of the PowerBar and Musashi brands and related worldwide assets from Nestlé S.A. (“PowerBar”) for $150.0, subject to a working capital adjustment, which resulted in a payment at closing of $136.1. In March 2015, a final settlement of net working capital and other adjustments was reached, resulting in an amount back to the Company of approximately $1.7. Based upon the purchase price allocation, the Company recorded $21.0 of customer relationships to be amortized over a weighted-average period of 18.3 years and $40.0 to trademarks and brands to be amortized over a weighted-average period of 20 years. PowerBar is reported in the Active Nutrition segment (see Note 21).
On November 1, 2014, the Company completed its acquisition of American Blanching Company (“ABC”) for $128.0. ABC is a manufacturer of peanut butter for national brands, private label retail and industrial markets and provider of peanut blanching, granulation and roasting services for the commercial peanut industry. Based upon the purchase price allocation, the Company recorded $63.9 of customer relationships to be amortized over a weighted-average period of 17 years and $8.0 to trademarks and brands to be amortized over a weighted-average period of 10 years. ABC is reported in the Private Brands segment (see Note 21).
On May 4, 2015, Post completed its acquisition of MOM Brands Company (“MOM Brands”), a manufacturer and distributer of RTE cereals. MOM Brands is reported in the Post Consumer Brands segment (see Note 21). The closing purchase price of the transaction was $1,181.5 and was partially paid by the issuance of 2.45 million shares of the Company’s common stock to the former owners of MOM Brands. The shares were valued at the May 1, 2015 closing price of $46.60 per share for a total issuance of $114.4. In September 2015, a final settlement of net working capital and other adjustments was reached, resulting in an amount back to the Company of $4.0. Based upon the purchase price allocation, the Company recorded $185.6 of customer relationships to be amortized over a weighted-average period of 20 years and $178.8 to trademarks and brands to be amortized over a weighted-average period of 20 years.
The following table provides the allocation of the purchase price based upon the fair value of assets and liabilities assumed for each acquisition completed in fiscal 2015. Substantially all of the final fair value of goodwill related to the acquisitions of
60
PowerBar and MOM Brands will be deductible for U.S. income tax purposes and the final fair value of goodwill related to the acquisition of ABC will not be deductible for U.S. income tax purposes.
PowerBar | ABC | MOM Brands | |||||||||
Cash and cash equivalents | $ | 2.4 | $ | 0.6 | $ | 11.1 | |||||
Receivables | 6.5 | 12.8 | 41.7 | ||||||||
Inventories | 23.1 | 15.5 | 97.9 | ||||||||
Prepaid expenses and other current assets | 0.1 | 0.4 | 6.2 | ||||||||
Property | 17.9 | 19.7 | 532.1 | ||||||||
Goodwill | 18.6 | 49.6 | 195.6 | ||||||||
Other intangible assets | 61.0 | 71.9 | 364.4 | ||||||||
Deferred tax asset - non-current | 11.7 | — | — | ||||||||
Other assets | — | 0.4 | — | ||||||||
Accounts payable | (1.2 | ) | (9.0 | ) | (33.0 | ) | |||||
Deferred tax liability - current | (0.2 | ) | (0.4 | ) | (5.4 | ) | |||||
Other current liabilities | (4.4 | ) | (2.8 | ) | (24.9 | ) | |||||
Deferred tax liability - non-current | (1.1 | ) | (30.7 | ) | (6.9 | ) | |||||
Other liabilities | — | — | (1.3 | ) | |||||||
Total acquisition cost | $ | 134.4 | $ | 128.0 | $ | 1,177.5 | |||||
Divestitures
On July 1, 2015, the Company sold the PowerBar Australia assets and Musashi trademark for $3.8. By September 30, 2016, final settlements of net working capital and other adjustments were reached related to this sale, resulting in an additional amount received by the Company of $0.4. In fiscal 2015, the Company recorded held for sale losses of $3.7 related to these assets in order to adjust the carrying value of the assets to their fair value less estimated selling costs. Both amounts were reported as “Other operating expenses, net” on the Consolidated Statements of Operations. PowerBar Australia was included in the Active Nutrition segment (see Note 21).
Transaction related costs
During the years ended September 30, 2017, 2016 and 2015, the Company incurred acquisition related expenses of $30.5, $8.5 and $14.1, respectively, recorded as “Selling, general and administrative expenses.” These costs include amounts for transactions that were signed, spending for due diligence on potential acquisitions that were not signed or announced at the time of the Company’s annual reporting, and spending for divestiture transactions. In addition, during the year ended September 30, 2017, the Company recorded net foreign currency gains of $30.0 related to cash held in British pounds sterling (GBP) to fund the acquisition of the Weetabix Group, which were recorded in “Selling, general and administrative expenses” in the Consolidated Statements of Operations.
Pro Forma Information
The following unaudited pro forma information presents a summary of the combined results of operations of the Company and the aggregate results of all businesses acquired in fiscal years 2017, 2016 and 2015 for the periods presented as if the fiscal 2017 acquisitions had occurred on October 1, 2015, the fiscal 2016 acquisitions had occurred on October 1, 2014 and the fiscal 2015 acquisitions had occurred on October 1, 2013 along with certain pro forma adjustments. These pro forma adjustments give effect to the amortization of certain definite-lived intangible assets, adjusted depreciation based upon fair value of assets acquired, interest expense related to the financing of the business combinations, inventory revaluation adjustments on acquired businesses, transaction and extinguished debt costs and related income taxes. The following unaudited pro forma information has been prepared for comparative purposes only and is not necessarily indicative of the results of operations as they would have been had the acquisitions occurred on the assumed dates, nor is it necessarily an indication of future operating results.
2017 | 2016 | 2015 | |||||||||
Pro forma net sales | $ | 5,614.9 | $ | 5,751.2 | $ | 5,236.6 | |||||
Pro forma net earnings (loss) available to common shareholders | $ | 71.9 | $ | 2.0 | $ | (73.3 | ) | ||||
Pro forma basic earnings (loss) per share | $ | 1.06 | $ | 0.03 | $ | (1.29 | ) | ||||
Pro forma diluted earnings (loss) per share | $ | 1.03 | $ | 0.03 | $ | (1.29 | ) | ||||
61
NOTE 6 — GOODWILL
The changes in the carrying amount of goodwill by segment are noted in the following table.
Post Consumer Brands | Michael Foods Group | Active Nutrition | Private Brands | Weetabix | Total | ||||||||||||||||||
Balance, September 30, 2015 | |||||||||||||||||||||||
Goodwill (gross) | $ | 2,069.0 | $ | 1,341.6 | $ | 180.7 | $ | 178.9 | $ | — | $ | 3,770.2 | |||||||||||
Accumulated impairment losses | (609.1 | ) | — | (88.3 | ) | — | — | (697.4 | ) | ||||||||||||||
Goodwill (net) | $ | 1,459.9 | $ | 1,341.6 | $ | 92.4 | $ | 178.9 | $ | — | $ | 3,072.8 | |||||||||||
Goodwill acquired | — | 4.2 | — | — | — | 4.2 | |||||||||||||||||
Currency translation adjustment | 0.1 | — | — | 2.6 | — | 2.7 | |||||||||||||||||
Balance, September 30, 2016 | |||||||||||||||||||||||
Goodwill (gross) | $ | 2,069.1 | $ | 1,345.8 | $ | 180.7 | $ | 181.5 | $ | — | $ | 3,777.1 | |||||||||||
Accumulated impairment losses | (609.1 | ) | — | (88.3 | ) | — | — | (697.4 | ) | ||||||||||||||
Goodwill (net) | $ | 1,460.0 | $ | 1,345.8 | $ | 92.4 | $ | 181.5 | $ | — | $ | 3,079.7 | |||||||||||
Goodwill acquired | 5.3 | 46.3 | — | — | 964.0 | 1,015.6 | |||||||||||||||||
Impairment loss | — | — | (26.5 | ) | — | — | (26.5 | ) | |||||||||||||||
Currency translation adjustment | 0.3 | — | — | — | (37.1 | ) | (36.8 | ) | |||||||||||||||
Balance, September 30, 2017 | |||||||||||||||||||||||
Goodwill (gross) | $ | 2,074.7 | $ | 1,392.1 | $ | 180.7 | $ | 181.5 | $ | 926.9 | $ | 4,755.9 | |||||||||||
Accumulated impairment losses | (609.1 | ) | — | (114.8 | ) | — | — | (723.9 | ) | ||||||||||||||
Goodwill (net) | $ | 1,465.6 | $ | 1,392.1 | $ | 65.9 | $ | 181.5 | $ | 926.9 | $ | 4,032.0 | |||||||||||
Goodwill represents the excess of the cost of acquired businesses over the fair market value of their identifiable net assets. The Company conducts a goodwill impairment qualitative assessment during the fourth quarter of each fiscal year following the annual forecasting process, or more frequently if facts and circumstances indicate that goodwill may be impaired. The goodwill impairment qualitative assessment requires an analysis to determine if it is more likely than not that the fair value of the business is less than its carrying amount. If adverse qualitative trends are identified that could negatively impact the fair value of the business, a quantitative goodwill impairment test is performed. In fiscal years 2017, 2016 and 2015, the Company elected not to perform a qualitative assessment and instead performed a quantitative impairment test for all reporting units.
The estimated fair value is determined using a combined income and market approach with a greater weighting on the income approach. The income approach is based on discounted future cash flows and requires significant assumptions, including estimates regarding future revenue, profitability, and capital requirements. The market approach is based on a market multiple (revenue and EBITDA which stands for earnings before interest, income taxes, depreciation, and amortization) and requires an estimate of appropriate multiples based on market data.
For the year ended September 30, 2017, the Company recorded a charge of $26.5 for the impairment of goodwill. The impairment charge related to the Dymatize reporting unit which is included in the Active Nutrition segment. In fiscal 2017, consistent with the prior year, the specialty sports nutrition channel, in which Dymatize sells the majority of its products, continued to experience weak sales which resulted in management lowering its long-term expectations for the Dymatize reporting unit. After conducting step one of the impairment analysis, it was determined that the carrying value of the Dymatize reporting unit exceeded its fair value by $76.6. As the application of ASU 2017-04 does not allow for step two of the analysis prescribed prior to the adoption of ASU 2017-04, the Company recorded an impairment charge for of goodwill down to the fair value. At the time of the analysis, the Dymatize reporting unit had $26.5 of remaining goodwill, and we therefore recorded an impairment charge for the entire goodwill balance of $26.5. At September 30, 2017, the estimated fair values of all other reporting units exceeded their carrying values by at least 25%, with the exception of Weetabix, whose fair value only slightly exceeded its carrying value due to the recency of the acquisition.
For the year ended September 30, 2016, the Company concluded there was no impairment of goodwill. With the exception of Dymatize, all reporting units passed step one of the impairment test. Dymatize failed step one and accordingly, step two of the analysis was performed. Based on the results of step two, it was determined that the fair value of the goodwill allocated to the Dymatize reporting unit exceeded its carrying value by approximately $36.0 and was therefore not impaired as of September 30, 2016. At September 30, 2016, the estimated fair values of all other reporting units exceeded their carrying values by at least 33%.
As of September 30, 2015, the Company recorded a charge of $57.0 for the impairment of goodwill. The impairment charge related to the Active Nutrition segment and was primarily the result of fourth quarter production issues at Dymatize which resulted
62
in the Company’s decision to close its manufacturing facility and permanently transfer production to third party facilities under co-manufacturing agreements.
These fair value measurements fell within Level 3 of the fair value hierarchy as described in Note 14. The goodwill impairment losses are aggregated with trademark impairment losses in “Impairment of goodwill and other intangible assets” in the Consolidated Statements of Operations.
NOTE 7 — EQUITY INTERESTS
In connection with its acquisition of the Weetabix Group in July 2017 (see Note 5), the Company acquired an equity interest in two legal entities, Alpen Food Company South Africa (Proprietary) Limited (“Alpen”) and Weetabix East Africa Limited (“Weetabix East Africa”). Results of both entities are reported in the Weetabix segment (see Note 21).
Alpen is a South African based company that produces RTE cereal and muesli. The Company owns 50% of Alpen’s common stock with no other indicators of control and, accordingly, the Company accounts for its investment in Alpen using the equity method. At September 30, 2017, the Company recorded an investment of $4.5 included in “Other assets” on the Consolidated Balance Sheet and loss of $0.1 included in “Other operating expenses, net” in the Consolidated Statement of Operations during the year ended September 30, 2017. At September 30, 2017, the Company had a receivable balance with Alpen of $1.0, included in “Other assets” on the Consolidated Balance Sheet.
Weetabix East Africa is a Kenyan based company that produces RTE cereal and muesli. The Company owns 50.1% of Weetabix East Africa and holds a controlling voting and financial interest through its appointment of management and representation on Weetabix East Africa’s Board of Directors. Accordingly, the Company has fully consolidated Weetabix East Africa into its consolidated financial statements. At September 30, 2017, Weetabix East Africa had a long-term payable with Pioneer Food Group Limited, the owner of the remaining 49.9% of the business, of $0.5, included in “Other liabilities” on the Consolidated Balance Sheet.
NOTE 8 — INCOME TAXES
The benefit for income taxes consisted of the following:
Year Ended September 30, | |||||||||||
2017 | 2016 | 2015 | |||||||||
Current: | |||||||||||
Federal | $ | (5.8 | ) | $ | 37.6 | $ | 59.5 | ||||
State | 4.3 | 1.7 | 2.9 | ||||||||
Foreign | 10.2 | 8.5 | 5.7 | ||||||||
8.7 | 47.8 | 68.1 | |||||||||
Deferred: | |||||||||||
Federal | 19.7 | (64.8 | ) | (116.0 | ) | ||||||
State | 2.7 | (7.5 | ) | (2.1 | ) | ||||||
Foreign | (5.0 | ) | (2.3 | ) | (2.0 | ) | |||||
17.4 | (74.6 | ) | (120.1 | ) | |||||||
Income tax expense (benefit) | $ | 26.1 | $ | (26.8 | ) | $ | (52.0 | ) | |||
63
The effective tax rate for fiscal 2017 was 35.1% compared to 89.0% for fiscal 2016 and 31.1% for fiscal 2015. A reconciliation of income tax benefit with amounts computed at the statutory federal rate follows:
Year Ended September 30, | |||||||||||
2017 | 2016 | 2015 | |||||||||
Computed tax at federal statutory rate (35%) | $ | 26.1 | $ | (10.5 | ) | $ | (58.6 | ) | |||
Non-deductible goodwill impairment loss | 7.2 | — | 16.5 | ||||||||
Non-deductible compensation | 1.8 | 2.6 | 0.4 | ||||||||
Non-deductible transaction costs | 2.9 | — | 0.6 | ||||||||
Domestic production activities deduction | — | (4.3 | ) | (5.9 | ) | ||||||
State income taxes, net of effect on federal tax | 0.8 | (6.2 | ) | (7.2 | ) | ||||||
Non-taxable interest income | (3.4 | ) | (2.6 | ) | (2.7 | ) | |||||
Valuation allowances | 4.8 | 3.8 | 6.7 | ||||||||
Change in deferred tax rates | — | (2.0 | ) | 4.9 | |||||||
Uncertain tax positions | (0.5 | ) | (2.0 | ) | (3.4 | ) | |||||
Sale and liquidation of Michael Foods Canadian egg business | — | (3.6 | ) | — | |||||||
Enacted tax law and changes | — | 0.7 | (0.4 | ) | |||||||
Income tax credits | (1.4 | ) | (1.5 | ) | (0.4 | ) | |||||
Rate differential on foreign income | (6.8 | ) | (1.8 | ) | (1.4 | ) | |||||
Excess tax benefits for share-based payments | (6.2 | ) | — | — | |||||||
Other, net (none in excess of 5% of statutory tax) | 0.8 | 0.6 | (1.1 | ) | |||||||
Income tax expense (benefit) | $ | 26.1 | $ | (26.8 | ) | $ | (52.0 | ) | |||
Deferred income taxes reflect the net tax effects of temporary differences between the carrying amounts of assets and liabilities for financial reporting purposes and the amounts used for income tax purposes. Deferred tax non-current assets (liabilities) were as follows:
September 30, 2017 | September 30, 2016 | ||||||||||||||||||||||
Assets | Liabilities | Net | Assets | Liabilities | Net | ||||||||||||||||||
Accrued vacation, incentive and severance | $ | 16.2 | $ | — | $ | 16.2 | $ | 14.3 | $ | — | $ | 14.3 | |||||||||||
Inventory | 3.0 | — | 3.0 | 2.5 | — | 2.5 | |||||||||||||||||
Accrued liabilities | 16.6 | — | 16.6 | 24.0 | — | 24.0 | |||||||||||||||||
Property | — | (210.1 | ) | (210.1 | ) | — | (172.3 | ) | (172.3 | ) | |||||||||||||
Intangible assets | — | (882.5 | ) | (882.5 | ) | — | (784.3 | ) | (784.3 | ) | |||||||||||||
Pension and other postretirement benefits | 5.3 | — | 5.3 | 31.7 | — | 31.7 | |||||||||||||||||
Stock-based and deferred compensation | 28.7 | — | 28.7 | 22.2 | — | 22.2 | |||||||||||||||||
Derivative mark-to-market adjustments | 91.9 | — | 91.9 | 121.6 | — | 121.6 | |||||||||||||||||
Net operating loss carryforwards, credits | 38.7 | — | 38.7 | 22.2 | — | 22.2 | |||||||||||||||||
Other items | 6.5 | (1.6 | ) | 4.9 | 5.1 | (1.3 | ) | 3.8 | |||||||||||||||
Total gross deferred income taxes | 206.9 | (1,094.2 | ) | (887.3 | ) | 243.6 | (957.9 | ) | (714.3 | ) | |||||||||||||
Valuation allowance | (18.5 | ) | — | (18.5 | ) | (12.2 | ) | — | (12.2 | ) | |||||||||||||
Total deferred taxes | $ | 188.4 | $ | (1,094.2 | ) | $ | (905.8 | ) | $ | 231.4 | $ | (957.9 | ) | $ | (726.5 | ) | |||||||
As of September 30, 2017, the Company had United States federal net operating loss (“NOL”) carryforwards totaling approximately $96.8 which have expiration dates beginning in fiscal 2021 and extending through fiscal 2037, as well as state NOL carryforwards totaling approximately $360.2, which have expiration dates beginning in fiscal 2018 and extending through fiscal 2037. As of September 30, 2017, Post had NOL carryforwards in foreign jurisdictions of $9.3.
As certain of these NOLs and carryforwards were acquired through acquisitions made during fiscal years 2013, 2014 and 2017, as a result of these ownership changes, the deductibility of the NOLs is subject to limitation under section 382 of the Internal Revenue Code (“IRC”) and similar limitations under state tax law. Giving consideration to IRC section 382 and state limitations, the Company believes it will generate sufficient taxable income to fully utilize the United States federal and certain state NOLs before they expire. Approximately $11.8 of the deferred tax asset related to the state NOLs has been offset by a valuation allowance based on management’s judgment that it is more likely than not that the benefits of those deferred tax assets will not be realized in the future.
64
No provision has been made for income taxes on undistributed earnings of consolidated foreign subsidiaries of $56.4 at September 30, 2017 since it is our intention to indefinitely reinvest undistributed earnings of our foreign subsidiaries. It is not practicable to estimate the additional income taxes and applicable foreign withholding taxes that would be payable on the remittance of such undistributed earnings.
For fiscal 2017, 2016 and 2015, foreign income before income taxes was $24.7, $29.6 and $7.0, respectively.
Unrecognized Tax Benefits
The Company recognizes the tax benefit from uncertain tax positions only if it is “more likely than not” the tax position will be sustained on examination by the taxing authorities. The tax benefits recognized from such positions are measured based on the largest benefit that has a greater than 50% likelihood of being realized upon ultimate settlement. To the extent the Company’s assessment of such tax positions changes, the change in estimate will be recorded in the period in which the determination is made.
Unrecognized tax benefits activity for the years ended September 30, 2017 and 2016 is presented in the following table:
Unrecognized tax benefits, September 30, 2015 | $ | 11.3 | ||
Additions for tax positions taken in current year and acquisitions | 0.1 | |||
Reductions for tax positions taken in prior years | (1.6 | ) | ||
Settlements with tax authorities/statute expirations | (0.5 | ) | ||
Unrecognized tax benefits, September 30, 2016 | $ | 9.3 | ||
Additions for tax positions taken in current year and acquisitions | — | |||
Reductions for tax positions taken in prior years | — | |||
Settlements with tax authorities/statute expirations | (0.7 | ) | ||
Unrecognized tax benefits, September 30, 2017 | $ | 8.6 | ||
The amount of the net unrecognized tax benefits that, if recognized, would directly affect the effective tax rate is $5.6 at September 30, 2017. The Company believes that, due to expiring statutes of limitations and settlements with authorities, it is reasonably possible that the total unrecognized tax benefits may decrease by less than $1.0 within twelve months of the reporting date.
The Company classifies tax-related interest and penalties as components of income tax expense. The accrued interest and penalties are not included in the table above. The Company had accrued interest and penalties of $2.7 and $2.4 at September 30, 2017 and 2016, respectively. The Company had net expense (benefit) of $0.3, $(0.1) and zero for interest and penalties in the Consolidated Statements of Operations for the years ended September 30, 2017, 2016 and 2015, respectively. Interest and penalties were computed on the difference between the tax position recognized for financial reporting purposes and the amount previously taken on the Company’s tax returns.
United States federal, United States state and Canadian income tax returns for the tax years ended September 30, 2016, 2015 and 2014 are subject to examination by the tax authorities in each respective jurisdiction. The Michael Foods tax return for the short year ended June 2, 2014 was examined by the Internal Revenue Service without adjustment.
For the NPE acquisition made in 2017 and acquisitions made in 2015, the seller generally retained responsibility for all income tax liabilities through the date of acquisition. With respect to the acquisition of the Weetabix Group, the Company assumed substantially all income tax liabilities for those jurisdictions which remain subject to examination. With respect to the Michael Foods acquisition, the Company assumed all income tax liabilities for those jurisdictions which remain subject to examination, consisting primarily of the short tax year ended June 2, 2014, the date of acquisition. The Company did not assume any pre-acquisition tax liabilities related to the 2016 acquisition of WEF.
NOTE 9 — EARNINGS (LOSS) PER SHARE
Basic earnings (loss) per share is based on the average number of common shares outstanding during the period. Diluted earnings (loss) per share is based on the average number of shares used for the basic earnings (loss) per share calculation, adjusted for the dilutive effect of stock options, stock appreciation rights and restricted stock units using the “treasury stock” method. The impact of potentially dilutive convertible preferred stock is calculated using the “if-converted” method. For the periods outstanding, the Company’s tangible equity units (“TEUs”) (see Note 19) are assumed to be settled at the minimum settlement amount for weighted-average shares for basic earnings (loss) per share. All TEU purchase contracts were settled as of June 1, 2017. For diluted earnings (loss) per share, the shares, to the extent dilutive, are assumed to be settled as described in Note 19.
65
Year ended September 30, | |||||||||||
2017 | 2016 | 2015 | |||||||||
Net earnings (loss) for basic loss per share | $ | 34.8 | $ | (28.4 | ) | $ | (132.3 | ) | |||
Net earnings (loss) for diluted loss per share | $ | 34.8 | $ | (28.4 | ) | $ | (132.3 | ) | |||
Weighted-average shares outstanding | 65.2 | 63.9 | 51.8 | ||||||||
Effect of TEUs on weighted-average shares for basic earnings (loss) per share | 2.6 | 4.9 | 4.9 | ||||||||
Weighted-average shares for basic earnings (loss) per share | 67.8 | 68.8 | 56.7 | ||||||||
Effect of dilutive securities: | |||||||||||
Stock options | 1.8 | — | — | ||||||||
Restricted stock awards | 0.3 | — | — | ||||||||
Total dilutive securities | 2.1 | — | — | ||||||||
Weighted-average shares for diluted earnings (loss) per share | 69.9 | 68.8 | 56.7 | ||||||||
Basic earnings (loss) per common share | $ | 0.51 | $ | (0.41 | ) | $ | (2.33 | ) | |||
Diluted earnings (loss) per common share | $ | 0.50 | $ | (0.41 | ) | $ | (2.33 | ) | |||
The following table details the securities that have been excluded from the calculation of weighted-average shares for diluted earnings (loss) per share as they were anti-dilutive.
Year ended September 30, | ||||||||
2017 | 2016 | 2015 | ||||||
Stock options | 0.3 | 4.3 | 4.2 | |||||
Stock appreciation rights | — | 0.2 | 0.3 | |||||
Restricted stock awards | — | 0.5 | 0.5 | |||||
Preferred shares conversion to common | 9.1 | 9.1 | 11.0 | |||||
NOTE 10 — SUPPLEMENTAL OPERATIONS STATEMENT AND CASH FLOW INFORMATION
Year Ended September 30, | |||||||||||
2017 | 2016 | 2015 | |||||||||
Advertising and promotion expenses | $ | 159.7 | $ | 184.2 | $ | 137.3 | |||||
Repair and maintenance expenses | 162.6 | 141.6 | 92.1 | ||||||||
Research and development expenses | 18.6 | 16.3 | 16.8 | ||||||||
Rent expense | 41.8 | 32.0 | 23.3 | ||||||||
Interest income | (6.8 | ) | (2.7 | ) | (0.8 | ) | |||||
Interest paid | 333.6 | 309.6 | 235.5 | ||||||||
Income taxes paid | 29.6 | 73.4 | 46.4 | ||||||||
66
NOTE 11— SUPPLEMENTAL BALANCE SHEET INFORMATION
September 30, | |||||||
2017 | 2016 | ||||||
Receivables, net | |||||||
Trade | $ | 421.6 | $ | 354.9 | |||
Income tax receivable | 46.4 | 23.6 | |||||
Other | 14.2 | 8.1 | |||||
482.2 | 386.6 | ||||||
Allowance for doubtful accounts | (1.6 | ) | (1.6 | ) | |||
$ | 480.6 | $ | 385.0 | ||||
Inventories | |||||||
Raw materials and supplies | $ | 129.8 | $ | 112.4 | |||
Work in process | 16.9 | 17.4 | |||||
Finished products | 395.6 | 339.3 | |||||
Flocks | 31.2 | 34.0 | |||||
$ | 573.5 | $ | 503.1 | ||||
Other Assets | |||||||
Pension asset | $ | 154.6 | $ | — | |||
Other | 29.7 | 15.9 | |||||
$ | 184.3 | $ | 15.9 | ||||
Accounts Payable | |||||||
Trade | $ | 306.5 | $ | 228.8 | |||
Book cash overdrafts | 17.8 | 26.6 | |||||
Other | 11.7 | 9.0 | |||||
$ | 336.0 | $ | 264.4 | ||||
Other Current Liabilities | |||||||
Advertising and promotion | $ | 74.5 | $ | 95.8 | |||
Accrued interest | 36.5 | 55.2 | |||||
Accrued compensation | 89.9 | 103.9 | |||||
Hedging liabilities | 54.6 | 5.5 | |||||
Accrued legal settlements | 8.6 | 37.3 | |||||
Other | 82.2 | 59.6 | |||||
$ | 346.3 | $ | 357.3 | ||||
Other Liabilities | |||||||
Pension and other postretirement benefit obligations | $ | 83.5 | $ | 83.2 | |||
Hedging liabilities - non-current | 188.9 | 313.2 | |||||
Accrued compensation - non-current | 29.2 | 22.7 | |||||
Other | 26.2 | 21.2 | |||||
$ | 327.8 | $ | 440.3 | ||||
NOTE 12 — ALLOWANCE FOR DOUBTFUL ACCOUNTS
September 30, | |||||||||||
2017 | 2016 | 2015 | |||||||||
Balance, beginning of year | $ | 1.6 | $ | 2.0 | $ | 1.4 | |||||
Provision charged to expense | 0.3 | 1.2 | 0.7 | ||||||||
Write-offs, less recoveries | (0.3 | ) | (1.6 | ) | (0.3 | ) | |||||
Impact of acquisitions | — | — | 0.2 | ||||||||
Balance, end of year | $ | 1.6 | $ | 1.6 | $ | 2.0 | |||||
NOTE 13 — DERIVATIVE FINANCIAL INSTRUMENTS AND HEDGING
In the ordinary course of business, the Company is exposed to commodity price risks relating to the acquisition of raw materials and supplies, interest rate risks relating to floating rate debt, and foreign currency exchange rate risks. The Company utilizes derivative financial instruments, including (but not limited to) futures contracts, option contracts, forward contracts and swaps,
67
to manage certain of these exposures by hedging when it is practical to do so.The Company does not hold or issue financial instruments for speculative or trading purposes.
At September 30, 2017, the Company’s derivative instruments consisted of:
Not designated as hedging instruments under ASC Topic 815
• | Commodity and energy futures and option contracts which relate to inputs that generally will be utilized within the next year; |
• | foreign currency forward contracts used to hedge the impact of intercompany activity against currency fluctuations between the United States dollar and Canadian dollar; |
• | a pay-fixed, receive-variable interest rate swap maturing in May 2021 that requires monthly settlements and have the effect of hedging interest payments on debt expected to be issued but not yet priced; and |
• | rate-lock interest rate swaps that require four lump sum settlements with the first settlement occurring in July 2018 and the last in July 2020 and have the effect of hedging interest payments on debt expected to be issued but not yet priced. |
Designated as hedging instruments under ASC Topic 815
• | Foreign currency forward contracts used as a cash flow hedge of forecasted Euro denominated capital purchases occurring within the next 17 months against currency fluctuations between the Euro and the United States dollar; |
• | a pay-fixed, receive-fixed cross-currency swap maturing in July 2022 that requires quarterly cash settlements used as a net investment hedge of the Company’s investment in the Weetabix Group, which is denominated in GBP; and |
• | a pay-fixed, receive-variable interest rate swap maturing in May 2024 that requires monthly settlements used as a cash flow hedge of forecasted interest payments on our variable rate term loan (see Note 15). |
The following table shows the notional amounts of derivative instruments held.
September 30, 2017 | September 30, 2016 | |||||||
Not designated as hedging instruments under ASC Topic 815: | ||||||||
Commodity contracts | $ | 53.8 | $ | 49.8 | ||||
Energy contracts | 25.6 | 23.6 | ||||||
Foreign exchange contracts - Forward contracts | 3.8 | — | ||||||
Interest rate swap | 76.1 | 77.6 | ||||||
Interest rate swaps - Rate-lock swaps | 1,649.3 | 1,649.3 | ||||||
Designated as hedging instruments under ASC Topic 815: | ||||||||
Foreign exchange contracts - Forward contracts | 20.9 | — | ||||||
Foreign exchange contracts - Cross-currency swaps | 448.7 | — | ||||||
Interest rate swap | 1,000.0 | — | ||||||
The following tables present the balance sheet location and fair value of the Company’s derivative instruments on a gross and net basis as of September 30, 2017 and 2016, along with the portion designated as hedging instruments under ASC Topic 815. The Company does not offset derivative assets and liabilities within the Consolidated Balance Sheets.
68
Fair Value | Portion Designated as Hedging Instruments | |||||||||||||||||
Balance Sheet Location | September 30, 2017 | September 30, 2016 | September 30, 2017 | September 30, 2016 | ||||||||||||||
Asset Derivatives: | ||||||||||||||||||
Commodity contracts | Prepaid expenses and other current assets | $ | 0.5 | $ | 0.6 | $ | — | $ | — | |||||||||
Energy contracts | Prepaid expenses and other current assets | 3.8 | 2.4 | — | — | |||||||||||||
Foreign exchange contracts | Prepaid expenses and other current assets | 1.3 | — | 1.1 | — | |||||||||||||
Foreign exchange contracts | Other assets | 0.3 | — | 0.3 | — | |||||||||||||
$ | 5.9 | $ | 3.0 | $ | 1.4 | $ | — | |||||||||||
Liability Derivatives: | ||||||||||||||||||
Commodity contracts | Other current liabilities | $ | 1.9 | $ | 3.3 | $ | — | $ | — | |||||||||
Energy contracts | Other current liabilities | 0.3 | 0.2 | — | — | |||||||||||||
Foreign exchange contracts | Other current liabilities | 1.5 | — | 1.5 | — | |||||||||||||
Foreign exchange contracts | Other liabilities | 23.6 | — | 23.6 | — | |||||||||||||
Interest rate swaps | Other current liabilities | 50.9 | 2.0 | 0.7 | — | |||||||||||||
Interest rate swaps | Other liabilities | 165.3 | 313.2 | 4.2 | — | |||||||||||||
$ | 243.5 | $ | 318.7 | $ | 30.0 | $ | — | |||||||||||
The following tables present the effects of the Company’s derivative instruments on the Company’s Consolidated Statements of Operations for the years ended September 30, 2017, 2016 and 2015 and Consolidated Statements of Comprehensive Income (Loss) as of September 30, 2017 and 2016.
Derivatives Not Designated as Hedging Instruments | Statement of Operations Location | (Gain) Loss Recognized in Statement of Operations | ||||||||||||
2017 | 2016 | 2015 | ||||||||||||
Commodity contracts | Cost of goods sold | $ | (0.4 | ) | $ | 7.5 | $ | (5.2 | ) | |||||
Energy contracts | Cost of goods sold | (1.3 | ) | 1.2 | 12.8 | |||||||||
Foreign exchange contracts | Selling, general and administrative expenses | 0.8 | — | — | ||||||||||
Interest rate swaps | Other (income) expense, net | (102.1 | ) | 182.9 | 92.5 | |||||||||
Derivatives Designated as Hedging Instruments | (Gain) Loss Recognized in OCI | Loss Reclassified from Accumulated OCI into Earnings | Loss Recognized in Earnings [amount excluded from effectiveness testing] | Statement of Operations Location | ||||||||||||||||||||||
2017 | 2016 | 2017 | 2016 | 2017 | 2016 | |||||||||||||||||||||
Foreign exchange contracts | $ | (1.6 | ) | $ | — | $ | — | $ | — | $ | — | $ | — | Selling, general and administrative expenses | ||||||||||||
Interest rate swaps | 5.6 | — | 0.7 | — | — | — | Interest expense, net | |||||||||||||||||||
Cross-currency swaps (a) | 14.8 | — | — | — | 10.3 | — | Other expense (income), net | |||||||||||||||||||
(a) | On July 3, 2017, the Company designated its cross-currency swaps, entered into in the third quarter of fiscal 2017, as net investment hedges. Prior to the designation, mark to market losses of $10.3 were recognized in “Other expense (income), net” in the Consolidated Statement of Operations. |
Approximately $0.7 of the net cash flow hedge losses reported in accumulated OCI at September 30, 2017 is expected to be reclassified into earnings within the next 12 months. For gains and losses associated with foreign exchange forward contracts, the reclassification will occur on a straight-line basis over the useful life of the related capital assets. For gains or losses associated with interest rate swaps, the reclassification will occur over the term of the related debt. Reclassification of gains and losses reported in accumulated OCI related to the cross-currency swaps will only occur in the event all United Kingdom based operations are liquidated.
69
At September 30, 2017 and September 30, 2016, the Company had pledged collateral of $2.9 and $6.1, respectively, related to its commodity and energy contracts. These amounts are classified as “Restricted cash” on the Consolidated Balance Sheets.
NOTE 14 — FAIR VALUE MEASUREMENTS
The following table presents the assets and liabilities measured at fair value on a recurring basis and the basis for that measurement according to the levels in the fair value hierarchy in ASC Topic 820:
September 30, 2017 | September 30, 2016 | ||||||||||||||||||||||
Total | Level 1 | Level 2 | Total | Level 1 | Level 2 | ||||||||||||||||||
Assets | |||||||||||||||||||||||
Deferred compensation investment | $ | 15.4 | $ | 15.4 | $ | — | $ | 11.5 | $ | 11.5 | $ | — | |||||||||||
Derivative assets | 5.9 | — | 5.9 | 3.0 | — | 3.0 | |||||||||||||||||
$ | 21.3 | $ | 15.4 | $ | 5.9 | $ | 14.5 | $ | 11.5 | $ | 3.0 | ||||||||||||
Liabilities | |||||||||||||||||||||||
Deferred compensation liabilities | $ | 22.5 | $ | — | $ | 22.5 | $ | 17.3 | $ | — | $ | 17.3 | |||||||||||
Derivative liabilities | 243.5 | — | 243.5 | 318.7 | — | 318.7 | |||||||||||||||||
$ | 266.0 | $ | — | $ | 266.0 | $ | 336.0 | $ | — | $ | 336.0 | ||||||||||||
The deferred compensation investment is primarily invested in mutual funds and its fair value is measured using the market approach. This investment is in the same funds and purchased in substantially the same amounts as the participants’ selected investment options (excluding Post common stock equivalents), which represent the underlying liabilities to participants in the Company’s deferred compensation plans. Deferred compensation liabilities are recorded at amounts due to participants in cash, based on the fair value of participants’ selected investment options (excluding certain Post common stock equivalents to be distributed in shares) using the market approach. The Company utilizes the income approach to measure fair value for its derivative assets, which include commodity options and futures contracts. The income approach uses pricing models that rely on market observable inputs such as yield curves and forward prices.
Commodity and energy derivatives are valued using an income approach based on index prices less the contract rate multiplied by the notional amount. Foreign exchange contracts are valued using the spot rate less the forward rate multiplied by the notional amount. The Company’s calculation of the fair value of interest rate swaps is derived from a discounted cash flow analysis based on the terms of the contract and the interest rate curve. Refer to Note 13 for the classification of changes in fair value of derivative assets and liabilities measured at fair value on a recurring basis within the Consolidated Statements of Operations.
The Company’s financial assets and liabilities also include cash and cash equivalents, receivables and accounts payable for which the carrying value approximates fair value due to their short maturities (less than 12 months). The Company does not record its short-term and long-term debt at fair value on the Consolidated Balance Sheets. Based on current market rates, the fair value of the Company’s debt (Level 2) was $7,343.4 and $4,852.2 as of September 30, 2017 and 2016, respectively.
Certain assets and liabilities, including long-lived assets, goodwill, indefinite-lived intangibles and assets held for sale are measured at fair value on a non-recurring basis.
In fiscal 2017, the Company recorded goodwill impairment losses of $26.5 and goodwill and other intangible assets impairment losses of $57.0 and $3.8, respectively, in the year ended September 30, 2015. There were no such charges recorded in fiscal 2016. These losses were recorded as “Impairment of goodwill and other intangible assets” in the Consolidated Statement of Operations. For additional information on other intangibles assets and goodwill, see Note 2 and Note 6, respectively. There were no other fair value measurement losses recognized during the years ended September 30, 2017, 2016 and 2015.
At September 30, 2016, the Company had land, buildings and equipment classified as assets held for sale related to the closure of its Modesto, California facility. At September 30, 2016, the carrying value, as determined by estimated fair value less estimated costs to sell, of the assets held for sale was $4.3 and was included in “Prepaid expenses and other current assets” on the Condensed Consolidated Balance Sheets. Related to its Farmers Branch, Texas facility, the Company had land and buildings classified as assets held for sale as of September 30, 2016. The carrying value of the assets included in “Prepaid expenses and other current assets” on the Condensed Consolidated Balance Sheets was $5.8 as of September 30, 2016. The fair value of the assets held for sale were measured at fair value on a nonrecurring basis based on third party offers to purchase the assets. The fair value measurement was categorized as Level 3, as the fair values utilize significant unobservable inputs.
70
The following table summarizes the Level 3 activity. For additional information on assets held for sale, see Note 4.
Balance, September 30, 2015 | $ | 11.4 | |
Transfers into held for sale | 9.6 | ||
Losses on assets held for sale | (9.3 | ) | |
Proceeds from the sale of assets held for sale | (1.6 | ) | |
Balance, September 30, 2016 | $ | 10.1 | |
Gain on sale of assets held for sale | 0.2 | ||
Proceeds from the sale of assets held for sale | (10.3 | ) | |
Balance, September 30, 2017 | $ | — | |
NOTE 15 — LONG-TERM DEBT
Long-term debt as of the dates indicated consists of the following:
September 30, | |||||||
2017 | 2016 | ||||||
5.50% Senior Notes maturing March 2025 | $ | 1,000.0 | $ | — | |||
5.75% Senior Notes maturing March 2027 | 1,500.0 | — | |||||
5.00% Senior Notes maturing August 2026 | 1,750.0 | 1,750.0 | |||||
7.75% Senior Notes maturing March 2024 | — | 800.0 | |||||
8.00% Senior Notes maturing July 2025 | 137.5 | 400.0 | |||||
6.00% Senior Notes maturing December 2022 | 630.0 | 630.0 | |||||
6.75% Senior Notes maturing December 2021 | — | 875.0 | |||||
7.375% Senior Notes maturing February 2022 | — | 133.0 | |||||
Term Loan | 2,194.5 | — | |||||
TEUs (see Note 19) | — | 11.0 | |||||
4.57% 2012 Series Bond maturing September 2017 | — | 1.3 | |||||
Capital leases | 0.2 | — | |||||
7,212.2 | 4,600.3 | ||||||
Less: Current Portion | (22.1 | ) | (12.3 | ) | |||
Debt issuance costs, net | (81.8 | ) | (53.5 | ) | |||
Plus: Unamortized premium | 40.8 | 16.7 | |||||
Total long-term debt | $ | 7,149.1 | $ | 4,551.2 | |||
Senior Notes
On June 2, 2014, the Company issued $630.0 principal value of 6.00% senior notes due in December 2022. The 6.00% senior notes were issued at par and the Company received $619.0 after paying related fees of $11.0, which will be deferred and amortized to interest expense over the term of the notes. Interest payments on the 6.00% senior notes are due semi-annually each June 15 and December 15.
On August 18, 2015, the Company issued $800.0 principal value of 7.75% senior notes due in March 2024 and $400.0 principal value of 8.00% senior notes due in July 2025. The 7.75% and 8.00% senior notes were issued at par. The Company received $1,187.9 after paying related fees of $12.1, which were deferred to be amortized to interest expense over the term of the notes. Interest payments on the 7.75% senior notes were due semi-annually each March 15 and September 15. Interest payments on the 8.00% senior notes are due semi-annually each January 15 and July 15. With a portion of the proceeds received from term loan borrowings (see below), the Company repaid the $800.0 principal value of the 7.75% senior notes as well as $262.5 principal value of the 8.00% senior notes along with related tender premiums. In connection with the early repayment of these notes, the Company recorded expense of $160.4 in the year ended September 30, 2017, which is reported as “Loss on extinguishment of debt, net ” in the Consolidated Statement of Operations. This loss included tender premiums of $151.9 and debt issuance costs write-offs of $8.5.
On August 3, 2016, the Company issued $1,750.0 principal value of 5.00% senior notes due in August 2026. The 5.00% senior notes were issued at par and the Company received $1,725.7 after paying related fees of $24.3, which were deferred and will be
71
amortized to interest expense over the term of the notes. Interest payments on the 5.00% senior notes are due semi-annually each February 15 and August 15.
On February 14, 2017, the Company issued $1,000.0 principal value of 5.50% senior notes due in March 2025 and $750.0 principal value of 5.75% senior notes due in March 2027 (the “February 14, 2017 issuance”). The 5.50% and 5.75% senior notes were issued at par and the Company received $1,725.4 after paying related fees of $24.6, which were deferred and will be amortized to interest expense over the term of the notes. On August 10, 2017, the Company issued an additional $750.0 principal value of 5.75% notes due in March 2027. The additional 5.75% senior notes were issued at 105.5% of par value and the Company received $784.0 after paying investment banking and other fees of $7.2. The premium related to the 5.75% senior notes will be amortized as a reduction to interest expense over the term of the notes. Interest payments on the the 5.50% and 5.75% senior notes are due semi-annually each March 1 and September 1.
With a portion of the proceeds received from the issuance of the 5.00% senior notes, the Company repaid $1,242.0 principal value of the 7.375% senior notes, originally issued on February 3, 2012, October 25, 2012 and July 18, 2013. In connection with the early repayment of this portion of the 7.375% notes, the Company recorded expense of $78.6 in the year ended September 30, 2016, which was reported as “Loss on extinguishment of debt, net” in the Consolidated Statement of Operations. This loss included a tender premium of $88.0 and debt issuance costs write-offs of $12.4, partially offset by the write-off of unamortized debt premium of $21.8. In addition, with a portion of the proceeds received from the February 14, 2017 issuance, the Company repaid the remaining $133.0 principal value of the 7.375% senior notes. In connection with the early repayment of this portion of the 7.375% notes, the Company recorded expense of $4.0 in the year ended September 30, 2017, which is reported as “Loss on extinguishment of debt, net” in the Consolidated Statement of Operations. The loss included a premium of $4.9 and debt issuance costs write-offs of $1.2, partially offset by the write-off of unamortized debt premium of $2.1.
With a portion of the proceeds received from the February 14, 2017 issuance, the Company repaid the $875.0 principal value of the 6.75% senior notes, originally issued on November 18, 2013 and March 19, 2014. In connection with the early repayment of these notes, the Company recorded expense of $58.5 in the year ended September 30, 2017, which is reported as “Loss on extinguishment of debt, net” in the Consolidated Statement of Operations. The loss included a premium of $63.0 and debt issuance cost write-offs of $8.9, partially offset by the write-off of unamortized debt premium of $13.4.
All of the Company’s senior notes are fully and unconditionally guaranteed, jointly and severally, on a senior unsecured basis by each of our existing and future domestic subsidiaries, other than immaterial subsidiaries, receivables finance subsidiaries and subsidiaries we designate as unrestricted subsidiaries (the “Guarantors”). As of September 30, 2017, the U.S. subsidiary of the Weetabix Group was not a Guarantor, but the Company intends to add it as a Guarantor in the future. Our foreign subsidiaries do not guarantee the senior notes. These guarantees are subject to release in limited circumstances (only upon the occurrence of certain customary conditions).
Credit Agreement
On March 28, 2017, the Company amended and restated its prior credit agreement, originally entered into on January 29, 2014, and further amended the credit agreement on April 28, 2017 (as amended and restated, the “Credit Agreement”). The Credit Agreement provides for a revolving credit facility in an aggregate principal amount of $800.0 (the “Revolving Credit Facility”), with the commitments thereunder to be made available to the Company in US Dollars, Canadian Dollars, Euros and pounds sterling. The issuance of letters of credit is available under the Credit Agreement in an aggregate amount of up to $50.0. The Credit Agreement also provides for potential incremental revolving and term facilities at the request of the Company and at the discretion of the lenders, in each case on terms to be determined, and also permits the Company, subject to certain conditions, to incur incremental equivalent debt, in an aggregate maximum amount not to exceed the greater of (1) $700.0 and (2) the maximum amount at which (A) the Company’s pro forma consolidated leverage ratio (as defined in the Credit Agreement) would not exceed 6.50 to 1.00 and (B) the Company’s pro forma senior secured leverage ratio (as defined in the Credit Agreement) would not exceed 3.00 to 1.00 as of the date such indebtedness is incurred. The outstanding amounts under the Revolving Credit Facility must be repaid on or before March 28, 2022. The Company incurred $4.6 of issuance costs in connection with the Credit Agreement in the year ended September 30, 2017. The Revolving Credit Facility has outstanding letters of credit of $10.0 which reduced the available borrowing capacity to $790.0 at September 30, 2017. The Credit Agreement also permits the Company to incur additional unsecured debt if, among other conditions, its consolidated interest coverage ratio (as defined in the Credit Agreement) would be greater than or equal to 2.00 to 1.00 after giving effect to such new debt.
Borrowings under the Revolving Credit Facility will bear interest, at the option of the Company, at an annual rate equal to either the Base Rate, Eurodollar Rate or Canadian Dollar Offered Rate (“CDOR”) (as such terms are defined in the Credit Agreement) plus an applicable margin ranging from 1.75% to 2.25% for Eurodollar Rate-based loans and CDOR Rate-based loans and from 0.75% to 1.25% for Base Rate-based loans, depending in each case on the Company’s senior secured leverage ratio. Commitment fees on the daily unused amount of commitments under the Revolving Credit Facility will accrue at rates ranging from 0.250% to 0.375%, also depending on the Company’s senior secured leverage ratio.
72
The Credit Agreement contains affirmative and negative covenants customary for agreements of this type, including delivery of financial and other information, compliance with laws, maintenance of property, existence, insurance and books and records, inspection rights, obligation to provide collateral and guarantees by certain new subsidiaries, preparation of environmental reports, participation in an annual meeting with the agent and the lenders under the Credit Agreement, further assurances, limitations with respect to indebtedness, liens, fundamental changes, restrictive agreements, use of proceeds, amendments of organization documents, accounting changes, prepayments and amendments of certain indebtedness, dispositions of assets, acquisitions and other investments, sale leaseback transactions, conduct of business, transactions with affiliates, dividends and redemptions or repurchases of stock, and granting liens. The Credit Agreement contains a financial covenant requiring the Company to maintain a senior secured leverage ratio (as defined in the Credit Agreement) not to exceed 4.25 to 1.00, measured as of the last day of any fiscal quarter if, as of the last day of such fiscal quarter, the aggregate outstanding amount of all revolving credit loans, swing line loans and letter of credit obligations (subject to certain exceptions specified in the Credit Agreement) exceeds 30% of the Company’s revolving credit commitments.
The Credit Agreement provides for customary events of default, including material breach of representations and warranties, failure to make required payments, failure to comply with certain agreements or covenants, failure to pay, or default under, indebtedness in excess of $75.0, certain events of bankruptcy and insolvency, inability to pay debts, the occurrence of one or more unstayed or undischarged judgments in excess of $75.0, attachments issued against a material part of the Company’s property, change in control, the invalidity of any loan document, the failure of the collateral documents to create a valid and perfected first priority lien and certain ERISA events. Upon the occurrence of an event of default, the maturity of the loans under the Credit Agreement may be accelerated and the agent and lenders under the Credit Agreement may exercise other rights and remedies available at law or under the loan documents, including with respect to the collateral and guarantees for the Company’s obligations under the Credit Agreement.
The Company’s obligations under the Credit Agreement are unconditionally guaranteed by each of the Guarantors. The Company’s obligations under the Credit Agreement are secured by security interests on substantially all of the personal property assets of the Company and the Guarantors and are secured by the material domestic real property assets of the Company and the Guarantors.
Term Loans
On May 24, 2017, the Company entered into a Joinder Agreement No. 1 (“Joinder No. 1”). Joinder No.1 provided for an incremental term loan of $1,200.0 (the “ Joinder No. 1 Term Loan”) under the Credit Agreement. Pursuant to Joinder No. 1, the Company borrowed $1,200.0, the net proceeds of which were used to repay the $800.0 principal value of the 7.75% senior notes as well as $262.5 principal value of the 8.00% senior notes along with related tender premiums and other fees and expenses (described above).
On June 29, 2017, the Company entered into a Joinder Agreement No. 2 (“Joinder No. 2”). Joinder No. 2 provided for an incremental term loan of $1,000.0 (the “ Joinder No. 2 Term Loan”) under the Credit Agreement. Pursuant to Joinder No. 2, the Company borrowed $1,000.0 and used the proceeds, together with cash on hand, to finance its acquisition of the Weetabix Group (see Note 5).
The Joinder No. 2 Term Loan was combined with the outstanding amounts under the Joinder No.1 Term Loan (collectively the “Term Loan”). The outstanding amounts under the Term Loan bear interest at the Eurodollar Rate plus 2.25% or the Base Rate (as such terms are defined in the Credit Agreement) plus 1.25%. The interest rate on the Term Loan at September 30, 2017 was 3.49%. The Term Loan requires quarterly principal installments of $5.5 beginning on September 30, 2017 and must be repaid in full on May 24, 2024. The Company must make certain prepayments of principal of the Term Loan under circumstances specified in Joinder No. 1. The Company incurred $23.7 of issuance costs in connection with the Term Loan as of September 30, 2017.
In fiscal 2016 and 2015, the Company utilized a portion of the net proceeds from the issuances of the 7.75% senior notes, the 8.00% senior notes and the 5.00% senior notes, together with the net proceeds from the August 18, 2015 common stock issuance, to repay its prior term loan, originally entered into on June 2, 2014 and May 4, 2015. In connection with the early repayment of the prior term loan, the Company expensed $7.8 and $30.0 of debt issuance costs and unamortized debt discount in the years ended September 30, 2016 and 2015, respectively, which is reported as “Loss on extinguishment of debt, net” in the Consolidated Statement of Operations.
Debt Covenants
Under the terms of the Credit Agreement, the Company is required to comply with a financial covenant consisting of a ratio for quarterly maximum senior secured leverage (as defined in the Credit Agreement) not to exceed 4.25 to 1.00, measured as of the last day of any fiscal quarter if, as of the last day of such fiscal quarter, the aggregate outstanding amount of all revolving credit loans, swing line loans and letter of credit obligations (subject to certain exceptions specified in the Credit Agreement) exceeds 30% of the Company’s revolving credit commitments. As of September 30, 2017, the Company was not required to comply with such financial covenant as the aggregate amount of the aforementioned obligations did not exceed 30%.
73
The Credit Agreement permits the Company to incur additional unsecured debt if, among other conditions, the pro forma consolidated interest coverage ratio, calculated as provided in the Credit Agreement, would be greater than or equal to 2.00 to 1.00 after giving effect to such new debt. As of September 30, 2017, the pro forma consolidated interest coverage ratio exceeded this threshold.
NOTE 16 — COMMITMENTS AND CONTINGENCIES
Legal Proceedings
Antitrust claims: In late 2008 and early 2009, some 22 class action lawsuits were filed in various federal courts against Michael Foods, Inc. (“Michael Foods”), a wholly-owned subsidiary of the Company, and some 20 other defendants (producers of shell eggs and egg products, and egg industry organizations), alleging violations of federal and state antitrust laws in connection with the production and sale of shell eggs and egg products, and seeking unspecified damages. All cases were transferred to the Eastern District of Pennsylvania for coordinated and/or consolidated pretrial proceedings.
The case involves three plaintiff groups: (1) direct purchasers of eggs and egg products; (2) companies (primarily large grocery chains and food companies that purchase considerable quantities of eggs) that opted out of any eventual class and brought their own separate actions against the defendants (“opt-out plaintiffs”); and (3) indirect purchasers of shell eggs.
Motions related to class certification: In September 2015, the court granted the motion of the direct purchaser plaintiffs to certify a shell-egg subclass, but denied their motion to certify an egg-products subclass. Also in September 2015, the court denied the motion of the indirect purchaser plaintiffs for class certification. The indirect purchaser plaintiffs subsequently filed an alternative motion for certification of an injunctive class, and that motion was denied on June 27, 2017.
Motions for summary judgment: In September 2016, the court granted the defendants’ motion for summary judgment based on purchases of egg products, thereby limiting all claims to shell eggs. Also in September 2016, the court denied individual motions for summary judgment made by Michael Foods and three other defendants that had sought the dismissal of all claims against them.
Settlements by Michael Foods: On December 8, 2016, Michael Foods reached an agreement to settle all class claims asserted against it by the direct purchaser plaintiffs for a payment of $75.0 million. The Company has paid such amount into escrow. This settlement is awaiting court approval. Although the Company expects the settlement will receive the needed approval, there can be no assurance that the court will approve the agreement as proposed by the parties.
On January 19, 2017, Michael Foods entered into a settlement, the details of which are confidential, with the opt-out plaintiffs (excluding those opt-out plaintiffs whose claims relate primarily or exclusively to egg products; several of those plaintiffs are now appealing the dismissal of the egg -products claims). This settlement was paid by the Company as of September 30, 2017. Michael Foods has at all times denied liability in this matter, and neither settlement contains any admission of liability by Michael Foods. Under current law, any settlement paid, including the settlement with the direct purchaser plaintiffs and the settlement with the opt-out plaintiffs, is deductible for federal income tax purposes.
Remaining portions of the case: The Third Circuit Court of Appeals has denied the motions of the indirect purchaser plaintiffs to immediately appeal the court’s denial of their motions for class certification. Additionally, the elimination of egg products from the case is being appealed by opt-out plaintiffs who purchased egg products. The appeal is fully submitted to the Third Circuit Court of Appeals.
Although the likelihood of a material adverse outcome in the egg antitrust litigation has been significantly reduced as a result of the Michael Foods settlements described above, there is still a possibility of an adverse outcome following appellate review of the remaining portions of the case. At this time, however, we do not believe it is possible to estimate any loss in connection with these remaining portions of the egg antitrust litigation. Accordingly, we cannot predict what impact, if any, these remaining matters and any results from such matters could have on our future results of operations.
At September 30, 2016, the Company had accrued $28.5 for this matter that was included in “Other current liabilities” on the Consolidated Balance Sheets. There were no accruals for these matters at September 30, 2017. We record reserves for litigation losses in accordance with ASC Topic 450, “Contingencies” (“ASC 450”). Under ASC 450, a loss contingency is recorded if a loss is probable and can be reasonably estimated. We record probable loss contingencies based on the best estimate of the loss. If a range of loss can be reasonably estimated, but no single amount within the range appears to be a better estimate than any other amount within the range, the minimum amount in the range is accrued. These estimates are often initially developed earlier than when the ultimate loss is known, and the estimates are adjusted if additional information becomes known.
Although the Company believes its accruals for this matter are appropriate, the final amounts required to resolve such matters could differ materially from recorded estimates and the Company's results of operations and cash flows could be materially affected.
74
Accordingly, the Company cannot predict what impact, if any, these matters and any results from such matters could have on the future results of operations.
During the years ended September 30, 2017 and 2016, the Company expensed $74.5 and $28.5 related to these settlements, respectively, which was included in “Selling, general and administrative expenses” in the Consolidated Statements of Operations. No expense related to these settlements was recorded during the year ended September 30, 2015.
Other: The Company is subject to various other legal proceedings and actions arising in the normal course of business. In the opinion of management, based upon the information presently known, the ultimate liability, if any, arising from such pending legal proceedings, as well as from asserted legal claims and known potential legal claims which are likely to be asserted, taking into account established accruals for estimated liabilities (if any), are not expected to be material individually or in the aggregate to the consolidated financial position, results of operations or cash flows of the Company. In addition, although it is difficult to estimate the potential financial impact of actions regarding expenditures for compliance with regulatory matters, in the opinion of management, based upon the information currently available, the ultimate liability arising from such compliance matters is not expected to be material to the consolidated financial position, results of operations or cash flows of the Company.
Lease Commitments
Future minimum rental payments under noncancelable operating leases in effect as of September 30, 2017 were $22.4, $25.3, $23.7, $22.8, $20.6 and $38.1 for fiscal 2018, 2019, 2020, 2021, 2022 and thereafter, respectively.
NOTE 17 — PENSION AND OTHER POSTRETIREMENT BENEFITS
The Company maintains qualified defined benefit plans in the United States, United Kingdom and Canada for certain employees primarily within its Post Consumer Brands and Weetabix segments. Certain of the Company’s employees are eligible to participate in the Company’s postretirement benefit plans (partially subsidized retiree health and life insurance). The following disclosures reflect amounts related to the Company’s employees based on separate actuarial valuations, projections and certain allocations. Amounts for the Canadian plans are included in the North America disclosures and are not disclosed separately because they do not constitute a significant portion of the combined amounts. With respect to defined benefits for U.S. Post Consumer Brands employees, eligibility is frozen to new employees and benefit accruals are frozen for all administrative employees and certain production employees. With respect to defined benefits for Canadian Post Consumer Brands employees, eligibility is frozen to new entrants and benefit accrual is frozen for salaried employees. With respect to defined benefits for Weetabix employees, eligibility is frozen to new entrants in the United Kingdom and the benefit accrual is frozen for salaried Weetabix employees in the United States and in the executive scheme for United Kingdom employees.
75
Defined Benefit Pension Plans
The following table provides a reconciliation of the changes in the pension plans’ benefit obligations and fair value of assets over the two year period ended September 30, 2017, and a statement of the funded status and amounts recognized on the combined balance sheets as of September 30, 2017 and 2016.
North America | Other International | ||||||||||||||
Year Ended September 30, | Year Ended September 30, | ||||||||||||||
2017 | 2016 | 2017 | 2016 | ||||||||||||
Change in benefit obligation | |||||||||||||||
Benefit obligation at beginning of period | $ | 71.2 | $ | 58.1 | $ | — | $ | — | |||||||
Service cost | 4.1 | 4.0 | 1.7 | — | |||||||||||
Interest cost | 2.5 | 2.5 | 4.9 | — | |||||||||||
Plan participants’ contributions | 0.6 | 0.6 | 0.6 | — | |||||||||||
Plan amendment (a) | — | 0.5 | — | — | |||||||||||
Actuarial loss (gain) | (1.0 | ) | 8.0 | (46.4 | ) | — | |||||||||
Business combinations | 25.5 | — | 746.0 | — | |||||||||||
Benefits paid | (3.0 | ) | (2.7 | ) | (6.2 | ) | — | ||||||||
Currency translation | 0.7 | 0.2 | 23.0 | — | |||||||||||
Benefit obligation at end of period | $ | 100.6 | $ | 71.2 | $ | 723.6 | $ | — | |||||||
Change in fair value of plan assets | |||||||||||||||
Fair value of plan assets at beginning of period | $ | 54.3 | $ | 44.4 | $ | — | $ | — | |||||||
Actual return on plan assets | 5.4 | 5.5 | 0.3 | — | |||||||||||
Employer contributions | 7.7 | 6.3 | 2.4 | — | |||||||||||
Business combinations | 15.2 | — | 852.2 | — | |||||||||||
Plan participants’ contributions | 0.6 | 0.6 | 0.6 | — | |||||||||||
Benefits paid | (3.0 | ) | (2.7 | ) | (6.2 | ) | — | ||||||||
Currency translation | 0.7 | 0.2 | 27.4 | — | |||||||||||
Fair value of plan assets at end of period | 80.9 | 54.3 | 876.7 | — | |||||||||||
Funded status | $ | (19.7 | ) | $ | (16.9 | ) | $ | 153.1 | $ | — | |||||
Amounts recognized in assets or liabilities | |||||||||||||||
Other assets | $ | 1.5 | $ | — | $ | 153.1 | $ | — | |||||||
Other liabilities | (21.2 | ) | (16.9 | ) | — | — | |||||||||
Net amount recognized | $ | (19.7 | ) | $ | (16.9 | ) | $ | 153.1 | $ | — | |||||
Amounts recognized in accumulated other comprehensive loss | |||||||||||||||
Net actuarial loss | $ | 0.6 | $ | 19.1 | $ | (40.2 | ) | $ | — | ||||||
Prior service cost (credit) | 14.3 | 0.8 | — | — | |||||||||||
Total | $ | 14.9 | $ | 19.9 | $ | (40.2 | ) | $ | — | ||||||
Weighted-average assumptions used to determine benefit obligation | |||||||||||||||
Discount rate — U.S. plans | 3.86 | % | 3.66 | % | n/a | n/a | |||||||||
Discount rate — Canadian plans | 3.63 | % | 3.18 | % | n/a | n/a | |||||||||
Discount rate — Other international plans | n/a | n/a | 2.72 | % | n/a | ||||||||||
Rate of compensation increase — U.S. plans | 3.00 | % | 3.00 | % | n/a | n/a | |||||||||
Rate of compensation increase — Canadian plans | 2.69 | % | 2.75 | % | n/a | n/a | |||||||||
Rate of compensation increase — Other international plans | n/a | n/a | 2.70 | % | n/a | ||||||||||
(a) | In the second quarter of fiscal 2016, the Company finalized a new collective bargaining agreement that resulted in an amendment to its North American pension plans. |
The accumulated benefit obligation exceeded the fair value of plan assets for the North American pension plans at September 30, 2017 and September 30, 2016, whereas the fair value of plan assets for the Other International pension plans
76
exceeded the accumulated benefit obligation at September 30, 2017. The aggregate accumulated benefit obligation for the North American pension plans was $98.3 and $68.6 at September 30, 2017 and 2016, respectively. The aggregate accumulated benefit obligation for the Other International pension plans was $690.4 at September 30, 2017.
The following tables provide the components of net periodic benefit cost for the pension plans including amounts recognized in OCI.
North America | |||||||||||
Year Ended September 30, | |||||||||||
2017 | 2016 | 2015 | |||||||||
Components of net periodic benefit cost | |||||||||||
Service cost | $ | 4.1 | $ | 4.0 | $ | 3.8 | |||||
Interest cost | 2.5 | 2.5 | 2.2 | ||||||||
Expected return on plan assets | (3.2 | ) | (2.6 | ) | (2.4 | ) | |||||
Recognized net actuarial loss | 1.6 | 1.1 | 0.9 | ||||||||
Recognized prior service cost | 0.2 | 0.3 | 0.3 | ||||||||
Net periodic benefit cost | $ | 5.2 | $ | 5.3 | $ | 4.8 | |||||
Weighted-average assumptions used to determine net benefit cost | |||||||||||
Discount rate — U.S. plans | 3.66 | % | 4.55 | % | 4.56 | % | |||||
Discount rate — Canadian plans | 3.18 | % | 3.82 | % | 4.25 | % | |||||
Rate of compensation increase — U.S. plans | 2.99 | % | 3.00 | % | 3.00 | % | |||||
Rate of compensation increase — Canadian plans | 2.50 | % | 2.75 | % | 2.75 | % | |||||
Expected return on plan assets — U.S. plans | 5.33 | % | 5.20 | % | 5.72 | % | |||||
Expected return on plan assets — Canadian plans | 6.00 | % | 6.00 | % | 6.00 | % | |||||
Changes in benefit obligation recognized in Total Comprehensive Income (Loss) | |||||||||||
Net (gain) loss | $ | (3.1 | ) | $ | 5.1 | $ | 6.4 | ||||
Recognized loss | (1.6 | ) | (1.1 | ) | (0.9 | ) | |||||
Plan amendment | — | 0.5 | — | ||||||||
Recognized prior service cost | (0.2 | ) | (0.3 | ) | (0.3 | ) | |||||
Currency translation | (0.1 | ) | — | — | |||||||
Total recognized in other comprehensive income or loss (before tax effects) | $ | (5.0 | ) | $ | 4.2 | $ | 5.2 | ||||
Other International | |||||||||||
Year Ended September 30, | |||||||||||
2017 | 2016 | 2015 | |||||||||
Components of net periodic benefit cost | |||||||||||
Service cost | $ | 1.7 | $ | — | $ | — | |||||
Interest cost | 4.9 | — | — | ||||||||
Expected return on plan assets | (7.5 | ) | — | — | |||||||
Net periodic benefit cost | $ | (0.9 | ) | $ | — | $ | — | ||||
Weighted-average assumptions used to determine net benefit cost | |||||||||||
Discount rate | 2.61 | % | — | % | — | % | |||||
Rate of compensation increase | 2.75 | % | — | % | — | % | |||||
Expected return on plan assets | 3.52 | % | — | % | — | % | |||||
Changes in plan assets and benefit obligation recognized in Total Comprehensive Income (Loss) | |||||||||||
Net (gain) loss | $ | (39.3 | ) | $ | — | $ | — | ||||
Currency translation | (0.9 | ) | — | — | |||||||
Total recognized in other comprehensive income or loss (before tax effects) | $ | (40.2 | ) | $ | — | $ | — | ||||
The estimated net actuarial loss and prior service cost expected to be reclassified from accumulated OCI into net periodic benefit cost during 2018 related to North American pension benefits are $1.1 and $0.1, respectively. There are no estimated net
77
actuarial loss and prior service cost (credit) expected to be reclassified from accumulated OCI into net periodic benefit cost during 2018 related to Other International pension benefits. In addition, the Company expects to make contributions of $5.2 and $9.6 to its defined benefit North American and Other International pension plans, respectively, during fiscal 2018.
The expected return on North American pension plan assets was determined based on historical and expected future returns of the various asset classes, using the target allocation. The broad target allocations are 56.0% equity securities, 40.0% debt securities and 4.0% real assets. At September 30, 2017, equity securities were 58.3%, debt securities were 37.0%, real assets were 3.7% and other was 1.0% of the fair value of total plan assets, approximately 69.6% of which was invested in passive index funds. At September 30, 2016, equity securities were 49.8%, debt securities were 42.4%, real assets were 6.6% and cash was 1.2% of the fair value of total plan assets, approximately 81.0% of which was invested in passive index funds. The allocation guidelines were established based on management’s determination of the appropriate risk posture and long-term objectives.
The expected return on Other International pension plan assets was determined based on historical and expected future returns of the various asset classes, using the target allocation. The broad target allocations are 63.0% debt securities, 22.8% liability driven instruments, 4.0% real assets, 8.0% other and 2.2% cash. At September 30, 2017, debt securities were 75.9%, liability hedging instruments were 23.3%, real assets were 0.4%, other was 0.1% and cash was 0.3% of the fair value of total plan assets, approximately 25.6% of which was invested in passive index funds. The allocation guidelines were established based on management’s determination of the appropriate risk posture and long-term objectives.
The following tables present the North American and Other International pension plan’s assets measured at fair value on a recurring basis and the basis for that measurement. The fair value of mutual funds is based on quoted net asset values of the shares held by the plan at year end.
North America | |||||||||||||||||||||||
September 30, 2017 | September 30, 2016 | ||||||||||||||||||||||
Total | Level 1 | Level 2 | Total | Level 1 | Level 2 | ||||||||||||||||||
Equities | $ | 16.4 | $ | 7.8 | $ | 8.6 | $ | 6.7 | $ | — | $ | 6.7 | |||||||||||
Bonds | 11.3 | 11.3 | — | 6.0 | 6.0 | — | |||||||||||||||||
Fixed income | 4.6 | — | 4.6 | 3.9 | — | 3.9 | |||||||||||||||||
Real assets | 0.9 | 0.9 | — | — | — | — | |||||||||||||||||
Cash | 0.8 | 0.8 | — | 0.6 | 0.6 | — | |||||||||||||||||
Fair value of plan assets in the fair value hierarchy | 34.0 | 20.8 | 13.2 | 17.2 | 6.6 | 10.6 | |||||||||||||||||
Equities | 30.7 | — | — | 20.3 | — | — | |||||||||||||||||
Pooled assets | 4.5 | — | — | 4.3 | — | — | |||||||||||||||||
Fixed income | 9.6 | — | — | 8.9 | — | — | |||||||||||||||||
Real assets | 2.1 | — | — | 3.6 | — | — | |||||||||||||||||
Investments measured at net asset value (a) | 46.9 | — | — | 37.1 | — | — | |||||||||||||||||
Total plan assets | $ | 80.9 | $ | 20.8 | $ | 13.2 | $ | 54.3 | $ | 6.6 | $ | 10.6 | |||||||||||
Other International | |||||||||||
September 30, 2017 | |||||||||||
Total | Level 1 | Level 2 | |||||||||
Bonds | $ | 461.7 | $ | 441.1 | $ | 20.6 | |||||
Liability driven instruments | 204.2 | 204.2 | — | ||||||||
Fixed income | 108.3 | 108.3 | — | ||||||||
Cash | 2.7 | 2.7 | — | ||||||||
Fair value of plan assets in the fair value hierarchy | 776.9 | 756.3 | 20.6 | ||||||||
Fixed income | 95.0 | — | — | ||||||||
Real assets | 3.9 | — | — | ||||||||
Other | 0.9 | — | — | ||||||||
Investments measured at net asset value (a) | 99.8 | — | — | ||||||||
Total plan assets | $ | 876.7 | $ | 756.3 | $ | 20.6 | |||||
(a) | In accordance with ASC 820-10, certain investments were measured at net asset value per share (“NAV”). In cases where the fair value was measured at NAV using the practical expedient provided for in ASC 820-10, the investments have not been classified in the fair value hierarchy. The fair value amounts presented in these tables are intended to permit reconciliation of the fair value hierarchy to the tables above. |
78
Other Postretirement Benefits
The following table provides a reconciliation of the changes in the North American other postretirement benefit obligations over the two year period ended September 30, 2017. Besides the North American plans, the Company does not maintain any other postretirement benefit plans.
Year Ended September 30, | |||||||
2017 | 2016 | ||||||
Change in benefit obligation | |||||||
Benefit obligation at beginning of period | $ | 68.6 | $ | 112.4 | |||
Service cost | 0.6 | 1.0 | |||||
Interest cost | 2.0 | 4.0 | |||||
Plan amendment (a) | (0.1 | ) | (36.1 | ) | |||
Actuarial gain | (4.4 | ) | (11.3 | ) | |||
Benefits paid | (2.1 | ) | (1.6 | ) | |||
Currency translation | 0.4 | 0.2 | |||||
Benefit obligation at end of period | $ | 65.0 | $ | 68.6 | |||
Change in fair value of plan assets | |||||||
Employer contributions | 2.1 | 1.6 | |||||
Benefits paid | (2.1 | ) | (1.6 | ) | |||
Fair value of plan assets at end of period | — | — | |||||
Funded status | $ | (65.0 | ) | $ | (68.6 | ) | |
Amounts recognized in assets or liabilities | |||||||
Other current liabilities | (2.7 | ) | (2.3 | ) | |||
Other liabilities | (62.3 | ) | (66.3 | ) | |||
Net amount recognized | $ | (65.0 | ) | $ | (68.6 | ) | |
Amounts recognized in accumulated other comprehensive loss | |||||||
Net actuarial loss | $ | 8.6 | $ | 13.6 | |||
Prior service cost (credit) | (28.8 | ) | (33.5 | ) | |||
Total | $ | (20.2 | ) | $ | (19.9 | ) | |
Weighted-average assumptions used to determine benefit obligation | |||||||
Discount rate — U.S. plans | 3.77 | % | 3.54 | % | |||
Discount rate — Canadian plans | 3.69 | % | 3.23 | % | |||
Rate of compensation increase — Canadian plans | 2.75 | % | 2.75 | % | |||
(a) | In the second quarter of fiscal 2016, the Company finalized a new collective bargaining agreement that resulted in an amendment to its pension and other postretirement benefit plans. |
79
The following table provides the components of net periodic benefit cost for the other postretirement benefit plans including amounts recognized in OCI.
Year Ended September 30, | |||||||||||
2017 | 2016 | 2015 | |||||||||
Components of net periodic benefit cost | |||||||||||
Service cost | $ | 0.6 | $ | 1.0 | $ | 2.0 | |||||
Interest cost | 2.0 | 4.0 | 4.8 | ||||||||
Recognized net actuarial loss | 0.7 | 1.6 | 1.4 | ||||||||
Recognized prior service credit | (4.8 | ) | (3.8 | ) | (1.6 | ) | |||||
Net periodic benefit cost | $ | (1.5 | ) | $ | 2.8 | $ | 6.6 | ||||
Weighted-average assumptions used to determine net benefit cost | |||||||||||
Discount rate — U.S. plans (Prior to plan amendment) (a) | n/a | 4.60 | % | 4.61 | % | ||||||
Discount rate — U.S. plans (Subsequent to plan amendment) (a) | 3.54 | % | 4.22 | % | n/a | ||||||
Discount rate — Canadian plans | 3.23 | % | 3.91 | % | 4.45 | % | |||||
Rate of compensation increase — Canadian plans | 2.75 | % | 2.75 | % | 2.75 | % | |||||
Changes in plan assets and benefit obligation recognized in Total Comprehensive Income (Loss) | |||||||||||
Net (gain) loss | $ | (4.4 | ) | $ | (11.3 | ) | $ | 3.1 | |||
Recognized loss | (0.7 | ) | (1.6 | ) | (1.4 | ) | |||||
Plan amendment | (0.1 | ) | (36.1 | ) | — | ||||||
Recognized prior service credit | 4.8 | 3.8 | 1.6 | ||||||||
Currency translation | 0.1 | (0.1 | ) | (0.3 | ) | ||||||
Total recognized in other comprehensive income or loss (before tax effects) | $ | (0.3 | ) | $ | (45.3 | ) | $ | 3.0 | |||
(a) | The plan was re-measured as of February 29, 2016. For fiscal 2016, the discount rate was 4.6% for the first five months of benefit cost and 4.22% for the last seven months of benefit cost. |
For September 30, 2017 measurement purposes, the assumed annual rate of increase in the future per capita cost of covered health care benefits related to domestic plans for 2018 was 7.0% and 5.8% for participants under the age of 65 and over the age of 65, respectively, declining gradually to an ultimate rate of 5.0% for 2022 and beyond. For September 30, 2016 measurement purposes, the assumed annual rate of increase in the future per capita cost of covered health care benefits related to domestic plans for 2017 was 7.5% and 6.0% for participants under the age of 65 and over the age of 65, respectively, declining gradually to an ultimate rate of 5.0% for 2022 and beyond. For September 30, 2017 and 2016 measurement purposes, the assumed annual rate of increase in the future per capita cost of covered health care benefits related to Canadian plans for the following fiscal year was 6.5% and 7.0%, respectively, declining gradually to an ultimate rate of 4.5% for 2021 and beyond for the year ended September 30, 2017 and 2016. A 1% change in assumed health care cost trend rates would result in the following changes in the accumulated postretirement benefit obligation and in the total service and interest cost components for fiscal 2017:
Increase | Decrease | ||||||
Effect on postretirement benefit obligation | $ | 6.7 | $ | (5.5 | ) | ||
Effect on total service and interest cost | 0.3 | (0.2 | ) | ||||
The estimated net actuarial loss and prior service credit expected to be reclassified from accumulated OCI into net periodic benefit cost during 2018 related to other postretirement benefits are $0.3 and $4.7, respectively.
Additional Information
As of September 30, 2017, expected future benefit payments and related federal subsidy receipts (Medicare Part D) in the next ten fiscal years were as follows:
2018 | 2019 | 2020 | 2021 | 2022 | 2023- 2027 | ||||||||||||||||||
Pension benefits | $ | 23.0 | $ | 24.2 | $ | 24.6 | $ | 25.5 | $ | 26.8 | $ | 153.3 | |||||||||||
Other benefits | 2.7 | 3.0 | 3.2 | 3.3 | 3.5 | 18.2 | |||||||||||||||||
Subsidy receipts | — | — | 0.1 | 0.1 | 0.1 | 1.0 | |||||||||||||||||
80
In addition to the defined benefit plans described above, the Company sponsors a defined contribution 401(k) plan under which it makes matching contributions. The Company expensed $18.2, $15.6 and $11.7 for the fiscal years ended September 30, 2017, 2016 and 2015, respectively.
NOTE 18 — STOCK-BASED COMPENSATION
On February 3, 2012, the Company established the 2012 Long-Term Incentive Plan (the “2012 Plan”) which permitted the issuance of various stock-based compensation awards up to 6.5 million shares. On January 29, 2016, the Company established the 2016 Long-Term Incentive Plan (the “2016 Plan”) which permits issuance of stock-based compensation awards up to 2.4 million shares. Upon establishment of the 2016 Plan, all remaining shares available to be issued under the 2012 Plan were transfered to the 2016 Plan. Awards issued under the 2012 Plan and 2016 Plan have a maximum term of 10 years, provided, however, that the Corporate Governance and Compensation Committee of the Board of Directors may, in its discretion, grant awards with a longer term to participants who are located outside the United States.
Total compensation cost for cash and non-cash stock-based compensation awards recognized in the fiscal years ended 2017, 2016 and 2015 was $30.7, $25.6 and $29.2, respectively, and the related recognized deferred tax benefit for each of those periods was approximately $9.7, $8.0 and $10.6, respectively. As of September 30, 2017, the total compensation cost related to non-vested awards not yet recognized was $44.4, which is expected to be recognized over a weighted-average period of 2.2 years.
In connection with employee retirement and reorganization initiatives during fiscal 2015, the Company accelerated the vesting of unvested equity awards for 25 and 4 employees in the fiscal years ended September 2016 and 2015, respectively. As a result of this acceleration, the Company recorded $2.2 and $8.0 of incremental cash and stock-based compensation expense in the fiscal years ended September 30, 2016 and 2015, respectively. No such expense was recorded in the year ended September 30, 2017.
Stock Appreciation Rights
Information about stock-settled stock appreciation rights (“SSAR”) is summarized in the following table. Upon exercise of each SSAR, the holder will receive the number of shares of Post common stock equal in value to the difference between the exercise price and the fair market value at the date of exercise, less all applicable taxes. The total intrinsic value of SSARs exercised was $0.6, $5.1 and $2.1 in the fiscal years ended September 30, 2017, 2016 and 2015, respectively.
Stock-Settled Stock Appreciation Rights | Weighted- Average Exercise Price Per Share | Weighted- Average Remaining Contractual Term in Years | Aggregate Intrinsic Value | |||||||||
Outstanding at September 30, 2016 | 152,831 | $ | 42.07 | |||||||||
Granted | — | — | ||||||||||
Exercised | (15,000 | ) | 46.19 | |||||||||
Forfeited | — | — | ||||||||||
Expired | — | — | ||||||||||
Outstanding at September 30, 2017 | 137,831 | 41.63 | 5.69 | $ | 6.4 | |||||||
Vested and expected to vest as of September 30, 2017 | 137,831 | 41.63 | 5.69 | 6.4 | ||||||||
Exercisable at September 30, 2017 | 102,831 | 38.17 | 5.08 | 5.2 | ||||||||
In 2015, the Company granted 40,000 SSARs to its non-management members of the Board of Directors. Due to vesting provisions of these awards the Company determined that these awards had subjective acceleration rights such that the Company expensed the grant date fair value upon issuance and recognized $0.7 of related expense for the year ended September 30, 2015.
The following table provides the weighted-average grant date fair value of SSARs granted calculated using the Black-Scholes valuation model, which uses assumptions of expected life (term), expected stock price volatility, risk-free interest rate, and expected dividends (collectively, the “Black-Scholes Model”). The expected term is estimated based on the award’s vesting period and contractual term, along with historical exercise behavior on similar awards. Expected volatilities are based on historical volatility trends. The risk-free rate is the interpolated U.S. Treasury rate for a term equal to the expected term. The weighted-average assumptions and grant date fair values for SSARs granted during the fiscal year ended September 30, 2015 are summarized in the table below. For SSARs granted to Company employees prior to the separation from its former owner, the assumptions used in the Black-Scholes Model were based on the former owner’s history and stock characteristics.
81
2015 | |
Expected term (in years) | 6.5 |
Expected stock price volatility | 29.2% |
Risk-free interest rate | 1.6% |
Expected dividends | 0% |
Fair value (per SSAR) | $16.72 |
Cash Settled Stock Appreciation Rights
Cash-Settled Stock Appreciation Rights | Weighted- Average Exercise Price Per Share | Weighted- Average Remaining Contractual Term in Years | Aggregate Intrinsic Value | |||||||||
Outstanding at September 30, 2016 | 105,000 | $ | 46.29 | |||||||||
Granted | — | — | ||||||||||
Exercised | (500 | ) | 18.10 | |||||||||
Forfeited | — | — | ||||||||||
Expired | — | — | ||||||||||
Outstanding at September 30, 2017 | 104,500 | 46.43 | 7.40 | $ | 4.4 | |||||||
Vested and expected to vest as of September 30, 2017 | 104,500 | 46.43 | 7.40 | 4.4 | ||||||||
Exercisable at September 30, 2017 | 71,166 | 45.83 | 7.31 | 3.0 | ||||||||
The fair value of each cash settled stock appreciation right (“SAR”) was estimated each reporting period using the Black-Scholes Model. The expected term is estimated based on the award’s vesting period and contractual term, along with historical exercise behavior on similar awards. Expected volatilities are based on historical volatility trends and other factors. The risk-free rate is the interpolated U.S. Treasury rate for a term equal to the expected term. The following table presents the assumptions used to remeasure the fair value of outstanding SARs at September 30, 2017, 2016 and 2015.
2017 | 2016 | 2015 | |||
Expected term | 2.9 | 3.8 | 4.8 | ||
Expected stock price volatility | 31.7% | 32.4% | 29.7% | ||
Risk-free interest rate | 1.6% | 1.0% | 1.3% | ||
Expected dividends | 0% | 0% | 0% | ||
Fair value (per right) | $54.18 | $44.44 | $29.10 | ||
Stock Options
Stock Options | Weighted- Average Exercise Price Per Share | Weighted- Average Remaining Contractual Term in Years | Aggregate Intrinsic Value | |||||||||
Outstanding at September 30, 2016 | 4,255,500 | $ | 42.15 | |||||||||
Granted | 343,000 | 71.32 | ||||||||||
Exercised | (400,000 | ) | 33.51 | |||||||||
Forfeited | — | — | ||||||||||
Expired | — | — | ||||||||||
Outstanding at September 30, 2017 | 4,198,500 | 45.36 | 6.29 | $ | 180.2 | |||||||
Vested and expected to vest as of September 30, 2017 | 4,198,500 | 45.36 | 6.29 | 180.2 | ||||||||
Exercisable at September 30, 2017 | 3,060,163 | 41.00 | 5.76 | 144.7 | ||||||||
The fair value of each stock option was estimated on the date of grant using the Black-Scholes Model. The Company uses the simplified method for estimating a stock option term as it does not have sufficient historical share options exercise experience upon which to estimate an expected term. The expected term is estimated based on the award’s vesting period and contractual term, along with historical exercise behavior on similar awards. Expected volatilities are based on historical volatility trends and other factors. The risk-free rate is the interpolated U.S. Treasury rate for a term equal to the expected term. The weighted-average
82
assumptions and fair values for stock options granted during the years ended September 30, 2017, 2016 and 2015 are summarized in the table below.
2017 | 2016 | 2015 | |||
Expected term | 6.5 | 6.5 | 5.3 | ||
Expected stock price volatility | 30.6% | 29.1% | 27.9% | ||
Risk-free interest rate | 1.9% | 1.9% | 1.6% | ||
Expected dividends | 0% | 0% | 0% | ||
Fair value (per option) | $24.80 | $20.22 | $7.22 | ||
The total intrinsic value of stock options exercised was $17.6, $5.1 and $12.4 in the fiscal years ended September 30, 2017, 2016 and 2015, respectively.
Restricted Stock Units
Restricted Stock Units | Weighted- Average Grant Date Fair Value Per Share | |||||
Nonvested at September 30, 2016 | 543,502 | $ | 54.11 | |||
Granted | 342,778 | 73.79 | ||||
Vested | (136,557 | ) | 51.60 | |||
Forfeited | (19,683 | ) | 63.84 | |||
Nonvested at September 30, 2017 | 730,040 | 63.55 | ||||
The grant date fair value of each restricted stock award was determined based upon the closing price of the Company’s stock on the date of grant. The total vest date fair value of restricted stock units that vested during fiscal 2017, 2016 and 2015 was $10.5, $32.0 and $9.3, respectively.
In fiscal years 2017 and 2016, the Company granted 10,200 and 15,000 restricted stock units to its non-management members of the Board of Directors, respectively. Due to vesting provisions of these awards, the Company determined that 8,500 and 12,500 of these awards granted in 2017 and 2016, respectively, had subjective acceleration rights such that the Company expensed the grant date fair value upon issuance and recognized $0.7 of related expense in each of the years ended September 30, 2017 and 2016, respectively.
Cash Settled Restricted Stock Units
Cash-Settled Restricted Stock Units | Weighted- Average Grant Date Fair Value Per Share | |||||
Nonvested at September 30, 2016 | 154,230 | $ | 47.66 | |||
Granted | — | — | ||||
Vested | (51,919 | ) | 44.41 | |||
Forfeited | (2,192 | ) | 42.37 | |||
Nonvested at September 30, 2017 | 100,119 | 49.47 | ||||
Cash settled restricted stock awards are liability awards and as such, their fair value is based upon the closing price of the Company’s stock for each reporting period, with the exception of 49,000 cash settled restricted stock units that are valued at the greater of the closing stock price or the grant price of $51.43. Cash used by the Company to settle restricted stock units was $4.1, $5.9 and $3.4 for the years ended September 30, 2017, 2016 and 2015, respectively.
Deferred Compensation
Post provides deferred compensation plans for directors and key employees through which eligible participants may elect to defer payment of all or a portion of their compensation or eligible annual bonus until a later date based on the participant’s elections. Participant deferrals for employee participants may be made into Post common stock equivalents (Equity Option) or into a number of funds operated by The Vanguard Group Inc. with a variety of investment strategies and objectives (Vanguard Funds). In order to receive a 33% matching contribution, deferrals for director participants must be made into Post common stock equivalents.
83
Deferrals into the Equity Option are generally distributed in Post stock for employees and cash for directors, while deferrals into the Vanguard Funds are distributed in cash. There are no significant costs related to the administration of the deferred compensation plans. Post funds its deferred compensation liability (potential cash distributions) by investing in the Vanguard Funds in the same amounts as selected by the participating employees. Both realized and unrealized gains and losses on these investments are included in “Selling, general and administrative expenses” in the Consolidated Statement of Operations and offset the related change in the deferred compensation liability. For additional information, refer to Note 14.
NOTE 19 — TANGIBLE EQUITY UNITS
In May 2014, the Company completed a public offering of 2.875 million TEUs, each with a stated value of $100.00. Each TEU was comprised of a prepaid stock purchase contract and a senior amortizing note due June 1, 2017. The prepaid common stock purchase contracts were recorded as additional paid-in capital, net of issuance costs, and the senior notes were recorded as long-term debt. Issuance costs associated with the debt component were recorded as deferred financing costs within “Long-term debt” on the Consolidated Balance Sheets and were amortized using the effective interest rate method over the term of the instrument to June 1, 2017. Post allocated the proceeds from the issuance of the TEUs to equity and debt based on the relative fair values of the respective components of each TEU. The proceeds received in the offering were $278.6, which were net of financing fees of $8.9. The aggregate values assigned upon issuance of each component of the TEUs were as follows (amounts in millions except price per TEU):
Equity Component | Debt Component | TEUs Total | |||||||||
Price per TEU | $ | 85.48 | $ | 14.52 | $ | 100.00 | |||||
Gross proceeds | $ | 245.7 | $ | 41.8 | $ | 287.5 | |||||
Issuance costs | (7.6 | ) | (1.3 | ) | (8.9 | ) | |||||
Net proceeds | $ | 238.1 | $ | 40.5 | $ | 278.6 | |||||
Balance sheet impact (at issuance) | |||||||||||
Long-term debt (deferred financing fees) | $ | — | $ | 1.3 | $ | 1.3 | |||||
Current portion of long-term debt | — | 13.3 | 13.3 | ||||||||
Long-term debt | — | 28.5 | 28.5 | ||||||||
Additional paid-in capital | 238.1 | — | 238.1 | ||||||||
The senior amortizing note component of each TEU’s initial principal amount of $14.5219 bore interest at 5.25% per annum and had a final installment payment date on June 1, 2017. The Company paid equal quarterly cash installments of $1.3125 per amortizing note on March 1, June 1, September 1 and December 1 of each year. Payments commenced on September 1, 2014 and ended on June 1, 2017. Each installment constituted a payment of interest and a partial repayment of principal. The senior amortizing note component of the TEUs was repaid as of June 1, 2017 and the Company delivered 1.7114 shares of its common stock per purchase contract.
Holders of TEUs, or their separated purchase contract components, settled 2.8 and 0.1 purchase contracts during the years ended September 30, 2017 and 2016, respectively, for which the Company issued 4.7 and 0.2 shares of common stock during the years ended September 30, 2017 and 2016, respectively. No purchase contracts were settled and no shares of common stock were issued relating to the TEUs during the year ended September 30, 2015. All outstanding purchase contracts were settled as of September 30, 2017.
NOTE 20 — SHAREHOLDERS' EQUITY
The Company has two classes of preferred stock, the 3.75% Series B Cumulative Perpetual Convertible Preferred Stock (the “Series B Preferred”) and the 2.5% Series C Cumulative Perpetual Convertible Preferred Stock (the “Series C Preferred”). There are 50.0 preferred shares authorized.
The Series B Preferred has a $0.01 par value per share and a $100.00 liquidation value per share. There were 1.5 shares outstanding at both September 30, 2017 and 2016. The Series B Preferred earns cumulative dividends at a rate of 3.75% per annum payable quarterly on February 15, May 15, August 15 and November 15. The Series B Preferred is non-voting and ranks senior to the Company’s outstanding common stock upon the Company’s dissolution or liquidation. The Series B Preferred has no maturity date; however, holders of the Series B Preferred may convert their stock at an initial conversion rate of 2.1192 shares of the Company’s common stock per share of convertible preferred stock, which is equivalent to a conversion price of $47.19 per share of common stock.
84
On or after February 15, 2018, the Company may redeem all or some of the Series B Preferred at a redemption price equal to 100% of the liquidation preference per share, plus accrued and unpaid dividends to the redemption date if the closing sale price of our common stock has been at least 130% of the conversion price then in effect for at least 20 trading days during any 30 day trading day period ending on, and including, the trading day immediately preceding the date of the redemption notice.
The Series C Preferred has a $0.01 par value per share and a $100.00 liquidation value per share. There were 3.2 shares outstanding at both September 30, 2017 and 2016. The Series C Preferred earns cumulative dividends at a rate of 2.5% per annum payable quarterly on February 15, May 15, August 15 and November 15. The Series C Preferred is non-voting and ranks senior to the Company’s outstanding common stock upon the Company’s dissolution or liquidation. The Series C Preferred has no maturity date; however, holders of the Series C Preferred may convert their stock at an initial conversion rate of 1.8477 shares of the Company’s common stock per share of convertible preferred stock, which is equivalent to a conversion price of $54.12 per share of common stock.
On or after February 15, 2019, the Company may redeem all or some of the Series C Preferred at a redemption price equal to 100% of the liquidation preference per share, plus accrued and unpaid dividends to the redemption date if the closing sale price of our common stock has been at least 150% of the conversion price then in effect for at least 20 trading days during any 30 day trading day period ending on, and including, the trading day immediately preceding the date of the redemption notice.
Fiscal 2017
During the year ended September 30, 2017, the Company repurchased 4.0 shares of its common stock at an average share price of $79.53 per share for a total cost of $317.8, including brokers’ commissions. These share repurchases were recorded as “Treasury stock, at cost” on the Consolidated Balance Sheets.
Fiscal 2016
In December 2015, the Company and a holder of the Company’s Series B Preferred entered into an exchange agreement pursuant to which the shareholder agreed to deliver 0.9 shares of the Series B Preferred to the Company in exchange for 2.0 shares of common stock and $10.9 of cash. The number of shares of common stock exchanged in the transaction was based upon the current conversion rate, under the Certificate of Designation, Rights and Preferences for the Series B Preferred, of 2.1192 shares of common stock per share of Series B Preferred. The cash paid of $10.9 was recorded as “Additional paid-in capital” on the Consolidated Balance Sheet.
The Company may, from time to time, enter into common stock structured repurchase arrangements with financial institutions using general corporate funds. Under such arrangements, the Company pays a fixed sum of cash upon execution of each agreement in exchange for the right to receive either a pre-determined amount of cash or Post common stock. Upon expiration of each agreement, if the closing market price of Post’s common stock is above the pre-determined price, the Company will have the initial investment returned with a premium in cash. If the closing market price of Post’s common stock is at or below the pre-determined price, the Company will receive the number of shares specified in the agreement. In March 2016, the Company entered into a structured share repurchase arrangement which required cash payments totaling $28.3, including transaction-related fees of $0.2. At the May 2016 expiration of the agreement, the market price of Post’s common stock exceeded the pre-determined contract price, resulting in cash payments to the Company of $29.4. Prepayments and cash receipts at settlement under the agreement were recorded as “Additional paid-in capital” on the Consolidated Balance Sheets.
NOTE 21 — SEGMENTS
During the fourth quarter of fiscal 2017, we reorganized our reportable segments in accordance with ASC Topic 280, “Segment Reporting.” At September 30, 2017, our reportable segments were as follows:
• | Post Consumer Brands: North American RTE cereal and granola businesses, inclusive of the recently acquired Weetabix North American RTE cereal business; |
• | Michael Foods Group: eggs, potatoes, cheese and pasta; |
• | Active Nutrition: protein shakes, bars and powders and nutritional supplements; |
• | Private Brands: peanut and other nut butters and dried fruit and nuts; and |
• | Weetabix: the Weetabix branded RTE cereal and Alpen branded muesli business sold and distributed primarily outside of North America. |
All historical segment results reported herein have been reclassified to conform with the September 30, 2017 presentation.
Management evaluates each segment’s performance based on its segment profit, which is its operating profit before impairment of property and intangible assets, facility closure related costs, restructuring expenses, losses on assets held for sale, gain on sale of business and other unallocated corporate income and expenses. The following tables present information about the Company’s reportable segments, including corresponding amounts for the prior year.
85
Post’s external revenues were primarily generated by sales within the United States; foreign (primarily located in the United Kingdom and Canada) sales were approximately 8% of total fiscal 2017 net sales. Sales are attributed to individual countries based on the address to which the product is shipped.
As of September 30, 2017 and 2016, the majority of Post’s tangible long-lived assets were located in the United States; the remainder are located primarily in the United Kingdom and Canada which combined have a net carrying value of approximately $311.1 and $39.5, respectively.
In the fiscal years ended September 30, 2017, 2016 and 2015, one customer accounted for $704.1, $668.8 and $464.1, respectively, or approximately 13%, 13% and 10%, of total net sales, respectively. All segments, except Weetabix, sell products to this major customer.
The following tables present information about the Company’s reportable segments. In addition, the tables present net sales by product. Note that “Additions to property and intangibles” excludes additions through business acquisitions (see Note 5) and includes the non-monetary portion of asset exchanges.
Year Ended September 30, | |||||||||||||
2017 | 2016 | 2015 | |||||||||||
Net Sales | |||||||||||||
Post Consumer Brands | $ | 1,851.5 | $ | 1,838.5 | $ | 1,365.9 | |||||||
Michael Foods Group | 2,116.2 | 2,184.7 | 2,305.7 | ||||||||||
Active Nutrition | 713.2 | 574.7 | 555.0 | ||||||||||
Private Brands | 432.5 | 429.1 | 421.7 | ||||||||||
Weetabix | 112.4 | — | — | ||||||||||
Eliminations | — | (0.2 | ) | (0.1 | ) | ||||||||
Total | $ | 5,225.8 | $ | 5,026.8 | $ | 4,648.2 | |||||||
Segment Profit (Loss) | |||||||||||||
Post Consumer Brands | $ | 359.0 | $ | 302.9 | $ | 219.5 | |||||||
Michael Foods Group | 133.1 | 276.6 | 188.2 | ||||||||||
Active Nutrition | 96.4 | 44.7 | (13.8 | ) | |||||||||
Private Brands | 31.5 | 28.0 | 27.5 | ||||||||||
Weetabix | 14.5 | — | — | ||||||||||
Total segment profit | 634.5 | 652.2 | 421.4 | ||||||||||
General corporate expenses and other | 87.7 | 106.5 | 147.9 | ||||||||||
Impairment of goodwill and other intangibles | 26.5 | — | 60.8 | ||||||||||
Interest expense, net | 314.8 | 306.5 | 257.5 | ||||||||||
Loss on extinguishment of debt, net | 222.9 | 86.4 | 30.0 | ||||||||||
Other (income) expense, net | (91.8 | ) | 182.9 | 92.5 | |||||||||
Earnings (loss) before income taxes | $ | 74.4 | $ | (30.1 | ) | $ | (167.3 | ) | |||||
Net sales by product | |||||||||||||
Cereal and granola | $ | 1,963.9 | $ | 1,838.5 | $ | 1,365.9 | |||||||
Egg and egg products | 1,419.1 | 1,417.0 | 1,511.9 | ||||||||||
Cheese and dairy | 259.4 | 320.9 | 340.4 | ||||||||||
Refrigerated potato | 192.3 | 179.5 | 182.3 | ||||||||||
Pasta | 249.4 | 270.6 | 275.0 | ||||||||||
Protein-based products and supplements | 713.2 | 574.7 | 555.0 | ||||||||||
Nut butters and dried nut and fruit | 432.5 | 429.1 | 421.7 | ||||||||||
Eliminations | (4.0 | ) | (3.5 | ) | (4.0 | ) | |||||||
Total | $ | 5,225.8 | $ | 5,026.8 | $ | 4,648.2 | |||||||
Additions to property and intangibles | |||||||||||||
Post Consumer Brands | $ | 65.5 | $ | 39.2 | $ | 20.7 | |||||||
Michael Foods Group | 76.3 | 58.3 | 60.5 | ||||||||||
86
Active Nutrition | 3.9 | 4.4 | 7.2 | ||||||||||
Private Brands | 11.1 | 12.4 | 5.1 | ||||||||||
Weetabix | 13.6 | — | — | ||||||||||
Corporate | 20.0 | 7.2 | 27.0 | ||||||||||
Total | $ | 190.4 | $ | 121.5 | $ | 120.5 | |||||||
Depreciation and amortization | |||||||||||||
Post Consumer Brands | $ | 118.8 | $ | 111.7 | $ | 77.9 | |||||||
Michael Foods Group | 147.5 | 141.2 | 142.3 | ||||||||||
Active Nutrition | 25.3 | 25.0 | 26.9 | ||||||||||
Private Brands | 20.1 | 18.9 | 18.2 | ||||||||||
Weetabix | 7.7 | — | — | ||||||||||
Total segment depreciation and amortization | 319.4 | 296.8 | 265.3 | ||||||||||
Corporate and accelerated depreciation | 3.7 | 6.0 | 7.5 | ||||||||||
Total | $ | 323.1 | $ | 302.8 | $ | 272.8 | |||||||
September 30, | |||||||||||||
2017 | 2016 | 2015 | |||||||||||
Assets, end of year | |||||||||||||
Post Consumer Brands | $ | 3,611.9 | $ | 3,558.2 | $ | 3,642.3 | |||||||
Michael Foods Group | 3,572.2 | 3,498.1 | 3,506.0 | ||||||||||
Active Nutrition | 581.3 | 624.8 | 645.4 | ||||||||||
Private Brands | 487.3 | 484.7 | 482.3 | ||||||||||
Weetabix | 2,048.9 | — | — | ||||||||||
Corporate | 1,575.2 | 1,194.8 | 887.9 | ||||||||||
Total | $ | 11,876.8 | $ | 9,360.6 | $ | 9,163.9 | |||||||
87
NOTE 22 — SUMMARY QUARTERLY FINANCIAL INFORMATION (UNAUDITED)
First | Second | Third | Fourth | ||||||||||||
Quarter | Quarter | Quarter | Quarter | ||||||||||||
Fiscal 2017 | |||||||||||||||
Net sales | $ | 1,249.8 | $ | 1,255.4 | $ | 1,272.1 | $ | 1,448.5 | |||||||
Gross profit | 379.2 | 364.1 | 393.7 | 437.1 | |||||||||||
Impairment of goodwill and other intangible assets | — | — | — | 26.5 | |||||||||||
Net earnings (loss) | 97.6 | (4.0 | ) | (59.5 | ) | 14.2 | |||||||||
Net earnings (loss) available to common shareholders | 94.2 | (7.4 | ) | (62.9 | ) | 10.9 | |||||||||
Basic earnings (loss) per share | $ | 1.36 | $ | (0.11 | ) | $ | (0.93 | ) | $ | 0.16 | |||||
Diluted earnings (loss) per share | $ | 1.22 | $ | (0.11 | ) | $ | (0.93 | ) | $ | 0.16 | |||||
Fiscal 2016 | |||||||||||||||
Net sales | $ | 1,248.8 | $ | 1,271.1 | $ | 1,246.1 | $ | 1,260.8 | |||||||
Gross profit | 362.5 | 409.3 | 398.2 | 377.4 | |||||||||||
Net earnings (loss) | 25.5 | 4.9 | 3.3 | (37.0 | ) | ||||||||||
Net earnings (loss) available to common shareholders | 10.5 | 1.5 | — | (40.4 | ) | ||||||||||
Basic earnings (loss) per share | $ | 0.16 | $ | 0.02 | $ | — | $ | (0.58 | ) | ||||||
Diluted earnings (loss) per share | $ | 0.15 | $ | 0.02 | $ | — | $ | (0.58 | ) | ||||||
NOTE 23 — SUBSEQUENT EVENTS
On September 19, 2017, the Company announced that it had entered into a definitive agreement to acquire Bob Evans Farms, Inc. (“Bob Evans”), a producer of retail refrigerated potato, pasta and vegetable-based side dishes, pork sausage, and a variety of refrigerated and frozen convenience food items for $77.00 per share. Bob Evans also has a foodservice business which sells a range of products, including sausage, sausage gravy, breakfast sandwiches and side dishes. The acquisition is expected to close in Post’s second quarter of fiscal 2018.
ITEM 9. | CHANGES IN AND DISAGREEMENTS WITH ACCOUNTANTS ON ACCOUNTING AND FINANCIAL DISCLOSURE |
Not applicable.
ITEM 9A. CONTROLS AND PROCEDURES
Evaluation of Disclosure Controls and Procedures
Our management, with the Chief Executive Officer (“CEO”) and Chief Financial Officer (“CFO”) of the Company, has evaluated the effectiveness of our disclosure controls and procedures (as defined in Rules 13a-15(e) and 15d-15(e) under the Exchange Act) as of the end of the period covered by this report. Based on that evaluation, our CEO and CFO concluded that, as of the end of the period covered by this report, the Company's disclosure controls and procedures were effective to provide reasonable assurance of achieving the desired control objectives.
Management's Report on Internal Control Over Financial Reporting
Our management is responsible for establishing and maintaining adequate internal control over financial reporting as such term is defined in Rules 13a-15(f) and 15d-15(f) under the Exchange Act. Our internal control over financial reporting is designed to provide reasonable assurance regarding the reliability of financial reporting and the preparation of financial statements for external purposes in accordance with generally accepted accounting principles.
In fiscal 2017, we completed the acquisition of Latimer Newco 2 Limited (“Latimer”) and all of Latimer’s direct and indirect subsidiaries at the time of acquisition, including Weetabix Limited (collectively the “Weetabix Group”). We have excluded the Weetabix Group, which was a purchase business combination, from our assessment of the effectiveness of internal control over financial reporting. Total assets excluding goodwill and intangible assets (which is included in control testing) for the Weetabix Group represent $596.0 million, or 5%, of consolidated assets. Total third party revenues for the Weetabix Group represent $140.5 million, or 3%, of consolidated revenues.
88
As of September 30, 2017, management conducted an assessment of the effectiveness of the Company’s internal control over financial reporting based upon the criteria set forth by the Committee of Sponsoring Organizations of the Treadway Commission (COSO) in Internal Control - Integrated Framework (2013). Management’s assessment included an evaluation of the design of the Company’s internal control over financial reporting and testing of the operational effectiveness of its internal control over financial reporting. Based on management's assessment utilizing these criteria, our management concluded that, as of September 30, 2017, our internal control over financial reporting was effective.
The effectiveness of our internal control over financial reporting as of September 30, 2017 has been audited by PricewaterhouseCoopers LLP, an independent registered public accounting firm, as stated in its report, which appears herein.
Changes in Internal Control Over Financial Reporting
We evaluated the changes in our internal control over financial reporting that occurred during the quarter ended September 30, 2017 and concluded the following activity has materially affected, or is reasonably likely to materially affect, our internal control over financial reporting.
In connection with our fiscal 2017 acquisition of the Weetabix Group, management is in the process of analyzing, evaluating and, where necessary, implementing changes in controls and procedures. As a result, the process may result in additions or changes to the Company's internal control over financial reporting. The Weetabix Group is excluded from management's report on internal control over financial reporting as of September 30, 2017.
ITEM 9B. OTHER INFORMATION
Not applicable.
89
PART III
ITEM 10. DIRECTORS, EXECUTIVE OFFICERS AND CORPORATE GOVERNANCE
The information regarding directors under the headings “Election of Directors – Information about the Current Directors and Nominees for Election to the Board of Directors,” “Corporate Governance – Board Meetings and Committees,” “Corporate Governance – Nomination Process for Election of Directors,” and “Security Ownership of Certain Shareholders – Section 16(a) Beneficial Ownership Reporting Compliance” in the Company’s 2018 Notice of Annual Meeting and Proxy Statement is hereby incorporated by reference. Information regarding Executive Officers of the Company is included under Item 1 of Part I.
The Company has adopted a code of ethics, our “Code of Conduct for Officers and Employees,” applicable to all corporate officers and employees, which sets forth the Company’s expectations for the conduct of business by officers and employees. The directors have adopted, and are required to abide by, the Board of Directors Code of Ethics. Both documents are available on the Company’s website at www.postholdings.com. In the event the Company modifies either document or waivers of compliance are granted to officers or directors, the Company will post such modifications or waivers on its website or in a report on Form 8-K.
ITEM 11. EXECUTIVE COMPENSATION
Information appearing under the headings “Compensation of Officers and Directors,” “Compensation Committee Interlocks and Insider Participation” and “Corporate Governance and Compensation Committee Report” in the Company’s 2018 Notice of Annual Meeting and Proxy Statement is hereby incorporated by reference.
ITEM 12. | SECURITY OWNERSHIP OF CERTAIN BENEFICIAL OWNERS AND MANAGEMENT AND RELATED SHAREHOLDER MATTERS |
The discussion of the security ownership of certain beneficial owners and management appearing under the headings “Security Ownership of Certain Shareholders” and equity compensation plan information under the heading “Compensation of Officers and Directors – Equity Compensation Plan Information” in the Company’s 2018 Notice of Annual Meeting and Proxy Statement is hereby incorporated by reference.
ITEM 13. CERTAIN RELATIONSHIPS AND RELATED TRANSACTIONS, AND DIRECTOR INDEPENDENCE
Information appearing under the headings “Certain Relationships and Related Transactions” and “Corporate Governance – Director Independence and Role of the Independent Lead Director” of the Company’s 2018 Notice of Annual Meeting and Proxy Statement is hereby incorporated by reference.
ITEM 14. PRINCIPAL ACCOUNTANT FEES AND SERVICES
The information under the heading “Ratification of Appointment of Independent Registered Public Accounting Firm” in the Company’s 2018 Notice of Annual Meeting and Proxy Statement is hereby incorporated by reference.
PART IV
ITEM 15. EXHIBITS AND FINANCIAL STATEMENT SCHEDULES
Documents filed as a part of this report:
1. | Financial Statements. The following are filed as a part of this document under Item 8. |
• | Report of Independent Registered Public Accounting Firm |
• | Consolidated Statements of Operations for the years ended September 30, 2017, 2016 and 2015 |
• | Consolidated Statements of Comprehensive Income (Loss) for the years ended September 30, 2017, 2016 and 2015 |
• | Consolidated Balance Sheets at September 30, 2017 and 2016 |
• | Consolidated Statements of Cash Flows for the years ended September 30, 2017, 2016 and 2015 |
• | Consolidated Statements of Shareholders’ Equity for the years ended September 30, 2017, 2016 and 2015 |
• | Notes to Consolidated Financial Statements |
2. | Financial Statement Schedules. None. Schedules not included have been omitted because they are not applicable or the required information is shown in the financial statements or notes thereto. |
3. | Exhibits. See the Exhibit Index that appears at the end of this document and which is incorporated herein. |
90
SIGNATURES
Pursuant to the requirements of Section 13 or 15(d) of the Securities Exchange Act of 1934, as amended, Post Holdings, Inc. has duly caused this report to be signed on its behalf by the undersigned, thereunto duly authorized.
POST HOLDINGS, INC. | ||||
By: | /s/ Robert V. Vitale | |||
Robert V. Vitale | ||||
President and Chief Executive Officer | ||||
November 17, 2017
KNOW ALL PERSONS BY THESE PRESENTS, that each person whose signature appears below constitutes and appoints Jeff A. Zadoks and Diedre J. Gray, and each of them, his or her true and lawful attorney-in-fact and agent, with full power of substitution and resolution, for him or her and in his or her name, place, and stead, in any and all capacities, to sign any and all amendments to this report, and to file the same, with all exhibits thereto, and other documents in connection therewith, with the Securities and Exchange Commission, granting unto said attorneys-in-fact and agents full power and authority to do and perform each and every act and thing requisite and necessary to be done in and about the premises, as fully and to all intents and purposes as he or she might or could do in person, hereby ratifying and confirming all that said attorneys-in-fact and agents or their substitute or substitutes may lawfully do or cause to be done by virtue hereof.
Pursuant to the requirements of the Securities Exchange Act of 1934, as amended, this report has been signed below by the following persons on behalf of the registrant and in the capacities and on the dates indicated.
Signature | Title | Date | ||
/s/ Robert V. Vitale | Director, President and Chief Executive Officer (principal executive officer) | November 17, 2017 | ||
Robert V. Vitale | ||||
/s/ Jeff A. Zadoks | Executive Vice President and Chief Financial Officer (principal financial and accounting officer) | November 17, 2017 | ||
Jeff A. Zadoks | ||||
/s/ William P. Stiritz | Chairman of the Board | November 17, 2017 | ||
William P. Stiritz | ||||
/s/ Jay W. Brown | Director | November 17, 2017 | ||
Jay W. Brown | ||||
/s/ Edwin H. Callison | Director | November 17, 2017 | ||
Edwin H. Callison | ||||
/s/ Gregory L. Curl | Director | November 17, 2017 | ||
Gregory L. Curl | ||||
/s/ Robert E. Grote | Director | November 17, 2017 | ||
Robert E. Grote | ||||
/s/ Ellen F. Harshman | Director | November 17, 2017 | ||
Ellen F. Harshman | ||||
/s/ David W. Kemper | Director | November 17, 2017 | ||
David W. Kemper | ||||
/s/ David P. Skarie | Director | November 17, 2017 | ||
David P. Skarie | ||||
91
EXHIBIT INDEX
Exhibit No. | Description | |
*‡2.1 | ||
*‡2.2 | ||
*‡2.3 | ||
*‡2.4 | ||
*‡2.5 | ||
*3.1 | ||
*3.2 | ||
*4.1 | ||
*4.2 | ||
*4.3 | ||
*4.4 | ||
*4.5 | ||
*4.6 | ||
*4.7 | ||
*†10.1 | ||
*†10.2 | ||
*†10.3 | ||
*†10.4 | ||
*†10.5 | ||
*†10.6 | ||
92
Exhibit No. | Description | |
*†10.7 | ||
*†10.8 | ||
*†10.9 | ||
*†10.10 | ||
*†10.11 | ||
*10.12 | ||
*†10.13 | ||
*†10.14 | ||
*†10.15 | ||
*10.16 | ||
*†10.17 | ||
*†10.18 | ||
*10.19 | ||
*10.20 | ||
*†10.21 | ||
*†10.22 | ||
*†10.23 | ||
*†10.24 | ||
*†10.25 | ||
*†10.26 | ||
*†10.27 | ||
*†10.28 | ||
93
Exhibit No. | Description | |
*†10.29 | ||
*†10.30 | ||
*†10.31 | ||
*†10.32 | ||
*†10.33 | ||
*†10.34 | ||
*†10.35 | ||
*†10.36 | ||
*10.37 | ||
*10.38 | ||
*10.39 | ||
*10.40 | ||
*†10.41 | ||
*†10.42 | ||
*†10.43 | ||
*†10.44 | ||
**21.1 | ||
**23.1 | ||
**24.1 | ||
**31.1 | ||
**31.2 | ||
94
Exhibit No. | Description | |
**32.1 | ||
**101.INS | XBRL Instance Document | |
**101.SCH | XBRL Taxonomy Extension Schema Document | |
**101.CAL | XBRL Taxonomy Extension Calculation Linkbase Document | |
**101.DEF | XBRL Taxonomy Extension Definition Linkbase Document | |
**101.LAB | XBRL Taxonomy Extension Label Linkbase Document | |
**101.PRE | XBRL Taxonomy Extension Presentation Linkbase Document | |
* | Incorporated by reference |
** | Furnished with this Form 10-K |
† | These exhibits constitute management contracts, compensatory plans and arrangements. |
‡ | Schedules and exhibits have been omitted pursuant to Item 601(b)(2) of Regulation S-K. The Company hereby undertakes to furnish copies of any of the omitted schedules and exhibits upon request by the U.S. Securities and Exchange Commission. |
95