Attached files
| file | filename |
|---|---|
| 8-K - 8-K - Manitex International, Inc. | d491940d8k.htm |
| Exhibit 99.1
|
MANITEX INTERNATIONAL, INC.
(NASDAQ: MNTX)
Corporate
Presentation November 2017
|
FORWARD-LOOKING STATEMENT
& NON-GAAP MEASURES
Safe Harbor Statement under
the U.S. Private Securities Litigation Reform Act of 1995: This presentation contains statements that are forward-looking in nature which express the beliefs and expectations of management including statements regarding the Company’s expected
results of operations or liquidity; statements concerning projections, predictions, expectations, estimates or forecasts as to our business, financial and operational results and future economic performance; and statements of management’s goals
and objectives and other similar expressions concerning matters that are not historical facts. In some cases, you can identify forward-looking statements by terminology such as “anticipate,” “estimate,” “plan,”
“project,” “continuing,” “ongoing,” “expect,” “we believe,” “we intend,” “may,” “will,” “should,” “could,” and similar expressions. Such statements
are based on current plans, estimates and expectations and involve a number of known and unknown risks, uncertainties and other factors that could cause the Company’s future results, performance or achievements to differ significantly from the
results, performance or achievements expressed or implied by such forward-looking statements. These factors and additional information are discussed in the Company’s filings with the Securities and Exchange Commission and statements in this
presentation should be evaluated in light of these important factors. Although we believe that these statements are based upon reasonable assumptions, we cannot guarantee future results. Forward-looking statements speak only as of the date on which
they are made, and the Company undertakes no obligation to update publicly or revise any forward-looking statement, whether as a result of new information, future developments or otherwise.
Non-GAAP Measures: Manitex International from time to time refers to various non-GAAP (generally
accepted accounting principles) financial measures in this presentation. Manitex believes that this information is useful to understanding its operating results without the impact of special items. See Manitex’sQ2 2017 earnings release on the
Investor Relations section of our website www.Manitex International.com for a description and/or reconciliation of these measures.
NASDAQ : MNTX 2
|
Why We are Here Today-Investment Considerations
IMPROVING OUTLOOK for 2017 as recovery begins to accelerate:
Announced
backlog of $50.3 million (9/30/17), growth of 60.8% over 12/31/16; 6% higher, sequentially Production is expected to steadily increase along with revenues, margins, and EBITDA throughout the year and into next
DELEVERAGING strategy includes divestitures and portfolio adjustments
Steady increase in
MARKET SHARE in straight-mast cranes last 5 years; potential to take market share for knuckle boom cranes via PM
Over first 3 quarters of 2017 industry orders are
up 60% year to date Orders in third quarter were up 105% vs same quarter a year ago
During third quarter, Manitex share grew 10 percentage points vs. same quarter
last year Year to date market share inceased4 percentage points vs. last year
Last cyclical peak for PM and Manitex was OVER $350M in net sales and approximately
$45 million in EBITDA; potential EARNINGS POWER now exceeds prior peak level; product mix has changed the margin profile away from low-margin materials handling businesses to primarily crane businesses
NASDAQ : MNTX 3
|
Recent Headlines- New Orders, Dealer Additions, New
Products
October 30, 2017, Manitex International Welcomes Tampa Crane & Body as Knuckle Boom Distributor in Florida October 18, 2017, Manitex
International, Inc. Expands North American Product Line with A62, trolley boom loader, and other new products ($20M in incremental 2018 sales potential) October 4, 2017, Manitex International, Inc. Announces $12 Million New Crane Order Taken at
ICUEE 2017 October 2, 2017, Manitex International Welcomes Western Pacific Crane & Equipment to PM Knuckle boom Dealer Network September 18, 2017, Manitex International Welcomes Walter Payton Power Equipment to Knuckle boom Dealer
Network July 20, 2017, Manitex International, Inc. Announces €1.5 Million in New Orders for PM Truck-Mounted Knuckle boom Cranes
NASDAQ : MNTX 4
|
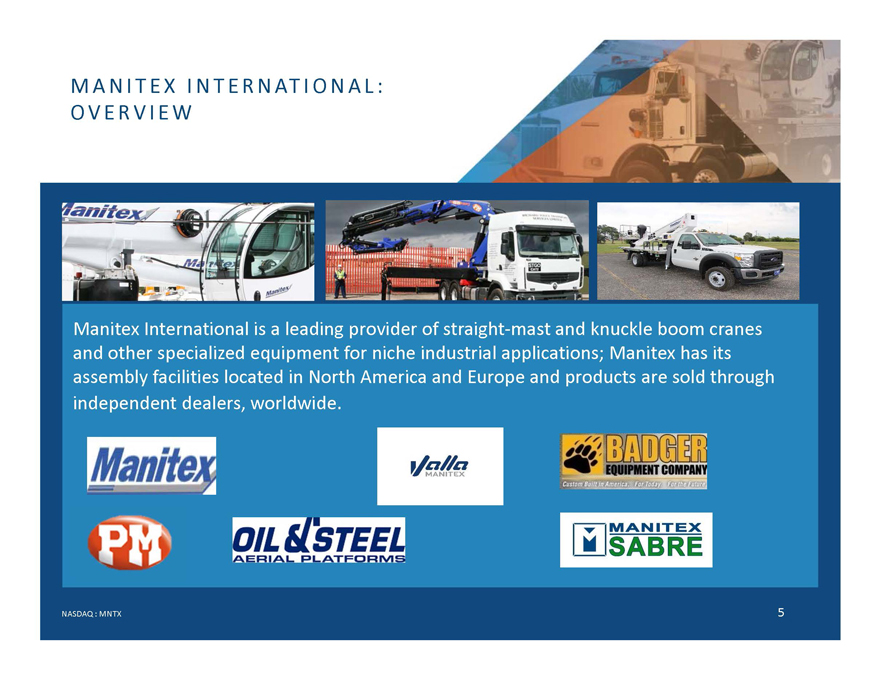
MANITEX INTERNATIONAL: OVERVIEW
Manitex International is a leading provider of straight-mast and knuckle boom cranes and other specialized equipment for niche industrial applications; Manitex has its assembly
facilities located in North America and Europe and products are sold through independent dealers, worldwide.
NASDAQ : MNTX 5
|
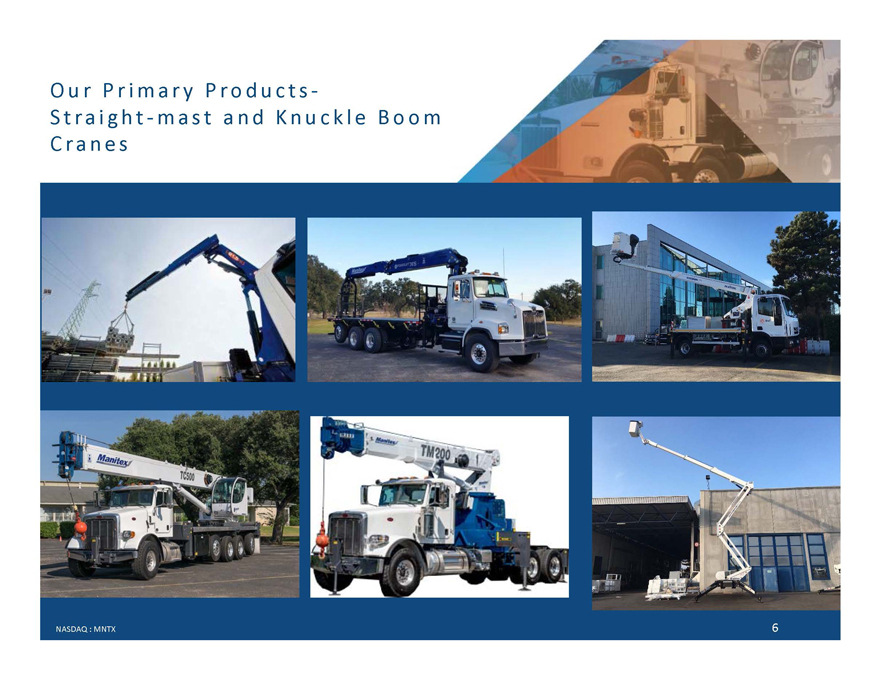
Our Primary Products-Straight-mast and Knuckle Boom
Cranes
NASDAQ : MNTX 6
|
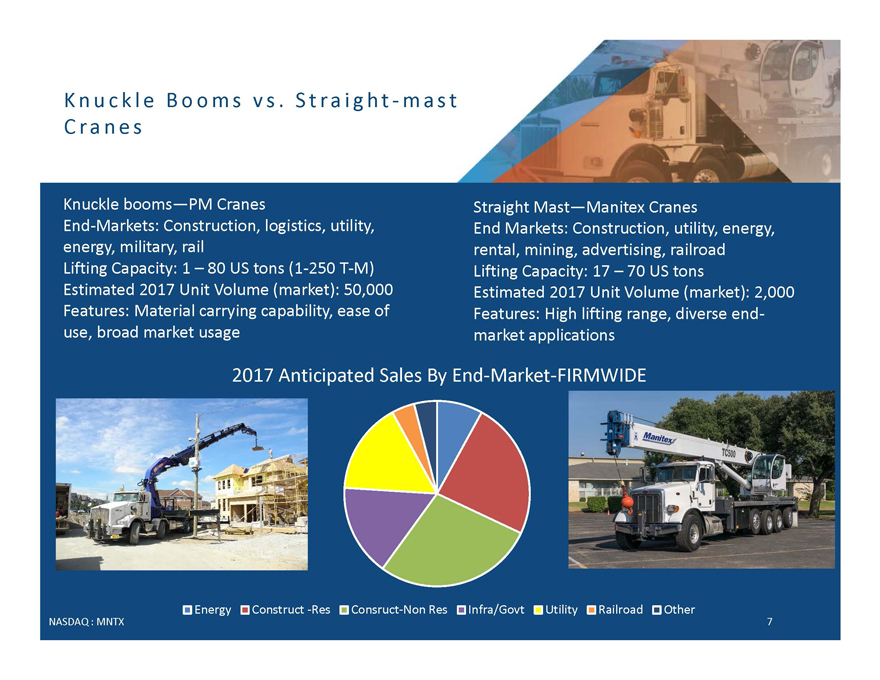
Knuckle Booms vs. Straight-mast Cranes
Knuckle booms—PM Cranes Straight Mast—ManitexCranes End-Markets: Construction, logistics, utility, End Markets: Construction,
utility, energy, energy, military, rail rental, mining, advertising, railroad Lifting Capacity: 1 –80 US tons (1-250 T-M) Lifting Capacity: 17 –70 US tons
Estimated 2017 Unit Volume (market): 50,000 Estimated 2017 Unit Volume (market): 2,000 Features: Material carrying capability, ease of Features: High lifting range, diverse end-use, broad market usage market
applications
2017 Anticipated Sales By End-Market-FIRMWIDE
Energy Construct -Res Consruct-Non Res Infra/Govt Utility Railroad Other
NASDAQ : MNTX 7
|
Sales Increase and Margin Expansion in 2017 and
Beyond
Sales:
Crane backlog growth should add gradually to Manitex
International sales throughout 2017
Peak level for remaining businesses* was > $350M (and EBITDA of approx. $45M)
Run rate sales for remaining businesses* of just over $200M
* Remaining businesses = Manitex,
C&M, Badger, Sabre, and Valla; and PM and O&S
Margin Profile Improves in 2017 from non-crane divestitures with
<4% EBITDA margin:
Sales reduction $90M
EBITDA reduction $4M
Over $15 million in cost reductions achieved through sourcing and operating efficiency initiatives 2015-2017
10%-Plus EBITDA margin goal with continued crane market recovery and execution
NASDAQ : MNTX 8
|
LIFTING EQUIPMENT MARKET
OVERVIEW – STRAIGHT MAST
Straight Mast
IndustryManitexMarket Share by
ShipmentsTonnage Class
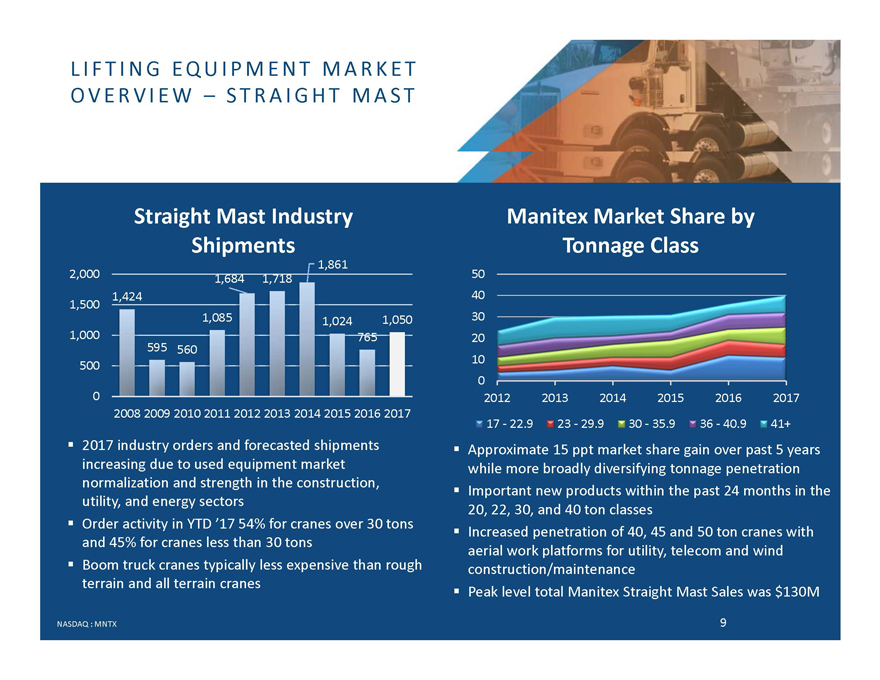
1,861
2,000 1,684 1,71850
1,424 40
1,500
1,0851,024 1,05030
1,000 76520
595 560
500 10
0
0 2012 2013 2014 2015 2016 2017
2008200920102011201220132014201520162017
17—22.9 23—29.9
30—35.9 36—40.9 41+
2017 industry orders and forecasted shipments Approximate 15 pptmarket share gain over past 5 years
increasing due to used equipment market while more broadly diversifying tonnage penetration
normalization and strength in the construction, Important new products within the past 24 months in the
utility, and energy sectors 20, 22, 30, and 40 ton classes
Order
activity in YTD ’17 54% for cranes over 30 tons Increased penetration of 40, 45 and 50 ton cranes with
and 45% for cranes less than 30
tons aerial work platforms for utility, telecom and wind
Boom truck cranes typically less expensive than rough construction/maintenance
terrain and all terrain cranes Peak level total Manitex Straight Mast Sales was $130M
NASDAQ : MNTX 9
|
THE KNUCKLE BOOM MARKET
$2.3 Billion Globally
(Management
Estimates)
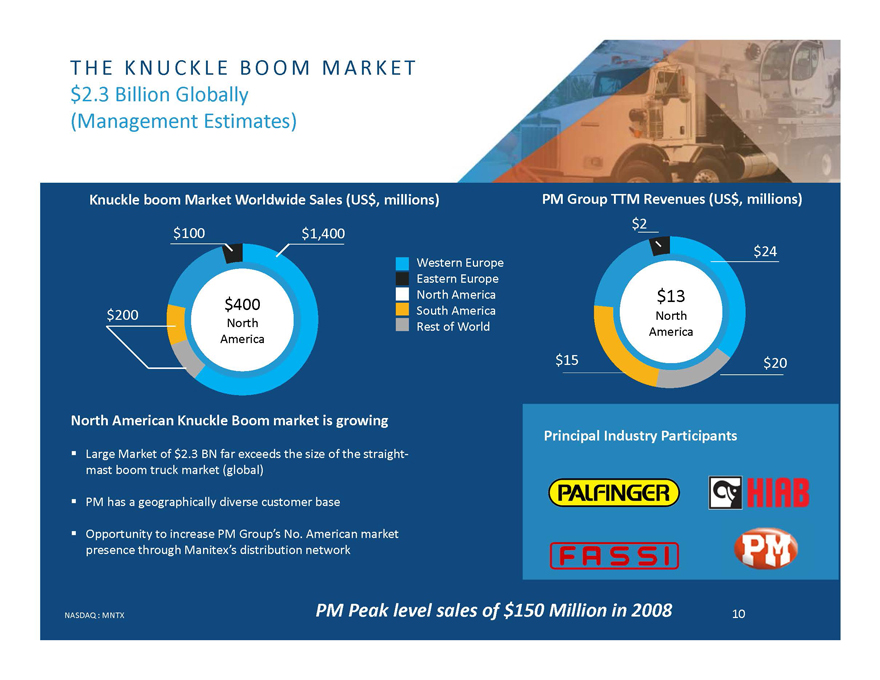
Knuckle boom Market Worldwide Sales (US$, millions) PM Group TTM Revenues (US$, millions)
$2
$100 $1,400
$24
Western Europe
Eastern Europe
$400 North America $13
$200 South America North
North Rest of World
America America
$15$20
North American Knuckle Boom market is growing
Principal Industry
Participants
Large Market of $2.3 BN far exceeds the size of the straight-
mast boom truck market (global)
PM has a
geographically diverse customer base
Opportunity to increase PM Group’s No. American market
presence through Manitex’sdistribution network
NASDAQ :
MNTX PM Peak level sales of $150 Million in 2008 10
|
REPLACEMENTS PARTS&SERVICE
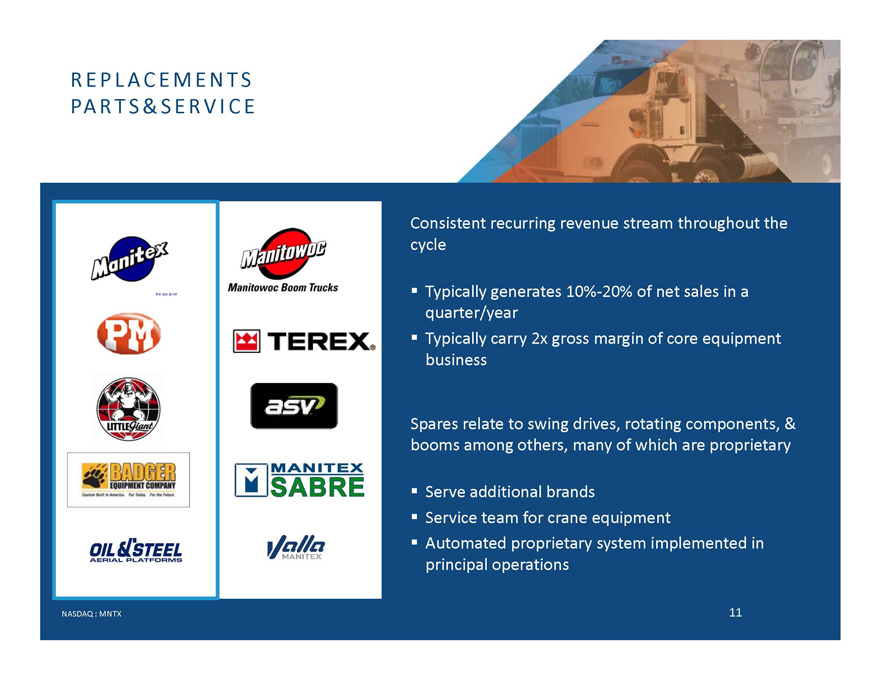
Consistent recurring revenue stream throughout the cycle
Typically generates 10%-20% of net sales in a quarter/year Typically carry 2x gross margin of core equipment business
Spares relate to swing drives,
rotating components, & booms among others, many of which are proprietary
Serve additional brands Service team for crane equipment Automated proprietary system
implemented in principal operations
NASDAQ : MNTX 11
|
OPERATING COMPANIES
Products, End Market, Drivers
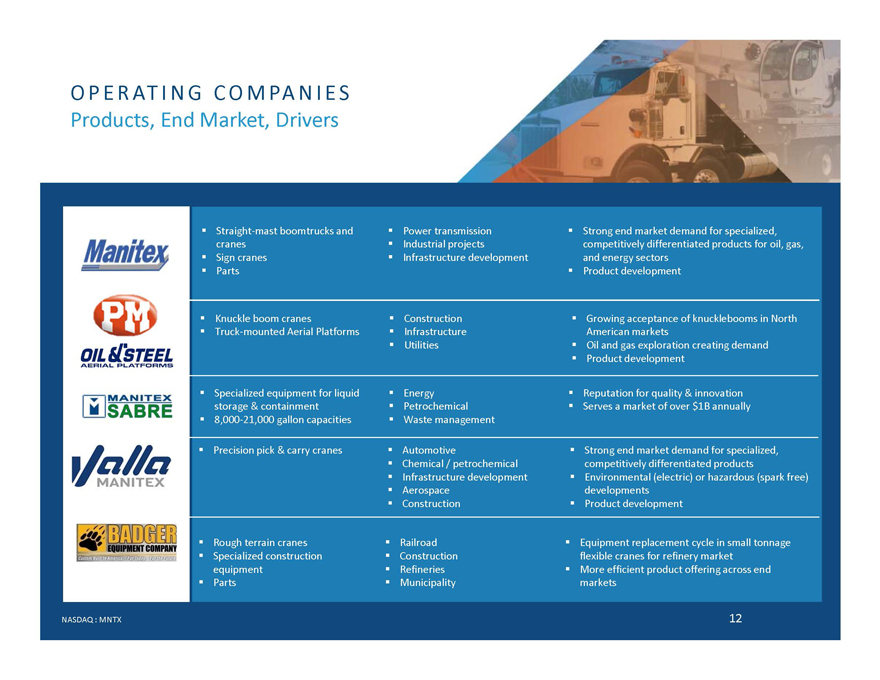
Straight-mast
boomtrucksand Power transmission Strong end market demand for specialized,
cranes Industrial projectscompetitively differentiated products
for oil, gas,
Sign cranes Infrastructure developmentand energy sectors
Parts Product development
Knuckle boom cranes
Construction Growing acceptance of knuckleboomsin North
Truck-mounted Aerial Platforms Infrastructure American markets
Utilities Oil and gas exploration creating demand
Product development
Specialized equipment for liquid Energy Reputation for quality & innovation
storage & containment Petrochemical Serves a market of over $1B annually
8,000-21,000 gallon capacities Waste management
Precision pick & carry cranes Automotive Strong end market demand for specialized,
Chemical / petrochemicalcompetitively differentiated products
Infrastructure development
Environmental (electric) or hazardous (spark free)
Aerospacedevelopments
Construction Product development
Rough terrain cranes Railroad Equipment
replacement cycle in small tonnage
Specialized construction Constructionflexible cranes for refinery market
equipment Refineries More efficient product offering across end
Parts Municipalitymarkets
NASDAQ :
MNTX 12
|
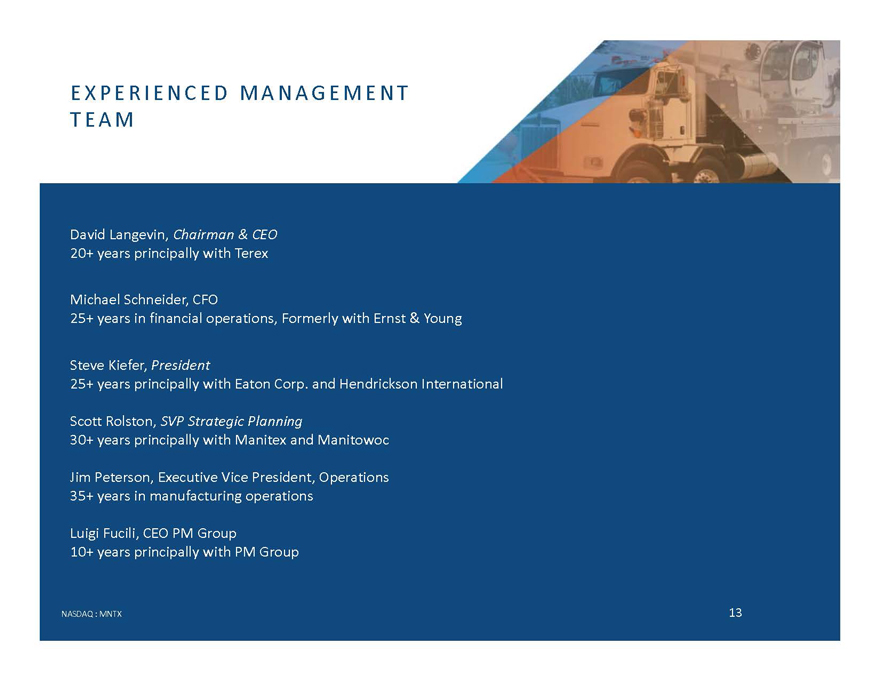
EXPERIENCED MANAGEMENT TEAM
David Langevin, Chairman & CEO 20+ years principally with Terex
Michael Schneider,
CFO
25+ years in financial operations, Formerly with Ernst & Young
Steve Kiefer, President
25+ years principally with Eaton Corp. and
Hendrickson International
Scott Rolston, SVP Strategic Planning
30+ years
principally with Manitex and Manitowoc
Jim Peterson, Executive Vice President, Operations 35+ years in manufacturing operations
Luigi Fucili, CEO PM Group 10+ years principally with PM Group
NASDAQ : MNTX 13
|
MANITEX INTERNATIONAL, INC.
FINANCIAL OVERVIEW
November 2017
|
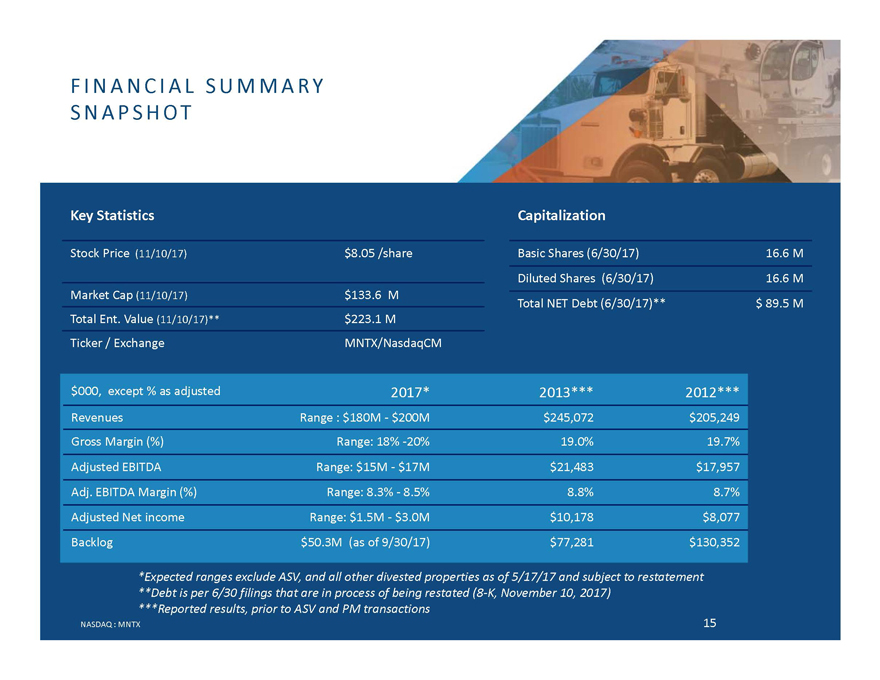
FINANCIAL SUMMARY
SNAPSHOT
Key Statistics
Capitalization
Stock Price (11/10/17) $8.05 /share Basic Shares (6/30/17)16.6 M
Diluted Shares (6/30/17) 16.6 M
Market Cap (11/10/17) $133.6 M
Total NET Debt (6/30/17)** $ 89.5 M
Total Ent. Value
(11/10/17)** $223.1 M
Ticker / Exchange MNTX/NasdaqCM
$000, except % as adjusted 2017* 2013***2012***
Revenues Range : $180M—$200M $245,072$205,249
Gross Margin (%) Range: 18% -20% 19.0%19.7%
Adjusted EBITDA Range: $15M—$17M $21,483$17,957
Adj. EBITDA Margin
(%) Range: 8.3%—8.5% 8.8%8.7%
Adjusted Net income Range: $1.5M—$3.0M $10,178$8,077
Backlog $50.3M (as of 9/30/17) $77,281$130,352
*Expected ranges exclude
ASV, and all other divested properties as of 5/17/17 and subject to restatement
**Debt is per 6/30 filings that are in process of being
restated (8-K, November 10, 2017)
***Reported results, prior to ASV and PM
transactions
NASDAQ : MNTX 15
|
MANITEX INTERNATIONAL, INC.
(NASDAQ: MNTX) November 2017
David Langevin,CEO 708-237-2060 dlangevin@manitex.com
Peter Seltzberg, IR Darrow Associates, Inc.
516-419-9915 pseltzberg@darrowir.com