Attached files
| file | filename |
|---|---|
| 8-K - 8-K - ZAGG Inc | a8k-november132017.htm |

0
Investor Presentation
November 2017

1
Safe harbor statement
Forward-Looking Statements
Statements in this presentation relating to ZAGG Inc’s (“ZAGG”) future plans, expectations, beliefs, intentions and prospects are “forward-looking statements” and are subject to material risks and
uncertainties. Many factors could affect our current expectations and our actual results could differ materially from those expectations. We presently consider the following to be among the important
factors that could cause actual results to differ materially from expectations: (a) the ability to design, produce, and distribute the creative product solutions required to retain existing customers and to
attract new customers; (b) building and maintaining marketing and distribution functions sufficient to gain meaningful international market share for ZAGG's products; (c) the ability to respond quickly
with appropriate products after the adoption and introduction of new mobile devices by major manufacturers like Apple, Samsung, and Google; (d) changes or delays in announced launch schedules
for (or recalls or withdrawals of) new mobile devices by major manufacturers like Apple, Samsung, and Google; (e) the ability to successfully integrate new operations or acquisitions, specifically including
mophie inc., (f) the impact of inconsistent quality or reliability of new product offerings; (g) the impact of lower profit margins in certain new and existing product categories, including certain mophie
products; (h) the impacts of changes in economic conditions, including on customer demand; (i) managing inventory in light of constantly shifting consumer demand; (j) the failure of information systems
or technology solutions or the failure to secure information system data, failure to comply with privacy laws, security breaches, or the effect on the company from cyber-attacks, terrorist incidents, or the
threat of terrorist incidents; and (k) adoption of or changes in accounting policies, principles, or estimates. A detailed discussion of these factors and other risks that affect our business is contained in our
filings with the Securities and Exchange Commission, including our most recent reports on Form 10-K and Form 10-Q, particularly under the heading “Risk Factors.” Any forward-looking statement speaks
only as of the date on which such statement is made. New factors emerge from time to time and it is not possible for management to predict all such factors, nor can it assess the impact of any such
factor on the business or the extent to which any factor, or combination of factors, may cause results to differ materially from those contained in any forward-looking statement. All information set forth in
this presentation is current as of November 13, 2017. ZAGG undertakes no duty to update any statement in light of new information or future events.
This presentation also contains estimates and other statistical data made by independent parties and by ZAGG relating to market share, growth and other industry data. This data involves a number of
assumptions and limitations, and you are cautioned not to give undue weight to such estimates. We have not independently verified the statistical and other industry data generated by independent
parties and contained in this presentation and, accordingly, cannot guarantee their accuracy or completeness. In addition, projections, assumptions and estimates of our future performance and the
future performance of the markets in which we compete are necessarily subject to a high degree of uncertainty and risk due to a variety of factors. These and other factors could cause results or
outcomes to differ materially from those expressed in the estimates made by the independent parties and by ZAGG.
Non-GAAP Financial Measures
This presentation also includes certain non-GAAP financial measures. These non-GAAP financial measures are not meant to be considered in isolation or as a substitute for comparable GAAP measures,
and should be read only in conjunction with our consolidated financial statements prepared in accordance with GAAP. There are a number of limitations related to the use of these non-GAAP financial
measures versus their nearest GAAP equivalents. We have provided a reconciliation of those measures to the most directly comparable GAAP measures, which is available in the appendix.
The Company is unable to provide guidance for net income (loss), and reconciliation of Adjusted EBITDA to net income (loss), as the closest corresponding U.S. GAAP measure is not available without
unreasonable efforts on a forward-looking basis due to the variability and complexity with respect to charges excluded from this non-GAAP measure. In particular, these complexities include the
measures and effects of stock based compensation expense that are directly impacted by unpredictable fluctuations in our share price, and our tax expense that is directly impacted by our taxable
income. We expect the variability of these charges could have a significant, and potentially unpredictable, impact on our future U.S. GAAP results

2
Corporate objectives & values

3
$-
$100
$200
$300
$400
$500
$600
A history of continuous innovation
Key ZAGG
milestones
Industry
products
released
2013 2016200920082007 2014 20152010 2011 2012 2017E
Key ZAGG
products
introduced
Year
InvisibleShield
was first
released
ZAGG releases
first tablet
keyboard
First iPad
released by
Apple
InvisibleShield
introduced curved
glass solution
iFROGZ wireless
earbuds released
Apple announces
new wireless
charging platform
Screen Protection
Power
Audio
Keyboards, Cases, & Other
First Apple
iPhone is
released
Randy Hales
appointed CEO
Company
reaches
$100mm in
revenue
ZAGG
acquires
iFrogz
ZAGG launches
InvisibleShield On
Demand and
InvisibleShield
Glass
mophie launches
wireless charging
platform
Release of
Samsung
Galaxy S4
ZAGG acquires
mophie
Samsung
announces
Galaxy S8 with
curved glass
display

4
Product portfolio aligns with consumer needs
46%
42%
6% 5%
Power
Audio
Cases
Screen
protection
Tablet
keyboards
1%
2017E
$520MM
net sales
Mobile audio lifestyle
Connectivity
& productivity
Investment protection
Extended power
Handset costs are on the rise
Protecting trade-in device value
Brittleness vs. scratch resistance screens
1.5 billion units sold in 2016
Mobile traffic outpacing desktop traffic
Increasing frequency of working remotely
Tablets being used for more than just consumption –
content creation
Larger screens and thinner devices are gaining popularity
Apps and increased phone usage drain battery at an
alarming rate
“Our One Wish? Longer Battery Life” – Wall Street Journal
People are consuming increasing amounts of content
Wireless options allow for more flexibility
Mobile music listening has driven weekly headphone
usage from an average 3 hours in 1980 to over 20 hours
in 2016
5
Global leadership in mobile lifestyle
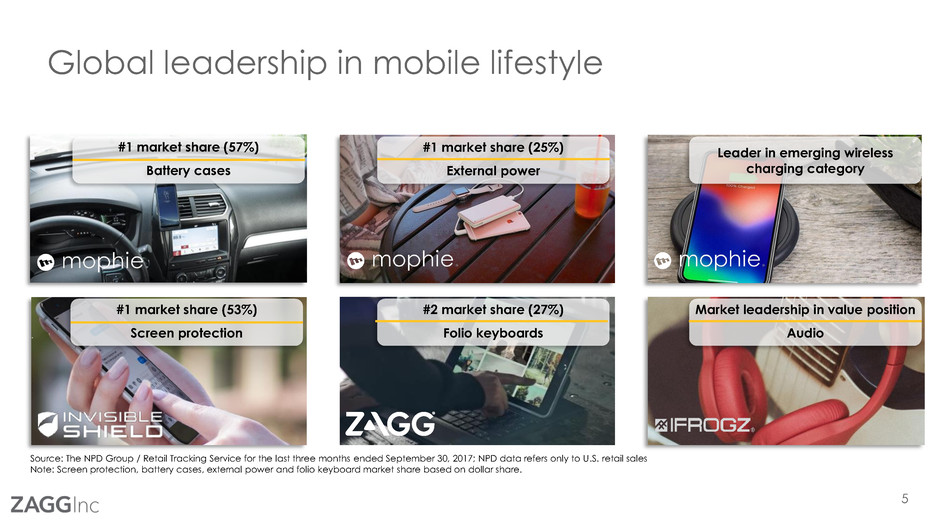
#1 market share (53%)
Screen protection
#1 market share (57%)
Battery cases
#2 market share (27%)
Folio keyboards
Source: The NPD Group / Retail Tracking Service for the last three months ended September 30, 2017; NPD data refers only to U.S. retail sales
Note: Screen protection, battery cases, external power and folio keyboard market share based on dollar share.
Leader in emerging wireless
charging category
Market leadership in value position
Audio
#1 market share (25%)
External power
6
Our brands empower mobile lifestyles
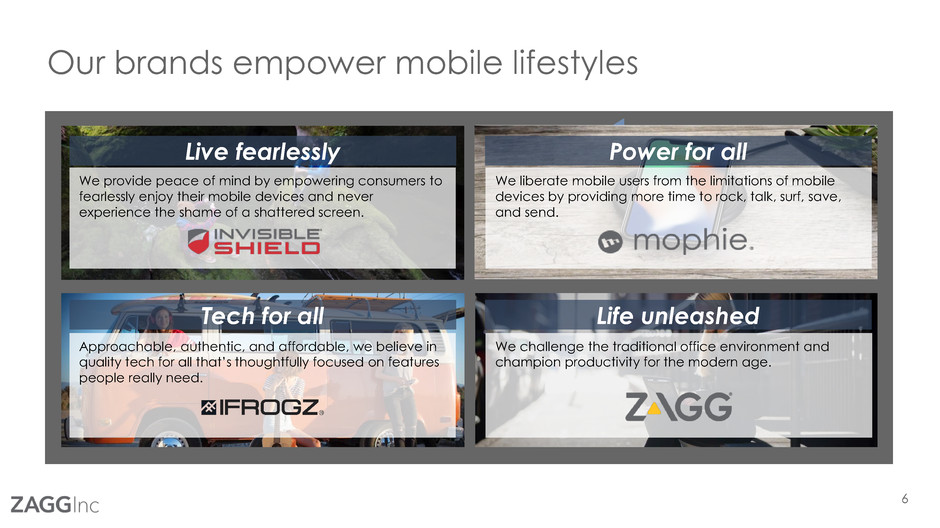
We challenge the traditional office environment and
champion productivity for the modern age.
We liberate mobile users from the limitations of mobile
devices by providing more time to rock, talk, surf, save,
and send.
Approachable, authentic, and affordable, we believe in
quality tech for all that’s thoughtfully focused on features
people really need.
Power for allLive fearlessly
We provide peace of mind by empowering consumers to
fearlessly enjoy their mobile devices and never
experience the shame of a shattered screen.
Tech for all Life unleashed

7
Preferred partner across channels
Wireless
carriers
45%
Major retail 42%
E-
commerce
9%
Strategic
retail
4%
Category management expertise
Speed to market
Operational execution
Strong retail sell-through
High margin categories
World class customer service
Deep strategic partnerships✓
✓
✓
✓
✓
Channel Select customers % of sales1
ZAGG International
customers
✓
✓
= ~12% of sales1
1 % of sales figures from expected 2017 year-end results
Why our partners love us
8
Continue global distribution expansion
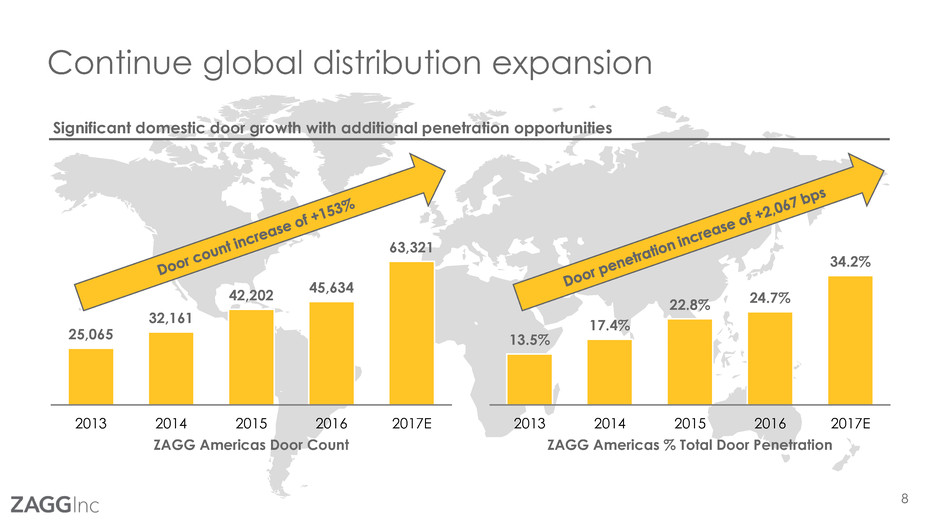
Significant domestic door growth with additional penetration opportunities
25,065
32,161
42,202
45,634
63,321
2013 2014 2015 2016 2017E
ZAGG Americas Door Count
13.5%
17.4%
22.8% 24.7%
34.2%
2013 2014 2015 2016 2017E
ZAGG Americas % Total Door Penetration
9
Operational excellence
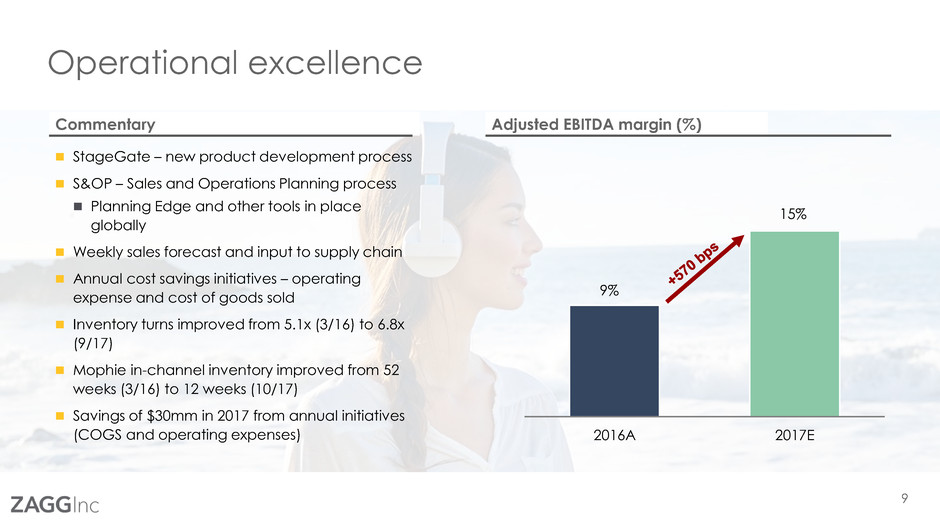
9%
15%
2016A 2017E
Adjusted EBITDA margin (%)
StageGate – new product development process
S&OP – Sales and Operations Planning process
Planning Edge and other tools in place
globally
Weekly sales forecast and input to supply chain
Annual cost savings initiatives – operating
expense and cost of goods sold
Inventory turns improved from 5.1x (3/16) to 6.8x
(9/17)
Mophie in-channel inventory improved from 52
weeks (3/16) to 12 weeks (10/17)
Savings of $30mm in 2017 from annual initiatives
(COGS and operating expenses)
Commentary

10
Strong relationship with key OEMs
During the Apple iPhone 8 / iPhone X unveil, Apple
announced mophie wireless charging collaboration
During the Google Pixel 2 launch event, Google
announced InvisibleShield screen protection collaboration
Close partnerships with key OEMsProducts designed for all the top mobile devices1
1 Logos shown are not inclusive of all brands
✓ Longstanding partnership with
diverse set of key OEMS
✓ Nimble across form factors
✓ Ability to adapt to rapidly
changing technology landscape

11
34%
42%
51%
53%
20%
30%
40%
50%
60%
2014 2015 2016 2017 YTD
Dollar Market Share
Strategy case study: screen protection
InvisibleShield ~19 points of market share gains driven by:
✓ Product innovation and higher ASPs ✓ Expanded distribution at wireless retailers
✓ Increased brand awareness ✓ Desirable, high-margin product for retailers
✓ Increased attach rates with further growth expected as cost of devices increase, changing phone contract dynamics
Source: ZAGG management; The NPD Group, Inc., U.S. Retail Tracking Service, Cell Phone Screen Protection, January 2014 – September 2017, dollars
GG4 11/14 GG5 08/16
Timing of Gorilla Glass launches (originally launched in 2010)
12
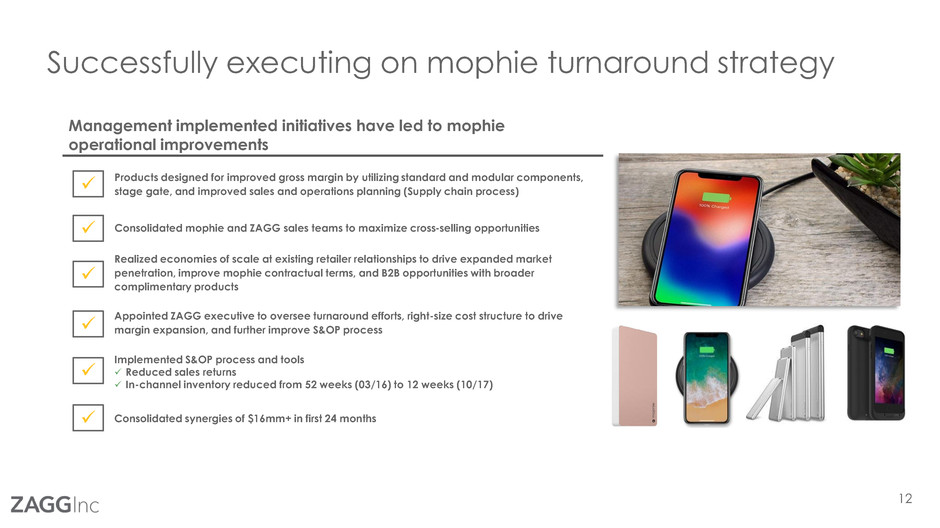
Successfully executing on mophie turnaround strategy
Appointed ZAGG executive to oversee turnaround efforts, right-size cost structure to drive
margin expansion, and further improve S&OP process
✓
Products designed for improved gross margin by utilizing standard and modular components,
stage gate, and improved sales and operations planning (Supply chain process)
Consolidated mophie and ZAGG sales teams to maximize cross-selling opportunities
Realized economies of scale at existing retailer relationships to drive expanded market
penetration, improve mophie contractual terms, and B2B opportunities with broader
complimentary products
Management implemented initiatives have led to mophie
operational improvements
Implemented S&OP process and tools
✓ Reduced sales returns
✓ In-channel inventory reduced from 52 weeks (03/16) to 12 weeks (10/17)
✓
✓
✓
✓
✓
Consolidated synergies of $16mm+ in first 24 months

Financial overview
14
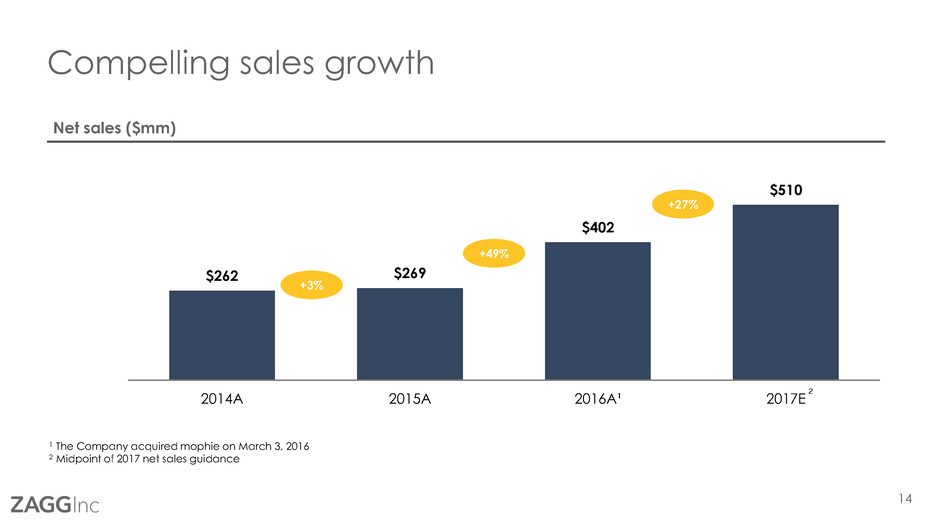
Compelling sales growth
Net sales ($mm)
$262 $269
$402
$510
2014A 2015A 2016A¹ 2017E
+3%
+27%
+49%
1 The Company acquired mophie on March 3, 2016
2 Midpoint of 2017 net sales guidance
2

15
Strong profitability
Adjusted EBITDA1 ($mm)
$32
$42
$37
$77
2014A 2015A 2016A 2017E
EBITDA
margin %
12.3% 15.7% 15.0%9.3%
1 Adjusted EBITDA is defined as earnings before interest, taxes, depreciation, amortization, stock-based compensation expense, other income (expense), mophie transaction costs, mophie fair value
inventory write-up related to acquisition, mophie restructuring charges, mophie employee retention bonus, and the loss on disputed mophie purchase price
2 mophie Adjusted EBITDA of ($16mm); ZAGG Adjusted EBITDA of $53mm
3 Midpoint of 2017 Adjusted EBITDA guidance
+105%
+31% (12%)
2 3

16
Adjusted EBITDA bridge – 2016A-2017E
Bridge to 2017E Adjusted EBITDA ($mm)
$37
$20
$12
$8 $77
2016A Adj. EBITDA Screen protection,
audio and keyboards
Power management Synergies 2017E Adj. EBITDA
Summary of 2017E Adjusted EBITDA adjustments
Screen protection, audio and keyboard category growth
Power management and wireless category expansion, including improved margins
Synergies – cost synergies related to mophie acquisition
1
2
3
2 31

17
Long-term growth
Long-term growth engine
▪ Continued international expansion
▪ Organically grow existing product categories in the
domestic market
▪ Digital channel expansion (zagg.com
mophie.com, and Amazon)
▪ M&A activity in existing or new product categories
Historical acquisition success
$350+1
$300+1
$300+1
Purchase price / acquisition date
Net sales
(cumulative, $mm)
Keyboard IP
acquisition
$2.5mm (2011)
$100mm (2011)
$100mm (2016)
1 Expected cumulative sales for the year-ended December 31, 2017

18
Appendix

19
Non-GAAP reconciliation
Three months ended Nine months ended Year Ended
September 31,
2017
September 31,
2016
September 31,
2017
September 31,
2016
December 31,
2016
Net income in accordance with GAAP $ 9,776 $ (7,105) $ 7,041 $ (11,442) $ (15,587)
Adjustments:
a. Stock based compensation expense 899 1,386 2,535 3,679 3,830
b. Depreciation and amortization 5,486 4,989 16,505 16,484 22,270
c. Other (income) expense 399 656 1,460 1,639 2,199
d. Impairment of intangible asset - - 1,959 - -
e. mophie transaction costs 96 145 611 2,467 2,591
f. mophie fair value of inventory write-up - (739) - 2,586 2,586
g. mophie restructuring charges - 138 437 1,201 2,160
h. mophie employee retention bonus - 300 346 500 841
i. Loss on disputed mophie purchase price - 24,317 - 24,317 24,317
j. Income tax benefit 5,760 (6,261) 6,281 (7,963) (7,972)
Adjusted EBITDA $ 22,416 $ 17,826 $ 37,175 $ 33,468 $ 37,235
20
The NPD Group, Inc. references
References to the market shares information on slide #5 from The NPD Group Retail Tracking Services cited below:
1. The NPD Group Inc., U.S. Retail Tracking Service, Cell Phone Screen Protection, Based on dollar sales, July 2017 – September 2017.
2. The NPD Group Inc., U.S. Retail Tracking Service, Cell Phone Device Protection, Charging Case, Based on dollar sales, July 2017 – September 2017.
3. The NPD Group Inc., U.S. Retail Tracking Service, Mobile Power, Charge Type: Portable Power Packs, Based on dollar sales, July 2017 – September 2017.
4. The NPD Group Inc., U.S. Retail Tracking Service, Tablet and e-readers – Cases, Keyboard Included, Based on dollar sales, July 2017 – September 2017.

21
Investor Presentation
November 2017
