Attached files
| file | filename |
|---|---|
| EX-99.2 - EXHIBIT 99.2 - TrueCar, Inc. | q32017transcriptex992htm.htm |
| EX-99.1 - EXHIBIT 99.1 - TrueCar, Inc. | a201711-06x17ex991.htm |
| 8-K/A - 8-K/A - TrueCar, Inc. | a201711-07x17earningsrelea.htm |

1
November 6th 2017
Third Quarter 2017
Financial Highlights

2
SAFE HARBOR
This presentation contains forward-looking statements. All statements other than statements of historical facts contained in this presentation, including statements
regarding TrueCar, Inc.’s (“TrueCar”) future growth potential and opportunities, outlook for the fourth quarter and full year 2017, planned product offerings, including
research and discovery, digital retailing and the expansion of TrueCar Trade, future financial results, including expectations regarding future revenue and adjusted
EBITDA, business strategy, plans and objectives are forward-looking statements. These forward-looking statements are subject to a number of risks, uncertainties,
and assumptions that may prove incorrect, any of which could cause TrueCar’s results to differ materially from those expressed or implied by such forward-looking
statements. Among the risks and uncertainties that could cause TrueCar’s results to differ materially from those expressed or implied by such forward-looking
statements include: the ability to maintain and improve TrueCar’s relationship with, and perception among, car dealerships and grow the network of Certified Dealers,
on an overall basis, among dealers representing high volume brands and in important geographies, as well as the ability to grow the revenue TrueCar derives from car
manufacturer incentive programs; dependence upon affinity group marketing partners, especially USAA; compliance with U.S. federal and state laws and regulations
directly or indirectly applicable to TrueCar's business; the ability to scale and compete effectively in an increasingly competitive market and to grow and enhance
TrueCar's brand; the ability to increase revenue from dealers on the subscription pricing model; the successful improvement of TrueCar's technology infrastructure;
macro-economic issues that affect the automobile industry; the ability to attract, retain, and integrate qualified personnel, including recently hired members of
management and the hiring of additional personnel in our technology and dealer teams; the ability to successfully resolve litigation to which TrueCar is subject; and
other risks and uncertainties described more fully under the heading “Risk Factors” in TrueCar’s annual report on Form 10-K for the year ended December 31, 2016
and its subsequent Quarterly Reports on Form 10-Q filed with the Securities and Exchange Commission (“SEC”) and its report on Form 10-Q for the quarter ended
September 30, 2017 to be filed with the SEC. Moreover, TrueCar operates in a very competitive and rapidly changing environment. New risks emerge from time to
time. It is not possible for TrueCar management to predict all risks, nor can management assess the impact of all factors on its business or the extent to which any
factor, or combination of factors, may cause actual results to differ materially from those contained in any forward-looking statements TrueCar may make. All forward-
looking statements in this presentation are based on information available to TrueCar’s management as of the date hereof, and except as required by law,
management assumes no obligation to update these forward-looking statements, which speak only as of the date hereof.
In addition to U.S. GAAP financials, this presentation includes certain non-GAAP financial measures. These non-GAAP measures are in addition to, not a substitute
for or superior to, measures of financial performance prepared in accordance with U.S. GAAP. A reconciliation of these non-GAAP financial measures to the most
directly comparable GAAP measures is set forth in the Appendix to this presentation.

3
Q3 2017 HIGHLIGHTS
Third quarter total revenue up 10% from a year ago to $82.4 million
Total dealer count at an all-time high of 15,224 dealers, up 15% year-over-year
Total franchise dealer count(1) of 12,286 dealers, up 14% year-over-year
Franchise revenue per franchise dealer of $5,319
Total independent dealer count of 2,938 dealers, up 16% year-over-year
Independent revenue per independent dealer of $2,852
TrueCar users purchased 253,527 units from TrueCar Certified Dealers, up 15% year-over-year
TrueCar branded channel units of 108,376, up 12% year-over-year
Other Partners units of 80,310, up 45% year-over-year
USAA units of 64,841, down (5%) year-over-year
Adjusted EBITDA(2) of $8.0 million representing an Adjusted EBITDA margin(3) of 9.7%
New Car Market Share of 4.6%, up 19% year-over-year
(1) Note that this number excludes Genesis franchises on our program due to Hyundai’s transition of Genesis to a stand-alone brand. In order to facilitate period over period comparisons, we have continued to count each Hyundai franchise that also has a Genesis franchise
as one franchise dealer rather than two.
(2) See reconciliation of GAAP net loss to Adjusted EBITDA on page 17.
(3) Adjusted EBITDA margin is a Non-GAAP financial measure, calculated as Adjusted EBITDA, divided by total revenue.

4
10,759
12,286
2,537
2,938
13,296
15,224
Q3 2017 KEY HIGHLIGHTS
UNITS
221K
254K
15%
Y/Y
Q3 2016 Q3 2017
MARKET SHARE
19%
Y/Y
Q3 2016 Q3 2017
REVENUE
$70M
$78M
$75M
$82M
10%
Y/Y
FORECASTS,
CONSULTING AND
OTHER REVENUE
TRANSACTION
REVENUE
Q3 2016 Q3 2017
DEALER COUNT
15%
Y/Y
Q3 2016 Q3 2017
INDEPENDENT
DEALERS
FRANCHISE
DEALERS
16%
Y/Y
14%
Y/Y
3.9%
4.6%

5
56.9 50.7 48.9 51.8
58.5 57.3 57.8 61.4
65.1
4.6
4.9 5.2 5.6
6.3 6.9 7.4
8.0
8.3
5.9
3.7 3.4
4.4
5.5 5.8 5.3
7.8 4.1 5.0
4.3 4.5
4.6
4.8 4.1 5.3
4.6 4.9 $72.4
$63.6 $61.9
$66.4
$75.1 $74.1 $75.8
$81.8 $82.4
Q3 Q4 Q1 Q2 Q3 Q4 Q1 Q2 Q3
Net Franchise Revenue Net Independent Revenue OEM Incentives Revenue Forecasts, Consulting & Other Revenue
17% 22% 23% Total Revenue Y/Y: 10%
13% 18% 18% Net Franchise Revenue Y/Y: 11%
(1) Note: Transaction Revenue represents the sum of Net Franchise Revenue, Net Independent
Revenue and OEM Incentives Revenue
REVENUE
($ in millions)
2017 2015 2016
(4%) 20% 1% Other Revenue Y/Y: 2%
57% 57% 76% OEM Incentives Revenue Y/Y: (25%)
(1)
40% 42% 43% Net Independent Revenue Y/Y: 31%
(1)

6
8,702 9,094
9,281
10,135
10,759 11,151
11,734 12,204
12,286
$6,324
$5,695 $5,320 $5,336 $5,600 $5,230 $5,049 $5,128 $5,319
Q3 Q4 Q1 Q2 Q3 Q4 Q1 Q2 Q3
Franchise Dealer Count Franchise Revenue Per Franchise Dealer (period avg.)
FRANCHISE DEALER OVERVIEW
23% 26% 20% 14%
(8%) (5%) (4%) (5%)
Note: Represents Franchise Dealer count only. This number excludes Genesis franchises on our
program that were spun off from Hyundai. In order to facilitate period over period comparisons, we
have continued to count each Hyundai franchise that also has a Genesis franchise as one
franchise dealer rather than two. Non-Franchise Dealer count was 2,938 for Q3 2017, bringing the
network of TrueCar Certified Dealers to 15,224.
Franchise Dealer Count Y/Y:
Franchise Revenue/Dealer Y/Y:
4% 5% 4% 1%
(7%) (3%) 2% 4%
Franchise Dealer Count Q/Q:
Franchise Revenue/Dealer Q/Q:
2017 2015 2016

7
2,007 2,082
2,321
2,534 2,537 2,597
2,716
2,860 2,938
$2,422 $2,415 $2,354 $2,302 $2,492
$2,689 $2,778 $2,865 $2,852
Q3 Q4 Q1 Q2 Q3 Q4 Q1 Q2 Q3
Independent Dealer Count Independent Revenue Per Independent Dealer (period avg.)
INDEPENDENT DEALER OVERVIEW
2017 2015 2016
25% 17% 13% 16%
11% 18% 24% 14%
2% 5% 5% 3%
8% 3% 3% (0%)
Independent Dealer Count Y/Y:
Independent Revenue/Dealer Y/Y:
Independent Dealer Count Q/Q:
Independent Revenue/Dealer Q/Q:

8
TRAFFIC
6.6
5.9
6.7 6.7
7.6
7.0
7.3 7.2
7.7
Q3 Q4 Q1 Q2 Q3 Q4 Q1 Q2 Q3
(millions)
AVERAGE MONTHLY UNIQUE VISITORS
19% 10% 8% 1%
2017 2015 2016
Y/Y Growth:

9
208
183
175
193
221 219 218
242
254
Q3 Q4 Q1 Q2 Q3 Q4 Q1 Q2 Q3
UNITS
(thousands)
Y/Y Growth: 19% 24% 26% 15%
2017 2015 2016

10
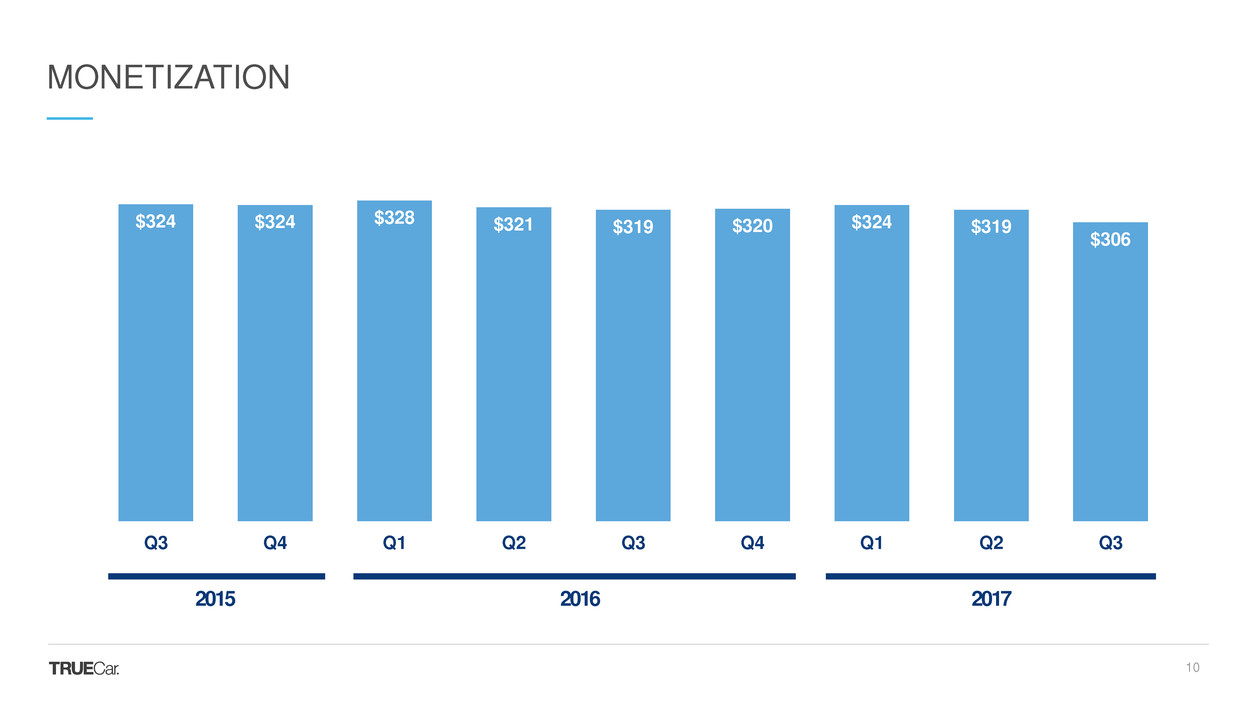
$324 $324 $328 $321 $319 $320 $324 $319
$306
Q3 Q4 Q1 Q2 Q3 Q4 Q1 Q2 Q3
MONETIZATION
2017 2015 2016

11
(1) See reconciliations of GAAP expenses to Non-GAAP expenses on page 18.
9.6 10.4 11.4 10.0 10.4 10.5 10.8 10.3 9.9
43.0
34.0 31.3 35.9
40.9 39.9 40.4 44.8 45.0
11.5
13.3 12.1 12.0
12.0 11.9 12.3
12.5 12.8
5.7
5.8 6.0 6.1
6.1 6.0 6.2
6.9 6.8 $69.8
$63.4
$60.8
$64.0
$69.3 $68.3 $69.7
$74.5 $74.4
Q3 Q4 Q1 Q2 Q3 Q4 Q1 Q2 Q3
G & A Sales & Mktg. Tech & Dev. Cost of Revenue
NON-GAAP EXPENSES (1)
($ in millions)
EXPENSES
2017 2015 2016

12
13.3% 16.3% 18.4% 15.1% 13.9% 14.2% 14.2% 12.5% 12.0%
59.3% 53.4% 50.7% 54.0% 54.4% 53.9% 53.4% 54.7% 54.6%
15.8% 21.0% 19.5% 18.0% 15.9% 16.1% 16.3% 15.3% 15.5%
7.9% 9.1% 9.7% 9.2% 8.1% 8.1% 8.2% 8.4% 8.2%
96.3% 99.7% 98.3% 96.3%
92.3% 92.2% 92.0% 91.0% 90.3%
Q3 Q4 Q1 Q2 Q3 Q4 Q1 Q2 Q3
G & A Sales & Mktg. Tech & Dev. Cost of Revenue
NON-GAAP EXPENSES AS A PERCENTAGE OF REVENUE (1)
(1) See reconciliations of GAAP expenses to Non-GAAP expenses on page 18.
2017 2015 2016

13
(1) See reconciliation of GAAP net loss to Adjusted EBITDA on page 17.
(2) Adjusted EBITDA margin is a Non-GAAP financial measure, calculated as Adjusted EBITDA, divided by total revenue.
$2.7
$0.2
$1.1
$2.4
$5.8 $5.8
$6.1
$7.4
$8.0
3.7%
0.3%
1.7%
3.7%
7.7% 7.8% 8.0%
9.0%
9.7%
Q3 Q4 Q1 Q2 Q3 Q4 Q1 Q2 Q3
Adj. EBITDA Adj. EBITDA Margin %
ADJUSTED EBITDA (1)
($ in millions)
2017 2015 2016
(2)

14
(1) We are unable to provide reconciliations of forward-looking Adjusted EBITDA without unreasonable effort because we are unable to provide a forward-looking estimate of certain reconciling items between GAAP net loss and Adjusted EBITDA due to uncertainty regarding,
and the potential variability of, stock-based compensation due to timing, valuation and number of future employee awards, and certain litigation costs due to timing, status, and cost of litigation, both of which may have a significant impact on GAAP results.
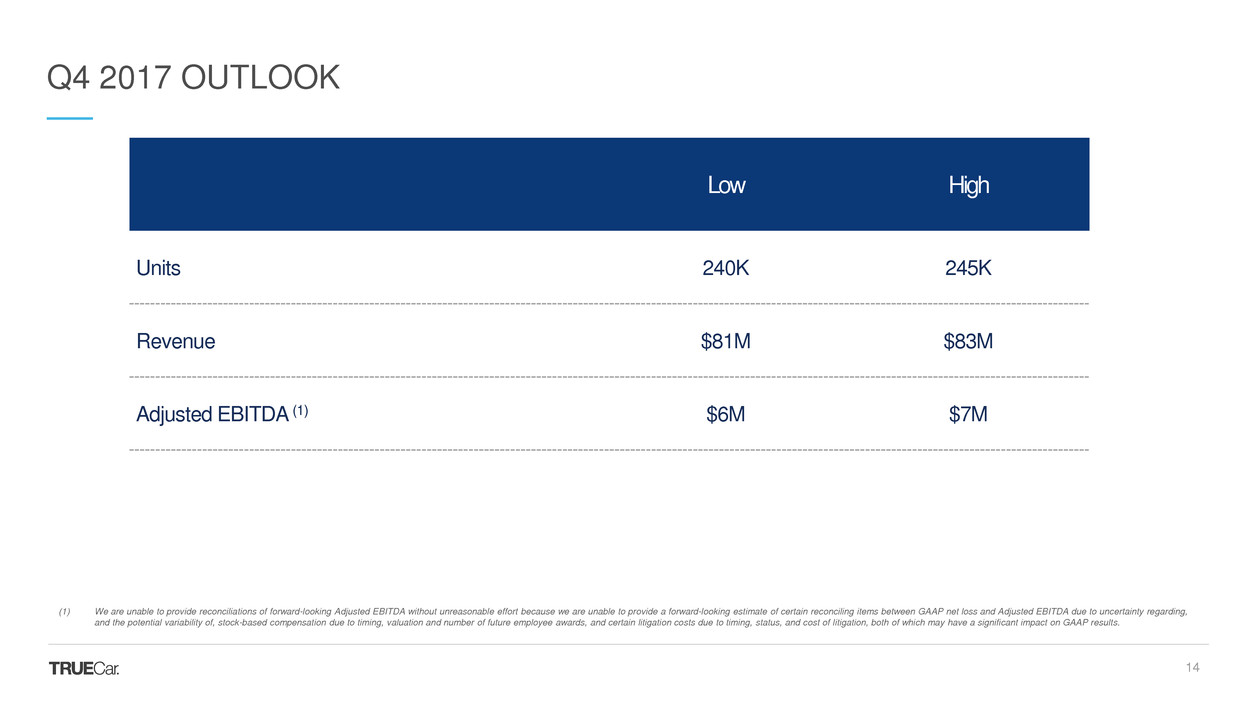
Q4 2017 OUTLOOK
Low High
Units 240K 245K
Revenue $81M $83M
Adjusted EBITDA (1) $6M $7M

15
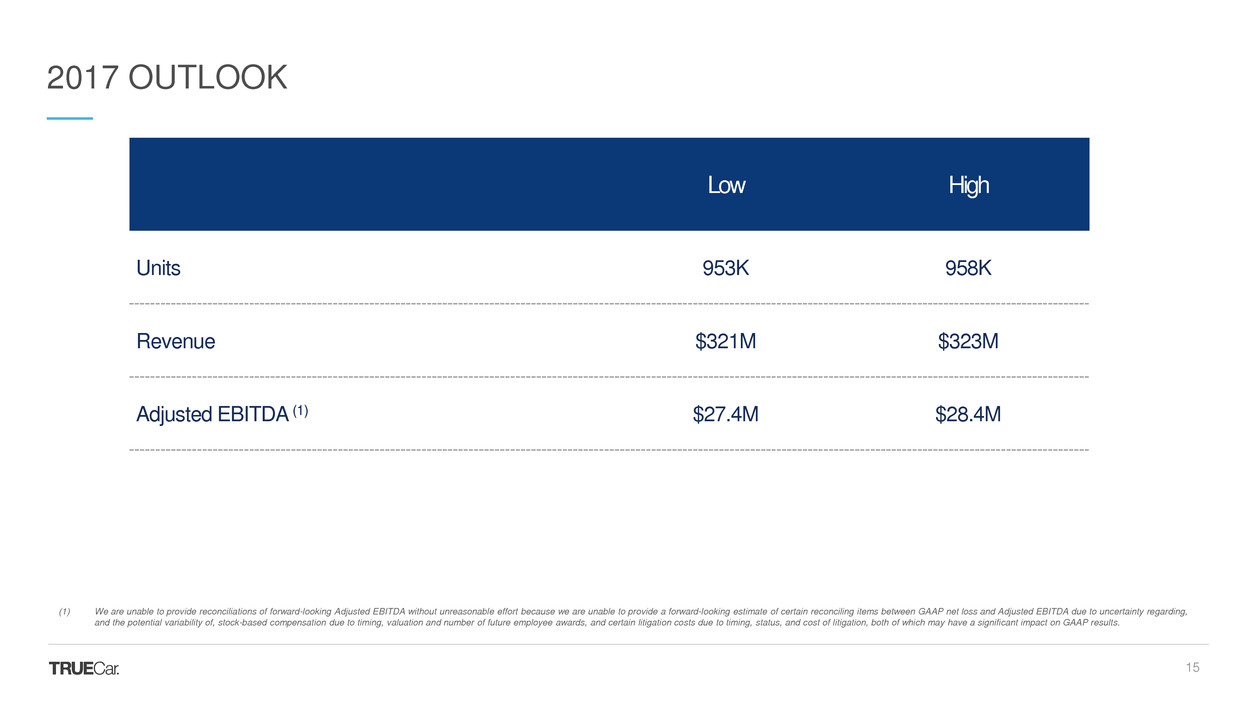
2017 OUTLOOK
Low High
Units 953K 958K
Revenue $321M $323M
Adjusted EBITDA (1) $27.4M $28.4M
(1) We are unable to provide reconciliations of forward-looking Adjusted EBITDA without unreasonable effort because we are unable to provide a forward-looking estimate of certain reconciling items between GAAP net loss and Adjusted EBITDA due to uncertainty regarding,
and the potential variability of, stock-based compensation due to timing, valuation and number of future employee awards, and certain litigation costs due to timing, status, and cost of litigation, both of which may have a significant impact on GAAP results.

16
2CONFIDENTIAL
Leadership4Clock4Tower
APPENDIX

17
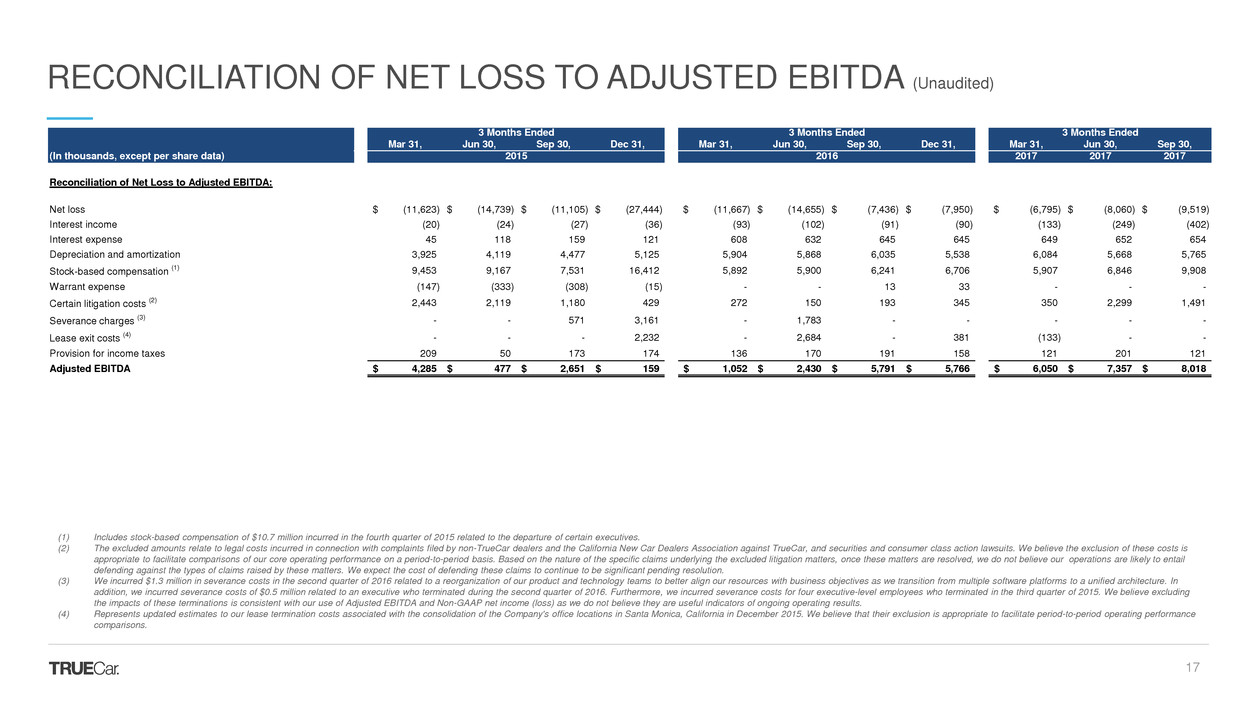
3 Months Ended 3 Months Ended 3 Months Ended
Mar 31, Jun 30, Sep 30, Dec 31, Mar 31, Jun 30, Sep 30, Dec 31, Mar 31, Jun 30, Sep 30,
(In thousands, except per share data) 2015 2016 2017 2017 2017
Reconciliation of Net Loss to Adjusted EBITDA:
Net loss (11,623)$ (14,739)$ (11,105)$ (27,444)$ (11,667)$ (14,655)$ (7,436)$ (7,950)$ (6,795)$ (8,060)$ (9,519)$
Interest income (20) (24) (27) (36) (93) (102) (91) (90) (133) (249) (402)
Interest expense 45 118 159 121 608 632 645 645 649 652 654
Depreciation and amortization 3,925 4,119 4,477 5,125 5,904 5,868 6,035 5,538 6,084 5,668 5,765
Stock-based compensation
(1) 9,453 9,167 7,531 16,412 5,892 5,900 6,241 6,706 5,907 6,846 9,908
Warrant expense (147) (333) (308) (15) - - 13 33 - - -
Certain litigation costs
(2) 2,443 2,119 1,180 429 272 150 193 345 350 2,299 1,491
Severance charges
(3) - - 571 3,161 - 1,783 - - - - -
Lease exit costs
(4) - - - 2,232 - 2,684 - 381 (133) - -
Provision for income taxes 209 50 173 174 136 170 191 158 121 201 121
Adjusted EBITDA 4,285$ 477$ 2,651$ 159$ 1,052$ 2,430$ 5,791$ 5,766$ 6,050$ 7,357$ 8,018$
RECONCILIATION OF NET LOSS TO ADJUSTED EBITDA (Unaudited)
(1) Includes stock-based compensation of $10.7 million incurred in the fourth quarter of 2015 related to the departure of certain executives.
(2) The excluded amounts relate to legal costs incurred in connection with complaints filed by non-TrueCar dealers and the California New Car Dealers Association against TrueCar, and securities and consumer class action lawsuits. We believe the exclusion of these costs is
appropriate to facilitate comparisons of our core operating performance on a period-to-period basis. Based on the nature of the specific claims underlying the excluded litigation matters, once these matters are resolved, we do not believe our operations are likely to entail
defending against the types of claims raised by these matters. We expect the cost of defending these claims to continue to be significant pending resolution.
(3) We incurred $1.3 million in severance costs in the second quarter of 2016 related to a reorganization of our product and technology teams to better align our resources with business objectives as we transition from multiple software platforms to a unified architecture. In
addition, we incurred severance costs of $0.5 million related to an executive who terminated during the second quarter of 2016. Furthermore, we incurred severance costs for four executive-level employees who terminated in the third quarter of 2015. We believe excluding
the impacts of these terminations is consistent with our use of Adjusted EBITDA and Non-GAAP net income (loss) as we do not believe they are useful indicators of ongoing operating results.
(4) Represents updated estimates to our lease termination costs associated with the consolidation of the Company's office locations in Santa Monica, California in December 2015. We believe that their exclusion is appropriate to facilitate period-to-period operating performance
comparisons.

18
3 Months Ended 3 Months Ended 3 Months Ended
Mar 31, Jun 30, Sep 30, Dec 31, Mar 31, Jun 30, Sep 30, Dec 31, Mar 31, Jun 30, Sep 30,
(In thousands, except per share data) 2015 2016 2017 2017 2017
Reconciliation of GAAP Expenses to Non-GAAP Expenses:
Cost of revenue, as reported 5,791 5,927 5,952 5,987 6,225 6,365 6,320 6,257 6,392 7,130 7,088
Stock-based compensation
(1) 177 187 217 211 222 233 256 249 203 233 339
Non-GAAP cost of revenue 5,614$ 5,740$ 5,735$ 5,776$ 6,003$ 6,132$ 6,064$ 6,008$ 6,189$ 6,897$ 6,749$
Sales and marketing, as reported 31,709 40,457 43,969 34,867 32,111 38,129 42,557 41,609 42,182 46,933 48,383
Stock-based compensation
(1) 1,390 1,218 1,131 754 763 1,736 1,655 1,683 1,745 2,160 3,358
Warrant expense (147) (333) (308) (15) - - 13 33 - - -
Severance charges
(2) - - 185 171 - 508 - - - - -
Non-GAAP sales and marketing 30,466$ 39,572$ 42,961$ 33,957$ 31,348$ 35,885$ 40,889$ 39,893$ 40,437$ 44,773$ 45,025$
Technology and development, as reported 9,760 10,979 12,340 14,942 13,140 14,022 13,153 13,265 13,629 14,131 15,357
Stock-based compensation
(1) 926 1,227 889 1,252 1,079 746 1,200 1,373 1,298 1,600 2,598
Severance charges
(2) - - - 366 - 1,304 - - - - -
Non-GAAP technology and development 8,834$ 9,752$ 11,451$ 13,324$ 12,061$ 11,972$ 11,953$ 11,892$ 12,331$ 12,531$ 12,759$
General and administrative, as reported 18,769 18,407 16,467 29,851 15,496 15,998 13,765 14,649 13,628 15,413 14,993
Stock-based compensation
(1) 6,960 6,535 5,294 14,195 3,828 3,185 3,130 3,401 2,661 2,853 3,613
Certain litigation costs
(3) 2,443 2,119 1,180 429 272 150 193 345 350 2,299 1,491
Severance charges
(2) - - 386 2,623 - (29) - - - - -
Lease exit costs
(4) - - - 2,232 - 2,684 - 381 (133) - -
Non-GAAP general and administrative 9,366$ 9,753$ 9,607$ 10,372$ 11,396$ 10,008$ 10,442$ 10,522$ 10,750$ 10,261$ 9,889$
RECONCILIATION OF GAAP EXPENSES TO NON-GAAP EXPENSES (Unaudited)
(1) Includes stock-based compensation of $10.7 million incurred in the fourth quarter of 2015 related to the departure of certain executives.
(2) We incurred $1.3 million in severance costs in the second quarter of 2016 related to a reorganization of our product and technology teams to better align our resources with business objectives as we transition from multiple software platforms to a unified architecture. In
addition, we incurred severance costs of $0.5 million related to an executive who terminated during the second quarter of 2016. Furthermore, we incurred severance costs for four executive-level employees who terminated in the third quarter of 2015. We believe excluding
the impacts of these terminations is consistent with our use of Adjusted EBITDA and Non-GAAP net income (loss) as we do not believe they are useful indicators of ongoing operating results.
(3) The excluded amounts relate to legal costs incurred in connection with complaints filed by non-TrueCar dealers and the California New Car Dealers Association against TrueCar, and securities and consumer class action lawsuits. We believe the exclusion of these costs is
appropriate to facilitate comparisons of our core operating performance on a period-to-period basis. Based on the nature of the specific claims underlying the excluded litigation matters, once these matters are resolved, we do not believe our operations are likely to entail
defending against the types of claims raised by these matters. We expect the cost of defending these claims to continue to be significant pending resolution.
(4) Represents updated estimates to our lease termination costs associated with the consolidation of the Company's office locations in Santa Monica, California in December 2015. We believe that their exclusion is appropriate to facilitate period-to-period operating performance
comparisons.

19
3 Months Ended 3 Months Ended 3 Months Ended
Mar 31, Jun 30, Sep 30, Dec 31, Mar 31, Jun 30, Sep 30, Dec 31, Mar 31, Jun 30, Sep 30,
(In thousands, except per share data) 2015 2016 2017 2017 2017
Reconciliation of GAAP Net Loss to Non-GAAP Net Income (Loss):
Net loss, as reported (11,623)$ (14,739)$ (11,105)$ (27,444)$ (11,667)$ (14,655)$ (7,436)$ (7,950)$ (6,795)$ (8,060)$ (9,519)$
Stock-based compensation
(1) 9,453 9,167 7,531 16,412 5,892 5,900 6,241 6,706 5,907 6,846 9,908
Warrant expense (147) (333) (308) (15) - - 13 33 - - -
Certain litigation costs
(2) 2,443 2,119 1,180 429 272 150 193 345 350 2,299 1,491
Severance charges
(3) - - 571 3,161 - 1,783 - - - - -
Lease exit costs
(4) - - - 2,232 - 2,684 - 381 (133) - -
Non-GAAP net income (loss)
(5) 126$ (3,786)$ (2,131)$ (5,225)$ (5,503)$ (4,138)$ (989)$ (485)$ (671)$ 1,085$ 1,880$
Basic shares for non-GAAP EPS 80,461 82,012 82,417 82,735 83,462 83,931 84,822 85,698 86,783 93,745 98,665
Diluted shares for non-GAAP EPS 92,361 82,012 82,417 82,735 83,462 83,931 84,822 85,698 86,783 103,265 105,751
Non-GAAP net income (loss) per share - basic 0.00$ (0.05)$ (0.03)$ (0.06)$ (0.07)$ (0.05)$ (0.01)$ (0.01)$ (0.01)$ 0.01$ 0.02$
Non-GAAP net income (loss) per share - diluted 0.00$ (0.05)$ (0.03)$ (0.06)$ (0.07)$ (0.05)$ (0.01)$ (0.01)$ (0.01)$ 0.01$ 0.02$
RECONCILIATION OF NET LOSS TO NON-GAAP NET INCOME (LOSS) (Unaudited)
(1) Includes stock-based compensation of $10.7 million incurred in the fourth quarter of 2015 related to the departure of certain executives.
(2) The excluded amounts relate to legal costs incurred in connection with complaints filed by non-TrueCar dealers and the California New Car Dealers Association against TrueCar, and securities and consumer class action lawsuits. We believe the exclusion of these costs is
appropriate to facilitate comparisons of our core operating performance on a period-to-period basis. Based on the nature of the specific claims underlying the excluded litigation matters, once these matters are resolved, we do not believe our operations are likely to entail
defending against the types of claims raised by these matters. We expect the cost of defending these claims to continue to be significant pending resolution.
(3) We incurred $1.3 million in severance costs in the second quarter of 2016 related to a reorganization of our product and technology teams to better align our resources with business objectives as we transition from multiple software platforms to a unified architecture. In
addition, we incurred severance costs of $0.5 million related to an executive who terminated during the second quarter of 2016. Furthermore, we incurred severance costs for four executive-level employees who terminated in the third quarter of 2015. We believe excluding
the impacts of these terminations is consistent with our use of Adjusted EBITDA and Non-GAAP net income (loss) as we do not believe they are useful indicators of ongoing operating results.
(4) Represents updated estimates to our lease termination costs associated with the consolidation of the Company's office locations in Santa Monica, California in December 2015. We believe that their exclusion is appropriate to facilitate period-to-period operating performance
comparisons.
(5) There is no income tax impact related to the adjustments made to calculate Non-GAAP net loss because of our available net operating loss carryforwards and the full valuation allowance recorded against our net deferred tax assets for all periods shown.
