Attached files
| file | filename |
|---|---|
| EX-10.36 - EXHIBIT 10.36 SWART EE AGREEMENT - TrueCar, Inc. | trueq42016ex1036swartemplo.htm |
| EX-32.1 - EXHIBIT 32.1 - TrueCar, Inc. | trueq42016ex321.htm |
| EX-31.2 - EXHIBIT 31.2 - TrueCar, Inc. | trueq42016ex312.htm |
| EX-31.1 - EXHIBIT 31.1 - TrueCar, Inc. | trueq42016ex311.htm |
| EX-23.1 - EXHIBIT 23.1 CONSENT - TrueCar, Inc. | trueq42016ex231consent.htm |
| EX-10.35 - EXHIBIT 10.35 SKUTTA EE AMENDMENT - TrueCar, Inc. | trueq42016ex1035skuttaempl.htm |
| EX-10.34 - EXHIBIT 10.34 SKUTTA EE AGREEMENT - TrueCar, Inc. | trueq42016ex1034skuttaempl.htm |
| EX-10.33 - EXHIBIT 10.33 GUNSAGAR EE AGREEMENT - TrueCar, Inc. | trueq42016ex1033gunsagarem.htm |
UNITED STATES
SECURITIES AND EXCHANGE COMMISSION
Washington, D.C. 20549
FORM 10-K
x | ANNUAL REPORT PURSUANT TO SECTION 13 OR 15(d) OF THE SECURITIES EXCHANGE ACT OF 1934 |
For the fiscal year ended December 31, 2016
¨ | TRANSITION REPORT PURSUANT TO SECTION 13 OR 15(d) OF THE SECURITIES EXCHANGE ACT OF 1934 |
Commission File Number: 001-36449
TRUECAR, INC.
(Exact name of registrant as specified in its charter)
Delaware (State or other jurisdiction of incorporation or organization) | 04‑3807511 (I.R.S. Employer Identification Number) | |
120 Broadway, Suite 200
Santa Monica, California 90401
(Address of principal executive offices and Zip Code)
(800) 200‑2000
(Registrant’s telephone number, including area code)
Securities registered pursuant to Section 12(b) of the Act:
Common Stock, par value $0.0001 per share | The Nasdaq Global Select Market | |
(Title of each class) | (Name of each exchange on which registered) | |
Securities registered pursuant to Section 12(g) of the Act:
None
Indicate by check mark if the registrant is a well-known seasoned issuer, as defined in Rule 405 of the Securities Act. Yes ☐ No ☒
Indicate by check mark if the registrant is not required to file reports pursuant to Section 13 or Section 15(d) of the Act. Yes ☐ No ☒
Indicate by check mark whether the registrant (1) has filed all reports required to be filed by Section 13 or 15(d) of the Securities Exchange Act of 1934 (Exchange Act) during the preceding 12 months (or for such shorter period that the registrant was required to file such reports), and (2) has been subject to such filing requirements for the past 90 days. Yes ☒ No ☐
Indicate by check mark whether the registrant has submitted electronically and posted on its corporate Website, if any, every Interactive Data File required to be submitted and posted pursuant to Rule 405 of Regulation S-T (§ 232.405 of this chapter) during the preceding 12 months (or for such shorter period that the registrant was required to submit and post such files). Yes ☒ No ☐
Indicate by check mark if disclosure of delinquent filers pursuant to Item 405 of Regulation S-K (§ 229.405 of this chapter) is not contained herein, and will not be contained, to the best of registrant’s knowledge, in definitive proxy or information statements incorporated by reference in Part III of this Form 10-K or any amendment to this Form 10-K. ☐
Indicate by check mark whether the registrant is a large accelerated filer, an accelerated filer, a non-accelerated filer, or a smaller reporting company. See the definitions of “large accelerated filer,” “accelerated filer” and “smaller reporting company” in Rule 12b-2 of the Exchange Act:
Large accelerated filer ¨ | Accelerated filer x | Non‑accelerated filer ¨ (do not check if a smaller reporting company) | Smaller reporting company ¨ |
Indicate by check mark whether the registrant is a shell company (as defined in Rule 12b-2 of the Exchange Act). Yes ☐ No ☒
The aggregate market value of the voting and non-voting stock held by non-affiliates of the registrant as of June 30, 2016, the last business day of the registrant’s most recently completed second fiscal quarter, was $366,724,525 based upon the closing price reported for such date on the NASDAQ Global Select Market.
As of February 23, 2017, the registrant had 86,670,243 shares of common stock outstanding.
Documents Incorporated by Reference
Portions of the registrant’s definitive Proxy Statement for the 2017 Annual Meeting of Stockholders are incorporated herein by reference in Part III of this Annual Report on Form 10-K to the extent stated herein. Such proxy statement will be filed with the Securities and Exchange Commission within 120 days of the registrant’s fiscal year ended December 31, 2016. Except with respect to information specifically incorporated by reference in this Form 10-K, the Definitive Proxy Statement is not deemed to be filed as part of this Form 10-K.
TRUECAR, INC.
FORM 10-K
2
As used in this Annual Report on Form 10-K, the terms “TrueCar”, “the Company,” “we,” “us” and “our” refer to TrueCar, Inc., and its wholly owned subsidiaries, TrueCar.com, Inc. and ALG, Inc., unless the context indicates otherwise. TrueCar.com, Inc. is referred to as “TrueCar.com” and ALG, Inc. is referred to as “ALG”.
Special Note Regarding Forward Looking Statements
This Annual Report on Form 10-K contains forward-looking statements within the meaning of the federal securities laws, which statements involve substantial risks and uncertainties. Forward-looking statements generally relate to future events or our future financial or operating performance. In some cases you can identify forward-looking statements because they contain words such as “anticipates,” “believes,” “continue,” “could,” “estimates,” “expects,” “intends,” “may,” “might,” “likely,” “plans,” “potential,” “predicts” “projects,” “seeks,” “should,” “target,” “will,” “would” or similar expressions and the negatives of those terms. Forward-looking statements contained in this Annual Report on Form 10-K include, but are not limited to, statements about:
• | our future financial performance and our expectations regarding our revenue, cost of revenue, gross profit or gross margin, operating expenses, ability to generate cash flow, and ability to achieve, and maintain, future profitability; |
• | our relationship with key industry participants, including car dealers and automobile manufacturers; |
• | anticipated trends, growth rates and challenges in our business and in the markets in which we operate; |
• | our ability to anticipate market needs and develop new and enhanced products and services to meet those needs, and our ability to successfully monetize them; |
• | maintaining and expanding our customer base, including our ability to increase the number of high volume brand dealers in our network generally and in key geographies; |
• | our reliance on our third-party service providers; |
• | the impact of competition in our industry and innovation by our competitors; |
• | our anticipated growth and growth strategies, including our ability to increase the rate at which site visitors obtain Guaranteed Savings Certificates and close rates; |
• | our ability to anticipate or adapt to future changes in our industry; |
• | the impact of seasonality on our business; |
• | our ability to hire and retain necessary qualified employees, including anticipated additions to our dealer, product and technology teams; |
• | our ability to integrate recent additions to our management team; |
• | our continuing ability to provide customers access to our products and services and the impact of any failure of our solutions or solution innovations; |
• | the evolution of technology affecting our products, services and markets; |
• | our ability to adequately protect our intellectual property; |
• | the anticipated effect on our business of litigation to which we are a party; |
• | our ability to stay abreast of new or modified laws and regulations that currently apply or become applicable to our business; |
• | the expense and administrative workload associated with being a public company; |
• | failure to maintain an effective system of internal controls necessary to accurately report our financial results and prevent fraud; |
• | our liquidity and working capital requirements; |
• | the estimates and estimate methodologies used in preparing our consolidated financial statements; |
• | the future trading prices of our common stock and the impact of securities analysts’ reports on these prices; |
• | the preceding and other factors discussed in Part I, Item 1A, “Risk Factors,” and in other reports we may file with the Securities and Exchange Commission from time to time; and |
• | the factors set forth in Part II, Item 7, “Management’s Discussion and Analysis of Financial Condition and Results of Operations.” |
Forward-looking statements involve known and unknown risks, uncertainties and other factors that may cause our actual results, performance or achievements to be materially different from any future results, performance or achievements expressed or implied by the forward-looking statements. We discuss these risks in greater detail in the section entitled “Risk Factors” and elsewhere in this Annual Report on Form 10-K. Given these uncertainties, you should not place undue reliance on these forward-looking statements. Forward-looking statements speak only as of the date the statements are made. You should not put undue reliance on any forward-looking statements. We assume no obligation to update forward-looking statements to reflect actual results, changes in assumptions or changes in other factors affecting forward-looking information, except to the extent required by applicable securities laws. If we do update one or more forward-looking statements, no inference should be drawn that we will make additional updates with respect to those or other forward-looking statements.
3
PART I
Item 1. Business
Overview
We seek to dramatically improve the way consumers buy cars and provide dealers and automakers with an excellent return on their marketing dollars.
We have established an intelligent, data-driven online platform powered by proprietary market data and analytics. Our company-branded platform is available on our TrueCar website and mobile applications. In addition, we customize and operate our platform on a co-branded basis for our many affinity group marketing partners, including financial institutions like USAA, Chase and American Express, membership-based organizations like Consumer Reports, AARP, Sam's Club, and AAA, and employee buying programs for large enterprises such as IBM and Walmart. We enable users to obtain market-based pricing data on new and used cars, and to connect with our network of TrueCar Certified Dealers. We also allow automobile manufacturers, known in the industry as OEMs, to connect with TrueCar users during the purchase process and efficiently deliver targeted incentives to consumers.
We benefit consumers by providing information related to what others have paid for a make, model and trim of car in their area and guaranteed savings off the manufacturer's suggested retail price, or MSRP, for that make, model and trim, as well as, in most instances, price offers on actual vehicle inventory, which we refer to as VIN-based offers, from our network of TrueCar Certified Dealers. Guaranteed savings off MSRP are reflected in a Guaranteed Savings Certificate which the consumer may then take to the dealer and apply toward the purchase of the specified make, model and trim of car. VIN-based offers provide consumers with price offers for specific vehicles from specific dealers. We benefit our network of TrueCar Certified Dealers by enabling them to attract these informed, in-market consumers in a cost-effective, accountable manner, which we believe helps them to sell more cars profitably. We benefit OEMs by allowing them to more effectively target their incentive spending at deep-in-market consumers during their purchase process.
Our network of over 13,000 TrueCar Certified Dealers consists primarily of new car franchises, representing all major makes of cars, as well as independent dealers selling used vehicles. TrueCar Certified Dealers operate in all 50 states and the District of Columbia.
Our subsidiary, ALG, Inc., provides forecasts and consulting services regarding determination of the residual value of an automobile at given future points in time. These residual values are used to underwrite automotive loans and leases to determine payments by consumers. In addition, financial institutions use this information to measure exposure and risk across loan, lease, and fleet portfolios. We also obtain automobile purchase data from a variety of sources and use this data to provide consumers and dealers with highly accurate, geographically specific, real-time pricing information.
Products and Services
Consumer
Consumers interface with us via our TrueCar branded website, affinity group marketing partner websites, and TrueCar branded and affinity group mobile applications.
The following are key elements of our consumer experience:
Market pricing data. Through our websites and mobile applications, a consumer selects a vehicle, adds desired options and inputs a ZIP code. In most instances, we then present the consumer with the TrueCar Curve, a graphical distribution of what others paid for a similar make, model and trim of car. Within this distribution, we include MSRP, factory invoice, and average price paid for that make, model and trim in the consumer’s local market. We generally provide consumers with our TrueCar Average, a proprietary calculation based on the recent transactions of TrueCar users, that provides an understanding of what others have paid for similarly configured vehicles. This information enables the consumer to evaluate a potential price in the context of broader market data.
Guaranteed Savings Certificates. After the consumer has received the context supplied by the market pricing data described above, the consumer may elect to connect with local TrueCar Certified Dealers by releasing the consumer’s contact information to those dealers. A consumer who makes this election then receives one or more Guaranteed Savings Certificates from the dealers that received the consumer’s contact information. The Guaranteed Savings Certificate issued by each TrueCar Certified Dealer will reflect the amount of guaranteed savings off MSRP that the consumer may then take to that dealer and apply toward the purchase of the specified make, model and trim of car.
4
VIN-based Offers. In most instances, in addition to receiving one or more Guaranteed Savings Certificates, the consumer will also receive price offers on in-stock vehicles with specified Vehicle Identification Numbers (“VINs”) from each of the Certified Dealers that has supplied the consumer with a Guaranteed Savings Certificate. These VIN-based offers provide consumers with price offers for specific vehicles from specific Certified Dealers.
Dealer
Our network of TrueCar Certified Dealers interfaces with our platform primarily through our Dealer Portal, an application that can be accessed online or using a mobile device. The Dealer Portal is considered a sales enhancement tool, and it enables dealers to access unique information on their prospects unavailable to them in their standard customer relationship management (CRM) software. The Dealer Portal allows dealers to assess the competitiveness of their vehicle pricing relative to their market, create vehicle pricing rules, access details on potential buyers wants and needs, create custom detailed offers based on vehicles in stock, manage how their dealership profile appears on the network, assess their competitive market performance on vehicles sold through their dealership, as well a number of administrative and other management tools. With the mobile application for iOS and Android, dealers also have the ability to provide a price quote on a vehicle relative to the local market, regardless of whether the potential buyer was sourced via the TrueCar network or not.
Pricing tools. The Pricing Manager provides dealers with a single interface to assess the competiveness of their vehicle pricing relative to their market and set pricing on all makes and models they offer for sale. The Sales Analyzer helps dealers better understand how their pricing for recently sold vehicles compares to the market, whether or not the customer transaction was with one of our users.
Sales closing tools. The Offer Tool helps dealers create custom detailed offers based on vehicles in stock. The Dealership Profile enables dealers to identify their selling benefits to customers, including salesperson names and pictures, dealership makes, hours of operation and website and social media links.
Manufacturers
We enable manufacturers to target consumers based on membership in an affinity group and other criteria. Through our platform, manufacturers can create cash incentives targeted to specific consumers and provide the ability to generate a unique coupon code that can be redeemed and validated at any dealership across the country in connection with the purchase of a new car. By facilitating and tracking these incentive codes in their own reporting systems, manufacturers can account directly for this method of reaching consumers. These manufacturers pay a per-vehicle fee to us for this service.
Used car listings
For consumers looking to purchase a used car, we provide an aggregated listing of used vehicles for sale in their local area. These listings are consolidated from a variety of sources, including members of our network of TrueCar Certified Dealers which sell used cars in addition to new cars, and dedicated non-franchise or independent dealers that do not sell new cars. In addition to displaying stated information made available by the seller about the pricing and condition of a car, we provide consumers with information related to the value of other cars of the same make, model, year and stated condition in the market. Through our websites and mobile applications, the user can contact the dealer, identifying herself as a TrueCar user, to initiate communications that may ultimately result in a completed transaction.
ALG
We forecast data on residual values of cars and provide this information on a subscription and consultative basis via ALG, our wholly-owned subsidiary. Automotive manufacturers, lenders, lessors, dealers, and software providers use information from ALG to determine the residual value of an automobile at given points in time in the future. These residual values are used to underwrite automotive loans and leases to determine payments by consumers. In addition, financial institutions use this information to measure exposure and risk across loan, lease, and fleet portfolios.
5
Sales and Marketing
Consumer marketing
We reach consumers through the TrueCar website and our branded mobile applications and websites we maintain for our affinity group marketing partners. Our marketing is focused on building the TrueCar brand. The key tenets of our brand are providing transparent market price information and enhancing the car-buying experience for both consumers and dealers. We divide our marketing spend between traditional media sources, such as television and radio, and digital media. Our consumer brand awareness efforts are aided by the fact that we are quoted in various media outlets from time to time as a recognized industry authority on automotive retail and online data forecasting.
We also support initiatives for our affinity group marketing partners, including USAA, Consumer Reports, AAA, American Express, and PenFed. These initiatives are designed to promote awareness of the organizations’ car-buying programs among their memberships through a variety of media, including television, email, direct mail, website development, print, online advertising, Internet search engine marketing, Internet search engine optimization, and social networking.
Dealer engagement and industry relations
Our dealer sales force is responsible for supporting our network of TrueCar Certified Dealers, optimizing our TrueCar Certified Dealer coverage across brands and geographies and for providing onboarding and dealer support. Our sales force helps dealers grow their businesses by regularly providing data-driven insights on inventory management and pricing.
Our ability to understand the needs of, actively listen to, and collaborate with our network of TrueCar Certified Dealers is crucial to our success. Many of our dealer sales force employees have worked at dealerships or OEMs. In response to feedback from our dealer network, in 2012 we formed an advisory panel of influential dealers to regularly meet with our senior management team to provide updates and opinions on how to improve our role in the car selling experience for dealers.
Competition
The automotive retail industry is highly competitive and fragmented. Consumers use a variety of online and offline sources to research vehicle information, obtain vehicle pricing information and identify dealers. In addition, dealers use a variety of marketing channels to promote themselves to consumers.
Competition for consumer awareness
We compete to attract consumers directly to our TrueCar.com website and mobile applications primarily on the basis of the quality of the consumer experience; the breadth, depth and accuracy of information; brand awareness and reputation.
Our principal competitors for consumer awareness include:
• | online automotive classified listings sites such as AutoTrader.com, Cars.com, CarGurus.com, and eBay Motors; |
• | online automotive content publishers such as Edmunds.com, KBB.com, and Autobytel.com; |
• | Internet search engines such as Google, Bing, and Yahoo; |
• | online sites operated by automobile manufacturers, such as General Motors and Ford; |
• | membership-based car-buying services, such as the Costco Auto Program, enabling members to purchase cars from affiliated dealers at preferential terms; and |
• | offline automotive classified listings, such as trade periodicals and local newspapers. |
Competition for car dealer marketing spend
We compete for a share of car dealers’ overall marketing expenditures within online and offline media marketing channels. We compete primarily on the basis of the transaction-readiness of our users; the efficiency of customer acquisition as compared to alternative methods; the accountability and measurability of our service; product features, analytics and tools; dealer support; and the size of our prospective car buyer audience. Other businesses also derive a majority of their revenue by offering consumer marketing services to dealers. These companies include listings, information, lead generation and car-buying services, and compete with us for dealer marketing spend.
6
Our principal competitors for car dealer marketing spend include:
• | online automotive content publishers such as Edmunds.com and KBB.com selling impression-based display advertising, and online automotive classified listing sites such as AutoTrader.com and Cars.com selling inventory-based subscription billing; |
• | lead generators such as Autobytel.com selling pay-per-lead advertising; |
• | Internet search engines such as Google selling cost-per-click advertising; and |
• | offline media, including newspaper, outdoor advertising, radio, television and direct mail. |
Technology
We have designed our technology platform, website and products to provide consumers, dealers and other parties with the information they need to effect a successful car purchase. Consumers access this platform through the TrueCar branded website, affinity group marketing partner websites, and TrueCar branded and affinity group mobile applications. Dealers access the platform through the software tools available on our Dealer Portal. Supporting each of these user interfaces are advanced systems for processing and analyzing automotive data, including features such as vehicle configurators and predictive consumer behavior modeling, as well as our proprietary matching algorithm to compare our transaction-based data sources with our record of online users for processing and billing. We use a combination of open source and licensed software running on optimized hardware.
We currently utilize cloud-based data processing and storage capabilities in connection with certain aspects of our business operations, while a portion of our data is housed in co-location facilities in Los Angeles and Chicago. We have adopted a centralized approach to quality assurance and testing for our technology platform and all products aimed at enhancing consumer and dealer experiences while seeking to optimize availability, scalability, security and performance.
Intellectual Property
We protect our intellectual property through a combination of patents, copyrights, trademarks, service marks, domain names, trade secret laws, confidentiality procedures and contractual restrictions.
At December 31, 2016, we had 23 U.S. issued patents, 41 pending U.S. patent applications, 4 issued foreign patents, and 18 pending foreign patent applications. The issued and allowed patents begin expiring in 2029 through 2033. We intend to pursue additional patent protection to the extent we believe it would be beneficial to our competitive position.
We have a number of registered and unregistered trademarks. We registered “TrueCar,” the TrueCar logo, various TRUE marks and other marks as trademarks in the U.S. and several other jurisdictions. We also have filed trademark applications for ALG and others in the U.S. and other jurisdictions, and will pursue additional trademark registrations to the extent we believe it would be beneficial to our competitive position.
In addition to the protection provided by our intellectual property rights, we enter into confidentiality and proprietary rights agreements with our employees, consultants, contractors, and business partners. Our employees and contractors are also subject to invention assignment agreements. We further control the use of our proprietary technology and intellectual property through provisions in both our general and product-specific terms of use on our website.
Regulatory Matters
Various aspects of our business are or may be subject to U.S. federal and state regulation. In particular, the advertising and sale of new or used motor vehicles is highly regulated by the states in which we do business. Although we do not sell motor vehicles, the dealers from which we derive a significant portion of our revenues do sell motor vehicles. Moreover, state regulatory authorities or other third parties could take and, on some occasions, have taken the position that some of the regulations applicable to dealers or to the manner in which motor vehicles are advertised and sold generally are directly applicable to our business model.
In May 2015, we were named as a defendant in a lawsuit filed by the California New Car Dealers Association in the Superior Court for the County of Los Angeles (the “CNCDA Litigation”). The complaint, both as originally filed and as subsequently amended, seeks declaratory and injunctive relief based on allegations that we are operating in the State of California as an unlicensed automobile dealer and autobroker. On December 7, 2015, the court dismissed this lawsuit “without prejudice,” meaning that the complaint could be amended and re-filed. On January 4, 2016, the plaintiff amended and re-filed the complaint. On February 3, 2016, the Company
7
filed a "demurrer" to the amended complaint, which is a pleading that requests the court to dismiss the case. On March 30, 2016, the Court granted in part and denied in part our demurrer to the second amended complaint, dismissing the Lanham Act claim but declining to dismiss the balance of the claims at the demurrer stage of the litigation. On May 31, 2016, based on certain intervening developments in state law, the Court announced that it would reconsider its March 30, 2016 order, and it invited the parties to file new briefs on the demurrer issues. On July 15, 2016, the Court heard oral argument on reconsideration of the demurrer issues. On July 25, 2016, the Court granted in part and denied in part the Company’s demurrer to the second amended complaint, just as it had done in its March 30, 2016 order. The litigation is currently in the discovery phase and is currently scheduled for trial in August 2017. We believe that the portions of the second amended complaint that survived the Court’s reconsideration of our demurrer are without merit, and we intend to vigorously defend ourselves in this matter.
In July 2015, we were named as a defendant in a lawsuit filed in the California Superior Court for the County of Los Angeles (the “Participating Dealer Litigation”). The complaint, filed by numerous dealers participating on the TrueCar Platform, and as subsequently amended, sought declaratory and injunctive relief based on allegations that the Company is engaging in unfairly competitive practices and is operating as an unlicensed automobile dealer and autobroker in contravention of various state laws. On September 29, 2015, the plaintiffs voluntarily dismissed this lawsuit “without prejudice.” There have been no further pleadings in this action.
In September 2015, we received a letter from the Texas Department of Motor Vehicles (the “Texas DMV Notice”) asserting that certain aspects of our advertising in Texas constitute false, deceptive, unfair, or misleading advertising within the meaning of applicable Texas law. On September 24, 2015, we responded to the Texas DMV Notice in an effort to resolve the concerns raised by the Texas DMV Notice without making material, unfavorable adjustments to our business practices or user experience in Texas. In light of the fact that no further action has been taken with respect to this matter subsequent to our response to the Texas DMV Notice, we consider the issues raised by the Texas DMV Notice to be informally resolved, but we cannot assure you that this matter or similar matters will not reemerge in the future.
In December 2015, the Company was named as a defendant in a putative class action lawsuit filed by Gordon Rose in the California Superior Court for the County of Los Angeles. The complaint asserts claims for unjust enrichment, violation of the California Consumer Legal Remedies Act, and violation of the California Business and Professions Code, based in part on allegations that we are operating in the State of California as an unlicensed automobile dealer and autobroker. The plaintiff seeks to represent a class of California consumers defined as “[a]ll California consumers who purchased an automobile by using TrueCar, Inc.’s price certificate during the applicable statute of limitations.” On January 12, 2016, the Court entered an order staying all proceedings in the case pending an initial status conference, which was previously scheduled for April 13, 2016. On March 16, 2016, the case was reassigned to a different judge. As a result of that reassignment, the initial status conference was rescheduled for and held on May 26, 2016. By stipulation, the stay of discovery has been continued until a second status conference, which was scheduled for October 12, 2016. On July 13, 2016, the plaintiff amended his complaint. The amended complaint continues to assert claims for unjust enrichment, violation of the California Consumer Legal Remedies Act, and violation of the California Business and Professions Code. The amended complaint retains the same proposed class definition as the initial complaint. Like the initial complaint, the amended complaint seeks an award of unspecified damages, interest, disgorgement, injunctive relief, and attorneys’ fees. On September 12, 2016, the Company filed a demurrer to the amended complaint. On October 12, 2016, the Court heard oral argument on the demurrer. On October 13, 2016, the Court granted in part and denied in part the Company’s demurrer to the amended complaint, dismissing the unjust enrichment claim but declining to dismiss the balance of the claims at the demurrer stage of the litigation. At a status conference held on January 26, 2017, the Court ruled that discovery may proceed regarding matters related to class certification only at this time. We believe the amended complaint is without merit and intend to vigorously defend the Company in this matter.
In July 2016, we received a letter from the Mississippi Motor Vehicle Commission (the “Mississippi MVC Letter”) asserting that an aspect of our advertising in Mississippi was not in compliance with a regulation adopted by the Mississippi Motor Vehicle Commission. On July 19, 2016 we responded to the Mississippi MVC Letter in an effort to resolve the concerns raised by the Mississippi MVC Letter without making material, unfavorable adjustments to our business practices or user experience in Mississippi. In light of the fact that no further action has been taken with respect to this matter subsequent to our response to the Mississippi MVC Letter, we consider the issues raised by the Mississippi MVC Letter to be informally resolved, but we cannot assure you that this matter or similar matters will not reemerge in the future.
In August 2016, we met with investigators from the California Department of Motor Vehicles (the “California DMV”) regarding an allegation made by a dealer that we were operating as an unlicensed automobile auction in California (the “Unlicensed Auction Allegation”). We provided the investigators with information about our business in an effort to resolve the concerns raised by the Unlicensed Auction Allegation. In October 2016, we were informally advised by an investigator for the California DMV that the concerns raised by the Unlicensed Auction Allegation had been resolved, but that the investigators will continue to evaluate our responses regarding certain matters related to the advertising of new motor vehicles. We cannot assure you that this matter or similar matters will not reemerge in the future.
In order to operate in this highly regulated environment, we have developed our products and services with a view toward appropriately managing the risk that our regulatory compliance or the regulatory compliance of the dealers in our dealer network
8
could be challenged. If, and to the extent that, our products and services fail to satisfy relevant regulatory requirements, our business or our TrueCar Certified Dealers could be subject to significant civil and criminal penalties, including fines, or the award of significant damages in class action or other civil litigation, as well as orders interfering with our ability to continue providing our products and services in certain states.
Given the regulatory environment in which we and our participating dealers operate, in designing our products and services, we have focused considerable attention on two areas of state regulation: state advertising regulations and state brokering or “bird-dogging” regulations. With respect to advertising, we believe that most of the content displayed on the websites we operate does not constitute advertising for the sale of new motor vehicles. Nevertheless, we endeavor to design the content such that it would comply insofar as practicable with state advertising regulations if and to the extent that the content is considered to be new vehicle sales advertising. With respect to state brokering or “bird-dogging” regulations, we have designed our products and services in a manner that aims to avoid the applicability of those regulations.
Our efforts to design products and services in a manner that appropriately manages the regulatory compliance risk for our business and our participating dealers are complicated by the fact that the related automotive sales and marketing laws vary from state to state, and even within a given state, are frequently susceptible to multiple interpretations. These laws were generally developed decades before the emergence of the Internet, are subject to significant revision or modification, and the manner in which they should be applied to our business model is frequently open to question. As a practical matter, state automobile dealer associations often have considerable influence over the construction of these laws by the relevant state regulatory authorities. Accordingly, in addition to our dialogues with relevant state agencies, we interface on a regular basis with representatives from automobile dealer associations in order to take their views into account as we continually update our products and services. The specific manner in which we have designed our products and services in an effort to manage state regulatory compliance concerns for us and our network of TrueCar Certified Dealers is the result of extensive analysis, which has required the investment of substantial resources that we believe represents a valuable asset of our business. However, we cannot assure you that we will be able to successfully comply with current or future regulations to which our business may be subject.
Employees
At December 31, 2016, we had 650 full-time employees at locations in Santa Monica, Austin, Denver, and San Francisco. We also engage a number of temporary employees and consultants to support our operations. None of our employees are represented by a labor union or subject to a collective bargaining agreement. We have not experienced any work stoppages, and we consider our relations with our employees to be good.
Corporate Information
We were incorporated in Delaware in February 2005 under our then corporate name Zag.com Inc. and began business operations in April 2005. We completed our initial public offering in May 2014 and our common stock is listed on The NASDAQ Global Select Market under the symbol "TRUE."
Available Information
Our internet address is www.true.com. Our investor relations website is located at http://ir.true.com/. We make our Securities and Exchange Commission (“SEC”) periodic reports (Form 10-Q and Forms 10-K) and current reports (Forms 8-K), and amendments to these reports, available free of charge through our website as soon as reasonably practicable after they are filed electronically with the SEC. We may from time to time provide important disclosures to investors by posting them in the investor relations section of our website, as allowed by SEC rules.
Materials we file with the SEC may be read and copied at the SEC’s Public Reference Room at 100 F Street, N.E., Washington, D.C. 20549. Information on the operation of the Public Reference Room may be obtained by calling the SEC at 1-800-SEC-0330. The SEC also maintains an Internet website at www.sec.gov that contains reports, proxy and information statements, and other information regarding our company that we file electronically with the SEC.
Item 1A. Risk Factors
Investing in our common stock involves a high degree of risk. You should consider carefully the risks and uncertainties described below, together with all of the other information in this report, including our consolidated financial statements and related notes, and Part II, Item 7, “Management's Discussion and Analysis of Financial Condition and Results of Operations” before making an investment in our common stock. If any of the following risks is realized, our business, financial condition, operating results and
9
prospects could be materially and adversely affected. In that event, the trading price of our common stock could decline and you could lose part or all of your investment. Additional risks and uncertainties not presently known to us or not believed by us to be material could also impact us.
Risks Related to Our Business and Industry
The growth of our business relies significantly on our ability to grow and optimize the geographic coverage of dealers in our network of TrueCar Certified Dealers and increase the representation of high volume brands in our network, such that we are able to increase the number of transactions between our users and TrueCar Certified Dealers. Failure to do so would limit our growth.
Some automotive brands consistently achieve higher than average sales volume per dealer. As a consequence, dealers representing those brands make a disproportionately greater contribution to our unit volume. Our ability to grow and to optimize the geographic coverage of dealers in our network of TrueCar Certified Dealers, increase the number of dealers representing high volume brands and grow the overall number of dealers in our network is an important factor in growing our business.
As described elsewhere in this “Risk Factors” section, we are a relatively new participant in the automobile retail industry and our business has sometimes been viewed in a negative light by car dealerships. Although we have taken steps intended to improve our relationships with, and image among, car dealerships, including the commitments made in our pledge to dealers, there can be no assurance that our efforts will be successful. We may be unable to maintain or grow the number of car dealers in our network, in a geographically optimized manner or at all, or increase the proportion of dealers in our network representing high volume brands. During the second half of 2015, we experienced both a decline in the proportion of such high volume dealers in our network and slowed quarter-over-quarter revenue growth. There can be no assurance we will be successful in sustainably reversing these declines. Failure to do so could have a material adverse effect on our business, growth, financial condition, results of operations and cash flows.
In addition, our ability to increase the number of TrueCar Certified Dealers in an optimized manner depends on strong relationships with other constituents, including car manufacturers and state dealership associations. From time to time, car manufacturers have communicated concerns about our business to the dealers in our network. For example, some car manufacturers maintain guidelines that prohibit dealers from advertising a car at a price that is below an established floor. If a TrueCar Certified Dealer submits pricing information to our users that falls below pricing guidelines established by the applicable manufacturer, the manufacturer may discourage that dealer from remaining in the network and may discourage other dealers within its brand from joining the network. For example, in late 2011, Honda publicly announced that it would not provide advertising allowances to dealers that remained in our network of TrueCar Certified Dealers. While we subsequently addressed Honda’s concerns and it ceased withholding advertising allowances from our TrueCar Certified Dealers, discord with specific car manufacturers impedes our ability to grow our dealer network. More recently, in January 2016, Toyota modified its marketing covenant to include guidelines on minimum allowable advertised pricing. We have implemented certain changes designed to accommodate these guidelines; however it is unclear whether we will ultimately be able to do so without making material, unfavorable adjustments to our business practices or user experience. If we are unable to successfully accommodate these guidelines without making material, unfavorable adjustments to our business practices or user experience, it could have a material adverse effect on our business, growth, financial condition, results of operations and cash flows.
In addition, state dealership associations maintain significant influence over the dealerships in their state as lobbying groups and as thought leaders. To the extent that these associations view us in a negative light, our reputation with car dealers in the corresponding state may be negatively affected. If our relationships with car manufacturers or state dealership associations suffer, our ability to maintain and grow the number of car dealers in our network will be harmed.
We cannot assure you that we will expand our network of TrueCar Certified Dealers in a manner that provides a sufficient number of dealers by brand and geography for our unique visitors and failure to do so would limit our growth.
If key industry participants, including car dealers and automobile manufacturers, perceive us in a negative light or our relationships with them suffer harm, our ability to grow and our financial performance may be damaged.
Our primary source of revenue consists of fees paid by TrueCar Certified Dealers to us in connection with the sales of automobiles to our users. In addition, our value proposition to consumers depends on our ability to provide pricing information on automobiles from a sufficient number of automobile dealers by brand and in a given consumer’s geographic area. If our relationships with our network of TrueCar Certified Dealers suffer harm in a manner that leads to the departure of these dealers from our network, then our revenue and ability to maintain and grow unique visitor traffic will be adversely affected.
10
At the end of 2011 and the beginning of 2012, due to certain regulatory and publicity-related challenges, many dealers canceled their agreements with us and our franchise dealer count fell from 5,571 at November 30, 2011 to 3,599 at February 28, 2012. More recently, 279 franchise dealers became inactive as the result of a contractual dispute with a large dealer group, and our franchise dealer count decreased from 9,300 at June 30, 2015 to 8,702 at September 30, 2015. At December 31, 2016 our franchise dealer count was 11,151.
TrueCar Certified Dealers have no contractual obligation to maintain their relationship with us. Accordingly, these dealers may leave our network at any time or may develop or use other products or services in lieu of ours. Further, while we believe that our service provides a lower cost, accountable customer acquisition channel, dealers may have difficulty rationalizing their marketing spend across TrueCar and other channels, which potentially has the effect of diluting our dealer value proposition. If we are unable to create and maintain a compelling value proposition for dealers to become and remain TrueCar Certified Dealers, our dealer network would not grow and could decline.
In addition, although the automobile dealership industry is fragmented, a small number of groups have significant influence over the industry. These groups include state and national dealership associations, state regulators, car manufacturers, consumer groups, individual dealers and consolidated dealer groups. To the extent that these groups believe that automobile dealerships should not do business with us, this belief may become quickly and widely shared by automobile dealerships and we may lose a significant number of dealers in our network. In May 2015, the California New Car Dealers Association filed a lawsuit alleging that we are operating in the State of California as an unlicensed automobile dealer and autobroker. For more information concerning this lawsuit, refer to the risk factor below, “We face litigation and are party to legal proceedings that could have a material adverse effect on our business, financial condition, results of operations and cash flows.” A significant number of automobile dealerships are also members of larger dealer groups, and to the extent that a group decides to leave our network, this decision would typically apply to all dealerships within the group.
Furthermore, automobile manufacturers may provide their franchise dealers with financial or other marketing support, provided that such dealers adhere to certain marketing guidelines. Automobile manufacturers may determine that the manner in which certain of their franchise dealers use our platform is inconsistent with the terms of such marketing guidelines, which determination could result in potential or actual loss of the manufacturers’ financial or other marketing support to the dealers whose use of the platform is deemed objectionable. The potential or actual loss of such marketing support may cause such dealers to cease being members of our TrueCar Certified Dealer network, which may adversely affect our ability to maintain or grow the number and productivity of dealers in our network or the revenue derived from those dealers.
We cannot assure you that we will maintain strong relationships with the dealers in our network of TrueCar Certified Dealers or that we will not suffer dealer attrition in the future. We may also have disputes with dealers from time to time, including relating to the collection of fees from them and other matters. We may need to modify our products, change pricing or take other actions to address dealer concerns in the future. If a significant number of these automobile dealerships decided to leave our network or change their financial or business relationship with us, then our business, growth, operating results, financial condition and prospects would suffer.
If we are unable to provide a compelling car-buying experience to our users, the number of transactions between our users and TrueCar Certified Dealers will decline and our revenue and results of operations will suffer harm.
The user experience on our company-branded platform on the TrueCar website has evolved since its launch in 2010, but has not changed dramatically. We cannot assure you that we are able to provide a compelling car-buying experience to our users, and our failure to do so could mean that the number of transactions between our users and TrueCar Certified Dealers may decline and we would be unable to effectively monetize our user traffic. We believe that our ability to provide a compelling car-buying experience is subject to a number of factors, including:
• | our ability to launch new products that are effective and have a high degree of consumer engagement; |
• | our ability to constantly innovate and improve our existing products; |
• | compliance of the dealers within our network of TrueCar Certified Dealers with applicable laws, regulations and the rules of our platform, including honoring the TrueCar certificates submitted by our users; and |
• | our access to a sufficient amount of data to enable us to provide relevant pricing information to consumers. |
11
If we suffer a significant interruption in our ability to gain access to third-party data, we may be unable to maintain key aspects of our user experience, including the TrueCar Curve, and our business and operating results will suffer.
Our business relies on our ability to analyze data for the benefit of our users and the TrueCar Certified Dealers in our network. We use data obtained pursuant to agreements with third parties to power certain aspects of the user experience on our platform, including the TrueCar Curve, a graphical distribution of what others paid for the same make and model of car. In addition, the effectiveness of our user acquisition efforts depends in part on the availability of data relating to existing and potential users of our platform. If we are unable to renew data agreements, or utilize alternative data sources, as certain agreements expire, and we experience a material disruption in the data provided to us, the information that we provide to our users and TrueCar Certified Dealers may be limited, the quality of this information may suffer, the user experience may be negatively affected and certain functionality on our platform may be disabled, and our business, financial condition, results of operations and cash flows could be materially and adversely affected.
Changes to management, including turnover of our top executives, or an inability to retain, attract and integrate qualified personnel, could harm our ability to develop and successfully grow our business.
We believe our success has depended, and continues to depend, on the efforts and talents of our executives and employees. Our future success depends on our continuing ability to attract, develop, motivate and retain highly qualified and skilled employees. Qualified individuals are in high demand, and we may incur significant costs to attract and retain them. In order to attract and retain executives and other key employees in a competitive marketplace, we must provide competitive compensation packages, including cash and stock-based compensation. Our primary forms of stock-based incentive awards are stock options and restricted stock units. If the anticipated value of such stock-based incentive awards does not materialize, if our stock-based compensation otherwise ceases to be viewed as a valuable benefit, or if our total compensation package is not viewed as being competitive, our ability to attract, retain and motivate executives and key employees could be weakened.
The loss of any of our senior management or key employees could materially adversely affect our ability to execute our business plan and strategy, and we may not be able to find adequate replacements on a timely basis, or at all. Our executive officers and other employees are at-will employees, which means they may terminate their employment relationship with us at any time, and their knowledge of our business and industry would be extremely difficult to replace. In the second half of 2015, we experienced increased turnover in key executive positions, including our chief executive officer and president. Our current executives may view the business differently than prior members of management, and over time may make changes to our strategic focus, operations or business plans with corresponding changes in how we report our results of operations. We can make no assurances that our current executives will be able to properly manage any such shift in focus or that any changes to our business would ultimately prove successful. We cannot ensure that we will be able to retain the services of any members of our senior management or other key employees. If we do not succeed in attracting well-qualified employees, retaining and motivating existing employees or integrating new executives and employees, our business could be materially and adversely affected.
Our growth in recent years may not be indicative of our future growth and, we may not be able to manage future growth effectively.
Our revenue grew from $38.1 million in 2010 to $277.5 million in 2016. However, beginning in the third quarter of 2015, we began experiencing slowed revenue growth. Although revenue growth has recently improved, we expect that in the future, as our revenue increases, our rate of growth may again decline. In addition, we may not be able to grow as fast or at all if we do not accomplish the following:
• | expand our dealer network in a geographically optimized manner, including increasing dealers in our network representing high volume brands; |
• | increase the number of transactions between our users and TrueCar Certified Dealers; |
• | maintain and grow our affinity group marketing partner relationships and increase the productivity of our current affinity group marketing partners; |
• | increase the number of users of our products and services, and in particular the number of unique visitors to the TrueCar website and our TrueCar branded mobile applications; |
• | further improve the quality of our existing products and services, and introduce high quality new products and services; and |
• | introduce third party ancillary products and services. |
12
We may not successfully accomplish any of these objectives. We plan to continue our investment in future growth. We expect to continue to expend substantial financial and other resources on:
• | marketing and advertising; |
• | dealer outreach and training, including the hiring of significant additional personnel in our dealer team; |
• | technology and product development, including the hiring of additional personnel in our product development and technical teams, harmonization of our software infrastructure, and the development of new products and new features for existing products; and |
• | general administration, including legal, accounting and other compliance expenses related to being a public company. |
In addition, our historical growth has placed and may continue to place significant demands on our management and our operational and financial resources. We have also experienced significant growth in the number of users of our platform as well as the amount of data that we analyze. We have hired, and expect to continue hiring, additional personnel, particularly in our dealer and technology teams. The additional personnel in our dealer team are intended to enhance the service experience and the productivity of our dealer network while the additional personnel in our technology team are focusing on delivering a better experience to consumers and dealers. Finally, our organizational structure is becoming more complex as we continue to add additional staff, and we will need to improve our operational, financial and management controls as well as our reporting systems and procedures. We will require significant capital expenditures and the allocation of valuable management resources to grow and change in these areas without undermining our corporate culture of rapid innovation, teamwork and attention to the car-buying experience for the consumer and the economics of the dealer.
We may be unable to maintain or grow relationships with information data providers or may experience interruptions in the data feeds they provide, which may limit the information that we are able to provide to our users and dealers as well as the timeliness of such information and may impair our ability to attract or retain consumers and TrueCar Certified Dealers and to timely invoice our dealers.
We receive automobile purchase data from many third-party data providers, including our network of TrueCar Certified Dealers, dealer management system, or DMS, data feed providers, data aggregators and integrators, survey companies, purveyors of registration data and our affinity group marketing partners. In the states in which we employ a pay-per-sale billing model, we use this data to match purchases with users that obtained a Guaranteed Savings Certificate from a TrueCar Certified Dealer so that we may collect a transaction fee from those dealers and recognize revenue from the related transactions.
From time to time, we experience interruptions in one or more data feeds that we receive from third-party data providers, particularly DMS system data feed providers, in a manner that affects our ability to timely invoice the dealers in our network. These interruptions may occur for a number of reasons, including changes to the software used by these data feed providers and difficulties in renewing our agreements with third-party data feed providers. In the states in which we employ a pay-per-sale billing model, an interruption in the data feeds that we receive may affect our ability to match automobile purchases with users that obtained a Guaranteed Savings Certificate from a TrueCar Certified Dealer, thereby delaying our submission of an invoice to an automobile dealer in our network for a given transaction and delaying the timing of cash receipts from the dealer. The redundancies of data feeds received from multiple providers may not result in sufficient data to match automobile purchases with users that obtained a Guaranteed Savings Certificate from a TrueCar Certified Dealer. In the case of an interruption in our data feeds, our billing structure may transition to a subscription model for automobile dealers in our network until the interruption ceases. However, our subscription billing model may result in lower revenues during an interruption and, when an interruption ceases, we are not always able to retroactively match a transaction and collect a fee. In addition, our likelihood of collection of the fee owed to us for a given transaction decreases for those periods in which we are unable to submit an invoice to automobile dealers. Interruptions which occur in close proximity to the end of a given reporting period could result in delays in our ability to recognize those transaction revenues in that reporting period and these shortfalls in transaction revenue could be material to our operating results.
13
We have a history of losses and we may not achieve or maintain profitability in the future.
We have not been profitable since inception and had an accumulated deficit of $318.2 million at December 31, 2016. From time to time in the past, we have made significant investments in our operations which have not resulted in corresponding revenue growth and, as a result, increased our losses. We expect to make significant future investments to support the further development and expansion of our business and these investments may not result in increased revenue or growth on a timely basis or at all. Our revenue growth has been highly influenced by marketing expenditures. Incremental marketing expenditures in certain situations do not result in sufficient incremental revenue to cover their cost. This limits the growth in revenue that can be achieved through marketing expenditures. In addition, as a public company, we have and will continue to incur significant legal, accounting and other expenses that we did not incur as a private company. As a result of these increased expenditures, we have to generate and sustain increased revenue to achieve and maintain profitability.
We may incur significant losses in the future for a number of reasons, including slowing demand for our products and services, increasing competition, weakness in the automobile industry generally, as well as other risks described in this report, and we may encounter unforeseen expenses, difficulties, complications and delays, and other unknown factors. If we incur losses in the future, we may not be able to reduce costs effectively because many of our costs are fixed. In addition, to the extent that we reduce variable costs to respond to losses, this may affect our ability to acquire consumers and dealers and grow our revenues. Accordingly, we may not be able to achieve or maintain profitability and we may continue to incur significant losses in the future, and this could cause the price of our common stock to decline.
We have operated our business at scale for a limited period of time and we cannot predict whether we will continue to grow. If we are unable to successfully respond to changes in the market, our business could be harmed.
Our business has grown as users and automobile dealers have increasingly used our products and services. However, our business is relatively new and has operated at a substantial scale for only a limited period of time. Given this limited history, it is difficult to predict whether we will be able to maintain or grow our business. We expect that our business will evolve in ways which may be difficult to predict. For example, marketing expenditures in certain situations become inefficient, particularly with respect to the TrueCar website and our branded mobile applications. Continued revenue growth will require more focus on increasing the number of transactions from which we derive revenue by growing our network of TrueCar Certified Dealers, including dealers representing high volume brands, both on an overall basis and in important geographies. It is also possible that car dealers could broadly determine that they no longer believe in the value of our services. In the event of these or any other developments, our continued success will depend on our ability to successfully adjust our strategy to meet the changing market dynamics. If we are unable to do so, our business could be harmed and our results of operations and financial condition could be materially and adversely affected.
The loss of a significant affinity group marketing partner or a significant reduction in the number of cars purchased from our TrueCar Certified Dealers by members of our affinity group marketing partners would reduce our revenue and harm our operating results.
Our financial performance is substantially dependent upon the number of automobiles purchased from TrueCar Certified Dealers by users of the TrueCar website, our branded mobile applications and the car-buying sites we maintain for our affinity group marketing partners. Currently, a majority of the automobiles purchased by our users were matched to the car-buying sites we maintain for our affinity group marketing partners. As a result, our relationships with our affinity group marketing partners are critical to our business and financial performance. However, several aspects of our relationship with affinity groups might change in a manner that harms our business and financial performance, including:
• | affinity group marketing partners might terminate their relationship with us or make such relationship non-exclusive, resulting in a reduction in the number of transactions between users of our platform and TrueCar Certified Dealers; |
• | affinity group marketing partners might de-emphasize the automobile buying programs within their offerings, resulting in a decrease in the number of transactions between their members and our TrueCar Certified Dealers; or |
• | the economic structure of our agreements with affinity group marketing partners might change, resulting in a decrease in our operating margins on transactions by their members. |
A significant change to our relationships with affinity group marketing partners may have a negative effect on our business in other ways. For example, the termination by an affinity group marketing partner of our relationship may create the perception that our products and services are no longer beneficial to the members of affinity groups or a more general negative association with our business. In addition, a termination by an affinity group marketing partner may result in the loss of the data provided to us by them with respect to automobile transactions. This loss of data may decrease the quantity and quality of the
14
information that we provide to consumers and may also reduce our ability to identify transactions for which we can invoice dealers. If our relationships with affinity group marketing partners change our business, revenue, operating results and prospects may be harmed.
Any adverse change in our relationship with United Services Automobile Association, or USAA, could harm our business.
The largest source of user traffic and unit sales from our affinity group marketing partners comes from the site we maintain for USAA, and USAA is our largest stockholder. In 2016, 254,241 units, or 32%, of all units purchased by users from TrueCar Certified Dealers during that period, were matched to users of the car-buying site we maintain for USAA. As such, USAA has a significant influence on our operating results. We define units as the number of automobiles purchased by our users from TrueCar Certified Dealers through the TrueCar website and our branded mobile applications or the car-buying sites we maintain for our affinity group marketing partners. At December 31, 2016, USAA beneficially owned 12,175,335 shares, which represented 14.0% of our outstanding common stock.
In May 2014, we entered into an extension of our affinity group marketing agreement with USAA that extends through February 13, 2020, but we cannot assure you that our agreement with USAA will be extended at the expiration of the current agreement on terms satisfactory to us, or at all. In addition, USAA has broad discretion in how the car-buying site we maintain for USAA is promoted and marketed on its own website. Changes in this promotion and marketing have in the past and may in the future adversely affect the volume of user traffic we receive from USAA. Changes in our relationship with USAA or its promotion and marketing of our platform could adversely affect our business and operating results in the future.
The success of our business relies heavily on our marketing and branding efforts, especially with respect to the TrueCar website and our branded mobile applications, as well as those efforts of the affinity group marketing partners whose websites we power, and these efforts may not be successful.
We believe that an important component of our growth will be the growth of our business derived from the TrueCar website and our TrueCar branded mobile applications. Because TrueCar.com is a consumer brand, we rely heavily on marketing and advertising to increase the visibility of this brand with potential users of our products and services. We currently advertise through television and radio marketing campaigns, digital and online media, sponsorship programs and other means, the goal of which is to increase the strength, recognition and trust in the TrueCar brand and drive more unique visitors to our website and mobile applications. We incurred expenses of $154.4 million on sales and marketing during 2016.
Our business model relies on our ability to scale rapidly and to decrease incremental user acquisition costs as we grow. Our revenue growth has been highly influenced by marketing expenditures. Incremental marketing expenditures in certain situations do not result in the acquisition of sufficient users visiting our website and mobile applications to permit recovery of such costs through revenue growth. This limits the growth in revenue that can be achieved through marketing expenditures. If we are unable to recover our marketing costs through increases in user traffic and in the number of transactions by users of our platform it could have a material adverse effect on our growth, results of operations and financial condition.
Additionally, to the extent that we discontinue our broad marketing campaigns or elect to reduce our sales and marketing costs to decrease our losses, this may affect our ability to acquire consumers and dealers and grow our revenues. Our current and potential competitors may have significantly more financial, marketing and other resources than we have and the ability to devote greater resources to the promotion and support of their products and services. The realities of competing for users and brand visibility, as well as ensuring the satisfaction of our dealers, may limit our ability to reduce our own marketing expenditures, potentially negatively impacting our operating margins and financial results.
In addition, the number of transactions generated by the members of our affinity group marketing partners depends in part on the emphasis that these affinity group marketing partners place on marketing the purchase of cars within their platforms. For example, USAA is a large diversified financial services group of companies serving the United States military community with hundreds of highly competitive product and service offerings. At any given time, USAA’s car-buying service may or may not be a priority relative to its other offerings. Consequently, changes in how USAA promotes and markets the car-buying site we maintain for them can and has, from time to time in the past, affected the volume of purchases generated by USAA members. For example, in the past USAA adjusted the location and prominence of the links to our platform on its web pages, adversely affecting the volume of traffic to our platform. Should USAA or one or more of our other affinity group marketing partners decide to de-emphasize the marketing of our platform, or if their marketing efforts are otherwise unsuccessful, our revenue, business and financial results will be harmed.
15
Failure to increase our revenue or reduce our sales and marketing expense or our technology and development expense as a percentage of revenue would adversely affect our financial condition and profitability.
We expect to make significant future investments to support the further development and expansion of our business and these investments may not result in increased revenue or growth on a timely basis or at all. Furthermore, these investments may not decrease as a percentage of revenue if our business grows. In particular, we intend to increase expenditures to enhance our existing products and services, grow and train our network of TrueCar Certified Dealers and upgrade our system architecture. We also intend to continue investing to increase awareness of our brand, including via television and radio advertisements. There can be no assurance that these investments will increase revenue or that we will eventually be able to decrease our sales and marketing expense, or our technology and development expense, as a percentage of revenue, and failure to do so would adversely affect our financial condition and profitability.
We are subject to a complex framework of federal and state laws and regulations primarily concerning vehicle sales, advertising and brokering, many of which are unsettled, still developing and contradictory, which have in the past, and could in the future, subject us to claims, challenge our business model or otherwise harm our business.
Various aspects of our business are or may be subject, directly or indirectly, to U.S. federal and state laws and regulations. Failure to comply with such laws or regulations may result in the suspension or termination of our ability to do business in affected jurisdictions or the imposition of significant civil and criminal penalties, including fines or the award of significant damages against us and our TrueCar Certified Dealers in class action or other civil litigation.
State Motor Vehicle Sales, Advertising and Brokering Laws
The advertising and sale of new or used motor vehicles is highly regulated by the states in which we do business. Although we do not sell motor vehicles, state regulatory authorities or third parties could take the position that some of the regulations applicable to dealers or to the manner in which motor vehicles are advertised and sold generally are directly applicable to our business. If our products and services are determined to not comply with relevant regulatory requirements, we or our TrueCar Certified Dealers could be subject to significant civil and criminal penalties, including fines, or the award of significant damages in class action or other civil litigation as well as orders interfering with our ability to continue providing our products and services in certain states. In addition, even absent such a determination, to the extent dealers are uncertain about the applicability of such laws and regulations to our business, we may lose, or have difficulty increasing the number of, TrueCar Certified Dealers in our network, which would affect our future growth.
Several states in which we do business have laws and regulations that strictly regulate or prohibit the brokering of motor vehicles or the making of so-called “bird-dog” payments by dealers to third parties in connection with the sale of motor vehicles through persons other than licensed salespersons. If our products or services are determined to fall within the scope of such laws or regulations, we may be forced to implement new measures, which could be costly, to reduce our exposure to those obligations, including the discontinuation of certain products or services in affected jurisdictions. Additionally, such a determination could subject us or our TrueCar Certified Dealers to significant civil or criminal penalties, including fines, or the award of significant damages in class action or other civil litigation.
In addition to generally applicable consumer protection laws, many states in which we do business have laws and regulations that specifically regulate the advertising for sale of new or used motor vehicles. These state advertising laws and regulations are frequently subject to multiple interpretations and are not uniform from state to state, sometimes imposing inconsistent requirements on the advertiser of a new or used motor vehicle. If the content displayed on the websites we operate is determined or alleged to be inaccurate or misleading, under motor vehicle advertising laws, generally applicable consumer protection laws, or otherwise, we could be subject to significant civil and criminal penalties, including fines, or the award of significant damages in class action or other civil litigation. Moreover, such allegations, even if unfounded or decided in our favor, could be extremely costly to defend, could require us to pay significant sums in settlements, and could interfere with our ability to continue providing our products and services in certain states.
From time to time, certain state authorities, dealer associations, and others have taken the position that aspects of our products and services violate state brokering, bird-dog, or advertising laws. When such allegations have arisen, we have endeavored to resolve the identified concerns on a consensual and expeditious basis, through negotiation and education efforts, without resorting to the judicial process. In certain instances, we have nevertheless been obligated to suspend all or certain aspects of our business operations in a state pending the resolution of such issues, the resolution of which included the payment of fines in 2011 and 2012 in the aggregate amount of approximately $26,000. For example, in the beginning of 2012, following implementation of our first nationwide television advertising campaign, state regulatory inquiries with respect to the compliance of our products and services with state brokering, bird-dog, and advertising laws intensified to a degree not previously experienced by
16
us. Responding to and resolving these inquiries, as well as our efforts to ameliorate the related adverse publicity and loss of TrueCar Certified Dealers from our network, resulted in decreased revenues and increased expenses and, accordingly, increased our losses during much of 2012.
In May 2015, we were named as a defendant in a lawsuit filed in the Superior Court for the County of Los Angeles (the “CNCDA Litigation”). The complaint, filed by the California New Car Dealers Association, seeks declaratory and injunctive relief based on allegations that we are operating in the State of California as an unlicensed automobile dealer and autobroker. For more information concerning the CNCDA Litigation, refer to the risk factor below, “We face litigation and are party to legal proceedings that could have a material adverse effect on our business, financial condition, results of operations and cash flows.”
In July 2015, we were named as a defendant in a lawsuit filed in the California Superior Court for the County of Los Angeles (the “Participating Dealer Litigation”). The complaint, filed by numerous dealers participating on the TrueCar platform, and as subsequently amended, sought declaratory and injunctive relief based on allegations that the Company is engaging in unfairly competitive practices and is operating as an unlicensed automobile dealer and autobroker in contravention of various state laws. On September 29, 2015, the plaintiffs voluntarily dismissed this lawsuit “without prejudice,” which means that the Participating Dealer Litigation is currently resolved, but that it could be re-filed at a later date. For more information concerning this lawsuit, refer to the risk factor below, “We face litigation and are party to legal proceedings that could have a material adverse effect on our business, financial condition, results of operations and cash flows.”
In September 2015, we received a letter from the Texas Department of Motor Vehicles (the “Texas DMV Notice”) asserting that certain aspects of our advertising in Texas constitute false, deceptive, unfair, or misleading advertising within the meaning of applicable Texas law. On September 24, 2015, we responded to the Texas DMV Notice in an effort to resolve the concerns raised by the Texas DMV Notice without making material, unfavorable adjustments to our business practices or user experience in Texas. In light of the fact that no further action has been taken with respect to this matter subsequent to our response to the Texas DMV Notice, we consider the issues raised by the Texas DMV Notice to be informally resolved, but we cannot assure you that this matter or similar matters will not reemerge in the future.
In December 2015, we were named as a defendant in a putative class action lawsuit filed by Gordon Rose in the California Superior Court for the County of Los Angeles (the “California Consumer Class Action”). The complaint asserts claims for unjust enrichment, violation of the California Consumer Legal Remedies Act, and violation of the California Business and Professions Code, based in part on allegations that we are operating in the State of California as an unlicensed automobile dealer and autobroker. The plaintiff seeks to represent a class of California consumers defined as “[a]ll California consumers who purchased an automobile by using TrueCar, Inc.’s price certificate during the applicable statute of limitations.” For more information concerning this lawsuit, refer to the risk factor below, “We face litigation and are party to legal proceedings that could have a material adverse effect on our business, financial condition, results of operations and cash flows.”
In July 2016, we received a letter from the Mississippi Motor Vehicle Commission (the “Mississippi MVC Letter”) asserting that an aspect of our advertising in Mississippi was not in compliance with a regulation adopted by the Mississippi Motor Vehicle Commission. On July 19, 2016 we responded to the Mississippi MVC Letter in an effort to resolve the concerns raised by the Mississippi MVC Letter without making material, unfavorable adjustments to our business practices or user experience in Mississippi. In light of the fact that no further action has been taken with respect to this matter subsequent to our response to the Mississippi MVC Letter, we consider the issues raised by the Mississippi MVC Letter to be informally resolved, but we cannot assure you that this matter or similar matters will not reemerge in the future.
In August 2016, we met with investigators from the California Department of Motor Vehicles (the “California DMV”) regarding an allegation made by a dealer that we were operating as an unlicensed automobile auction in California (the “Unlicensed Auction Allegation”). We provided the investigators with information about our business in an effort to resolve the concerns raised by the Unlicensed Auction Allegation. In October 2016, we were informally advised by an investigator for the California DMV that the concerns raised by the Unlicensed Auction Allegation had been resolved, but that the investigators will continue to evaluate our responses regarding certain matters related to the advertising of new motor vehicles. We cannot assure you that this matter or similar matters will not reemerge in the future.
If state regulators or other third parties take the position in the future that our products or services violate applicable brokering, bird-dog, or advertising laws or regulations, responding to such allegations could be costly, could require us to pay significant sums in settlements, could require us to pay civil and criminal penalties, including fines, could interfere with our ability to continue providing our products and services in certain states, or could require us to make adjustments to our products and services or the manner in which we derive revenue from our participating dealers, any or all of which could result in substantial adverse publicity, loss of TrueCar Certified Dealers from our network, decreased revenues, increased expenses, and decreased profitability.
17
Federal Advertising Regulations
The Federal Trade Commission, or the FTC, has authority to take actions to remedy or prevent advertising practices that it considers to be unfair or deceptive and that affect commerce in the United States. If the FTC takes the position in the future that any aspect of our business constitutes an unfair or deceptive advertising practice, responding to such allegations could require us to pay significant damages, settlements, and civil penalties, or could require us to make adjustments to our products and services, any or all of which could result in substantial adverse publicity, loss of participating dealers, lost revenues, increased expenses, and decreased profitability.
In March 2015, we were named as a defendant in a lawsuit filed in the U.S. District Court in the Southern District of New York (the “NY Lanham Act Litigation”). The complaint, purportedly filed on behalf of numerous automotive dealers who are not on the TrueCar platform, seeks injunctive relief in addition to over $250 million in damages based on allegations that we violated the Lanham Act as well as various state laws prohibiting unfair competition and deceptive acts or practices related to our advertising and promotional activities. For more information concerning the NY Lanham Act Litigation, refer to the risk factor below, “We face litigation and are party to legal proceedings that could have a material adverse effect on our business, financial condition, results of operations and cash flows.”
Federal Antitrust Laws
The antitrust laws prohibit, among other things, any joint conduct among competitors that would lessen competition in the marketplace. Some of the information that we obtain from dealers is competitively sensitive and, if disclosed inappropriately, could potentially be used by dealers to impede competition or otherwise diminish independent pricing activity. A governmental or private civil action alleging the improper exchange of information, or unlawful participation in price maintenance or other unlawful or anticompetitive activity, even if unfounded, could be costly to defend and adversely impact our ability to maintain and grow our dealer network.
In addition, governmental or private civil actions related to the antitrust laws could result in orders suspending or terminating our ability to do business or otherwise altering or limiting certain of our business practices, including the manner in which we handle or disclose dealer pricing information, or the imposition of significant civil or criminal penalties, including fines or the award of significant damages against us and our TrueCar Certified Dealers in class action or other civil litigation.
Other
The foregoing description of laws and regulations to which we are or may be subject is not exhaustive, and the regulatory framework governing our operations is subject to continuous change. The enactment of new laws and regulations or the interpretation of existing laws and regulations in an unfavorable way may affect the operation of our business, directly or indirectly, which could result in substantial regulatory compliance costs, civil or criminal penalties, including fines, adverse publicity, loss of participating dealers, lost revenues, increased expenses, and decreased profitability. Further, investigations by government agencies, including the FTC, into allegedly anticompetitive, unfair, deceptive or other business practices by us or our TrueCar Certified Dealers, could cause us to incur additional expenses and, if adversely concluded, could result in substantial civil or criminal penalties and significant legal liability.
We face litigation and are party to legal proceedings that could have a material adverse effect on our business, financial condition, results of operations and cash flows.
In March 2015, we were named as a defendant in the NY Lanham Act Litigation. The complaint in the NY Lanham Act Litigation, purportedly filed on behalf of numerous automotive dealers who are not on the TrueCar platform, alleges that we violated the Lanham Act as well as various state laws prohibiting unfair competition and deceptive acts or practices related to our advertising and promotional activities. The complaint seeks injunctive relief in addition to over $250 million in damages as a result of the alleged diversion of customers from the plaintiffs’ dealerships to TrueCar Certified Dealers. On April 7, 2015, we filed an answer to the complaint. Thereafter, the plaintiffs amended their complaint, and on July 13, 2015, we filed a motion to dismiss the amended complaint. On January 6, 2016, the Court granted in part and denied in part our motion to dismiss. The litigation is currently in the discovery phase. We believe that the portions of the amended complaint that survived our motion to dismiss are without merit, and we intend to vigorously defend ourselves in this matter. Based on the current stage of the proceedings in this case, the outcome of this legal proceeding, including the anticipated legal defense costs, remains uncertain; however, we may incur significant legal fees, settlements or damage awards resulting from this or other civil litigation. If this matter is not resolved in our favor, losses arising from the results of litigation or settlements, as well as ongoing defense costs, could have a material adverse effect on our business, financial condition, results of operations and cash flows.
18
In May 2015, we were named as a defendant in the CNCDA Litigation. The complaint in the CNCDA Litigation seeks declaratory and injunctive relief based on allegations that we are operating in the State of California as an unlicensed automobile dealer and autobroker. On July 20, 2015, we filed a "demurrer" to the complaint, which is a pleading that requests the court to dismiss the case. The plaintiffs subsequently amended their complaint, and on September 11, 2015, we filed a demurrer to the amended complaint. On December 7, 2015, the Court granted our demurrer in its entirety, but afforded the CNCDA the opportunity to file a second amended complaint. The CNCDA filed a second amended complaint on January 4, 2016. The second amended complaint reiterates the claims in the prior complaints and adds claims under theories based on the federal Lanham Act and California unfair competition law. On February 3, 2016, we filed a demurrer to the second amended complaint. On March 30, 2016, the Court granted in part and denied in part our demurrer to the second amended complaint, dismissing the Lanham Act claim but declining to dismiss the balance of the claims at the demurrer stage of the litigation. On May 31, 2016, based on certain intervening developments in state law, the Court announced that it would reconsider its March 30, 2016 order, and it invited the parties to file new briefs on the demurrer issues. On July 15, 2016, the Court heard oral argument on reconsideration of the demurrer issues. On July 25, 2016, the Court granted in part and denied in part the Company’s demurrer to the second amended complaint, just as it had done in its March 30, 2016 order. The litigation is currently in the discovery phase and is currently scheduled for trial in August 2017. We believe that the portions of the second amended complaint that survived the Court’s reconsideration of our demurrer are without merit, and we intend to vigorously defend ourselves in this matter. Based on the current stage of the proceedings in this case, the outcome of this legal proceeding, including the anticipated legal defense costs, remains uncertain; however, we may incur significant legal fees, settlements or damage awards resulting from this or other civil litigation. If this matter is not resolved in our favor, losses arising from the results of litigation or settlements, as well as ongoing defense costs, could have a material adverse effect on our business, financial condition, results of operations and cash flows.
In May 2015, a purported securities class action complaint was filed in the U.S. District Court for the Central District of California (the “Federal Securities Litigation”) by Satyabrata Mahapatra naming TrueCar and two other individuals not affiliated with TrueCar as defendants. On June 15, 2015, the plaintiff filed a Notice of Errata and Correction purporting to name Scott Painter and Michael Guthrie as individual defendants in lieu of the two individual defendants named in the complaint. On October 5, 2015, the plaintiffs amended their complaint. As amended, the complaint in the Federal Securities Litigation seeks an award of unspecified damages, interest and attorneys' fees based on allegations that the defendants made false and/or misleading statements, and failed to disclose material adverse facts about TrueCar’s business, operations, prospects and performance. Specifically, the amended complaint alleges that during the putative class period, the defendants made false and/or misleading statements and/or failed to disclose that: (i) TrueCar’s business practices violated unfair competition and deceptive trade practice laws (i.e., the issues raised in the NY Lanham Act Litigation); (ii) TrueCar acts as a dealer and broker in car sales transactions without proper licensing, in violation of various states’ laws that govern car sales (i.e., the issues raised in the CNCDA Litigation); and (iii) as a result of the above, TrueCar’s registration statements, prospectuses, quarterly and annual reports, financial statements, SEC filings, press releases, and other statements and documents were materially false and misleading at times relevant to the amended complaint and putative class period. The amended complaint asserts a putative class period stemming from May 16, 2014 to July 23, 2015. On October 19, 2015, we filed a motion to dismiss the amended complaint. On December 9, 2015, the Court granted our motion to dismiss and dismissed the case in its entirety. On January 8, 2016, the plaintiff filed a notice of appeal. On June 20, 2016, the plaintiff filed a motion for voluntary dismissal of the appeal. The motion was granted by the Court on June 27, 2016. As this case has been dismissed, we do not anticipate a loss related to this matter. However, if similar litigation is filed against us, we may incur significant legal fees, adverse changes in our dealer network, settlements or damage awards as a result. If any such matters are not resolved in our favor, losses arising from the results of litigation or settlements, as well as ongoing defense costs or adverse changes in our dealer network, could have a material adverse effect on our business, financial condition, results of operations and cash flows.
In July 2015, we were named as a defendant in the Participating Dealer Litigation. Both as originally filed and as subsequently amended, the complaint in the Participating Dealer Litigation sought declaratory and injunctive relief based on allegations that the Company is engaging in unfairly competitive practices and is operating as an unlicensed automobile dealer and autobroker in contravention of various state laws. Neither the original nor amended complaint sought an award of money damages. On September 29, 2015, the plaintiffs voluntarily dismissed this lawsuit “without prejudice,” which means that the Participating Dealer Litigation is currently resolved, but that it could be re-filed at a later date. If the Participating Dealer Litigation is re-filed at a later date or if similar litigation is filed against us, we may incur significant legal fees, adverse changes in our dealer network, settlements or damage awards as a result. If any such matters are not resolved in our favor, losses arising from the results of litigation or settlements, as well as ongoing defense costs or adverse changes in our dealer network, could have a material adverse effect on our business, financial condition, results of operations and cash flows.
In August 2015, the Company, certain of its executives and directors, and the underwriters of the Company’s initial public offering and secondary offering were named as defendants in a putative class action lawsuit filed by Ning Shen and William Fitzpatrick in California Superior Court under the federal securities laws (the “California State Court Securities Litigation”). The complaint alleged that TrueCar’s registration statements in connection with the offerings contained false or misleading statements
19
of material facts, and failed to disclose material adverse facts about the Company’s business, operations, prospects, and performance. On September 2, 2015, following our removal of the action from California state court to the U.S. District Court for the Central District of California, the plaintiffs voluntarily dismissed this lawsuit “without prejudice,” which means that the California State Court Securities Litigation is currently resolved, but that it could be re-filed at a later date. If the California State Court Securities Litigation is re-filed at a later date or if additional similar litigation, such as the Federal Securities Litigation, is filed against us, we may incur significant legal fees, settlements or damage awards as a result. If any such matters are not resolved in our favor, losses arising from the results of litigation or settlements, as well as ongoing defense costs, could have a material adverse effect on our business, financial condition, results of operations and cash flows.
In December 2015, we were named as a defendant in a putative class action lawsuit filed by Gordon Rose in the California Superior Court for the County of Los Angeles (the “California Consumer Class Action”). The complaint asserted claims for unjust enrichment, violation of the California Consumer Legal Remedies Act, and violation of the California Business and Professions Code, based principally on factual allegations similar to those asserted in the NY Lanham Act Litigation and the CNCDA Litigation. In the complaint, the plaintiff sought to represent a class of California consumers defined as “[a]ll California consumers who purchased an automobile by using TrueCar, Inc.’s price certificate during the applicable statute of limitations.” On January 12, 2016, the Court entered an order staying all proceedings in the case pending an initial status conference, which was previously scheduled for April 13, 2016. On March 16, 2016, the case was reassigned to a different judge. As a result of that reassignment, the initial status conference was rescheduled for and held on May 26, 2016. By stipulation, the stay of discovery has been continued until a second status conference, which was scheduled for October 12, 2016. On July 13, 2016, the plaintiff amended his complaint. The amended complaint continues to assert claims for unjust enrichment, violation of the California Consumer Legal Remedies Act, and violation of the California Business and Professions Code. The amended complaint retains the same proposed class definition as the initial complaint. Like the initial complaint, the amended complaint seeks an award of unspecified damages, interest, disgorgement, injunctive relief, and attorneys’ fees. On September 12, 2016, the Company filed a demurrer to the amended complaint. On October 12, 2016, the Court heard oral argument on the demurrer. On October 13, 2016, the Court granted in part and denied in part the Company’s demurrer to the amended complaint, dismissing the unjust enrichment claim but declining to dismiss the balance of the claims at the demurrer stage of the litigation. At a status conference held on January 26, 2017, the Court ruled that discovery may proceed regarding matters related to class certification only at this time. We believe that the amended complaint is without merit, and we intend to vigorously defend ourselves in this matter. Based on the current stage of the proceedings in this case, the outcome of this legal proceeding, including the anticipated legal defense costs, remains uncertain; however, we may incur significant legal fees, settlements or damage awards resulting from this or other civil litigation. If this matter is not resolved in our favor, losses arising from the results of litigation or settlements, as well as ongoing defense costs, could have a material adverse effect on our business, financial condition, results of operations and cash flows.
As a public company, we face the risk of shareholder lawsuits, particularly if we experience declines in the price of our common stock. In the past, following periods of volatility in the overall market and the market prices of a particular company’s securities, securities class action lawsuits have often been instituted against affected companies, and as noted immediately above, such lawsuits have been instituted against us in the form of the Federal Securities Litigation and the California State Court Securities Litigation. Additional lawsuits of this type or similar types, if instituted against us or one or more of our officers or directors, whether arising from alleged facts the same as, similar to, or different from those alleged in the Federal Securities Litigation or the California State Court Securities Litigation, could result in significant legal fees, settlements, or damage awards, as well as the diversion of our management’s attention and resources, and thus could have a material adverse effect on our business, financial condition, results of operations and cash flows.
We will incur significant legal fees in our defense of the NY Lanham Act Litigation, the CNCDA Litigation and the California Consumer Class Action, and we may incur fees associated with additional lawsuits that may be filed against us or one or more of our officers or directors hereafter. The legal fees arising from any or all of these matters could have a material adverse effect on our financial condition, results of operations and cash flows
We participate in a highly competitive market, and pressure from existing and new companies may adversely affect our business and operating results.
We face significant competition from companies that provide listings, information, lead generation, and car-buying services designed to reach consumers and enable dealers to reach these consumers.
Our competitors offer various products and services that compete with us. Some of these competitors include:
• | Internet search engines and online automotive sites such as Google, AutoTrader.com, eBay Motors, Edmunds.com, KBB.com, Autobytel.com and Cars.com; |
20
• | sites operated by automobile manufacturers such as General Motors and Ford; |
• | providers of offline, membership-based car-buying services such as the Costco Auto Program; and |
• | offline automotive classified listings, such as trade periodicals and local newspapers. |
We compete with many of the above-mentioned companies and other companies for a share of car dealers’ overall marketing budget for online and offline media marketing spend. To the extent that car dealers view alternative marketing and media strategies to be superior to TrueCar, we may not be able to maintain or grow the number of TrueCar Certified Dealers and our TrueCar Certified Dealers may sell fewer cars to users of our platform, and our business, operating results and financial condition will be harmed.
We also expect that new competitors will continue to enter the automotive retail industry with competing products and services, which could have an adverse effect on our revenue, business and financial results.
Our competitors could significantly impede our ability to expand and optimize our network of TrueCar Certified Dealers and to reach consumers. Our competitors may also develop and market new technologies that render our existing or future products and services less competitive, unmarketable or obsolete. In addition, if our competitors develop products or services with similar or superior functionality to our solutions, we may need to decrease the prices for our solutions in order to remain competitive. If we are unable to maintain our current pricing structure due to competitive pressures, our revenue will be reduced and our operating results will be negatively affected.
Our current and potential competitors may have significantly more financial, technical, marketing and other resources than we have, and the ability to devote greater resources to the development, promotion, and support of their products and services. Additionally, they may have more extensive automotive industry relationships than we have, longer operating histories and greater name recognition. As a result, these competitors may be better able to respond more quickly with new technologies and to undertake more extensive marketing or promotional campaigns. In addition, to the extent any of our competitors have existing relationships with dealers or automobile manufacturers for marketing or data analytics solutions, those dealers and automobile manufacturers may be unwilling to continue to partner with us. If we are unable to compete with these companies, the demand for our products and services could substantially decline.
In addition, if one or more of our competitors were to merge or partner with another of our competitors, the change in the competitive landscape could adversely affect our ability to compete effectively. Our competitors may also establish or strengthen cooperative relationships with our current or future third-party data providers, technology partners, or other parties with whom we have relationships, thereby limiting our ability to develop, improve, and promote our solutions. We may not be able to compete successfully against current or future competitors, and competitive pressures may harm our revenue, business and financial results.
We rely, in part, on Internet search engines to drive traffic to our website, and if we fail to appear prominently in the search results, our traffic would decline and our business would be adversely affected.
We depend in part on Internet search engines such as Google, Bing, and Yahoo! to drive traffic to our website. For example, when a user types an automobile into an Internet search engine, we rely on a high organic search ranking of our webpages in these search results to refer the user to our website. However, our ability to maintain high, non-paid search result rankings is not within our control. Our competitors’ Internet search engine optimization efforts may result in their websites receiving a higher search result page ranking than ours, or Internet search engines could revise their methodologies in a way that would adversely affect our search result rankings. If Internet search engines modify their search algorithms in ways that are detrimental to us, or if our competitors’ efforts are more successful than ours, overall growth in our user base could slow or our user base could decline. Internet search engine providers could provide automobile dealer and pricing information directly in search results, align with our competitors or choose to develop competing services. Our website has experienced fluctuations in search result rankings in the past, and we anticipate similar fluctuations in the future. Any reduction in the number of users directed to our website through Internet search engines could harm our business and operating results.
The failure to maintain our brand would harm our ability to grow unique visitor traffic and to expand our dealer network.
Maintaining and enhancing the TrueCar brand largely depends on the success of our efforts to maintain the trust of our users and TrueCar Certified Dealers and to deliver value to each of our users and TrueCar Certified Dealers. If our existing or potential users perceive that we are not focused primarily on providing them with a better car-buying experience or if dealers do not perceive TrueCar as offering a compelling value proposition, our reputation and the strength of our brand will be adversely affected.
21
Complaints or negative publicity about our business practices, our marketing and advertising campaigns, our compliance with applicable laws and regulations, the integrity of the data that we provide to users, data privacy and security issues, and other aspects of our business, irrespective of their validity, could diminish users’ and dealers’ confidence in and use of our products and services and adversely affect our brand. These concerns could also diminish the trust of existing and potential affinity group marketing partners. There can be no assurance that we will be able to maintain or enhance our brand, and failure to do so would harm our business growth prospects and operating results.
Our ability to enhance our current product offerings, or grow complementary product offerings, may be limited, which could negatively impact our growth rate, revenues and financial performance.
As we introduce new offerings or enhance existing products and services on our platform we may incur losses or otherwise fail to enter these markets successfully. Our expansion into these markets may place us in competitive and regulatory environments with which we are unfamiliar and involves various risks, including the need to invest significant resources and the possibility that returns on such investments will not be achieved for several years, if at all. In attempting to establish our new product offerings we expect to incur significant expenses and face various other challenges, such as expanding our sales force and technology teams or management personnel to cover these markets and complying with complicated regulations that may apply to these markets. In addition, we may not successfully demonstrate the value of these expanded or complementary products to consumers, and failure to do so would compromise our ability to successfully expand our user experience and could harm our growth rate, revenue and operating performance.
Our business is subject to risks related to the larger automotive ecosystem, including consumer demand, global supply chain challenges and other macroeconomic issues.
Decreases in consumer demand could adversely affect the market for automobile purchases and, as a result, reduce the number of consumers using our platform. Consumer purchases of new and used automobiles generally decline during recessionary periods and other periods in which disposable income is adversely affected. For example, the number of new vehicle sales in the United States decreased from approximately 16.1 million in 2007 to approximately 10.4 million in 2009, according to the Bureau of Economic Analysis. Various economic uncertainties, including stock market and commodity pricing volatility, could lead to such a downturn that may impact our business. Purchases of new and used automobiles are typically discretionary for consumers and have been, and may continue to be, affected by negative trends in the economy, including the cost of energy and gasoline, the availability and cost of credit, reductions in business and consumer confidence, stock market volatility and increased unemployment. A reduction in the number of automobiles purchased by consumers could adversely affect automobile dealers and car manufacturers and lead to a reduction in other spending by these constituents, including targeted incentive programs. In addition, our business may be negatively affected by challenges to the larger automotive ecosystem, including global supply chain challenges, such as those resulting from the Japanese tsunami in 2011 and other macroeconomic issues. The foregoing could have a material adverse effect on our business, results of operations and financial condition.
We may fail to respond adequately to changes in technology and consumer demands that could lead to decreased demand for automobiles.
In recent years the market for motor vehicles has been characterized by rapid changes in technology and consumer demands. Self-driving technology, ride sharing, transportation networks and other fundamental changes in automotive and transportation could have a substantial impact on consumer demand for the purchase or lease of automobiles. If we fail to respond adequately to a decline in the demand for automobile purchases, it could have a material adverse effect on our business, growth, operating results, financial condition and prospects.
Our unique visitors, revenue and operating results fluctuate due to seasonality.
Our revenue trends are a reflection of consumers’ car buying patterns. Across the automotive industry, consumers tend to purchase a higher volume of cars in the second and third quarters of each year, due in part to the introduction of new vehicle models from manufacturers. In the past, these seasonal trends have not been pronounced due the overall growth of our business, but we expect that in the future our revenues will be affected by these seasonal trends. Our business will also be impacted by cyclical trends affecting the overall economy, specifically the retail automobile industry, as well as by actual or threatened severe weather events.
22
We may require additional capital to pursue our business objectives and respond to business opportunities, challenges or unforeseen circumstances. If capital is not available to us, our operating results, business, and financial condition may be harmed.
Since our founding, we have raised substantial equity and debt financing to support the growth of our business. Because we intend to continue to make investments to support the growth of our business, we may require additional capital to pursue our business objectives and respond to business opportunities, challenges or unforeseen circumstances, including to increase our marketing expenditures to improve our brand awareness, develop new products or services or further improve existing products and services, enhance our operating infrastructure and acquire complementary businesses and technologies. Accordingly, we may need to engage in equity or debt financings to secure additional funds. However, additional funds may not be available when we need them, on terms that are acceptable to us, or at all. In addition, our current revolving credit facility contains restrictive covenants relating to our capital raising activities and other financial and operational matters, and any debt financing that we secure in the future could involve further restrictive covenants which may make it more difficult for us to obtain additional capital and to pursue business opportunities. Volatility in the credit markets may also have an adverse effect on our ability to obtain debt financing.
If we raise additional funds through further issuances of equity or convertible debt securities, our existing stockholders could suffer significant dilution, and any new equity securities we issue could have rights, preferences and privileges superior to those of holders of our common stock. If we are unable to obtain adequate financing or financing on terms satisfactory to us, when we require it, our ability to continue to pursue our business objectives and to respond to business opportunities, challenges or unforeseen circumstances could be significantly limited, and our business, operating results, financial condition and prospects could be adversely affected.
We collect, process, store, share, disclose and use personal information and other data, and our actual or perceived failure to protect such information and data could damage our reputation and brand and harm our business and operating results.
We collect, process, store, share, disclose and use personal information and other data provided by consumers and dealers. We rely on encryption and authentication technology licensed from third parties to effect secure transmission of such information. We may need to expend significant resources to protect against security breaches or to address problems caused by breaches. Any failure or perceived failure to maintain the security of personal and other data that is provided to us by consumers and dealers could harm our reputation and brand and expose us to a risk of loss or litigation and possible liability, any of which could harm our business and operating results.
In addition, from time to time, concerns have been expressed about whether our products, services, or processes compromise the privacy of our users. Concerns about our practices with regard to the collection, use or disclosure of personal information or other privacy-related matters, even if unfounded, could harm our business and operating results.
There are numerous federal, state and local laws around the world regarding privacy and the collection, processing, storing, sharing, disclosing, using and protecting of personal information and other data, the scope of which are changing, subject to differing interpretations, and which may be costly to comply with and may be inconsistent between countries and jurisdictions or conflict with other rules. We generally comply with industry standards and are subject to the terms of our privacy policies and privacy-related obligations to third parties. We strive to comply with all applicable laws, policies, legal obligations and industry codes of conduct relating to privacy and data protection, to the extent possible. However, it is possible that these obligations may be interpreted and applied in new ways or in a manner that is inconsistent from one jurisdiction to another and may conflict with other rules or our practices or that new regulations could be enacted. Any failure or perceived failure by us to comply with our privacy policies, our privacy-related obligations to consumers or other third parties, or our privacy-related legal obligations, or any compromise of security that results in the unauthorized release or transfer of sensitive information, which may include personally identifiable information or other user data, may result in governmental enforcement actions, litigation or public statements against us by consumer advocacy groups or others and could cause consumers and automobile dealers to lose trust in us, which could have a material adverse effect on our business. Additionally, if vendors, developers or other third parties that we work with violate applicable laws or our policies, such violations may also put consumer or dealer information at risk and could in turn harm our reputation, business and operating results.
A significant disruption in service on our website or of our mobile applications could damage our reputation and result in a loss of consumers, which could harm our business, brand, operating results, and financial condition.
Our brand, reputation and ability to attract consumers, affinity groups and advertisers depend on the reliable performance of our technology platform and content delivery. We may experience significant interruptions with our systems. Interruptions in
23
these systems, whether due to system failures, computer viruses, denial-of-service attacks or physical or electronic break-ins, could affect the security or availability of our products and services on our website and mobile application, and prevent or inhibit the ability of consumers to access our products and services. Problems with the reliability or security of our systems or with the upgrading and architectural unification of those system could harm our reputation, result in a loss of consumers, dealers and affinity group marketing partners, and result in additional costs. In addition, a significant disruption in our billing systems could affect our ability to match automobile purchases with users that obtained a Guaranteed Savings Certificate and delay or prevent us from submitting invoices to TrueCar Certified Dealers, receiving payment for such invoices and recognizing revenue related to such purchases.
Although we are developing a unified architecture, our systems currently employ multiple software platforms. As we upgrade our system architecture we may encounter challenges that could impact our business, and our ability to quickly change aspects of our consumer and dealer experiences may be limited. During the third quarter of 2016 we began hosting certain of our systems using an enterprise cloud computing provider; however, a substantial portion of the computer hardware and communications and network infrastructure used to operate our website, mobile applications and billing systems continues to be located at co-location facilities in Los Angeles and Chicago. Although we have two locations, our systems are not fully redundant. In addition, we do not own or control the operation of these facilities. Our systems and operations are vulnerable to damage or interruption from fire, flood, power loss, telecommunications failure, terrorist attacks, acts of war, denial-of-service attacks, electronic and physical break-ins, computer viruses, earthquakes, and similar events. The occurrence of any of these events could result in damage to our systems and hardware or could cause them to fail.
Problems faced by our third-party web hosting providers could adversely affect the experience of our consumers and dealers. Such providers could close their facilities without adequate notice. Any financial difficulties, up to and including bankruptcy, faced by our third-party web hosting providers or any of the service providers with whom they contract may have negative effects on our business, the nature and extent of which are difficult to predict. If our third-party web hosting providers are unable to keep up with our growing capacity needs, our business could be harmed.
Any errors, defects, disruptions, or other performance or reliability problems with our network operations could cause interruptions in access to our products as well as delays and additional expense in arranging new facilities and services and could harm our reputation, business, operating results, and financial condition.
We have begun utilizing an enterprise cloud computing provider to operate certain aspects of our service and any disruption of or interference with our use of these operations could adversely affect our business operations and financial results.
We utilize a cloud-based computing platform operated by a third party in connection with certain aspects of our business operations. We are in the process of architecting our software and computer systems so as to utilize cloud-based data processing, storage capabilities and other cloud-based services. As of the end of 2016, a portion of our computing processes are cloud-based, and we are working to significantly increase our use of enterprise cloud services. As a result, now and increasingly going forward, any disruption of or interference with the use of these cloud services, including disruptions due to system failures, denial-of-service or other cyberattacks and computer viruses, or an interruption to the third-party systems or in the infrastructure which allows us to connect to the third-party systems for an extended period, may impact our ability to operate the business and could adversely impact our operations and our business.
Failure to adequately protect our intellectual property could harm our business and operating results.
Our business depends on our intellectual property, the protection of which is crucial to the success of our business. We rely on a combination of patent, trademark, trade secret and copyright law and contractual restrictions to protect our intellectual property. In addition, we attempt to protect our intellectual property, technology, and confidential information by requiring our employees and consultants to enter into confidentiality and assignment of inventions agreements and third parties to enter into nondisclosure agreements. These agreements may not effectively prevent unauthorized use or disclosure of our confidential information, intellectual property, or technology and may not provide an adequate remedy in the event of unauthorized use or disclosure of our confidential information, intellectual property, or technology. Despite our efforts to protect our proprietary rights, unauthorized parties may attempt to copy aspects of our website features, software, and functionality or obtain and use information that we consider proprietary.
Competitors may adopt service names similar to ours, thereby harming our ability to build brand identity and possibly leading to user confusion. In addition, there could be potential trade name or trademark infringement claims brought by owners of other registered trademarks or trademarks that incorporate variations of the term “TrueCar.”
24
We currently hold the “TrueCar.com” and “True.com” Internet domain names as well as various other related domain names. The regulation of domain names in the United States is subject to change. Regulatory bodies could establish additional top-level domains, appoint additional domain name registrars, or modify the requirements for holding domain names. As a result, we may not be able to acquire or maintain all domain names that use the name TrueCar.
We may in the future be subject to intellectual property disputes, which are costly to defend and could harm our business and operating results.
We may from time to time face allegations that we have infringed the trademarks, copyrights, patents and other intellectual property rights of third parties, including from our competitors or non-practicing entities.
Patent and other intellectual property litigation may be protracted and expensive, and the results are difficult to predict and may require us to stop offering some features, purchase licenses or modify our products and features while we develop non-infringing substitutes or may result in significant settlement costs.
In addition, we use open source software in our products and will use open source software in the future. From time to time, we may face claims against companies that incorporate open source software into their products, claiming ownership of, or demanding release of, the source code, the open source software or derivative works that were developed using such software, or otherwise seeking to enforce the terms of the applicable open source license. These claims could also result in litigation, require us to purchase a costly license or require us to devote additional research and development resources to change our platform or services, any of which would have a negative effect on our business and operating results.
Even if these matters do not result in litigation or are resolved in our favor or without significant cash settlements, these matters, and the time and resources necessary to litigate or resolve them, could harm our business, our operating results and our reputation.
Complying with the laws and regulations affecting public companies has increased our costs and the demands on management and could harm our operating results.
As a public company, we incur significant legal, accounting, and other expenses that we did not incur as a private company and these expenses will increase after we cease to be an “emerging growth company.” In addition, the Sarbanes-Oxley Act and rules implemented by the SEC and NASDAQ impose various requirements on public companies, including requiring changes in corporate governance practices. Our management and other personnel devote a substantial amount of time to these compliance initiatives. Moreover, these rules and regulations have increased and will continue to increase our legal, accounting, and financial compliance costs and have made and will continue to make some activities more time consuming and costly. For example, these rules and regulations make it more difficult and more expensive for us to obtain director and officer liability insurance, and we may be required to accept reduced policy limits and coverage or to incur substantial costs to maintain the same or similar coverage. These rules and regulations could also make it more difficult for us to attract and retain qualified persons to serve on our board of directors or our board committees or as executive officers.
As an “emerging growth company” we are currently exempt from the requirement to comply with the auditor attestation requirements of Section 404 of the Sarbanes-Oxley Act (“Section 404”). When our independent registered public accounting firm is required to undertake an assessment of our internal control over financial reporting, the cost of our compliance with Section 404 will correspondingly increase. Our compliance with applicable provisions of Section 404 requires that we incur substantial accounting expense and expend significant management time on compliance-related issues as we implement additional corporate governance practices and comply with reporting requirements. Moreover, if we or our independent registered public accounting firm identifies deficiencies in our internal control over financial reporting that are deemed to be material weaknesses, the market price of our stock could decline and we could be subject to sanctions or investigations by the SEC or other regulatory authorities, which would require additional financial and management resources.
Furthermore, investor perceptions of our company may suffer if, in the future, material weaknesses are found, and this could cause a decline in the market price of our stock. Irrespective of compliance with Section 404, any failure of our internal control over financial reporting could have a material adverse effect on our stated operating results and harm our reputation. If we are unable to implement these changes effectively or efficiently, it could harm our operations, financial reporting, or financial results and could result in an adverse opinion on internal control from our independent registered public accounting firm.
25
We may acquire other companies or technologies, which could divert our management’s attention, result in additional dilution to our stockholders and otherwise disrupt our operations and harm our operating results.
Our success will depend, in part, on our ability to grow our business in response to the demands of consumers, dealers and other constituents within the automotive industry as well as competitive pressures. In some circumstances, we may determine to do so through the acquisition of complementary businesses and technologies rather than through internal development, such as our acquisition of ALG in 2011. The identification of suitable acquisition candidates can be difficult, time-consuming, and costly, and we may not be able to successfully complete identified acquisitions. The risks we face in connection with acquisitions include:
• | diversion of management time and focus from operating our business to addressing acquisition integration challenges; |
• | coordination of technology, research and development and sales and marketing functions; |
• | transition of the acquired company’s users to our website and mobile applications; |
• | retention of employees from the acquired company; |
• | cultural challenges associated with integrating employees from the acquired company into our organization; |
• | integration of the acquired company’s accounting, management information, human resources, and other administrative systems; |
• | the need to implement or improve controls, procedures, and policies at a business that prior to the acquisition may have lacked effective controls, procedures, and policies; |
• | potential write-offs of intangibles or other assets acquired in such transactions that may have an adverse effect our operating results in a given period; |
• | liability for activities of the acquired company before the acquisition, including patent and trademark infringement claims, violations of laws, commercial disputes, tax liabilities, and other known and unknown liabilities; and |
• | litigation or other claims in connection with the acquired company, including claims from terminated employees, consumers, former stockholders, or other third parties. |
Our failure to address these risks or other problems encountered in connection with our past or future acquisitions and investments could cause us to fail to realize the anticipated benefits of these acquisitions or investments, cause us to incur unanticipated liabilities, and harm our business generally. Future acquisitions could also result in dilutive issuances of our equity securities, the incurrence of debt, contingent liabilities, amortization expenses, or the write-off of goodwill, any of which could harm our financial condition. Also, the anticipated benefits of any acquisitions may not materialize.
If our intangible assets and goodwill become impaired we may be required to record a significant non-cash charge to earnings which would materially and adversely affect our results of operations.
We had goodwill and intangible assets of $73.0 million at December 31, 2016. Under accounting principles generally accepted in the United States, we review our goodwill for impairment annually in the fourth quarter of each fiscal year, or more frequently if events or changes in circumstances indicate the carrying value may not be fully recoverable. We review our intangible assets for impairment whenever events or changes in circumstances indicate that the carrying amounts may not be recoverable. While we have not recognized any impairment charges since our inception, we may recognize impairment charges in future periods in connection with our acquisitions or from other businesses we may seek to acquire in the future. The carrying value of our goodwill and intangible assets may not be recoverable due to factors such as a decline in our stock price and market capitalization, reduced estimates of future revenues or cash flows or slower growth rates in our industry. Estimates of future revenues and cash flows are based on a long-term financial outlook of our operations. Actual performance in the near-term or long-term could be materially different from these forecasts, which could impact future estimates and the recorded value of the intangibles. For example, a significant, sustained decline in our stock price and market capitalization may result in impairment of our intangible assets, including goodwill, and a significant charge to earnings in our consolidated financial statements during the period in which an impairment is determined to exist. In the event we had to reduce the carrying value of our goodwill or intangible assets, any such impairment charge could materially and adversely affect our results of operations.
If our ability to use our net operating loss carryforwards and other tax attributes is limited, we may not receive the benefit of those assets.
We had federal net operating loss carryforwards of approximately $250.2 million and state net operating loss carryforwards of approximately $176.5 million at December 31, 2016. The federal and state net operating loss carryforwards begin to expire in the years ending December 31, 2025 and 2017, respectively. At December 31, 2016, we had federal and state research
26
and development credit carryforwards of approximately $0.8 million and $0.4 million, respectively. The federal credit carryforwards begin to expire in the year ending December 31, 2028. The state credit carryforwards can be carried forward indefinitely.
The Internal Revenue Code of 1986, as amended, imposes substantial restrictions on the utilization of net operating losses and other tax attributes in the event of an “ownership change” of a corporation. Accordingly, our ability to use pre-change net operating loss and research tax credits may be limited as prescribed under Internal Revenue Code, or IRC, Sections 382 and 383. Therefore, if we generate taxable income in the future, our ability to reduce our federal income tax liability may be subject to limitation.
Events which may cause limitation in the amount of the net operating losses and credits that we utilize in any one year include, but are not limited to, a cumulative ownership change of more than 50% over a three-year period. As a result of historical equity issuances, we have determined that the annual utilization of our net operating losses and credits and tax credits may be limited pursuant to IRC Sections 382 and 383. Future changes in our stock ownership, including future equity offerings, as well as other changes that may be outside our control could potentially result in further limitations on our ability to utilize our net operating loss and credit carryforwards.
Risks Related to Ownership of Our Common Stock
We may fail to meet our publicly announced guidance or other expectations about our business and future operating results, which would cause our stock price to decline.
We have provided and may continue to provide guidance about our business and future operating results, including financial results for the quarter ending March 31, 2017, as well as the year ending December 31, 2017, as part of our press releases, investor conference calls or otherwise. In developing this guidance, our management must make certain assumptions and judgments about our future performance. For example, in the second quarter of 2015, our business results varied significantly from guidance for the quarter and the price of our common stock declined. Our future business results may vary significantly from management's guidance due to a number of factors, many of which are outside of our control, and which could materially and adversely affect our operations, financial condition and operating results. If our publicly announced guidance of future operating results fails to meet expectations of securities analysts, investors or other interested parties, the price of our common stock could decline.
Concentration of ownership among our existing executive officers, directors, their affiliates, and holders of 5% or more of our outstanding commons stock may prevent new investors from influencing significant corporate decisions.
As of December 31, 2016, our executive officers, directors, and holders of 5% or more of our outstanding common stock beneficially own, in the aggregate, approximately 76% of our outstanding shares of common stock. Some of these persons or entities may have interests that are different from yours. For example, these stockholders may support proposals and actions with which you may disagree or which are not in your interests. These stockholders are able to exercise a significant level of control over all matters requiring stockholder approval, including the election of directors, amendment of our certificate of incorporation, and approval of significant corporate transactions. This control could have the effect of delaying or preventing a change of control of our company or changes in management and will make the approval of certain transactions difficult or impossible without the support of these stockholders, which in turn could reduce the price of our common stock.
The price of our common stock has been and may continue to be volatile, and the value of your investment could decline.
The trading price of our common stock has been volatile since our initial public offering and is likely to continue to fluctuate substantially. The trading price of our common stock depends on a number of factors, including those described in this “Risk Factors” section, many of which are beyond our control and may not be related to our operating performance. These fluctuations could cause you to lose all or part of your investment in our common stock since you might be unable to sell your shares at or above the price you paid. Factors that could cause fluctuations in the trading price of our common stock include the following:
• | price and volume fluctuations in the overall stock market from time to time; |
• | volatility in the market prices and trading volumes of high technology stocks; |
• | changes in operating performance and stock market valuations of other technology companies generally, or those in our industry in particular; |
27
• | sales of shares of our common stock by us or our stockholders; |
• | failure of securities analysts to maintain coverage of us, changes in financial estimates by any securities analysts who follow our company, or our failure to meet these estimates or the expectations of investors; |
• | announcements by us or our competitors of new products; |
• | the public’s reaction to our press releases, other public announcements, and filings with the SEC; |
• | rumors and market speculation involving us or other companies in our industry; |
• | actual or anticipated changes in our operating results or fluctuations in our operating results; |
• | actual or anticipated developments in our business, our competitors’ businesses, or the competitive landscape generally; |
• | our ability to control costs, including our operating expenses; |
• | litigation involving us, our industry or both, or investigations by regulators into our operations or those of our competitors; |
• | developments or disputes concerning our intellectual property or other proprietary rights; |
• | announced or completed acquisitions of businesses or technologies by us or our competitors; |
• | new laws or regulations or new interpretations of existing laws or regulations applicable to our business; |
• | changes in accounting standards, policies, guidelines, interpretations, or principles; |
• | any significant change in our management; |
• | conditions in the automobile industry; and |
• | general economic conditions and slow or negative growth of our markets. |
The effect of such factors on the trading market for our stock may be enhanced by the lack of a large and established trading market for our stock. In addition, the stock market in general, and the market for technology companies in particular, have experienced extreme price and volume fluctuations that have often been unrelated or disproportionate to the operating performance of those companies. Broad market and industry factors may seriously affect the market price of our common stock, regardless of our actual operating performance. Additionally, as a public company, we face the risk of shareholder lawsuits, particularly if we experience declines in the price of our common stock. In the past, following periods of volatility in the overall market and the market prices of a particular company’s securities, securities class action lawsuits have often been instituted against affected companies. As described in the risk factor above entitled "We face litigation and are party to legal proceedings that could have a material adverse effect on our business, financial condition, results of operations and cash flows," two such lawsuits were instituted against us in the form of the Federal Securities Litigation and the California State Court Securities Litigation. Although both the Federal Securities Litigation and the California State Court Securities Litigation have been dismissed, additional lawsuits of this type or similar types, if instituted against us or one or more of our officers or directors, whether arising from alleged facts the same as, similar to, or different from those alleged in the Federal Securities Litigation and the California State Court Securities Litigation, could result in significant legal fees, settlements, or damage awards, as well as the diversion of our management’s attention and resources, and thus could have a material adverse effect on our business, financial condition, results of operations and cash flows.
Sales of substantial amounts of our common stock in the public markets, or the perception that such sales might occur, could depress the market price of our common stock.
The market price for our common stock could decline as a result of the sale of substantial amounts of our common stock, particularly sales by our directors, executive officers and significant stockholders, a large number of shares of our common stock becoming available for sale or the perception in the market that holders of a large number of shares intend to sell their shares. In January 2017, we filed a universal shelf registration statement on Form S-3 with the SEC which will enable us to offer and sell from time to time up to $100 million of securities of any combination of common stock, preferred stock, debt securities, warrants, depositary shares, subscription rights and/or units at prices and on terms that we may determine, and up to 20 million of shares of common stock to be offered and sold from time to time by selling stockholders (“2017 Shelf Registration”). The 2017 Shelf Registration was declared effective by the SEC on February 6, 2017. No offering under the 2017 Shelf Registration has been made or commenced. We may periodically offer one or more of these securities in amounts, prices and terms to be announced when and if the securities are offered. At the time any of the securities covered by the registration statement are offered for sale, a prospectus supplement will be prepared and filed with the SEC containing specific information about the terms of any such offering.
28
At December 31, 2016, approximately 86.2 million shares of our common stock were outstanding. In addition, as of December 31, 2016, there were 24.5 million shares underlying options and 4.3 million shares underlying restricted stock units. If these additional shares are sold, or if it is perceived that they will be sold in the public market, the trading price of our stock could decline. Under Rule 144, shares held by non-affiliates for more than six months may generally be sold without restriction, other than a current public information requirement, and may be sold freely without any restrictions after one year. Shares held by affiliates may also be sold under Rule 144, subject to applicable restrictions, including volume and manner of sale limitations.
Stockholders owning a substantial portion of our total outstanding shares are entitled, under contracts providing for registration rights and subject to some conditions, to require us to file registration statements covering their shares or to include their shares in registration statements that we may file for ourselves or our stockholders.
Anti-takeover provisions contained in our certificate of incorporation and bylaws, as well as provisions of Delaware law, could impair a takeover attempt.
Our certificate of incorporation, bylaws, and Delaware law contain provisions which could have the effect of rendering more difficult, delaying, or preventing an acquisition deemed undesirable by our board of directors. Our corporate governance documents include provisions:
• | creating a classified board of directors whose members serve staggered three-year terms; |
• | authorizing “blank check” preferred stock, which could be issued by our board of directors without stockholder approval and may contain voting, liquidation, dividend, and other rights superior to our common stock; |
• | limiting the liability of, and providing indemnification to, our directors and officers; |
• | limiting the ability of our stockholders to call and bring business before special meetings; |
• | requiring advance notice of stockholder proposals for business to be conducted at meetings of our stockholders and for nominations of candidates for election to our board of directors; |
• | controlling the procedures for the conduct and scheduling of board of directors and stockholder meetings; and |
• | providing our board of directors with the express power to postpone previously scheduled annual meetings and to cancel previously scheduled special meetings. |
These provisions, alone or together, could delay or prevent hostile takeovers and changes in control or changes in our management.
As a Delaware corporation, we are also subject to provisions of Delaware law, including Section 203 of the Delaware General Corporation law, which prevents some stockholders holding more than 15% of our outstanding common stock from engaging in certain business combinations without approval of the holders of substantially all of our outstanding common stock.
Any provision of our certificate of incorporation, bylaws or Delaware law that has the effect of delaying or deterring a change in control could limit the opportunity for our stockholders to receive a premium for their shares of our common stock, and could also affect the price that some investors are willing to pay for our common stock.
If securities or industry analysts do not publish or cease publishing research or reports about us, our business or our market, or if they change their recommendations regarding our stock adversely, our stock price and trading volume could decline.
The trading market for our common stock is influenced by the research and reports that industry or securities analysts may publish about us, our business, our market, or our competitors. If any of the analysts who may cover us change their recommendation regarding our stock adversely, or provide more favorable relative recommendations about our competitors, our stock price would likely decline. If any analyst who may cover us were to cease coverage of our company or fail to regularly publish reports on us, we could lose visibility in the financial markets, which in turn could cause our stock price or trading volume to decline.
We do not expect to declare any dividends in the foreseeable future.
We do not anticipate declaring any cash dividends to holders of our common stock in the foreseeable future. In addition, the terms of our credit facility currently prohibit us from paying cash dividends on our capital stock. Consequently, investors may
29
need to rely on sales of their common stock after price appreciation, which may never occur, as the only way to realize any future gains on their investment. Investors seeking cash dividends should not purchase our common stock.
Item 1B. Unresolved Staff Comments
None.
Item 2. Properties
We maintain our principal offices in Santa Monica, California. We currently lease approximately 38,000 square feet at 120 Broadway in Santa Monica, under a lease that expires in December 2025, and approximately 34,000 square feet at 1401 Ocean Avenue in Santa Monica that expires in 2029. We maintain additional leased spaces in several other Santa Monica locations as well as spaces in San Francisco, California, Austin, Texas, and Denver, Colorado. We believe that our facilities are adequate to meet our needs for the immediate future, and that should it be needed, we will be able to secure additional space to accommodate any such expansion of our operations.
Item 3. Legal Proceedings
Refer to the disclosure under the heading “Legal Proceedings” in Note 6 “Commitments and Contingencies” to our annual consolidated financial statements included in Part II, Item 8 of this report for legal proceedings, which disclosure is incorporated by reference into this Item 3 of Part I.
Item 4. Mine Safety Disclosures
Not applicable.
30
PART II
Item 5. Market for Registrant’s Common Equity, Related Stockholder Matters and Issuer Purchases of Equity Securities
Market Information for Common Stock
Our common stock has been listed on The NASDAQ Global Select Market under the symbol “TRUE” since May 16, 2014. Our initial public offering was priced at $9.00 per share. Prior to that date, there was no public trading market for our common stock. The following table sets forth for the periods indicated the high and low sale prices per share of our common stock as reported on The NASDAQ Global Select Market:
Year Ended December 31, 2016 | Year Ended December 31, 2015 | ||||||||||||||
High | Low | High | Low | ||||||||||||
First Quarter | $ | 9.47 | $ | 4.42 | $ | 23.10 | $ | 15.92 | |||||||
Second Quarter | $ | 7.98 | $ | 5.13 | $ | 17.99 | $ | 11.85 | |||||||
Third Quarter | $ | 11.13 | $ | 7.63 | $ | 12.12 | $ | 4.01 | |||||||
Fourth Quarter | $ | 13.29 | $ | 8.47 | $ | 9.88 | $ | 4.97 | |||||||
Holders of Record
As of February 23, 2017, there were 163 holders of record of our common stock. The actual number of stockholders is greater than this number of record holders and includes stockholders who are beneficial owners but whose shares are held in street name by brokers and other nominees. This number of holders of record also does not include stockholders whose shares may be held in trust by other entities.
Dividend Policy
We have never declared or paid cash dividends on our common stock. We currently intend to retain all available funds and any future earnings for use in the operation of our business and do not anticipate paying any dividends on our common stock in the foreseeable future. Any future determination to declare dividends will be made at the discretion of our board of directors and will depend on our financial condition, operating results, capital requirements, general business conditions, any restrictions on paying dividends, including the current restriction on our ability to pay dividends under our credit facility, and other factors that our board of directors may deem relevant.
Purchases of Equity Securities by the Issuer and Affiliated Purchasers
None.
Securities Authorized for Issuance Under Equity Compensation Plans
See Note 8 of the consolidated financial statements herein regarding information about securities authorized for issuance under our equity compensation plans.
Sales of Unregistered Securities
None.
Use of Proceeds from Public Offerings of Common Stock
Our initial public offering of common stock was effected through a Registration Statement on Form S-1 (File No. 333-195036), which was declared or became effective on May 15, 2014. There has been no material change in the planned use of proceeds from our initial public offering as described in our final prospectus filed with the SEC on May 15, 2014 pursuant to Rule 424(b) of the Securities Act and other periodic reports previously filed with the SEC.
On November 17, 2014, we closed a follow-on public offering of 7,362,991 shares of common stock, which included 1,960,390 shares of common stock sold by us and 5,402,601 shares of common stock sold by selling stockholders. The public offering price of the shares sold in the follow-on offering was $17.00 per share. We received net proceeds of $30.8 million, after deducting underwriting discounts and commissions and offering expenses payable by us, from the sales of our shares. We did not receive any proceeds from the sale of shares by the selling stockholders. The offer and sale of all of the shares in the follow-on offering were
31
registered under the Securities Act pursuant to a registration statement on Form S-1 (File No. 333-199650). J.P. Morgan, Goldman, Sachs & Co., Morgan Stanley, RBC Capital Markets, JMP Securities, and Cowen and Company acted as the underwriters. There has been no material change in the planned use of proceeds from the follow-on offering as described in our final prospectus filed with the SEC on November 11, 2014 pursuant to Rule 424(b).
Stock Performance Graph
The following shall not be deemed “soliciting material” or to be “filed” for purposes of Section 18 of the Exchange Act, or incorporated by reference into any of our other filings under the Exchange Act or the Securities Act of 1933, as amended, except to the extent we specifically incorporate it by reference into such filing. The following graph shows a comparison from May 16, 2014 (the date our common stock commenced trading on the NASDAQ Global Select Market) through December 31, 2016 of the cumulative total return for our common stock, the Nasdaq Composite Index (NASDAQ Composite), and the RDG Internet Composite. The graph assumes that $100 was invested at the market close on May 16, 2014 in our common stock, the NASDAQ Composite and the RDG Internet Composite, and the data for the NASDAQ Composite and the RDG Internet Composite assumes reinvestments of dividends. As discussed above, we have never declared or paid a cash dividend on our common stock and do not anticipate declaring or paying a cash dividend in the foreseeable future. The stock price performance of the following graph is not necessarily indicative of future stock price performance.
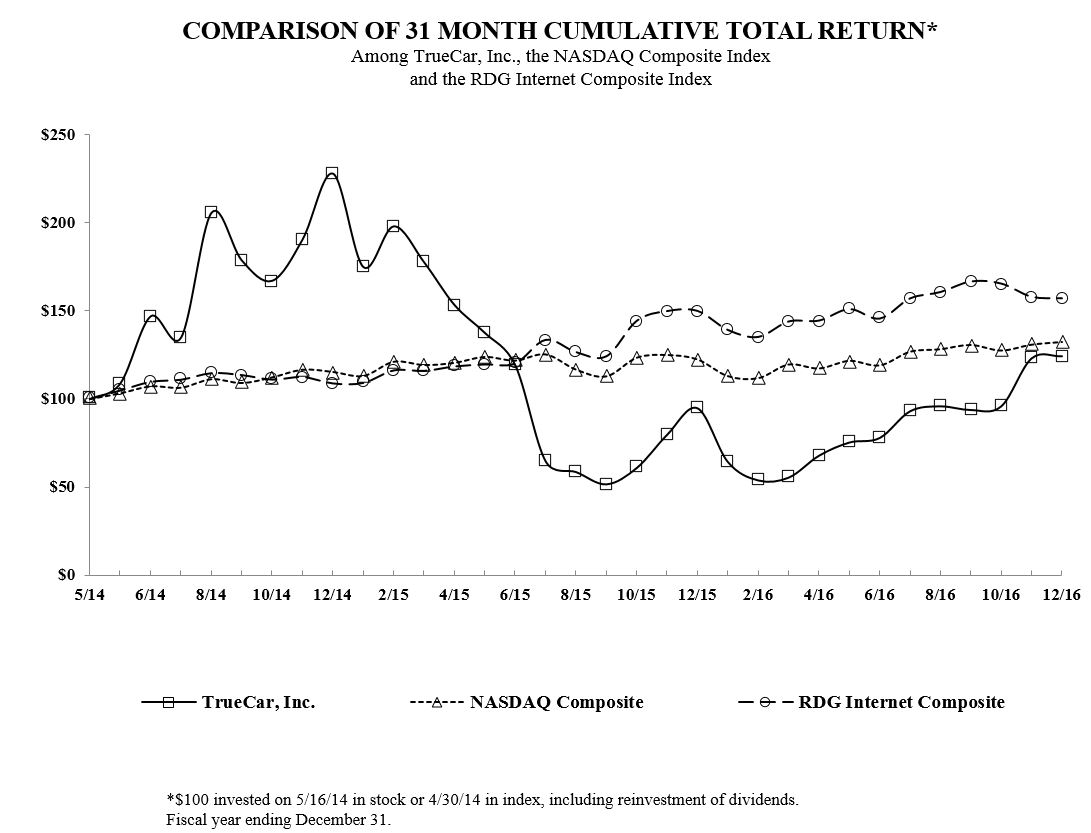
32
Item 6. Selected Financial Data
We have derived the following selected consolidated statement of operations data for the years ended December 31, 2016, 2015, and 2014 and the selected consolidated balance sheet data at December 31, 2016 and 2015 from our audited consolidated financial statements included elsewhere herein. We have derived the selected consolidated statement of operations data for the years ended December 31, 2013 and 2012, and the consolidated balance sheet data at December 31, 2014, 2013 and 2012 from our audited consolidated financial statements which are not included in this Annual Report on Form 10-K. Our historical results are not necessarily indicative of the results that may be expected in the future.
You should read the following selected consolidated financial and other data together with the section titled “Management’s Discussion and Analysis of Financial Condition and Results of Operations” and our consolidated financial statements, related notes and other financial information included elsewhere in this Annual Report on Form 10‑K. The selected consolidated financial data in this section is not intended to replace the consolidated financial statements and are qualified in their entirety by the consolidated financial statements and related notes included elsewhere in this Annual Report on Form 10-K.
Consolidated Statements of Operations Data:
Year Ended December 31, | |||||||||||||||||||
2016 | 2015 | 2014 | 2013 | 2012 | |||||||||||||||
(in thousands, except share and per share amounts) | |||||||||||||||||||
Revenues | $ | 277,507 | $ | 259,838 | $ | 206,649 | $ | 133,958 | $ | 79,889 | |||||||||
Cost and operating expenses: | |||||||||||||||||||
Cost of revenue (exclusive of depreciation and amortization presented separately below)(1): | 25,167 | 23,657 | 17,513 | 15,295 | 13,559 | ||||||||||||||
Sales and marketing (1) | 154,406 | 151,002 | 128,569 | 75,180 | 70,327 | ||||||||||||||
Technology and development (1) | 53,580 | 48,021 | 36,563 | 23,685 | 21,960 | ||||||||||||||
General and administrative (1) | 59,908 | 83,494 | 58,296 | 30,857 | 34,228 | ||||||||||||||
Depreciation and amortization | 23,345 | 17,646 | 13,213 | 11,569 | 11,768 | ||||||||||||||
Total costs and operating expenses | 316,406 | 323,820 | 254,154 | 156,586 | 151,842 | ||||||||||||||
Loss from operations | (38,899 | ) | (63,982 | ) | (47,505 | ) | (22,628 | ) | (71,953 | ) | |||||||||
Interest income | 376 | 107 | 59 | 121 | 229 | ||||||||||||||
Interest expense | (2,530 | ) | (443 | ) | (380 | ) | (1,988 | ) | (3,359 | ) | |||||||||
Other income (expense) | — | 13 | 37 | 18 | (18 | ) | |||||||||||||
Loss before (provision) benefit for income taxes | (41,053 | ) | (64,305 | ) | (47,789 | ) | (24,477 | ) | (75,101 | ) | |||||||||
Benefit (provision) for income taxes | (655 | ) | (606 | ) | (640 | ) | (579 | ) | 606 | ||||||||||
Net loss | $ | (41,708 | ) | $ | (64,911 | ) | $ | (48,429 | ) | $ | (25,056 | ) | $ | (74,495 | ) | ||||
Net loss per share, basic and diluted (2) (3) | $ | (0.49 | ) | $ | (0.79 | ) | $ | (0.68 | ) | $ | (0.43 | ) | $ | (1.33 | ) | ||||
Weighted average common shares outstanding, basic and diluted (2) (3) | 84,483 | 81,914 | 70,837 | 58,540 | 55,828 | ||||||||||||||
Other Financial Information: | |||||||||||||||||||
Adjusted EBITDA (4) | $ | 15,039 | $ | 7,572 | $ | 10,884 | $ | 2,140 | $ | (46,523 | ) | ||||||||
Non-GAAP net loss (5) | $ | (11,115 | ) | $ | (11,016 | ) | $ | (3,290 | ) | $ | (11,875 | ) | $ | (60,815 | ) | ||||
33
(1) | The following table presents stock-based compensation expense included in each respective expense category: |
Year Ended | |||||||||||||||||||
December 31, | |||||||||||||||||||
2016 | 2015 | 2014 | 2013 | 2012 | |||||||||||||||
(in thousands) | |||||||||||||||||||
Cost of revenue | $ | 960 | $ | 792 | $ | 454 | $ | 141 | $ | 122 | |||||||||
Sales and marketing | 5,837 | 4,493 | 4,743 | 2,561 | 1,571 | ||||||||||||||
Technology and development | 4,398 | 4,294 | 5,013 | 1,762 | 1,428 | ||||||||||||||
General and administrative | 13,544 | 32,984 | 19,123 | 4,882 | 7,199 | ||||||||||||||
Total stock-based compensation expense | $ | 24,739 | $ | 42,563 | $ | 29,333 | $ | 9,346 | $ | 10,320 | |||||||||
(2) | See Note 10 to our audited consolidated financial statements for an explanation of the calculations of our basic and diluted net loss per share attributable to common stockholders. |
(3) | All share, per-share and related information has been retroactively adjusted, where applicable, to reflect the impact of a 2-for-3 reverse stock split, which was effected on May 2, 2014. |
(4) | Adjusted EBITDA is not a measure of our financial performance under GAAP and should not be considered as an alternative to net income, operating income or any other measures derived in accordance with GAAP. For a definition of Adjusted EBITDA and a reconciliation of Adjusted EBITDA to net loss, see “Non-GAAP Financial Measures.” |
(5) | Non-GAAP net (loss) income is not a measure of our financial performance under GAAP and should not be considered as an alternative to net (loss) income, operating (loss) income or any other measures derived in accordance with GAAP. For a definition of Non-GAAP net (loss) income and a reconciliation of Non-GAAP net (loss) income, see “Non-GAAP Financial Measures.” |
At December 31, | |||||||||||||||||||
2016 | 2015 | 2014 | 2013 | 2012 | |||||||||||||||
(in thousands) | |||||||||||||||||||
Selected Consolidated Balance Sheet Data | |||||||||||||||||||
Cash and cash equivalents and short term investments | $ | 107,721 | $ | 112,371 | $ | 147,539 | $ | 43,819 | $ | 22,062 | |||||||||
Working capital (deficit), excluding restricted cash | 117,549 | 113,855 | 145,666 | 36,637 | (9,290 | ) | |||||||||||||
Property and equipment, net | 66,941 | 71,390 | 30,731 | 15,238 | 12,842 | ||||||||||||||
Total assets | 294,448 | 302,374 | 296,952 | 174,750 | 145,244 | ||||||||||||||
Total indebtedness | — | — | — | 4,764 | 23,696 | ||||||||||||||
Lease financing obligation | 28,833 | 26,987 | 6,093 | — | — | ||||||||||||||
Convertible preferred stock | — | — | — | 29,224 | — | ||||||||||||||
Contingently redeemable common stock | — | — | — | — | 1,000 | ||||||||||||||
Total stockholders’ equity | 224,581 | 232,692 | 249,198 | 112,180 | 98,196 | ||||||||||||||
Non-GAAP Financial Measures
Adjusted EBITDA and Non-GAAP net (loss) income are financial measures that are not calculated in accordance with generally accepted accounting principles in the United States, or GAAP. We define Adjusted EBITDA as net loss adjusted to exclude interest income, interest expense, depreciation and amortization, change in the fair value of preferred stock warrant liability, non-cash warrant expense, transaction costs from acquisitions, change in fair value of contingent consideration, stock-based compensation, IPO-related expenses, ticker symbol acquisition costs, certain litigation costs and legal settlements, severance charges, real estate exit costs, and income taxes. We define Non-GAAP net (loss) as net loss adjusted to exclude stock-based compensation, change in fair value of preferred stock warrant liability, non-cash warrant expense, transaction costs from acquisitions, change in the fair value of contingent consideration, IPO-related expenses, ticker symbol acquisition costs, certain litigation costs and legal settlements, severance charges, and real estate exit costs. We have provided below a reconciliation of each of Adjusted EBITDA and Non-GAAP net (loss) income to net loss, the most directly comparable GAAP financial measure. Neither Adjusted EBITDA nor Non-GAAP net (loss) income should be considered as an alternative to net loss or any other measure of financial performance calculated and presented in accordance with GAAP. In addition, our Adjusted EBITDA and Non-GAAP net (loss) income measures may not be comparable to similarly titled
34
measures of other organizations as they may not calculate Adjusted EBITDA or Non-GAAP net (loss) income in the same manner as we calculate these measures.
We have included Adjusted EBITDA and Non-GAAP net (loss) income herein as they are important measures used by our management and board of directors to assess our operating performance. We believe that using Adjusted EBITDA and Non-GAAP net (loss) income facilitates operating performance comparisons on a period-to-period basis because these measures exclude variations primarily caused by changes in the excluded items noted above. In addition, we believe that Adjusted EBITDA, Non-GAAP net (loss) income and similar measures are widely used by investors, securities analysts, rating agencies and other parties in evaluating companies as a measure of financial performance and debt service capabilities.
Our use of each of Adjusted EBITDA and Non-GAAP net (loss) income has limitations as an analytical tool, and you should not consider them in isolation or as a substitute for analysis of our results as reported under GAAP. Some of these limitations are:
• | Adjusted EBITDA does not reflect the payment or receipt of interest or the payment of income taxes; |
• | neither Adjusted EBITDA nor Non-GAAP net (loss) income reflects changes in, or cash requirements for, our working capital needs; |
• | although depreciation and amortization are non-cash charges, the assets being depreciated and amortized may have to be replaced in the future, and Adjusted EBITDA does not reflect cash capital expenditure requirements for such replacements or for new capital expenditures or any other contractual commitments; |
• | neither Adjusted EBITDA nor Non-GAAP net (loss) income reflects the cash costs to advance our claims in respect of certain litigation or the costs to defend ourselves in various complaints filed against us; |
• | neither Adjusted EBITDA nor Non-GAAP net (loss) income reflect a non-recurring legal settlement in favor of the Company; |
• | neither Adjusted EBITDA nor Non-GAAP net (loss) income reflects the cash severance costs due to certain former executives upon separation; |
• | neither Adjusted EBITDA non Non-GAAP net (loss) income reflects the real estate exit costs associated with consolidation of the Company's office locations in Santa Monica, California. |
• | neither Adjusted EBITDA nor Non-GAAP net (loss) income consider the potentially dilutive impact of shares issued or to be issued in connection with share-based compensation or warrant issuances; and |
• | other companies, including companies in our own industry, may calculate Adjusted EBITDA and Non-GAAP net (loss) income differently from how we do, limiting its usefulness as a comparative measure. |
Because of these limitations, you should consider Adjusted EBITDA and Non-GAAP net (loss) income alongside other financial performance measures, including our net loss, our other GAAP results, and various cash flow metrics. In addition, in evaluating Adjusted EBITDA and Non-GAAP net (loss) income you should be aware that in the future we will incur expenses such as those that are the subject of adjustments in deriving Adjusted EBITDA and Non-GAAP net (loss) income, and you should not infer from our presentation of Adjusted EBITDA and Non-GAAP net (loss) income that our future results will not be affected by these expenses or any unusual or non-recurring items.
35
The following table presents a reconciliation of net loss to Adjusted EBITDA for each of the periods presented:
Year Ended | |||||||||||||||||||
December 31, | |||||||||||||||||||
2016 | 2015 | 2014 | 2013 | 2012 | |||||||||||||||
(in thousands) | |||||||||||||||||||
Reconciliation of Net Loss to Adjusted EBITDA: | |||||||||||||||||||
Net loss | $ | (41,708 | ) | $ | (64,911 | ) | $ | (48,429 | ) | $ | (25,056 | ) | $ | (74,495 | ) | ||||
Non-GAAP adjustments: | |||||||||||||||||||
Interest income | (376 | ) | (107 | ) | (59 | ) | (121 | ) | (229 | ) | |||||||||
Interest expense | 2,530 | 443 | 380 | 1,988 | 3,359 | ||||||||||||||
Depreciation and amortization | 23,345 | 17,646 | 13,213 | 11,569 | 11,768 | ||||||||||||||
Stock-based compensation (1) | 24,739 | 42,563 | 29,333 | 9,346 | 10,320 | ||||||||||||||
Warrant expense (reduction) | 46 | (803 | ) | 9,808 | 3,740 | 1,990 | |||||||||||||
Change in fair value of contingent consideration | — | — | — | 95 | 1,370 | ||||||||||||||
IPO-related expenses | — | — | 3,717 | — | — | ||||||||||||||
Ticker symbol acquisition costs | — | — | 803 | — | — | ||||||||||||||
Certain litigation costs(2) | 960 | 6,171 | 2,270 | — | — | ||||||||||||||
Legal settlement (3) | — | — | (792 | ) | — | — | |||||||||||||
Severance charges (4) | 1,783 | 3,732 | — | — | — | ||||||||||||||
Lease exit costs (5) | 3,065 | 2,232 | — | — | — | ||||||||||||||
Provision (benefit) for income taxes | 655 | 606 | 640 | 579 | (606 | ) | |||||||||||||
Adjusted EBITDA | $ | 15,039 | $ | 7,572 | $ | 10,884 | $ | 2,140 | $ | (46,523 | ) | ||||||||
(1) | Includes stock-based compensation of $10.7 million incurred in the fourth quarter of 2015 related to the departure of certain executives. |
(2) | The excluded amounts relate to legal costs incurred in connection with a claim we filed against Sonic Automotive Holdings, Inc. (the "Sonic Litigation"), complaints filed by non-TrueCar dealers and the California New Car Dealers Association against TrueCar, and securities and consumer class action lawsuits. We believe the exclusion of these costs is appropriate to facilitate comparisons of our core operating performance on a period-to-period basis. We do not believe significant trademark litigation like the Sonic Litigation is reflective of a trend in our underlying operations. Based on the nature of the specific claims underlying the excluded litigation matters, once these matters are resolved, we do not believe our operations are likely to entail defending against the types of claims raised by these matters. We expect the cost of defending these claims to continue to be significant pending resolution. |
(3) | Represents a non-recurring legal settlement in favor of the Company. We believe excluding the impact of this non-recurring legal settlement is appropriate to facilitate period-to-period operating performance comparisons. |
(4) | In 2016, we incurred severance costs in $1.3 million related to a reorganization of our product and technology teams to better align our resources with business objectives as we transition from multiple software platforms to a unified architecture. In addition, we incurred severance cost of $0.5 million related to an executive who terminated during 2016. In 2015, we incurred severance costs of $3.4 million for executive-level employees who terminated during the second half of the year ended December 31, 2015. In addition, we also incurred $0.3 million of related recruiting fees for the placement of our new CEO in the fourth quarter of 2015. We believe excluding the impact of these terminations from 2016 and 2015 is consistent with our use of these non-GAAP measures as we do not believe they are a useful indicator of ongoing operating results. |
(5) | Represents the initial estimate and updates to that estimate of lease termination costs associated with the consolidation of the Company's office locations in Santa Monica, California in December 2015. We believe that their exclusion is appropriate to facilitate period-to-period operating performance comparisons. |
36
The following table presents a reconciliation of net loss to Non-GAAP net loss for each of the periods presented:
Year Ended | |||||||||||||||||||
December 31, | |||||||||||||||||||
2016 | 2015 | 2014 | 2013 | 2012 | |||||||||||||||
(in thousands) | |||||||||||||||||||
Reconciliation of Net Loss to Non-GAAP Net Loss: | |||||||||||||||||||
Net loss | $ | (41,708 | ) | $ | (64,911 | ) | $ | (48,429 | ) | $ | (25,056 | ) | $ | (74,495 | ) | ||||
Non-GAAP adjustments: | |||||||||||||||||||
Stock-based compensation (1) | 24,739 | 42,563 | 29,333 | 9,346 | 10,320 | ||||||||||||||
Warrant expense (reduction) | 46 | (803 | ) | 9,808 | 3,740 | 1,990 | |||||||||||||
Change in fair value of preferred stock warrant liability | — | — | — | — | — | ||||||||||||||
Transaction costs from acquisitions | — | — | — | — | — | ||||||||||||||
Change in fair value of contingent consideration | — | — | — | 95 | 1,370 | ||||||||||||||
IPO-related expenses | — | — | 3,717 | — | — | ||||||||||||||
Ticker symbol acquisition costs | — | — | 803 | — | — | ||||||||||||||
Certain litigation costs (2) | 960 | 6,171 | 2,270 | — | — | ||||||||||||||
Legal settlement (3) | — | — | (792 | ) | — | — | |||||||||||||
Severance charges (4) | 1,783 | 3,732 | — | — | — | ||||||||||||||
Lease exit costs (5) | 3,065 | 2,232 | — | — | — | ||||||||||||||
Non-GAAP net (loss) income (6) | $ | (11,115 | ) | $ | (11,016 | ) | $ | (3,290 | ) | $ | (11,875 | ) | $ | (60,815 | ) | ||||
(1) | Includes stock-based compensation of $10.7 million incurred in the fourth quarter of 2015 related to the departure of certain executives. |
(2) | The excluded amounts relate to legal costs incurred in connection with a claim we filed against Sonic Automotive Holdings, Inc. (the "Sonic Litigation"), complaints filed by non-TrueCar dealers and the California New Car Dealers Association against TrueCar, and securities and consumer class action lawsuits. We believe the exclusion of these costs is appropriate to facilitate comparisons of our core operating performance on a period-to-period basis. We do not believe significant trademark litigation like the Sonic Litigation is reflective of a trend in our underlying operations. Based on the nature of the specific claims underlying the excluded litigation matters, once these matters are resolved, we do not believe our operations are likely to entail defending against the types of claims raised by these matters. We expect the cost of defending these claims to continue to be significant pending resolution. |
(3) | Represents a non-recurring legal settlement in favor of the Company. We believe excluding the impact of this non-recurring legal settlement is appropriate to facilitate period-to-period operating performance comparisons. |
(4) | In 2016, we incurred severance costs in $1.3 million related to a reorganization of our product and technology teams to better align our resources with business objectives as we transition from multiple software platforms to a unified architecture. In addition, we incurred severance cost of $0.5 million related to an executive who terminated during 2016. In 2015, we incurred severance costs of $3.4 million for executive-level employees who terminated during the second half of the year ended December 31, 2015. In addition, we also incurred $0.3 million of related recruiting fees for the placement of our new CEO in the fourth quarter of 2015. We believe excluding the impact of these terminations from 2016 and 2015 is consistent with our use of these non-GAAP measures as we do not believe they are a useful indicator of ongoing operating results. |
(5) | Represents the initial estimate and updates to that estimate of lease termination costs associated with the consolidation of the Company's office locations in Santa Monica, California in December 2015. We believe that their exclusion is appropriate to facilitate period-to-period operating performance comparisons. |
(6) | There is no income tax impact related to the adjustments made to calculate Non-GAAP net loss because of our available net operating loss carryforwards and the full valuation allowance recorded against our net deferred tax assets at December 31, 2016 and December 31, 2015. |
37
Item 7. Management’s Discussion and Analysis of Financial Condition and Results of Operations
The following discussion and analysis of our financial condition and results of operations should be read together with our consolidated financial statements and the related notes to those statements included herein. In addition to historical financial information, the following discussion and analysis contains forward-looking statements that involve risks, uncertainties and assumptions. Our actual results and timing of selected events may differ materially from those anticipated in these forward-looking statements as a result of many factors, including those discussed under “Risk Factors” and elsewhere herein. See “Special Note Regarding Forward-Looking Statements.”
Overview
We seek to dramatically improve the way consumers buy cars and provide dealers and automakers with an excellent return on their marketing dollars.
We have established an intelligent, data-driven online platform powered by proprietary market data and analytics. Our company-branded platform is available on our TrueCar website and mobile applications. In addition, we customize and operate our platform on a co-branded basis for our many affinity group marketing partners, including financial institutions like USAA, Chase and American Express, membership-based organizations like Consumer Reports, AARP, Sam's Club, and AAA, and employee buying programs for large enterprises such as IBM and Walmart. We enable users to obtain market-based pricing data on new and used cars, and to connect with our network of TrueCar Certified Dealers. We also allow automobile manufacturers, known in the industry as OEMs, to connect with TrueCar users during the purchase process and efficiently deliver targeted incentives to consumers.
Our subsidiary, ALG, Inc., provides forecasts and consulting services regarding determination of the residual value of an automobile at given future points in time. These residual values are used to underwrite automotive loans and leases to determine payments by consumers. In addition, financial institutions use this information to measure exposure and risk across loan, lease, and fleet portfolios. We also obtain automobile purchase data from a variety of sources and use this data to provide consumers and dealers with highly accurate, geographically specific, real-time pricing information.
During the year ended December 31, 2016, we generated revenues of $277.5 million and recorded a net loss of $41.7 million. Of the $277.5 million in revenues, 93.5% consisted of transaction revenues with the remaining 6.5% derived primarily from the sale of forecasts, consulting and other services to the automotive and financial services industries. Revenues from the sale of forecasts, consulting and other services are derived primarily from the operations of our ALG subsidiary. Transaction revenues primarily consist of fees paid to us by our network of TrueCar Certified Dealers under our pay-for-performance business model where we generally earn a fee only when a TrueCar user purchases a car from them.
Key Metrics
We regularly review a number of key metrics to evaluate our business, measure our performance, identify trends affecting our business, formulate financial projections and make operating and strategic decisions.
Year Ended | |||||||||||
December 31, | |||||||||||
2016 | 2015 | 2014 | |||||||||
Average Monthly Unique Visitors | 7,004,863 | 5,999,606 | 4,296,650 | ||||||||
Units(1) | 806,953 | 750,108 | 610,620 | ||||||||
Monetization | $ | 322 | $ | 322 | $ | 310 | |||||
Franchise Dealer Count | 11,151 | 9,094 | 8,501 | ||||||||
Transaction Revenue Per Franchise Dealer | $ | 25,638 | $ | 27,439 | $ | 24,994 | |||||
(1) | We issued full credits of the amount originally invoiced with respect to 19,021, 12,484, and 8,779, units during the years ended December 31, 2016, 2015 and 2014, respectively. The number of units has not been adjusted downwards related to units credited as discussed in the description of the unit metric below. |
Average Monthly Unique Visitors
We define a monthly unique visitor as an individual who has visited our website, our landing page on our affinity group marketing partner sites, or our mobile applications within a calendar month. We identify unique visitors through cookies for browser-based visits on either a desktop computer or mobile device and through device IDs for mobile application visits. In addition, if a
38
TrueCar.com user logs-in, we supplement their identification with their log-in credentials to attempt to avoid double counting on TrueCar.com across devices, browsers and mobile applications. If an individual accesses our service using different devices or different browsers on the same device within a given month, the first access through each such device or browser is counted as a separate monthly unique visitor, except where adjusted based upon TrueCar.com log-in information. We calculate average monthly unique visitors as the sum of the monthly unique visitors in a given period, divided by the number of months in that period. We view our average monthly unique visitors as a key indicator of the growth in our business and audience reach, the strength of our brand, and the visibility of car-buying services to the member base of our affinity group marketing partners.
The number of average monthly unique visitors increased 16.8% to approximately 7.0 million for the year ended December 31, 2016 from approximately 6.0 million for the year ended December 31, 2015. We attribute the growth in our average monthly unique visitors principally to television and digital marketing advertising campaigns that have led to improved brand awareness and also to increased efforts from our affinity group marketing partners to drive greater member awareness and traffic to our platform.
Units
We define units as the number of automobiles purchased by our users from TrueCar Certified Dealers through TrueCar.com, our TrueCar branded mobile applications or the car-buying sites we maintain for our affinity group marketing partners. A unit is counted following such time as we have matched the sale to a TrueCar user with one of TrueCar Certified Dealers. We view units as a key indicator of the growth of our business, the effectiveness of our product and the size and geographic coverage of our network of TrueCar Certified Dealers.
On occasion we issue credits to our TrueCar Certified Dealers with respect to units sold. However, we do not adjust our unit metric for these credits as we believe that in substantially all cases a vehicle has in fact been purchased through our platform given the high degree of accuracy of our sales matching process. Credits are most frequently issued to a dealer that claims that it had a pre-existing relationship with a purchaser of a vehicle, and we determine whether we will issue a credit based on a number of factors, including the facts and circumstances related to the dealer claim and the level of claim activity at the dealership. In most cases, we issue credits in order to maintain strong business relations with the dealer and not because we have made an erroneous sales match or billing error.
The number of units increased 7.6% to 806,953 for the year ended December 31, 2016 from 750,108 for the year ended December 31, 2015. We attribute this growth in units to the effectiveness of our marketing activities, product enhancements, and the growing number and geographic coverage of TrueCar Certified Dealers in our network.
Monetization
We define monetization as the average transaction revenue per unit, which we calculate by dividing all of our transaction revenue in a given period by the number of units in that period. For the years ended December 31, 2016 and December 31, 2015, our monetization was $322 per unit. We expect our monetization to be affected in the future by changes in our pricing structure, the unit mix between new and used cars, with used cars providing higher monetization, and by the introduction of new products and services.
Franchise Dealer Count
We define franchise dealer count as the number of franchise dealers in the network of TrueCar Certified Dealers at the end of a given period. This number is calculated by counting the number of brands of new cars sold by dealers in the TrueCar Certified Dealer network at their locations, and includes both single-location proprietorships as well as large consolidated dealer groups. The network comprises of dealers with a range of unit sales volume per dealer, with dealers representing certain brands consistently achieving higher than average unit sales volume. We view our ability to increase our franchise dealer count, particularly dealers representing high volume brands, as an indicator of our market penetration and the likelihood of converting users of our platform into unit sales. Our TrueCar Certified Dealer network includes non-franchised dealers that primarily sell used cars and are not included in franchise dealer count.
Our franchise dealer count increased to 11,151 at December 31, 2016 from 9,094 at December 31, 2015 and 8,501 at December 31, 2014. Note that our franchise dealer count of 11,151 at December 31, 2016 excludes 376 Genesis franchises on our program as of December 31, 2016 due to Hyundai’s recent transition of Genesis to a stand-alone brand. In order to facilitate period over period comparisons, we have continued to count each Hyundai franchise that also has a Genesis franchise as one franchise dealer rather than two. We intend to increase the number of dealers representing high volume brands in our dealer network, generally, and in key geographies, by investing to improve the dealer experience and increasing dealer satisfaction.
39
Transaction Revenue per Franchise Dealer
We define transaction revenue per franchise dealer as the aggregate transaction revenue we receive in a given period divided by the average franchise dealer count in that period. We calculate average franchise dealer count in a given period as the average of the franchise dealer count at the beginning of the period and the franchise dealer count at the end of the period. Our transaction revenue per franchise dealer decreased 6.6% to $25,638 during the year ended December 31, 2016 from $27,439 for the year ended December 31, 2015. Transaction revenue per franchise dealer fluctuates based on the timing and rate of dealer additions to our network throughout the year as well as the size and locations of dealers on our platform.
Presentation of Financial Statements
Our consolidated financial statements include the accounts of our wholly owned subsidiaries in accordance with FASB ASC 810 — Consolidation. Business acquisitions are included in our consolidated financial statements from the date of the acquisition. Our purchase accounting resulted in all assets and liabilities of acquired businesses being recorded at their estimated fair values on the acquisition dates. All intercompany balances and transactions have been eliminated in consolidation.
We report our financial results as one operating segment, with two distinct service offerings: transactions, and forecasts, consulting and other. Our operating results are regularly reviewed by our chief operating decision maker on a consolidated basis, principally to make decisions about how we allocate our resources and to measure our consolidated operating performance. Our chief operating decision maker regularly reviews revenue for each of our transaction and forecasts, consulting and other offerings in order to gain more depth and understanding of the factors driving our business.
Components of Operating Results
Revenues
Our revenues are comprised of transaction revenues, and forecasts, consulting and other revenue.
Transaction Revenue. Revenue consists of fees paid by dealers participating in our network of TrueCar Certified Dealers. Dealers pay us these fees either on a per vehicle basis for sales to our users or in the form of a subscription arrangement. Subscription arrangements fall into several types: flat rate subscriptions, subscriptions subject to downward adjustment based on a minimum number of vehicle sales (“guaranteed sales”) and subscriptions based on introduction volume, including those subject to downward adjustment based on a minimum number of introductions (“guaranteed introductions”).
Under flat rate subscription arrangements, fees are charged at a monthly flat rate regardless of the number of sales made to users of our platform by the dealer. For flat rate subscription arrangements, we recognize the fees as revenue over the subscription period on a straight line basis which corresponds to the period that we are providing the dealer with access to our platform.
Under guaranteed sales subscription arrangements, fees are charged based on the number of guaranteed sales multiplied by a fixed amount per vehicle. To the extent that the actual number of vehicles sold by the dealers to users of our platform is less than the number of guaranteed sales, we provide a credit to the dealer. To the extent that the actual number of vehicles sold exceeds the number of guaranteed sales, we are not entitled to any additional fees.
Certain of our subscription arrangements are charged based on volume of introductions provided while other introduction based subscription arrangements operate under a guaranteed introduction model. Under guaranteed introductions subscription arrangements, fees are charged based on a periodically-updated formula that considers, among other things, the introductions anticipated to be provided to the dealer. To the extent that the number of actual introductions is less than the number of guaranteed introductions, we provide a credit to the dealer. To the extent that the actual number of introductions provided exceeds the number guaranteed, we are not entitled to any additional fees.
For guaranteed sales and guaranteed introductions subscription arrangements, we recognize revenue based on the lesser of (i) the actual number of sales generated or introductions delivered through our platform during the subscription period multiplied by the contracted price per sale/introduction or (ii) the guaranteed number of sales or introductions multiplied by the contracted price per sale/introduction.
In addition, we enter into arrangements with automobile manufacturers to promote the sale of their vehicles through the offering of additional consumer incentives to members of our affinity group marketing partners. These manufacturers pay us a per-vehicle fee for promotion of the incentive and we recognize the per-vehicle incentive fee when the vehicle sale has occurred between the member of our affinity group marketing partner and the dealer.
40
Forecasts, Consulting and Other Revenue. We derive this type of revenue primarily from the provision of forecasts and consulting services to the automotive and financial services industries through our ALG subsidiary. The forecasts and consulting services that ALG provides typically relate to the determination of the residual value of an automobile at given future points in time. These residual values are used to underwrite automotive loans and leases to determine payments by consumers. In addition, financial institutions use this information to measure exposure and risk across loan, lease and fleet portfolios. Our customers generally pay us for these services as information is delivered to them.
For a description of our revenue accounting policies, see “Critical Accounting Policies and Estimates” below.
Costs and Operating Expenses
Cost of Revenue (exclusive of depreciation and amortization). Cost of revenue includes expenses related to the fulfillment of our services, consisting primarily of data costs and licensing fees paid to third party service providers and expenses related to operating our website and mobile applications, including those associated with our data centers, hosting fees, data processing costs required to deliver introductions to our network of TrueCar Certified Dealers, employee costs related to certain dealer operations, sales matching, employee and consulting costs related to delivering data and consulting services to our customers, and facilities costs. Cost of revenue excludes depreciation and amortization of software costs and other hosting and data infrastructure equipment used to operate our platforms, which are included in the depreciation and amortization line item on our statement of comprehensive loss.
Sales and Marketing. Sales and marketing expenses consist primarily of: television, digital, and radio advertising; media production costs, affinity group partner marketing fees, which also includes loan subvention costs where we pay certain affinity group marketing partners a portion of consumers’ borrowing costs for car loan products offered by these affinity group marketing partners, and common stock warrants issued to USAA; marketing sponsorship programs; and digital customer acquisition. See Part III, Item 13 “Certain Relationships, Related Party and Other Transactions — Strategic Partnerships — United Services Automobile Association” for a description of our arrangements with USAA. In addition, sales and marketing expenses include employee related expenses for sales, customer support, marketing and public relations employees, including salaries, bonuses, benefits, severance, and stock-based compensation expenses; third-party contractor fees; and facilities costs. Sales and marketing expenses also include costs related to common stock warrants issued to a third-party marketing firm and a service provider as part of our commercial arrangements with them. Marketing and advertising costs promote our services and are expensed as incurred, except for media production costs which are expensed the first time the advertisement is aired.
Technology and Development. Technology and development expenses consist primarily of employee related expenses including salaries, bonuses, benefits, severance and stock-based compensation expenses, third-party contractor fees, facilities costs, as well as our product development, product management, research and analytics, and internal IT functions.
General and Administrative. General and administrative expenses consist primarily of employee related expenses including salaries, bonuses, benefits, severance, and stock-based compensation expenses for executive, finance, accounting, legal, and human resources. General and administrative expenses also include legal, accounting, and other third-party professional service fees, bad debt, lease exit costs, and facilities costs.
Depreciation and Amortization. Depreciation consists primarily of depreciation expense recorded on property and equipment. Amortization expense consists primarily of amortization recorded on intangible assets, capitalized software costs and leasehold improvements.
Interest Income. Interest income consists of interest earned on our cash and cash equivalents and short-term investment balances.
Interest Expense. Interest expense consists of interest on our built-to-suit lease financing obligations and, in 2014, interest expense included interest on our credit facility and the amortization of the discount on our line of credit.
Provision for Income Taxes. We are subject to federal and state income taxes in the United States. We provided a full valuation allowance against our net deferred tax assets as of December 31, 2016 and December 31, 2015 as it is more likely than not that some or all of our deferred tax assets will not be realized. As a result of the valuation allowance, our income tax benefit (or expense) is significantly less than the federal statutory rate of 34%. Our provision for income taxes in 2016, 2015, and 2014 primarily reflect a tax expense associated with the amortization of tax deductible goodwill that is not an available source of income to realize deferred tax assets.
We have accumulated federal net operating loss carryforwards of approximately $250.2 million and state net operating loss carryforwards of approximately $176.5 million at December 31, 2016.
41
See Note 9 of our consolidated financial statements included herein for more information about our provision for income taxes.
Results of Operations
The following table sets forth our selected consolidated statements of operations data for each of the periods indicated.
Year Ended | |||||||||||
December 31, | |||||||||||
2016 | 2015 | 2014 | |||||||||
(in thousands) | |||||||||||
Consolidated Statements of Operations Data: | |||||||||||
Revenues | $ | 277,507 | $ | 259,838 | $ | 206,649 | |||||
Costs and operating expenses: | |||||||||||
Cost of revenue (exclusive of depreciation and amortization presented separately below) | 25,167 | 23,657 | 17,513 | ||||||||
Sales and marketing | 154,406 | 151,002 | 128,569 | ||||||||
Technology and development | 53,580 | 48,021 | 36,563 | ||||||||
General and administrative | 59,908 | 83,494 | 58,296 | ||||||||
Depreciation and amortization | 23,345 | 17,646 | 13,213 | ||||||||
Total costs and operating expenses | 316,406 | 323,820 | 254,154 | ||||||||
Loss from operations | (38,899 | ) | (63,982 | ) | (47,505 | ) | |||||
Interest income | 376 | 107 | 59 | ||||||||
Interest expense | (2,530 | ) | (443 | ) | (380 | ) | |||||
Other income | — | 13 | 37 | ||||||||
Loss before provision for income taxes | (41,053 | ) | (64,305 | ) | (47,789 | ) | |||||
Provision for income taxes | 655 | 606 | 640 | ||||||||
Net loss | $ | (41,708 | ) | $ | (64,911 | ) | $ | (48,429 | ) | ||
42
The following table sets forth our selected consolidated statements of operations data as a percentage of revenues for each of the periods indicated.
Year Ended | ||||||||
December 31, | ||||||||
2016 | 2015 | 2014 | ||||||
Revenues | 100 | % | 100 | % | 100 | % | ||
Costs and operating expenses: | ||||||||
Cost of revenue (exclusive of depreciation and amortization presented separately below) | 9 | 9 | 8 | |||||
Sales and marketing | 56 | 58 | 62 | |||||
Technology and development | 19 | 18 | 18 | |||||
General and administrative | 22 | 32 | 28 | |||||
Depreciation and amortization | 8 | 7 | 6 | |||||
Loss from operations | (14 | ) | (25 | ) | (23 | ) | ||
Interest income | * | * | * | |||||
Interest expense | (1 | ) | * | * | ||||
Other income | * | * | * | |||||
Loss before provision for income taxes | (15 | ) | (25 | ) | (23 | ) | ||
Provision for income taxes | * | * | * | |||||
Net loss | (15 | )% | (25 | )% | (23 | )% | ||
* Less than 0.5% of revenues
Comparison of Years Ended December 31, 2016, 2015, and 2014
Revenues
Years Ended December 31, | % Change | ||||||||||||||||
2016 | 2015 | 2014 | 2016 vs. 2015 | 2015 vs. 2014 | |||||||||||||
(dollars in thousands) | |||||||||||||||||
Revenues | |||||||||||||||||
Transaction revenue | $ | 259,516 | $ | 241,395 | $ | 189,353 | 7.5 | % | 27.5 | % | |||||||
Forecasts, consulting and other revenue | 17,991 | 18,443 | 17,296 | (2.5 | )% | 6.6 | % | ||||||||||
Total revenues | $ | 277,507 | $ | 259,838 | $ | 206,649 | 6.8 | % | 25.7 | % | |||||||
Year ended December 31, 2016 compared to year ended December 31, 2015. The increase in our revenues of $17.7 million or 6.8%, for 2016 as compared to 2015 reflected the increase in our transaction revenue. Transaction revenue and forecasts, consulting and other revenue comprised 93.5% and 6.5%, respectively, of revenues for 2016 as compared to 92.9% and 7.1%, respectively, for 2015. The increase in transaction revenue for 2016 primarily reflected a 7.6% increase in units. The 2.5% decrease in forecasts, consulting and other revenue for 2016 as compared to 2015 is primarily due to a decrease in lead referral fees.
In the second half of 2015, our close rates decreased as the result of a decline in the proportion of dealers representing high volume brands in our network. The lower close rates dampened the impact of increases in unique visitors on transaction revenue. To improve close rates and re-accelerate revenue growth, we invested in additional dealer support personnel to improve and expand our dealer relationships, and we improved the messaging on our site to make the benefits of registration more clear to consumers. In the second half of 2016, improvement in our dealer network combined with product improvements resulted in increases in consumer registration and transaction revenue. In 2017, we expect our year-over-year revenue growth to increase as the result of our investments in dealer relationships, in consumer messaging and in our technology platform, which we believe will enable our business to scale.
Year ended December 31, 2015 compared to year ended December 31, 2014. The increase in our revenues of $53.2 million for 2015 as compared to 2014 primarily reflected the substantial increase in our transaction revenue. Transaction revenue and forecasts, consulting and other revenue comprised 92.9% and 7.1%, respectively, of revenues for 2015 as compared to 91.6% and 8.4%, respectively, for 2014. The increase in transaction revenue for 2015 primarily reflected the 22.8% increase in units due to the level of marketing spend and the increase in the number of Certified TrueCar Dealers, platform and product enhancements, and the
43
overall growth in sales of the automotive industry. Our average monthly unique visitors grew 39.6% to 6.0 million during 2015 from 4.3 million during 2014, reflecting our increased advertising expenses which improved brand awareness and the visibility of our platform to our users. Our monetization increased 3.9% to $322 during 2015 from $310 for 2014, primarily as a result of improved subscription pricing optimization and growth in used vehicles vs. new vehicle mix, the independent dealer channel, and in revenue from OEMs. The 6.6% increase in forecasts, consulting, and other for 2015 as compared to 2014 primarily reflected an increase in volume of portfolio risk analyses and residual value forecasts provided to customers.
Costs and Operating Expenses
Cost of Revenue (exclusive of depreciation and amortization)
Years Ended December 31, | % Change | ||||||||||||||||
2016 | 2015 | 2014 | 2016 vs. 2015 | 2015 vs. 2014 | |||||||||||||
(dollars in thousands) | |||||||||||||||||
Cost of revenue (exclusive of depreciation and amortization) | $ | 25,167 | $ | 23,657 | $ | 17,513 | 6.4 | % | 35.1 | % | |||||||
Cost of revenue (exclusive of depreciation and amortization) as a percentage of revenues | 9.1 | % | 9.1 | % | 8.5 | % | |||||||||||
Year ended December 31, 2016 compared to year ended December 31, 2015. The increase in cost of revenue of $1.5 million or 6.4% for 2016 as compared to 2015 was primarily due to increased employee related costs associated with an increase in headcount. Although we expect our cost of revenue to increase in dollar amount, we believe that the nature of our cost structure will enable us to realize operating leverage in our business over time.
Year ended December 31, 2015 compared to year ended December 31, 2014. The increase in cost of revenue of $6.1 million or 35.1% for 2015 as compared to 2014 was primarily due to a $4.4 million increase in data costs and licensing fees to support the growth of our business and a $1.1 million increase in employee related costs primarily due to increases in headcount.
Sales and Marketing Expenses
Years Ended December 31, | % Change | ||||||||||||||||
2016 | 2015 | 2014 | 2016 vs. 2015 | 2015 vs. 2014 | |||||||||||||
(dollars in thousands) | |||||||||||||||||
Sales and marketing expense | $ | 154,406 | $ | 151,002 | $ | 128,569 | 2.3 | % | 17.4 | % | |||||||
Sales and marketing expense as a percentage of revenues | 55.6 | % | 58.1 | % | 62.2 | % | |||||||||||
Year ended December 31, 2016 compared to year ended December 31, 2015. The increase in sales and marketing expenses of $3.4 million or 2.3% for 2016 as compared to 2015 reflected a $11.6 million increase in salaries and employee related expenses primarily due to our increased headcount and a $1.3 million increase in stock-based compensation. The increase was partially offset by a $6.7 million decrease in advertising as we reduced our expenditures to maintain the efficiency of our customer acquisition spending, a $1.3 million decrease in outsourced services and consulting fees, and a $1.1 million decrease in revenue share paid to affinity marketing partners. We expect sales and marketing expenses to continue to increase in total due to increased headcount to better service our existing dealers, as well as television and radio advertising, digital customer acquisition costs, affinity group marketing partner fees, and marketing programs as we grow our business.
Year ended December 31, 2015 compared to year ended December 31, 2014. The increase in sales and marketing expenses of $22.4 million or 17.4% for 2015 as compared to 2014 reflected a $19.3 million increase in advertising and promotional activities primarily due to increased television, radio and online marketing spend, and a $3.4 million increase in affinity partner marketing fees as a result of our increased level of unit sales and increased promotional activities, such as loan subvention, where we pay certain affinity group marketing partners a portion of customers’ borrowing costs for car loan products offered by these affinity group marketing partners to incentivize their customers to use our platform. The increase in sales and marketing expenses for 2015 also reflected a $7.2 million increase in salaries and related expenses primarily due to our increased headcount. These increases in sales and marketing expenses were partially offset by a decrease of $5.1 million in warrant expense related to warrants issued to a third-party marketing firm and a service provider and a decrease of $1.9 million in consulting fees as we have brought some services in-house that were previously performed by third parties.
44
Technology and Development Expenses
Years Ended December 31, | % Change | ||||||||||||||||
2016 | 2015 | 2014 | 2016 vs. 2015 | 2015 vs. 2014 | |||||||||||||
(dollars in thousands) | |||||||||||||||||
Technology and development expenses | $ | 53,580 | $ | 48,021 | $ | 36,563 | 11.6 | % | 31.3 | % | |||||||
Technology and development expenses as a percentage of revenues | 19.3 | % | 18.5 | % | 17.7 | % | |||||||||||
Capitalized software costs | $ | 12,025 | $ | 15,645 | $ | 13,818 | (23.1 | )% | 13.2 | % | |||||||
Year ended December 31, 2016 compared to year ended December 31, 2015. The increase in technology and development expenses of $5.6 million or 11.6% for 2016 as compared to 2015 includes an increase of $5.7 million in increased salaries and related expenses due to increased headcount, higher bonus expense in 2016 than in 2015, and $1.3 million of severance costs related to a reorganization in our product and technology teams made in the second quarter of 2016 to better align our resources with business objectives as we transition from multiple software platforms to a unified architecture. The increase in technology and development expense also includes a $1.7 million increase in software license and hosting expenses. These increases were partially offset by a $0.9 million decrease in write-offs of capitalized software that we determined not to place in service and a $0.5 million increase in the amount of salaries capitalized for the development of internal use software costs, which reduce technology development expenses.
Capitalized software costs decreased $3.6 million for 2016 as compared to 2015 primarily due to the decrease in the amount of capitalized third-party developer and software costs of $4.1 million, which was partially offset by an increase in the amount of salaries capitalized for the development of internal use software of $0.5 million.
We expect our technology and development expenses to increase in dollar amount as we continue to increase our developer headcount to upgrade and enhance our technology infrastructure, invest in our products, expand the functionality of our platform and provide new product offerings. We also expect technology and development expenses to continue to be affected by variations in the amount of capitalized internally developed software.
Year ended December 31, 2015 compared to year ended December 31, 2014. The increase in technology and development expenses of $11.5 million or 31.3% for 2015 as compared to 2014 reflected an increase of $10.6 million in increased salaries and related expenses due to increased headcount, a $1.6 million increase in software license and hosting expenses, a $1.4 million increase in overhead related to facilities, reflecting extra space needed to accommodate increased headcount, and a $1.2 million increase in write-offs of capitalized software that we determined not to place in service. These increases were partially offset by a $2.8 million increase in the amount of salaries capitalized for the development of internal use software costs which reduced technology and development expenses during the period.
Capitalized software costs increased $1.8 million for 2015 as compared to 2014 primarily due to the increase in the amount of salaries capitalized for the development of internal use software of $2.8 million, which was partially offset by a decrease in capitalized third-party software costs of $1.0 million.
General and Administrative Expenses
Years Ended December 31, | % Change | ||||||||||||||||
2016 | 2015 | 2014 | 2016 vs. 2015 | 2015 vs. 2014 | |||||||||||||
(dollars in thousands) | |||||||||||||||||
General and administrative expense | $ | 59,908 | $ | 83,494 | $ | 58,296 | (28.2 | )% | 43.2 | % | |||||||
General and administrative expense as a percentage of revenues | 21.6 | % | 32.1 | % | 28.2 | % | |||||||||||
Year ended December 31, 2016 compared to year ended December 31, 2015. General and administrative expenses decreased $23.6 million or 28.2% for 2016 as compared to 2015. The decrease is primarily due to a $19.4 million reduction in stock based-compensation as a result of certain terminated executives who received accelerations and modifications of their equity awards in 2015. Additionally, the decrease in general and administration expense includes a $7.5 million decrease in professional services fees primarily due to decreased legal fees related to ongoing litigation. These decreases were partially offset by an increase of $2.4 million in facilities costs, which includes a $0.8 million increase in real estate exit costs associated with certain leased facilities that we exited in the fourth quarter of 2015.
Year ended December 31, 2015 compared to year ended December 31, 2014. The increase in general and administrative expenses of $25.2 million or 43.2% for 2015 as compared to 2014 reflected a $13.9 million increase in stock-based compensation due
45
primarily to the acceleration and modification of equity awards related to certain terminated executives of $10.7 million, additional stock-based compensation expense of $2.1 million associated with the surrender and forfeiture of unvested options held by our former president and additional stock-based compensation of $1.1 million primarily related to awards granted in 2015. Other increases in general and administrative expenses include an increase of $5.3 million in professional fees, which includes an increase of $4.5 million in legal fees related to ongoing litigation, an increase of $3.6 million in overhead related to facilities, which includes $2.2 million in real estate exit costs associated with certain leased facilities that we exited in the fourth quarter of 2015, and an increase of $2.1 million in salaries and related expenses, primarily due to executive severance. For further discussion of executive severance, refer to Note 6 to our consolidated financial statements contained herein.
Depreciation and Amortization Expenses
Years Ended December 31, | % Change | ||||||||||||||||
2016 | 2015 | 2014 | 2016 vs. 2015 | 2015 vs. 2014 | |||||||||||||
(dollars in thousands) | |||||||||||||||||
Depreciation and amortization expenses | $ | 23,345 | $ | 17,646 | $ | 13,213 | 32.3 | % | 33.6 | % | |||||||
Year ended December 31, 2016 compared to year ended December 31, 2015. Depreciation and amortization expenses increased $5.7 million or 32.3% for 2016 as compared to 2015. The increase is primarily related to growth in capitalized software costs and includes $2.1 million in accelerated depreciation related to software assets that we have determined to have shortened useful lives in light of recently commenced efforts to upgrade our technology infrastructure. The shortened useful lives of these assets result in comparatively greater depreciation in 2016 than the corresponding periods in 2015. We expect our depreciation and amortization expenses to continue to be affected by the amount of capitalized internally developed software costs, property and equipment and the timing of placing projects in service.
Year ended December 31, 2015 compared to year ended December 31, 2014. The increase in depreciation and amortization expenses of $4.4 million or 33.6% for 2015 as compared to 2014 reflected a growth in capitalized software costs and higher investments in property and equipment.
Interest Expense
Years Ended December 31, | % Change | ||||||||||||||||
2016 | 2015 | 2014 | 2016 vs. 2015 | 2015 vs. 2014 | |||||||||||||
(dollars in thousands) | |||||||||||||||||
Interest expense | $ | 2,530 | $ | 443 | $ | 380 | 471.1 | % | 16.6 | % | |||||||
Year ended December 31, 2016 compared to year ended December 31, 2015. Interest expense relates to interest incurred on our lease financing obligation for our Santa Monica leased office space and San Francisco leased office space. The increase in interest expense of $2.1 million or 471.1% for 2016 as compared to 2015 is primarily due to our Santa Monica leased office space, for which we began expensing interest in December 2015. We expect to incur a consistent level of interest expense on our lease financing obligation in future periods.
Year ended December 31, 2015 compared to year ended December 31, 2014. The increase in interest expense of $0.1 million or 16.6% for 2015 as compared to 2014 primarily reflects the interest expense incurred on our lease financing obligation in 2015, partially offset by a decrease in the interest on our outstanding balance of our short-term borrowings in 2014.
Provision for Income Taxes
Years Ended December 31, | % Change | ||||||||||||||||
2016 | 2015 | 2014 | 2016 vs. 2015 | 2015 vs. 2014 | |||||||||||||
(dollars in thousands) | |||||||||||||||||
Provision for income taxes | $ | 655 | $ | 606 | $ | 640 | 8.1 | % | (5.3 | )% | |||||||
Years ended December 31, 2016, December 31, 2015 and December 31, 2014. Our provision for income taxes for 2016, 2015, and 2014 primarily reflected tax expense due to amortization of tax deductible goodwill that is not an available source of income to realize our deferred tax assets.
46
Quarterly Key Metrics and Results of Operations
The following tables set forth selected key metrics and unaudited quarterly consolidated statements of comprehensive loss data for each of the quarters indicated. The consolidated financial statements for each of these quarters have been prepared on the same basis as the audited consolidated financial statements included herein and, in the opinion of management, include all adjustments, consisting only of normal recurring adjustments, necessary for the fair statement of the consolidated results of operations for these periods. You should read this information together with our consolidated financial statements and related notes included herein. These quarterly operating results are not necessarily indicative of the results for any future period.
Three Months Ended | |||||||||||||||||||||||||||||||
Dec. 31, | Sept. 30, | Jun. 30, | Mar. 31, | Dec. 31, | Sept. 30, | Jun. 30, | Mar. 31, | ||||||||||||||||||||||||
2016 | 2016 | 2016 | 2016 | 2015 | 2015 | 2015 | 2015 | ||||||||||||||||||||||||
Average Monthly Unique Visitors | 7,046,065 | 7,600,900 | 6,683,027 | 6,689,458 | 5,897,417 | 6,634,659 | 5,953,061 | 5,520,235 | |||||||||||||||||||||||
Units(1) | 218,807 | 220,633 | 192,531 | 174,982 | 183,157 | 208,034 | 190,358 | 168,559 | |||||||||||||||||||||||
Monetization | $ | 320 | $ | 319 | $ | 321 | $ | 328 | $ | 324 | $ | 324 | $ | 317 | $ | 322 | |||||||||||||||
Franchise Dealer Count (Ending) | 11,151 | 10,759 | 10,135 | 9,281 | 9,094 | 8,702 | 9,300 | 9,108 | |||||||||||||||||||||||
Transaction Revenue Per Franchise Dealer | $ | 6,386 | $ | 6,730 | $ | 6,370 | $ | 6,249 | $ | 6,662 | $ | 7,493 | $ | 6,563 | $ | 6,164 | |||||||||||||||
Three Months Ended | |||||||||||||||||||||||||||||||
Dec. 31, | Sept. 30, | Jun. 30, | Mar. 31, | Dec. 31, | Sept. 30, | Jun. 30, | Mar. 31, | ||||||||||||||||||||||||
2016 | 2016 | 2016 | 2016 | 2015 | 2015 | 2015 | 2015 | ||||||||||||||||||||||||
(in thousands) | |||||||||||||||||||||||||||||||
Revenues: | |||||||||||||||||||||||||||||||
Transaction revenues | $ | 69,960 | $ | 70,306 | $ | 61,841 | $ | 57,409 | $ | 59,278 | $ | 67,441 | $ | 60,408 | $ | 54,268 | |||||||||||||||
Forecasts, consulting, and other revenues | 4,121 | 4,833 | 4,586 | 4,451 | 4,310 | 4,964 | 4,883 | 4,286 | |||||||||||||||||||||||
Total revenues | 74,081 | 75,139 | 66,427 | 61,860 | 63,588 | 72,405 | 65,291 | 58,554 | |||||||||||||||||||||||
Costs and operating expenses: | |||||||||||||||||||||||||||||||
Cost of revenue (exclusive of depreciation and amortization presented separately below) | 6,257 | 6,320 | 6,365 | 6,225 | 5,987 | 5,952 | 5,927 | 5,791 | |||||||||||||||||||||||
Sales and marketing | 41,609 | 42,557 | 38,129 | 32,111 | 34,867 | 43,969 | 40,457 | 31,709 | |||||||||||||||||||||||
Technology and development | 13,265 | 13,153 | 14,022 | 13,140 | 14,942 | 12,340 | 10,979 | 9,760 | |||||||||||||||||||||||
General and administrative | 14,649 | 13,765 | 15,998 | 15,496 | 29,851 | 16,467 | 18,407 | 18,769 | |||||||||||||||||||||||
Depreciation and amortization | 5,538 | 6,035 | 5,868 | 5,904 | 5,125 | 4,477 | 4,119 | 3,925 | |||||||||||||||||||||||
Total costs and expenses | 81,318 | 81,830 | 80,382 | 72,876 | 90,772 | 83,205 | 79,889 | 69,954 | |||||||||||||||||||||||
Loss from operations | (7,237 | ) | (6,691 | ) | (13,955 | ) | (11,016 | ) | (27,184 | ) | (10,800 | ) | (14,598 | ) | (11,400 | ) | |||||||||||||||
Interest income | 90 | 91 | 102 | 93 | 36 | 27 | 24 | 20 | |||||||||||||||||||||||
Interest expense | (645 | ) | (645 | ) | (632 | ) | (608 | ) | (121 | ) | (159 | ) | (118 | ) | (45 | ) | |||||||||||||||
Other (expense) income | — | — | — | — | (1 | ) | — | 3 | 11 | ||||||||||||||||||||||
Loss before provision for income taxes | (7,792 | ) | (7,245 | ) | (14,485 | ) | (11,531 | ) | (27,270 | ) | (10,932 | ) | (14,689 | ) | (11,414 | ) | |||||||||||||||
Provision for income taxes | 158 | 191 | 170 | 136 | 174 | 173 | 50 | 209 | |||||||||||||||||||||||
Net loss | $ | (7,950 | ) | $ | (7,436 | ) | $ | (14,655 | ) | $ | (11,667 | ) | $ | (27,444 | ) | $ | (11,105 | ) | $ | (14,739 | ) | $ | (11,623 | ) | |||||||
Net loss per share: | |||||||||||||||||||||||||||||||
Basic and diluted | $ | (0.09 | ) | $ | (0.09 | ) | $ | (0.17 | ) | $ | (0.14 | ) | $ | (0.33 | ) | $ | (0.13 | ) | $ | (0.18 | ) | $ | (0.14 | ) | |||||||
Other Financial Information (2): | |||||||||||||||||||||||||||||||
Adjusted EBITDA | $ | 5,766 | $ | 5,791 | $ | 2,430 | $ | 1,052 | $ | 159 | $ | 2,651 | $ | 477 | $ | 4,285 | |||||||||||||||
Non-GAAP net (loss) income | $ | (485 | ) | $ | (989 | ) | $ | (4,138 | ) | $ | (5,503 | ) | $ | (5,225 | ) | $ | (2,131 | ) | $ | (3,786 | ) | $ | 126 | ||||||||
(1) | We issued full credits of the amount originally invoiced with respect to 5,736, 4,547, 4,546, 4,192, 3,604, 3,319, 2,802, and 2,759, units during the three months ended December 31, 2016, September 30, 2016, June 30, 2016, March 31, 2016, December 31, 2015, September 30, 2015, June 30, 2015, and March 31, 2015, respectively. The number of units has not been adjusted downwards related to units credited. |
(2) | Adjusted EBITDA and Non-GAAP net (loss) income are not measures of our financial performance under GAAP and should not be considered as alternatives to net income, operating income or any other measures derived in accordance with GAAP. For definitions of Adjusted EBITDA and Non-GAAP net (loss) income and a reconciliation of net loss to Adjusted EBITDA and Non-GAAP net (loss) income, see “Non-GAAP Financial Measures.” |
47
The following table presents a reconciliation of net loss to Adjusted EBITDA for each of the periods presented:
Three Months Ended | |||||||||||||||||||||||||||||||
Dec. 31, | Sept. 30, | Jun. 30, | Mar. 31, | Dec. 31, | Sept. 30, | Jun. 30, | Mar. 31, | ||||||||||||||||||||||||
2016 | 2016 | 2016 | 2016 | 2015 | 2015 | 2015 | 2015 | ||||||||||||||||||||||||
(in thousands) | |||||||||||||||||||||||||||||||
Reconciliation of Net Loss to Adjusted EBITDA | |||||||||||||||||||||||||||||||
Net loss | $ | (7,950 | ) | $ | (7,436 | ) | $ | (14,655 | ) | $ | (11,667 | ) | $ | (27,444 | ) | $ | (11,105 | ) | $ | (14,739 | ) | $ | (11,623 | ) | |||||||
Non-GAAP Adjustments: | |||||||||||||||||||||||||||||||
Interest income | (90 | ) | (91 | ) | (102 | ) | (93 | ) | (36 | ) | (27 | ) | (24 | ) | (20 | ) | |||||||||||||||
Interest expense | 645 | 645 | 632 | 608 | 121 | 159 | 118 | 45 | |||||||||||||||||||||||
Depreciation and amortization | 5,538 | 6,035 | 5,868 | 5,904 | 5,125 | 4,477 | 4,119 | 3,925 | |||||||||||||||||||||||
Stock-based compensation (1) | 6,706 | 6,241 | 5,900 | 5,892 | 16,412 | 7,531 | 9,167 | 9,453 | |||||||||||||||||||||||
Warrant expense (reduction) | 33 | 13 | — | — | (15 | ) | (308 | ) | (333 | ) | (147 | ) | |||||||||||||||||||
Certain litigation costs (2) | 345 | 193 | 150 | 272 | 429 | 1,180 | 2,119 | 2,443 | |||||||||||||||||||||||
Severance charges (3) | — | — | 1,783 | — | 3,161 | 571 | — | — | |||||||||||||||||||||||
Lease exit charges (4) | 381 | — | 2,684 | — | 2,232 | — | — | — | |||||||||||||||||||||||
Provision for income taxes. | 158 | 191 | 170 | 136 | 174 | 173 | 50 | 209 | |||||||||||||||||||||||
Adjusted EBITDA (5) | $ | 5,766 | $ | 5,791 | $ | 2,430 | $ | 1,052 | $ | 159 | $ | 2,651 | $ | 477 | $ | 4,285 | |||||||||||||||
(1) | Includes stock-based compensation of $10.7 million incurred in the fourth quarter of 2015 related to the departure of certain executives. |
(2) | The excluded amounts relate to legal costs incurred in connection with a claim we filed against Sonic Automotive Holdings, Inc. (the "Sonic Litigation"), complaints filed by non-TrueCar dealers and the California New Car Dealers Association against TrueCar, and securities and consumer class action lawsuits. We believe the exclusion of these costs is appropriate to facilitate comparisons of our core operating performance on a period-to-period basis. We do not believe significant trademark litigation like the Sonic Litigation is reflective of a trend in our underlying operations. Based on the nature of the specific claims underlying the excluded litigation matters, once these matters are resolved, we do not believe our operations are likely to entail defending against the types of claims raised by these matters. We expect the cost of defending these claims to continue to be significant pending resolution. |
(3) | We incurred $1.3 million in severance costs in the second quarter of 2016 related to a reorganization of our product and technology teams to better align our resources with business objectives as we transition from multiple software platforms to a unified architecture. We incurred severance costs of $0.5 million, $0.6 million and $2.8 million for executive-level employees who terminated during the quarters ended June 30, 2016, September 30, 2015 and December 31, 2015, respectively. In addition, we also incurred $0.3 million of related recruiting fees for the placement of our new CEO in the fourth quarter of 2015. We believe excluding the impact of these terminations is consistent with our use of these non-GAAP measures as we do not believe they are a useful indicator of ongoing operating results. |
(4) | Represents the initial estimate and updates to that estimate of lease termination costs associated with the consolidation of the Company's office locations in Santa Monica, California in December 2015. We believe that their exclusion is appropriate to facilitate period-to-period operating performance comparisons. |
(5) | Adjusted EBITDA is not a measure of our financial performance under GAAP and should not be considered as an alternative to net income, operating income or any other measures derived in accordance with GAAP. For a definition of Adjusted EBITDA, see “Non-GAAP Financial Measures.” |
48
The following table presents a reconciliation of net loss to Non-GAAP net (loss) income for each of the periods presented:
Three Months Ended | |||||||||||||||||||||||||||||||
Dec. 31, | Sept. 30, | Jun. 30, | Mar. 31, | Dec. 31, | Sept. 30, | Jun. 30, | Mar. 31, | ||||||||||||||||||||||||
2016 | 2016 | 2016 | 2016 | 2015 | 2015 | 2015 | 2015 | ||||||||||||||||||||||||
(in thousands) | |||||||||||||||||||||||||||||||
Reconciliation of Net Loss to Non-GAAP Net (Loss) Income | |||||||||||||||||||||||||||||||
Net loss | $ | (7,950 | ) | $ | (7,436 | ) | $ | (14,655 | ) | $ | (11,667 | ) | $ | (27,444 | ) | $ | (11,105 | ) | $ | (14,739 | ) | $ | (11,623 | ) | |||||||
Non-GAAP Adjustments: | |||||||||||||||||||||||||||||||
Stock-based compensation (1) | 6,706 | 6,241 | 5,900 | 5,892 | 16,412 | 7,531 | 9,167 | 9,453 | |||||||||||||||||||||||
Warrant expense (reduction) | 33 | 13 | — | — | (15 | ) | (308 | ) | (333 | ) | (147 | ) | |||||||||||||||||||
Certain litigation costs (2) | 345 | 193 | 150 | 272 | 429 | 1,180 | 2,119 | 2,443 | |||||||||||||||||||||||
Severance charges (3) | — | — | 1,783 | — | 3,161 | 571 | — | — | |||||||||||||||||||||||
Lease exit charges (4) | 381 | — | 2,684 | — | 2,232 | — | — | — | |||||||||||||||||||||||
Non-GAAP net (loss) income (5) (6) | $ | (485 | ) | $ | (989 | ) | $ | (4,138 | ) | $ | (5,503 | ) | $ | (5,225 | ) | $ | (2,131 | ) | $ | (3,786 | ) | $ | 126 | ||||||||
(1) | Includes stock-based compensation of $10.7 million incurred in the fourth quarter of 2015 related to the departure of certain executives. |
(2) | The excluded amounts relate to legal costs incurred in connection with a claim we filed against Sonic Automotive Holdings, Inc. (the "Sonic Litigation"), complaints filed by non-TrueCar dealers and the California New Car Dealers Association against TrueCar, and securities and consumer class action lawsuits. We believe the exclusion of these costs is appropriate to facilitate comparisons of our core operating performance on a period-to-period basis. We do not believe significant trademark litigation like the Sonic Litigation is reflective of a trend in our underlying operations. Based on the nature of the specific claims underlying the excluded litigation matters, once these matters are resolved, we do not believe our operations are likely to entail defending against the types of claims raised by these matters. We expect the cost of defending these claims to continue to be significant pending resolution. |
(3) | We incurred $1.3 million in severance costs in the second quarter of 2016 related to a reorganization of our product and technology teams to better align our resources with business objectives as we transition from multiple software platforms to a unified architecture. We incurred severance costs of $0.5 million, $0.6 million and $2.8 million for executive-level employees who terminated during the quarters ended June 30, 2016, September 30, 2015 and December 31, 2015, respectively. In addition, we also incurred $0.3 million of related recruiting fees for the placement of our new CEO in the fourth quarter of 2015. We believe excluding the impact of these terminations from 2015 is consistent with our use of these non-GAAP measures as we do not believe they are a useful indicator of ongoing operating results. |
(4) | Represents the initial estimate and updates to that estimate of lease termination costs associated with the consolidation of the Company's office locations in Santa Monica, California in December 2015. We believe that their exclusion is appropriate to facilitate period-to-period operating performance comparisons. |
(5) | There is no income tax impact related to the adjustments made to calculate Non-GAAP net loss because of our available net operating loss carryforwards and the full valuation allowance recorded against our net deferred tax assets at December 31, 2016 and 2015. |
(6) | Non-GAAP net (loss) income is not a measure of our financial performance under GAAP and should not be considered as an alternative to net income, operating income or any other measures derived in accordance with GAAP. For a definition of Non-GAAP net income (loss) see “Non-GAAP Financial Measures.” |
Liquidity and Capital Resources
At December 31, 2016, our principal sources of liquidity were cash and cash equivalents totaling $107.7 million. Since inception, our operations have been financed primarily by net proceeds from the sales of shares of our capital stock and proceeds from the issuance of indebtedness.
We have incurred cumulative losses of $318.2 million from our operations through December 31, 2016, and expect to incur additional losses in the future. We believe that our existing sources of liquidity will be sufficient to fund our operations for at least the next 12 months. However, our future capital requirements will depend on many factors, including our rate of revenue growth, the expansion of our sales and marketing activities, and the timing and extent of our spending to support our technology and development
49
efforts. To the extent that existing cash and cash equivalents, and cash from operations are insufficient to fund our future activities, we may need to raise additional funds through public or private equity or debt financing. Additional funds may not be available on terms favorable to us or at all.
Credit Facility
On February 18, 2015, we amended our credit facility to provide advances of up to $35.0 million. This amended credit facility provides a $10.0 million subfacility for the issuance of letters of credit and contains an increase option permitting us, subject to the lenders consent, to increase the revolving credit facility by up to $15.0 million, to an aggregate maximum of $50 million. The credit facility has a three-year term and matures on February 18, 2018. No amounts were outstanding at December 31, 2016. The amount available under the amended credit facility at December 31, 2016 was $30.7 million, reduced for the letters of credit issued and outstanding under the subfacility of $4.3 million. See Note 5 of our consolidated financial statements herein for more information about our amended credit facility.
Cash Flows
The following table summarizes our cash flows:
Year Ended December 31, | |||||||||||
2016 | 2015 | 2014 | |||||||||
(in thousands) | |||||||||||
Consolidated Cash Flow Data: | |||||||||||
Net cash provided by (used in) operating activities | $ | 2,768 | $ | (11,369 | ) | $ | 3,104 | ||||
Net cash used in investing activities | (16,639 | ) | (29,836 | ) | (9,823 | ) | |||||
Net cash provided by financing activities | 9,221 | 6,037 | 110,439 | ||||||||
Net (decrease) increase in cash and cash equivalents | $ | (4,650 | ) | $ | (35,168 | ) | $ | 103,720 | |||
Operating Activities
Our net loss and cash flows used in operating activities are significantly influenced by our investments in headcount and infrastructure to support our growth, and marketing, advertising and sponsorship expenses. Our net loss has been significantly greater than cash used in or provided by operating activities due to the inclusion of non-cash expenses and charges.
Cash provided by operating activities in 2016 was $2.8 million. This was primarily due to our net loss of $41.7 million, which, adjusted for non-cash items, including stock-based compensation expense of $24.7 million, depreciation and amortization expense of $23.2 million, bad debt expense of $1.3 million, and other non-cash adjustments of $1.5 million, resulted in $9.0 million in cash from operations. This was offset by a decrease of $6.2 million in changes to operating assets and liabilities, which primarily reflected a decrease of $4.6 million in accounts payable primarily due to decreased affinity group marketing fees, an increase of $4.4 million in accounts receivable primarily related to increased revenues, and an increase of $1.5 million in other current assets and other assets due to increased legal insurance recoveries and increased lease deposits. These were partially offset by a $1.5 million increase in accrued expenses and other current liabilities, a $1.5 million increase in other liabilities, and a $1.2 million increase in accrued employee expenses primarily due to increased accrued bonus.
Cash used in operating activities in 2015 was $11.4 million. This was primarily due to our net loss of $64.9 million, which, adjusted for non-cash items, including depreciation and amortization expense of $17.3 million, stock-based compensation expense of $42.6 million, and loss on disposal of fixed assets of $1.6 million, resulted in $2.7 million in cash used in operations. This use of cash was also due to $8.6 million in changes to operating assets and liabilities, which primarily reflected a decrease of $6.5 million in accrued employee expenses primarily related to lower accrued bonuses, an increase of $5.9 million in accounts receivable primarily related to increased revenues, a decrease of $1.8 million in accrued expenses and other current liabilities primarily due to decreased marketing fees. These were partially offset by a $5.3 million increase in accounts payable primarily due to increased affinity group marketing fees and growth in our business and a decrease of $1.1 million in other current assets primarily due to a decrease in a receivable from a legal settlement in our favor.
Cash provided by operating activities in 2014 was $3.1 million. This was primarily due to our net loss of $48.4 million, which, adjusted for non-cash items, including depreciation and amortization expense of $13.0 million, stock-based compensation expense of $29.3 million, common stock warrant expense of $9.9 million, and other non-cash adjustments of $1.3 million, resulted in $5.1 million in cash provided by operations. This was offset by a decrease of $2.0 million in changes to operating assets and liabilities, which reflected a decrease in accrued expenses and other liabilities of $4.3 million, primarily related to increases in accrued marketing expenses, legal costs, and construction costs; a decrease in accrued employee expenses of $3.9 million related to increased accrued
50
bonuses driven by growth in headcount; and a decrease in accounts payable of $3.4 million, primarily related to affinity group marketing fees. These were partially offset by a $10.4 million increase in accounts receivable as a result of our increased revenues, $1.7 million increase in prepaid expenses related to media production, insurance, and software costs, and a $1.3 million increase in other assets related to amounts receivable from a legal settlement in our favor.
Investing Activities
Our investing activities consist primarily of capital expenditures for capitalized software development costs and property and equipment and changes in restricted cash requirements associated with our modified marketing arrangement with Yahoo!.
Cash used in investing activities of $16.6 million for 2016 resulted primarily from $11.5 million of investments in software, $3.8 million of investments in furniture, leasehold, and facility improvements, and $1.3 million of investment in computer hardware.
Cash used in investing activities of $29.8 million for 2015 resulted primarily from $13.8 million of investments in software, $12.7 million of investments in furniture, leasehold, and facility improvements primarily associated with our San Francisco and Santa Monica office spaces, and $3.3 million of investment in computer hardware.
Cash used in investing activities of $9.8 million for 2014 primarily resulted from investments in capitalized software development and property and equipment of $15.5 million and a purchase of $0.4 million related to the True.com domain name, which was partially offset by $4.1 million of repayments on notes receivable from related parties and the release of $2.0 million of restricted cash under our modified marketing arrangement with Yahoo!.
Financing Activities
Cash provided by financing activities of $9.2 million for 2016 primarily reflects $7.8 million of proceeds from the exercise of stock options, net of taxes paid for the net share settlement of certain equity awards, and a $1.5 million tenant improvement reimbursement related to our Santa Monica capitalized facility lease, partially offset by $0.1 million paid for the repurchase of common stock option awards.
Cash provided by financing activities of $6.0 million for 2015 primarily reflects $5.4 million of proceeds from the exercise of stock options, net of taxes paid for the net share settlement of certain equity awards, and a $0.6 million tenant improvement reimbursement related to a build-to-suit capitalized lease.
Cash provided by financing activities of $110.4 million for 2014 reflects $69.7 million of proceeds from our initial public offering, $30.9 million of proceeds from our follow-on offering, approximately $9.4 million of proceeds from the exercise of warrants, $5.3 million of proceeds from the exercise of stock options, net of taxes paid for the net share settlement of certain equity awards, and $5.0 million of proceeds from borrowings under our credit facility, which was partially offset by repayment of $10.0 million under our credit facility.
Contractual Obligations and Known Future Cash Requirements
Contractual Obligations
Set forth below is information concerning our known contractual obligations at December 31, 2016 that are fixed and determinable.
Total | Less Than 1 Year | 1 - 3 Years | 3 - 5 Years | More Than 5 Years | |||||||||||||||
(in thousands) | |||||||||||||||||||
Lease obligations | $ | 87,244 | $ | 9,749 | $ | 20,560 | $ | 17,278 | $ | 39,657 | |||||||||
Purchase obligations | 7,037 | 3,994 | 3,043 | — | — | ||||||||||||||
Total | $ | 94,281 | $ | 13,743 | $ | 23,603 | $ | 17,278 | $ | 39,657 | |||||||||
Our lease obligations consist of various leases for office space and have not been reduced by minimum non-cancelable sublease rentals aggregating $6.1 million. Purchase obligations include long-term agreements to purchase data information, software related licenses and support services, and other obligations that are enforceable and legally binding as of December 31, 2016. Purchase obligations exclude agreements that are cancelable without penalty. Contingent obligations arising from unrecognized tax benefits are
51
not included in the contractual obligations because it is expected that the unrecognized benefits would only result in an insignificant amount of cash payments.
Off-Balance Sheet Arrangements
We do not engage in transactions that generate relationships with unconsolidated entities or financial partnerships, such as entities often referred to as structured finance or special purpose entities, as part of our ongoing business. Accordingly, our operating results, financial condition, and cash flows are not subject to off-balance sheet risks.
Critical Accounting Policies and Estimates
Our consolidated financial statements are prepared in accordance with U.S. generally accepted accounting principles, or GAAP. The preparation of these consolidated financial statements requires us to make estimates and assumptions that affect the reported amounts of assets, liabilities, revenue, expenses and related disclosures. We evaluate our estimates and assumptions on an ongoing basis. Our estimates are based on historical experience and various other assumptions on an ongoing basis and that we believe to be reasonable under the circumstances. Our actual results could differ from these estimates.
We believe that the assumptions and estimates associated with revenue recognition, sales allowances and allowances for doubtful accounts, the fair value of assets and liabilities assumed in business combinations, the recoverability of goodwill and long-lived assets, valuation allowances with respect to deferred tax assets, the expensing and capitalization of software and website development costs, and the valuation and assumptions underlying stock-based compensation and other equity instruments have the greatest potential impact on our consolidated financial statements. Therefore, we consider these to be our critical accounting policies and estimates. For further information on all of our significant accounting policies, see Note 2 of our consolidated financial statements included herein.
Revenue Recognition
We recognize revenue when all of the following criteria have been met:
• | Persuasive evidence of an arrangement exists. |
• | Delivery has occurred or services have been rendered. |
• | The fees are fixed or determinable. |
• | Collectability is reasonably assured. We assess collectability based primarily on the creditworthiness of the customer as determined by credit checks and analysis, as well as the customer’s payment history. |
Deferred revenue is recognized on the accompanying consolidated balance sheets when payments are received in advance of us meeting all of the revenue recognition criteria described above.
Transaction Revenue
We recognize revenue for fee arrangements based on a per vehicle basis when the vehicle sale has occurred between the automotive buying website program user and dealer. Under the contractual terms and conditions with our network of TrueCar Certified Dealers, the dealer is required to pay us upon the sale of a vehicle to a user that has been provided to the dealer by us. Revenue recognition is not contingent on verification or acceptance of the transaction by the dealer.
Upon a user deciding to proceed with the user’s vehicle purchase through us, the user provides his or her name, address, e-mail, and phone number during the process of obtaining a Guaranteed Savings Certificate, which gives us the identity and source of a TrueCar lead provided to a specific dealer prior to an actual sale occurring. After a sale occurs, we receive real-time information regarding the sale, including the identity of the purchaser, via the Dealer Management System, “DMS”, used by the dealer that made the sale. To the extent that a sale is not matched via comparison of user information we have to sale information provided by the DMS, we also establish matches via one or more of the over 20 different data feeds provided to the Company by third party data aggregators, loan and insurance files provided by our affinity group marketing partners and other publicly available sources. This process often results in overlapping sales matches between the DMS and multiple data feeds, resulting in a high degree of certainty with respect to our ability to identify user leads that we provide to the dealers. This data is also used to invoice dealers shortly after the completion of the sales transactions. As a result of the various data sources available to us, it is unusual for us to have difficulty in reconciling introductions provided to our network of dealers to actual vehicle sales under our platform.
52
Revenue is recognized net of estimated sales allowances. We establish sales allowances at the time of revenue recognition based on our history of adjustments and credits provided to our TrueCar Certified Dealers. Sales allowances relate primarily to credits issued where a dealer claims that an introduction was previously identified by the dealer from a source other than us. While the dealer is contractually obligated to pay the invoice, we may issue a credit against the invoice to maintain overall dealer relations. In assessing the adequacy of the sales allowance, we evaluate our history of adjustments and credits made through the date of the issuance of the financial statements. While estimated sales adjustments and credits and ultimate losses may vary from actual results, and could be material to the financial statements, actual sales allowances have been materially consistent with our estimates.
We also recognize revenue from dealers under subscription arrangements. Subscription fee arrangements are short-term in nature with terms ranging from one to six months and are cancellable by the dealer or us at any time. Subscription arrangements fall into three types: flat rate subscriptions, subscriptions subject to downward adjustment based on a minimum number of vehicle sales (“guaranteed sales”) and subscriptions based on introduction volume, including those subject to downward adjustment based on a minimum number of introductions (“guaranteed introductions”). Under flat rate subscription arrangements, fees are charged at a monthly flat rate regardless of the number of sales made to users of our platform by the dealer. For flat rate subscription arrangements, we recognize the fees as revenue over the subscription period on a straight line basis which corresponds to the period that we are providing the dealer with access to our platform. Under guaranteed sales subscription arrangements fees are charged based on the number of guaranteed sales multiplied by a fixed amount per vehicle. To the extent that the actual number of vehicles sold by the dealers to users of our platform is less than the number of guaranteed sales, we provide a credit to the dealer. To the extent that the actual number of vehicles sold exceeds the number of guaranteed sales, we are not entitled to any additional fees. Certain of our subscription arrangements are charged based on volume of introductions provided while other introduction based subscription arrangements operate under a guaranteed introduction model. Under guaranteed introductions subscription arrangements, fees are charged based on a periodically-updated formula that considers, among other things, the introductions anticipated to be provided to the dealer. To the extent that the number of actual introductions is less than the number of guaranteed introductions, we provide a credit to the dealer. To the extent that the actual number of introductions provided exceeds the number guaranteed, we are not entitled to any additional fees. For guaranteed sales and guaranteed introductions subscription arrangements, we recognize revenue based on the lesser of (i) the actual number of sales generated or introductions delivered through our platform during the subscription period multiplied by the contracted price per sale/introduction or (ii) the guaranteed number of sales or introductions multiplied by the contracted price per sale/introduction.
In addition, some automobile manufacturers promote the sale of their vehicles through the offering of additional consumer incentives to members of our affinity group marketing partners. These manufacturers pay a per-vehicle fee to us for promotion of the incentive and we recognize as revenue the per-vehicle incentive fee at the time the sale of the vehicle has occurred between the Automotive Website Program user and the dealer.
Forecasts, Consulting and Other Revenue
We also derive revenue from providing forecasts, consulting and other services to the automotive and financial services industries. Additional revenue sources include lead referral fees, advertising fees earned from display advertisements on the TrueCar.com website, and data licensing fees earned for licensing certain proprietary data to third parties. We generally recognize revenue upon delivery of such services.
Sales of forecasts, consulting and other services may include multiple deliverables including sale of lease residual data, guidebooks and consulting services. We therefore recognize revenues for these arrangements in accordance with FASB ASC 605-25, Revenue Recognition — Multiple-Element Arrangements (“ASC 605-25”). ASC 605-25 was updated by Accounting Standards Update (“ASU”) 2009-13, Revenue Recognition (Topic 605) — Multiple-Deliverable Revenue Arrangements — a Consensus of the Emerging Issues Task Force (“ASU 2009-13”).
For multiple deliverable revenue arrangements, we first assess whether each deliverable has value to the customer on a standalone basis and performance is considered probable and substantially in our control. Forecasts and consulting services are sold both on a standalone basis and as part of multiple deliverable arrangements. Accordingly, the services have standalone value to the customer. Based on that standalone value of the deliverables, we allocate our revenues among the separate deliverables in the arrangement using the relative selling price method hierarchy established in ASU 2009-13. This hierarchy requires the selling price of each deliverable in a multiple deliverable revenue arrangement to be based on, in descending order: (i) vendor-specific objective evidence, or VSOE, (ii) third-party evidence of selling price, or TPE, or (iii) management’s best estimated selling price, or BESP.
We have not established VSOE or TPE for our forecasts, consulting and other services because the deliverables are not sold separately within a sufficiently narrow price range or third party pricing for comparable services is not available; therefore, we apply judgment to determine BESP. The objective of BESP is to determine the price at which we would transact a sale if the service were sold on a stand-alone basis. The determination of BESP requires us to make significant estimates and judgments and we consider numerous factors in this determination, including the nature of the deliverables, market conditions and our competitive landscape,
53
internal costs, and our pricing and discounting practices associated with actual transactions. We update our estimates of BESP on a periodic basis as events and as circumstances may require.
Revenue from the sale of lease residual value data and guidebooks is recognized in the period that the data or report is delivered. Revenue in connection with consulting services is recognized in the period the report is completed and delivered to the customer.
Allowances for Doubtful Accounts
We determine our allowance for doubtful accounts based on our historical write-off experience and when specific circumstances make it likely that recovery will not occur. We review the allowance for doubtful accounts periodically and assesses the aging of account balances, with an emphasis on those that are past due over ninety days. Account balances are charged off against the allowance when we determine that it is probable the receivable will not be recovered.
Business Combinations
The results of businesses acquired in a business combination are included in our consolidated financial statements from the date of the acquisition. Purchase accounting results in assets and liabilities of an acquired business being recorded at their estimated fair values on the acquisition date. Any excess consideration over the fair value of assets acquired and liabilities assumed is recognized as goodwill.
We perform valuations of assets acquired and liabilities assumed for an acquisition and allocate the purchase price to the respective net tangible and intangible assets. Determining the fair value of assets acquired and liabilities assumed requires management to use significant judgment and estimates including the selection of valuation methodologies, estimates of future revenues and cash flows and discount rates. We engage the assistance of valuation specialists in arriving at fair value measurements in connection with fair values of assets and liabilities assumed in a business combination.
Transaction costs associated with business combinations are expensed as incurred, and are included in general and administrative expenses in our consolidated statement of comprehensive loss.
Goodwill
Goodwill represents the excess of the aggregate purchase price paid over the fair value of the identifiable assets and liabilities acquired in our business combinations. Goodwill is not amortized and is tested for impairment at least annually or whenever events or changes in circumstances indicate that the carrying value may not be recoverable. Events or changes in circumstances which could trigger an impairment review include a significant adverse change in business climate, an adverse action or assessment by a regulator, unanticipated competition, a loss of key personnel, significant changes in the manner of our use of the acquired assets or the strategy for our overall business, significant negative industry or economic trends, or significant underperformance relative to expected historical or projected future results of operations.
We have the option to assess goodwill for possible impairment by performing a qualitative analysis to determine it is more likely than not that the fair value of a reporting unit is less than its carrying amount or perform the first step in an impairment test.
The first step ("Step 1") involves comparing the estimated fair value of a reporting unit with its respective book value, including goodwill. If the estimated fair value exceeds book value, goodwill is considered not to be impaired and no additional steps are necessary. If, however, the fair value of the reporting unit is less than book value, then the second step is to compare the carrying amount of the goodwill to its implied fair value. The estimate of implied fair value of goodwill may require valuations of certain internally generated and unrecognized intangible assets. If the carrying amount of goodwill exceeds the implied fair value of that goodwill, an impairment loss is recognized in an amount equal to the excess.
We test for goodwill impairment annually at December 31. During the years ended December 31, 2016, 2015 and 2014, there were no impairment charges recorded on our goodwill. We performed a qualitative goodwill assessment at December 31, 2016 and concluded there was no impairment based on a number of factors considered, including the improvement in key operating metrics over the prior year, the value of our common stock, overall strength of the automotive industry and general economy, and continued execution against our overall strategic objectives. The fair value of the reporting units significantly exceeded their carrying value and accordingly, we concluded that there was no impairment of goodwill.
54
Impairment of Long-Lived Assets
We assess the impairment of long-lived assets, consisting primarily of property and equipment and intangible assets resulting from business combinations, whenever events or changes in circumstances indicate that the carrying amount of such assets may not be recoverable. Recoverability of assets to be held and used is measured first by a comparison of the carrying amount of an asset to the future undiscounted net cash flows expected to be generated by the assets. If such assets are considered to be impaired, an impairment loss equal to the excess of the asset’s carrying value over its fair value is recorded. When measuring the recoverability of these assets, we make assumptions regarding our estimated future cash flows expected to be generated by the assets. If our estimates or related assumptions change in the future, we may be required to impair these assets. We have not recognized any impairment of long-lived assets to date.
Software and Website Development Costs
Costs incurred in the preliminary project and post-implementation stages of development and maintenance of our platform are expensed as incurred. Certain costs incurred in the application development stage of a new product or projects to provide significant additional functionality to existing products are capitalized if certain criteria are met. Maintenance and enhancement costs are typically expensed as incurred. Such costs are amortized on a straight-line basis over the estimated useful lives of the related assets, which are estimated to be three years. Amortization expense is included in depreciation and amortization in the statements of comprehensive loss.
Stock-Based Compensation
We recognize stock-based compensation expense for stock-based compensation awards granted to our employees, consultants and other service providers that can be settled in shares of our common stock. We estimate the grant date fair value of option grants, and the resulting stock-based compensation using the Black-Scholes option-pricing model. For restricted stock awards and restricted stock units, we use the market value of the Company’s common stock on the date of grant to determine the fair value of the award. Stock-based compensation for employee awards is recognized on a straight-line basis over the requisite period, except for performance-based awards, which are recognized using the graded-vesting model.
Determining the fair value of awards using the Black-Scholes option-pricing model requires the use of highly subjective assumptions, including the expected term and the price volatility of the underlying stock, which are key inputs in the determination of the fair value of stock-based awards. These assumptions include:
• | Risk-free interest rate. The risk-free interest rate is based on the U.S. Treasury yield curve in effect at the time of grant with maturities approximately equal to the expected term of the options; |
• | Expected term. We use the simplified method under the SEC’s Staff Accounting Bulletin No. 107, Share-Based Payment, to calculate expected term for plain vanilla share options. For performance-based option awards and out-of-the money option grants, we determine the expected term based upon historical exercise and post-vesting cancellations, adjusted for expected future exercise behavior; |
• | Expected volatility. As we do not have a significant trading history for our common stock, expected volatility is derived from the historical stock volatilities of several comparable publicly listed peers over a period approximately equal to the expected term of the options. When making the selections of our comparable industry peers to be used in the volatility calculation, we considered the size, operational and economic similarities to our principal business operations; and |
• | Dividend yield. The expected dividend yield is assumed to be zero as we have never paid dividends and have no current plans to pay any dividends on our common stock. |
In 2016, the FASB issued guidance to simplify several aspects of the accounting for share-based payment award transactions, including accounting for forfeitures. Companies have the choice to elect as an accounting policy whether to continue to estimate forfeitures or recognize forfeitures when they occur. As part of our early adoption of this guidance in 2016, we elected to account for forfeitures as they occur. Prior to 2016, in addition to the assumptions used in the Black-Scholes option-pricing model, we estimated a forfeiture rate to calculate the stock-based compensation for our awards. We evaluated the appropriateness of the forfeiture rate based on actual forfeiture experience, analysis of employee turnover, and other factors.
We will continue to use judgment in evaluating the expected volatility and expected terms utilized for our stock-based compensation calculations on a prospective basis. As we continue to accumulate additional data related to our common stock, we may have refinements to the estimates of our expected volatility and expected term, which could materially impact our future stock-based compensation expense.
55
At December 31, 2016 total remaining stock-based compensation expense for unvested awards was $63.8 million, which is expected to be recognized over a weighted-average period of 3.0 years.
Prior to the date our common stock began trading on The NASDAQ Global Select Market, the fair value of our common stock had been approved by the board of directors at each grant date based on a variety of factors, including periodic valuations of our common stock, our financial position, historical financial performance, projected financial performance, valuations of publicly traded peer companies arm’s-length sales of our common stock, and the illiquid nature of common stock. Since our initial public offering, we determine the fair value of our common stock based on the closing price as quoted on The NASDAQ Global Select Market of our common stock on the grant date.
Income Taxes
We use the liability method of accounting for income taxes. Deferred tax assets and liabilities are recognized for the future tax consequences attributable to the differences between the financial statement carrying amounts of existing assets and liabilities and their respective tax basis. Deferred tax assets and liabilities are measured using enacted tax rates expected to be in effect when such assets and liabilities are recovered or settled. The effect on deferred tax assets and liabilities of a change in tax rates is recognized in the year that includes the enactment date. We determine deferred tax assets including net operating losses and liabilities, based on temporary differences between the book and tax bases of assets and liabilities. A valuation allowance is established to reduce net deferred tax assets to amounts that are more likely than not to be realized. We consider all available evidence, both positive and negative, in assessing the need for a valuation allowance. We have a full valuation allowance, and have concluded, based on the weight of all available evidence, that it is more likely than not that our net deferred tax assets will not be realized, primarily due to our historical net operating losses.
We utilize a two-step approach for evaluating uncertain tax positions. Step one, recognition, requires us to determine if the weight of available evidence indicates that a tax position is more likely than not to be sustained upon audit, including resolution of related appeals or litigation processes, if any. If a tax position is not considered “more likely than not” to be sustained, no benefits of the position are recognized. If we determine that a position is “more likely than not” to be sustained, then we proceed to step two, measurement, which is based on the largest amount of benefit which is more likely than not to be realized on effective settlement. This process involves estimating our actual current tax exposure, including assessing the risks associated with tax audits, together with assessing temporary differences resulting from the different treatment of items for tax and financial reporting purposes. If actual results differ from our estimates, our net operating loss and credit carryforwards could be materially impacted.
Recent Accounting Pronouncements
See Note 2 to our consolidated financial statements included herein.
Item 7A. Quantitative and Qualitative Disclosures about Market Risk
Market risk represents the risk of loss that may affect our financial position due to adverse changes in financial market prices and rates. We are exposed to market risks related to changes in interest rates.
Interest Rate Risk
We had cash and cash equivalents of $107.7 million at December 31, 2016, which consists entirely of bank deposits and short-term money market funds. Such interest-earning instruments carry a degree of interest rate risk. To date, fluctuations in interest income have not been significant.
We do not enter into investments for trading or speculative purposes and have not used any derivative financial instruments to manage our interest rate risk exposure.
To the extent we borrow funds under our credit facility, we would be subject to fluctuations in interest rates. See Part II, Item 7, “Management’s Discussion and Analysis of Financial Condition and Results of Operations – Liquidity and Capital Resources.” As of December 31, 2016, we had no borrowings under the credit facility. We believe that we do not have a material exposure to changes in the fair value as a result of changes in interest rates.
Inflation Risk
We do not believe that inflation has had a material effect on our business, financial condition or results of operations. However, if our costs were to become subject to significant inflationary pressures, we may not be able to fully offset such
56
higher costs through price increases. Our inability or failure to do so could harm our business, operating results and financial condition.
Foreign Currency Exchange Risk
Historically, as our operations and sales have been primarily in the United States, we have not faced any significant foreign currency risk. If we plan for international expansion, our risks associated with fluctuation in currency rates will become greater, and we will continue to reassess our approach to managing this risk.
Item 8. Financial Statements and Supplementary Data
The information required by this item appears in a separate section of this annual report on Form 10-K beginning on page F-1 and is incorporated herein by reference.
Item 9. Changes in and Disagreements with Accountants on Accounting and Financial Disclosure
None.
Item 9A. Controls and Procedures
Evaluation of Disclosure Controls and Procedures
The phrase “disclosure controls and procedures” refers to controls and procedures designed to ensure that information required to be disclosed in our reports filed or submitted under the Securities Exchange Act of 1934, as amended, or the Exchange Act, such as this Annual Report on Form 10-K, is recorded, processed, summarized and reported within the time periods specified in the rules and forms of the U.S. Securities and Exchange Commission, or SEC. Disclosure controls and procedures are also designed to ensure that such information is accumulated and communicated to our management, including our chief executive officer, or CEO, and chief financial officer, or CFO, as appropriate to allow timely decisions regarding required disclosure.
Our management, with the participation of our CEO and CFO has evaluated the effectiveness of our disclosure controls and procedures (as defined in Rules 13a- 5(e) and 15d- 15(e) under the Exchange Act), as of December 31, 2016, the end of the period covered by this Annual Report on Form 10-K. Based on such evaluation, our CEO and CFO have concluded that as of December 31, 2016, our disclosure controls and procedures were designed at a reasonable assurance level and were effective to provide reasonable assurance that information we are required to disclose in reports that we file or submit under the Exchange Act is recorded, processed, summarized, and reported within the time periods specified in the rules and forms of the SEC, and that such information is accumulated and communicated to our management, including our CEO and CFO, as appropriate, to allow timely decisions regarding required disclosure.
Management's Report on Internal Control over Financial Reporting
Our management is responsible for establishing and maintaining adequate internal control over financial reporting, as defined in Rule 13a-15(f) of the Exchange Act. Internal control over financial reporting is a process to provide reasonable assurance regarding the reliability of our financial reporting for external purposes in accordance with accounting principles generally accepted in the United States of America. Management conducted an evaluation of the effectiveness of our internal control over financial reporting based on the criteria for effective control over financial reporting described in Internal Control — Integrated Framework (2013) issued by the Committee of Sponsoring Organizations of the Treadway Commission. Based on this evaluation, management has concluded that, as of December 31, 2016, the Company’s internal control over financial reporting was effective. Management has reviewed its assessment with the Audit Committee.
Changes in Internal Control Over Financial Reporting
There were no changes in our internal control over financial reporting identified in management's evaluation pursuant to Rules 13a-15(d) or 15d-15(d) of the Exchange Act during the fourth quarter of 2016 that materially affected, or are reasonably likely to materially affect, our internal control over financial reporting.
Limitations on Effectiveness of Controls and Procedures
In designing and evaluating the disclosure controls and procedures and internal control over financial reporting, management recognizes that any controls and procedures, no matter how well designed and operated, can provide only reasonable assurance of achieving the desired control objectives. In addition, the design of disclosure controls and procedures and internal control over
57
financial reporting must reflect the fact that there are resource constraints and that management is required to apply judgment in evaluating the benefits of possible controls and procedures relative to their costs.
Item 9B. Other Information
None.
58
PART III
Item 10. Directors, Executive Officers and Corporate Governance
The information required by this Item is incorporated by reference from our definitive Proxy Statement for the 2017 Annual Meeting of Stockholders to be filed with the SEC within 120 days of the fiscal year ended December 31, 2016.
Our board of directors has adopted a Code of Business Conduct and Ethics applicable to all officers, directors, and employees, which is available on our website (ir.true.com) under "Corporate Governance – Documents and Charters." We intend to satisfy the disclosure requirement under Item 5.05 of Form 8-K regarding amendment to, or waiver from, a provision of our Code of Business Conduct and Ethics by posting such information on the website address and location specified above.
Item 11. Executive Compensation
The information required by this Item is incorporated by reference from our definitive Proxy Statement for the 2017 Annual Meeting of Stockholders to be filed with the SEC within 120 days of the fiscal year ended December 31, 2016.
Item 12. Security Ownership of Certain Beneficial Owners and Management and Related Stockholder Matters
The information required by this Item is incorporated by reference from our definitive Proxy Statement for the 2017 Annual Meeting of Stockholders to be filed with the SEC within 120 days of the fiscal year ended December 31, 2016.
Item 13. Certain Relationships and Related Transactions, and Director Independence
The information required by this Item is incorporated by reference from our definitive Proxy Statement for the 2017 Annual Meeting of Stockholders to be filed with the SEC within 120 days of the fiscal year ended December 31, 2016.
Item 14. Principal Accounting Fees and Services
The information required by this Item is incorporated by reference from our definitive Proxy Statement for the 2017 Annual Meeting of Stockholders to be filed with the SEC within 120 days of the fiscal year ended December 31, 2016.
59
PART IV
Item 15. Exhibits and Financial Statement Schedules
(a) | The following documents are filed as part of this report: |
1. | Financial Statements: |
Index: | |
2. | Financial Statements Schedule |
All schedules have been omitted because they are not required, not applicable, not present in amounts sufficient to require submission of the schedule, or the required information is otherwise included in our consolidated financial statements and related notes.
3. | Exhibits |
The following exhibits are filed as part of, or are incorporated by reference in, this annual report on Form 10-K:
Exhibit | Exhibit Title | Filed Herewith | Incorp-orated by Reference | Form | Exhibit No. | Date Filed | ||||||
3.1 | Amended and Restated Certificate of Incorporation of the Registrant. | X | S-1 | 3.2 | May 5, 2014 | |||||||
3.2 | Bylaws of the Registrant. | X | S-1 | 3.4 | May 5, 2014 | |||||||
4.1 | Seventh Amended and Restated Investors’ Rights Agreement, dated November 22, 2013, by and among the Registrant and certain of its stockholders. | X | S-1 | 4.1 | April 4, 2014 | |||||||
4.2 | Specimen Common Stock Certificate of the Registrant. | X | S-1 | 4.2 | May 5, 2014 | |||||||
4.3 | Warrant to Purchase Shares of Common Stock, dated May 1, 2014, by and between the Registrant and United Services Automobile Association. | X | S-1 | 4.16 | May 5, 2014 | |||||||
10.1# | Form of Indemnification Agreement between the Registrant and each of its directors and executive officers. | X | S-1 | 10.1 | April 4, 2014 | |||||||
10.2# | 2005 Stock Plan, as amended, and forms of agreements thereunder. | X | S-1 | 10.2 | April 4, 2014 | |||||||
10.3# | 2008 Stock Plan, as amended, and forms of agreements thereunder. | X | S-1 | 10.3 | April 4, 2014 | |||||||
10.4# | 2014 Equity Incentive Plan and forms of agreements thereunder. | X | S-1 | 10.4 | May 15, 2014 | |||||||
10.5# | Employment Agreement, dated December 20, 2012, by and between the Registrant and Scott Painter, as amended. | X | S-1 | 10.5 | April 4, 2014 | |||||||
60
Exhibit | Exhibit Title | Filed Herewith | Incorp-orated by Reference | Form | Exhibit No. | Date Filed | ||||||
10.6# | Employment Agreement, dated October 25, 2013, by and between the Registrant and Michael Guthrie. | X | S-1 | 10.6 | April 4, 2014 | |||||||
10.7# | Employment Agreement, dated May 1, 2010, by and between the Registrant and Bernard Brenner. | X | S-1 | 10.7 | April 4, 2014 | |||||||
10.8# | Offer Letter, dated September 28, 2011, by and between the Registrant and Lawrence Dominique. | X | S-1 | 10.8 | April 4, 2014 | |||||||
10.9# | Employment Agreement, dated September 15, 2008, by and between the Registrant and Stewart Easterby. | X | S-1 | 10.10 | April 4, 2014 | |||||||
10.10# | Employment Agreement, dated September 15, 2008, by and between the Registrant and James Nguyen, as amended. | X | S-1 | 10.11 | April 4, 2014 | |||||||
10.11# | Offer Letter, dated November 1, 2010, by and between the Registrant and Thomas Taira. | X | S-1 | 10.12 | April 4, 2014 | |||||||
10.12# | Employment Agreement, dated January 17, 2014, by and between the Registrant and Lucas Donat. | X | S-1 | 10.13 | April 4, 2014 | |||||||
10.13# | Employment Agreement, dated April 21, 2014, by and between the Registrant and Troy Foster. | X | S-1 | 10.14 | May 5, 2014 | |||||||
10.14# | Employment Agreement, dated May 1, 2014, by and between the Registrant and John Krafcik. | X | S-1 | 10.15 | May 5, 2014 | |||||||
10.15# | Employment Agreement, dated May 1, 2014, by and between the Registrant and John Stephenson. | X | S-1 | 10.16 | May 5, 2014 | |||||||
10.16 | Clock Tower Building Office Lease, dated May 10, 2010, by and between the Registrant and Clock Tower, LLC, as amended by the Amendment to Lease Re Additional Space and Term Extension dated November 20, 2010 and the Second Amendment to Lease, dated September 19, 2013, by and between the Registrant and SaMo Clock Tower, LLC (successor in interest to Clock Tower, LLC). | X | S-1 | 10.14 | April 4, 2014 | |||||||
10.17 | Office Lease, dated October 15, 2010, by and between the Registrant and Douglas Emmett 1995, LLC. | X | S-1 | 10.15 | April 4, 2014 | |||||||
10.18 | Second Amendment, dated February 11, 2015, to Office Lease, dated October 15, 2010, by and between the Registrant and Douglas Emmett 1995, LLC. | X | 10-K | 10.18 | March 12, 2015 | |||||||
10.19 | 1540 Second Street Office Lease, dated September 30, 2013, by and between the Registrant and RBE 1540 Second Street LLC. | X | S-1 | 10.16 | April 4, 2014 | |||||||
10.20 | 1401 Ocean Avenue Office Lease Agreement, dated July 10, 2014, by and between the Registrant and Mani Brothers Portofino Plaza (DE), LLC. | X | 10-Q | 10.15 | August 14, 2014 | |||||||
10.21 | Office Lease Agreement, dated May 3, 2016, by and between the Registrant and Hill Country Texas Galleria, LLC. | X | 10-Q | 10.1 | August 9, 2016 | |||||||
61
Exhibit | Exhibit Title | Filed Herewith | Incorp-orated by Reference | Form | Exhibit No. | Date Filed | ||||||
10.22 | Loan and Security Agreement, dated May 15, 2009, by and between the Registrant and Silicon Valley Bank, as amended by the Amended and Restated Loan and Security Agreement dated November 12, 2010, the First Amendment to Amended and Restated Loan and Security Agreement dated December 31, 2010, the Second Amendment to Amended and Restated Loan and Security Agreement dated November 11, 2011, the Third Amendment to Amended and Restated Loan and Security Agreement dated February 9, 2012, the Second Amended and Restated Loan and Security Agreement dated June 13, 2012, the First Amendment to the Second Amended and Restated Loan and Security Agreement, dated October 11, 2012, the Second Amendment to the Second Amended and Restated Loan and Security Agreement dated June 13, 2013, and the Third Amendment to the Second Amended and Restated Loan and Security Agreement, dated August 11, 2014, but effective as of June 13, 2014. | X | S-1 | 10.21 | October 28, 2014 | |||||||
10.23 | Third Amended & Restated Loan and Security Agreement, dated February 18, 2015, by and between the Registrant and Silicon Valley Bank. | X | 10-K | 10.22 | March 12, 2015 | |||||||
10.24+ | Zag Services & Maintenance Agreement, dated February 13, 2007, by and between the Registrant and United Services Automobile Association, as amended by Amendment #1 dated September 22, 2008, Amendment #2 dated May 12, 2009, Amendment #4 dated June 25, 2010, Amendment #5 dated October 26, 2010, Amendment #7 dated June 1, 2011, Amendment #9 dated March 13, 2012, Amendment #11 dated May 17, 2012, Amendment #12 dated May 17, 2012, Amendment #14 dated October 16, 2012, Amended and Restated Amendment #15 dated November 12, 2012, Amendment #16 dated December 12, 2012, Amendment #17 dated May 17, 2012, Amendment #18 dated January 17, 2013, Amendment #20 dated April 2, 2013, Amendment #22 dated July 22, 2013, Amendment #23 dated September 10, 2013, Amendment #24 dated August 30, 2013, Amendment #26 dated April 4, 2014, and Amendment #27 dated May 1, 2014. | X | S-1 | 10.21 | May 5, 2014 | |||||||
10.25# | 2014 Incentive Plan. | X | S-1 | 10.22 | May 5, 2014 | |||||||
10.26# | Executive Incentive Compensation Plan. | X | S-1 | 10.23 | May 5, 2014 | |||||||
10.27# | 2015 Inducement Equity Incentive Plan. | X | 8-K | 10.1 | December 16, 2015 | |||||||
10.28# | 2015 Inducement Equity Incentive Plan - Form of Stock Option Agreement. | X | 8-K | 10.2 | December 16, 2015 | |||||||
10.29# | Separation Agreement and Release, dated November 20, 2015, by and between the Registrant and Scott Painter. | X | 10-K | 10.28 | March 10, 2016 | |||||||
10.30# | Separation Agreement and Release, dated December 22, 2015, by and between the Registrant and Troy Foster. | X | 10-K | 10.29 | March 10, 2016 | |||||||
10.31# | Option Forfeiture Agreement, dated December 28, 2015, by and between the Registrant and John Krafcik. | X | 8-K | 10.1 | January 4, 2016 | |||||||
10.32# | Employment Agreement, dated November 16, 2015, by and between the Registrant and Chip Perry. | X | 10-K | 10.31 | March 10, 2016 | |||||||
62
Exhibit | Exhibit Title | Filed Herewith | Incorp-orated by Reference | Form | Exhibit No. | Date Filed | ||||||
10.33# | Employment Agreement, dated June 30, 2015, by and between the Registrant and Neeraj Gunsagar. | X | ||||||||||
10.34# | Employment Agreement, dated February 16, 2016, by and between the Registrant and Brian Skutta. | X | ||||||||||
10.35# | Amendment to Employment Agreement, dated February 16, 2016, by and between the Registrant and Brian Skutta. | X | ||||||||||
10.36# | Employment Agreement, dated January 25, 2017, by and between the Registrant and Jeffrey Swart. | X | ||||||||||
21.1 | List of Subsidiaries of the Registrant. | X | S-1 | 21.1 | April 4, 2014 | |||||||
23.1 | Consent of PricewaterhouseCoopers LLP, Independent Registered Public Accounting Firm. | X | ||||||||||
24.1 | Power of Attorney (included on signature page). | X | ||||||||||
31.1 | Certification of the Principal Executive Officer Pursuant to Exchange Act Rules 13a-14(a) and 15d-14(a), as adopted pursuant to Section 302 of the Sarbanes-Oxley Act of 2002. | X | ||||||||||
31.2 | Certification of the Principal Financial Officer Pursuant to Exchange Act Rules 13a-14(a) and 15d-14(a), as adopted pursuant to Section 302 of the Sarbanes-Oxley Act of 2002. | X | ||||||||||
32.1 | Certification of the Principal Executive Officer and Principal Financial Officer Pursuant to 18 U.S.C. Section 1350, as adopted pursuant to Section 906 of the Sarbanes-Oxley Act of 2002. | X | ||||||||||
101.INS | XBRL Instance Document. | |||||||||||
101.SCH | XBRL Taxonomy Extension Schema Document. | |||||||||||
101.CAL | XBRL Taxonomy Extension Calculation Linkbase Document. | |||||||||||
101.DEF | XBRL Taxonomy Extension Definition Linkbase Document. | |||||||||||
101.LAB | XBRL Taxonomy Extension Label Linkbase Document. | |||||||||||
101.PRE | XBRL Taxonomy Extension Presentation Linkbase Document. | |||||||||||
# Indicates a management contract or compensatory plan.
+ Portions of this exhibit have been granted confidential treatment by the Securities and Exchange Commission.
63
Item 16. Form 10-K Summary
None
64
SIGNATURES
Pursuant to the requirements of the Securities Exchange Act of 1934, the registrant has duly caused this report to be signed on its behalf by the undersigned thereunto duly authorized, in the City of Santa Monica, State of California, on March 1, 2017.
TRUECAR, INC. | |||
By: | /s/ Chip Perry | ||
Chip Perry | |||
President and Chief Executive Officer | |||
POWER OF ATTORNEY
KNOW ALL PERSONS BY THESE PRESENTS, that each person whose signature appears below constitutes and appoints Michael Guthrie, Jeff Swart and John Pierantoni, jointly and severally, as his true and lawful attorney-in-fact and agent, with full power of substitution and resubstitution, for him and in his name, place and stead, in any and all capacities, to sign any amendments to this Annual Report on Form 10-K and to file the same, with exhibits thereto and other documents in connection therewith, with the Securities and Exchange Commission, hereby ratifying and confirming all that each of said attorneys-in-fact, or his substitute or substitutes, may do or cause to be done by virtue hereof.
Pursuant to the requirements of the Securities Exchange Act of 1934, this report has been signed by the following persons on behalf of the Registrant and in the capacities and on the dates indicated.
Signature | Title | Date | ||
/s/ Chip Perry | President and Chief Executive Officer | March 1, 2017 | ||
Chip Perry | (Principal Executive Officer) | |||
/s/ Michael Guthrie | Chief Financial Officer | March 1, 2017 | ||
Michael Guthrie | (Principal Financial Officer) | |||
/s/ John Pierantoni | Chief Accounting Officer | March 1, 2017 | ||
John Pierantoni | (Principal Accounting Officer) | |||
/s/ Abhishek Agrawal | Director | March 1, 2017 | ||
Abhishek Agrawal | ||||
/s/ Robert Buce | Director | March 1, 2017 | ||
Robert Buce | ||||
/s/ Christopher Claus | Director | March 1, 2017 | ||
Christopher Claus | ||||
/s/ Steven Dietz | Director | March 1, 2017 | ||
Steven Dietz | ||||
/s/ John Krafcik | Director | March 1, 2017 | ||
John Krafcik | ||||
/s/ Erin Lantz | Director | March 1, 2017 | ||
Erin Lantz | ||||
/s/ Wesley Nichols | Director | March 1, 2017 | ||
Wesley Nichols | ||||
/s/ Ion Yadigaroglu | Director | March 1, 2017 | ||
Ion Yadigaroglu | ||||
65
INDEX TO CONSOLIDATED FINANCIAL STATEMENTS
F-1
REPORT OF INDEPENDENT REGISTERED PUBLIC ACCOUNTING FIRM
To the Board of Directors and Stockholders of TrueCar, Inc.:
In our opinion, the accompanying consolidated balance sheets and the related consolidated statements of comprehensive loss, stockholders’ equity and cash flows present fairly, in all material respects, the financial position of TrueCar, Inc. and its subsidiaries (the “Company”) as of December 31, 2016 and 2015 and the results of their operations and their cash flows for each of the three years in the period ended December 31, 2016 in conformity with accounting principles generally accepted in the United States of America. These financial statements are the responsibility of the Company’s management. Our responsibility is to express an opinion on these financial statements based on our audits. We conducted our audits of these financial statements in accordance with the standards of the Public Company Accounting Oversight Board (United States). Those standards require that we plan and perform the audit to obtain reasonable assurance about whether the financial statements are free of material misstatement. An audit includes examining, on a test basis, evidence supporting the amounts and disclosures in the financial statements, assessing the accounting principles used and significant estimates made by management, and evaluating the overall financial statement presentation. We believe that our audits provide a reasonable basis for our opinion.
/s/ PricewaterhouseCoopers LLP |
Los Angeles, California |
March 1, 2017 |
F-2
TrueCar, Inc.
Consolidated Balance Sheets
(in thousands, except par value and share data)
December 31, | |||||||
2016 | 2015 | ||||||
Assets | |||||||
Current assets | |||||||
Cash and cash equivalents | $ | 107,721 | $ | 112,371 | |||
Accounts receivable, net of allowances of $2,600 and $2,720 at December 31, 2016 and 2015, respectively (includes related party receivables of $393 and $328 at December 31, 2016 and 2015, respectively) | 36,867 | 33,761 | |||||
Prepaid expenses | 6,044 | 6,048 | |||||
Other current assets | 2,278 | 779 | |||||
Total current assets | 152,910 | 152,959 | |||||
Property and equipment, net | 66,941 | 71,390 | |||||
Goodwill | 53,270 | 53,270 | |||||
Intangible assets, net | 19,774 | 23,815 | |||||
Other assets | 1,553 | 940 | |||||
Total assets | $ | 294,448 | $ | 302,374 | |||
Liabilities and Stockholders’ Equity | |||||||
Current liabilities | |||||||
Accounts payable (includes related party payables of $2,925 and $7,490 at December 31, 2016 and 2015, respectively) | $ | 13,827 | $ | 18,880 | |||
Accrued employee expenses | 8,951 | 7,799 | |||||
Accrued expenses and other current liabilities (includes related party accrued expenses of $992 and $318 at December 31, 2016 and 2015, respectively) | 12,583 | 12,425 | |||||
Total current liabilities | 35,361 | 39,104 | |||||
Deferred tax liabilities | 2,994 | 2,413 | |||||
Lease financing obligation, net of current portion | 28,833 | 26,987 | |||||
Other liabilities | 2,679 | 1,178 | |||||
Total liabilities | 69,867 | 69,682 | |||||
Commitments and contingencies (Note 6) | |||||||
Stockholders’ Equity | |||||||
Preferred stock — $0.0001 par value; 20,000,000 shares authorized at December 31, 2016 and 2015, respectively; no shares issued and outstanding at December 31, 2016 and 2015 | — | — | |||||
Common stock — $0.0001 par value; 1,000,000,000 shares authorized at December 31, 2016 and 2015, respectively; 86,159,527 and 83,016,735 shares issued and outstanding at December 31, 2016 and 2015, respectively | 9 | 8 | |||||
Additional paid-in capital | 542,807 | 508,584 | |||||
Accumulated deficit | (318,235 | ) | (275,900 | ) | |||
Total stockholders’ equity | 224,581 | 232,692 | |||||
Total liabilities and stockholders’ equity | $ | 294,448 | $ | 302,374 | |||
The accompanying notes are an integral part of these consolidated financial statements.
F-3
TrueCar, Inc.
Consolidated Statements of Comprehensive Loss
(in thousands except per share data)
Year Ended | |||||||||||
December 31, | |||||||||||
2016 | 2015 | 2014 | |||||||||
Revenues | $ | 277,507 | $ | 259,838 | $ | 206,649 | |||||
Costs and operating expenses: | |||||||||||
Cost of revenue (exclusive of depreciation and amortization presented separately below; includes related party expenses of $0, $0, and $405 for 2016, 2015, and 2014, respectively) | 25,167 | 23,657 | 17,513 | ||||||||
Sales and marketing (includes related party expenses of $13,910, $20,852, and $19,443, for the years ended December 31, 2016, 2015, and 2014, respectively) | 154,406 | 151,002 | 128,569 | ||||||||
Technology and development | 53,580 | 48,021 | 36,563 | ||||||||
General and administrative | 59,908 | 83,494 | 58,296 | ||||||||
Depreciation and amortization | 23,345 | 17,646 | 13,213 | ||||||||
Total costs and operating expenses | 316,406 | 323,820 | 254,154 | ||||||||
Loss from operations | (38,899 | ) | (63,982 | ) | (47,505 | ) | |||||
Interest income | 376 | 107 | 59 | ||||||||
Interest expense | (2,530 | ) | (443 | ) | (380 | ) | |||||
Other income | — | 13 | 37 | ||||||||
Loss before provision for income taxes | (41,053 | ) | (64,305 | ) | (47,789 | ) | |||||
Provision for income taxes | 655 | 606 | 640 | ||||||||
Net loss | $ | (41,708 | ) | $ | (64,911 | ) | $ | (48,429 | ) | ||
Net loss per share, basic and diluted | $ | (0.49 | ) | $ | (0.79 | ) | $ | (0.68 | ) | ||
Weighted average common shares outstanding, basic and diluted | 84,483 | 81,914 | 70,837 | ||||||||
Other comprehensive loss: | |||||||||||
Comprehensive loss | $ | (41,708 | ) | $ | (64,911 | ) | $ | (48,429 | ) | ||
The accompanying notes are an integral part of these consolidated financial statements.
F-4
TrueCar, Inc.
Consolidated Statements of Stockholders’ Equity
(in thousands except share data)
Common Stock | Notes Receivable from Related Parties | Accumulated deficit | Stockholders’ Equity | |||||||||||||||||||
Shares | Amount | APIC | ||||||||||||||||||||
Balance at December 31, 2013 | 59,955,343 | $ | 6 | $ | 275,803 | $ | (1,069 | ) | $ | (162,560 | ) | $ | 112,180 | |||||||||
Net loss | — | — | — | — | (48,429 | ) | (48,429 | ) | ||||||||||||||
Issuance of common stock in connection with initial public offering, net of underwriting discounts and offering costs | 8,941,250 | 1 | 69,150 | — | — | 69,151 | ||||||||||||||||
Conversion of Series A convertible preferred stock in connection with initial public offering | 2,857,143 | — | 29,224 | — | — | 29,224 | ||||||||||||||||
Issuance of common stock in follow-on offering, net of underwriting discounts and offering costs | 1,960,390 | — | 30,762 | — | — | 30,762 | ||||||||||||||||
Stock-based compensation | — | — | 30,582 | — | — | 30,582 | ||||||||||||||||
Issuance of warrants in connection with marketing agreements | — | — | 9,861 | — | — | 9,861 | ||||||||||||||||
Exercise of warrants to purchase common stock | 3,357,867 | 1 | 9,460 | — | — | 9,461 | ||||||||||||||||
Shares issued in connection with employee stock plans, net of shares withheld for employee taxes | 2,739,776 | — | 5,313 | — | — | 5,313 | ||||||||||||||||
Recovery of short swing profits | — | — | 14 | — | — | 14 | ||||||||||||||||
Imputed interest on notes receivable | — | — | 10 | — | — | 10 | ||||||||||||||||
Interest income on notes receivable | — | — | — | (3 | ) | — | (3 | ) | ||||||||||||||
Repayment of notes receivable | — | — | — | 1,072 | — | 1,072 | ||||||||||||||||
Balance at December 31, 2014 | 79,811,769 | $ | 8 | $ | 460,179 | $ | — | $ | (210,989 | ) | $ | 249,198 | ||||||||||
Net loss | — | — | — | — | (64,911 | ) | (64,911 | ) | ||||||||||||||
Stock-based compensation | — | — | 43,888 | — | — | 43,888 | ||||||||||||||||
Repurchase of common stock awards | — | — | (100 | ) | — | — | (100 | ) | ||||||||||||||
Issuance of warrants and change in fair value of unvested warrants related to marketing agreements | — | — | (803 | ) | — | — | (803 | ) | ||||||||||||||
Net exercise of warrants to purchase common stock | 959,676 | — | — | — | — | — | ||||||||||||||||
Shares issued in connection with employee stock plans, net of shares withheld for employee taxes | 2,245,290 | — | 5,420 | — | — | 5,420 | ||||||||||||||||
Balance at December 31, 2015 | 83,016,735 | $ | 8 | $ | 508,584 | $ | — | $ | (275,900 | ) | $ | 232,692 | ||||||||||
Cumulative-effect of accounting change adopted as of January 1, 2016 | — | — | 627 | — | (627 | ) | — | |||||||||||||||
Net loss | — | — | — | — | (41,708 | ) | (41,708 | ) | ||||||||||||||
Stock-based compensation | — | — | 25,751 | — | — | 25,751 | ||||||||||||||||
Issuance of warrants relating to marketing agreements | — | — | 46 | — | — | 46 | ||||||||||||||||
Shares issued in connection with employee stock plans, net of shares withheld for employee taxes | 3,142,792 | 1 | 7,799 | — | — | 7,800 | ||||||||||||||||
Balance at December 31, 2016 | 86,159,527 | $ | 9 | $ | 542,807 | $ | — | $ | (318,235 | ) | $ | 224,581 | ||||||||||
The accompanying notes are an integral part of these consolidated financial statements.
F-5
TrueCar, Inc.
Consolidated Statements of Cash Flows
(in thousands)
For the Year Ended December 31, | |||||||||||
2016 | 2015 | 2014 | |||||||||
Cash flows from operating activities | |||||||||||
Net loss | $ | (41,708 | ) | $ | (64,911 | ) | $ | (48,429 | ) | ||
Adjustments to reconcile net loss to net cash provided by (used in) operating activities: | |||||||||||
Depreciation and amortization | 23,169 | 17,267 | 12,979 | ||||||||
Deferred income taxes | 581 | 581 | 577 | ||||||||
Bad debt expense and other reserves | 1,285 | 925 | 300 | ||||||||
Stock-based compensation | 24,739 | 42,563 | 29,333 | ||||||||
Common stock warrant expense (benefit) | 46 | (803 | ) | 9,861 | |||||||
Non-cash interest expense on lease financing obligation | 396 | — | — | ||||||||
Imputed interest on notes receivable | — | — | (3 | ) | |||||||
Interest income on notes receivable | — | — | (4 | ) | |||||||
Accretion of beneficial conversion feature on convertible notes payable and discount on revolving line of credit | — | — | 236 | ||||||||
Write-off and loss on disposal of fixed assets | 474 | 1,631 | 233 | ||||||||
Changes in operating assets and liabilities: | |||||||||||
Accounts receivable | (4,391 | ) | (5,938 | ) | (10,372 | ) | |||||
Prepaid expenses | 4 | (855 | ) | (1,643 | ) | ||||||
Other current assets | (846 | ) | 1,087 | (1,316 | ) | ||||||
Other assets | (613 | ) | (458 | ) | (26 | ) | |||||
Accounts payable | (4,552 | ) | 5,312 | 3,399 | |||||||
Accrued employee expenses | 1,152 | (6,510 | ) | 3,883 | |||||||
Accrued expenses and other liabilities | 1,531 | (1,781 | ) | 4,253 | |||||||
Other liabilities | 1,501 | 521 | (157 | ) | |||||||
Net cash provided by (used in) operating activities | 2,768 | (11,369 | ) | 3,104 | |||||||
Cash flows from investing activities | |||||||||||
Change in restricted cash | — | — | 2,000 | ||||||||
Purchase of property and equipment | (16,639 | ) | (29,836 | ) | (15,531 | ) | |||||
Purchase of intangible assets | — | — | (365 | ) | |||||||
Notes receivable from related parties | — | — | (60 | ) | |||||||
Repayment of notes receivable from related parties | — | — | 4,133 | ||||||||
Net cash used in investing activities | (16,639 | ) | (29,836 | ) | (9,823 | ) | |||||
The accompanying notes are an integral part of these consolidated financial statements.
F-6
TrueCar, Inc.
Consolidated Statements of Cash Flows (Continued)
(in thousands)
For the Year Ended December 31, | |||||||||||
2016 | 2015 | 2014 | |||||||||
Cash flows from financing activities | |||||||||||
Proceeds from initial public offering, net of underwriting discounts and offering costs | — | — | 69,702 | ||||||||
Proceeds from follow-on public offering, net of underwriting discounts and offering costs | — | — | 30,950 | ||||||||
Proceeds from short swing profits | — | — | 14 | ||||||||
Proceeds from borrowings under credit agreement | — | — | 5,000 | ||||||||
Repayments under credit agreement | — | — | (10,000 | ) | |||||||
Repurchase of common stock option awards | (100 | ) | — | — | |||||||
Proceeds from exercise of common stock options | 9,112 | 6,328 | 5,851 | ||||||||
Taxes paid related to net share settlement of equity awards | (1,312 | ) | (908 | ) | (539 | ) | |||||
Proceeds from exercise of warrants | — | — | 9,461 | ||||||||
Proceeds from financing obligation drawdown | 1,521 | 622 | — | ||||||||
Payments for lease financing obligation | — | (5 | ) | — | |||||||
Net cash provided by financing activities | 9,221 | 6,037 | 110,439 | ||||||||
Net (decrease) increase in cash and cash equivalents | (4,650 | ) | (35,168 | ) | 103,720 | ||||||
Cash and cash equivalents at beginning of period | 112,371 | 147,539 | 43,819 | ||||||||
Cash and cash equivalents at end of period | $ | 107,721 | $ | 112,371 | $ | 147,539 | |||||
Supplemental disclosure of cash flow information | |||||||||||
Cash paid during the year for: | |||||||||||
Interest | $ | 2,133 | $ | 617 | $ | 139 | |||||
Income taxes | 82 | 48 | 20 | ||||||||
Supplemental disclosures of non-cash activities | |||||||||||
Conversion of Series A convertible preferred stock in connection with initial public offering | — | — | 29,224 | ||||||||
Initial public offering costs paid in the prior year | — | — | 551 | ||||||||
Stock-based compensation capitalized for software development | 1,012 | 1,325 | 1,249 | ||||||||
Recognition of leased facility asset and lease financing obligation | — | 23,683 | 6,591 | ||||||||
Accrued offering costs included in accounts payable and accrued expenses | — | — | (188 | ) | |||||||
Capitalized assets included in accounts payable, accrued employee expenses and other accrued expenses | 1,078 | 1,635 | 795 | ||||||||
The accompanying notes are an integral part of these consolidated financial statements.
F-7
1. Organization and Nature of Business
TrueCar, Inc. (“TrueCar”) is an Internet-based information, technology, and communication services company. Hereinafter, TrueCar, Inc. and its wholly owned subsidiaries TrueCar.com, Inc. and ALG, Inc. are collectively referred to as “TrueCar” or the “Company”; TrueCar.com, Inc. is referred to as “TrueCar.com” and ALG, Inc. is referred to as “ALG”. TrueCar was incorporated in the state of Delaware in February 2005 and began business operations in April 2005. Its principal corporate offices are located in Santa Monica, California.
TrueCar is a digital automotive marketplace that (i) provides pricing transparency about what other people paid for their cars and enables consumers to engage with TrueCar Certified Dealers who are committed to providing a superior purchase experience; (ii) empowers Certified Dealers to attract these informed, in-market consumers in a cost-effective, accountable manner; and (iii) allows automobile manufacturers ("OEMs") to more effectively target their incentive spending at deep-in-market consumers during their purchase process. TrueCar has established a diverse software ecosystem on a common technology infrastructure, powered by proprietary data and analytics. Consumers access TrueCar’s platform through the TrueCar.com website and TrueCar mobile applications or through the car buying websites and mobile applications that TrueCar operates for its affinity group marketing partners (“Auto Buying Programs”). An affinity group is comprised of a network of members or employees that provides discounts to its members.
ALG provides forecasts, consulting, and other services regarding determination of the residual value of an automobile at future given points in time, which are used to underwrite automotive loans and leases and by financial institutions to measure exposure and risk across loan, lease, and fleet portfolios. ALG also obtains automobile purchase data from a variety of sources and uses this data to provide consumers and dealers with highly accurate, geographically specific, real-time pricing information.
F-8
2. Summary of Significant Accounting Policies
Basis of Presentation
The Company’s accounting and financial reporting policies conform to accounting principles generally accepted in the United States of America (“GAAP”).
Principles of Consolidation
The accompanying consolidated financial statements include the accounts of TrueCar and its wholly owned subsidiaries. Business acquisitions are included in the Company’s consolidated financial statements from the date of the acquisition. The Company’s purchase accounting resulted in all assets and liabilities of acquired businesses being recorded at their estimated fair values on the acquisition dates. All intercompany balances and transactions have been eliminated in consolidation.
Use of Estimates
The preparation of consolidated financial statements in conformity with GAAP requires management to make estimates and assumptions that affect the reported amounts of assets and liabilities and the disclosure of contingent assets and liabilities at the dates of the consolidated financial statements, and the reported amounts of revenues and expenses during the reporting period. Actual results could differ from those estimates. Assets and liabilities which are subject to judgment and use of estimates include sales allowances and allowances for doubtful accounts, the fair value of assets and liabilities assumed in business combinations, fair value of the capitalized facility lease, the recoverability of goodwill and long-lived assets, valuation allowances with respect to deferred tax assets, useful lives associated with property and equipment and intangible assets, lease exit liabilities, contingencies, and the valuation and assumptions underlying stock-based compensation and other equity instruments. On an ongoing basis, the Company evaluates its estimates compared to historical experience and trends, which form the basis for making judgments about the carrying value of assets and liabilities. In addition, the Company engaged valuation specialists to assist with management’s determination of the valuation of its capitalized facility lease, fair values of assets and liabilities assumed in business combinations, the fair value of reporting units in connection with annual goodwill impairment testing, and in periods prior to the Company’s initial public offering, valuation of common stock.
Segments
The Company has one operating segment. The Company’s chief operating decision maker (“CODM”) is the President and Chief Executive Officer and the Chief Financial Officer, who manage the Company’s operations based on consolidated financial information for purposes of evaluating financial performance and allocating resources.
The CODM reviews financial information on a consolidated basis, accompanied by information about transaction revenue and forecasts, consulting and other revenue (Note 13). All of the Company’s principal operations, decision-making functions and assets are located in the United States.
Fair Value Measurements
Fair value is defined as the exchange price that would be received for an asset or paid to transfer a liability (an exit price) in the principal or most advantageous market for the asset or liability in an orderly transaction between market participants on the measurement date.
Valuation techniques used to measure fair value must maximize the use of observable inputs and minimize the use of unobservable inputs. Accounting standards describe a fair value hierarchy based on three levels of inputs, of which the first two are considered observable and the last unobservable, that may be used to measure fair value which are the following:
• | Level 1 — Quoted prices in active markets for identical assets or liabilities or funds. |
F-9
• | Level 2 — Inputs other than Level 1 that are observable, either directly or indirectly, such as quoted prices for similar assets or liabilities; quoted prices in markets that are not active; or other inputs that are observable or can be corroborated by observable market data for substantially the full term of the assets or liabilities. |
• | Level 3 — Unobservable inputs that are supported by little or no market activity and that are significant to the fair value of the assets or liabilities. |
Fair Value Methods
Fair value is based on quoted market prices, if available. If listed prices or quotes are not available, fair value is based on internally developed models that primarily use market-based or independently sourced market parameters as inputs.
For assets and liabilities measured at fair value, the following section describes the valuation methodologies, key inputs and significant assumptions.
Cash equivalents, consisting primarily of money market instruments and debt securities represent highly liquid investments with maturities of three months or less at purchase. Generally, market prices are used to determine the fair value of money market instruments and debt securities.
The carrying amounts of cash equivalents, restricted cash, accounts receivable, prepaid and other current assets, accounts payable, and accrued liabilities approximate fair value because of the short maturity of these items. The fair value of the Company’s revolving line of credit approximates carrying value based on the Company’s current incremental borrowing rate for similar types of borrowing arrangements.
Certain assets, including long-lived assets, goodwill and intangible assets are also subject to measurement at fair value on a non-recurring basis if they are deemed to be impaired as a result of an impairment review. For the years ended December 31, 2016, 2015, and 2014, no impairments were identified on those assets required to be measured at fair value on a non-recurring basis.
The following table summarizes the Company's assets at fair value on a recurring basis at December 31, 2016 and 2015 by level within the fair value hierarchy. There were no liabilities measure at fair value on a recurring basis at December 31, 2016 and 2015. These assets are classified in their entirety based on the lowest level of input that is significant to the fair value measurement (in thousands):
At December 31, 2016 | At December 31, 2015 | ||||||||||||||||||||||||||||||
Total Fair | Total Fair | ||||||||||||||||||||||||||||||
Level 1 | Level 2 | Level 3 | Value | Level 1 | Level 2 | Level 3 | Value | ||||||||||||||||||||||||
Assets: | |||||||||||||||||||||||||||||||
Cash equivalents | $ | 107,721 | $ | — | $ | — | $ | 107,721 | $ | 112,131 | $ | — | $ | — | $ | 112,131 | |||||||||||||||
Total Assets | $ | 107,721 | $ | — | $ | — | $ | 107,721 | $ | 112,131 | $ | — | $ | — | $ | 112,131 | |||||||||||||||
Concentrations of Credit and Business Risk
Financial instruments that potentially subject the Company to credit risk consist principally of cash and cash equivalents and accounts receivable.
The Company, at times, maintains cash balances at financial institutions in excess of amounts insured by United States government agencies or payable by the United States government directly. The Company places its cash and cash equivalents with high credit quality financial institutions.
Credit is extended to customers based on an evaluation of their financial condition and other factors. The Company generally does not require collateral or other security to support accounts receivable. The Company performs ongoing credit evaluations of its customers and maintains an allowance for doubtful accounts based on these evaluations. No single customer comprised more than
F-10
10% of the Company’s total revenues for the years ended December 31, 2016, 2015 and 2014. At December 31, 2016, one customer accounted for approximately 13% of the accounts receivable balance. No single customer comprised more than 10% of the Company’s accounts receivable balance at December 31, 2015.
The Company’s single largest source of unique visitors and unit sales from affinity group marketing partners comes from its relationship with United Services Automobile Association (“USAA”), a related party (Note 12). Changes in the Company’s relationship with USAA and its promotion and marketing of the Company’s Auto Buying Programs may have a material adverse effect on the Company’s business, financial condition, results of operations and cash flows.
Cash and Cash Equivalents
The Company considers all highly liquid investments purchased with an original or remaining maturity at the date of purchase of three months or less to be cash equivalents. At December 31, 2016 and 2015, cash and cash equivalents were comprised of cash held in money market funds and checking accounts.
Accounts Receivable, Allowance for Doubtful Accounts, and Sales Allowances
The Company extends credit in the normal course of business to its customers and performs credit evaluations on a case-by-case basis. The Company does not obtain collateral or other security related to its accounts receivable.
Accounts receivable are recorded based on the amount due from the customer and do not bear interest. The Company reduces accounts receivable by sales allowances and allowance for doubtful accounts.
The Company establishes sales allowances at the time of revenue recognition based on its history of adjustments and credits provided to its network of dealers. Sales allowances relate primarily to credits issued where a dealer claims that an introduction was previously identified by the dealer from a source other than the Company. While contractually obligated to pay the invoice, the Company may issue a credit against the invoice to maintain overall dealer relations. In assessing the adequacy of the sales allowance, the Company evaluates its history of adjustments and credits made through the date of the issuance of the financial statements. Estimated sales adjustments and credits and ultimate losses may vary from actual results which could be material to the financial statements; however, to date, actual sales allowances have been materially consistent with the Company’s estimates.
The Company determines its allowance for doubtful accounts based on its historical write-off experience and when specific circumstances make it likely that recovery will not occur. The Company reviews the allowance for doubtful accounts each reporting period and assesses the aging of account balances, with an emphasis on those that are past due over ninety days. Account balances are charged off against the allowance when the Company determines that it is probable the receivable will not be recovered. The Company does not have any off-balance sheet credit exposure related to its customers.
The following table summarizes the changes in the allowance for doubtful accounts and sales allowances (in thousands):
Year Ended December 31, | |||||||||||
2016 | 2015 | 2014 | |||||||||
Allowances, at beginning of period | $ | 2,720 | $ | 2,069 | $ | 2,184 | |||||
Charged as a reduction of revenue | 7,042 | 6,716 | 4,797 | ||||||||
Charged to bad debt expense in general and administrative expenses | 1,285 | 925 | 373 | ||||||||
Write-offs, net of recoveries | (8,447 | ) | (6,990 | ) | (5,285 | ) | |||||
Allowances, at end of period | $ | 2,600 | $ | 2,720 | $ | 2,069 | |||||
F-11
Property and Equipment, net
Property and equipment are stated at cost, less accumulated depreciation. Depreciation is computed using the straight-line method over the estimated useful lives of the assets, which is generally three years for computer hardware and software, five years for furniture and equipment, and over the shorter of lease term or useful life of the assets for leasehold improvements. Buildings are depreciated over a useful life of forty years. Maintenance and repairs are expensed as incurred. When assets are retired or otherwise disposed of, the cost and related accumulated depreciation are removed from the accounts and any resulting gain or loss is reflected in the Company’s results of operations.
Build-to-Suit Leases
The Company establishes assets and liabilities for the fair value of the building and estimated construction costs incurred under lease arrangements when it is considered the owner (for accounting purposes only), or build-to-suit leases, to the extent it is involved in the construction of structural improvements or takes on construction risk. Upon completion of construction of facilities under build-to-suit leases, the Company assesses whether these arrangements qualify for sales recognition under the sale-leaseback accounting guidance, and if so, the leased facility and lease financing obligation are removed from the balance sheet. If the Company does not qualify for sale-leaseback accounting, then the facilities are accounted for as financing leases.
Software and Website Development Costs
The Company accounts for the costs of computer software obtained or developed for internal use in accordance with FASB ASC 350, Intangibles — Goodwill and Other. Computer software development costs and website development costs are expensed as incurred, except for internal use software or website development costs that qualify for capitalization as described below, and include certain employee related expenses, including salaries, bonuses, benefits and stock-based compensation expenses; costs of computer hardware and software; and costs incurred in developing features and functionality. These capitalized costs are included in property and equipment on the consolidated balance sheets.
The Company expenses costs incurred in the preliminary project and post implementation stages of software development and capitalizes costs incurred in the application development stage and costs associated with significant enhancements to existing internal use software applications.
Software costs are amortized using the straight-line method over an estimated useful life of three years commencing when the software project is ready for its intended use.
Costs incurred related to less significant modifications and enhancements as well as maintenance are expensed as incurred.
At December 31, 2016 and 2015, capitalized software costs were $55.7 million and $43.9 million, respectively, before accumulated amortization of $35.3 million and $20.6 million, respectively. During the years ended December 31, 2016 and 2015, the Company wrote off capitalized software costs of $0.3 million and $1.2 million, respectively, relating to the Company's decision to abandon additional development activities relating to specific software projects. As these capitalized assets had never been placed in service, the write-off was recorded in technology and development expense and there was no accumulated amortization and no acceleration of amortization. During 2016, the Company recorded accelerated amortization of $2.1 million related to software assets that were determined to have shortened useful lives due to upgrades to the Company's technology infrastructure. During 2014, the Company wrote off capitalized software costs that were previously placed in service and no longer in use of $0.3 million and accumulated amortization of $0.1 million, which resulted in acceleration of amortization of $0.2 million.
F-12
Expected amortization expense with respect to capitalized software costs at December 31, 2016 for each of the three years through December 31, 2019 is as follows (in thousands):
Years ended December 31, | |||
2017 | $ | 12,438 | |
2018 | 5,931 | ||
2019 | 2,024 | ||
2020 | 23 | ||
Total amortization expense | $ | 20,416 | |
Intangible Assets Acquired in Business Combinations
The Company performs valuations of assets acquired and liabilities assumed on each acquisition accounted for as a business combination, and allocates the purchase price to the tangible and intangible assets acquired and liabilities assumed based on its best estimate of fair value. Acquired intangible assets include: trade names, customer relationships, and developed technology. The Company determines the appropriate useful life of intangible assets by performing an analysis of cash flows based on historical experience of the acquired businesses. Intangible assets are amortized over their estimated useful lives based on the pattern in which the economic benefits associated with the asset are expected to be consumed, which to date has approximated the straight-line method of amortization. The estimated useful lives for trade names, customer relationships, and technology are generally, one to fifteen years, five to ten years, and three to ten years, respectively.
Long-Lived Assets
The Company evaluates the recoverability of its long-lived assets with finite useful lives for impairment whenever events or changes in circumstances indicate that the carrying amounts may not be recoverable. Such triggering events or changes in circumstances may include: a significant decrease in the market price of a long-lived asset, a significant adverse change in the extent or manner in which a long-lived asset is being used, significant adverse change in legal factors or in the business climate, the impact of competition or other factors that could affect the value of a long-lived asset, a significant adverse deterioration in the amount of revenue or cash flows expected to be generated from an asset group, an accumulation of costs significantly in excess of the amount originally expected for the acquisition or development of a long-lived asset, current or future operating or cash flow losses that demonstrate continuing losses associated with the use of a long-lived asset, or a current expectation that, more likely than not, a long-lived asset will be sold or otherwise disposed of significantly before the end of its previously estimated useful life. The Company performs impairment testing at the asset group level that represents the lowest level for which identifiable cash flows are largely independent of the cash flows of other assets and liabilities. If events or changes in circumstances indicate that the carrying amount of an asset group may not be recoverable and the expected undiscounted future cash flows attributable to the asset group are less than the carrying amount of the asset group, an impairment loss equal to the excess of the asset’s carrying value over its fair value is recorded. Fair value is determined based upon estimated discounted future cash flows. During the years ended December 31, 2016, 2015 and 2014, there were no impairment charges recorded on the Company’s long-lived assets.
Goodwill
Goodwill represents the excess of the aggregate purchase price paid over the fair value of the identifiable assets and liabilities acquired in the Company’s business combinations. Goodwill is not amortized and is tested for impairment at least annually or whenever events or changes in circumstances indicate that the carrying value may not be recoverable. Events or changes in circumstances which could trigger an impairment review include a significant adverse change in business climate, an adverse action or assessment by a regulator, unanticipated competition, a loss of key personnel, significant changes in the manner of use of the acquired assets or the Company’s overall business strategy, significant negative industry or economic trends, or significant underperformance relative to expected historical or projected future results of operations.
The Company has the option to assess goodwill for possible impairment by performing a qualitative analysis to determine if it is more likely than not that the fair value of a reporting unit is less than its carrying amount or perform the first step on an impairment test.
F-13
The first step involves comparing the estimated fair value of a reporting unit with its respective book value, including goodwill. If the estimated fair value exceeds book value, goodwill is considered not to be impaired and no additional steps are necessary. If, however, the fair value of the reporting unit is less than book value, then the second step is to compare the carrying amount of the goodwill to its implied fair value. The estimate of implied fair value of goodwill may require valuations of certain internally generated and unrecognized intangible assets. If the carrying amount of goodwill exceeds the implied fair value of that goodwill, an impairment loss is recognized in an amount equal to the excess.
The Company tests for goodwill impairment annually at December 31. During the years ended December 31, 2016, 2015 and 2014, there were no impairment charges recorded on goodwill. In 2016, the Company qualitatively assessed whether it was more likely than not that the respective fair values of its reporting units are less than their carrying amounts, including goodwill. Based on the assessment of the qualitative factors, the Company determined that it was more likely than not that the fair value of the reporting units were greater than their carrying amounts. As such, performing the first step of the two-step impairment test was unnecessary. In 2015, the Company conducted a quantitative goodwill assessment of its reporting units. The fair value of the reporting units exceeded their respective carrying values and accordingly, the Company concluded there was no impairment of its goodwill.
Revenue Recognition
The Company recognizes revenue, net of sales allowances, when (i) persuasive evidence of an arrangement exists, (ii) delivery has occurred or services have been rendered, (iii) the fees are fixed or determinable, and (iv) collectability is reasonably assured. Deferred revenue is recognized on the accompanying consolidated balance sheets when payments are received in advance of the Company meeting all of the revenue recognition criteria described above. The Company recorded deferred revenue (included in other accrued expenses) of $0.5 million at December 31, 2016 and 2015.
Transaction Revenues
Auto Buying Program Revenues
Revenues consist of fees paid by dealers participating in the Company’s dealer network with which the Company has an agreement (“TrueCar Certified Dealers” or “Dealers”). TrueCar Certified Dealers pay the Company fees either on a per-vehicle basis for sales to Auto Buying Program users or in the form of a subscription arrangement.
The Company recognizes revenue for fee arrangements based on a per-vehicle basis when the vehicle sale has occurred between the Auto Buying Program user and the Dealer. Under the contractual terms and conditions of arrangements with its network of participating TrueCar Certified Dealers, the dealer is required to pay the Company upon the sale of a vehicle to an Auto Buying Program user that has been provided to the dealer by the Company. Recognition of revenue from the sale is not contingent upon verification or acceptance of the transaction by the dealer.
Upon a user deciding to proceed with the user’s vehicle purchase through the Company, the user provides his or her name, address, e-mail, and a phone number during the process of obtaining a Guaranteed Savings Certificate, which gives the Company the identity and source of a TrueCar introduction provided to a specific dealer prior to an actual sale occurring. After a sale occurs, the Company receives information regarding the sale, including the identity of the purchaser, via the Dealer Management System used by the dealer that made the sale. The Company also receives information regarding vehicle sales from a variety of data sources, including third party car sales aggregators, car dealer networks, and other publicly available sources (collectively, “sales data”) and uses this sales data to further verify that a sale has occurred between an Auto Buying Program user and a TrueCar Certified Dealer, as well as a means to invoice the Dealer shortly after the completion of the sales transaction. Actual vehicle sales data is reported on a daily basis shortly following the date of sale.
The Company also recognizes revenue from dealers under subscription agreements. Subscription fee arrangements are short-term in nature with terms ranging from one to six months and are cancellable by the dealer or the Company at any time. Subscription arrangements fall into three types: flat rate subscriptions, subscriptions subject to downward adjustment based on a minimum number of vehicle sales (“guaranteed sales”), and subscriptions based on introduction volume, including those subject to downward adjustment based on a minimum number of introductions (“guaranteed introductions”). Under flat rate subscription arrangements, fees are charged at a monthly flat rate regardless of the number of sales made to users of the Company’s platform by the dealer. For flat rate subscription arrangements, the Company recognizes the fees as revenue over the subscription period on a straight line basis which
F-14
corresponds to the period that the Company is providing the dealer access to the Auto Buying Program. Under guaranteed sales subscription arrangements, fees are charged based on the number of guaranteed sales multiplied by a fixed amount per vehicle. To the extent that the actual number of vehicles sold by the dealers to users of the Company’s platform is less than the number of guaranteed sales, the Company provides a credit to the dealer. To the extent that the actual number of vehicles sold exceeds the number of guaranteed sales, the Company is not entitled to any additional fees. Certain of our subscription arrangements are charged based on volume of introductions provided while other introduction based subscription arrangements operate under a guaranteed introduction model. Under guaranteed introductions subscription arrangements, fees are charged based on a periodically-updated formula that considers, among other things, the introductions anticipated to be provided to the dealer. To the extent that the number of actual introductions is less than the number of guaranteed introductions, the Company provides a credit to the dealer. To the extent that the actual number of introductions provided exceeds the number guaranteed, the Company is not entitled to any additional fees. For guaranteed sales and guaranteed introductions subscription arrangements, the Company recognizes revenue based on the lesser of (i) the actual number of sales generated or introductions delivered through the Auto Buying Program during the subscription period multiplied by the contracted price-per-sale/introduction or (ii) the guaranteed number of sales or introductions multiplied by the contracted price per sale/introduction.
OEM Incentives
The Company enters into arrangements with automobile manufacturers (“OEM”) to promote the sale of their vehicles through the offering of additional consumer incentives. These manufacturers pay a per-vehicle fee to the Company for promotion of the incentive and the Company recognizes as revenue the per-vehicle incentive fee at the time the sale of the vehicle has occurred between the Auto Buying Program user and the dealer.
Forecasts, Consulting and Other Revenues
Revenues are generated from the sale of forecasts of lease residual value data for new and used leased automobiles, guidebooks, and consulting services. Sales are principally made to vehicle manufacturers, vehicle financing companies, investment banks, automobile dealers, and insurance companies. Forecasts and consulting services customers typically prepay annually in the form of a subscription agreement for lease residual value data and guidebooks.
Forecasts and consulting services sales arrangements may include multiple deliverables, such as sale of lease residual forecasts from guidebooks and consulting services. For multiple deliverable revenue arrangements, the Company first assesses whether each deliverable has value to the customer on a standalone basis and performance is considered probable and substantially in its control. Forecasts and consulting services can be sold both on a standalone basis or as part of multiple deliverable arrangements. The deliverables constitute separate units of accounting because the deliverables have standalone value to the customer and as such, the total arrangement consideration is allocated to each unit of accounting using the relative selling price hierarchy. This hierarchy requires the selling price of each deliverable in a multiple deliverable revenue arrangement to be based on, in descending order: (i) vendor-specific objective evidence, or VSOE, (ii) third-party evidence of selling price, or TPE, or (iii) management’s best estimated selling price, or BESP.
The Company cannot establish VSOE or TPE because the deliverables are not sold separately within a sufficiently narrow price range or third party pricing for comparable services is not available; therefore, it applies judgment to determine BESP. The objective of BESP is to determine the price at which the Company would transact a sale if the service were sold on a stand-alone basis. The determination of BESP requires the Company to make significant estimates and judgments and the Company considers numerous factors in this determination, including the nature of the deliverables, market conditions and the competitive landscape, internal costs, and its pricing and discounting practices. The Company updates its estimates of BESP on a periodic basis as events and as circumstances may require.
Revenue allocated to each element from the sale of lease residual value forecasts, guidebooks, and consulting services is recognized when the basic recognition criteria are met for each element. Sales attributed to residual value data and guidebooks are recognized when the data or guidebooks are delivered, and consulting services are recognized when the project is completed.
F-15
Lead Referral Fees
Lead referral fees revenues consist of fees earned through an online process that refers consumers to out-of-network auto dealers for new and used vehicles when the Company is unable to identify a dealer with a vehicle in the Company’s dealer network for which a prospective car buyer is searching. Fees are recognized at the time the lead referral is transmitted to, and accepted by, the lead-buying entities and are not contingent on the sale of a vehicle. The Company is not a party to the arrangement with, and is not the primary obligor to, the lead-buyer’s dealer; accordingly, revenue is recognized for the net fee received for the lead from the lead-buyer.
Cost of Revenue (exclusive of depreciation and amortization)
Cost of revenue includes expenses related to the fulfillment of the Company’s services, consisting primarily of data costs and licensing fees paid to third party service providers and expenses related to operating the Company’s website and mobile applications, including those associated with its data centers, hosting fees, data processing costs required to deliver introductions to its network of TrueCar Certified Dealers, employee costs related to certain dealer operations, sales matching, and employee and consulting costs related to delivering data and consulting services to the Company’s customers. Cost of revenue excludes depreciation and amortization of software development costs and other hosting and data infrastructure equipment used to operate the Company’s platforms, which are included in the depreciation and amortization line item on its statement of comprehensive loss.
Sales and Marketing
Sales and marketing expenses consist primarily of: television, digital, and radio advertising; media production costs, affinity group partner marketing fees, which also includes loan subvention costs where the Company pays certain affinity group marketing partners a portion of consumers’ borrowing costs for car loan products offered by these affinity group marketing partners, and common stock warrants issued to USAA; marketing sponsorship programs; and digital customer acquisition. In addition, sales and marketing expenses include employee related expenses for sales, customer support, marketing and public relations employees, including salaries, bonuses, benefits, severance, and stock-based compensation expenses; third-party contractor fees; and facilities costs. Sales and marketing expenses also include costs related to common stock warrants issued to a third-party marketing firm and a service provider as part of our commercial arrangements with them.
Marketing and advertising costs promote our services and are expensed as incurred, except for media production costs which are expensed the first time the advertisement is aired. Marketing and advertising expenses were $70.7 million, $79.6 million, and $58.1 million for the years ended December 31, 2016, 2015 and 2014, respectively. Prepaid expenses include prepaid media costs of $1.6 million and $1.8 million at December 31, 2016 and 2015, respectively. Accrued marketing and advertising expenses were $2.1 million and $2.0 million at December 31, 2016 and 2015, respectively, and were included within accrued expenses and other current liabilities on the consolidated balance sheet.
Technology and Development
Technology and development expenses consist primarily of employee related expenses for technology and development staff, including salaries, benefits, bonuses, severance, and stock-based compensation; the cost of certain third-party service providers; and facilities costs. Technology and development expenses are expensed as incurred.
General and Administrative
General and administrative expenses consist primarily of employee related expenses for administrative, legal, finance, and human resource staffs, including salaries, benefits, bonuses, severance, and stock-based compensation; professional fees; insurance premiums; other corporate expenses; lease exit charges, and facilities costs.
Stock-Based Compensation
The Company recognizes stock-based compensation expense related to employee stock option, restricted stock awards, and restricted stock units based on the fair value of the awards on the grant date in accordance with the relevant standards. The Company estimates the grant date fair value of option grants, and the resulting stock-based compensation expense, using the Black-Scholes
F-16
option pricing model. Stock-based compensation for employee awards is recognized on a straight-line basis over the requisite period, except for performance-based awards which are recognized using the graded-vesting model.
Compensation expense for non-employee stock-based awards is recognized in accordance with FASB ASC 505, Equity — Equity-Based Payments to Non-Employees. Under this standard, stock option awards issued to non-employees are accounted for at fair value using the Black-Scholes option-pricing model. Management believes that the fair value of the stock options is more reliably measured than the fair value of the services received. The Company records compensation expense based on the then-current fair values of the stock options at each financial reporting date. Compensation recorded during the service period is adjusted in subsequent periods for changes in the stock options’ fair value until the earlier of the date at which the non-employee’s performance is complete or a performance commitment is reached, which is generally when the stock option vests.
For issuances of restricted stock awards or restricted stock units, the Company determines the fair value of the award based on the market value of its common stock at the date of grant.
Income Taxes
The Company accounts for income taxes under the asset and liability method. Under the asset and liability method, deferred tax assets and liabilities are determined based on the differences between the financial reporting and income tax bases of assets and liabilities and are measured using the tax rates that will be in effect when the differences are expected to reverse. A valuation allowance is recorded when it is more likely than not that some of the deferred tax assets will not be realized.
The Company determines whether a tax position is more likely than not to be sustained upon examination based on the technical merits of the position. For tax positions meeting the more likely than not threshold, the tax amount recognized in the financial statements is reduced by the largest benefit that has a greater than 50% likelihood of being realized upon ultimate settlement with the relevant tax authority. The Company recognizes interest and penalties accrued related to unrecognized tax benefits, if any, in its income tax provision in the accompanying statements of comprehensive loss.
Comprehensive Loss
Comprehensive loss encompasses all changes in equity other than those arising from transactions with stockholders and consists of net loss and unrealized gains on marketable securities. For the years ended December 31, 2016, 2015 and 2014, the Company had no other comprehensive income (loss) items and accordingly, net loss equaled comprehensive loss.
Recent Accounting Pronouncements
Under the Jumpstart Our Business Startups Act (“JOBS Act”), the Company meets the definition of an emerging growth company. The Company has irrevocably elected to opt out of the extended transition period for complying with new or revised accounting standards pursuant to Section 107(b) of the JOBS Act.
In January 2017, the Financial Accounting Standards Board (“FASB”) issued guidance simplifying the test for goodwill impairment. This standard eliminates Step 2 from the goodwill impairment test, instead requiring an entity to recognize a goodwill impairment charge for the amount by which the goodwill carrying amount exceeds the reporting unit’s fair value. This guidance is effective for interim and annual goodwill impairment tests in fiscal years beginning after December 15, 2019, and early adoption is permitted. The adoption of this guidance is not expected to have a material impact on the Company's consolidated financial statements.
In October 2016, the FASB issued new guidance which requires the recognition of the income tax consequences of an intra-entity transfer of an asset, other than inventory, when the transfer occurs. This removes the exception to postpone recognition until the asset has been sold to an outside party. This standard is effective for annual reporting periods beginning after December 15, 2017, including interim reporting periods within those annual reporting periods, with early adoption is permitted. It is required to be applied on a modified retrospective basis through a cumulative-effect adjustment to the balance sheet as of the beginning of the fiscal year of adoption. The adoption of this guidance is not expected to have a material impact on the Company's consolidated financial statements.
F-17
In March 2016, the FASB issued guidance to simplify several aspects of the accounting for share-based payment award transactions, including accounting for income tax, classification of awards as either equity or liabilities, forfeitures, statutory tax withholding requirements, and classification in the statement of cash flows. The new guidance is effective for annual periods beginning after December 15, 2016, and interim periods within those annual periods. Early adoption is permitted if it is applied from the beginning of the fiscal year of adoption. The Company adopted this guidance in the third quarter of 2016, which required retroactive application to the beginning of 2016.
With this adoption, the Company recognized $18.0 million of accumulated excess tax benefits as deferred tax assets that under previous guidance could not be recognized until the benefits were realized through a reduction in cash taxes paid. However, given the full valuation allowance placed on the additional $18.0 million of deferred tax assets, the recognition upon adoption had no impact upon the accumulated deficit as of January 1, 2016.
Also with this adoption, the Company elected to account for forfeitures when they occur instead of estimating the expected forfeiture rate. Adoption of this provision resulted in a cumulative effect adjustment as of January 1, 2016 to increase accumulated deficit by $0.6 million.
In February 2016, the FASB issued guidance amending the existing accounting standards for lease accounting, including requiring lessees to recognize most leases on their balance sheets and making targeted changes to lessor accounting. The new guidance will be effective for public entities for annual periods beginning after December 15, 2018 and interim periods therein. Early adoption is permitted. The new leases standard requires a modified retrospective transition approach for all leases existing at, or entered into after, the date of initial application, with an option to use certain transition relief. The Company is evaluating the methods and impact of adopting this guidance on its consolidated financial statements.
In September 2015, the Financial Accounting Standards Board ("FASB") issued new guidance regarding business combinations to simplify measurement-period adjustments. Under this guidance, an acquirer must recognize adjustments to provisional amounts that are identified during the measurement period in the reporting period in which the adjustment amounts are determined. This guidance also requires acquirers to present separately on the face of the income statement, or disclose in the notes, the portion of the amount recorded in current period earnings by line item that would have been recorded in previous reporting periods. The new guidance is effective for annual and interim reporting periods beginning after December 15, 2015 and must be applied prospectively. The adoption of this guidance did not have a material impact on the Company’s consolidated financial statements.
In April 2015, the FASB issued new guidance related to the customer’s accounting for fees paid in a cloud computing arrangement, which provides guidance to customers about whether a cloud computing arrangement includes a software license. If a cloud computing arrangement includes a software license, then the customer should account for the software license element of the arrangement consistent with the acquisition of other software licenses. If a cloud computing arrangement does not include a software license, the customer should account for the arrangement as a service contract. The new guidance is effective for annual and interim reporting periods beginning after December 15, 2015. The adoption of this guidance did not have a material impact on the Company’s consolidated financial statements.
In April 2015, the FASB issued new guidance related to the presentation of debt issuance costs, which requires debt issuance costs to be presented in the balance sheet as a direct deduction for the associated debt liability. The new guidance is effective for annual and interim reporting periods beginning after December 15, 2015. The adoption of this guidance did not have a material impact on the Company’s consolidated financial statements.
In August 2014, the FASB issued guidance on the disclosure of uncertainties about an entity's ability to continue as a going concern. This standard provides guidance about management's responsibility to evaluate whether there is substantial doubt about an entity's ability to continue as a going concern and to provide related footnote disclosures, if required. The guidance is effective for annual reporting periods ending after December 15, 2016. The adoption of this guidance did not have an impact on the Company's consolidated financial statements.
F-18
In May 2014, the FASB issued guidance related to revenue from contracts with customers. Under this guidance, revenue is recognized when promised goods or services are transferred to customers in an amount that reflects the consideration that is expected to be received for those goods or services. The updated standard will replace all existing revenue recognition guidance under GAAP when it becomes effective and permits the use of either the retrospective or cumulative effect transition method. In August 2015, the FASB deferred the effective date to January 1, 2018, with early adoption beginning January 1, 2017. In 2016, the FASB issued additional guidance to clarify the implementation guidance. The Company continues to evaluate the impact of adopting this guidance on its consolidated financial statements.
F-19
3. Property and Equipment, net
Property and equipment consisted of the following at December 31, 2016 and 2015 (in thousands):
December 31, | |||||||
2016 | 2015 | ||||||
Computer equipment, software, and internally developed software | $ | 65,973 | $ | 53,862 | |||
Furniture and fixtures | 3,705 | 3,575 | |||||
Leasehold improvements | 6,067 | 4,410 | |||||
Capitalized facility leases | 39,302 | 39,154 | |||||
115,047 | 101,001 | ||||||
Less: Accumulated depreciation | (48,106 | ) | (29,611 | ) | |||
Total property and equipment, net | $ | 66,941 | $ | 71,390 | |||
The Company is considered the owner, for accounting purposes only, of one of its Santa Monica, California leased office spaces and of its San Francisco, California leased office space (collectively, the "Premises") as it had taken on certain risks of construction build cost overages above normal tenant improvement allowances. Accordingly, at December 31, 2016 and 2015, the Company has capitalized $39.3 million and $39.2 million, respectively, related to the Premises, which represents the estimated fair value of the leased properties, additions for capitalized interest incurred during the construction periods, and capitalized costs related to improvements to the buildings. For the year ended December 31, 2015, the Company capitalized approximately $2.0 million of interest costs related to the Premises. No interest costs related to the Premises were capitalized for the years ended December 31, 2016 and 2014. At December 31, 2016 and 2015, the Company had recorded accumulated amortization of $1.2 million and $0.2 million for capitalized facility leases. Additionally, at December 31, 2016 and 2015, the Company recognized a corresponding lease financing obligation of approximately $30.9 million and $28.9 million, respectively. Refer to Note 6 for additional information.
Included in the table above are property and equipment of $4.3 million and $5.3 million as of December 31, 2016 and 2015, respectively, which are capitalizable, but had not yet been placed in service. The $4.3 million and $5.3 million balances at December 31, 2016 and 2015, respectively, were comprised primarily of capitalized software not ready for its intended use.
Total depreciation and amortization expense of property and equipment was $19.3 million, $13.5 million and $8.9 million for the years ended December 31, 2016, 2015, and 2014, respectively.
Amortization of internal use capitalized software development costs was $14.7 million, $8.8 million and $5.7 million for the years ended December 31, 2016, 2015, and 2014, respectively.
Amortization of capitalized facility leases was $1.0 million and $0.2 million for the years ended December 31, 2016 and 2015.
F-20
4. Intangible Assets
Intangible assets consisted of the following at December 31, 2016 and December 31, 2015 (in thousands, except years):
At December 31, 2016 | |||||||||||
Gross Carrying Value | Accumulated Amortization | Net Carrying Value | |||||||||
Acquired technology and domain name | $ | 31,090 | $ | (16,876 | ) | $ | 14,214 | ||||
Customer relationships | 6,300 | (3,925 | ) | 2,375 | |||||||
Tradenames | 4,900 | (1,715 | ) | 3,185 | |||||||
Total | $ | 42,290 | $ | (22,516 | ) | $ | 19,774 | ||||
At December 31, 2015 | |||||||||||
Gross Carrying Value | Accumulated Amortization | Net Carrying Value | |||||||||
Acquired technology and domain name | $ | 31,090 | $ | (13,835 | ) | $ | 17,255 | ||||
Customer relationships | 6,300 | (3,252 | ) | 3,048 | |||||||
Tradenames | 4,900 | (1,388 | ) | 3,512 | |||||||
Total | $ | 42,290 | $ | (18,475 | ) | $ | 23,815 | ||||
Amortization expense by asset type for the years ended December 31, 2016, 2015, and 2014 is shown below (in thousands):
Year Ended December 31, | |||||||||||
2016 | 2015 | 2014 | |||||||||
Acquired technology and domain name | $ | 3,041 | $ | 3,047 | $ | 3,164 | |||||
Customer relationships | 673 | 760 | 760 | ||||||||
Trade names | 327 | 327 | 327 | ||||||||
Total amortization | $ | 4,041 | $ | 4,134 | $ | 4,251 | |||||
Expected amortization expense with respect to intangible assets at December 31, 2016 for each of the five years through December 31, 2021 and thereafter is as follows (in thousands):
Years ended December 31, | |||
2017 | $ | 3,862 | |
2018 | 3,861 | ||
2019 | 3,791 | ||
2020 | 3,787 | ||
2021 | 2,922 | ||
Thereafter | 1,551 | ||
Total amortization expense | $ | 19,774 | |
F-21
5. Credit Facility
In February 2015, the Company entered into a third amended and restated loan and security agreement (“Third Amended Credit Facility”) with the same financial institution with which the Company had previous credit arrangements, effective as of February 18, 2015, for a $35.0 million secured revolving credit facility that expires on February 18, 2018. The Third Amended Credit Facility provides a $10.0 million subfacility for the issuance of letters of credit and contains an increase option permitting the Company, subject to the lenders consent, to increase the revolving credit facility by up to $15.0 million, to an aggregate maximum of $50 million.
This amended credit facility bears interest, at the Company’s option, at either (i) the prime rate published by The Wall Street Journal, plus a spread of -0.25% to 0.50%, or (ii) a LIBOR rate determined in accordance with the terms of the credit facility, plus a spread of 1.75% to 2.50%. In each case, the spread is based on the Company’s adjusted quick ratio, which is a ratio of the Company’s cash and cash equivalents plus net billed accounts receivable to current liabilities plus all borrowings under the credit facility.
Interest is due and payable quarterly in arrears for prime rate loans and on the earlier of the last day of each quarter or the end of an interest period, as defined in the Third Amended Credit Facility, for LIBOR rate loans. The Company is also obligated to pay an unused revolving line facility fee of 0.0% to 0.20% per annum based on the Company’s adjusted quick ratio.
This amended credit facility requires the Company to maintain an adjusted quick ratio of at least 1.5 to 1 on the last day of each quarter. If the adjusted quick ratio is not maintained, then the facility requires the Company to maintain, as measured at each quarter end, a maximum consolidated leverage ratio 3.00 or 2.50 to 1.00, and a fixed charge coverage ratio of at least 1.25 to 1.00.
Consolidated leverage ratio is a ratio of all funded indebtedness, including all capital lease obligations, plus all letters of credit under the facility to the Company’s Adjusted EBITDA for the trailing twelve months. Fixed charge coverage ratio is the ratio of our Adjusted EBITDA minus cash income taxes to our cash interest payments plus capital expenditures for the trailing twelve months. This credit facility also limits the Company’s ability to pay dividends. At December 31, 2016 and 2015, the Company was in compliance with the financial covenants.
The Company’s future material domestic subsidiaries are required, upon the lender’s request, to become co-borrowers under the credit facility. The credit facility contains acceleration clauses that accelerate any borrowings in the event of default. The obligations of the Company and its future material domestic subsidiaries are collateralized by substantially all of their respective assets, subject to certain exceptions and limitations.
At December 31, 2016 and 2015, the Company had no outstanding amounts under the credit facility. At December 31, 2016 and 2015, the amounts available were $30.7 million and $30.4 million, respectively, reduced for letters of credit issued and outstanding under the subfacility of $4.3 million and $4.6 million, respectively.
F-22
6. Commitments and Contingencies
Office Lease Commitments
At December 31, 2016, the Company had various non-cancellable leases related to the Company’s office facilities which expire through 2030. At December 31, 2016, future minimum payments for obligations under non-cancellable lease obligations, and related sublease income, are as follows (in thousands):
Years ended December 31, | Lease Commitments | Sublease Income | ||||||
2017 | $ | 9,749 | $ | (1,494 | ) | |||
2018 | 10,134 | (1,827 | ) | |||||
2019 | 10,426 | (1,668 | ) | |||||
2020 | 9,415 | (1,091 | ) | |||||
2021 | 7,863 | — | ||||||
Thereafter | 39,657 | — | ||||||
Total minimum lease payments | $ | 87,244 | $ | (6,080 | ) | |||
The Company recorded rent expense, net of sublease income, of $7.4 million, $6.3 million, and $2.8 million for the years ended December 31, 2016, 2015, and 2014, respectively.
San Francisco Office Lease
In May 2014, the Company entered into a facility lease in San Francisco (the “San Francisco Office”) with total future minimum lease commitments over 10 years, beginning August 1, 2014 of $7.0 million. The remaining future minimum lease commitments as of December 31, 2016 are included in the table above. In conjunction with this lease, the Company was required to obtain an irrevocable standby letter of credit in the amount of $0.8 million for the benefit of the landlord. Beginning August 1, 2017 through August 1, 2020, the letter of credit is subject to an annual reduction to as little as $0.2 million.
The Company had concluded that it was deemed the owner (for accounting purposes only) of the San Francisco Office during the construction period under build-to-suit lease accounting. As the Company assumed control of the construction project in the third quarter of 2014, the Company recorded the fair value of the leased property in "Property and equipment, net" and a corresponding liability in "Lease financing obligations" on the accompanying consolidated balance sheets. The Company recognized increases in the asset as additional building costs were incurred during the construction period. Additionally, imputed interest during the construction period was capitalized. At December 31, 2016 and 2015, the Company has capitalized $8.7 million and $8.5 million, respectively, in "Property and equipment, net" and a corresponding current and non-current lease financing obligation of $6.8 million.
Upon completion of the construction during the first quarter of 2015, the Company retained the fair value of the San Francisco Office lease property and the obligation on its balance sheet as it did not qualify for sales and leaseback accounting due to requirements to maintain collateral in the lease. The Company records the rent payments as a reduction of the lease financing obligation and imputed interest expense and ground rent as an operating expense. The fair value of the lease property will be depreciated over the building’s estimated useful life of forty years. At the conclusion of the lease term, the Company will de-recognize both the then carrying values of the asset and financing obligation.
Santa Monica Office Lease
In July 2014, the Company entered into a facility lease in Santa Monica (the “Santa Monica Office”) with total future minimum lease commitments over fifteen years, beginning in January 2015, of $36.0 million. The remaining future minimum lease commitments as of December 31, 2016 are included in the future minimum lease payments table above. In connection with this lease, the Company obtained an irrevocable standby letter of credit in the amount of $3.5 million for the benefit of the landlord. Beginning October 1, 2019 through October 1, 2025, the letter of credit is subject to an annual reduction to as little as $1.2 million.
F-23
The Company had concluded that it was deemed the owner (for accounting purposes only) of the Santa Monica Office during the construction period under build-to-suit lease accounting. As the Company assumed control of the construction project in the first quarter of 2015, the Company recorded the fair value of the leased property in “Property and equipment, net” and a corresponding liability in “Lease financing obligations” on the accompanying consolidated balance sheets. The Company recognized increases in the asset as additional building costs were incurred during the construction period. Additionally, imputed interest during the construction period was capitalized. At December 31, 2016 and 2015, the Company has capitalized $30.6 million and $30.4 million, respectively, in “Property and equipment, net” and a corresponding current and non-current lease financing obligation of $24.0 million and $22.1 million, respectively.
Upon completion of the construction during the fourth quarter of 2015, the Company retained the fair value of the Santa Monica Office lease property and the obligation on its balance sheet as it did not qualify for sales leaseback accounting due to requirements to maintain collateral in the lease. The Company records the rent payments as a reduction of the lease financing obligation and imputed interest expense; ground rent is recorded as an operating expense. The fair value of the lease property will be depreciated over the building’s estimated useful life of forty years. At the conclusion of the lease term, the Company will de-recognize both the then carrying values of the asset and financing obligation.
Austin Office Lease
In May 2016, the Company entered into a new office lease for approximately 38,000 square feet near Austin, Texas. The lease commenced in February 2017 and has a ten-year term. The Company has the option to extend the lease for two additional five-year periods. The cumulative base rent over the initial lease term is approximately $9.9 million.
Lease Exit Costs
In December 2015, the Company consolidated its Santa Monica, California office locations. In accordance with accounting for exit and disposal activities, the Company recognized a liability for lease exit costs incurred when it no longer derived economic benefit from the related leases. The liability was recognized and measured based on a discounted cash flow model when the cease use date occurred. The liability was determined based on the remaining lease rental due, reduced by estimated sublease rental income that could be reasonably obtained for the properties. The lease terms of the spaces exited expire in 2020. The liability is recorded in accrued expenses and other current liabilities (current portion) and other liabilities (non-current portion) within the consolidated balance sheets. The costs are recorded in general and administrative expense in the consolidated statement of comprehensive loss. In 2016, the Company updated its estimates of sublease rental income for the spaces exited in December 2015 and recorded an additional $3.1 million in lease exit costs. Due to a deterioration in the local commercial real estate market, the Company now expects both a longer period of time to sublease the spaces as well as lower rental rates than originally estimated in the fourth quarter of 2015. The Company does not expect to incur significant additional charges in future periods related to these exits.
The following table presents a roll forward of the lease exit liability for the years ended December 31, 2016 and 2015 (in thousands):
Lease Exit Costs | |||
Accrual at December 31, 2014 | $ | — | |
Expense | 2,232 | ||
Cash Payments | (244 | ) | |
Accrual at December 31, 2015 | $ | 1,988 | |
Expense | 3,065 | ||
Cash Payments | (2,396 | ) | |
Accrual at December 31, 2016 | $ | 2,657 | |
F-24
Legal Proceedings
From time to time, the Company may become subject to legal proceedings, claims, and litigation arising in the ordinary course of business. When the Company becomes aware of a claim or potential claim, it assesses the likelihood of any loss or exposure. In accordance with authoritative guidance, the Company records loss contingencies in its financial statements only for matters in which losses are probable and can be reasonably estimated. Where a range of loss can be reasonably estimated with no best estimate in the range, the Company records the minimum estimated liability. If the loss is not probable or the amount of the loss cannot be reasonably estimated, the Company discloses the nature of the specific claim if the likelihood of a potential loss is reasonably possible and the amount involved is material. The Company continuously assesses the potential liability related to the Company’s pending litigation and revises its estimates when additional information becomes available. The Company is not currently a party to any material legal proceedings, other than as described below.
On March 9, 2015, the Company was named as a defendant in a lawsuit filed in the U.S. District Court in the Southern District of New York (the "NY Lanham Act Litigation"). The complaint in the NY Lanham Act Litigation, purportedly filed on behalf of numerous automotive dealers who are not participating on the TrueCar platform, alleges that the Company has violated the Lanham Act as well as various state laws prohibiting unfair competition and deceptive acts or practices related to the Company’s advertising and promotional activities. The complaint seeks injunctive relief in addition to over $250 million in damages as a result of the alleged diversion of customers from the plaintiffs’ dealerships to TrueCar Certified Dealers. On April 7, 2015, the Company filed an answer to the complaint. Thereafter, the plaintiffs amended their complaint, and on July 13, 2015, the Company filed a motion to dismiss the amended complaint. On January 6, 2016, the Court granted the Company’s motion to dismiss with respect to some, but not all, of the advertising and promotional activities challenged in the amended complaint. The litigation is currently in the discovery phase. The Company believes that the portions of the amended complaint that survived the Company’s motion to dismiss are without merit, and it intends to vigorously defend itself in this matter. We have not recorded an accrual related to this matter as of December 31, 2016, as we do not believe a loss is probable or reasonably estimable.
On May 20, 2015, the Company was named as a defendant in a lawsuit filed by the California New Car Dealers Association in the Superior Court for the County of Los Angeles (the "CNCDA Litigation"). The complaint in the CNCDA Litigation seeks declaratory and injunctive relief based on allegations that the Company is operating in the State of California as an unlicensed automobile dealer and autobroker. The complaint does not seek monetary relief. On July 20, 2015, the Company filed a "demurrer" to the complaint, which is a pleading that requests the court to dismiss the case. Thereafter, the plaintiffs amended their complaint, and on September 11, 2015, the Company filed a demurrer to the amended complaint. On December 7, 2015, the Court granted the Company’s demurrer in its entirety, but afforded the CNCDA the opportunity to file a second amended complaint. The CNCDA filed a second amended complaint on January 4, 2016. The second amended complaint reiterates the claims in the prior complaints and adds claims under theories based on the federal Lanham Act and California unfair competition law. On February 3, 2016, the Company filed a demurrer to the second amended complaint. On March 30, 2016, the Court granted in part and denied in part the Company’s demurrer to the second amended complaint, dismissing the Lanham Act claim but declining to dismiss the balance of the claims at the demurrer stage of the litigation. On May 31, 2016, based on certain intervening developments in state law, the Court announced that it would reconsider its March 30, 2016 order, and it invited the parties to file new briefs on the demurrer issues. On July 15, 2016, the Court heard oral argument on reconsideration of the demurrer issues. On July 25, 2016, the Court granted in part and denied in part the Company’s demurrer to the second amended complaint, just as it had done in its March 30, 2016 order. The litigation is currently in the discovery phase and is currently scheduled for trial in August 2017. The Company believes that the portions of the second amended complaint that survived the Court’s reconsideration of the Company’s demurrer are without merit, and it intends to vigorously defend itself in this matter. The Company has not recorded an accrual related to this matter as of December 31, 2016, as the Company does not believe a loss is probable or reasonably estimable.
On May 27, 2015, a purported securities class action complaint was filed in the U.S. District Court for the Central District of California (the “Federal Securities Litigation”) by Satyabrata Mahapatra naming the Company and two other individuals not affiliated with the Company as defendants. On June 15, 2015, the plaintiff filed a Notice of Errata and Correction purporting to name Scott Painter, the Company’s then Chief Executive Officer, and Michael Guthrie, the Company’s Chief Financial Officer, as individual defendants in lieu of the two individual defendants named in the complaint. On October 5, 2015, the plaintiffs amended their complaint. As amended, the complaint in the Federal Securities Litigation seeks an award of unspecified damages, interest and attorneys' fees based on allegations that the defendants made false and/or misleading statements, and failed to disclose material adverse facts about the Company’s business, operations, prospects and performance. Specifically, the amended complaint alleges that during the putative class period, the defendants made false and/or misleading statements and/or failed to disclose that: (i) the
F-25
Company’s business practices violated unfair competition and deceptive trade practice laws (i.e., the issues raised in the NY Lanham Act Litigation); (ii) the Company acts as a dealer and broker in car sales transactions without proper licensing, in violation of various states’ laws that govern car sales (i.e., the issues raised in the CNCDA Litigation); and (iii) as a result of the above, the Company’s registration statements, prospectuses, quarterly and annual reports, financial statements, SEC filings, press releases, and other statements and documents were materially false and misleading at times relevant to the amended complaint and putative class period. The amended complaint asserts a putative class period stemming from May 16, 2014 to July 23, 2015. On October 19, 2015, the Company filed a motion to dismiss the amended complaint. On December 9, 2015, the Court granted the Company’s motion to dismiss and dismissed the case in its entirety. On January 8, 2016, the plaintiff filed a notice of appeal. On June 20, 2016, the plaintiff filed a motion for voluntary dismissal of the appeal. The motion was granted by the Court on June 27, 2016. As the case has been dismissed, no loss was deemed probable and no accrual related to this matter has been recorded.
On December 23, 2015, the Company was named as a defendant in a putative class action lawsuit filed by Gordon Rose in the California Superior Court for the County of Los Angeles (the “California Consumer Class Action”). The complaint asserted claims for unjust enrichment, violation of the California Consumer Legal Remedies Act, and violation of the California Business and Professions Code, based principally on factual allegations similar to those asserted in the NY Lanham Act Litigation and the CNCDA Litigation. The complaint sought an award of unspecified damages, interest, disgorgement, injunctive relief, and attorneys’ fees. In the complaint, the plaintiff sought to represent a class of California consumers defined as “[a]ll California consumers who purchased an automobile by using TrueCar, Inc.’s price certificate during the applicable statute of limitations.” On January 12, 2016, the Court entered an order staying all proceedings in the case pending an initial status conference, which was previously scheduled for April 13, 2016. On March 16, 2016, the case was reassigned to a different judge. As a result of that reassignment, the initial status conference was rescheduled for and held on May 26, 2016. By stipulation, the stay of discovery has been continued until a second status conference, which was scheduled for October 12, 2016. On July 13, 2016, the plaintiff amended his complaint. The amended complaint continues to assert claims for unjust enrichment, violation of the California Consumer Legal Remedies Act, and violation of the California Business and Professions Code. The amended complaint retains the same proposed class definition as the initial complaint. Like the initial complaint, the amended complaint seeks an award of unspecified damages, interest, disgorgement, injunctive relief, and attorneys’ fees. On September 12, 2016, the Company filed a demurrer to the amended complaint. On October 12, 2016, the Court heard oral argument on the demurrer. On October 13, 2016, the Court granted in part and denied in part the Company’s demurrer to the amended complaint, dismissing the unjust enrichment claim but declining to dismiss the balance of the claims at the demurrer stage of the litigation. At a status conference held on January 26, 2017, the Court ruled that discovery may proceed regarding matters related to class certification only at this time. The Company believes that the amended complaint is without merit, and it intends to vigorously defend itself in this matter. The Company has not recorded an accrual related to this matter as of December 31, 2016, as the Company does not believe a loss is probable or reasonably estimable.
Employment Contracts
The Company has entered into employment contracts with certain executives of the Company. Employment under these contracts is at-will employment. However, under the provisions of the contracts, the Company would incur severance obligations of up to twelve months of the executive’s annual base salary for certain events, such as involuntary terminations. In addition, upon the consummation of the IPO, certain executives earned liquidity bonuses totaling $2.6 million, which were recorded in sales and marketing and general and administrative expenses in the Company’s consolidated statements of comprehensive loss during the year ended December 31, 2014.
In December 2015, pursuant to an executed separation agreement with the Company's former CEO, the Company will pay its former CEO: (i) a 2015 bonus of $0.1 million; (ii) severance of approximately $0.5 million to be paid in approximately equal semi-monthly payments through December 31, 2016; and (iii) an annual fee of $0.1 million for limited advisory services to the Company during the period from his termination date to May 2018. Additionally, the Company will continue to provide its former CEO health insurance benefits through the end of May 2018. For the year ended December 31, 2015, the Company recorded as severance costs of $0.9 million in general and administrative expenses in the Company's consolidated statements of comprehensive loss for these obligations to the former CEO. At December 31, 2015, the remaining severance liability related to the former CEO was $0.9 million. At December 31, 2016, the remaining severance liability related to the former CEO was $0.2 million and is included in the table below.
F-26
For the year ended December 31, 2015, in addition to its former CEO, the Company incurred severance costs totaling $2.5 million for several executive-level employees who terminated their employment during the period. Of the total, the Company recorded $0.4 million in sales and marketing, $0.4 million in technology and development and $1.7 million in general and administrative expenses in the Company's consolidated statements of comprehensive loss during the year ended December 31, 2015. At December 31, 2015, the remaining severance liability related to these former executive-level employees was $1.9 million. At December 31, 2016, there was no remaining severance liability related to these former executive-level employees.
For the year ended December 31, 2016, the Company incurred severance costs totaling $1.8 million related to an executive who terminated during the year, and several other employees whose terminations related to a reorganization of the Company's product and technology teams. The reorganization of the Company's product and technology teams was necessary to better align the Company's resources during its transition from multiple software platforms to a unified architecture. Of the total severance costs, the Company recorded $1.3 million in technology and development and $0.5 million in sales and marketing in the Company's consolidated statements of comprehensive loss for the year ended December 31, 2016. At December 31, 2016, the remaining severance liability related to these severance costs was $0.2 million and is included in the table below.
The following table presents a roll forward of this severance liability for the years ended December 31, 2016 and 2015:
Executive Severance and Reorganization Costs | |||
Accrual at December 31, 2014 | $ | — | |
Severance Costs | 3,732 | ||
Cash Payments | (929 | ) | |
Accrual at December 31, 2015 | $ | 2,803 | |
Severance Costs | 1,783 | ||
Cash Payments | (4,215 | ) | |
Accrual at December 31, 2016 | $ | 371 | |
Indemnifications
In the ordinary course of business, the Company may provide indemnifications of varying scope and terms to customers, vendors, lessors, investors, directors, officers, employees, and other parties with respect to certain matters, including, but not limited to, losses arising out of the Company’s breach of such agreements, services to be provided by the Company, or from intellectual property infringement claims made by third-parties. These indemnifications may survive termination of the underlying agreement and the maximum potential amount of future payments the Company could be required to make under these indemnification provisions may not be subject to maximum loss provisions. The maximum potential amount of future payments the Company could be required to make under these indemnification provisions is indeterminable. To date, there has not been a material claim paid by the Company, nor has the Company been sued in connection with these indemnification arrangements. At December 31, 2016 and 2015, the Company has not accrued a liability for these guarantees, because the likelihood of incurring a payment obligation, if any, in connection with these guarantees is not probable or reasonably estimable.
Software Subscription License Agreement
In August 2014, the Company entered into an agreement to purchase a perpetual software subscription license totaling $4.9 million, which was fully paid in the third quarter of 2014. In addition to the software license agreement, the Company purchased a support services package for a three year term totaling $2.4 million payable quarterly. The remaining future commitments for the support services package at December 31, 2016 are included in the purchase obligations table below.
F-27
Purchase Obligations
At December 31, 2016, the Company had the following purchase obligations (in thousands):
Total | Less Than 1 Year | 1 - 3 Years | 3 - 5 Years | More Than 5 Years | |||||||||||||||
Purchase obligations | $ | 7,037 | $ | 3,994 | $ | 3,043 | $ | — | $ | — | |||||||||
Purchase obligations include long-term agreements to purchase data information, software related licenses and support services, and other obligations that are enforceable and legally binding as of December 31, 2016. Purchase obligations exclude agreements that are cancelable without penalty.
F-28
7. Stockholders’ Equity
Reverse Stock Split
The Company’s board of directors and stockholders approved a 2-for-3 reverse split of its common stock and its Series A convertible preferred stock, or preferred stock, which was effected on May 2, 2014. All share data and per share data, and related information presented in the consolidated financial statements and accompanying notes have been retroactively adjusted, where applicable, to reflect the reverse stock split of its common stock and preferred stock.
Initial Public Offering
In May 2014, the Company completed its initial public offering (“IPO”) in which the Company sold an aggregate of 8,941,250 shares of its common stock, including 1,166,250 shares sold pursuant to the exercise by the underwriters of their option to purchase such shares, at a public offering price of $9.00 per share. The Company received net proceeds of $69.2 million, after deducting underwriting discounts and commissions and offering expenses payable by the Company, from sales of its shares in the IPO. Immediately prior to the completion of the IPO, all shares of the then-outstanding Series A convertible preferred stock automatically converted into 2,857,143 shares of common stock.
Follow-on Public Offering
In November 2014, the Company completed a follow-on public offering in which the Company sold 1,960,390 shares of common stock and selling stockholders sold 5,402,601 shares at a price of $17.00 per share. The Company received net proceeds of $30.8 million, after deducting underwriting discounts and commissions and offering expenses payable by the Company, from sales of its shares. The Company did not receive any proceeds from the sale of shares by selling stockholders.
Series A Preferred Stock
At December 31, 2012, the Company was authorized to issue 147.0 million shares of common stock. In November 2013, the Company increased the number of authorized shares of common stock to 150.0 million shares. Additionally, the Company authorized the issuance of 4.5 million shares of preferred stock, designated as Series A Preferred Stock (“Series A”).
In November 2013, the Company sold an aggregate of 2,857,143 shares of Series A and warrants to purchase 666,666 shares of common stock at an exercise price of $15.00 per share to Vulcan Capital Growth Equity LLC (“Vulcan”), in a private placement at a price of $10.50 per share, for an aggregate purchase price of $30.0 million.
In May 2014, immediately prior to the completion of the Company’s IPO, all of the outstanding shares of Series A preferred stock automatically converted into 2,857,143 shares of common stock on a one-to-one basis.
Warrants Issued to USAA
On March 12, 2009, June 25, 2010, January 1, 2012, and May 1, 2014, the Company entered into agreements with USAA, an affinity partner and significant stockholder of the Company, which provided for the issuance of warrants to purchase shares of the Company’s common stock upon achievement of minimum performance milestones based on the level of vehicle sales. The warrants were issued to USAA in exchange for marketing services performed by USAA under the Company’s affinity group marketing program. The purpose of the marketing services performed by USAA is to create awareness of, acquire traffic for, and drive users to, the Company’s auto buying platforms. For that reason expense recognized related to warrants issued to USAA is recorded as sales and marketing expense in the Company’s consolidated statements of comprehensive loss.
On November 24, 2009, the minimum performance milestones related to the March 12, 2009 agreement were reached and a fully vested warrant was issued by the Company which allows for the purchase of up to 961,482 shares of common stock at $0.83 per share. These warrants were outstanding at December 31, 2013.
On June 25, 2010, an additional warrant to purchase up to 1,653,333 shares of the Company’s common stock at $2.12 per share was issued to USAA. The warrant became exercisable based on the achievement of performance milestones based on the level
F-29
of vehicle sales. During 2011, the performance milestones were fully achieved and the affinity partner received a warrant to purchase the full 1,653,333 shares of common stock. The warrant was fully vested at December 31, 2011. These warrants were outstanding at December 31, 2013.
On January 1, 2012, the Company issued another warrant to USAA which allowed USAA to purchase up to 1,042,666 shares of the Company’s common stock at $7.95 per share if minimum performance milestones were reached. The warrant expired at the earlier of (i) eight (8) years from issuance, (ii) ninety (90) days after the expiration of the affinity-agreement with USAA, or (iii) immediately prior to the close of an initial public offering of the Company’s common stock.
In May 2014, the Company and USAA agreed to an extension of the affinity group marketing agreement. As part of the agreement, on May 1, 2014, the Company issued to USAA a warrant to purchase 1,458,979 shares of the Company’s common stock, which will be exercisable in two tranches. The first tranche of 392,313 shares has an exercise price of $7.95 per share and the second tranche of 1,066,666 shares has an exercise price of $15.00 per share. The warrant becomes exercisable based on the achievement of performance milestones based on the level of vehicle sales of USAA members through the Company’s auto buying platforms. The warrant terminates on the earlier of (i) the eighth anniversary of the date of issuance, (ii) the first anniversary of the termination of the USAA car-buying program, or (iii) the date on which the Company no longer operates the USAA car-buying program. In addition, the agreement provides for the Company to spend marketing program funds with the actual level of marketing spend to be mutually agreed upon by USAA and the Company, subject to limits based on the number of actual vehicle sales generated through the affinity group marketing program (Note 12).
For the years ended December 31, 2016, 2015 and 2014, the Company recognized expense of $0.1 million, $0.2 million and $5.7 million related to warrants to purchase 10,666 shares, 71,330 shares, and 631,449 shares of common stock that have been earned and are vested, respectively. The fair value of the warrants was based on the following assumptions using the Black-Scholes option-pricing model:
Year Ended December 31, | |||||||||||||||||
2016 | 2015 | 2014 | |||||||||||||||
Risk-free interest rate | 1.13 | % | to | 1.98 | % | 1.51 | % | to | 2.03 | % | 0.02 | % | to | 2.33 | % | ||
Contractual life (years) | 5.3 | to | 6.3 | 6.3 | to | 7.2 | 0.3 | to | 8.0 | ||||||||
Expected volatility | 46.7 | % | to | 48.8 | % | 47.8 | % | to | 54.2 | % | 48.5 | % | to | 57.5 | % | ||
Dividend yield | — | — | — | ||||||||||||||
Warrants to purchase 3,265,168 shares of the Company’s common stock earned from agreements entered into prior to May 2014 were exercised in connection with the Company’s IPO in May 2014 for an aggregate purchase price of $9.5 million.
At December 31, 2016, there were 509,642 warrants that were earned and outstanding with an additional 949,337 remaining warrants that is available for issuance upon achievement of minimum performance milestones.
Warrants Issued to Third Party Marketing Firm
On February 25, 2011, the Company entered into a media and marketing services agreement with a direct marketing firm. Under the arrangement, the marketing firm will provide media purchasing, production, advertising, and marketing services in connection with the advertising and marketing of the Company’s services. In addition to cash consideration, the Company agreed to issue a warrant to the marketing firm to purchase up to 1,433,333 shares of the Company’s common stock at a price of $6.02 per share. The warrant expires eight years from the issuance date and as of December 31, 2014, all warrants have been earned and issued to the marketing firm. In March 2015, the warrant to purchase 1,433,333 shares of the Company's common stock was exercised through a net settlement election. The Company issued 959,676 shares of its common stock to the third party marketing firm.
In 2014, the Company recorded the fair value of the warrants based on the following assumptions using the Black-Scholes option-pricing model: expected life of 4.8 to 5.1 years, risk free rate of 1.51% to 1.70%, and volatility of 46.6% to 48.1%.
For the year ended December 31, 2014, the Company recognized expense of $2.3 million related to 343,665 warrants earned. The expense has been reflected as sales and marketing expense on the accompanying consolidated statements of comprehensive loss.
F-30
Warrants Issued to Financial Institution
On August 29, 2013, the Company issued warrants to purchase 66,666 shares of TrueCar’s common stock at an exercise of $7.92 per share to a financial institution with which the Company had previous credit arrangements with. The warrants were issued pursuant to a warrant agreement that the Company had previously entered into in connection with the execution of a credit facility. The warrants were immediately issued and vested upon drawing on the credit facility and expire on the earlier of June 13, 2022, or an acquisition of the Company consisting solely of cash and or marketable securities.
In June 2014, warrants to purchase 66,666 shares of the Company’s common stock were exercised through a net settlement election. The Company issued 27,526 shares of its common stock to the financial institution.
Warrants Issued to Service Provider
In May 2014, the Company entered into a consulting agreement with an individual to provide marketing services to the Company. The Company agreed to issue a warrant to the individual to purchase up to 333,333 shares of the Company’s common stock at a price of $12.81 per share. All shares under the warrant agreement become exercisable in accordance with the vesting schedule over a four year period. The warrant expires five years from the issuance date or, if earlier, twelve months following the termination of the consulting agreement. In December 2015, the Company terminated the consulting agreement and the unvested warrants to purchase an aggregate of 187,500 shares of common stock were canceled. Upon termination, 145,833 of the warrants had vested and were outstanding at December 31, 2015. The warrant expired unexercised in December 2016.
For the year ended December 31, 2015, the Company recorded the fair value of the warrant based on the following assumptions using the Black-Scholes option-pricing model: contractual life of 1.0 to 4.0 years, risk free rate of 0.52% to 1.28%, and volatility of 44.1% to 48.9%. For the year ended December 31, 2014, the Company recorded the fair value of the warrant based on the following assumptions: contractual life of 4.4 to 5.0 years, risk free rate of 1.48% to 1.55%, and volatility of 54.8% to 56.8%.
For the year ended December 31, 2015, the Company recorded a reduction in warrant expense of $1.0 million due to the remeasurement to fair value of the unvested shares through the vesting date, which was primarily related to the reduction in the Company's stock price. The reduction in expense has been reflected as a reduction to sales and marketing expense on the accompanying consolidated statements of comprehensive loss. For the year ended December 31, 2015, warrants earned under this agreement totaled 112,500 shares. For the year ended December 31, 2014, the Company recognized expense of $1.7 million related to warrants to purchase 33,333 shares of common stock that have been earned and are vested.
Reserve for Unissued Shares of Common Stock
The Company is required to reserve and keep available out of its authorized but unissued shares of common stock such number of shares sufficient for the exercise of all outstanding warrants, plus shares granted and available for grant under the Company’s stock option plan.
The amount of such shares of the Company’s common stock reserved for these purposes at December 31, 2016 is as follows:
Number of Shares | ||
Outstanding stock options | 24,541,512 | |
Outstanding restricted stock units | 4,339,320 | |
Outstanding common stock warrants | 1,458,979 | |
Additional shares available for grant under equity plan | 3,254,115 | |
Total | 33,593,926 | |
F-31
8. Stock-based Awards
The Company has four equity incentive plans: the Amended and Restated 2005 Stock Plan (the “2005 Plan”), the 2008 Stock Plan (the “2008 Plan”), the 2014 Equity Incentive Plan (the “2014 Plan”), and the 2015 Inducement Equity Incentive Plan (the "Inducement Plan"). In connection with the Company’s IPO in May 2014, the 2005 Plan and the 2008 Plan were terminated. Upon the Company's IPO in May 2014, the shares reserved for issuance under the 2014 Plan include (i) shares that have been reserved but not issued pursuant to any awards granted under the 2005 Plan, plus (ii) shares subject to stock options or similar awards granted under the 2005 Plan or the 2008 Plan that, after the registration date, expire or terminate without having been exercised in full and shares issued pursuant to awards granted under the 2005 Plan or the 2008 Plan are forfeited to or repurchased by the Company. In addition, the shares available for issuance under the 2014 Plan include an annual increase on January 1 of each year equal to the least of: (i) 10,000,000 shares; (ii) 5% of the total outstanding shares of TrueCar common stock as of the last day of the previous fiscal year; or, (iii) such other amount as determined by the Company’s Board of Directors. As of December 31, 2016, the total number of shares available under the 2014 Plan is 3,254,115 shares. In accordance with the evergreen provision, effective January 1, 2017, an additional 4,307,976 shares of common stock was authorized to be issued under the 2014 Plan. Under the Inducement Plan, there were 1,840,000 shares of common stock reserved for the issuance of nonqualified stock options. In December 2015, in conjunction with the hiring of the Company's new president and CEO, the Company granted a stock option to purchase 1,840,000 shares of the Company's common stock under the Inducement Plan that vest over a four year period and expire ten years from the date of grant. There are no shares available for future issuance as of December 31, 2015 under the Inducement Plan.
Under the 2014 Plan, the Company has the ability to issue incentive stock options, nonstatutory stock options, restricted stock, restricted stock units, stock appreciation rights, performance units, and performance shares. Stock options granted under the 2014 Plan must at least equal to the fair market value of the Company’s common stock on the date of grant. Stock options granted generally vest monthly over a four year period and expire ten years from the date of grant. Restricted stock units generally vest quarterly over a four to five year period.
Stock Options
A summary of the Company’s stock option activity for the year ended December 31, 2016 is as follows:
Number of Options | Weighted-Average Exercise Price | Weighted-Average Remaining Contractual Life | Aggregate Intrinsic Value (1) | |||||||||
(in years) | (in millions) | |||||||||||
Outstanding at December 31, 2015 | 24,277,901 | $ | 8.12 | 5.62 | ||||||||
Granted | 4,812,332 | 9.56 | ||||||||||
Exercised | (1,911,723 | ) | 4.77 | |||||||||
Canceled/forfeited | (2,636,998 | ) | 11.54 | |||||||||
Outstanding at December 31, 2016 | 24,541,512 | $ | 8.29 | 5.49 | $ | 110.5 | ||||||
Vested and expected to vest at December 31, 2016 | 24,541,512 | $ | 8.29 | 5.49 | $ | 110.5 | ||||||
Exercisable at December 31, 2016 | 16,700,882 | $ | 7.56 | 3.94 | $ | 86.8 | ||||||
(1) | The aggregate intrinsic value represents the excess of the closing price of the Company's common stock of $12.50 on December 31, 2016 over the exercise price of in-the-money stock option awards. |
At December 31, 2016, total remaining stock-based compensation expense for unvested option awards, including performance-based stock option awards, was $33.1 million, which is expected to be recognized over a weighted-average period of 3.0 years.
F-32
The weighted-average grant-date fair value per share of options granted for the years ended December 31, 2016, 2015 and 2014 was $4.50, $4.76 and $6.32, respectively. The Company recorded stock-based compensation expense for stock option awards of $14.8 million, $34.0 million and $27.2 million, for the years ended December 31, 2016, 2015 and 2014, respectively.
The total intrinsic value of options exercised in 2016, 2015 and 2014 was $8.5 million, $19.2 million, and $57.1 million, respectively.
From time to time, the Company grants stock options that contain performance conditions. During 2014, the Company granted 2,776,114 stock options at a weighted average exercise price of $12.81, which include a two step performance and service vesting condition. The first step is based upon achieving certain revenue and earnings targets. Stock options eligible for time-based vesting are calculated based on the Company's performance against these metrics and vest over 48 months beginning February 1, 2015. Based on the achievement levels of the performance criteria, as of December 31, 2014, there were 2,241,796 outstanding stock options with a weighted average exercise price of $12.81 that were eligible for vesting over the requisite service period. Stock options granted in excess of the achievement level totaling 288,406 shares were forfeited and returned to the 2014 Plan in the first quarter of 2015.
The grant date fair values of these awards for the year ended December 31, 2014 was $20.1 million as determined using a Black-Scholes option-pricing model. The Company recognizes compensation cost for stock options with performance conditions using a graded vesting model, based on the probability of the performance condition being met, net of actual pre-vesting forfeitures.
Restricted Stock Units
Activity in connection with restricted stock units (“RSUs”) is as follows for the year ended December 31, 2016:
Number of Shares | Weighted-Average Grant Date Fair Value | |||||
Non-vested — December 31, 2015 | 3,747,340 | $ | 8.18 | |||
Granted | 2,711,392 | 7.37 | ||||
Vested | (1,370,672 | ) | 8.06 | |||
Canceled/forfeited | (748,740 | ) | 7.38 | |||
Non-vested — December 31, 2016 | 4,339,320 | $ | 7.85 | |||
The total fair market value of restricted stock units that vested for the years ended December 31, 2016, 2015, 2014 was $11.8 million, $6.5 million, and $0.3 million, respectively.
The weighted-average grant-date fair value of RSUs granted for the years ended December 31, 2016, 2015, and 2014 was $7.37, $8.17, and $12.35, respectively. For the years ended December 31, 2016, 2015, and 2014, the Company recorded $9.9 million, $8.6 million, and $2.0 million in compensation expense, respectively. At December 31, 2016, total remaining stock-based compensation expense for non-vested RSUs is $30.7 million, which is expected to be recognized over a weighted-average period of 3.0 years.
During 2014, the Company granted 720,146 RSUs with a weighted average grant date fair value of $10.04, which include a two-step performance and service vesting condition. The first step is based upon achieving certain revenue and earnings targets. RSUs eligible for time-based vesting are calculated based on the Company’s performance against these metrics and vest over 16 quarters beginning January 1, 2015. Based on the achievement levels of the performance criteria, as of December 31, 2014, there were 583,537 non-vested RSUs with a weighted average grant date fair value of $10.07 that were eligible to vest over the requisite service period. RSUs granted in excess of the achievement level totaling 73,939 shares were forfeited and returned to the 2014 Plan in the first quarter of 2015.
Modifications
In November 2015, the Compensation Committee of the Board of Directors authorized the modification of equity awards in connection with the separation of the Company's former CEO. In accordance with the terms of the separation agreement, the Company
F-33
paid $0.1 million for the surrender and cancellation of options the former CEO holds to purchase 1,333,332 shares of the Company’s common stock with a weighted-average exercise price of $45.00. Additionally, under a limited advisory services arrangement, the former CEO will also continue to vest in his remaining options, covering 1,401,553 shares, and 154,088 remaining restricted stock units until May 2018. Although these awards continue to vest, no substantive additional service is required by the former CEO. As a result of this modification, the Company recognized $7.7 million in additional stock-based compensation expense for the year ended December 31, 2015.
In the fourth quarter of 2015, the Company accelerated the vesting of stock options to purchase 337,111 shares of common stock and 48,113 RSUs to four former executives. Additionally, the Company extended the exercise period of all vested stock options to these former executives. As a result of these modifications, the Company recognized additional stock compensation expense of $3.0 million for the year ended December 31, 2015.
In December 2015, the Company's former President and current member of its Board of Directors agreed to surrender and forfeit unvested options to purchase 309,722 shares of the Company's common stock with a weighted-average exercise price of $13.17. The Company's former President will continue to vest in his remaining unvested options covering 252,431 shares and 57,679 remaining RSUs, subject to his continued service as a member of the Company's Board of Directors. As a result of this forfeiture, the Company recognized additional stock compensation expense of $2.1 million for the year ended December 31, 2015.
Valuation Assumptions and Stock-based Compensation Cost
The fair value of stock options granted to employees is estimated on the grant date using the Black-Scholes option-pricing model. This valuation model requires the Company to make assumptions and judgments about the variables used in the calculation, including the expected term, the volatility of the Company’s common stock, risk-free interest rate, and expected dividends. The Company uses the simplified method under the SEC’s Staff Accounting Bulletin No. 107, Share-Based Payment, to calculate expected term for plain vanilla share options. For performance-based option awards and out of the money option grants, the Company determines the expected term based upon historical exercise and post-vesting cancellations, adjusted for expected future exercise behavior. The Company’s computation of volatility is based on an average of the historical volatilities of the common stock of several entities with characteristics similar to those of the Company. The risk-free interest rate is based on the U.S. Treasury yield curve in effect at the time of grant for periods corresponding with the expected life of the option. The Company uses an expected dividend of zero, as it does not anticipate paying any dividends in the foreseeable future.
The fair value of each stock option award was estimated at the date of grant using a Black-Scholes option-pricing model with the following weighted-average assumptions:
Year Ended December 31, | ||||||||
2016 | 2015 | 2014 | ||||||
Risk-free interest rate | 1.32 | % | 1.66 | % | 1.93 | % | ||
Expected term (years) | 5.96 | 6.03 | 6.24 | |||||
Expected volatility | 49 | % | 49 | % | 58 | % | ||
Dividend yield | — | — | — | |||||
As a result of the Company's early adoption of the revised share-based payment guidance in 2016, forfeitures are recognized as they occur. Prior to the adoption of this guidance, forfeitures were estimated at the time of grant and revised, if necessary, in subsequent periods if actual forfeitures differ from those estimates.
F-34
The Company recorded stock-based compensation cost relating to stock options, restricted stock awards, and RSUs in the following categories on the accompanying consolidated statements of comprehensive loss (in thousands):
Year Ended December 31, | |||||||||||
2016 | 2015 | 2014 | |||||||||
Cost of revenue | $ | 960 | $ | 792 | $ | 454 | |||||
Sales and marketing | 5,837 | 4,493 | 4,743 | ||||||||
Technology and development | 4,398 | 4,294 | 5,013 | ||||||||
General and administrative | 13,544 | 32,984 | 19,123 | ||||||||
Total stock-based compensation expense | 24,739 | 42,563 | 29,333 | ||||||||
Amount capitalized to internal-use software | 1,012 | 1,325 | 1,249 | ||||||||
Total stock-based compensation cost | $ | 25,751 | $ | 43,888 | $ | 30,582 | |||||
F-35
9. Income Taxes
The components of the Company’s income tax provision are as follows (in thousands):
Year Ended December 31, | |||||||||||
2016 | 2015 | 2014 | |||||||||
Current: | |||||||||||
Federal | $ | — | $ | — | $ | — | |||||
State | 74 | 25 | 63 | ||||||||
Total current provision | 74 | 25 | 63 | ||||||||
Deferred: | |||||||||||
Federal | 547 | 547 | 540 | ||||||||
State | 34 | 34 | 37 | ||||||||
Total deferred provision | 581 | 581 | 577 | ||||||||
Total income tax provision | $ | 655 | $ | 606 | $ | 640 | |||||
As described below, the Company has established a valuation allowance against its net deferred tax assets as the Company has determined that it is more likely than not that the deferred tax assets will not be realized. The Company’s 2016, 2015, and 2014 income tax provisions of $0.7 million, $0.6 million, and $0.6 million, respectively, primarily reflect the amortization of tax deductible goodwill that is not an available source of income to realize deferred tax assets.
The overall effective income tax rate differs from the statutory federal rate of 34% as follows:
Year Ended December 31, | ||||||||
2016 | 2015 | 2014 | ||||||
Income tax benefit based on the federal statutory rate | 34.0 | % | 34.0 | % | 34.0 | % | ||
State income taxes, net of federal benefit | 3.2 | 2.4 | 2.0 | |||||
Nondeductible expenses | (1.7 | ) | (0.3 | ) | (0.7 | ) | ||
Change in valuation allowance | (33.0 | ) | (30.7 | ) | (34.7 | ) | ||
Stock-based compensation | (4.1 | ) | (6.4 | ) | (2.0 | ) | ||
Other | — | 0.1 | 0.1 | |||||
Overall effective income tax rate | (1.6 | )% | (0.9 | )% | (1.3 | )% | ||
F-36
The components of deferred tax assets (liabilities) are as follows (in thousands):
December 31, | |||||||
2016 | 2015 | ||||||
Deferred income tax assets: | |||||||
Net operating loss carryforwards | $ | 95,342 | $ | 66,340 | |||
Stock-based compensation | 25,278 | 24,192 | |||||
Accrued expenses | 3,338 | 4,016 | |||||
Research and development tax credits | 543 | 543 | |||||
Other | 371 | 306 | |||||
Gross deferred tax assets | 124,872 | 95,397 | |||||
Valuation allowance | (115,689 | ) | (84,167 | ) | |||
Net deferred tax assets | 9,183 | 11,230 | |||||
Deferred tax liabilities: | |||||||
Property, equipment and software | (5,424 | ) | (6,734 | ) | |||
Intangible assets and goodwill | (6,753 | ) | (6,909 | ) | |||
Gross deferred tax liabilities | (12,177 | ) | (13,643 | ) | |||
Total net deferred tax liabilities | $ | (2,994 | ) | $ | (2,413 | ) | |
The federal benefit related to the state tax effect of each type of temporary difference and carryforward is presented within each component of deferred tax assets and liabilities as shown in the chart above as of December 31, 2016 and December 31, 2015, respectively. This is a change in presentation from the prior year income tax footnote as the federal benefit related to the state tax effect of each type of temporary difference and carryforward was presented within one component titled “State taxes”.
The net deferred tax liability at December 31, 2016 and 2015 relates to amortization of tax deductible goodwill that is not an available source of income to realize deferred tax assets. Accordingly, the net deferred tax liability does not reduce the need for a valuation allowance related to the Company’s net deferred tax assets.
At December 31, 2016, the Company had federal and state net operating loss carryforwards of $250.2 million and $176.5 million, respectively. The Company’s federal and state net operating loss carryforwards begin to expire in the years ending December 31, 2025 and 2017, respectively. At December 31, 2016, the Company had federal and state research and development tax credit carryforwards of approximately $0.8 million and $0.4 million, respectively. The federal tax credit carryforwards begin to expire in the year ending December 31, 2028. The state tax credit carryforward can be carried forward indefinitely.
The Internal Revenue Code of 1986, as amended, imposes substantial restrictions on the utilization of net operating losses and other tax attributes in the event of an “ownership change” of a corporation. Accordingly, a company’s ability to use pre-change net operating loss and research tax credits may be limited as prescribed under IRC Sections 382 and 383. Events which may cause limitation in the amount of the net operating losses and credits that the Company utilizes in any one year include, but are not limited to, a cumulative ownership change of more than 50% over a three-year period. As a result of historical equity issuances, the Company has determined that annual limitations on the utilization of its net operating losses and credits do exist pursuant to IRC Sections 382 and 383, however, such limitations are not expected to impact the Company’s ability to utilize these deferred tax assets prior to their statutory expiration dates.
Management assesses the available positive and negative evidence to estimate if sufficient future taxable income will be generated to use the existing deferred tax assets. A significant piece of objective negative evidence evaluated was the cumulative loss incurred over the three-year period ended December 31, 2016. Such objective evidence limits the ability to consider other subjective evidence such as its projections for future growth. On the basis of this evaluation, at December 31, 2016, a valuation allowance of $115.7 million has been recorded since it is more likely than not that the deferred tax assets will not be realized.
F-37
The change in the valuation allowance for the years ended December 31, 2016, 2015, and 2014 is as follows (in thousands):
Year Ended December 31, | |||||||||||
2016 | 2015 | 2014 | |||||||||
Valuation allowance, at beginning of year | $ | 84,167 | $ | 64,449 | $ | 47,858 | |||||
Increase in valuation allowance- share-based compensation guidance impact | 17,959 | — | — | ||||||||
Valuation allowance, at beginning of year, as adjusted | $ | 102,126 | $ | 64,449 | $ | 47,858 | |||||
Increase in valuation allowance | 13,563 | 19,718 | 16,591 | ||||||||
Valuation allowance, at end of year | $ | 115,689 | $ | 84,167 | $ | 64,449 | |||||
As described in Note 2, the Company early adopted the new share-based compensation guidance during the third quarter of 2016. The adoption of this guidance had no impact on either accumulated deficit as of January 1, 2016 or 2016 income tax expense as the Company believes that it is more likely than not that the excess tax benefits recognized as deferred tax assets due to the adoption of this guidance will not be realized. Therefore the Company has recorded a full valuation allowance against these excess tax benefits.
The following is a reconciliation of the total amounts of unrecognized tax benefits (in thousands):
Year Ended December 31, | |||||||||||
2016 | 2015 | 2014 | |||||||||
Unrecognized tax benefit, beginning of year | $ | 3 | $ | 46 | $ | (4 | ) | ||||
Additions based on current year tax positions | — | — | 21 | ||||||||
Additions for prior years' tax positions | — | — | 29 | ||||||||
Settlements with tax authorities | — | (13 | ) | — | |||||||
Reductions for prior years' tax positions | — | (30 | ) | — | |||||||
Unrecognized tax benefit, end of year | $ | 3 | $ | 3 | $ | 46 | |||||
Since there is a full valuation allowance recorded against the deferred tax assets, any subsequent reductions of the valuation allowance and recognition of the associated tax benefit would impact the effective tax rate.
The Company’s policy is to recognize interest and penalties related to uncertain tax positions, if any, in the income tax provision. At December 31, 2016, accrued interest and penalties related to uncertain tax positions were insignificant. The Company does not anticipate that the amount of unrecognized tax benefits will significantly increase or decrease within the next 12 months.
The Company is subject to United States federal and state taxation. Due to the presence of net operating loss carryforwards, all income tax years remain open for examination by the Internal Revenue Service (“IRS”) and various state taxing authorities. The Company is currently under state tax examination for the 2013 and 2014 tax years. The Company does not anticipate that this pending tax examination will result in a material tax assessment.
F-38
10. Net Loss Per Share
The Company applies the two-class method for calculating basic earnings per share. Under the two-class method, net income (loss) is reduced by cumulative preferred stock dividends and the residual amount is allocated between common stock and other participating securities based on their participation rights. Participating securities comprised of restricted common stock, which participate in dividends, if declared, by the Company. As the Company has reported a net loss for all periods, and the participating securities were not contractually obligated to share in the losses of the Company, accordingly, no losses were allocated to the participating securities.
Basic earnings per share is calculated by dividing net income (loss) attributable to common stockholders by the weighted average number of shares of common stock outstanding, net of the weighted average unvested restricted stock subject to repurchase by the Company, if any, during the period. Diluted earnings per share is calculated by dividing the net income (loss) attributable to common stockholders by the weighted average number of common shares outstanding, adjusted for the effects of potentially dilutive common stock, which are comprised of stock options, restricted stock units and stock warrants, using the treasury-stock method, and convertible preferred stock, using the if-converted method. Because the Company reported losses attributable to common stockholders for all periods presented, all potentially dilutive common stock are antidilutive for those periods.
The following table sets forth the computation of basic and diluted net loss per share attributable to common stockholders during the years ended December 31, 2016, 2015 and 2014 (in thousands, except per share data):
Year Ended December 31, | |||||||||||
2016 | 2015 | 2014 | |||||||||
Net loss | $ | (41,708 | ) | $ | (64,911 | ) | $ | (48,429 | ) | ||
Weighted-average common shares outstanding | 84,483 | 81,914 | 70,837 | ||||||||
Net loss per share — basic and diluted | $ | (0.49 | ) | $ | (0.79 | ) | $ | (0.68 | ) | ||
The following table presents the number of anti-dilutive shares excluded from the calculation of diluted net loss per share attributable to common stockholders at December 31, 2016, 2015 and 2014 (in thousands):
December 31, | ||||||||
2016 | 2015 | 2014 | ||||||
Options to purchase common stock | 24,542 | 24,278 | 25,590 | |||||
Common stock warrants | 1,459 | 1,631 | 3,926 | |||||
Unvested restricted stock awards | 4,339 | 3,747 | 828 | |||||
Total shares excluded from net loss per share attributable to common stockholders | 30,340 | 29,656 | 30,344 | |||||
11. Employee Benefit Plan
The Company has a 401(k) Savings Retirement Plan that covers substantially all full-time employees who meet the plan’s eligibility requirements and provides for an employee elective contribution. The Company made matching contributions to the plan of $2.1 million, $1.7 million and $1.2 million for the years ended December 31, 2016, 2015, and 2014, respectively.
F-39
12. Related Party Transactions
Transactions with Stockholders
In October 2011, as part of the acquisition of ALG, the Company entered into various data licensing and transition services agreements with Dealertrack, a former significant stockholder of the Company. In the first quarter of 2014, Dealertrack divested its holdings in the Company and was no longer a related party. Costs under these agreements included in cost of revenue were $0.4 million for the year ended December 31, 2014.
Service Provider
From October 2013 to October 2015, an executive officer of the Company was an officer of a firm that provided marketing services to the Company. For the years ended December 31, 2015 and 2014, the Company recorded sales and marketing expense of $6.8 million and $4.2 million, respectively, for expenses paid to this marketing firm.
Transactions with USAA
USAA is the largest stockholder and most significant affinity marketing partner of the Company. The Company has entered into arrangements with USAA to operate its Auto Buying Program. The Company has amounts due from USAA at December 31, 2016 and 2015 of $0.4 million and $0.3 million, respectively. In addition, the Company has amounts due to USAA at December 31, 2016 and 2015 of $3.9 million and $7.8 million, respectively. At December 31, 2016 and 2015 $2.9 million and $7.5 million was included in accounts payable, respectively, while $1.0 million and $0.3 million was included in accrued expenses and other current liabilities, respectively. The Company recorded sales and marketing expense of $13.9 million, $14.0 million, and $15.2 million for the years ended December 31, 2016, 2015 and 2014, respectively, related to service arrangements entered into with USAA, including non-cash expense associated with warrants to purchase shares of common stock (Note 7).
13. Revenue Information
The CODM reviews financial information on a consolidated basis, accompanied by information about transaction revenue and forecasts, consulting and other revenue. The following table presents the Company's revenue categories during the periods presented (in thousands):
Year Ended December 31, | |||||||||||
2016 | 2015 | 2014 | |||||||||
Transaction revenue | $ | 259,516 | $ | 241,395 | $ | 189,353 | |||||
Forecasts, consulting and other revenue | 17,991 | 18,443 | 17,296 | ||||||||
Total revenues | $ | 277,507 | $ | 259,838 | $ | 206,649 | |||||
F-40