Attached files
| file | filename |
|---|---|
| 8-K - 8-K - TIER REIT INC | form8-k11132017.htm |

COMPANY
PRESENTATION
NOVEMBER 2017
Exhibit 99.1

High-quality portfolio
Proven execution
Flexible balance sheet
Significant value creation opportunities
Experienced management team
WHY
TIER?
Focused strategy
Austin I Dallas I Houston I Charlotte I Nashville I Atlanta I Denver

3
Domain 8
FOCUSED
STRATEGY
Delivered 2017
4
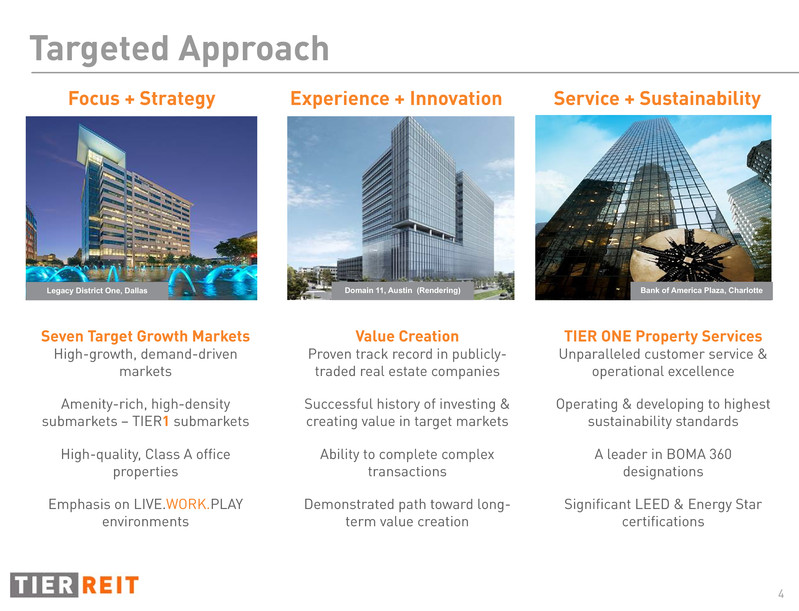
Service + Sustainability
Value Creation
Proven track record in publicly-
traded real estate companies
Successful history of investing &
creating value in target markets
Ability to complete complex
transactions
Demonstrated path toward long-
term value creation
Seven Target Growth Markets
High-growth, demand-driven
markets
Amenity-rich, high-density
submarkets – TIER1 submarkets
High-quality, Class A office
properties
Emphasis on LIVE.WORK.PLAY
environments
TIER ONE Property Services
Unparalleled customer service &
operational excellence
Operating & developing to highest
sustainability standards
A leader in BOMA 360
designations
Significant LEED & Energy Star
certifications
Focus + Strategy
Legacy District One, Dallas
Experience + Innovation
Domain 11, Austin (Rendering) Bank of America Plaza, Charlotte
Targeted Approach

5
Seven Target Growth Markets
TIER REIT targets high-growth, demand-driven TIER1 submarkets that
will benefit most from population and office-using employment growth
Denver
Houston
Austin
Atlanta
Nashville
Dallas
Charlotte
CBD
The Domain
Southwest
Westchase
The Galleria
Katy Freeway West
Uptown
SouthPark
Preston Center
Plano Legacy
Uptown Current market location
Midtown
Buckhead
CBD / LoDo
Platte River
Cherry Creek
CBD
West End
The Gulch
Target growth market

6
PROVEN
EXECUTION
Rendering
The Domain

7
Domain 8
Development Results
Domain 11 (Rendering)
Aggregate
Value Creation:
$107mm to $131mm1
Third + Shoal (Rendering)
Creating ~$2.22 to $2.75/share of incremental value with minimal lease-up risk,
driving long-term cash flow growth1
1 Includes estimated value creation of Domain 8, Domain 11 and Third + Shoal using estimated stabilized NOI, assuming a 5.5%-6.0% exit capitalization
rate less actual or budgeted development costs, at ownership share for Third + Shoal and Domain 8
2 At ownership share
2017 2018 2019DeliveryTimeline
Domain 8
(Delivered)
Domain 11Third
+
Shoal
NA
V +
Dividen
d
Developments >90% pre-leased2 & delivering at ~9%+ stabilized yields

8
The Domain
Austin, Texas
Domain 8 (Delivered 2017)
Domain 8 Domain 8
Quick Facts
291K SF with 12 stories
Pedestal parking 3.7/1,000
Completed 2Q'17
Walk to Whole Foods, Rock Rose
entertainment district, Domain
NORTHSIDE Shops
d
8
Primary Tenants
100%
Leased
9
The Domain
Austin, Texas
d
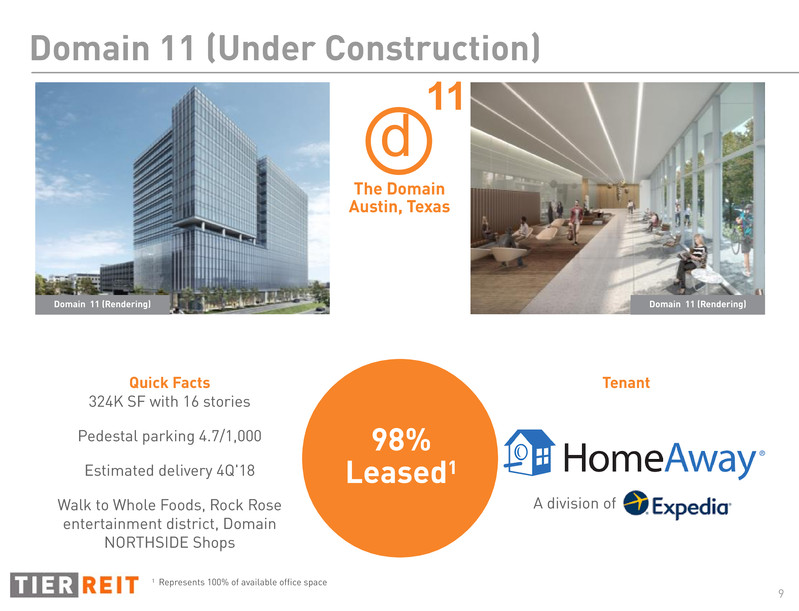
Domain 11 (Under Construction)
Domain 11 (Rendering)
Quick Facts
324K SF with 16 stories
Pedestal parking 4.7/1,000
Estimated delivery 4Q'18
Walk to Whole Foods, Rock Rose
entertainment district, Domain
NORTHSIDE Shops
11
Domain 11 (Rendering)
Tenant
A division of
98%
Leased1
1 Represents 100% of available office space

10
CBD
Austin, Texas
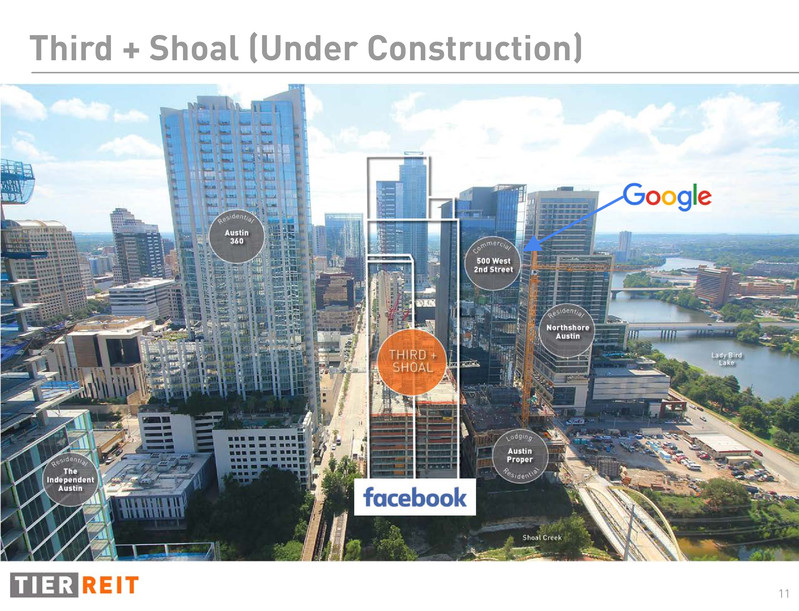
Third + Shoal (Under Construction)
Third + Shoal (Rendering) Third + Shoal (Rendering)
Quick Facts
345K SF with 29 stories
Pedestal parking 2.5/1,000
Estimated delivery 3Q'18
Located in the heart of CBD’s
"New Downtown"
Tenant
67%
Leased
11
Third + Shoal (Under Construction)

12
HIGH-QUALITY
PORTFOLIO
Legacy District One
Acquired 2017

13
Over 90% of NOI derived from high-growth,
demand-driven target markets
High-Quality Portfolio
Additional Quality Indicators1
Including in-process development,
>25% of portfolio SF will be recently
constructed2
Enviable roster of investment-
grade tenants
Weighted average lease life
approaching 7 years
Domain 7 Bank of America Plaza
1 September 30, 2017 operating portfolio pro forma for in-process development (at ownership share) and targeted reduction of Houston presence through
planned dispositions of Loop Central and Eldridge Place anticipated by YE'18
2 Recently constructed includes properties delivered since 2012
Austin
20%
Dallas
26%
Houston
13%
Charlotte
14%
Nashville
6%
SF by
Market1
Austin
Development
10%

14
Domain 11 & 12
Rendering
SIGNIFICANT VALUE
CREATION OPPORTUNITIES

15
Domain 12 (Rendering)
Creating Value: Future Development
Domain 12, Austin, TX
~320K net rentable SF
Legacy District, Plano, TX
~570K net rentable SF in two phases
1 Development potential incremental value calculated using estimated stabilized NOI from above developments, assuming a 5.5%-6.0% exit capitalization
rate less estimated development costs
Legacy District (Rendering)
Potential
value creation:
$249mm to $324mm1
Domain 9, 10, D & G, Austin, TX
~660K net rentable SF in three phases
Opportunity to create ~$5.17 to $6.75/share of incremental value through future development1
Domain 9 (Rendering)
NA
V +
Dividen
d
Approximate 8.5%+ yield on future development opportunities
16
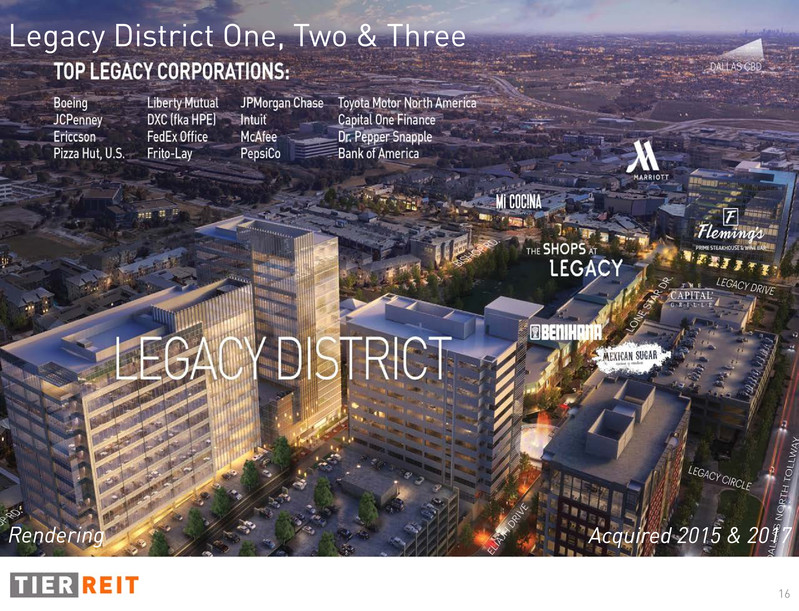
Legacy District One, Two & Three
Acquired 2015 & 2017Rendering

17
Mark-to-Market Rents
Creating Value: Leasing
Stabilize Occupancy at 93%
In-place rents 22%-24% below market
for tenants expiring through 2019
Opportunity to lease up to 325K SF
of vacant space
1 Mark-to-market potential incremental value calculated using incremental estimated NOI from re-leasing SF expiring through 2019 at Bank of America
Plaza and The Terrace at current market rates and a 6.0%-7.0% NOI exit capitalization rate less $50/SF estimated leasing capital
2 Stabilize occupancy potential incremental value calculated using estimated NOI generated from increasing occupancy of Two BriarLake Plaza, Eldridge
Place, and Burnett Plaza at 90% NOI margins of current market rates and a 6.0%-7.0% NOI exit capitalization rate less $50/SF estimated leasing capital
Bank of America Plaza BriarLake Plaza
Potential
incremental
value creation:
$146mm to $175mm1,2
NA
V +
Dividen
d

18
FLEXIBLE
BALANCE
SHEET
Third + Shoal
Expected Delivery 3Q'18Rendering

19
350
300
250
200
150
100
50
0
2018 2019 2020 2021 Thereafter
$43 $78 $66
$300
$275
1 Data shown as of 9.30.17 pro forma for the pending disposition of Fifth Third Columbus
2 Estimated equity value is based on common stock, restricted stock, and restricted stock units outstanding multiplied by consensus NAV of $22.78 per share
3 EBITDA and NOI reflect annualized 3Q'14 and 3Q'17 normalized EBITDA and GAAP NOI for properties owned at period end
Capital Structure1
Debt Maturities ($mm)
Total net liquidity of $256mm
$23
Mortgage debt
Unsecured bank debt
Mortgage Debt $ 187
Unsecured term loan 575
Unsecured revolver 23
Cash (13)
Total net debt $ 772
Estimated equity value2 1,095
Total est. enterprise value $ 1,867
Capital structure ($mm)
Total estimated
enterprise
value:
$1,867
Credit statistics 9.30.14 9.30.17
Long-
Term
Target
Net debt / annualized adj. EBITDA3 9.6x 7.5x <6.5x
Net debt / total est. ent. value 53% 43% <40%
Mortgage debt / total est. ent. value 53% 10% <20%
Fixed charge coverage 1.5x 3.1x >3.0x
Unencumbered NOI / total NOI3 3% 81% >65%
Credit Statistics
41%
59%

20
EXPERIENCED
MANAGEMENT TEAM
5950 Sherry Lane
Acquired 2014

21
Experienced Management Team
Significant real estate & public company experience spanning 30+ years
Jim Sharp
EVP
Capital Markets
Bill Reister
EVP & Chief
Investment Officer
Heath Johnson
Managing Director
Asset Management
Dallas Lucas
EVP & Chief
Financial Officer
Scott Fordham
President & Chief
Executive Officer
Scott McLaughlin
Senior Vice President
Investor Relations
Our team is 100% committed to optimizing the value of TIER’s common stock
through execution of our strategic plan or pursuing other strategic alternatives,
including public or private execution

22
ADDITIONAL
INFORMATION
BriarLake Plaza
Phase II delivered 2014
23
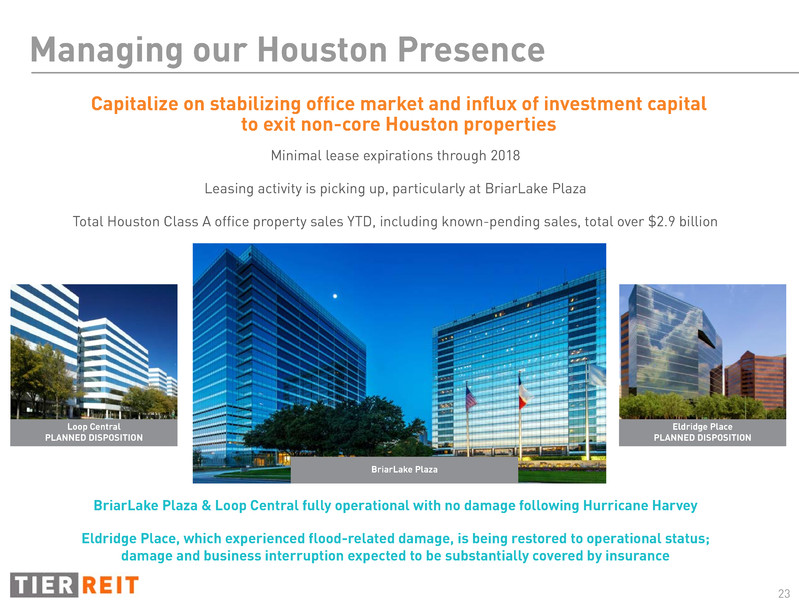
Managing our Houston Presence
Capitalize on stabilizing office market and influx of investment capital
to exit non-core Houston properties
Loop Central
PLANNED DISPOSITION
Eldridge Place
PLANNED DISPOSITION
BriarLake Plaza
Minimal lease expirations through 2018
Leasing activity is picking up, particularly at BriarLake Plaza
Total Houston Class A office property sales YTD, including known-pending sales, total over $2.9 billion
BriarLake Plaza & Loop Central fully operational with no damage following Hurricane Harvey
Eldridge Place, which experienced flood-related damage, is being restored to operational status;
damage and business interruption expected to be substantially covered by insurance

24
Top-tier market with a highly educated workforce
combined with pro-business government policy
8.9% Class A vacancy, down from 9.6% in prior year
YoY: 11.2% Class A rent growth / 1.4mm SF net absorption
3Q’17: 1.3% Class A rent growth / 0.3mm SF net absorption
2.3mm SF under construction, ~47% pre-leased
Five-year forecast of 1.6% avg. annual rent growth
Austin
The Domain
The Terrace
Third + Shoal
The Terrace Third+Shoal (Rendering) Domain 7
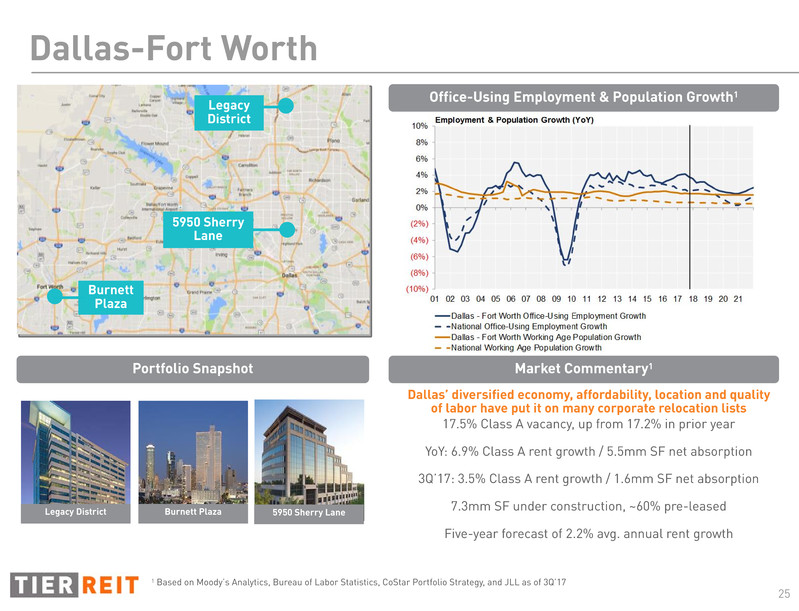
Office-Using Employment & Population Growth1
Portfolio Snapshot Market Commentary1
1 Based on Moody’s Analytics, Bureau of Labor Statistics, CoStar Portfolio Strategy, and JLL as of 3Q’17
25
Dallas’ diversified economy, affordability, location and quality
of labor have put it on many corporate relocation lists
17.5% Class A vacancy, up from 17.2% in prior year
YoY: 6.9% Class A rent growth / 5.5mm SF net absorption
3Q’17: 3.5% Class A rent growth / 1.6mm SF net absorption
7.3mm SF under construction, ~60% pre-leased
Five-year forecast of 2.2% avg. annual rent growth
Dallas-Fort Worth
Burnett Plaza 5950 Sherry LaneLegacy District
5950 Sherry
Lane
Burnett
Plaza
Legacy
District
1 Based on Moody’s Analytics, Bureau of Labor Statistics, CoStar Portfolio Strategy, and JLL as of 3Q’17
Office-Using Employment & Population Growth1
Portfolio Snapshot Market Commentary1
26
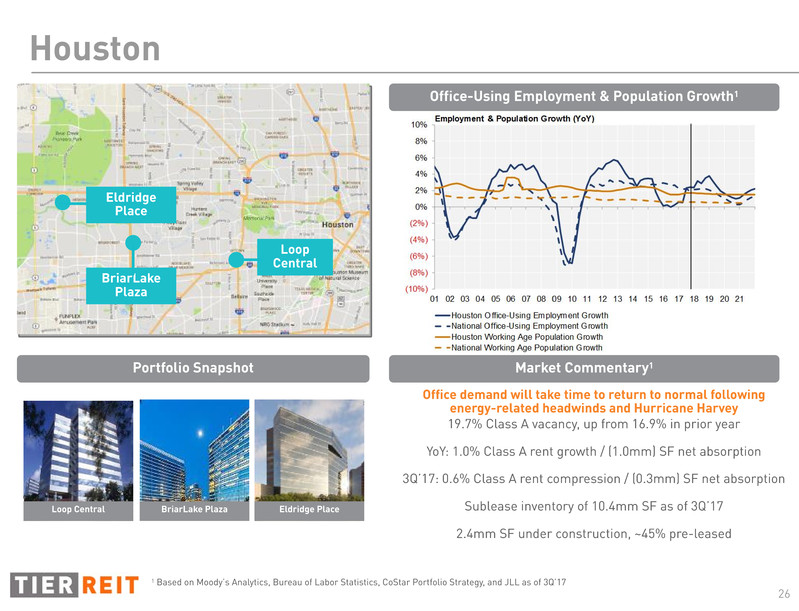
Houston
Office demand will take time to return to normal following
energy-related headwinds and Hurricane Harvey
19.7% Class A vacancy, up from 16.9% in prior year
YoY: 1.0% Class A rent growth / (1.0mm) SF net absorption
3Q’17: 0.6% Class A rent compression / (0.3mm) SF net absorption
Sublease inventory of 10.4mm SF as of 3Q’17
2.4mm SF under construction, ~45% pre-leased
BriarLake
Plaza
Loop
Central
Eldridge
Place
BriarLake PlazaLoop Central Eldridge Place
Office-Using Employment & Population Growth1
Portfolio Snapshot Market Commentary1
1 Based on Moody’s Analytics, Bureau of Labor Statistics, CoStar Portfolio Strategy, and JLL as of 3Q’17
27
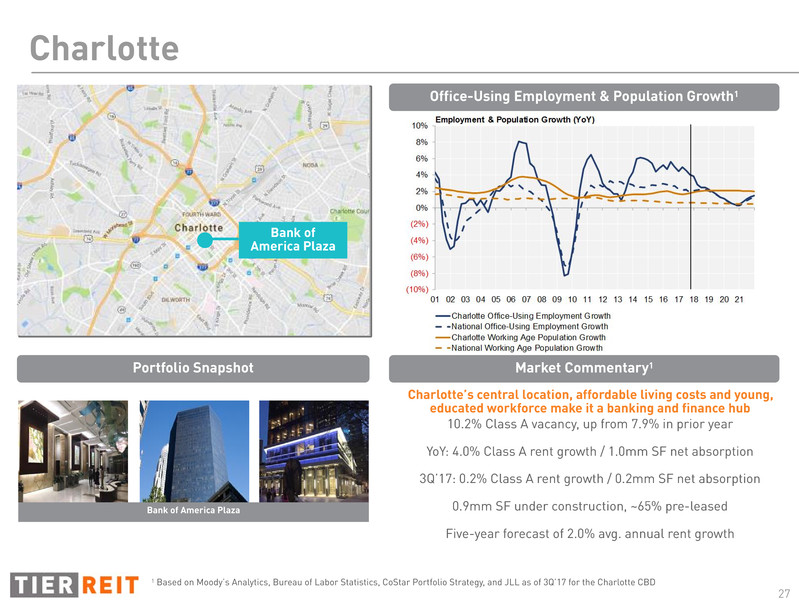
Charlotte’s central location, affordable living costs and young,
educated workforce make it a banking and finance hub
10.2% Class A vacancy, up from 7.9% in prior year
YoY: 4.0% Class A rent growth / 1.0mm SF net absorption
3Q’17: 0.2% Class A rent growth / 0.2mm SF net absorption
0.9mm SF under construction, ~65% pre-leased
Five-year forecast of 2.0% avg. annual rent growth
Charlotte
Bank of
America Plaza
Office-Using Employment & Population Growth1
Portfolio Snapshot Market Commentary1
1 Based on Moody’s Analytics, Bureau of Labor Statistics, CoStar Portfolio Strategy, and JLL as of 3Q’17 for the Charlotte CBD
Bank of America Plaza
28
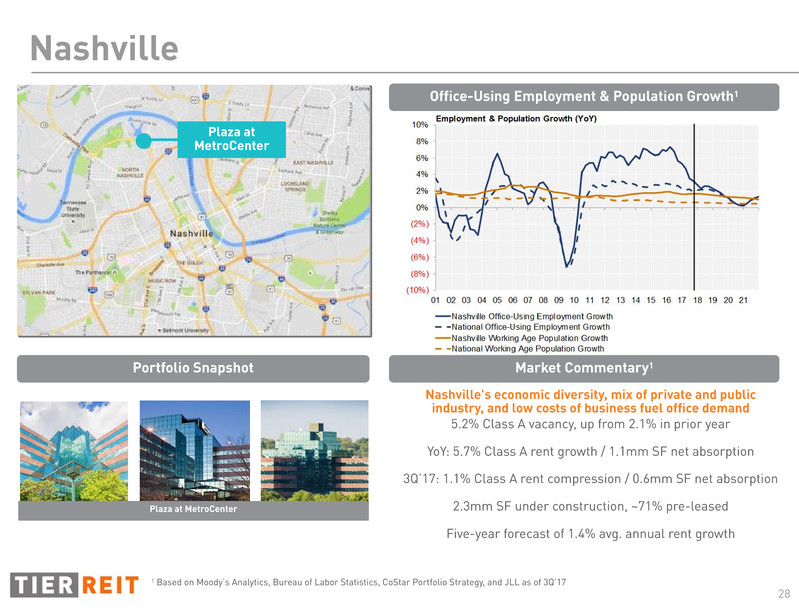
Nashville
Office-Using Employment & Population Growth1
Nashville's economic diversity, mix of private and public
industry, and low costs of business fuel office demand
5.2% Class A vacancy, up from 2.1% in prior year
YoY: 5.7% Class A rent growth / 1.1mm SF net absorption
3Q’17: 1.1% Class A rent compression / 0.6mm SF net absorption
2.3mm SF under construction, ~71% pre-leased
Five-year forecast of 1.4% avg. annual rent growth
Plaza at
MetroCenter
Portfolio Snapshot Market Commentary1
1 Based on Moody’s Analytics, Bureau of Labor Statistics, CoStar Portfolio Strategy, and JLL as of 3Q’17
Plaza at MetroCenter

29
Forward-Looking Statements
This presentation contains forward-looking statements, including discussion and analysis of the financial condition of us and our subsidiaries and other
matters. These forward-looking statements are not historical facts but are the intent, belief or current expectations of our management based on their
knowledge and understanding of our business and industry. Words such as “may,” “will”, “anticipates,” “expects,” “intends,” “plans,” “believes,”
“seeks,” “estimates,” “would,” “could,” “should,” “opportunities,” “objectives,” “strategies,” “goals,” “vision,” “mission,” and variations of these words
and similar expressions are intended to identify forward-looking statements. We intend that such forward-looking statements be subject to the safe
harbor provisions created by Section 27A of the Securities Act of 1933 and Section 21E of the Securities Exchange Act of 1934. These statements are not
guarantees of future performance and are subject to risks, uncertainties and other factors, some of which are beyond our control, are difficult to predict
and could cause actual results to differ materially from those expressed or forecasted in the forward-looking statements. Forward-looking statements
that were true at the time made may ultimately prove to be incorrect or false. We caution you not to place undue reliance on forward-looking
statements, which reflect our management's view only as of the date of this presentation. We undertake no obligation to update or revise forward-
looking statements to reflect changed assumptions, the occurrence of unanticipated events or changes to future operating results.
Factors that could cause actual results to differ materially from any forward-looking statements made in the presentation include but are not limited to:
(i) market disruptions and economic conditions experienced by the economy or real estate industry as a whole and the local economic conditions in the
markets in which our properties are located; (ii) our ability to renew expiring leases and lease vacant spaces at favorable rates or at all; (iii) the inability
of tenants to continue paying their rent obligations due to bankruptcy, insolvency or a general downturn in their business; (iv) the availability of cash
flow from operating activities to fund distributions and capital expenditures; (v) our ability to raise capital in the future by issuing additional equity or
debt securities, selling our assets or otherwise to fund our future capital needs; (vi) the availability and terms of financing, including the impact of
higher interest rates on the cost and/or availability of financing; (vii) our ability to strategically acquire, develop or dispose of assets on favorable terms
or at all; (viii) our level of debt and the terms and limitations imposed on us by our debt agreements; (ix) our ability to retain our executive officers and
other key personnel; (x) unfavorable changes in laws or regulations impacting our business or our assets; and (xi) factors that could affect our ability to
qualify as a real estate investment trust. The forward-looking statements should be read in light of these and other risk factors identified in the “Risk
Factors” section of our most recent Form 10-K and Form 10-Q, as filed with the Securities and Exchange Commission.
The modeling, projections, analyses, and other forward-looking information prepared by CoStar Portfolio Strategy, LLC (“CoStar”) and presented herein
are based on financial and other information from public and proprietary sources, as well as various assumptions concerning future events and
circumstances that are speculative, uncertain and subject to change without notice. Actual results and events may differ materially from the projections
presented.
All CoStar materials set forth herein (“CoStar Materials”) speak only as of the date referenced and may have materially changed since such date.
CoStar does not purport that the CoStar Materials herein are comprehensive, and, while they are believed to be accurate, the CoStar Materials are not
guaranteed to be free from error, omission or misstatement. CoStar has no obligation to update any of the CoStar Materials included in this document.
All CoStar Materials are provided “as is,” without any guarantees, representations or warranties of any kind, including implied warranties of
merchantability, non-infringement, title and fitness for a particular purpose. To the maximum extent permitted by law, CoStar disclaims any and all
liability in the event any CoStar Materials prove to be inaccurate, incomplete or unreliable. CoStar does not sponsor, endorse, offer or promote an
investment in the securities of TIER REIT, Inc. You should not construe any of the CoStar Materials as investment, tax, accounting or legal advice.
High-quality portfolio
Proven execution
Significant value creation opportunities
INVESTMENT
RATIONALE
Austin I Dallas I Houston I Charlotte I Nashville I Atlanta I Denver
Flexible balance sheet
Focused strategy
Experienced management team
ir@tierreit.com
www.tierreit.com
972.483.2400
