Attached files
| file | filename |
|---|---|
| EX-32.1 - EXHIBIT 32.1 - TIER REIT INC | tier-ex321_20151231x10k.htm |
| EX-31.2 - EXHIBIT 31.2 - TIER REIT INC | tier-ex312_20151231x10k.htm |
| EX-31.1 - EXHIBIT 31.1 - TIER REIT INC | tier-ex311_20151231x10k.htm |
| EX-21.1 - EXHIBIT 21.1 - TIER REIT INC | tier-ex211_20151231x10k.htm |
| EX-23.1 - EXHIBIT 23.1 - TIER REIT INC | tier-ex231_20151231x10k.htm |
UNITED STATES
SECURITIES AND EXCHANGE COMMISSION
Washington, D.C. 20549
FORM 10-K
(Mark One)
ý Annual Report Pursuant to Section 13 or 15(d) of the Securities Exchange Act of 1934
For the fiscal year ended December 31, 2015
or
o Transition Report Pursuant to Section 13 or 15(d) of the Securities Exchange Act of 1934
For the transition period from __________to ____________
Commission File Number: 001-37512
TIER REIT, Inc.
(Exact name of registrant as specified in its charter)
Maryland | 68-0509956 | |
(State or other jurisdiction of incorporation or organization) | (I.R.S. Employer Identification No.) | |
5950 Sherry Lane, Suite 700, Dallas, Texas | 75225 | |
(Address of principal executive offices) | (Zip Code) | |
(972) 483-2400
(Registrant’s telephone number, including area code)
Securities registered pursuant to section 12(b) of the Act:
Title of each class | Name of each exchange on which registered | |
Common stock, $.0001 par value per share | New York Stock Exchange | |
Securities registered pursuant to section 12(g) of the Act:
None
(Title of class)
Indicate by check mark if the registrant is a well-known seasoned issuer, as defined in Rule 405 of the Securities Act. Yes ý No o
Indicate by check mark if the registrant is not required to file reports pursuant to Section 13 or Section 15(d) of the Act. Yes o No ý
Indicate by check mark whether the registrant: (1) has filed all reports required to be filed by Section 13 or 15(d) of the Securities Exchange Act of 1934 during the preceding 12 months (or for such shorter period that the Registrant was required to file such reports) and (2) has been subject to such filing requirements for the past 90 days. Yes ý No o
Indicate by check mark whether the Registrant has submitted electronically and posted on its corporate website, if any, every Interactive Data File required to be submitted and posted pursuant to Rule 405 of Regulation S-T (§232.45 of this chapter) during the preceding 12 months (or for such shorter period that the registrant was required to submit and post such files). Yes ý No o
Indicate by check mark if disclosure of delinquent filers pursuant to Item 405 of Regulation S-K is not contained herein, and will not be contained, to the best of registrant’s knowledge, in definitive proxy or information statements incorporated by reference in Part III of this Form 10-K or any amendment to this Form 10-K. ý
Indicate by check mark whether the registrant is a large accelerated filer, an accelerated filer, a non-accelerated filer, or a smaller reporting company. See the definitions of “large accelerated filer,” “accelerated filer” and “smaller reporting company” in Rule 12b-2 of the Exchange Act.
Large accelerated filer o | Accelerated filer o | |
Non-accelerated filer x (Do not check if a smaller reporting company) | Smaller reporting company o | |
Indicate by check mark whether the registrant is a shell company (as defined in Rule 12b-2 of the Exchange Act). Yes o No ý
As of June 30, 2015, there was no established market for the registrant’s common stock. The aggregate market value of the registrant’s common stock held by non-affiliates of the registrant as of June 30, 2015 (the last business day of the registrant’s most recently completed second fiscal quarter) was approximately $1.3 billion, based on the estimated per share value of $26.88 per share, as established by the registrant’s board of directors as of October 30, 2014 (adjusted to reflect the one-for-six reverse stock split that occurred on June 2, 2015), pursuant to the registrant’s Third Amended and Restated Policy for Estimation of Common Stock Value. The registrant’s common stock was first listed on the New York Stock Exchange on July 23, 2015.
As of February 1, 2016, the registrant had 47,746,829 shares of common stock outstanding.
DOCUMENTS INCORPORATED BY REFERENCE
Portions of the registrant’s Definitive Proxy Statement, relating to its 2016 Annual Meeting of Stockholders, are incorporated by reference into Part III of this Form 10-K to the extent stated herein. The Registrant intends to file such Definitive Proxy Statement with the Securities and Exchange Commission not later than 120 days after the end of its 2015 fiscal year.
TIER REIT, Inc.
FORM 10-K
Year Ended December 31, 2015
Page | ||
Item 1. | ||
Item 1A. | ||
Item 1B. | ||
Item 2. | ||
Item 3. | ||
Item 4. | ||
Item 5. | ||
Item 6. | ||
Item 7. | ||
Item 7A. | ||
Item 8. | ||
Item 9. | ||
Item 9A. | ||
Item 9B. | ||
Item 10. | ||
Item 11. | ||
Item 12. | ||
Item 13. | ||
Item 14. | ||
Item 15. | ||
2
Forward-Looking Statements
Certain statements in this Annual Report on Form 10-K constitute “forward-looking statements” within the meaning of Section 27A of the Securities Act of 1933, as amended (the “Securities Act”) and Section 21E of the Securities Exchange Act of 1934, as amended (the “Exchange Act”). These forward-looking statements include discussion and analysis of the financial condition of TIER REIT, Inc. and our subsidiaries (which may be referred to herein as the “Company,” “we,” “us” or “our”), including our ability to rent space on favorable terms, our ability to address debt maturities and fund our capital requirements, our intentions to sell certain properties, our intentions with respect to development activity, the value of our assets, our anticipated capital expenditures, the amount and timing of any anticipated future cash distributions to our stockholders and other matters. Words such as “may,” “will,” “anticipates,” “expects,” “intends,” “plans,” “believes,” “seeks,” “estimates,” “would,” “could,” “should,” “objectives,” “strategies,” “goals,” and variations of these words and similar expressions are intended to identify forward-looking statements.
These forward-looking statements are not historical facts but reflect the intent, belief, or current expectations of our management based on their knowledge and understanding of the business and industry, the economy, and other future conditions. These statements are not guarantees of future performance, and we caution stockholders not to place undue reliance on forward-looking statements. Actual results may differ materially from those expressed or forecasted due to a variety of risks and uncertainties, including but not limited to the factors listed and described under “Risk Factors” in this Annual Report on Form 10-K and the factors described below:
• | market disruptions and economic conditions experienced by the U.S. economy or real estate industry as a whole and the local economic conditions in the markets in which our properties are located; |
• | our ability to renew expiring leases and lease vacant spaces at favorable rates or at all; |
• | the inability of tenants to continue paying their rent obligations due to bankruptcy, insolvency, or a general downturn in their businesses; |
• | the availability of cash flow from operating activities to fund distributions and capital expenditures; |
• | our ability to raise capital in the future by issuing additional equity or debt securities, selling our assets, or otherwise to fund our future capital needs; |
• | the availability and terms of financing, including the impact of higher interest rates on the cost and/or availability of financing; |
• | our ability to strategically acquire or dispose of assets on favorable terms, or at all; |
• | our level of debt and the terms and limitations imposed on us by our debt agreements; |
• | our ability to retain our executive officers and other key personnel; |
• | unfavorable changes in laws or regulations impacting our business or our assets; and |
• | factors that could affect our ability to qualify as a real estate investment trust for federal income tax purposes. |
Forward-looking statements in this Annual Report on Form 10-K reflect our management’s view only as of the date of this Report, and may ultimately prove to be incorrect or false. We undertake no obligation to update or revise forward-looking statements to reflect changed assumptions, the occurrence of unanticipated events, or changes to future operating results. We intend for these forward-looking statements to be covered by the applicable safe harbor provisions created by Section 27A of the Securities Act and Section 21E of the Exchange Act.
3
PART I
Item 1. Business.
General
TIER REIT, Inc. is a self-managed, Dallas-based real estate investment trust focused on maximizing total return to stockholders through the combination of stock appreciation and income derived from a sustainable distribution. As used herein, “TIER REIT,” “TIER,” the “Company,” “we,” “us” or “our” refers to TIER REIT, Inc. and its subsidiaries unless the context otherwise requires. TIER’s investment strategy is to acquire, develop, and operate a portfolio of best-in-class office properties in select U.S. markets that consistently lead the nation in both population and office-using employment growth. TIER REIT was incorporated in June 2002 as a Maryland corporation and has elected to be taxed, and currently qualifies, as a real estate investment trust, or REIT, for federal income tax purposes.
Substantially all of our business is conducted through Tier Operating Partnership LP (“Tier OP”), a Texas limited partnership. Our wholly-owned subsidiary, Tier GP, Inc., a Delaware corporation, is the sole general partner of Tier OP. Our direct and indirect wholly-owned subsidiaries, Tier Business Trust, a Maryland business trust, and Tier Partners, LLC, a Delaware limited liability company, are limited partners that together with Tier GP, Inc. own all of Tier OP.
As of December 31, 2015, we owned interests in 34 operating office properties, two non-operating properties, and one development property located in 15 markets throughout the United States. Our corporate offices are located at 5950 Sherry Lane, Suite 700, Dallas, Texas 75225, and our telephone number is (972) 483-2400.
On June 2, 2015, we filed articles of amendment to our charter to effect a one-for-six reverse stock split of our existing common stock. The par value of our common stock remained at $0.0001 per share, and we recorded an adjustment to the common stock value with an offset to additional paid-in-capital to reflect the change for all periods presented. In accordance with accounting principles generally accepted in the United States of America (“GAAP”), all share information presented has been retroactively adjusted to reflect the reverse stock split.
On July 23, 2015, we listed our shares of common stock on the New York Stock Exchange (“NYSE”) under the ticker symbol “TIER.”
Business Strategy
TIER REIT is a premier office REIT whose goal is to maximize total return to stockholders through the combination of stock appreciation and income derived from a sustainable distribution. We leverage the extensive experience of our executive team who were integral in the successful listing of four public office REITs over the last 20 years. In order to achieve our goal, we employ the following strategies:
Our Investment Strategy: Forward Thinking + Purposeful
Utilizing rigorous fiscal discipline blended with vision and creativity, we acquire, develop, and redevelop high quality office properties in target markets that we believe offer the opportunity to create long-term value. By investing in best-in-class properties, we believe our assets will outperform others in their respective markets, particularly in periods of oversupply or economic downturn. We also seek opportunities to enhance our investment returns through sales and joint ventures of mature properties and reinvestment into new opportunities.
Our Markets: Selective + Growth Oriented
Our approach to determining our target markets is research driven, augmented by our market knowledge resulting from our management team’s experience and operating history. We invest and operate in markets that we believe are well positioned to benefit from both long-term population and office-using employment growth. We focus our investment efforts primarily in the high-growth markets of Atlanta, Austin, Charlotte, Dallas, Denver, Houston, and Nashville in which our team has deep and extensive relationships cultivated through successful office acquisitions and development transactions encompassing four investment cycles during the past 30 years. We may also invest in other high-growth office markets in order to seek to enhance our return and diversify our risk.
4
Our Submarkets: Demand Driven + Progressive
We select specific submarkets within our target markets — TIER1 submarkets — that possess proven, long-term demand characteristics such as amenities that provide a “work-live-play” environment, proximity to office-using workforce, efficient infrastructure and transportation, presence of growth industries, quality higher education, and in-migration.
Our Operational Excellence: Dependable + Innovative
Operational excellence is at the forefront of our thinking. We provide our tenants with exceptional working environments with our best-in-class TierOne Property Services. We also believe that high-performance green buildings are not just good for the environment, they create economic value for our stockholders and tenants. We use innovative technology to stay on the cutting edge of efficient space planning, energy management, and conservation initiatives which are critical factors in the prospective tenant decision-making process.
Our Capital Structure: Conservative + Efficient
We manage our capital structure through the use of moderate levels and flexible forms of leverage. We utilize a variety of financing sources that provide us the opportunity to optimize our cost of capital while also supporting our flexibility to grow and enhance the value of our portfolio.
Key Objectives
We identified six key objectives for 2015: (1) dispose of properties outside target markets; (2) recycle capital into target markets; (3) strengthen the balance sheet; (4) increase portfolio occupancy; (5) internalize property management and administrative services; and (6) reinstate distributions. Please see a detailed discussion about our 2015 activities with respect to such objectives in “Management’s Discussion and Analysis of Financial Condition and Results of Operations - Overview.”
To continue the Company’s progress forward, we have identified five key objectives for 2016: (1) increase institutional ownership in shares of our common stock; (2) dispose of non-strategic properties; (3) reduce our leverage; (4) manage capital expenditures; and (5) increase portfolio occupancy while also addressing short- and mid-term lease expirations.
Increase Institutional Ownership in Shares of our Common Stock
We believe our transformation from a collection of assets to a premier office REIT, along with our high-quality, Class A office portfolio, focused investment strategy, opportunities for outsized growth, and in-house expertise, are attractive to institutional investors and differentiate us from other office REITs. To this end, during 2016, we will embark upon a robust investor relations program that will communicate our strategy to a broad audience of institutional investors.
Dispose of Non-Strategic Properties
We intend to continue disposing of non-strategic properties when we believe market conditions are advantageous to us. During 2015, we reduced our presence in two non-strategic markets (Baltimore, Maryland, and Philadelphia, Pennsylvania), exited two non-strategic markets (Worcester, Massachusetts, and Cleveland, Ohio), and exited one target market (Atlanta, Georgia) where we owned a non-controlling 10% interest in a property located outside of a TIER1 submarket. As of December 31, 2015, we had a total of 3.9 million square feet (at ownership share) located in our six remaining non-strategic markets, which include Baltimore, Maryland; Cherry Hill, New Jersey; Chicago, Illinois; Columbus, Ohio; Philadelphia, Pennsylvania; and St. Paul, Minnesota. Exiting these properties over time will allow us to further sharpen our geographic focus, de-lever the balance sheet, and provide capital to be recycled into strategic investment opportunities. We can provide no assurance that we will sell properties located in the non-strategic markets described above on terms favorable to us, or at all, or on the timing we expect. We can also provide no assurance regarding the specific uses of any net proceeds.
Reduce our Leverage
Substantial progress was made in 2015 to create a more flexible capital structure, balance our debt maturities, lower our leverage, and reduce our weighted average borrowing costs. During 2016, we intend to continue this progress by utilizing proceeds from the sale of non-strategic properties to further reduce leverage and transition our credit facility from secured to unsecured.
5
Manage Capital Expenditures
We will continue to actively manage capital expenditures with the objective of balancing leasing capital and building improvements with our ability to meet customer demands and achieve our leasing objectives. We believe our long-term strategy of acquiring and developing high-quality properties within our target growth markets will allow us to better manage our capital expenditures by: (1) increasing total operating cash flow; (2) sustaining the overall quality of our strategic portfolio; and (3) leveraging the existing property management team, thereby resulting in operating efficiencies within each market.
Increase Portfolio Occupancy and Address Short- to Mid-term Lease Expirations
We are focused on increasing our portfolio’s occupancy. As of December 31, 2015, our operating office properties are approximately 89.7% leased to tenants. We expect to experience downward pressure on occupancy through the second quarter of 2016 due to known tenant move outs coupled with typical downtime to market and backfill the vacated space, but anticipate positive movement in our occupancy in the second half of the year. The leasing environment remains strong in the majority of our markets; however, we continuously monitor the economy and our real estate markets closely.
In addition to increasing occupancy, we are focused on addressing short-term lease expirations and certain mid-term lease expirations to lock in recent market rental rate growth while reducing lease rollover exposure throughout the portfolio.
Competition
We are subject to significant competition in seeking tenants for our properties. The competition for creditworthy tenants is intense, and we have been required to provide rent concessions, incur charges for tenant improvements, and provide other inducements at a high level. Without these inducements, we may not be able to continue to lease vacant space timely, or at all, which would adversely impact our results of operations. We also compete with sellers of similar properties when we sell properties, which may result in our receiving lower proceeds from the sale, or which may result in our not being able to sell such properties due to the lack of an acceptable investment return. Further, we may compete with other buyers and developers who are interested in properties we may acquire or develop, which may result in an increase in the amount that we would pay for such properties or may result in us ultimately not being able to acquire or develop such properties. Some of our competitors, including larger REITs, have greater financial resources than we do and generally may be able to accept more risk. They also may enjoy competitive advantages that result from, among other things, a lower cost of capital and enhanced operating efficiencies.
Regulations and Environmental Matters
Our properties and operations are subject to various federal, state, and local laws, ordinances and regulations, including, among other things, zoning regulations, land use controls, requirements related to access and use by disabled persons, environmental controls relating to air and water quality, noise pollution, and indirect environmental impacts such as increased motor vehicle activity. We believe that we have all permits and approvals necessary under current law to operate our properties.
As an owner of real estate, we are subject to various environmental laws of federal, state, and local governments. Compliance with existing laws has not had a material adverse effect on our capital expenditures, earnings, or competitive position, and management does not believe it will have such an impact in the future. However, we cannot predict the impact of unforeseen environmental contingencies or new or changed laws or regulations on our properties.
Employees
As of December 31, 2015, we had 126 employees.
Financial Information About Industry Segments
Our current business consists of owning, operating, acquiring, developing, investing in, and disposing of real estate assets. We internally evaluate operating performance on an individual property level and view each of our real estate assets as one individual operating segment. However, all of our properties are aggregated into one reportable segment as they have similar economic characteristics.
Available Information
We electronically file annual reports on Form 10-K, quarterly reports on Form 10-Q, current reports on Form 8-K, and all amendments to those reports with the SEC. Copies of our filings with the SEC may be obtained from our website at www.tierreit.com or from the SEC’s website at www.sec.gov. Access to these filings is free of charge. We are not incorporating any information from our website into this Form 10-K.
6
Item 1A. Risk Factors.
The factors described below represent what we believe are our principal risks. Other factors may exist that we do not consider to be significant based on information that is currently available or that we are not currently able to anticipate. The occurrence of any of the risks discussed below could have a material adverse effect on our business, financial condition, and results of operations, and the market price of our common stock and could affect our ability to pay distributions in any future periods. Our stockholders may be referred to as “you” or “your” in this Item 1A, “Risk Factors” section.
Risks Related to Our Business and Operations
Market disruptions may adversely impact many aspects of our operating results and operating condition.
While many real estate markets have generally stabilized since the pervasive and fundamental disruptions associated with the last recession that created extensive job losses and limited availability of credit to businesses, the financial markets have been volatile recently, and oil prices have declined dramatically over the past year. The availability of debt financing secured by commercial real estate is still subject to tightened underwriting standards when compared to pre-recession standards and the impact of regulatory actions, all of which may increase interest rates and widen credit spreads leading to a slowdown in the U.S. economy as a whole, or impact real estate investments in some of the following ways:
• | the financial condition of our tenants may be adversely affected, which may result in us having to reduce rental rates in order to retain tenants; |
• | an increase in the number of bankruptcies or insolvency proceedings of our tenants and lease guarantors could delay our efforts to collect rent and any past due balances under the relevant leases, and ultimately could preclude collection of these sums; |
• | our ability to borrow on terms and conditions that we find acceptable may be limited, which could result in our investment operations generating lower overall economic returns and a reduced level of cash flow, which could potentially impact our ability to make distributions to our stockholders or pursue acquisition opportunities, among other things, and increase our interest expense; |
• | the value of certain of our real estate assets may decrease below the amounts we paid for them, which would limit our ability to dispose of assets at attractive prices or to obtain debt financing secured by these assets; and |
• | the value and liquidity of short-term investments, if any, could be reduced as a result of the dislocation of the markets for our short-term investments and increased volatility in market rates for these investments or other factors. |
For these and other reasons, we cannot assure you that we will be profitable or that we will realize growth in the value of our investments.
We cannot predict the impact future actions by regulators or government bodies, including the U.S. Federal Reserve, will have on real estate debt markets or on our business, and any such actions may negatively impact us.
Regulators and U.S. government bodies have a major impact on our business. The U.S. Federal Reserve is a major participant in, and its actions significantly impact, the commercial real estate debt markets. For example, quantitative easing, a program implemented by the U.S. Federal Reserve to keep long-term interest rates low and stimulate the U.S. economy, had the effect of reducing the difference between short-term and long-term interest rates. However, the U.S. Federal Reserve has recently ended the latest round of quantitative easing and has raised interest rates. Rising interest rates increase the cost of borrowing, which could limit our flexibility. This may result in future acquisitions by us generating lower overall economic returns and increasing the costs associated with refinancing current debt, which could potentially reduce future cash flow available for distribution. We cannot predict or control the impact future actions by regulators or government bodies, such as the U.S. Federal Reserve, will have on our business.
7
Economic conditions may adversely affect our income, and we could be subject to risks associated with acquiring real estate assets.
U.S. and international financial markets have been volatile, particularly recently. The effects of this volatility may persist particularly as financial institutions continue to restructure their businesses and capital structures in response to new or enhanced regulatory requirements, all of which could impact the availability of credit and overall economic activity as a whole.
In addition, we are subject to the risks generally incident to the ownership of real estate assets. For example, even though we may purchase assets at a discount from historical cost or market value due to, among other things, substantial deferred maintenance or poorly structured financing of the real estate or debt instruments underlying the assets, or we may currently own properties with similar factors, there is no assurance that we will be able to overcome these factors. All of these factors could further decrease the value of real estate assets.
Further, fluctuations in market conditions make judging the future performance of these assets difficult. The real estate assets we own or may acquire may substantially decline in value, which would, among other things, negatively impact our ability to finance or refinance debt secured by these assets or earn positive returns on these assets, and may require us to write down or impair the value of these assets, which would have a negative impact on our results of operations and ability to pay or sustain distributions.
Leases representing approximately 8% of the rentable area within our operating office properties are scheduled to expire in 2016. We may be unable to renew leases or lease vacant space at favorable rates or at all.
As of December 31, 2015, leases representing approximately 8% of the rentable area within our operating office properties were scheduled to expire in 2016. We may be unable to extend or renew any of the expiring leases, or we may be able to re-lease these spaces only at rental rates equal to or below the expiring rental rates. We also may not be able to lease space which is currently not occupied on acceptable terms and conditions, if at all. In addition, some of our tenants have leases that include early termination provisions that permit the lessee to terminate all or a portion of its lease with us after a specified date or upon the occurrence of certain events with little or no liability to us. We may be required to offer substantial rent abatements, tenant improvements, early termination rights, or below-market renewal options to retain these tenants or attract new ones. Portions of our properties may remain vacant for extended periods of time. Further, some of our leases currently provide tenants with options to renew the terms of their leases at rates that are less than the current market rate. If we are unable to obtain new rental rates that are on average comparable to our asking rents across our portfolio, then our ability to increase cash flow will be negatively impacted.
We may be required to make significant capital expenditures to improve our properties in order to retain and attract tenants and are uncertain of the sources of, and may be unable to obtain funding for, all of our future capital needs.
We require capital on an ongoing basis to fund tenant improvements, leasing commissions, and capital expenditures. Specifically, we may be required to expend substantial funds to improve or refurbish leasable space either to retain existing tenants or to attract new tenants. We expect that, upon the expiration of leases at our properties, we may be required to make rent or other concessions to tenants; accommodate requests for renovations, build-to-suit remodeling, and other improvements; or provide additional services to our tenants. As a result, we may have to pay for significant leasing costs or tenant improvements in order to retain tenants whose leases are expiring or to attract new tenants. The reserves we have established for capital improvements may not be sufficient, which would require us to seek funds from other sources. Moreover, certain reserves required by lenders are designated for specific uses and may not be available to use for tenant improvements. Our ability to fund future property capital needs may depend on our ability to borrow, to raise capital, including through the disposition of certain of our assets or interests in assets or equity offerings, or to generate additional cash flow from operations. There can be no assurance that any of these sources will be available, and some of these strategies pose additional risks. For example, if we sell assets, it will likely have the effect of reducing cash flow from operating activities. Alternatively, if we decide to raise capital by offering shares of common or preferred stock, or any other securities that are convertible into, exercisable, or exchangeable for our capital stock, the issuance could have the effect of diluting the proportionate equity interest and voting power of our existing stockholders. Ultimately, if we are unable to fund our capital needs, we may be required to, among other things, defer necessary improvements to our properties, which may cause the properties to suffer from a greater risk of obsolescence or a decline in value, or we may experience decreased cash flow as a result of non-renewals by tenants upon expiration of their leases or fewer tenants being attracted to a property. If this happens, we may not be able to maintain expiring rental rates for the affected properties.
8
We face significant competition in the leasing market, which may decrease or prevent increases in the occupancy and rental rates of our properties.
We own properties located in metropolitan cities and suburban markets in the United States. We compete with numerous developers, owners, and operators of office properties, many of which own properties similar to, and in the same market areas as, our properties. If our competitors offer space at rental rates below current market rates, or below the rental rates we currently charge our tenants, we may lose existing or potential tenants and we may be pressured to reduce our rental rates below those we currently charge in order to attract new tenants and retain existing tenants when their leases expire. Also, as our competitors develop additional office properties in locations near our properties, there will likely be increased competition for creditworthy tenants which may require us to make capital improvements to properties that we would not have otherwise made or further reduce rents.
We depend on tenants for our revenue, and accordingly, lease terminations and tenant defaults could adversely affect the income produced by our properties.
The success of our investments materially depends on the financial stability of our tenants, many of which are financial, legal and other professional firms and many of whom may experience a change in their business at any time. Economic conditions have adversely affected in the past, and could adversely affect in the future, one or more of our tenants. As a result, our tenants may delay lease commencements, decline to extend or renew their leases upon expiration, fail to make rental payments when due or declare bankruptcy. Any of these actions could result in the termination of the tenants’ leases, or expiration of existing leases without renewal, and the loss of rental income attributable to the terminated or expired leases. In the event of a tenant default or bankruptcy, we may experience delays in enforcing our rights as a landlord and may incur substantial costs in protecting our investment and re-leasing our property. Specifically, a bankruptcy filing by, or relating to, one of our tenants or a lease guarantor would bar efforts by us to collect pre-bankruptcy debts from that tenant or lease guarantor unless we receive an order permitting us to do so from the bankruptcy court. In addition, we cannot evict a tenant solely because of bankruptcy. The bankruptcy of a tenant or lease guarantor could delay our efforts to collect past due balances under the relevant leases, and could ultimately preclude collection of these sums. If a lease is assumed by a tenant in bankruptcy, all pre-bankruptcy balances due under the lease must be paid to us in full. If, however, a lease is rejected by a tenant in bankruptcy, we would have only a general, unsecured claim for damages. An unsecured claim would only be paid to the extent that funds are available and only in the same percentage as is paid to all other holders of general, unsecured claims. Restrictions under the bankruptcy laws further limit the amount of any other claims that we can make if a lease is rejected. As a result, it is likely that we would recover substantially less than the full value of the remaining rent during the term.
One of our balance sheet strategies involves the disposition of non-strategic assets; however, we may be unable to sell a property on acceptable terms and conditions, or at all.
One of our balance sheet strategies is to sell or otherwise dispose of certain non-strategic properties. We believe it makes economic sense to do so in today’s market in certain instances, such as when we believe there is strong investment interest in a non-strategic market, when we believe the value of the leases in place at a property will significantly decline over the remaining lease term, when we believe we have limited or no equity in a property that secures debt with a near- term maturity, when we do have equity in a property but the projected returns do not justify further investment, or when we believe the equity in a property can be redeployed in the portfolio in order to achieve better returns or strategic goals. However, certain market conditions generally, and property specific issues such as vacancies and lease terminations, could negatively affect the value of our investment properties and therefore reduce our ability to sell or otherwise dispose of these properties on acceptable terms or at all. In addition, the “prohibited transaction” rules (discussed below) may limit our ability to sell properties without adversely affecting returns to our stockholders. Real estate investments generally, and in particular large office properties like those that we own, often cannot be sold quickly, particularly when coupled with a debt assumption. Furthermore, properties that we have owned for a significant period of time may have a low tax basis. If we were to dispose of any of these properties in a taxable transaction, we may be required, under provisions of the Internal Revenue Code of 1986, as amended (the “Code”), applicable to REITs, to distribute a significant amount of the taxable gain, if any, to our stockholders and this could, in turn, impact our cash flow. In addition, purchase options and rights of first refusal held by tenants or partners in joint ventures may also limit our ability to sell certain properties. All of these factors limit our ability to effectuate this particular balance sheet strategy.
If we sell properties and provide financing to purchasers, defaults by the purchasers would decrease our cash flows and limit our ability to make distributions.
In some instances we may sell our properties by providing financing to purchasers. When we provide financing to purchasers, we will bear the risk that the purchaser may default, which could negatively impact our liquidity and results of
9
operations. Even in the absence of a purchaser default, the distribution of the proceeds of sales to our stockholders, or the reinvestment of proceeds in other assets, will be delayed until the promissory notes or other property we may accept upon a sale are actually paid, sold, refinanced, or otherwise disposed.
Development and construction projects are subject to significant risks, including the risks that such projects are more costly than anticipated and that we may not successfully complete and operate developed properties.
We may, from time to time, develop and construct new properties or redevelop existing properties. In doing so, we will be subject to the risks and uncertainties associated with construction and development including the environmental concerns of governmental entities or community groups and our builder’s ability to control construction costs or to build in conformity with plans, specifications, and timetables. The builder’s failure to perform may necessitate legal action by us to rescind the purchase or the construction contract or to compel performance. Performance also may be affected or delayed by conditions beyond the builder’s control. Delays in completion of construction also could give tenants the right to terminate preconstruction leases for space at a newly developed project. We may incur additional risks when we make periodic progress payments or other advances to builders prior to completion of construction. These and other such factors can result in increased costs of a project or loss of our investment. We may expend significant time and money on projects that are never completed, our construction costs, including labor and materials, may be higher than estimated, and we may be unable to obtain financing on favorable terms or at all. In addition, we are subject to normal lease-up risks relating to newly constructed projects or re-developed projects, and occupancy and rental rates at a newly-completed property may not meet our expectations. Furthermore, we must rely upon projections of rental income and expenses and estimates of the fair market value of property upon completion of construction when agreeing upon a price to be paid for the property at the time of acquisition of the property. If our projections are inaccurate, we may pay too much for a property, and our return on our investment could suffer. We may also invest in unimproved real property. Returns from development of unimproved properties also are subject to additional risks and uncertainties such as those associated with rezoning.
Our indebtedness may adversely affect our financial health and operating flexibility.
As of December 31, 2015, we had total outstanding indebtedness of approximately $1.1 billion, excluding debt of our unconsolidated entities. As a result of our indebtedness, we are required to use a material portion of our cash flow to pay principal and interest on our debt, which limits the cash flow available for other purposes. In addition, we may not generate sufficient cash flow after debt service to, among other things, fund capital expenditures and pay distributions. Our level of debt and the limitations imposed on us by our debt agreements, including our credit facility agreement, could have significant adverse consequences to us, regardless of our ability to refinance or extend our debt, including:
• | limiting our ability to borrow additional amounts for, among other things, working capital, capital expenditures, debt service requirements, execution of our business plan, or other purposes; |
• | limiting our ability to use operating cash flow in other areas of our business or to pay distributions; |
• | increasing our vulnerability to general adverse economic and industry conditions; |
• | limiting our ability to capitalize on business opportunities and to react to competitive pressures and adverse changes in governmental regulation; |
• | limiting our ability to fund capital expenditures, tenant improvements, and leasing commissions; and |
• | limiting our ability or increasing the costs to refinance our indebtedness. |
We have experienced net losses attributable to our common stockholders, and we may experience future losses.
Although we had positive net income attributable to our common stockholders of approximately $15.6 million, primarily as a result of gains on the sale or transfer of assets for the year ended December 31, 2013, we had net losses attributable to our common stockholders of approximately $32.1 million and $17.4 million for the years ended December 31, 2015 and 2014, respectively. If we incur net losses in the future or such losses increase, our financial condition, results of operations, cash flow, and our ability to service our indebtedness and pay distributions to our stockholders will be materially and adversely affected.
10
Economic, regulatory, and socio-economic changes that impact the real estate market generally or that could affect patterns of use of commercial office space may cause our operating results to suffer and decrease the value of our real estate properties.
If our properties do not generate income sufficient to meet operating expenses, debt service, and capital expenditures, it is unlikely we could continue to pay distributions to our stockholders. In addition, there are significant expenditures associated with an investment in real estate (such as mortgage payments, real estate taxes, and maintenance costs) that generally do not decline even if the income from the property has declined. The following factors, among others, may adversely affect the operating performance and long- or short-term value of our properties:
• | changes in the national, regional, and local economic climates, particularly in markets in which we have a concentration of properties; |
• | local office submarket conditions such as changes in the supply of, or demand for, space in properties similar to those that we own within a particular area; |
• | changes in the patterns of office use due to technological advances which may make telecommuting more prevalent; |
• | the attractiveness of our properties to potential tenants; |
• | changes in interest rates and availability of permanent mortgage funds that may render the sale of a property difficult or unattractive or otherwise reduce returns to stockholders; |
• | the financial stability of our tenants, including bankruptcies, financial difficulties, or lease defaults by our tenants; |
• | changes in operating costs and expenses, including costs for maintenance, insurance and real estate taxes, and our ability to control rents in light of such changes; |
• | the need to periodically fund the costs to repair, renovate, and re-lease space; |
• | earthquakes, tornadoes, hurricanes, and other natural disasters; civil unrest, terrorist acts, or acts of war; and public health emergencies, including the spread of infectious diseases, such as Ebola, any of which may result in uninsured or underinsured losses; |
• | changes in, or increased costs of compliance with, governmental regulations, including those governing usage, zoning, the environment, and taxes; and |
• | changes in accounting standards. |
Any of these factors may cause a decrease in the value of our real estate properties.
The geographic concentration of our portfolio may make us particularly susceptible to adverse economic developments in the real estate markets of those areas.
In addition to general, regional, and national economic conditions, our operating results are impacted by the economic conditions of the specific markets in which we have concentrations of properties. Properties located in Houston, Texas, generated approximately 24.4% of our consolidated rental revenue from continuing operations for the year ended December 31, 2015. For properties located in Houston, Texas, leases scheduled to expire in 2016 and 2017 represent approximately 1.1% and 3.7%, respectively, of our total occupied square feet as of December 31, 2015. Any adverse economic or real estate developments in these markets, such as business layoffs or downsizing, industry slowdowns, relocations of businesses, changing demographics, and other factors, or any decrease in demand for office space resulting from the local business climate, could adversely affect our property revenue, and hence, net operating income.
A significant number of our properties are located in or near energy producing and energy dependent regions, and if energy prices remain depressed or continue to decline, our financial results could be negatively impacted.
We have a substantial number of properties that are located in or near energy producing and energy dependent regions. In particular, we have five operating properties with approximately 2.2 million rentable square feet located in Houston, Texas, that comprised approximately $69.0 million, or 24.4%, of our consolidated rental revenue from continuing operations for the
11
year ended December 31, 2015. The Houston area is heavily dependent upon the energy sector. The price of oil and gas has declined dramatically over the past year. If prices remain depressed, it may have a significant adverse impact on the Houston economy, and companies in the oil and gas industries, including our tenants and prospective tenants, would likely curtail their level of operations, reduce the size of their workforces, and otherwise experience significant adverse impacts. In addition, a decline in the oil and gas industries would likely adversely affect companies, including our tenants and prospective tenants, in businesses that service or supply the oil and gas industries as well as businesses, including our tenants and prospective tenants, in unrelated industries located in areas like Houston that have benefited from the economic expansion generated by previous robust growth driven in part by higher oil prices. A prolonged period of low oil or gas prices or other factors negatively impacting the energy industry could have an adverse impact on our ability to maintain the occupancy of our Houston properties or could cause us to lease space at rates below current in place rents or at rates below the rates at which we have leased space in our Houston properties over the prior year. In addition, a prolonged period of low oil or gas prices or other factors negatively impacting the energy industry could have an adverse impact on the ability of our energy tenants to pay rent or could cause them to vacate their premises prior to, or at the conclusion of, their lease terms. Any such events could have a significant adverse impact on our financial condition and results of operations. In addition, factors negatively impacting the energy industry could reduce the market values of our Houston properties which could reduce our net asset value and adversely affect our financial condition and results of operations.
We may be adversely affected by trends in the office real estate industry.
Some businesses are rapidly evolving to increasingly permit employee telecommuting, flexible work schedules, open workplaces, and teleconferencing. These practices enable businesses to reduce their space requirements. A continuation of the movement towards these practices could over time erode the overall demand for office space and, in turn, place downward pressure on occupancy, rental rates, and property valuations.
An oversupply of space in any of our markets could cause rental rates and occupancies to decline, making it more difficult for us to lease space at attractive rental rates, or at all.
Undeveloped land in some of the markets in which we operate is generally more readily available and less expensive than in higher barrier-to-entry markets such as New York, Chicago, Boston, San Francisco and Los Angeles. As a result, even during times of positive economic growth, our competitors could construct new buildings that would compete with our properties. Any such increase in supply could result in lower occupancy and rental rates in our portfolio.
A concentration of our investments in any one property class may leave our profitability vulnerable to a downturn in that sector.
Substantially all of our properties are institutional quality office properties. As a result, we are subject to risks inherent in operating a single type of property. Any downturn in the office sector may have a material adverse effect on our financial condition and results of operations.
Adverse market and economic conditions may adversely affect us and could cause us to recognize impairment charges on real estate assets.
We continually monitor events and changes in circumstances that could indicate that the carrying value of our real estate related assets may not be recoverable. When indicators of potential impairment are present which indicate that the carrying value of our real estate related assets may not be recoverable, we assess the recoverability of these assets by determining whether the carrying value will be recovered through the estimated future undiscounted cash flows expected to be generated over the life of the asset including its eventual disposition. In the event that the carrying value exceeds the estimated future undiscounted cash flows and also exceeds the fair value of the asset, we adjust the real estate related assets to fair value and recognize an impairment charge.
Projections of expected future cash flows require management to make assumptions to estimate future market rental income amounts subsequent to the expiration of current lease agreements, property operating expenses, the number of months it takes to re-lease the property, and the number of years the property is held for investment, among other factors. The subjectivity of assumptions used in the future cash flow analysis, including discount rates, could result in an incorrect assessment of the property’s fair value and, therefore, could result in the misstatement of the carrying value of our real estate and related lease intangible assets and our net income.
12
Adverse market and economic conditions and market volatility may make it difficult to value our real estate assets. As a result of adverse market and economic conditions, there may be significant uncertainty in the valuation, or in the stability of, the cash flows, discount rates, and other factors related to such assets that could result in a substantial decrease in their value. We may be required to recognize additional asset impairment charges in the future.
Our ongoing strategy depends, in part, upon future acquisitions and development, and we may not be successful in identifying and consummating these transactions.
A part of our business strategy contemplates strategic expansion through the acquisition and development of institutional quality office properties. We may not be successful in identifying suitable properties or other assets or in consummating these transactions on satisfactory terms, if at all. We would likely need access to capital in order to fund any of these types of transactions. There is no assurance we would have access to capital on acceptable terms and conditions, if at all.
Further, we face significant competition for attractive investment opportunities from an indeterminate number of other real estate investors, including investors with significant capital resources such as domestic and foreign corporations and financial institutions, publicly traded and privately held REITs, private institutional investment funds, investment banking firms, life insurance companies, and pension funds. As a result of competition, we may be unable to acquire additional properties as we desire or the purchase price may be significantly elevated.
If we lose or are unable to obtain key personnel, our ability to implement our business and investment strategies and key objectives could be delayed or hindered.
Our ability to achieve our strategies and objectives depends, to a significant degree, upon the continued contributions of our executive officers and our other key personnel. The employment agreements that we have with our executive officers are terminable upon notice, and we cannot guarantee that we will retain our executive officers. We believe that our future success depends, in large part, on our ability to retain and hire highly-skilled managerial and operating personnel. Competition for persons with managerial and operational skills is intense, and we cannot assure you that we will be successful in retaining or attracting skilled personnel. If we lose or are unable to obtain the services of our executive officers and other key personnel, or do not establish or maintain the necessary strategic relationships, our ability to implement our business and investment strategies and key objectives could be delayed or hindered, and our operations and financial results could suffer.
Competition for skilled personnel could increase labor costs.
We compete with various other companies in attracting and retaining qualified and skilled personnel. We depend on our ability to attract and retain skilled management personnel who are responsible for the day-to-day operations of our company. Competitive pressures may require that we enhance our pay and benefits package to compete effectively for such personnel. We may not be able to offset such added costs by increasing the rates we charge our tenants. If there is an increase in these costs or if we fail to attract and retain qualified and skilled personnel, our business and operating results could be harmed.
Compensation awards to our management may not be tied to or correspond with our financial results or the price per share of our common stock.
The compensation committee of our board of directors is responsible for overseeing our compensation and employee benefit plans and practices, including our executive compensation plans and our incentive compensation and equity-based compensation plans. Our compensation committee has significant discretion in structuring compensation packages and may make compensation decisions based on competitive market practices or any number of other factors. As a result, compensation awards may not be tied to or correspond with financial results at our company or the price per share of our common stock.
Our use of joint ventures may limit our flexibility with jointly owned investments.
In appropriate circumstances, we intend to develop, acquire and recapitalize properties in joint ventures with other persons or entities when circumstances warrant the use of these structures. We currently have joint ventures that are not consolidated within our financial statements. Our participation in joint ventures is subject to the risks that:
• | we could become engaged in a dispute with any of our joint venture partners that might affect our ability to develop, finance or operate a property and could lead to the sale of either party’s ownership interest or the property; |
• | we may not have sole decision-making authority with respect to the joint venture, which could prevent us from taking actions that are in our best interests; |
13
• | our joint ventures may be subject to debt and any refinancing of such debt may require equity capital calls; |
• | our joint venture partners may default on their obligations necessitating that we fulfill their obligations ourselves; |
• | our joint venture partners may have different objectives than we have regarding the appropriate timing and terms of the development, sale, or refinancing of a property; |
• | our joint venture partners may be structured differently than us for tax purposes and this could create conflicts of interest; |
• | our joint venture partners may take actions that are not within our control, which could jeopardize our qualification as a REIT or the tax status of the joint venture, requiring us to pay taxes or subjecting properties owned by the joint venture to liabilities greater than those contemplated by the terms of the joint venture agreements; |
• | our joint venture partners may have competing interests in our markets that could create conflicts of interest; and |
• | our joint ventures may be unable to repay any amounts that we may loan to them. |
The failure of any bank in which we deposit our funds could reduce the amount of cash we have available for our operations or to pay distributions or make additional investments.
We have diversified our cash and cash equivalents between several banking institutions in an attempt to minimize exposure to any one of these entities. However, the Federal Deposit Insurance Corporation, or “FDIC,” generally only insures limited amounts per depositor per insured bank. We have cash and cash equivalents and restricted cash deposited in interest bearing accounts at certain financial institutions exceeding these federally insured levels. If any of the banking institutions in which we have deposited funds ultimately fails, we may lose the portion of our deposits that exceed the federally insured levels. The loss of our deposits would reduce the amount of cash we have available for our operations, to pay distributions, or to make additional investments.
We face risks associated with short-term liquid investments.
From time to time, we have significant cash balances that we invest in a variety of short-term investments that are intended to preserve principal value and maintain a high degree of liquidity while providing current income. These investments may include (either directly or indirectly):
• | direct obligations issued by the U.S. Treasury; |
• | obligations issued or guaranteed by the U.S. government or its agencies; |
• | taxable municipal securities; |
• | obligations (including certificates of deposits) of banks and thrifts; |
• | commercial paper and other instruments consisting of short-term U.S. dollar denominated obligations issued by corporations and banks; |
• | repurchase agreements collateralized by corporate and asset-backed obligations; |
• | both registered and unregistered money market funds; and |
• | other highly rated short-term securities. |
Investments in these securities and funds are not insured against loss of principal. Under certain circumstances we may be required to redeem all or part of our investment or our right to redeem some or all of our investment may be delayed or suspended. In addition, there is no guarantee that our investments in these securities or funds will be redeemable at par value. A decline in the value of our investment or a delay or suspension of our right to redeem may have a material adverse effect on our results of operations or financial condition.
14
An increase in real estate taxes may decrease our income from properties.
Generally, from time to time our property taxes will increase as property values or assessment rates change or for other reasons deemed relevant by the assessors. An increase in the assessed valuation of a property for real estate tax purposes results in an increase in the related real estate taxes on that property. Although some tenant leases may permit us to pass the tax increases through to the tenants for payment, there is no assurance that renewal leases or future leases will be negotiated on the same basis. Increases not passed through to tenants will adversely affect our income and our cash available to pay distributions, if any.
We may suffer uninsured losses relating to real property or pay excessively expensive premiums for insurance coverage.
Although we attempt to ensure that all of our properties are adequately insured to cover casualty losses, there are certain types of losses, generally catastrophic in nature, such as losses due to wars, acts of terrorism, earthquakes, floods, hurricanes, pollution, or environmental matters, which are uninsurable or not economically insurable, or may be insured subject to limitations, such as large deductibles or co-payments. Insurance risks associated with potential terrorist acts could sharply increase the premiums we pay for coverage against property and casualty claims. Mortgage lenders generally insist that specific coverage against terrorism be purchased by commercial property owners as a condition for providing mortgage, bridge, or mezzanine loans. We cannot be certain that this coverage will continue to be available, or available at reasonable cost, if at all, which could inhibit our ability to finance or refinance our properties. We may be required to provide other financial support, either through financial assurances or self-insurance, to cover potential losses. We cannot assure you that we will have adequate coverage for any losses we may suffer. In addition, other than any capital reserve we may establish, we will have limited sources of funding to repair or reconstruct any uninsured damaged property, and we cannot assure you that those reserves will be sufficient.
Should one of our insurance carriers become insolvent, we would be adversely affected.
We carry several different lines of insurance placed with several large insurance carriers. If any one of our large insurance carriers were to become insolvent, any outstanding claims would be at risk for collection. Further, in such an event, we would be forced to replace the existing insurance coverage with another suitable carrier, possibly at unfavorable rates or terms.
Future terrorist attacks, military conflicts, and global unrest could have a material adverse effect on general economic conditions, consumer confidence, and market liquidity.
The types of terrorist attacks since 2001, ongoing and future military conflicts, and the continued global unrest may affect commodity prices and interest rates, among other things. An increase in interest rates may increase our cost of borrowing, leading to a reduction in our earnings. An increase in the price of oil will also cause an increase in our operating costs, which may not be reimbursed by our tenants. Also, terrorist acts could result in significant damages to, or loss of, our properties or the value thereof.
We and the tenants of the properties in which we have an interest may be unable to obtain adequate insurance coverage on acceptable economic terms for losses resulting from acts of terrorism. Our lenders may require that we carry terrorism insurance even if we do not believe this insurance is necessary or cost effective. We may also be prohibited under the applicable lease from passing all or a portion of the cost of such insurance through to our tenants. Should an act of terrorism result in an uninsured loss or a loss in excess of insured limits we could lose capital invested in a property as well as the anticipated future revenues from a property while remaining obligated for any mortgage indebtedness or other financial obligations related to the property.
Actual or threatened terrorist attacks may adversely affect our ability to generate revenues and the value of our properties.
We have significant investments in large metropolitan markets that have been or may be in the future the targets of actual or threatened terrorism attacks. As a result, some tenants in these markets may choose to relocate their businesses to other markets or to lower-profile office buildings within these markets that may be perceived to be less likely targets of future terrorist activity. This could result in an overall decrease in the demand for office space in these markets generally or in our properties in particular, which could increase vacancies in our properties or necessitate that we lease our properties on less favorable terms or both. In addition, future terrorist attacks in these markets could directly or indirectly damage our properties, both physically and financially, or cause losses that materially exceed our insurance coverage. As a result of the foregoing, our ability to generate revenues and the value of our properties could decline materially.
Some of our properties are concentrated in regions that are particularly susceptible to extreme weather or natural disasters.
Certain of our properties are located in geographical areas, such as Florida and Texas, that are regularly impacted by extreme weather and natural disasters, including, but not limited to, earthquakes, winds, floods, hurricanes, and fires. Natural
15
disasters in these areas may cause damage to our properties beyond the scope of our insurance coverage, thus requiring us to make substantial expenditures to repair these properties and resulting in a loss of revenues from these properties. Further, several of these properties are located near the coast and are exposed to more severe weather than our properties located inland. Elements such as salt water and humidity in these areas can increase or accelerate wear on the properties’ weatherproofing and mechanical, electrical, and other systems, and cause mold issues over time. As a result, we may incur operating costs and expenditures for capital improvements at these properties in excess of those normally anticipated.
We face possible risks associated with the physical effects of climate change.
We cannot predict the rate at which climate change will progress. However, the physical effects of climate change could have a material adverse effect on our properties, operations, and business. To the extent that climate change impacts changes in weather patterns, some of our properties could experience increases in storm intensity and rising sea levels. Over time, these conditions could result in declining demand for space at our properties or result in our inability to operate the buildings at all. Climate change may also have indirect effects on our business by increasing the cost of, or availability of, property insurance on terms we find acceptable, increasing the cost of energy, and increasing the cost of snow removal at our properties. There can be no assurance that climate change will not have a material adverse effect on our properties, operations, or business.
Security breaches through cyber-attacks, cyber-intrusions, or otherwise, could disrupt our IT networks and related systems.
Risks associated with security breaches, whether through cyber-attacks or cyber-intrusions over the Internet, malware, computer viruses, attachments to e-mails, or otherwise, against persons inside our organization, persons with access to systems inside our organization, the U.S. government, financial markets or institutions, or major businesses, including tenants, could disrupt or disable networks and related systems, other critical infrastructures, and the normal operation of business. The risk of a security breach or disruption, particularly through cyber-attack or cyber-intrusion, including by computer hackers, foreign governments, and cyber-terrorists, has generally increased as the number, intensity, and sophistication of attempted attacks and intrusions from around the world have increased. Even though we may not be specifically targeted, cyber-attacks on the U.S. government, financial markets, financial institutions, or other major businesses, including tenants, could disrupt our normal business operations and networks, which may in turn have a material adverse impact on our financial condition and results of operations.
IT networks and related systems are essential to the operation of our business and our ability to perform day-to-day operations. They also may be critical to the operations of certain of our tenants. Although we believe we will be able to maintain the security and integrity of these types of networks and related systems, or implement various measures to manage the risk of a security breach or disruption, there can be no assurance that our security efforts and measures will be effective or that attempted security breaches or disruptions would not be successful or damaging. Even the most well protected information, networks, systems, and facilities remain potentially vulnerable because the techniques used in such attempted security breaches evolve and generally are not recognized until launched against a target, and in some cases are designed not to be detected and, in fact, may not be detected. While, to date, we are not aware that we have experienced any significant cyber-attacks or cyber-intrusions, we may not be able to anticipate or implement adequate security barriers or other preventive measures. A security breach or other significant disruption involving our IT networks and related systems could:
• | disrupt the proper functioning of our networks and systems and therefore our operations and/or those of certain of our tenants; |
• | result in misstated financial reports, violations of loan covenants, missed reporting deadlines, and/or missed permitting deadlines; |
• | result in our inability to properly monitor our compliance with the rules and regulations regarding our qualification as a REIT; |
• | result in the unauthorized access to, and destruction, loss, theft, misappropriation, or release of proprietary, confidential, sensitive, or otherwise valuable information of ours or others, which others could use to compete against us or for disruptive, destructive, or otherwise harmful purposes and outcomes; |
• | result in our inability to maintain the building systems relied upon by our tenants for the efficient use of their leased space; |
• | require significant management attention and resources to remedy any damages that result; |
16
• | subject us to claims for breach of contract, damages, credits, penalties, or termination of leases or other agreements; or |
• | damage our reputation among our tenants and stockholders generally. |
Any or all of the foregoing could have a material adverse effect on our results of operations, financial condition, and cash flows.
The cost of complying with environmental and other governmental laws and regulations may adversely affect us, and we may become subject to liability relating to environmental matters.
All real property and the operations conducted on real property are subject to federal, state, and local laws and regulations relating to environmental protection and human health and safety. These laws and regulations generally govern wastewater discharges, air emissions, the operation and removal of underground and above-ground storage tanks, the use, storage, treatment, transportation, and disposal of solid and hazardous materials, and the remediation of contamination associated with disposals. We also are required to comply with various local, state, and federal fire, health, life-safety, and similar regulations. Some of these laws and regulations may impose joint and several liability on tenants or owners for the costs of investigating or remediating contaminated properties. These laws and regulations often impose liability whether or not the owner knew of, or was responsible for, the presence of the hazardous or toxic substances. The cost of removing or remediating could be substantial. In addition, the presence of these substances, or the failure to properly remediate these substances, may adversely affect our ability to sell or rent a property or to use the property as collateral for borrowing.
Environmental laws and regulations also may impose restrictions on the manner in which properties may be used or businesses may be operated, and these restrictions may require substantial expenditures by us. Environmental laws and regulations provide for sanctions in the event of noncompliance and may be enforced by governmental agencies or, in certain circumstances, by private parties. Third parties may seek recovery from owners of real properties for personal injury or property damage associated with exposure to released hazardous substances. Compliance with new or more stringent laws or regulations or stricter interpretations of existing laws may require material expenditures by us. For example, various federal, state, and local laws and regulations have been implemented or are under consideration to mitigate the effects of climate change caused by greenhouse gas emissions. Among other things, “green” building codes may seek to reduce emissions through the imposition of standards for design, construction materials, water and energy usage and efficiency, and waste management. We are not aware of any such existing requirements that we believe will have a material impact on our current operations. However, future requirements could increase the costs of maintaining or improving our existing properties or developing new properties.
Our costs associated with complying with the Americans with Disabilities Act may affect cash available for our operations, to pay distributions, or to make additional investments.
Our real properties are generally subject to the Americans with Disabilities Act of 1990, as amended (the “Act”). Under the Act, all places of public accommodation are required to comply with federal requirements related to access and use by disabled persons. The Act has separate compliance requirements for “public accommodations” and “commercial facilities” generally requiring that buildings and services be made accessible and available to people with disabilities. The Act’s requirements could require removal of access barriers and could result in the imposition of injunctive relief, monetary penalties or, in some cases, an award of damages. We attempt to acquire properties that comply with the Act or any relevant law or regulation of a foreign jurisdiction or place the burden on the seller or other third party, such as a tenant, to ensure compliance with those laws or regulations. However, we cannot assure you that we will be able to acquire properties or allocate responsibilities in this manner.
We may from time to time be subject to litigation that may negatively impact our cash flow, financial condition, results of operations and market price of our common stock.
We may from time to time be a defendant in lawsuits and regulatory proceedings relating to our business. Such litigation and proceedings may result in defense costs, settlements, fines, or judgments against us, some of which may not be covered by insurance. Due to the inherent uncertainties of litigation and regulatory proceedings, we cannot accurately predict the ultimate outcome of any such litigation or proceedings. An unfavorable outcome could negatively impact our cash flow, financial condition, results of operations and trading price of our common stock. In addition, certain litigation or the resolution of certain litigation may affect the availability or cost of some of our insurance coverage, which could adversely impact our results of operations and cash flow, expose us to increased risks that would be uninsured, and/or adversely impact our ability to attract officers and directors.
17
We may be subject to other possible liabilities.
Our properties may be subject to other risks related to current or future laws, including laws benefiting disabled persons, state or local laws relating to zoning, construction, fire and life safety requirements, and other matters. These laws may require significant property modifications in the future and could result in the levy of fines against us. In addition, although we believe that we adequately insure our properties, we are subject to the risk that our insurance may not cover all of the costs to restore a property that is damaged by a fire or other catastrophic events, including acts of war or, as mentioned above, terrorism.
Our failure to maintain effective internal control over financial reporting could have a material adverse effect on our business and our operating results.
Section 404 of the Sarbanes-Oxley Act of 2002 requires annual management assessments of the effectiveness of our internal control over financial reporting. If we fail to maintain the adequacy of our internal control over financial reporting, as such standards may be modified, supplemented or amended from time to time, we may be required to disclose such failure and our financial reporting may not be relied on by most stockholders. Moreover, effective internal control, particularly related to revenue recognition, is necessary for us to produce reliable financial reports and to maintain our qualification as a REIT and is important in helping prevent financial fraud. If we cannot provide reliable financial reports or prevent fraud, our business and operating results could be harmed, our REIT qualification could be jeopardized, and stockholders could lose confidence in our reported financial information.
Risks Related to Financing
Our borrowings may increase our business risks.
Principal and interest payments reduce cash that would otherwise be available for other purposes. Further, incurring mortgage debt increases the risk of loss because (1) loss in investment value is generally borne entirely by the borrower until such time as the investment value declines below the principal balance of the associated debt and (2) defaults on indebtedness secured by a property may result in foreclosure actions initiated by lenders and our loss of the property securing the loan that is in default. We have experienced defaults resulting in our having to transfer properties to the respective lenders, and may do so again if our asset values do not support the underlying loans. For federal income tax purposes, a foreclosure generally is treated as a sale of the property for a purchase price equal to the outstanding balance of the debt secured by the mortgage. If the outstanding balance of the debt secured by the mortgage exceeds our tax basis in the property, we would recognize taxable income on foreclosure, but would not receive any cash proceeds. From time to time, we provide full or partial guarantees to lenders of mortgage debt to our indirect subsidiaries that own our properties. When we guarantee debt on behalf of an entity that owns one of our properties, we are thus responsible to the lender for satisfaction of the debt if it is not paid by the entity. To date, we have not been required to fund any of the guarantees that we have provided. If any mortgages contain cross-collateralization or cross-default provisions there is a risk that more than one real property may be affected by a default.
We may not be able to refinance or repay our indebtedness.
We may not be able to refinance or repay our existing indebtedness. Previously, we have faced significant challenges refinancing our debt due to (1) the reduced value of our real estate assets; (2) limited cash flow from operating activities; (3) our debt level; (4) the cost and terms of new or refinanced indebtedness; and (5) material changes in lending parameters, including lower loan-to-value ratios.
Failure to refinance or extend our debt as it comes due or a failure to satisfy the conditions and requirements of that debt would likely result in an event of default and potentially the loss of the property or properties securing the debt. We have experienced defaults or events of default on previous indebtedness, which has required us to either restructure the debt in a way that is supported by the underlying values of the property or properties collateralizing the debt or to purchase or pay off the debt at a discount. In certain instances, we were unable to repay or restructure our indebtedness, or to purchase or pay it off at a discount, and the lender accelerated the debt and/or foreclosed on the property or properties securing the debt. We have experienced this result with several properties where we ultimately allowed the lender to foreclose or transferred the underlying properties to the lender pursuant to deeds-in-lieu of foreclosure, thus losing our entire investment in these properties.
18
Existing loan agreements contain, and future financing arrangements will likely contain, restrictive covenants relating to our operations.
We are subject to certain restrictions pursuant to the restrictive covenants of our outstanding indebtedness, which may affect our distribution and operating policies and our ability to incur additional debt. Our credit facility, for example, restricts us from paying any distributions, other than as required to maintain our REIT qualification, in excess of 95% of funds from operations as defined by National Association of Real Estate Investment Trusts (“NAREIT”). In addition, a breach of the financial and operating covenants in our debt agreements, including our credit facility agreement, could cause a default and accelerate payment under these agreements which could have a material adverse effect on our results of operations and financial condition. Specifically, violating the covenants contained in our credit facility agreement would likely result in us incurring higher finance costs and fees or an acceleration of the maturity date of advances under the credit facility agreement.
Interest-only indebtedness may increase our risk of default.
We have obtained, and continue to incur interest on interest-only mortgage indebtedness. Of our approximately $1.1 billion of outstanding debt as of December 31, 2015, approximately $779.6 million currently requires interest only payments. During the interest-only period the amount of each scheduled payment is less than that of a traditional amortizing mortgage loan, and the principal balance of the mortgage loan is not being reduced (except in the case of prepayments) because there are no scheduled monthly payments of principal during this period. After the interest-only period we will be required either to make scheduled payments of principal and interest or to make a lump-sum or “balloon” payment at maturity. These required monthly or balloon principal payments will increase the amount of our scheduled payments and may increase our risk of default under the related mortgage loan and will otherwise reduce the funds available for other purposes, including funding capital expenditures or any future distributions to our stockholders.
Increases in interest rates could increase the amount of our debt payments.
As of December 31, 2015, we had approximately $720.8 million of debt that bears interest at a variable rate. Approximately $525.0 million of this variable rate debt has been effectively fixed through the use of interest rate swaps. Thus, we are potentially exposed to increases in costs in a rising interest rate environment. Increased payments will reduce the funds available for other purposes including funding capital expenditures or distributions to our stockholders. In addition, if rising interest rates cause us to need additional capital to repay indebtedness, we may be forced to sell one or more of our properties or investments in real estate at times which may result in losses, or not permit us to realize the return on the investments we would have otherwise realized.
To hedge against interest rate fluctuations, we may use derivative financial instruments, which will subject us to various risks.
From time to time we may use derivative financial instruments to hedge exposures to changes in interest rates on loans secured by our assets and investments in collateralized mortgage-backed securities. Derivative instruments include interest rate swap contracts, interest rate cap or floor contracts, futures or forward contracts, options, or repurchase agreements. Our actual hedging decisions are determined in light of the facts and circumstances existing at the time of the hedge and may differ from time to time. There is no assurance that our hedging activities will have a positive impact on our results of operations or financial condition. We might be subject to costs, such as transaction fees or breakage costs, if we terminate these arrangements.
To the extent that we use derivative financial instruments to hedge against interest rate fluctuations, we are exposed to credit risk, basis risk, and legal enforceability risks. In this context, credit risk is the failure of the counterparty to perform under the terms of the derivative contract. If the fair value of a derivative contract is positive, the counterparty owes us, which creates credit risk for us. Basis risk occurs when the index upon which the contract is based is more or less variable than the index upon which the hedged asset or liability is based, thereby making the hedge less effective. Finally, legal enforceability risks encompass general contractual risks including the risk that the counterparty will breach the terms of, or fail to perform its obligations under, the derivative contract, particularly in light of current market conditions. Further, the REIT provisions of the Code may limit our ability to hedge the risks inherent to our operations. We may be unable to manage these risks effectively.
We may enter into derivative contracts that could expose us to contingent liabilities in the future.
Derivative financial instruments may require us to fund cash payments upon the early termination of a derivative agreement caused by an event of default or other early termination event. The amount due would be equal to the unrealized loss of the open swap positions with the respective counterparty and could also include other fees and charges. In addition, some of these derivative arrangements may require that we maintain specified percentages of cash collateral with the counterparty to fund potential liabilities under the derivative contract. We may have to make cash payments in order to maintain the required
19
percentage of collateral with the counterparty. These economic losses would be reflected in our results of operations, and our ability to fund these obligations would depend on the liquidity of our respective assets and access to capital at the time.
Volatility in the financial markets and challenging economic conditions could adversely affect our ability to obtain debt financing on attractive terms and our ability to service any future indebtedness that we may incur.
If the overall cost of borrowing increases, either by increases in the index rates or by increases in lender spreads, the increased cost may result in future refinancing or acquisitions generating lower overall economic returns. Disruptions in the debt markets negatively impact our ability to borrow monies to finance the purchase of, or other activities related to, real estate assets. We may not be able to borrow monies on terms and conditions that we find acceptable or at all. In addition, we may find it costly to refinance indebtedness which is maturing.
Further, economic conditions could negatively impact commercial real estate fundamentals and may cause declines in our occupancy and rental rates as well as in the overall value of our real estate assets.
Risks Related to Our Common Stock
There is no assurance that an active market will develop and be sustained for our shares of common stock or regarding the prices at which our shares may trade.
Our shares of common stock were listed on the NYSE on July 23, 2015. Listing on the NYSE does not ensure that an active market will develop for our common stock. It is possible that the daily trading volumes for our common stock may be relatively small compared to other publicly traded securities. Accordingly, no assurance can be given as to (1) the likelihood that an active market for the stock will develop and be sustained, (2) the liquidity of any such market, (3) the ability of our stockholders to sell their common stock or (4) the price that our stockholders may obtain for their common stock. Even if an active trading market develops, the market price of our common stock may be highly volatile and could be subject to wide fluctuations. We cannot predict the prices at which our shares will trade.
Because we have a large number of stockholders and our common stock was not listed on a national securities exchange prior to July 23, 2015, there may be significant pent-up demand to sell our shares. Significant sales of our common stock, or the perception that significant sales of such shares could occur, may cause the market price of our common stock to decline significantly.
Prior to July 23, 2015, our common stock was not listed on any national securities exchange, and the ability of stockholders to liquidate their investments was limited. A large volume of sales of shares of our common stock could decrease the prevailing market price of our common stock and could impair our ability to raise additional capital through the sale of equity securities in the future. Even if a substantial number of sales of our shares are not affected, the mere perception of the possibility of these sales could depress the market price of our common stock and have a negative effect on our ability to raise capital in the future. In addition, anticipated downward pressure on our common stock price due to actual or anticipated sales of common stock from this market overhang could cause some institutions or individuals to engage in short sales of our common stock, which may itself cause the market price of our common stock to decline.
The market price and trading volume of our common stock may be volatile.
The trading price of our common stock may be volatile. In addition, the trading volume in our common stock may fluctuate and cause significant price variations to occur. Some of the factors that could negatively affect our share price or result in fluctuations in the price or trading volume of our common stock include:
• | actual or anticipated variations in our quarterly operating results or dividends; |
• | changes in our earnings estimates; |
• | publication of research reports about us or the real estate industry; |
• | increases in market interest rates that lead purchasers of our shares to demand a higher yield; |
• | changes in market valuations of similar companies; |
20
• | adverse market reaction to any additional debt we incur in the future; |
• | additions or departures of key management personnel; |
• | actions by institutional stockholders; |
• | speculation in the press or investment community; |
• | the realization of any of the other risk factors presented in this Annual Report on Form 10-K or in our other public filings; |
• | the extent of investor interest in our securities; |
• | the general reputation of REITs and the attractiveness of our equity securities in comparison to other equity securities, including securities issued by other real estate based companies; |
• | our underlying asset value; |
• | investor confidence in the stock and bond markets generally; |
• | changes in tax laws; |
• | future equity issuances or the perception that such equity issuances may occur; |
• | failure to meet earnings estimates; |
• | failure to maintain our status as a REIT; and |
• | general market and economic conditions. |
The availability, timing, and amount of any cash distributions are uncertain.
Our board of directors reinstated quarterly cash distributions beginning in the second quarter of 2015, at $0.18 per share per quarter, and authorized cash distributions in the same amount for each of the third and fourth quarters of 2015. We anticipate that the board of directors will continue to consider authorizing a quarterly distribution payable from cash anticipated to be provided by operations. We can provide no assurance, however, regarding the availability, timing, or amount of any cash distributions. Distributions are authorized at the discretion of our board of directors based on its analysis of our forthcoming cash needs, earnings, cash flow, anticipated cash flow, capital expenditure requirements, cash on hand, general financial condition, and other factors that our board deems relevant. Our board also considers the requirements necessary to maintain our REIT status under the Code.
Risks Related to Our Organization and Structure
Stockholders have limited control over changes in our policies and operations, and our investment and business strategies and objectives may not be successful.
Our board of directors determines our major policies, including those regarding investment and business policies and strategies, financing, growth, debt capitalization, REIT qualification, and distributions. Our board of directors may amend or revise certain of these and other policies without a vote of the stockholders. In addition, there is no assurance that we will be able to successfully implement our investment or business strategies, including our strategies and objectives for 2016.
Your percentage interest in TIER REIT, Inc. will be reduced if we issue additional shares.
Existing stockholders do not have preemptive rights to any shares issued by us in the future. Our charter currently has authorized 400,000,000 shares of capital stock of which 382,499,000 shares are designated as common stock, 1,000 shares are designated as convertible stock, 17,490,000 shares are designated as preferred stock, and 10,000 shares are designated as Series A Convertible Preferred Stock. Subject to any preferential rights in favor of any class of preferred stock, our board of directors may increase the number of authorized shares of capital stock that we have the authority to issue or increase or decrease the number of shares of equity stock of any class or series of stock designated. Shares may be issued in the discretion of our board
21
of directors. The percentage of our outstanding shares owned by stockholders at the time of any issuance will likely be reduced if we (1) issue or sell additional shares of our common stock in the future; (2) sell securities that are convertible into shares of our common stock; (3) issue shares of our common stock in a private offering of securities; (4) issue shares of our common stock upon the conversion of the Series A Convertible Preferred Stock; (5) issue shares of our common stock upon the exercise of the options granted to our independent directors or upon issuance of restricted stock or other awards under our 2015 Equity Incentive Plan or our 2005 Incentive Award Plan to our independent directors, employees, or consultants; or (6) issue shares of our common stock to sellers of properties acquired by us in connection with an exchange of limited partnership interests of Tier OP. In addition, the partnership agreement for Tier OP contains provisions that would allow, under certain circumstances, other entities to merge into, or cause the exchange or conversion of their interest for interests of, Tier OP. Because the limited partnership interests of Tier OP may be exchanged for shares of our common stock, any merger, exchange or conversion between Tier OP and another entity ultimately could result in the issuance of a substantial number of shares of our common stock, therefore reducing the number of outstanding shares owned by our other stockholders. Further, our board of directors could authorize the issuance of stock with terms and conditions that subordinate the rights of the current holders of our common stock or have the effect of delaying, deferring, or preventing a change in control of us, including an extraordinary transaction (such as a merger, tender offer, or sale of all or substantially all of our assets) that might provide a liquidity event for our stockholders.
A limit on the number of shares a person may own may discourage a takeover.
Our charter, with certain exceptions, authorizes our board of directors to take such actions as are necessary and desirable to preserve our qualification as a REIT. Unless exempted by our board of directors, no person or group may own more than 9.8% of our outstanding common or preferred stock, in value or number of shares, whichever is more restrictive. This restriction may have the effect of delaying, deferring, or preventing a change in control of us, including an extraordinary transaction (such as a merger, tender offer, or sale of all or substantially all of our assets) that might otherwise provide stockholders with a liquidity event.
Maryland law prohibits certain business combinations, which may make it more difficult for us to be acquired.
Under Maryland law, “business combinations” between a Maryland corporation and an interested stockholder or an affiliate of an interested stockholder are prohibited for five years after the most recent date on which the holder becomes an “interested stockholder.” These business combinations include a merger, consolidation, share exchange or, in circumstances specified in the statute, an asset transfer or issuance or reclassification of equity securities. An “interested stockholder” is defined as:
• | any person who beneficially owns 10% or more of the voting power of the then outstanding voting stock of the corporation; or |
• | an affiliate or associate of the corporation who, at any time within the two-year period prior to the date in question, was the beneficial owner of 10% or more of the voting power of the then outstanding voting stock of the corporation. |
A person is not an interested stockholder under the statute if our board of directors approved, in advance, the transaction by which the person otherwise would have become an interested stockholder. However, in approving a transaction, our board may condition its approval on compliance, at or after the time of approval, with any terms and conditions determined by the board.
After the expiration of the five-year period described above, any business combination between the Maryland corporation and an interested stockholder generally must be recommended by the board of directors of the corporation and approved by the affirmative vote of at least:
• | 80% of the votes entitled to be cast by holders of the then outstanding shares of voting stock of the corporation; and |
• | two-thirds of the votes entitled to be cast by holders of voting stock of the corporation other than shares held by the interested stockholder with whom or with whose affiliate the business combination is to be effected or held by an affiliate or associate of the interested stockholder. |
These super-majority voting requirements do not apply if the corporation’s common stockholders receive a minimum price, as defined under Maryland law, for their shares in the form of cash or other consideration in the same form as previously paid by the interested stockholder for its shares. Maryland law also permits various exemptions from these provisions, including business combinations that are exempted by the board of directors before the time that the interested stockholder becomes an
22
interested stockholder. The business combination statute may discourage others from trying to acquire control of us and increase the difficulty of consummating any offer.
Maryland law limits the ability of a third party to buy a large stake in us and exercise voting power in electing directors.
Maryland law contains a second statute that may also have an anti-takeover effect. This statute, known as the Control Share Acquisition Act, provides that persons or entities owning “control shares” of a Maryland corporation acquired in a “control share acquisition” have no voting rights with respect to those shares except to the extent approved by a vote of two-thirds of the corporation’s disinterested stockholders. Shares of stock owned by the acquirer, by officers, or by employees who are directors of the corporation, are not considered disinterested for these purposes. “Control shares” are shares of stock that, taken together with all other shares of stock the acquirer previously acquired, would entitle the acquirer to exercise voting power in electing directors within one of the following ranges of voting power:
• | one-tenth or more but less than one-third of all voting power; |
• | one-third or more but less than a majority of all voting power; or |
• | a majority or more of all voting power. |
Control shares do not include shares of stock the acquiring person is entitled to vote as a result of having previously obtained stockholder approval. A “control share acquisition” means the acquisition of control shares, subject to certain exceptions. The Control Share Acquisition Act does not apply to (1) shares acquired in a merger, consolidation or share exchange if the corporation is a party to the transaction or (2) acquisitions approved or exempted by our charter or bylaws. Our bylaws exempt any acquisition by any person of shares of our common stock from the Control Share Acquisition Act.
Our rights, and the rights of our stockholders, to recover claims against our officers and directors are limited.
Maryland law provides that a director or officer has no liability in that capacity if he or she performs his or her duties in good faith, in a manner he or she reasonably believes to be in our best interest and with the care that an ordinarily prudent person in a like position would use under similar circumstances. Our charter eliminates our directors’ and officers’ liability to us and our stockholders for money damages except for liability resulting from actual receipt of an improper benefit or profit in money, property, or services or active and deliberate dishonesty established by a final judgment and which is material to the cause of action. Our charter and bylaws require us to indemnify our directors and officers to the maximum extent permitted by Maryland law for any claim or liability to which they may become subject or which they may incur by reason of their service as directors or officers, except to the extent that the act or omission of the director or officer was material to the matter giving rise to the proceeding and was committed in bad faith or was the result of active and deliberate dishonesty, the director or officer actually received an improper personal benefit in money, property, or services, or, in the case of any criminal proceeding, the director or officer had reasonable cause to believe that the act or omission was unlawful. As a result, we and our stockholders may have more limited rights against our directors and officers than might otherwise exist under common law, which could reduce our and our stockholders’ recovery from these persons if they act in a negligent or grossly negligent manner. In addition, we may be obligated to fund the defense costs incurred by our officers and directors in some cases.
Federal Income Tax Risks
Failure to qualify as a REIT would adversely affect our operations and our ability to make distributions.
We elected to be taxed as a REIT commencing with our 2004 tax year. In order for us to remain qualified as a REIT, we must satisfy certain requirements set forth in the Code and maintain other facts and circumstances that are not entirely within our control.
Our qualification as a REIT depends upon our ability to meet, through investments, actual operating results, distributions, and satisfaction of specific stockholder rules, the various tests imposed by the Code. While we intend to structure our activities in a manner designed to satisfy all of these requirements, we cannot assure you that we will satisfy the REIT requirements in the future because qualification as a REIT involves the application of highly technical and complex provisions of the Code as to which there are only limited judicial and administrative interpretations and involves the determination of facts and circumstances not entirely within our control. In addition, new legislation, new regulations, administrative interpretations, or court decisions could significantly change the tax laws with respect to qualifying as a REIT or the federal income tax consequences of qualifying as a REIT. In the future, we may determine that it is in our best interests to hold one or more of our properties through one or
23
more subsidiaries that elect to be taxed as REITs. If any of these subsidiaries fail to qualify as a REIT for federal income tax purposes, then we may also fail to qualify as a REIT for federal income tax purposes.
If we fail to qualify as a REIT for any taxable year, then unless certain relief provisions apply, we will face serious tax consequences that could substantially reduce the funds available for payment of distributions for each of the years involved because:
• | we would not be allowed to deduct distributions paid to stockholders when computing our taxable income and we would no longer be required to make distributions to our stockholders; |
• | we would be subject to federal income tax (including any applicable alternative minimum tax) on our taxable income at regular corporate rates; |
• | we would become subject to additional state income tax provisions and owe greater amounts of state income tax on our taxable income; |
• | we would be disqualified from being taxed as a REIT for the four years following the year during which we failed to qualify, unless entitled to relief under certain statutory provisions; and |
• | we may be required to borrow additional funds during unfavorable market conditions or sell some of our assets in order to pay corporate tax obligations. |
If we fail to qualify as a REIT but are eligible for certain relief provisions then we may retain our status as a REIT but may be required to pay a penalty tax, which could be substantial.
Our investment strategy may cause us to incur penalty taxes, lose our REIT status, or own and sell properties through taxable
REIT subsidiaries, each of which would diminish the return to our stockholders.
It is possible that one or more sales of our properties may be “prohibited transactions” under provisions of the Code. If we are deemed to have engaged in a “prohibited transaction” (i.e., we sell a property held primarily for sale to customers in the ordinary course of business), all profit that we derive from such sale would be subject to a 100% penalty tax. While the Code sets forth a safe harbor for REITs that wish to sell property without risking the imposition of the 100% penalty tax, we cannot assure you that we can in all cases comply with the safe harbor or that we will avoid owning property that may be characterized as held primarily for sale to customers in the ordinary course of business.
Alternatively, if we dispose of property through a taxable REIT subsidiary (“TRS”), then such a sale may not be treated as a prohibited transaction. However, there may be circumstances that prevent us from using a TRS in a transaction that does not qualify for the safe harbor or circumstances where it may not be clear whether the TRS or the REIT would be treated as the seller for U.S. federal income tax purposes. Additionally, even if it is possible to effect a property disposition through a TRS, we may decide to forgo the use of a TRS in a transaction that does not meet the safe harbor requirements based on our own internal analysis, the opinion of counsel, or the opinion of other tax advisors that the disposition should not be subject to the 100% penalty tax. In cases where a property disposition is not effected (or is not treated as being effected) through a TRS, the IRS might successfully assert that the disposition constitutes a prohibited transaction, in which event all of the net income from the sale of such property will be payable as a tax and none of the net proceeds from such sale will be available for investment by us or distribution to our stockholders. Moreover, we may then owe additional state income taxes.
Though a sale of the property by a TRS likely would eliminate the danger of the application of the 100% penalty tax, the TRS itself would be subject to tax at the federal level, and very likely at the state and local levels as well, on the gain realized by it from the sale of the property as well as on the income earned while the property is operated by the TRS. This tax obligation would diminish the amount of the proceeds from the sale of such property that would be distributable to our stockholders. As a result, the amount available for distribution to our stockholders would be substantially less than if the REIT had not operated and sold such property through the TRS and such transaction was not successfully characterized by the IRS as a prohibited transaction.
As a REIT, the value of the non-mortgage securities we hold in our TRSs generally may not exceed 25% of the total value of our assets at the end of any calendar quarter through December 31, 2017, and may not exceed 20% of the total value of our assets at the end of any calendar quarter thereafter. If the IRS were to determine that the value of our interests in all of our TRSs exceeded this limit at the end of any calendar quarter, then we would fail to qualify as a REIT. If we determine it to be in
24
our best interests to own a substantial number of our properties through one or more TRSs, then it is possible that the IRS may conclude that the value of our interests in our TRSs exceeds 25% or 20%, as applicable, of the value of our total assets at the end of any calendar quarter and therefore cause us to fail to qualify as a REIT. Additionally, as a REIT, no more than 25% of our gross income with respect to any year may, in general, be from sources other than certain real estate-related assets. Dividends paid to us from a TRS are typically considered to be non-real estate income. Therefore, we may fail to qualify as a REIT if dividends from all of our TRSs, when aggregated with all other non-real estate income with respect to any one year, are more than 25% of our gross income with respect to such year.
Certain fees paid to us may affect our REIT status.
Certain income received by us may not qualify as income from rental of real property for REIT qualification purposes and could be characterized by the IRS as non-qualifying income for purposes of satisfying the “income tests” required for REIT qualification. If any of our income were, in fact, treated as non-qualifying, and if the aggregate of such non-qualifying income in any taxable year ever exceeded 5% of our gross revenues for such year (or 5% of any REIT subsidiaries), we could lose our REIT status for that taxable year and the four taxable years following the year of losing our REIT status. In addition, if income from services we perform for our tenants is determined to be impermissible by the IRS and if that amount exceeds 1% of the property’s gross revenues, then all gross revenues from that property will be deemed non-qualifying income for purposes of the 5% amount mentioned above. For example, a property with $9.0 million of gross revenue that has $90,000 or more of impermissible tenant services would render all $9.0 million of gross revenue as non-qualifying income and thus could then cause us to lose our REIT status.
If any of our partnerships or limited liability companies are recharacterized by the IRS as taxable corporations, our REIT status would be threatened and the income of such entities would be subject to tax at corporate rates.
If any partnership, limited liability company, or other subsidiary entity that we intend to be classified as a partnership or disregarded entity for U.S. federal income tax purposes (including, without limitation, Tier OP and any underlying property owner) is recharacterized by the IRS as a taxable corporation, this may result in our losing REIT status. In addition, the entity would be subject to tax as a corporation, thereby reducing distributions from such entity we ultimately receive.
In certain circumstances, we may be subject to federal and state income taxes as a REIT which would reduce our cash available to pay distributions.
Even if we maintain our status as a REIT, we may yet become subject to federal income taxes and related state taxes. For example:
• | We are subject to tax on any undistributed income. We will be subject to a 4% nondeductible excise tax on the amount, if any, by which distributions we pay in any calendar year plus amounts retained for which federal income tax was paid are less than the sum of 85% of our ordinary income, 95% of our capital gain net income, and 100% of our undistributed income from prior years. |
• | If we have net income from the sale of foreclosure property that we hold primarily for sale to customers in the ordinary course of business or other non-qualifying income from foreclosure property, we must pay a tax on that income at the highest corporate income tax rate. |
• | If we sell a property, other than foreclosure property, that we hold primarily for sale to customers in the ordinary course of business, our gain would be subject to the 100% “prohibited transaction” tax. |
• | We will be subject to a 100% penalty tax on certain amounts if the economic arrangements between our tenants, our taxable REIT subsidiaries, and us are not comparable to similar arrangements among unrelated parties. |
• | State laws may change so as to begin taxing REITs. |
Legislative or regulatory action could adversely affect stockholders.
Changes to the tax laws are likely to occur, and these changes may adversely affect the taxation of a stockholder. Any such changes could have an adverse effect on an investment in our shares or on the market value or the resale potential of our assets.
25
The more favorable rates applicable to regular corporate dividends could cause certain non-corporate investors to perceive investments in REITs to be relatively less attractive than investments in the stock of non-REIT corporations that pay dividends, which could adversely affect the value of our stock. However, as a REIT, we generally would not be subject to federal or state corporate income taxes on that portion of our ordinary income or capital gain that we distribute currently to our stockholders, and we thus expect to avoid the “double taxation” to which other corporations are typically subject. Stockholders and potential investors should consult their own tax advisors regarding the applicable tax rates that apply to them.
It is possible that future legislation would result in a REIT having fewer tax advantages, and it could become more advantageous for a company that invests in real estate to elect to be taxed, for federal income tax purposes, as a corporation. As a result, our charter provides our board of directors with the power, under certain circumstances, to revoke or otherwise terminate our REIT election and cause us to be taxed as a corporation, without the vote of our stockholders. Our board of directors has fiduciary duties to us and our stockholders and could only cause such changes in our tax treatment if it determines in good faith that such changes are in the best interest of our stockholders.
We face possible state and local tax audits.
Because we are organized and qualify as a REIT, we are generally not subject to federal income taxes, but are subject to certain state and local taxes. In the normal course of business, certain entities through which we own real estate have undergone tax audits. In some instances there is no controlling precedent or interpretive guidance on the specific point at issue. Collectively, tax deficiency notices received to date have not been material. However, there can be no assurance that future audits will not occur with increased frequency or that the ultimate result of such audits will not have a material adverse effect on our financial condition and results of operations.
Item 1B. Unresolved Staff Comments.
None.
26
Item 2. Properties.
General
As of December 31, 2015, we owned interests in 34 operating office properties, two non-operating properties and one development property located in 15 markets located throughout the United States. As of December 31, 2015, the operating office properties are approximately 89.7% leased to tenants. In the aggregate, the operating office properties represent approximately 12.0 million rentable square feet. The average effective rent per square foot for the operating office properties is approximately $25.69 per square foot. Average effective rent per square foot represents 12 times the sum of (1) the monthly contractual amounts for base rent and (2) the pro rata 2015 budgeted operating expense reimbursements, each as of December 31, 2015, related to leases in place as of December 31, 2015, as reduced for free rent and excluding any scheduled future rent increases, divided by the total square footage under commenced leases as of December 31, 2015.
As of December 31, 2015, all of our properties were consolidated with and into the accounts of our operating partnership, except for five properties which are accounted for using the equity method. As of December 31, 2015, approximately 71% of our consolidated properties are encumbered by property debt.
The following information applies to all of our operating office properties:
• | we believe, although there can be no assurance that, all of our properties are adequately covered by insurance and suitable for their intended purposes; |
• | we have no current commitments for any material renovations, improvements, or development of our properties, except in accordance with planned budgets; |
• | our properties are located in markets where we are subject to competition in attracting new tenants and retaining current tenants; and |
• | depreciation and amortization are provided on a straight-line basis over the estimated useful lives of the buildings, improvement, and related assets. |
27
The following table presents certain additional information about our properties as of December 31, 2015:
Property Name | Location | Date Acquired | Approximate Rentable Square Footage (in thousands) | Approximate % Leased | Our Ownership Interest | Ownership Type | ||||||||||
Operating office properties | ||||||||||||||||
The Terrace Office Park | Austin, TX | 06/2006 | 619 | 92.4 | % | 100.00 | % | fee title | ||||||||
Domain 2 (1) | Austin, TX | 7/2015 | 115 | 100.0 | % | 49.84 | % | joint venture | ||||||||
Domain 3 | Austin, TX | 7/2015 | 179 | 100.0 | % | 100.00 | % | fee title | ||||||||
Domain 4 | Austin, TX | 7/2015 | 153 | 100.0 | % | 100.00 | % | fee title | ||||||||
Domain 7 (1) | Austin, TX | 7/2015 | 222 | 86.5 | % | 49.84 | % | joint venture | ||||||||
5950 Sherry Lane | Dallas, TX | 12/2014 | 197 | 81.2 | % | 100.00 | % | fee title | ||||||||
Burnett Plaza | Ft. Worth, TX | 02/2006 | 1,025 | 85.7 | % | 100.00 | % | fee title | ||||||||
Centreport Office Center | Ft. Worth, TX | 06/2007 | 133 | 100.0 | % | 100.00 | % | fee title | ||||||||
Loop Central | Houston, TX | 12/2007 | 575 | 95.0 | % | 100.00 | % | fee title | ||||||||
One & Two Eldridge Place | Houston, TX | 12/2006 | 519 | 95.4 | % | 100.00 | % | fee title | ||||||||
One BriarLake Plaza | Houston, TX | 09/2008 | 502 | 89.6 | % | 100.00 | % | fee title | ||||||||
Two BriarLake Plaza | Houston, TX | 12/2009-09/2014 | 333 | 67.9 | % | 100.00 | % | fee title | ||||||||
Three Eldridge Place | Houston, TX | 12/2006-11/2009 | 305 | 81.0 | % | 100.00 | % | fee title | ||||||||
Buena Vista Plaza | Burbank, CA | 07/2005 | 115 | 99.1 | % | 100.00 | % | fee title | ||||||||
Eisenhower I | Tampa, FL | 12/2007 | 130 | 100.0 | % | 100.00 | % | fee title | ||||||||
Bank of America Plaza | Charlotte, NC | 10/2006 | 891 | 87.8 | % | 100.00 | % | fee title | ||||||||
Plaza at MetroCenter | Nashville, TN | 12/2007 | 361 | 92.8 | % | 100.00 | % | fee title | ||||||||
FOUR40 | Chicago, IL | 11/2007 | 1,041 | 70.4 | % | 100.00 | % | fee title | ||||||||
Wanamaker Building (1) | Philadelphia, PA | 12/2007 | 1,390 | 98.0 | % | 60.00 | % | joint venture | ||||||||
Three Parkway | Philadelphia, PA | 10/2006 | 561 | 95.5 | % | 100.00 | % | fee title | ||||||||
1325 G Street (1) | Washington, D.C. | 11/2005 | 307 | 83.9 | % | 10.00 | % | joint venture | ||||||||
Colorado Building (1) | Washington, D.C. | 08/2004-12/2008 | 128 | 92.3 | % | 10.00 | % | joint venture | ||||||||
Forum Office Park | Louisville, KY | 12/2007 | 328 | 97.6 | % | 100.00 | % | fee title | ||||||||
Hurstbourne Place | Louisville, KY | 12/2007 | 235 | 91.1 | % | 100.00 | % | fee title | ||||||||
One Oxmoor Place | Louisville, KY | 12/2007 | 135 | 98.5 | % | 100.00 | % | fee title | ||||||||
Hurstbourne Park | Louisville, KY | 12/2007 | 104 | 99.0 | % | 100.00 | % | fee title | ||||||||
Steeplechase Place | Louisville, KY | 12/2007 | 77 | 90.9 | % | 100.00 | % | fee title | ||||||||
Lakeview | Louisville, KY | 12/2007 | 76 | 96.1 | % | 100.00 | % | fee title | ||||||||
Hunnington | Louisville, KY | 12/2007 | 62 | 82.3 | % | 100.00 | % | fee title | ||||||||
500 E. Pratt | Baltimore, MD | 12/2007 | 280 | 98.2 | % | 100.00 | % | leasehold | ||||||||
801 Thompson | Rockville, MD | 12/2007 | 51 | 100.0 | % | 100.00 | % | fee title | ||||||||
Lawson Commons | St. Paul, MN | 06/2005 | 436 | 96.6 | % | 100.00 | % | fee title | ||||||||
Woodcrest Corporate Center | Cherry Hill, NJ | 01/2006 | 333 | 90.4 | % | 100.00 | % | fee title | ||||||||
111 Woodcrest | Cherry Hill, NJ | 11/2007 | 53 | 84.9 | % | 100.00 | % | fee title | ||||||||
Total operating office properties | 11,971 | |||||||||||||||
Non-operating properties | ||||||||||||||||
Fifth Third Center (2) | Columbus, OH | 12/2007 | 331 | 69.3 | % | 100.00 | % | fee title | ||||||||
Hurstbourne Plaza (3) | Louisville, KY | 12/2007 | 79 | 50.2 | % | 100.00 | % | fee title | ||||||||
Total properties (4) | 12,381 | |||||||||||||||
____________
(1) This property is accounted for under the equity method.
(2) The loan on Fifth Third Center is currently in default and we are working with the lender to dispose of this office property on their behalf.
(3) Hurstbourne Plaza is a retail shopping center that we are no longer actively leasing due to our plans to redevelop this property.
(4) Excludes our 50% interest in Domain 8, a property under development.
28
Lease Expirations
The following table sets forth a 10-year schedule of the lease expirations for leases in place at our operating office properties as of December 31, 2015 (square footage and dollar amounts are in thousands):
Year of Lease Expiration | Number of Leases Expiring (1) | Rentable Square Feet | Annualized Base Rent (2) | Percentage of Rentable Square Feet | Percentage of Annualized Base Rent | ||||||
2016 | 123 | 861 | $20,976 | 8% | 7% | ||||||
2017 | 75 | 1,122 | $31,465 | 10% | 11% | ||||||
2018 | 59 | 580 | $17,757 | 5% | 6% | ||||||
2019 | 67 | 1,255 | $37,478 | 12% | 13% | ||||||
2020 | 60 | 1,081 | $31,482 | 10% | 11% | ||||||
2021 | 46 | 672 | $20,320 | 6% | 7% | ||||||
2022 | 31 | 787 | $26,509 | 7% | 9% | ||||||
2023 | 20 | 871 | $28,939 | 8% | 10% | ||||||
2024 | 10 | 491 | $18,193 | 5% | 6% | ||||||
2025 | 27 | 428 | $12,103 | 4% | 4% | ||||||
(1) | Leases with an expiration on the last day of the year are considered leased at the last day of the year (i.e., expiring on the first day of the following year.) |
(2) | Represents the cash rental rate of base rents, including tenant reimbursements, in the final month prior to the expiration multiplied by 12, without consideration of tenant contraction or termination rights. Tenant reimbursements generally include payment of real estate taxes, operating expenses, and common area maintenance and utility charges. |
Item 3. Legal Proceedings.
We are not currently party to, and none of our properties is currently subject to, any material legal proceedings. From time to time, we are a party to various claims and legal proceedings that arise in the ordinary course of business.
Item 4. Mine Safety Disclosures.
None.
29
PART II
Item 5. Market for Registrant’s Common Equity, Related Stockholder Matters and Issuer Purchases of Equity Securities.
Market Information
Our common stock is traded on the New York Stock Exchange (“NYSE”) under the symbol “TIER.” As of February 1, 2016, we had 47,746,829 shares of common stock outstanding, including 353,402 shares of restricted stock for which restrictions have not yet lapsed, held by a total of approximately 21,000 stockholders of record. The number of holders of record does not include individuals or entities that beneficially own shares that are held of record by a broker or clearing agency. We listed our stock on the NYSE on July 23, 2015, and began paying distributions on July 8, 2015. On February 1, 2016, the last reported sales price of our shares of common stock on the NYSE was $15.43. The following table sets forth the quarterly high and low sales price per share of common stock reported on the NYSE for the indicated periods and the distributions declared by us with respect to each such period.
Share Price High | Share Price Low | Distributions declared per share of common stock(1) | |||
Second Quarter 2015 | N/A | N/A | $0.18 | ||
Third Quarter 2015 | $19.50 | $13.60 | $0.18 | ||
Fourth Quarter 2015 | $16.82 | $14.07 | $0.18 | ||
________________
(1) | Distributions declared per share have been adjusted retroactively to reflect the impact of the one-for-six reverse stock split that was effected |
on June 2, 2015.
Distributions
We made an election to qualify as a REIT for federal income tax purposes commencing with our taxable year ended December 31, 2004. As a REIT, we must distribute at least 90% of our REIT taxable income to our stockholders annually. We have paid all or a portion of our previous distributions from cash on hand, borrowings, proceeds from the sale of assets, and the proceeds of our offerings. Our board of directors reinstated quarterly cash distributions in the second quarter of 2015 at $0.18 per share of common stock and authorized cash distributions in the same amount for each of the third and fourth quarters of 2015. Distributions declared for each quarter were paid in the subsequent quarter. Of the amounts distributed by us in 2015, 100% represented a return of capital. Distributions are authorized at the discretion of our board of directors based on its analysis of numerous factors, including but not limited to our forthcoming cash needs and our financial condition, and there is no assurance that distributions will continue or at any particular rate or timing. Further, we are subject to certain restrictions pursuant to covenants in connection with our outstanding indebtedness, which may affect our distribution policies and our ability to pay distributions.
Securities Authorized for Issuance under Equity Compensation Plans
The following table provides information regarding our equity compensation plans as of December 31, 2015:
Plan Category | Number of securities to be issued upon exercise of outstanding options, warrants and rights (1) | Weighted-average exercise price of outstanding options, warrants and rights (2) | Number of securities remaining available for future issuance under equity compensation plans | |||||
Equity compensation plans approved by security holders - 2015 Equity Incentive Plan | 18,597 | N/A | 2,481,403 | |||||
Equity compensation plans approved by security holders - 2005 Incentive Award Plan | 22,603 | $40.13 | — | |||||
Equity compensation plans not approved by security holders | N/A | N/A | N/A | |||||
Total | 41,200 | $40.13 | 2,481,403 | |||||
______________
(1) Includes restricted stock units issued to independent directors.
(2) | Restricted stock units are not included in the weighted-average exercise price calculation because there is no exercise price associated with restricted stock units. |
30
Share Performance Graph
The Securities and Exchange Commission (“SEC”) requires us to present a chart comparing the cumulative total shareholder return on our shares of common stock with the cumulative total shareholder return of (i) a broad equity index and (ii) a published industry or peer group index. The following chart compares the cumulative total shareholder return for the shares of common stock with the cumulative shareholder return of companies on (i) the S&P 500 Index (ii) the Russell 2000 Index and (iii) the SNL US REIT Equity Index as provided by SNL Financial for the period beginning July 23, 2015, (the date our shares of common stock were listed on the NYSE) and ending December 31, 2015, and assumes an investment of $100, with reinvestment of all distributions, has been made in shares of our common stock and in each index on July 23, 2015. The historical information set forth below is not necessarily indicative of future performance.
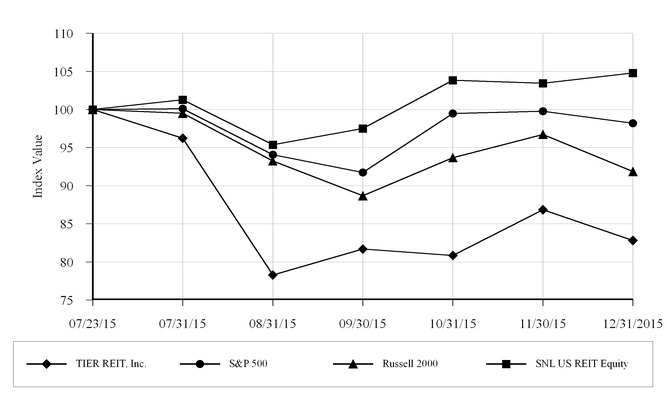
Period Ending | |||||||||||||||||||||
Index | 07/23/15 | 07/31/15 | 08/31/15 | 09/30/15 | 10/31/15 | 11/30/15 | 12/31/15 | ||||||||||||||
TIER REIT, Inc. | $ | 100.00 | $ | 96.22 | $ | 78.29 | $ | 81.68 | $ | 80.85 | $ | 86.84 | $ | 82.81 | |||||||
S&P 500 | $ | 100.00 | $ | 100.10 | $ | 94.06 | $ | 91.74 | $ | 99.47 | $ | 99.77 | $ | 98.20 | |||||||
Russell 2000 | $ | 100.00 | $ | 99.51 | $ | 93.26 | $ | 88.68 | $ | 93.68 | $ | 96.73 | $ | 91.87 | |||||||
SNL US REIT Equity | $ | 100.00 | $ | 101.28 | $ | 95.38 | $ | 97.50 | $ | 103.85 | $ | 103.45 | $ | 104.79 | |||||||
31
Unregistered Sales of Equity Securities and Use of Proceeds.
The following table includes information regarding purchases of our common stock made by us during the quarter ended December 31, 2015. These purchases represent the shares of common stock surrendered by employees to us to satisfy such employees’ minimum tax withholding obligations in connection with the lapse of restrictions on shares of restricted common stock.
Total number of shares purchased | Average price paid per share | Total number of shares purchased as part of publicly announced plans or programs | Maximum number of shares that may yet be purchased under the plans or programs | |||||
October 2015 | — | — | not applicable | not applicable | ||||
November 2015 | — | — | not applicable | not applicable | ||||
December 2015 | 64,397 | $15.31 | not applicable | not applicable | ||||
32
Item 6. Selected Financial Data.
The following data should be read in conjunction with our audited consolidated financial statements and the notes thereto and “Management’s Discussion and Analysis of Financial Condition and Results of Operations” appearing elsewhere in this Annual Report on Form 10-K. The selected historical consolidated financial data presented below has been derived from our audited consolidated financial statements (in thousands, except number of properties and per share amounts).
As of December 31 | 2015 | 2014 | 2013 | 2012 | 2011 | |||||||||||||||
Total assets | $ | 1,873,745 | $ | 2,211,183 | $ | 2,436,225 | $ | 3,125,294 | $ | 3,553,768 | ||||||||||
Notes payable | $ | 1,080,425 | $ | 1,194,085 | $ | 1,490,367 | $ | 2,107,380 | $ | 2,367,401 | ||||||||||
Other liabilities | 115,501 | 228,938 | 142,599 | 227,829 | 224,376 | |||||||||||||||
Series A Convertible Preferred Stock | 2,700 | 4,626 | 2,700 | 2,700 | — | |||||||||||||||
Stockholders’ equity | 673,617 | 782,589 | 799,732 | 781,757 | 955,692 | |||||||||||||||
Noncontrolling interests (1) | 1,502 | 945 | 827 | 5,628 | 6,299 | |||||||||||||||
Total liabilities and equity | $ | 1,873,745 | $ | 2,211,183 | $ | 2,436,225 | $ | 3,125,294 | $ | 3,553,768 | ||||||||||
Year Ended December 31 | 2015 | 2014 | 2013 | 2012 | 2011 | |||||||||||||||
Rental revenue | $ | 282,365 | $ | 288,067 | $ | 289,071 | $ | 296,701 | $ | 311,439 | ||||||||||
Loss from continuing operations before gain on sale or transfer of assets | (95,430 | ) | (74,855 | ) | (57,083 | ) | (163,114 | ) | (112,467 | ) | ||||||||||
Discontinued operations (2) | 16,790 | 59,327 | 56,964 | 2,670 | (70,793 | ) | ||||||||||||||
Gain on sale or transfer of assets | 44,477 | — | 16,102 | 8,083 | 1,385 | |||||||||||||||
Net income (loss) | (34,163 | ) | (15,528 | ) | 15,983 | (152,361 | ) | (181,875 | ) | |||||||||||
Noncontrolling interests in continuing operations | 159 | 132 | 60 | 227 | 286 | |||||||||||||||
Noncontrolling interests in discontinued operations | (30 | ) | (120 | ) | (491 | ) | 33 | 139 | ||||||||||||
Dilution (accretion) of Series A Convertible Preferred Stock | 1,926 | (1,926 | ) | — | — | — | ||||||||||||||
Net income (loss) attributable to common stockholders | $ | (32,108 | ) | $ | (17,442 | ) | $ | 15,552 | $ | (152,101 | ) | $ | (181,450 | ) | ||||||
Cash provided by (used in) operating activities | $ | (3,880 | ) | $ | 25,140 | $ | 45,151 | $ | 48,534 | $ | 2,363 | |||||||||
Cash provided by investing activities | $ | 224,854 | $ | 153,347 | $ | 454,446 | $ | 84,981 | $ | 129,040 | ||||||||||
Cash used in financing activities | $ | (240,168 | ) | $ | (204,831 | ) | $ | (451,557 | ) | $ | (135,842 | ) | $ | (258,469 | ) | |||||
Basic and diluted income (loss) per common share (3) | ||||||||||||||||||||
Continuing operations | $ | (1.00 | ) | $ | (1.54 | ) | $ | (0.82 | ) | $ | (3.11 | ) | $ | (2.24 | ) | |||||
Discontinued operations | 0.34 | 1.19 | 1.13 | 0.05 | (1.43 | ) | ||||||||||||||
Basic and diluted income (loss) per common share | $ | (0.66 | ) | $ | (0.35 | ) | $ | 0.31 | $ | (3.06 | ) | $ | (3.67 | ) | ||||||
Distributions declared to common stockholders per share (3) | $ | 0.54 | $ | — | $ | — | $ | 0.54 | $ | 0.60 | ||||||||||
Number of properties (4) | 36 | 37 | 38 | 50 | 57 | |||||||||||||||
Total rentable square feet (4) | 12,381 | 14,304 | 15,501 | 20,189 | 22,018 | |||||||||||||||
_________________
(1) | Noncontrolling interests reflects the proportionate interest not owned by us of certain of our real estate properties, limited partnership interest in Tier OP held by third parties, and vested restricted stock units. |
(2) | Effective January 1, 2015, we adopted the Financial Accounting Standards Board (“FASB”) guidance that changes the criteria for reporting a discontinued operation. This adoption impacts the comparability of our financial statements as disposals of individual operating properties generally no longer qualify as discontinued operations. |
(3) Amounts have been adjusted retroactively to reflect the one-for-six reverse stock split effected on June 2, 2015.
(4) | At December 31, 2015, we owned a 50% interest in a development property that is excluded from these numbers. At December 31, 2014, we owned a recently developed property that is excluded from these numbers, and we had three properties held for sale which are included in these numbers. |
33
Item 7. Management’s Discussion and Analysis of Financial Condition and Results of Operations.
The following discussion and analysis should be read in conjunction with the accompanying consolidated financial statements and the notes thereto.
Critical Accounting Policies and Estimates
Management’s discussion and analysis of financial condition and results of operations is based upon our consolidated financial statements, which have been prepared in accordance with GAAP. The preparation of these financial statements requires our management to make estimates and assumptions that affect the reported amount of assets, liabilities, revenues, and expenses, and related disclosure of contingent assets and liabilities. On a regular basis, we evaluate these estimates, including investment impairment. These estimates are based on management’s industry experience and on various other assumptions that are believed to be reasonable under the circumstances. Actual results may differ from these estimates. Below is a discussion of the accounting policies that we consider to be critical in that they may require complex judgment in their application or require estimates about matters that are inherently uncertain.
Real Estate
Upon the acquisition of real estate properties, we recognize the assets acquired, the liabilities assumed, and any noncontrolling interest as of the acquisition date, measured at their fair values. The acquisition date is the date on which we obtain control of the real estate property. The assets acquired and liabilities assumed may consist of land, inclusive of associated rights, buildings, assumed debt, identified intangible assets and liabilities, and asset retirement obligations. Identified intangible assets generally consist of above-market leases, in-place leases, in-place tenant improvements, in-place leasing commissions, and tenant relationships. Identified intangible liabilities generally consist of below-market leases. Goodwill is recognized as of the acquisition date and measured as the aggregate fair value of the consideration transferred and any noncontrolling interests in the acquiree over the fair value of the identifiable net assets acquired. Likewise, a bargain purchase gain is recognized in current earnings when the aggregate fair value of the consideration transferred and any noncontrolling interests in the acquiree is less than the fair value of the identifiable net assets acquired. Acquisition-related costs are expensed in the period incurred. Initial valuations are subject to change until our information is finalized, which is no later than twelve months from the acquisition date.
The fair value of the tangible assets acquired, consisting of land and buildings, is determined by valuing the property as if it were vacant, and the “as-if-vacant” value is then allocated to land and buildings. Land values are derived from appraisals or other relevant market information available to us, and building values are calculated as replacement cost less depreciation or management’s estimates of the fair value of these assets using discounted cash flow analyses or similar methods believed to be used by market participants. The value of buildings is depreciated over the estimated useful life of 25 years using the straight-line method.
We determine the fair value of assumed debt by calculating the net present value of the scheduled mortgage payments using interest rates for debt with similar terms and remaining maturities that management believes we could obtain at the date of the debt assumption. Any difference between the fair value and stated value of the assumed debt is recorded as a discount or premium and amortized over the remaining life of the loan using the effective interest method.
We determine the value of above-market and below-market leases for acquired properties based on the present value (using an interest rate that reflects the risks associated with the leases acquired) of the difference between (1) the contractual amounts to be paid pursuant to the in-place leases and (2) management’s estimate of current market lease rates for the corresponding in-place leases, measured over a period equal to (a) the remaining non-cancelable lease term for above-market leases, or (b) the remaining non-cancelable lease term plus any below-market fixed rate renewal options that, based on a qualitative assessment of several factors, including the financial condition of the lessee, the business conditions in the industry in which the lessee operates, the economic conditions in the area in which the property is located, and the ability of the lessee to sublease the property during the renewal term, are reasonably assured to be exercised by the lessee for below-market leases. We record the fair value of above-market and below-market leases as intangible assets or intangible liabilities, respectively, and amortize them as an adjustment to rental income over the determined lease term.
The total value of identified real estate intangible assets acquired is further allocated to in-place leases, in-place tenant improvements, in-place leasing commissions, and tenant relationships based on our evaluation of the specific characteristics of each tenant’s lease and our overall relationship with that respective tenant. The aggregate value for tenant improvements and leasing commissions is based on estimates of these costs incurred at inception of the acquired leases, amortized through the date of acquisition. The aggregate value of in-place leases acquired and tenant relationships is determined by applying a fair value
34
model. The estimates of fair value of in-place leases include an estimate of carrying costs during the expected lease-up periods for the respective spaces considering current market conditions. In estimating the carrying costs that would have otherwise been incurred had the leases not been in place, we include such items as real estate taxes, insurance, and other operating expenses, as well as lost rental revenue during the expected lease-up period based on current market conditions. The estimates of the fair value of tenant relationships also include costs to execute similar leases including leasing commissions, legal fees, and tenant improvements, as well as an estimate of the likelihood of renewal as determined by management on a tenant-by-tenant basis.
We amortize the value of in-place leases, in-place tenant improvements, and in-place leasing commissions to expense over the initial term of the respective leases. The tenant relationship values are amortized to expense over the initial term and any anticipated renewal periods, but in no event does the amortization period for intangible assets or liabilities exceed the remaining depreciable life of the building. Should a tenant terminate its lease, the unamortized portion of the acquired intangibles related to that tenant would be charged to expense.
In allocating the purchase price of each of our properties, management makes assumptions and uses various estimates, including, but not limited to, the estimated useful lives of the assets, the cost of replacing certain assets, discount rates used to determine present values, market rental rates per square foot, and the period required to lease the property up to its occupancy at acquisition as if it were vacant. Many of these estimates are obtained from independent third party appraisals. However, management is responsible for the source and use of these estimates. A change in these estimates and assumptions could result in the various categories of our real estate assets and/or related intangibles being overstated or understated which could result in an overstatement or understatement of depreciation and/or amortization expense and/or rental revenue. These variances could be material to our financial statements.
Impairment of Real Estate Related Assets
For our consolidated real estate assets, we monitor events and changes in circumstances indicating that the carrying amounts of the real estate assets may not be recoverable. When such events or changes in circumstances are present, we assess potential impairment by comparing estimated future undiscounted cash flows expected to be generated over the life of the asset including its eventual disposition, to the carrying amount of the asset. In the event that the carrying amount exceeds the estimated future undiscounted cash flows and also exceeds the fair value of the asset, we recognize an impairment loss to adjust the carrying amount of the asset to its estimated fair value. Our process to estimate the fair value of an asset involves using third-party broker valuation estimates, bona fide purchase offers, or the expected sales price of an executed sales agreement, which would be considered Level 1 or Level 2 assumptions within the fair value hierarchy. To the extent that this type of third-party information is unavailable, we estimate projected cash flows and a risk-adjusted rate of return that we believe would be used by a third party market participant in estimating the fair value of an asset. This is considered a Level 3 assumption within the fair value hierarchy. These projected cash flows are prepared internally by the Company’s asset management professionals and are updated quarterly to reflect in place and projected leasing activity, market revenue and expense growth rates, market capitalization rates, discount rates, and changes in economic and other relevant conditions. The Company’s Chief Financial Officer, Chief Investment Officer, and Chief Accounting Officer review these projected cash flows to assure that the valuation is prepared using reasonable inputs and assumptions which are consistent with market data or with assumptions that would be used by a third-party market participant and assume the highest and best use of the real estate investment. For the years ended December 31, 2015, 2014 and 2013 we recorded impairment charges of approximately $0.1 million, $13.2 million, and $4.9 million, respectively, related to the impairment of consolidated real estate assets, including discontinued operations. The impairment losses recorded were primarily related to assets assessed for impairment due to changes in management’s estimates of the intended hold period for certain of our properties.
For our unconsolidated real estate assets, at each reporting date we compare the estimated fair value of our investment to the carrying amount. An impairment charge is recorded to the extent the fair value of our investment is less than the carrying amount and the decline in value is determined to be other than a temporary decline. We had no impairment charges related to our investments in unconsolidated entities for the years ended December 31, 2015, 2014 and 2013.
In evaluating our investments for impairment, management makes several estimates and assumptions, including, but not limited to, the projected date of disposition and sales price for each property, the estimated future cash flows of each property during our estimated ownership period, and for unconsolidated investments, the estimated future distributions from the investment. A change in these estimates and assumptions could result in understating or overstating the carrying amount of our investments which could be material to our financial statements.
We undergo continuous evaluations of property level performance, credit market conditions and financing options. If our assumptions regarding the cash flows expected to result from the use and eventual disposition of our properties decrease or our expected hold periods decrease, we may incur future impairment charges on our real estate related assets. In addition, we may
35
incur impairment charges on assets classified as held for sale in the future if the carrying amount of the asset upon classification as held for sale exceeds the estimated fair value less costs to sell.
Overview
As of December 31, 2015, we owned interests in 34 operating office properties totaling approximately 12.0 million rentable square feet, two non-operating properties totaling approximately 410,000 square feet, and one development property. As of December 31, 2014, we owned interests in 37 operating office properties with approximately 14.3 million rentable square feet, including three properties held for sale at that time with approximately 1.2 million rentable square feet, and a development property with approximately 333,000 rentable square feet, which became operational in the fourth quarter of 2015.
As an owner of real estate, the majority of our income and cash flow is derived from rental revenue received pursuant to tenant leases for office space at our properties. While many real estate markets have generally stabilized since the pervasive and fundamental disruptions associated with the last recession that created extensive job losses and limited availability of credit to businesses, the financial markets have been volatile recently, and oil prices have declined dramatically over the past year. Further, performance in commercial office real estate is generally predicated on a sustained pattern of office-using job growth, and as a result of only modest annual growth and tenants focused on using less space per employee, it has trailed the general economy. The uncertainty about continued economic recovery has also impacted, and may continue to impact, our tenants’ businesses. For example, tenants may be reluctant to make long-term lease commitments. In the current economic climate, we continue to follow a disciplined approach to managing our operations.
2015 Developments
Listing on NYSE and Tender Offer
On July 23, 2015, we listed our shares of common stock on the NYSE under the ticker symbol “TIER.” We believe that listing our stock on the NYSE has positioned us to maximize stockholder value over the long term by giving us access to additional capital for future growth if and when we believe appropriate to do so and provides an opportunity for liquidity to those stockholders who may desire to sell their shares of common stock.
In connection with the NYSE listing, we commenced a modified “Dutch Auction” tender offer to purchase for cash up to $50.0 million of our shares of common stock. The tender offer expired on August 19, 2015, with 2,631,578 shares tendered and accepted at $19.00 per share. The aggregate purchase price of approximately $50.0 million for shares of common stock accepted for payment pursuant to the tender offer, and related fees and expenses, was funded from available cash and borrowings under our existing credit facility.
Reverse Stock Split
In preparation for listing shares of our common stock on the NYSE, we filed articles of amendment to our charter to effect a one-for-six reverse stock split of our existing shares of common stock on June 2, 2015. No fractional shares were issued in connection with the reverse stock split. Instead, each stockholder of record who held any fractional share of our common stock as of the close of business on June 2, 2015, received a cash payment for each fractional share held, which resulted in an aggregate payment to our stockholders holding fractional shares of approximately $0.8 million.
Review of 2015 Objectives
At the beginning of the year, we identified six key objectives for 2015: (1) dispose of properties outside target markets; (2) recycle capital into target markets; (3) strengthen the balance sheet; (4) increase portfolio occupancy; (5) internalize property management and administrative services; and (6) reinstate distributions. The following discussion describes our 2015 objectives and our activities in connection with these objectives.
Dispose of Properties Outside Target Markets
During 2015, we continued our efforts to sharpen our geographic focus by disposing of properties outside of our target markets. Since the beginning of 2009, we have exited 21 markets, and as a result of our efforts during 2015, we reduced our total markets from 18 to 15. During 2015, we sold approximately $550 million in properties and reduced our presence in three markets (Baltimore, Maryland; Philadelphia, Pennsylvania; and Washington, D.C.), exited two non-strategic markets (Cleveland, Ohio, and Worcester, Massachusetts), and exited one target market (Atlanta, Georgia) where we owned a non-controlling 10% interest in a property located outside of a TIER1 submarket.
36
Recycle Capital into Target Markets
During 2015, we identified opportunities to build scale in target markets and focused on best-in-class properties for long-term value creation. For example, in June 2015, we acquired interests in a ground lease and a land parcel to be used for future development, the first being located in the central business district of Austin, Texas, and the second located in the Legacy Town Center submarket of Plano, Texas (a suburb of Dallas). In July 2015, we acquired various interests in real estate, both existing operating properties and unimproved land, located in Austin, Texas (“The Domain”), which included two wholly-owned office buildings, interests in two additional office buildings, and various other tracts of land.
Strengthen the Balance Sheet
As of December 31, 2015, including our share of the debt maturing at our unconsolidated subsidiaries, we have approximately $212.7 million of debt maturing before the end of 2016, a reduction of approximately 67.5% from the approximately $654.4 million of debt that was scheduled to mature in 2016 as of December 31, 2014. Current interest rates for borrowings on commercial office properties are lower than the average interest rate of our debt maturing in the next two years, and with the potential for rising interest rates, one of our 2015 objectives was to mitigate a portion of the interest rate and refinancing risks associated with this debt. We were able to accomplish this objective for 2015 by (1) paying and pre-paying debt obligations in order to facilitate property dispositions and/or to secure new long-term financing, as we did by paying off approximately $290.9 million of debt that was scheduled to mature in 2015 (including our share of unconsolidated debt) and approximately $423.2 million of debt that was scheduled to mature in 2016, as well as securing a $275.0 million term loan that matures in June 2022; and (2) disposing of certain non-strategic properties and reducing our debt obligations, as described above.
Increase Portfolio Occupancy
Leasing was a key area of focus for us during 2015 as we worked to increase occupancy. In the following discussion and table, our leasing and occupancy amounts reflect our ownership interest in our 34 operating office properties, which excludes two non-operating properties and includes our share of five unconsolidated operating office properties. Our 34 operating office properties as of December 31, 2015, are comprised of approximately 12.0 million rentable square feet in total.
Our portfolio occupancy was approximately 89.7% as of December 31, 2015, as compared to approximately 88.0% as of December 31, 2014, for the 37 operating properties we owned at that time. The following table sets forth information regarding our leasing activity for the year ended December 31, 2015:
Renewal | Expansion | New | Total | ||||||||
Square feet leased | 1,052,000 | 246,000 | 480,000 | 1,778,000 | |||||||
Weighted average lease term (in years) | 6.8 | 6.3 | 8.0 | 7.1 | |||||||
Increase (decrease) in weighted average net rental rates per square foot per year (1) | $(0.44) | $1.45 | $0.52 | $0.03 | |||||||
% Increase (decrease) in rental rates per square foot per year | (3 | )% | 10 | % | 3 | % | — | % | |||
Leasing cost per square foot per year (2) | $3.77 | $5.32 | $6.65 | $4.76 | |||||||
_________________
(1) | Weighted average net rental rates are calculated as the fixed base rental amount paid by a tenant under the terms of their related lease agreements, less any portion of that base rent used to offset real estate taxes, utility charges, and other operating expenses incurred in connection with the leased space, weighted for the relative square feet under the lease. |
(2) Includes tenant improvements and leasing commissions.
Internalize Property Management and Administrative Services
In June 2015, we exercised our buyout option pursuant to our property management agreement with HPT Management. In connection with the closing of the buyout option, the property management agreement with HPT Management was terminated, HPT Management irrevocably waived certain non-solicitation and non-hire provisions, and we hired all of HPT Management’s property management personnel providing services to us.
In June 2015, we terminated all administrative services provided by BHT Advisors to us under the administrative services agreement. BHT Advisors no longer provides services to us, such as human resources, shareholder services, or information technology, each of which is now performed internally or by unrelated third parties.
37
We expect these actions to result in increased future cash flow through a reduction in property management and external administrative-related expenses, resulting in estimated overall saving of approximately $6.5 million annually, although we can provide no assurance any level of savings will occur.
Reinstate Distributions
Our board of directors reinstated quarterly cash distributions beginning in the second quarter of 2015 at $0.18 per share of common stock and authorized cash distributions in the same amount for each of the third and fourth quarters of 2015. We anticipate that the board of directors will continue to consider authorizing a quarterly distribution payable from cash anticipated to be provided by operations. Distributions are authorized at the discretion of our board of directors based on its analysis of numerous factors, including but not limited to our forthcoming cash needs and our financial condition, and there is no assurance that distributions will continue or at any particular rate or timing. All distributions declared in 2015 constituted a return of capital, and all or a portion of future distributions may continue to constitute a return of capital.
Results of Operations
The results of operations of our consolidated operating and non-operating properties are included in the discussion below, and include properties sold in 2015 that were not held for sale as of December 31, 2014, for our period of ownership. Properties disposed of prior to 2015, and properties sold in 2015 that were held for sale as of December 31, 2014, have been reclassified to discontinued operations in the accompanying consolidated statements of operations and comprehensive income (loss) for all periods presented and are excluded from the discussions below. Effective January 1, 2015, we adopted new accounting guidance that changes the criteria for reporting a discontinued operation. This adoption impacts the comparability of our financial statements as disposals of individual operating properties after January 1, 2015, generally no longer qualify as discontinued operations. The term “same store” in the discussion below includes our consolidated operating office properties owned and operated for the entirety of the two periods being compared.
Year ended December 31, 2015, as compared to the year ended December 31, 2014
Rental Revenue. Rental revenue for the year ended December 31, 2015, was approximately $282.4 million as compared to approximately $288.1 million for the year ended December 31, 2014, a $5.7 million decrease. Our non-same store properties had a decrease of approximately $11.8 million in rental revenue due to a decrease of approximately $30.5 million from the sale of properties in 2015, partially offset by an increase of approximately $18.7 million from properties acquired or developed during 2015 and 2014. Our same store properties had an increase of approximately $6.1 million, primarily due to an increase in rental rates resulting in an increase in revenue of approximately $3.3 million, an increase in occupancy resulting in an increase in rental revenue of approximately $2.4 million, an increase in straight-line rent adjustments of approximately $1.9 million, increases in lease termination income of approximately $1.3 million, and an increase in contribution to revenue from the amortization of above- and below-market rents, net, of approximately $1.2 million. These increases were partially offset by an increase in free rent concessions resulting in a decrease to rental revenue of approximately $4.0 million.
Property Operating Expenses. Property operating expenses for the year ended December 31, 2015, were approximately $89.2 million as compared to approximately $95.5 million for the year ended December 31, 2014, a $6.3 million decrease, primarily related to our non-same store properties due to a decrease of approximately $12.0 million from the sale of properties in 2015 partially offset by an increase of approximately $5.7 million from properties acquired or developed during 2015 and 2014.
Interest Expense. Interest expense for the year ended December 31, 2015, was approximately $57.5 million as compared to approximately $67.4 million for the year ended December 31, 2014, and was comprised of interest expense, amortization of deferred financing fees, and interest rate mark-to-market adjustments related to our credit facility, our notes payable associated with our consolidated real estate properties, and interest rate swap agreements. The $9.9 million decrease was primarily due to lower overall borrowings which reduced our interest expense by approximately $4.3 million, and lower overall interest rates (a weighted average effective interest rate of approximately 4.10% at December 31, 2015, as compared to approximately 5.34% at December 31, 2014), which reduced our interest expense by approximately $7.3 million, partially offset by approximately $1.0 million of default interest related to our non-recourse loan on our Fifth Third Center property located in Columbus, Ohio, and other increases of approximately $0.7 million, primarily due an increase in amortization of deferred financing fees primarily related to our new credit facility.
Property Management Fees. Property management fees for the year ended December 31, 2015, were approximately $5.0 million as compared to approximately $8.7 million for the year ended December 31, 2014, a $3.7 million decrease, primarily due to the internalization of the management of our properties that were formerly managed by HPT Management.
38
Asset Impairment Losses. We had approximately $0.1 million in asset impairment losses for the year ended December 31, 2015, related to final estimated closing costs incurred in connection with the disposition of One and Two Chestnut Place. We had approximately $13.2 million in asset impairment losses for the year ended December 31, 2014, related to assets assessed for impairment due to a change in management’s estimate of the intended hold period.
General and Administrative. General and administrative expenses for the year ended December 31, 2015, were approximately $44.9 million as compared to approximately $19.1 million for the year ended December 31, 2014, and were comprised of corporate general and administrative expenses, including payroll costs, directors’ and officers’ insurance premiums, audit and tax fees, legal fees, costs related to our tender offer and the listing of our common stock on the NYSE, corporate office rent, acquisition expenses, other administrative expenses, reimbursement of certain expenses to BHT Advisors, and termination and buyout fees paid to BHT Advisors and HPT Management. The approximately $25.8 million increase is primarily due to approximately $10.3 million related to the BHT Advisors termination and HPT Management buyout fees, increased payroll costs of approximately $6.8 million (primarily due to increased stock-based compensation of approximately $3.6 million, increased bonuses of approximately $1.5 million, and the internalization of administrative and property management functions), costs related to the tender offer and the listing of our common stock on the NYSE of approximately $5.5 million, increased acquisition expense of approximately $1.4 million, an increase in legal expenses of approximately $0.8 million, and an increase to corporate rent expense of approximately $0.4 million due to the early move-out and relocation of our corporate offices.
Depreciation and Amortization. Depreciation and amortization expense for the year ended December 31, 2015, was approximately $122.7 million as compared to approximately $119.7 million for the year ended December 31, 2014, a $3.0 million increase. Our non-same store properties had a decrease of approximately $1.2 million due to approximately $11.3 million from the sale of properties in 2015 partially offset by an increase of approximately $10.1 million from properties acquired or developed in 2015 and 2014. Our same store properties had an increase of approximately $4.4 million primarily due to increased amortization related to tenant improvements and leasing commissions.
Loss on Early Extinguishment of Debt. Loss on early extinguishment of debt for the year ended December 31, 2015, was approximately $21.5 million and was primarily comprised of defeasance costs related to early payoffs of debt. Loss on early extinguishment of debt for the year ended December 31, 2014, was approximately $0.4 million and was primarily comprised of write-offs of deferred financing fees related to early payoffs of debt.
Equity in Operations of Investments. Equity in operations of investments for the year ended December 31, 2015, was approximately $4.0 million as compared to approximately $1.8 million for the year ended December 31, 2014, and was comprised of our share of the earnings and losses of unconsolidated investments. The $2.2 million increase was primarily due to a gain on the sale of Paces West of approximately $3.4 million partially offset by losses that occurred at 1325 G Street and the Colorado Building, two properties that were wholly owned prior to June 30, 2015.
Gain on Sale of Assets. We had approximately $44.5 million in gain on sale of assets for the year ended December 31, 2015, related to our sales of 1650 Arch and United Plaza and our partial sales of 1325 G Street and the Colorado Building. We had no gain on sale of assets for the year ended December 31, 2014. Effective January 1, 2015, we adopted new accounting guidance that changes the criteria for reporting a discontinued operation. This adoption impacts the comparability of our financial statements as disposals of individual operating properties generally no longer qualify as discontinued operations. This results in approximately $27.5 million of gain on sale of assets in continuing operations in 2015 that would have been reflected in discontinued operations prior to adoption.
Year ended December 31, 2014, as compared to the year ended December 31, 2013
Rental Revenue. Rental revenue for the year ended December 31, 2014, was approximately $288.1 million as compared to approximately $289.1 million for the year ended December 31, 2013, a $1.0 million decrease, primarily as a result of a decrease in portfolio occupancy resulting in a reduction of approximately $3.4 million, an increase in free rent concessions of approximately $1.6 million, and a decrease in the contribution to revenue from the amortization of above- and below-market rents, net, of approximately $2.0 million. These decreases were partially offset by an increase of approximately $4.6 million due to rental rate increases and an increase in straight-line rent adjustments of approximately $1.0 million. We experienced a decrease in occupancy in the first half of 2014 because of known tenant move outs coupled with typical downtime to market and backfill space following lease expirations. However, we experienced an increase in occupancy in the second half of 2014.
Property Operating Expenses. Property operating expenses for the year ended December 31, 2014, were approximately $95.5 million as compared to approximately $91.2 million for the year ended December 31, 2013, a $4.3 million increase, primarily attributable to an increase in administrative and other expenses of approximately $2.9 million, an increase of approximately $0.9 million in repairs and maintenance, and an increase of approximately $0.5 million in utilities expense.
39
Interest Expense. Interest expense for the year ended December 31, 2014, was approximately $67.4 million as compared to approximately $88.8 million for the year ended December 31, 2013, and was comprised of interest expense and amortization of deferred financing fees and interest rate mark-to-market adjustments related to our notes payable associated with our consolidated real estate properties, credit facility, and interest rate cap and swap agreements. The $21.4 million decrease was primarily due to lower overall borrowings related to the payoff of debt associated with our FOUR40, Colorado Building, and 801 Thompson properties and lower borrowings on our credit facility in 2014 as compared to the same period in 2013.
Asset Impairment Losses. We had $13.2 million in impairment losses for the year ended December 31, 2014, primarily related to changes in expected holding periods of certain of our real estate properties. We had no asset impairment losses for the year ended December 31, 2013.
General and Administrative. General and administrative expenses for the year ended December 31, 2014, were approximately $19.1 million as compared to approximately $17.3 million for the year ended December 31, 2013, and were comprised of corporate general and administrative expenses including directors’ and officers’ insurance premiums, audit and tax fees, legal fees, other administrative expenses, and reimbursement of certain expenses of BHT Advisors. The $1.8 million increase in general and administrative expenses was primarily due to increased payroll costs, including stock based compensation expense and executive and director recruiting fees and expenses.
Depreciation and Amortization. Depreciation and amortization expense for the year ended December 31, 2014, was approximately $119.7 million as compared to approximately $121.9 million for the year ended December 31, 2013. The $2.2 million decrease was primarily due to the 2013 write-off of a non-real estate related asset of approximately $1.1 million and lower lease intangible amortization during 2014.
Loss on Early Extinguishment of Debt. Loss on early extinguishment of debt for the year ended December 31, 2014, was approximately $0.4 million as compared to $1.6 million for the year ended December 31, 2013, and, for each year, was comprised primarily of the write-off of deferred financing fees related to the early payoffs of debt under our credit facility.
Equity in Operations of Investments. Equity in operations of investments for the year ended December 31, 2014, was approximately $1.8 million as compared to approximately $24.5 million for the year ended December 31, 2013. The $22.7 million decrease is primarily related to the approximately $25.1 million gain on the 2013 sale of the 200 South Wacker unconsolidated property partially offset by increased losses at certain of our unconsolidated entities.
Gain on Sale of Assets. We had no gain on sale of assets for the year ended December 31, 2014. Gain on sale of assets was approximately $16.1 million for the year ended December 31, 2013, and was related to our 2013 partial sale of Paces West.
Cash Flow Analysis
Year ended December 31, 2015 as compared to year ended December 31, 2014
Cash used in operating activities was approximately $3.9 million for the year ended December 31, 2015, as compared to cash provided by operating activities of approximately $25.1 million for the year ended December 31, 2014. The $29.0 million decrease is primarily attributable to (1) approximately $36.6 million of fees paid primarily related to loans defeased (approximately $20.9 million), the termination and buyout of BHT Advisors and HPT Management (approximately $10.2 million), and our tender offer and listing on the NYSE (approximately $5.5 million); and (2) the timing of receipt of revenues and payment of expenses that resulted in approximately $10.1 million more net cash outflows from working capital assets and liabilities in 2015 compared to 2014; partially offset by approximately $13.2 million primarily due to more cash received from the results of our real estate property operations, including discontinued operations, net of interest expense and general and administrative expenses not identified in (1) above; and a decrease in cash paid for lease commissions and other lease intangibles of approximately $4.5 million.
Cash provided by investing activities for the year ended December 31, 2015, was approximately $224.9 million and was primarily comprised of proceeds from the sale of properties of approximately $493.4 million and changes in restricted cash of approximately $24.6 million, partially offset by purchases of real estate, a ground lease, and investments in unconsolidated entities of approximately $224.6 million and monies used to fund capital expenditures for existing real estate and real estate under development of approximately $73.4 million. During the year ended December 31, 2014, cash provided by investing activities was approximately $153.3 million and was primarily comprised of proceeds from the sale of properties of approximately $242.8 million and a change in restricted cash of approximately $14.4 million, partially offset by monies used to fund capital expenditures for existing real estate and real estate under development of approximately $106.0 million.
40
Cash used in financing activities for the year ended December 31, 2015, was approximately $240.2 million and was primarily comprised of payments on notes payable and financing costs, net of proceeds from notes payable of approximately $169.7 million, redemption of common stock primarily related to our tender offer of $50.8 million, and distributions of approximately $17.6 million. During the year ended December 31, 2014, cash used in financing activities was approximately $204.8 million and was primarily comprised of payments on notes payable and financing costs, net of proceeds from notes payable.
Year ended December 31, 2014, as compared to year ended December 31, 2013
Cash provided by operating activities totaled approximately $25.1 million for the year ended December 31, 2014, as compared to approximately $45.2 million for the year ended December 31, 2013. The $20.1 million decrease was attributable to (1) the timing of receipt of revenues and payment of expenses that resulted in approximately $11.1 million less net cash outflows from working capital assets and liabilities in 2014 compared to 2013; (2) approximately $24.9 million less cash received from the results of our consolidated real estate property operations, including discontinued operations, net of interest expense and general and administrative expenses for the year ended December 31, 2014, as compared to December 31, 2013; and (3) an increase in cash paid for lease commissions and other lease intangibles of approximately $6.2 million.
Cash provided by investing activities for the year ended December 31, 2014, was approximately $153.3 million and was primarily comprised of proceeds from the sale of properties of approximately $242.8 million and a change in restricted cash of approximately $14.4 million, partially offset by monies used to fund capital expenditures for existing real estate and real estate under development of approximately $106.0 million. During the year ended December 31, 2013, cash provided by investing activities was approximately $454.4 million and was primarily comprised of proceeds from the sale of properties of approximately $495.9 million, return of investment of approximately $36.3 million primarily related to the sale of 200 South Wacker, and a change in restricted cash of approximately $29.0 million, partially offset by monies used to fund capital expenditures for existing real estate and real estate under development of approximately $105.2 million.
Cash used in financing activities for the year ended December 31, 2014, was approximately $204.8 million and was comprised primarily of payments on notes payable and financing costs, net of proceeds from notes payable. During the year ended December 31, 2013, cash used in financing activities was approximately $451.6 million and was comprised primarily of payments on notes payable and financing costs, net of proceeds, of approximately $446.2 million and distributions to noncontrolling interests of approximately $5.3 million primarily related to the sale of the Energy Centre property.
Inflation
The majority of our leases contain inflation protection provisions applicable to reimbursement billings for common area maintenance charges, real estate taxes, and insurance reimbursements on a per square foot basis, or in some cases, annual reimbursement of operating expenses above a certain per square foot allowance. The real estate market has not been affected significantly by inflation in the past several years due to the relatively low inflation rate.
Funds from Operations (“FFO”)
Historical cost accounting for real estate assets in accordance with GAAP implicitly assumes that the value of real estate diminishes predictably over time. Since real estate values have historically risen or fallen with market conditions, many industry investors and analysts have considered the presentation of operating results for real estate companies that use historical cost accounting alone to be insufficient for evaluating operating performance. FFO is a non-GAAP financial measure that is widely recognized as a measure of a REIT’s operating performance. We use FFO as defined by NAREIT in the April 2002 “White Paper on Funds From Operations” which is net income (loss), computed in accordance with GAAP, excluding extraordinary items, as defined by GAAP, gains (or losses) from sales of property and impairments of depreciable real estate (including impairments of investments in unconsolidated entities which resulted from measurable decreases in the fair value of the depreciable real estate held by the unconsolidated entity), plus depreciation and amortization of real estate assets, and after related adjustments for unconsolidated entities and noncontrolling interests. The determination of whether impairment charges have been incurred is based partly on anticipated operating performance and hold periods. Estimated undiscounted cash flows from a property, derived from estimated future net rental and lease revenues, net proceeds on the sale of the property, and certain other ancillary cash flows, are taken into account in determining whether an impairment charge has been incurred. While impairment charges for depreciable real estate are excluded from net income (loss) in the calculation of FFO as described above, impairments reflect a decline in the value of the applicable property which we may not recover.
We believe that the use of FFO, together with the required GAAP presentations, is helpful in understanding our operating performance because it excludes real estate-related depreciation and amortization, gains and losses from property dispositions, impairments of depreciable real estate assets, and extraordinary items, and as a result, when compared period to period, reflects
41
the impact on operations from trends in occupancy rates, rental rates, operating costs, development activities, general and administrative expenses, and interest costs, which are not immediately apparent from net income. Factors that impact FFO include fixed costs, yields on cash held in accounts, income from portfolio properties and other portfolio assets, interest rates on debt financing, and operating expenses.
We also evaluate FFO, excluding certain items. The items excluded relate to certain non-operating activities or certain non-recurring activities that create significant FFO volatility. We believe it is useful to evaluate FFO excluding these items because it provides useful information in analyzing comparability between reporting periods and in assessing the sustainability of our operating performance.
FFO and FFO, excluding certain items, should not be considered as alternatives to net income (loss), or as indicators of our liquidity, nor are they indicative of funds available to fund our cash needs, including our ability to make distributions. Additionally, the exclusion of impairments limits the usefulness of FFO and FFO, excluding certain items, as a historical operating performance measures since an impairment charge indicates that operating performance has been permanently affected. FFO and FFO, excluding certain items, are not useful measures in evaluating net asset value because impairments are taken into account in determining net asset value but not in determining FFO and FFO, excluding certain items. FFO and FFO, excluding certain items, are non-GAAP measurements and should be reviewed in connection with other GAAP measurements. Our FFO and FFO, excluding certain items, as presented may not be comparable to amounts calculated by other REITs that do not define FFO in accordance with the current NAREIT definition, or interpret it differently, or that identify and exclude different items related to non-operating activities or certain non-recurring activities.
42
The following section presents our calculations of FFO (as defined by NAREIT) attributable to common stockholders and FFO attributable to common stockholders, excluding certain items, for the years ended December 31, 2015, 2014 and 2013, and provides additional information related to our FFO attributable to common stockholders and FFO attributable to common stockholders, excluding certain items. The table below is presented in thousands, except per share amounts:
Year Ended December 31, | ||||||||||||
2015 | 2014 | 2013 | ||||||||||
Net income (loss) | $ | (34,163 | ) | $ | (15,528 | ) | $ | 15,983 | ||||
Net (income) loss attributable to noncontrolling interests | 129 | 12 | (431 | ) | ||||||||
Dilution (accretion) of Series A Convertible Preferred Stock | 1,926 | (1,926 | ) | — | ||||||||
Adjustments (1): | ||||||||||||
Real estate depreciation and amortization from consolidated properties | 122,230 | 143,168 | 169,845 | |||||||||
Real estate depreciation and amortization from unconsolidated properties | 6,985 | 5,161 | 6,132 | |||||||||
Real estate depreciation and amortization - noncontrolling interests | (20 | ) | — | (504 | ) | |||||||
Impairment of depreciable real estate assets | 132 | 13,165 | 4,879 | |||||||||
Gain on sale of depreciable real estate | (63,263 | ) | (90,221 | ) | (81,661 | ) | ||||||
Taxes associated with sale of depreciable real estate | 1,259 | — | — | |||||||||
Noncontrolling interest share of gain on sale of depreciable real estate | — | — | 459 | |||||||||
Noncontrolling interests (OP units and vested restricted stock units) share of above adjustments | (116 | ) | (117 | ) | (143 | ) | ||||||
FFO attributable to common stockholders | 35,099 | 53,714 | 114,559 | |||||||||
Acquisition expenses | 1,863 | 90 | 95 | |||||||||
Tender offer and listing costs | 5,526 | 104 | — | |||||||||
Loss (gain) on early extinguishment of debt and troubled debt restructuring | 21,606 | 15,562 | (33,394 | ) | ||||||||
Non-cash default interest | 980 | — | 5,678 | |||||||||
BHT Advisors termination fee and HPT Management buyout fee | 10,301 | — | — | |||||||||
Noncontrolling interests (OP units and vested restricted stock units) share of above adjustments | (70 | ) | (25 | ) | 40 | |||||||
Accretion (dilution) of Series A Convertible Preferred Stock | (1,926 | ) | 1,926 | — | ||||||||
FFO attributable to common stockholders, excluding certain items | $ | 73,379 | $ | 71,371 | $ | 86,978 | ||||||
Weighted average common shares outstanding - basic (2) | 48,960 | 49,876 | 49,865 | |||||||||
Weighted average common shares outstanding - diluted (2) (3) | 49,148 | 50,001 | 49,931 | |||||||||
Net income (loss) per common share - basic and diluted (2) (3) | $ | (0.66 | ) | $ | (0.35 | ) | $ | 0.31 | ||||
FFO per common share - diluted (2) | $ | 0.71 | $ | 1.07 | $ | 2.29 | ||||||
FFO, excluding certain items, per common share - diluted (2) | $ | 1.49 | $ | 1.43 | $ | 1.74 | ||||||
____________
(1) | Reflects the adjustments of continuing operations, as well as discontinued operations. |
(2) | Amounts have been adjusted retroactively to reflect a one-for-six reverse stock split effected on June 2, 2015. |
(3) | There are no dilutive securities for purposes of calculating the net income (loss) per common share. |
Year ended December 31, 2015, as compared to the year ended December 31, 2014
FFO attributable to common stockholders for the year ended December 31, 2015, was approximately $35.1 million as compared to approximately $53.7 million for the year ended December 31, 2014, a decrease of approximately $18.6 million. The disposition of properties that are now included in discontinued operations resulted in an increase of approximately $8.8 million. The decrease in FFO attributable to common stockholders from continuing operations of approximately $27.4 million primarily related to the following factors:
• | an increase in general and administrative expenses of approximately $25.8 million, primarily due to approximately $10.3 million related to the BHT Advisors termination and HPT Management buyout fees, increased payroll costs of approximately $6.8 million (primarily due to increased stock-based compensation of approximately $3.6 million, increased bonuses of approximately $1.5 million, and the internalization of administrative and property management functions), costs related to the tender offer and the listing of our common stock on the NYSE of approximately $5.5 million, increased acquisition expense of approximately $1.4 million, an increase in legal expenses of approximately $0.8 million, and an increase to corporate rent expense of approximately $0.4 million due to the early move-out and relocation of our corporate offices; and |
• | loss on early extinguishment of debt of approximately $21.1 million; |
43
partially offset by:
•lower interest expense of approximately $9.9 million;
•an increase in property net operating income of approximately $5.6 million; and
• | dilution of the value of our Series A Convertible Preferred Stock of approximately $1.9 million as compared to accretion of the value of our Series A Convertible Preferred Stock of $1.9 million in 2014. |
FFO attributable to common stockholders, excluding certain items, for the year ended December 31, 2015, was approximately $73.4 million as compared to approximately $71.4 million for the year ended December 31, 2014, an increase of approximately $2.0 million. The disposition of properties that are now included in discontinued operations resulted in a decrease of approximately $6.3 million. An increase in FFO attributable to common stockholders, excluding certain items, from continuing operations of approximately $8.3 million was primarily due to lower interest expense of approximately $10.9 million, and an increase in property net operating income of approximately $5.6 million, partially offset by increased general and administrative expenses of approximately $8.7 million primarily due to increased payroll costs of approximately $6.8 million.
Year ended December 31, 2014, as compared to the year ended December 31, 2013
FFO attributable to common stockholders for the year ended December 31, 2014, was approximately $53.7 million as compared to approximately $114.6 million for the year ended December 31, 2013, a decrease of approximately $60.9 million. The disposition of properties that are now included in discontinued operations resulted in a decrease of approximately $78.0 million, including approximately $50.4 million of net gain on troubled debt restructuring and loss on early extinguishment of debt. This decrease was partially offset by an increase in FFO attributable to common stockholders from continuing operations of approximately $17.1 million primarily related to the following factors:
• | lower interest expense of approximately $21.4 million; |
• | increased equity in earnings from our unconsolidated properties of approximately $1.4 million; |
• | decreased loss on early extinguishment of debt of approximately $1.2 million; and |
• | a decrease in amortization expense related to the approximately $1.1 million write off of an intangible asset related to the use of the Behringer Harvard name and logo; |
partially offset by:
• | an increase in property operating expenses of approximately $4.3 million; |
• | accretion of the value of the Series A Convertible Preferred Stock of approximately $1.9 million; and |
• | an increase in general and administrative expenses of approximately $1.8 million. |
FFO attributable to common stockholders, excluding certain items, for the year ended December 31, 2014, was approximately $71.4 million as compared to approximately $87.0 million for the year ended December 31, 2013, a decrease of approximately $15.6 million. The disposition of properties that are now included in discontinued operations resulted in a decrease of approximately $27.6 million. An increase in FFO attributable to common stockholders, excluding certain items from continuing operations of approximately $12.0 million was primarily due to lower interest expense of approximately $15.7 million, increased equity in earnings from our unconsolidated properties of approximately $1.1 million, and a decrease in amortization expense related to the approximately $1.1 million write off of an intangible asset related to the use of the Behringer Harvard name and logo, partially offset by increased property operating expenses of approximately $4.3 million and general and administrative expenses of approximately $1.7 million.
For further details regarding the factors listed above, refer to “Results of Operations” beginning on page 38.
Same Store GAAP Net Operating Income and Same Store Cash Net Operating Income (“Same Store GAAP NOI” and “Same Store Cash NOI”)
Same Store GAAP NOI is equal to rental revenue, less lease termination fee income, property operating expenses (excluding tenant improvement demolition costs), real estate taxes, and property management expenses for our same store properties and is considered a non-GAAP financial measure. Same Store Cash NOI is equal to Same Store GAAP NOI less non-cash revenue items including straight-line rent adjustments and the amortization of above- and below-market rent. The same store properties include our operating office properties owned and operated for the entirety of both periods being compared and include our comparable ownership percentage in each period for properties in which we own an unconsolidated interest. We view Same Store
44
GAAP NOI and Same Store Cash NOI as important measures of the operating performance of our properties because they allow us to compare operating results of properties owned and operated for the entirety of both periods being compared and therefore eliminate variations caused by acquisitions or dispositions during such periods.
Same Store GAAP NOI and Same Store Cash NOI presented by us may not be comparable to Same Store GAAP NOI or Same Store Cash NOI reported by other REITs that do not define Same Store GAAP NOI or Same Store Cash NOI exactly as we do. We believe that in order to facilitate a clear understanding of our operating results, Same Store GAAP NOI and Same Store Cash NOI should be examined in conjunction with net income (loss) as presented in our consolidated financial statements and notes thereto. Same Store GAAP NOI and Same Store Cash NOI should not be considered as alternatives to net income (loss) as an indication of our performance or to cash flows as a measure of liquidity or our ability to make distributions.
45
The table below presents our Same Store GAAP NOI and Same Store Cash NOI with a reconciliation to net loss for the years ended December 31, 2015 and 2014 (in thousands). The same store properties for this comparison consist of 28 operating office properties and 9.8 million square feet. Seven operating office properties have been excluded from our same store results below including Paces West, Two BriarLake Plaza, 5950 Sherry Lane, Domain 2, Domain 3, Domain 4, and Domain 7 because we did not own these properties or they were not fully operational during the entirety of each of the years ended December 31, 2015 and 2014.
Year Ended December 31, | |||||||||
2015 | 2014 | ||||||||
Same Store Revenue: | |||||||||
Rental revenue | $ | 237,872 | $ | 231,747 | |||||
Less: | |||||||||
Lease termination fees | (3,471 | ) | (2,157 | ) | |||||
234,401 | 229,590 | ||||||||
Same Store Expenses: | |||||||||
Property operating expenses (less tenant improvement demolition costs) | 73,204 | 71,987 | |||||||
Real estate taxes | 33,634 | 34,379 | |||||||
Property management fees | 4,013 | 7,041 | |||||||
Property Expenses | 110,851 | 113,407 | |||||||
Same Store GAAP NOI - consolidated properties | 123,550 | 116,183 | |||||||
Same Store GAAP NOI - unconsolidated properties (at ownership %) | 9,736 | 10,021 | |||||||
Same Store GAAP NOI | $ | 133,286 | $ | 126,204 | |||||
Same Store GAAP NOI - consolidated properties | $ | 123,550 | $ | 116,183 | |||||
Less: | |||||||||
Straight-line rent revenue adjustment | (6,127 | ) | (4,248 | ) | |||||
Above- and below-market rent amortization | (4,992 | ) | (3,814 | ) | |||||
Same Store Cash NOI consolidated properties | 112,431 | 108,121 | |||||||
Same Store Cash NOI - unconsolidated properties (at ownership %) | 8,787 | 9,069 | |||||||
Same Store Cash NOI | $ | 121,218 | $ | 117,190 | |||||
Reconciliation of net loss to Same Store GAAP NOI and Same Store Cash NOI | |||||||||
Net loss | $ | (34,163 | ) | $ | (15,528 | ) | |||
Adjustments: | |||||||||
Interest expense | 57,454 | 67,374 | |||||||
Asset impairment losses | 132 | 13,165 | |||||||
Tenant improvement demolition costs | 358 | 1,644 | |||||||
General and administrative | 44,941 | 19,058 | |||||||
Depreciation and amortization | 122,731 | 119,670 | |||||||
Interest and other income | (810 | ) | (513 | ) | |||||
Loss on early extinguishment of debt | 21,502 | 426 | |||||||
Provision (benefit) for income taxes | 1,507 | (28 | ) | ||||||
Equity in operations of investments | (3,982 | ) | (1,836 | ) | |||||
(Income) loss from discontinued operations | (1,407 | ) | 30,894 | ||||||
Gain on sale of discontinued operations | (15,383 | ) | (90,221 | ) | |||||
Gain on sale of assets | (44,477 | ) | — | ||||||
Net operating income of non-same store properties | (21,382 | ) | (25,765 | ) | |||||
Lease termination fees | (3,471 | ) | (2,157 | ) | |||||
Same Store GAAP NOI - unconsolidated properties (at ownership %) | 9,736 | 10,021 | |||||||
Same Store GAAP NOI | 133,286 | 126,204 | |||||||
Straight-line rent revenue adjustment | (6,127 | ) | (4,248 | ) | |||||
Above- and below-market rent amortization | (4,992 | ) | (3,814 | ) | |||||
Same Store Cash NOI adjustments - unconsolidated properties (at ownership %) | (949 | ) | (952 | ) | |||||
Same Store Cash NOI | $ | 121,218 | $ | 117,190 | |||||
Same Store GAAP NOI increased approximately $7.1 million, or 5.6%, from the year ended December 31, 2014, as compared to the year ended December 31, 2015. Same Store Cash NOI increased approximately $4.0 million, or 3.4%, from the year ended December 31, 2014, as compared to the year ended December 31, 2015. For further details, refer to “Results of Operations” beginning on page 38.
46
The table below presents our Same Store GAAP NOI and Same Store Cash NOI with a reconciliation to net income (loss) for the years ended December 31, 2014 and 2013 (in thousands). The same store properties for this comparison consist of 33 operating office properties and 12.0 million square feet. Five properties excluded in the presentation above have been included in our same store results below, including United Plaza, 1650 Arch Street, Paces West, One & Two Chestnut Place, and Fifth Third Center (Columbus). Unlike in the presentation above, these five properties were operating during the entirety of each of the years ended December 31, 2014 and 2013, and are not included in discontinued operations.
Year Ended December 31, | |||||||||
2014 | 2013 | ||||||||
Same Store Revenue: | |||||||||
Rental revenue | $ | 287,013 | $ | 287,974 | |||||
Less: | |||||||||
Lease termination fees | (2,158 | ) | (793 | ) | |||||
284,855 | 287,181 | ||||||||
Same Store Expenses: | |||||||||
Property operating expenses (less tenant improvement demolition costs) | 93,449 | 89,021 | |||||||
Real estate taxes | 41,991 | 42,546 | |||||||
Property management fees | 8,127 | 8,191 | |||||||
Property Expenses | 143,567 | 139,758 | |||||||
Same Store GAAP NOI - consolidated properties | 141,288 | 147,423 | |||||||
Same Store GAAP NOI - unconsolidated properties (at ownership %) | 9,318 | 8,354 | |||||||
Same Store GAAP NOI | $ | 150,606 | $ | 155,777 | |||||
Same Store GAAP NOI - consolidated properties | $ | 141,288 | $ | 147,423 | |||||
Less: | |||||||||
Straight-line rent revenue adjustment | (5,959 | ) | (5,326 | ) | |||||
Above- and below-market rent amortization | (3,303 | ) | (5,315 | ) | |||||
Same Store Cash NOI consolidated properties | 132,026 | 136,782 | |||||||
Same Store Cash NOI - unconsolidated properties (at ownership %) | 8,342 | 6,895 | |||||||
Same Store Cash NOI | $ | 140,368 | $ | 143,677 | |||||
Reconciliation of net income (loss) to Same Store GAAP NOI and Same Store Cash NOI | |||||||||
Net income (loss) | $ | (15,528 | ) | $ | 15,983 | ||||
Adjustments: | |||||||||
Interest expense | 67,374 | 88,781 | |||||||
Asset impairment losses | 13,165 | — | |||||||
Tenant improvement demolition costs | 1,644 | 1,645 | |||||||
General and administrative | 19,058 | 17,322 | |||||||
Depreciation and amortization | 119,670 | 121,902 | |||||||
Interest and other income | (513 | ) | (1,234 | ) | |||||
Loss on early extinguishment of debt | 426 | 1,605 | |||||||
Provision (benefit) for income taxes | (28 | ) | 518 | ||||||
Equity in operations of investments | (1,836 | ) | (24,547 | ) | |||||
(Income) loss from discontinued operations | 30,894 | (16,528 | ) | ||||||
Gain on sale of discontinued operations | (90,221 | ) | (40,436 | ) | |||||
Gain on sale of assets | — | (16,102 | ) | ||||||
Net operating income of non-same store properties | (659 | ) | (693 | ) | |||||
Lease termination fees | (2,158 | ) | (793 | ) | |||||
Same Store GAAP NOI - unconsolidated properties (at ownership %) | 9,318 | 8,354 | |||||||
Same Store GAAP NOI | 150,606 | 155,777 | |||||||
Straight-line rent revenue adjustment | (5,959 | ) | (5,326 | ) | |||||
Above- and below-market rent amortization | (3,303 | ) | (5,315 | ) | |||||
Same Store Cash NOI adjustments - unconsolidated properties (at ownership %) | (976 | ) | (1,459 | ) | |||||
Same Store Cash NOI | $ | 140,368 | $ | 143,677 | |||||
Same Store GAAP NOI decreased approximately $5.2 million, or 3.3%, from the year ended December 31, 2013, as compared to the year ended December 31, 2014. Same Store Cash NOI decreased approximately $3.3 million, or 2.3%, from the year ended December 31, 2013, as compared to the year ended December 31, 2014. For further details, refer to “Results of Operations” beginning on page 38.
47
Liquidity and Capital Resources
General
As of December 31, 2015, we had cash and cash equivalents of approximately $12.2 million and restricted cash of approximately $10.7 million. We also have a credit facility with a borrowing capacity of $750.0 million (as described in more detail below). As of December 31, 2015, we had approximately $665.0 million drawn and had the ability to additionally borrow approximately $75.3 million under the credit facility as a whole.
Our expected actual and potential short- and long-term liquidity sources are, among others, cash and cash equivalents, restricted cash, revenue from our properties, proceeds from available borrowings under our credit facility and additional secured or unsecured debt financings and refinancings, and proceeds from the sales of properties in connection with our efforts to sharpen our geographic focus. We believe our recent listing on the NYSE will facilitate supplementing these sources by selling equity or debt securities of the Company if and when we believe appropriate to do so.
We may also seek to generate capital by contributing one or more of our existing assets to a joint venture with a third party. Investments in joint ventures may, under certain circumstances, involve risks not present when a third party is not involved. Our ability to successfully identify, negotiate, and complete joint venture transactions on acceptable terms or at all is highly uncertain.
Generally, our principal liquidity needs are operating and administrative expenses, payment of principal and interest on our outstanding indebtedness, including repaying or refinancing our outstanding indebtedness as it matures, capital improvements to our properties, including commitments for future tenant improvements, property acquisitions, and distributions to our stockholders. As of December 31, 2015, approximately $212.7 million of debt, including our share of debt at our unconsolidated properties, matures before the end of 2016.
At projected operating levels, we anticipate we have adequate capital resources and liquidity to meet our short- and long-term liquidity requirements.
Notes Payable
Our notes payable were approximately $1.1 billion and $1.2 billion in principal amount at December 31, 2015 and 2014, respectively, and were secured by real estate assets with a carrying value of approximately $1.4 billion and $1.7 billion as of December 31, 2015 and 2014, respectively. As of December 31, 2015, all of our outstanding debt was fixed rate debt (or effectively fixed rate debt, through the use of interest rate swaps), with the exception of approximately $195.8 million of borrowings on our revolving line of credit and the construction loan for Two BriarLake Plaza. As of December 31, 2015, the stated annual interest rates on our outstanding notes payable, excluding mezzanine financing, ranged from 1.94% to 6.09%. We had mezzanine financing on one property with a stated annual interest rate of 9.80%. As of December 31, 2015, the effective weighted average interest rate for our consolidated notes payable is approximately 4.10%. For our loan that is in default and detailed below, we incur a default interest rate that is 500 basis points higher than the stated interest rate, which results in an overall effective weighted average interest rate of 4.33% for our consolidated notes payable and an increase in 2015 interest expense of approximately $1.0 million. We anticipate, although we can provide no assurance, that when this property is sold, or if ownership of this property is conveyed to the lender, the default interest will be forgiven.
Our loan agreements generally require us to comply with certain reporting and financial covenants. As of December 31, 2015, we were in default on a non-recourse property loan with an outstanding balance of approximately $48.8 million secured by our Fifth Third Center property located in Columbus, Ohio, which has a carrying value of approximately $36.2 million as of December 31, 2015, and we are working with the lender to dispose of this property on their behalf. As of December 31, 2015, other than the default discussed above, we believe we were in compliance with the covenants under each of our loan agreements, including our credit facility, and our notes payable had maturity dates that range from July 2016 to June 2022.
Credit Facility
Through our operating partnership, Tier OP, we have a secured credit agreement providing for total borrowings of up to $750.0 million, and an accordion feature that allows Tier OP to increase the aggregate commitment by up to $225.0 million. The facility consists of a $250.0 million term loan, a $275.0 million term loan, and a $225.0 million revolving line of credit. The $250.0 million term loan matures on December 18, 2019. The $275.0 million term loan matures on June 30, 2022. The revolving line of credit matures on December 18, 2018, and can be extended one additional year subject to certain conditions and payment
48
of an extension fee. The annual interest rate on the credit facility is equal to either, at our election, (1) the “base rate” (calculated as the greatest of (i) the agent’s “prime rate”; (ii) 0.5% above the Federal Funds Effective Rate; or (iii) the LIBOR Market Index Rate plus 1.0%) plus the applicable margin or (2) LIBOR for an interest period of one, three, or six months plus the applicable margin. The applicable margin will be determined based on the ratio of total indebtedness to total asset value and ranges from 45 to 160 basis points for base rate loans and from 145 to 260 basis points for LIBOR loans. We have entered into interest rate swap agreements to hedge interest rates on $525.0 million of these borrowings to manage our exposure to future interest rate movements. All amounts owed are guaranteed by us and certain subsidiaries of Tier OP. As of December 31, 2015, draws under the credit facility are secured by a perfected first priority lien and security interest in a collateral pool that consisted of 15 properties owned by certain of our subsidiaries. As of December 31, 2015, we believe we have met certain financial covenants for two consecutive quarters that will enable the secured credit facility to convert to an unsecured structure. As of December 31, 2015, we had approximately $525.0 million in borrowings outstanding under the term loans and approximately $140.0 million in borrowings outstanding under the revolving line of credit with an additional $75.3 million of borrowings available under the facility as a whole. As of December 31, 2015, the weighted average effective interest rate for borrowings under the credit facility as a whole, inclusive of our interest rate swaps, was approximately 3.20%.
Distributions
Distributions are authorized at the discretion of our board of directors based on its analysis of numerous factors, including but not limited to our performance over the previous period, expectations of performance over future periods, forthcoming cash needs, earnings, cash flow, anticipated cash flow, capital expenditure requirements, cash on hand and general financial conditions. The board’s decisions are also influenced, in substantial part, by the requirements necessary to maintain our REIT status.
Our board of directors reinstated quarterly cash distributions in the second quarter of 2015 at $0.18 per share of common stock and authorized cash distributions in the same amount for each of the third and fourth quarters of 2015. This equates to an aggregate of approximately $26.1 million paid to our common stockholders through January 8, 2016. All of the distributions declared in 2015 constituted a return of capital, and all or a portion of future distributions may continue to constitute a return of capital. Distributions declared for each quarter were paid in the subsequent quarter. Distributions declared per share have been adjusted retroactively to reflect the impact of the one-for-six reverse stock split that was effected on June 2, 2015. We anticipate that the board of directors will continue to consider authorizing a quarterly distribution payable from cash anticipated to be provided by operations. Distributions are authorized at the discretion of our board of directors based on its analysis of numerous factors, including but not limited to our forthcoming cash needs, our financial condition, and the factors discussed above, and there is no assurance that distributions will continue or at any particular rate or timing.
Contractual Obligations
Our primary contractual obligations relate to our notes payable. In addition, we have land that is subject to long-term ground leases, we lease office space, parking space, and equipment, and we have lease-related commitments.
The following table summarizes our primary contractual obligations as of December 31, 2015 (in thousands):
Total | 2016 | 2017 | 2018 | 2019 | 2020 | Thereafter | ||||||||||||||||||||||
Notes payable principal | $ | 1,080,425 | $ | 193,771 | $ | 130,021 | $ | 141,622 | $ | 251,723 | $ | 1,814 | $ | 361,474 | ||||||||||||||
Interest (1) | 132,633 | 44,048 | 28,898 | 24,237 | 15,935 | 15,844 | 3,671 | |||||||||||||||||||||
Tenant improvement commitments | 34,398 | 34,398 | — | — | — | — | — | |||||||||||||||||||||
Leasing commission commitments | 4,191 | 4,191 | — | — | — | — | — | |||||||||||||||||||||
Operating leases | 45,201 | 2,966 | 2,517 | 2,125 | 1,642 | 1,526 | 34,425 | |||||||||||||||||||||
Total | $ | 1,296,848 | $ | 279,374 | $ | 161,436 | $ | 167,984 | $ | 269,300 | $ | 19,184 | $ | 399,570 | ||||||||||||||
____________
(1) Includes interest on any variable interest rate debt at rates in effect at December 31, 2015.
Off-Balance Sheet Arrangements
We have no off-balance sheet arrangements that are reasonably likely to have a current or future effect on our financial condition, changes in financial condition, revenues or expenses, results of operations, liquidity, capital expenditures, or capital resources.
49
New Accounting Pronouncements
In April 2014, FASB issued guidance that changes the criteria for reporting a discontinued operation. Under the new guidance, only a disposal of a component that represents a major strategic shift of an organization qualifies for discontinued operations reporting. The guidance also requires expanded disclosures about discontinued operations and new disclosures in regards to individually significant disposals that do not qualify for discontinued operations reporting. This guidance is effective for the first interim or annual period beginning on or after December 15, 2014. Upon our adoption of this guidance on January 1, 2015, sales of our individual operating properties generally no longer qualify as discontinued operations. However, properties sold or initially classified as held for sale prior to January 1, 2015, continue to be reported as discontinued operations. Properties that were held for sale prior to January 1, 2015, that were reclassified to held for use after January 1, 2015, are reported as continuing operations.
In May 2014, the FASB issued guidance to clarify the principles for recognizing revenue and to develop a common revenue standard for GAAP and International Financial Reporting Standards. The standard outlines a single comprehensive model for entities to use in accounting for revenue arising from contracts with customers. This guidance is effective for fiscal years and interim periods within those years beginning after December 15, 2017, with early adoption permitted as of December 31, 2016. The guidance permits two implementation approaches, one requiring retrospective application of the new standard with restatement of prior years and one requiring prospective application of the new standard with disclosure of results under old standards. We are currently evaluating the impact this guidance will have on our financial statements when adopted.
In June 2014, the FASB issued an update which clarifies that entities should treat performance targets that can be met after the requisite service period of a share-based payment award as performance conditions that affect vesting. The compensation expense related to such awards will be delayed until it becomes probable that the performance target will be met. This guidance is effective for fiscal years and interim periods within those years beginning after December 15, 2015, with early adoption permitted, and may be applied either prospectively or retrospectively. The adoption of this guidance will not have a material impact on our financial statements.
In August 2014, the FASB issued guidance regarding management’s responsibility in evaluating whether there is a substantial doubt about an entity’s ability to continue as a going concern and to provide related footnote disclosures. This guidance is effective for fiscal years and interim periods within those years beginning after December 15, 2016. We do not believe the adoption of this guidance will have a material impact on our disclosures.
In January 2015, the FASB issued guidance simplifying income statement presentation by eliminating the concept of extraordinary items. An entity will no longer be allowed to separately disclose extraordinary items, net of tax, in the income statement after income from continuing operations if an event or transaction is unusual in nature and occurs infrequently. This guidance is effective for fiscal years and interim periods within those years beginning after December 15, 2015, with early adoption permitted and may be applied either prospectively or retrospectively. The adoption of this guidance will not have a material impact on our financial statements.
In February 2015, the FASB issued updated guidance related to accounting for consolidation of certain legal entities. This guidance is effective for fiscal years and interim periods within those years beginning after December 15, 2015, with early adoption permitted. The adoption of this guidance will not have a material impact on our financial statements, but additional disclosures will be required related to certain of our entities that were determined to be a variable interest entity (“VIE”).
In April 2015, the FASB issued guidance related to accounting for debt issuance costs. The guidance simplifies presentation by requiring debt issuance costs to be presented as a deduction from the corresponding debt liability, consistent with the presentation of debt discounts or premiums. This guidance is effective for fiscal years and interim periods within those years beginning after December 15, 2015. The adoption of this guidance will change the classification of deferred financing fees on our balance sheet, but it will not otherwise have an impact on our financial statements.
Item 7A. Quantitative and Qualitative Disclosures About Market Risk.
We are exposed to interest rate changes primarily as a result of our debt used to acquire properties. Our interest rate risk management objectives are to limit the impact of interest rate changes on earnings and cash flows and to lower overall borrowing costs. To achieve these objectives, we borrow primarily at fixed rates or variable rates with what we believe are the lowest margins available at the time and in some cases, with the ability to convert variable rates to fixed rates. With regard to variable rate financing, we will assess interest rate risk by continually identifying and monitoring changes in interest rate exposures that may adversely impact expected future cash flows and by evaluating hedging opportunities. We have entered into derivative financial instruments to mitigate our interest rate risk on certain financial instruments and as a result have effectively fixed the interest rate on certain of our variable rate debt. As of December 31, 2015, we had approximately $720.8 million of debt that bears interest at a variable rate. Approximately $525.0 million of this variable rate debt has been effectively fixed through the use of interest rate swaps.
50
A 100 basis point increase in interest rates on our variable rate debt would result in a net increase in total annual interest incurred of approximately $2.0 million. A 100 basis point decrease in interest rates on our variable rate debt would result in a net decrease in total annual interest incurred of approximately $0.8 million. A 100 basis point increase in interest rates on our variable rate debt would result in a net increase in the fair value of our interest rate swaps of approximately $25.0 million. A 100 basis point decrease in interest rates on our variable rate debt would result in a net decrease in the fair value of our interest rate swaps of approximately $26.0 million.
We do not have any foreign operations and thus we are not directly exposed to foreign currency fluctuations.
Item 8. Financial Statements and Supplementary Data.
The information required by this Item 8 is hereby incorporated by reference to our Consolidated Financial Statements beginning on page F-1 of this Annual Report on Form 10-K.
Item 9. Changes in and Disagreements With Accountants on Accounting and Financial Disclosure.
None.
Item 9A. Controls and Procedures.
Evaluation of Disclosure Controls and Procedures
As required by Rule 13a-15(b) and Rule 15d-15(b) under the Exchange Act, our management, including our Chief Executive Officer and Chief Financial Officer, evaluated as of December 31, 2015, the effectiveness of our disclosure controls and procedures as defined in Exchange Act Rule 13a-15(e) and Rule 15d-15(e). Based on that evaluation, our Chief Executive Officer and Chief Financial Officer concluded that our disclosure controls and procedures, as of December 31, 2015, were effective for the purpose of ensuring that information required to be disclosed by us in the reports that we file or submit under the Exchange Act is recorded, processed, summarized, and reported within the time periods specified by the rules and forms of the Securities and Exchange Commission and is accumulated and communicated to management, including the Chief Executive Officer and Chief Financial Officer, as appropriate to allow timely decisions regarding required disclosures.
We believe, however, that a controls system, no matter how well designed and operated, cannot provide absolute assurance that the objectives of the controls system are met, and no evaluation of controls can provide absolute assurance that all control issues and instances of fraud or error, if any, within a company have been detected.
Management’s Annual Report on Internal Control over Financial Reporting
Management is responsible for establishing and maintaining adequate internal control over financial reporting (as defined in Exchange Act Rules 13a-15(f) and 15d-15(f)). Our management, including our Chief Executive Officer and Chief Financial Officer, evaluated as of December 31, 2015, the effectiveness of our internal control over financial reporting using the framework in Internal Control — Integrated Framework (2013) issued by the Committee of Sponsoring Organizations of the Treadway Commission. Based on that evaluation, our management, including our Chief Executive Officer and Chief Financial Officer, concluded that our internal controls, as of December 31, 2015, were effective.
This annual report does not include an attestation report of the company’s independent registered public accounting firm regarding internal control over financial reporting. Internal control over financial reporting was not subject to attestation by the Company’s independent registered public accounting firm pursuant to rules of the Securities and Exchange Commission that permit the Company to provide only management’s report in this Annual Report on Form 10-K.
Changes in Internal Control over Financial Reporting
There was no change in our internal control over financial reporting that occurred during the quarter ended December 31, 2015, that has materially affected, or is reasonably likely to materially affect, our internal control over financial reporting.
Item 9B. Other Information.
None.
51
PART III
Item 10. Directors, Executive Officers and Corporate Governance.
Our board of directors has adopted a Code of Business Conduct Policy. The policy describes ethical and legal principles and applies to all of our employees, including our officers, as well as all of our directors and contract personnel. A complete copy of the policy can be found at www.tierreit.com. Printed copies are available to any stockholder without charge by writing to us at: Corporate Secretary, 5950 Sherry Lane, Suite 700, Dallas, Texas 75225. We intend to disclose on this website any amendment to, or waiver of, any provision of this policy applicable to our principal executive officer, principal financial officer, principal accounting officer or controller, or persons performing similar functions, that would otherwise be required to be disclosed under the rules of the SEC.
The other information required by this Item is incorporated herein by reference from our definitive proxy statement relating to our 2016 annual meeting of stockholders, to be filed with the SEC pursuant to Regulation 14A within 120 days of December 31, 2015.
Item 11. Executive Compensation.
The information required by this Item is incorporated herein by reference from our definitive proxy statement relating to our 2016 annual meeting of stockholders, to be filed with the SEC pursuant to Regulation 14A within 120 days of December 31, 2015.
Item 12. Security Ownership of Certain Beneficial Owners and Management and Related Stockholder Matters.
The information required by this Item is incorporated herein by reference from our definitive proxy statement relating to our 2016 annual meeting of stockholders, to be filed with the SEC pursuant to Regulation 14A within 120 days of December 31, 2015.
The information concerning our equity compensation plans contained in the table entitled “Equity Compensation Plan Information” set forth in Item 5 of this Annual Report on Form 10-K is incorporated by reference into this Item 12.
Item 13. Certain Relationships and Related Transactions, and Director Independence.
The information required by this Item is incorporated herein by reference from our definitive proxy statement relating to our 2016 annual meeting of stockholders, to be filed with the SEC pursuant to Regulation 14A within 120 days of December 31, 2015.
Item 14. Principal Accounting Fees and Services.
The information required by this Item is incorporated herein by reference from our definitive proxy statement relating to our 2016 annual meeting of stockholders, to be filed with the SEC pursuant to Regulation 14A within 120 days of December 31, 2015.
52
PART IV
Item 15. Exhibits, Financial Statement Schedules.
(a) List of Documents Filed.
1. Financial Statements
The list of the financial statements filed as part of this Annual Report on Form 10-K is set forth on
page F-1 herein.
2. Financial Statement Schedules
Schedule II Valuation and Qualifying Accounts
Schedule III Real Estate and Accumulated Depreciation
3. Exhibits
The list of exhibits filed as part of this Annual Report on Form 10-K is set forth in the Exhibit Index
following the financial statements in response to Item 601 of Regulation S-K.
(b) Exhibits.
The exhibits filed in response to Item 601 of Regulation S-K are listed on the Exhibit Index attached hereto.
(c) Financial Statement Schedules.
All financial statement schedules, except for Schedules II and III (see (a) 2. above), have been omitted because the required information of such schedules is not present, is not present in amounts sufficient to require a schedule, or is included in the financial statements.
53
SIGNATURES
Pursuant to the requirements of Section 13 or 15(d) of the Securities Exchange Act of 1934, the registrant has duly caused this report to be signed on its behalf by the undersigned, thereunto duly authorized.
TIER REIT, Inc. | ||||
Dated: | February 16, 2016 | By: | /s/ Scott W. Fordham | |
Scott W. Fordham | ||||
Chief Executive Officer, President, and Director | ||||
Pursuant to the requirements of the Securities Exchange Act of 1934, this report has been signed below by the following persons on behalf of the registrant and in the capacities and on the dates indicated.
February 16, 2016 | /s/ Scott W. Fordham |
Scott W. Fordham | |
Chief Executive Officer, President, and Director | |
(Principal Executive Officer) | |
February 16, 2016 | /s/ Dallas E. Lucas |
Dallas E. Lucas | |
Chief Financial Officer and Treasurer | |
(Principal Financial Officer) | |
February 16, 2016 | /s/ James E. Sharp |
James E. Sharp | |
Chief Accounting Officer and Executive Vice President | |
(Principal Accounting Officer) | |
February 16, 2016 | /s/ Richard I. Gilchrist |
Richard I. Gilchrist | |
Chairman of the Board of Directors | |
February 16, 2016 | /s/ Robert S. Aisner |
Robert S. Aisner | |
Director | |
February 16, 2016 | /s/ Charles G. Dannis |
Charles G. Dannis | |
Director | |
February 16, 2016 | /s/ Thomas M. Herzog |
Thomas M. Herzog | |
Director | |
February 16, 2016 | /s/ Dennis J. Martin |
Dennis J. Martin | |
Director | |
February 16, 2016 | /s/ M. Jason Mattox |
M. Jason Mattox | |
Director | |
February 16, 2016 | /s/ Steven W. Partridge |
Steven W. Partridge | |
Director | |
February 16, 2016 | /s/ G. Ronald Witten |
G. Ronald Witten | |
Director | |
54
INDEX TO CONSOLIDATED FINANCIAL STATEMENTS
Page | |
Financial Statements | |
Financial Statement Schedules | |
F-1
REPORT OF INDEPENDENT REGISTERED PUBLIC ACCOUNTING FIRM
To the Board of Directors and Stockholders of
TIER REIT, Inc.
Dallas, Texas
We have audited the accompanying consolidated balance sheets of TIER REIT, Inc. and subsidiaries (the “Company”) as of December 31, 2015 and 2014, and the related consolidated statements of operations and comprehensive income (loss), changes in equity, and cash flows for each of the three years in the period ended December 31, 2015. Our audits also included the financial statement schedules listed in the Index at Item 15. These financial statements and financial statement schedules are the responsibility of the Company’s management. Our responsibility is to express an opinion on these financial statements and financial statement schedules based on our audits.
We conducted our audits in accordance with the standards of the Public Company Accounting Oversight Board (United States). Those standards require that we plan and perform the audit to obtain reasonable assurance about whether the financial statements are free of material misstatement. The Company is not required to have, nor were we engaged to perform, an audit of its internal control over financial reporting. Our audits included consideration of internal control over financial reporting as a basis for designing audit procedures that are appropriate in the circumstances, but not for the purpose of expressing an opinion on the effectiveness of the Company’s internal control over financial reporting. Accordingly, we express no such opinion. An audit also includes examining, on a test basis, evidence supporting the amounts and disclosures in the financial statements, assessing the accounting principles used and significant estimates made by management, as well as evaluating the overall financial statement presentation. We believe that our audits provide a reasonable basis for our opinion.
In our opinion, such consolidated financial statements present fairly, in all material respects, the financial position of TIER REIT, Inc. and subsidiaries at December 31, 2015 and 2014, and the results of their operations and their cash flows for each of the three years in the period ended December 31, 2015, in conformity with accounting principles generally accepted in the United States of America. Also, in our opinion, such financial statement schedules, when considered in relation to the basic consolidated financial statements taken as a whole, present fairly in all material respects the information set forth therein.
As discussed in Note 3 to the consolidated financial statements, during 2015 the Company adopted Financial Accounting Standards Board Accounting Standards Update No. 2014-08, Presentation of Financial Statements and Property, Plant, and Equipment (Topics 205 and 360): Reporting Discontinued Operations and Disclosures of Disposals of Components of an Entity.
/s/ Deloitte & Touche LLP |
Dallas, Texas |
February 16, 2016 |
F-2
TIER REIT, Inc.
Consolidated Balance Sheets
As of December 31, 2015 and 2014
(in thousands, except share and per share amounts)
December 31, 2015 | December 31, 2014 | |||||||
Assets | ||||||||
Real estate | ||||||||
Land | $ | 179,989 | $ | 286,430 | ||||
Land held for development | 45,059 | — | ||||||
Buildings and improvements, net | 1,348,200 | 1,482,336 | ||||||
Total real estate | 1,573,248 | 1,768,766 | ||||||
Cash and cash equivalents | 12,248 | 31,442 | ||||||
Restricted cash | 10,712 | 35,324 | ||||||
Accounts receivable, net | 76,228 | 83,380 | ||||||
Prepaid expenses and other assets | 6,712 | 7,129 | ||||||
Investments in unconsolidated entities | 88,998 | 39,885 | ||||||
Deferred financing fees, net | 11,965 | 10,783 | ||||||
Lease intangibles, net | 83,548 | 94,690 | ||||||
Other intangible assets, net | 10,086 | 2,144 | ||||||
Assets associated with real estate held for sale | — | 137,640 | ||||||
Total assets | $ | 1,873,745 | $ | 2,211,183 | ||||
Liabilities and equity | ||||||||
Liabilities | ||||||||
Notes payable | $ | 1,080,425 | $ | 1,194,085 | ||||
Accounts payable | 831 | 2,790 | ||||||
Payables to related parties | 292 | 2,041 | ||||||
Acquired below-market leases, net | 11,934 | 16,984 | ||||||
Distributions payable | 8,596 | — | ||||||
Accrued liabilities | 70,766 | 77,375 | ||||||
Other liabilities | 23,082 | 21,405 | ||||||
Obligations associated with real estate held for sale | — | 108,343 | ||||||
Total liabilities | 1,195,926 | 1,423,023 | ||||||
Commitments and contingencies | ||||||||
Series A Convertible Preferred Stock | 2,700 | 4,626 | ||||||
Equity | ||||||||
Preferred stock, $.0001 par value per share; 17,490,000 shares authorized, none outstanding | — | — | ||||||
Convertible stock, $.0001 par value per share; 1,000 shares authorized, none outstanding | — | — | ||||||
Common stock, $.0001 par value per share; 382,499,000 shares authorized, 47,362,372 and 49,877,350 shares issued and outstanding at December 31, 2015 and 2014, respectively (1) | 5 | 5 | ||||||
Additional paid-in capital (1) | 2,600,193 | 2,645,927 | ||||||
Cumulative distributions and net loss attributable to common stockholders | (1,922,721 | ) | (1,862,555 | ) | ||||
Accumulated other comprehensive loss | (3,860 | ) | (788 | ) | ||||
Stockholders’ equity | 673,617 | 782,589 | ||||||
Noncontrolling interests | 1,502 | 945 | ||||||
Total equity | 675,119 | 783,534 | ||||||
Total liabilities and equity | $ | 1,873,745 | $ | 2,211,183 | ||||
__________________
(1) Amounts have been adjusted retroactively to reflect a one-for-six reverse stock split effected on June 2, 2015.
See Notes to Consolidated Financial Statements.
F-3
TIER REIT, Inc.
Consolidated Statements of Operations and Comprehensive Income (Loss)
For the Years Ended December 31, 2015, 2014 and 2013
(in thousands, except share and per share amounts)
2015 | 2014 | 2013 | ||||||||||
Rental revenue | $ | 282,365 | $ | 288,067 | $ | 289,071 | ||||||
Expenses | ||||||||||||
Property operating expenses | 89,158 | 95,456 | 91,168 | |||||||||
Interest expense | 57,454 | 67,374 | 88,781 | |||||||||
Real estate taxes | 40,134 | 41,472 | 41,918 | |||||||||
Property management fees | 5,028 | 8,678 | 8,721 | |||||||||
Asset impairment losses | 132 | 13,165 | — | |||||||||
General and administrative | 44,941 | 19,058 | 17,322 | |||||||||
Depreciation and amortization | 122,731 | 119,670 | 121,902 | |||||||||
Total expenses | 359,578 | 364,873 | 369,812 | |||||||||
Interest and other income | 810 | 513 | 1,234 | |||||||||
Loss on early extinguishment of debt | (21,502 | ) | (426 | ) | (1,605 | ) | ||||||
Loss from continuing operations before income taxes, equity in operations of investments, and gain on sale of assets | (97,905 | ) | (76,719 | ) | (81,112 | ) | ||||||
Benefit (provision) for income taxes | (1,507 | ) | 28 | (518 | ) | |||||||
Equity in operations of investments | 3,982 | 1,836 | 24,547 | |||||||||
Loss from continuing operations before gain on sale of assets | (95,430 | ) | (74,855 | ) | (57,083 | ) | ||||||
Discontinued operations | ||||||||||||
Income (loss) from discontinued operations | 1,407 | (30,894 | ) | 16,528 | ||||||||
Gain on sale or transfer of discontinued operations | 15,383 | 90,221 | 40,436 | |||||||||
Discontinued operations | 16,790 | 59,327 | 56,964 | |||||||||
Gain on sale of assets | 44,477 | — | 16,102 | |||||||||
Net income (loss) | (34,163 | ) | (15,528 | ) | 15,983 | |||||||
Noncontrolling interests in continuing operations | 159 | 132 | 60 | |||||||||
Noncontrolling interests in discontinued operations | (30 | ) | (120 | ) | (491 | ) | ||||||
Dilution (accretion) of Series A Convertible Preferred Stock | 1,926 | (1,926 | ) | — | ||||||||
Net income (loss) attributable to common stockholders | $ | (32,108 | ) | $ | (17,442 | ) | $ | 15,552 | ||||
Basic and diluted weighted average common shares outstanding (1) | 48,960,393 | 49,875,899 | 49,865,310 | |||||||||
Basic and diluted income (loss) per common share: (1) | ||||||||||||
Continuing operations | $ | (1.00 | ) | $ | (1.54 | ) | $ | (0.82 | ) | |||
Discontinued operations | 0.34 | 1.19 | 1.13 | |||||||||
Basic and diluted income (loss) per common share | $ | (0.66 | ) | $ | (0.35 | ) | $ | 0.31 | ||||
Distributions declared per common share (1) | $ | 0.54 | $ | — | $ | — | ||||||
Net income (loss) attributable to common stockholders: | ||||||||||||
Continuing operations | $ | (48,868 | ) | $ | (76,649 | ) | $ | (40,921 | ) | |||
Discontinued operations | 16,760 | 59,207 | 56,473 | |||||||||
Net income (loss) attributable to common stockholders | $ | (32,108 | ) | $ | (17,442 | ) | $ | 15,552 | ||||
Comprehensive income (loss): | ||||||||||||
Net income (loss) | $ | (34,163 | ) | $ | (15,528 | ) | $ | 15,983 | ||||
Other comprehensive income (loss): unrealized gain (loss) on interest rate derivatives | (3,077 | ) | (789 | ) | 1,679 | |||||||
Dilution (accretion) of Series A Convertible Preferred Stock | 1,926 | (1,926 | ) | — | ||||||||
Comprehensive income (loss) | (35,314 | ) | (18,243 | ) | 17,662 | |||||||
Comprehensive (income) loss attributable to noncontrolling interests | 134 | 13 | (434 | ) | ||||||||
Comprehensive income (loss) attributable to common stockholders | $ | (35,180 | ) | $ | (18,230 | ) | $ | 17,228 | ||||
________________________
(1) Amounts have been adjusted retroactively to reflect a one-for-six reverse stock split effected on June 2, 2015.
See Notes to Consolidated Financial Statements.
F-4
TIER REIT, Inc.
Consolidated Statements of Changes in Equity
For the Years Ended December 31, 2015, 2014 and 2013
(in thousands)
Cumulative Distributions and Net Loss Attributable to Common Stockholders | ||||||||||||||||||||||||||
Common Stock (1) | Additional Paid-in Capital (1) | Accumulated Other Comprehensive Loss | ||||||||||||||||||||||||
Number of Shares | Par Value | Noncontrolling Interests | Total Equity | |||||||||||||||||||||||
Balance at January 1, 2013 | 49,865 | $ | 5 | $ | 2,646,019 | $ | (1,862,591 | ) | $ | (1,676 | ) | $ | 5,628 | $ | 787,385 | |||||||||||
Net income | — | — | — | 15,552 | — | 431 | 15,983 | |||||||||||||||||||
Unrealized gain on interest rate derivatives | — | — | — | — | 1,676 | 3 | 1,679 | |||||||||||||||||||
Share based compensation, net | — | — | 747 | — | — | 73 | 820 | |||||||||||||||||||
Distributions declared to noncontrolling interests | — | — | — | — | — | (5,308 | ) | (5,308 | ) | |||||||||||||||||
Balance at December 31, 2013 | 49,865 | $ | 5 | $ | 2,646,766 | $ | (1,847,039 | ) | $ | — | $ | 827 | $ | 800,559 | ||||||||||||
Net loss | — | — | — | (15,516 | ) | — | (12 | ) | (15,528 | ) | ||||||||||||||||
Unrealized loss on interest rate derivatives | — | — | — | — | (788 | ) | (1 | ) | (789 | ) | ||||||||||||||||
Share based compensation, net | 12 | — | 1,087 | — | — | 168 | 1,255 | |||||||||||||||||||
Distributions declared to noncontrolling interests | — | — | — | — | — | (37 | ) | (37 | ) | |||||||||||||||||
Accretion of Series A Convertible Preferred Stock | — | — | (1,926 | ) | — | — | — | (1,926 | ) | |||||||||||||||||
Balance at December 31, 2014 | 49,877 | $ | 5 | $ | 2,645,927 | $ | (1,862,555 | ) | $ | (788 | ) | $ | 945 | $ | 783,534 | |||||||||||
Net loss | — | — | — | (34,034 | ) | — | (129 | ) | (34,163 | ) | ||||||||||||||||
Unrealized loss on interest rate derivatives | — | — | — | — | (3,072 | ) | (5 | ) | (3,077 | ) | ||||||||||||||||
Share based compensation, net | 148 | — | 3,687 | — | — | 31 | 3,718 | |||||||||||||||||||
Redemption of common stock | (2,663 | ) | — | (50,841 | ) | — | — | — | (50,841 | ) | ||||||||||||||||
Contributions by noncontrolling interest | — | — | — | — | — | 1,325 | 1,325 | |||||||||||||||||||
Distributions declared: | ||||||||||||||||||||||||||
Common stock ($0.54 per share) (1) | — | — | — | (26,126 | ) | — | — | (26,126 | ) | |||||||||||||||||
Series A Convertible Preferred Stock ($0.54 per share) (1) | — | — | — | (6 | ) | — | — | (6 | ) | |||||||||||||||||
Noncontrolling interests | — | — | — | — | — | (48 | ) | (48 | ) | |||||||||||||||||
Dilution of Series A Convertible Preferred Stock | — | — | 1,926 | — | — | — | 1,926 | |||||||||||||||||||
Purchase of operating partnership units | — | — | (506 | ) | — | — | (617 | ) | (1,123 | ) | ||||||||||||||||
Balance at December 31, 2015 | 47,362 | $ | 5 | $ | 2,600,193 | $ | (1,922,721 | ) | $ | (3,860 | ) | $ | 1,502 | $ | 675,119 | |||||||||||
_______________
(1) Amounts have been adjusted retroactively to reflect a one-for-six reverse stock split effected on June 2, 2015.
See Notes to Consolidated Financial Statements.
F-5
TIER REIT, Inc.
Consolidated Statements of Cash Flows
For the Years Ended December 31, 2015, 2014 and 2013
(in thousands)
2015 | 2014 | 2013 | ||||||||||
Cash flows from operating activities | ||||||||||||
Net income (loss) | $ | (34,163 | ) | $ | (15,528 | ) | $ | 15,983 | ||||
Adjustments to reconcile net income (loss) to net cash provided by operating activities: | ||||||||||||
Asset impairment losses | 132 | 13,165 | 4,879 | |||||||||
Gain on sale of assets | (44,477 | ) | — | (16,102 | ) | |||||||
Gain on sale or transfer of discontinued operations | (15,383 | ) | (90,221 | ) | (40,436 | ) | ||||||
Gain on troubled debt restructuring | — | — | (36,856 | ) | ||||||||
Loss on early extinguishment of debt | 614 | 775 | 2,787 | |||||||||
Loss on derivatives | — | — | 251 | |||||||||
Amortization of restricted shares and units | 4,975 | 1,397 | 820 | |||||||||
Depreciation and amortization | 122,731 | 143,168 | 171,119 | |||||||||
Amortization of lease intangibles | (1,978 | ) | (376 | ) | 355 | |||||||
Amortization of above- and below-market rent | (5,842 | ) | (4,133 | ) | (9,540 | ) | ||||||
Amortization of deferred financing and mark-to-market costs | 3,683 | 3,088 | 6,308 | |||||||||
Equity in earnings of investments | (3,982 | ) | (1,836 | ) | (24,547 | ) | ||||||
Ownership portion of management, construction management, and financing fees from unconsolidated entities | 497 | 482 | 923 | |||||||||
Distributions from investments | 871 | 1,091 | — | |||||||||
Change in accounts receivable | (8,180 | ) | (8,290 | ) | (7,999 | ) | ||||||
Change in prepaid expenses and other assets | 2,260 | 618 | 572 | |||||||||
Change in lease commissions | (17,068 | ) | (21,891 | ) | (15,520 | ) | ||||||
Change in other lease intangibles | (1,149 | ) | (800 | ) | (961 | ) | ||||||
Change in accounts payable | (1,495 | ) | (746 | ) | 1,847 | |||||||
Change in accrued liabilities | (6,842 | ) | 391 | (11,793 | ) | |||||||
Change in other liabilities | 2,432 | 4,604 | 2,847 | |||||||||
Change in payables to related parties | (1,516 | ) | 182 | 214 | ||||||||
Cash provided by (used in) operating activities | (3,880 | ) | 25,140 | 45,151 | ||||||||
Cash flows from investing activities | ||||||||||||
Return of investments | 4,786 | 2,702 | 36,310 | |||||||||
Purchase of ground lease | (7,200 | ) | — | — | ||||||||
Purchases of real estate | (178,184 | ) | — | — | ||||||||
Investments in unconsolidated entities | (39,173 | ) | (560 | ) | (1,500 | ) | ||||||
Capital expenditures for real estate | (70,856 | ) | (78,567 | ) | (66,004 | ) | ||||||
Capital expenditures for real estate under development | (2,555 | ) | (27,423 | ) | (39,180 | ) | ||||||
Proceeds from sale of discontinued operations | 59,715 | 242,800 | 495,866 | |||||||||
Proceeds from sale of assets | 433,709 | — | — | |||||||||
Change in restricted cash | 24,612 | 14,395 | 28,954 | |||||||||
Cash provided by investing activities | 224,854 | 153,347 | 454,446 | |||||||||
Cash flows from financing activities | ||||||||||||
Financing costs | (5,915 | ) | (5,454 | ) | (2,362 | ) | ||||||
Proceeds from notes payable | 779,905 | 334,359 | 55,785 | |||||||||
Payments on notes payable | (943,667 | ) | (533,528 | ) | (499,672 | ) | ||||||
Payments on capital lease obligations | (12 | ) | (30 | ) | — | |||||||
Redemptions of common stock | (50,841 | ) | — | — | ||||||||
Transfer of common stock | (1,257 | ) | (141 | ) | — | |||||||
Purchase of operating partnership units | (1,123 | ) | — | — | ||||||||
Distributions paid to Series A Convertible Preferred and common stockholders | (17,553 | ) | — | — | ||||||||
Distributions paid to noncontrolling interests | (30 | ) | (37 | ) | (5,308 | ) | ||||||
Contributions from noncontrolling interests | 325 | — | — | |||||||||
Cash used in financing activities | (240,168 | ) | (204,831 | ) | (451,557 | ) | ||||||
Net change in cash and cash equivalents | (19,194 | ) | (26,344 | ) | 48,040 | |||||||
Cash and cash equivalents at beginning of period | 31,442 | 57,786 | 9,746 | |||||||||
Cash and cash equivalents at end of period | $ | 12,248 | $ | 31,442 | $ | 57,786 | ||||||
See Notes to Consolidated Financial Statements.
F-6
TIER REIT, Inc.
Notes to Consolidated Financial Statements
1. Business
Organization
TIER REIT, Inc. is a self-managed, Dallas-based real estate investment trust focused on maximizing total return to stockholders through the combination of stock appreciation and income derived from a sustainable distribution. As used herein, “TIER REIT,” the “Company,” “we,” “us” or “our” refers to TIER REIT, Inc. and its subsidiaries unless the context otherwise requires. TIER REIT was incorporated in June 2002 as a Maryland corporation and has elected to be taxed, and currently qualifies, as a real estate investment trust, or REIT, for federal income tax purposes. As of December 31, 2015, we owned interests in 34 operating office properties, two non-operating properties, and one development property located in 15 markets throughout the United States.
Substantially all of our business is conducted through Tier Operating Partnership LP (“Tier OP”), a Texas limited partnership. Our wholly-owned subsidiary, Tier GP, Inc., a Delaware corporation, is the sole general partner of Tier OP. Our direct and indirect wholly-owned subsidiaries, Tier Business Trust, a Maryland business trust, and Tier Partners, LLC, a Delaware limited liability company, are limited partners that together with Tier GP, Inc. own all of Tier OP.
On June 2, 2015, we filed articles of amendment to our charter to effect a one-for-six reverse stock split of our existing common stock. The par value of our common stock remained at $0.0001 per share, and we recorded an adjustment to the common stock value with an offset to additional paid-in-capital to reflect the change for all periods presented. In accordance with accounting principles generally accepted in the United States of America (“GAAP”), all share information presented has been retroactively adjusted to reflect the reverse stock split.
On July 23, 2015, we listed our shares of common stock on the New York Stock Exchange (“NYSE”) under the ticker symbol “TIER.”
2. Summary of Significant Accounting Policies
Use of Estimates in the Preparation of Financial Statements
The preparation of financial statements in conformity with GAAP requires management to make estimates and assumptions that affect the reported amounts of assets and liabilities and disclosure of contingent assets and liabilities at the date of the financial statements and the reported amounts of revenues and expenses during the reporting period. These estimates include such items as the purchase price allocation for real estate acquisitions, impairment of assets, timing of asset dispositions, duration of lease terms, depreciation and amortization, and allowance for doubtful accounts. Actual results could differ materially from those estimates.
Principles of Consolidation and Basis of Presentation
Our consolidated financial statements include our accounts, the accounts of variable interest entities (“VIEs”), if any, in which we are the primary beneficiary, and the accounts of other subsidiaries over which we have control. All inter-company transactions, balances, and profits have been eliminated in consolidation. Interests in entities acquired are evaluated based on applicable GAAP which requires the consolidation of VIEs in which we are deemed to be the primary beneficiary. If the interest is in an entity that is determined not to be a VIE, then the entity is evaluated for consolidation based on legal form, economic substance, and the extent to which we have control and/or substantive participating rights under the respective ownership agreement. We had no VIEs as of December 31, 2015, 2014 or 2013.
As discussed in Note 3, “New Accounting Pronouncements,” effective January 1, 2015, we adopted the Financial Accounting Standards Board (“FASB”) guidance that changes the criteria for reporting a discontinued operation. This adoption impacts the comparability of our financial statements as disposals of individual operating properties generally no longer qualify as discontinued operations.
Real Estate
Upon the acquisition of real estate properties, we recognize the assets acquired, the liabilities assumed, and any noncontrolling interest as of the acquisition date, measured at their fair values. The acquisition date is the date on which we obtain
F-7
control of the real estate property. The assets acquired and liabilities assumed may consist of land, inclusive of associated rights, buildings, assumed debt, identified intangible assets and liabilities, and asset retirement obligations. Identified intangible assets generally consist of above-market leases, in-place leases, in-place tenant improvements, in-place leasing commissions, and tenant relationships. Identified intangible liabilities generally consist of below-market leases. Goodwill is recognized as of the acquisition date and measured as the aggregate fair value of the consideration transferred and any noncontrolling interests in the acquiree over the fair value of the identifiable net assets acquired. Likewise, a bargain purchase gain is recognized in current earnings when the aggregate fair value of the consideration transferred and any noncontrolling interests in the acquiree is less than the fair value of the identifiable net assets acquired. Acquisition-related costs are expensed in the period incurred. Initial valuations are subject to change until our information is finalized, which is no later than twelve months from the acquisition date.
The fair value of the tangible assets acquired, consisting of land and buildings, is determined by valuing the property as if it were vacant, and the “as-if-vacant” value is then allocated to land and buildings. Land values are derived from appraisals or other relevant market information available to us, and building values are calculated as replacement cost less depreciation or management’s estimates of the fair value of these assets using discounted cash flow analyses or similar methods believed to be used by market participants. The value of buildings is depreciated over the estimated useful life of 25 years using the straight-line method.
We determine the fair value of assumed debt by calculating the net present value of the scheduled mortgage payments using interest rates for debt with similar terms and remaining maturities that management believes we could obtain at the date of the debt assumption. Any difference between the fair value and stated value of the assumed debt is recorded as a discount or premium and amortized over the remaining life of the loan using the effective interest method.
We determine the value of above-market and below-market leases for acquired properties based on the present value (using an interest rate that reflects the risks associated with the leases acquired) of the difference between (1) the contractual amounts to be paid pursuant to the in-place leases and (2) management’s estimate of current market lease rates for the corresponding in-place leases, measured over a period equal to (a) the remaining non-cancelable lease term for above-market leases, or (b) the remaining non-cancelable lease term plus any below-market fixed rate renewal options that, based on a qualitative assessment of several factors, including the financial condition of the lessee, the business conditions in the industry in which the lessee operates, the economic conditions in the area in which the property is located, and the ability of the lessee to sublease the property during the renewal term, are reasonably assured to be exercised by the lessee for below-market leases. We record the fair value of above-market and below-market leases as intangible assets or intangible liabilities, respectively, and amortize them as an adjustment to rental income over the determined lease term.
The total value of identified real estate intangible assets acquired is further allocated to in-place leases, in-place tenant improvements, in-place leasing commissions, and tenant relationships based on our evaluation of the specific characteristics of each tenant’s lease and our overall relationship with that respective tenant. The aggregate value for tenant improvements and leasing commissions is based on estimates of these costs incurred at inception of the acquired leases, amortized through the date of acquisition. The aggregate value of in-place leases acquired and tenant relationships is determined by applying a fair value model. The estimates of fair value of in-place leases include an estimate of carrying costs during the expected lease-up periods for the respective spaces considering current market conditions. In estimating the carrying costs that would have otherwise been incurred had the leases not been in place, we include such items as real estate taxes, insurance, and other operating expenses, as well as lost rental revenue during the expected lease-up period based on current market conditions. The estimates of the fair value of tenant relationships also include costs to execute similar leases including leasing commissions, legal fees, and tenant improvements, as well as an estimate of the likelihood of renewal as determined by management on a tenant-by-tenant basis.
We amortize the value of in-place leases, in-place tenant improvements, and in-place leasing commissions to expense over the initial term of the respective leases. The tenant relationship values are amortized to expense over the initial term and any anticipated renewal periods, but in no event does the amortization period for intangible assets or liabilities exceed the remaining depreciable life of the building. Should a tenant terminate its lease, the unamortized portion of the acquired intangibles related to that tenant would be charged to expense.
F-8
The estimated remaining useful lives for acquired lease intangibles range from an ending date of January 2016 to an ending date of December 2024. Anticipated amortization associated with the acquired lease intangibles for each of the years ending December 31, 2016, through December 31, 2020, is as follows (in thousands):
2016 | $ | 4,716 | |
2017 | $ | 2,280 | |
2018 | $ | 1,125 | |
2019 | $ | 1,043 | |
2020 | $ | 1,130 | |
As of December 31, 2015 and 2014, accumulated depreciation and amortization related to our consolidated real estate properties and related lease intangibles were as follows (in thousands):
Lease Intangibles | ||||||||||||||||
Assets | Liabilities | |||||||||||||||
Buildings and Improvements | Other Lease Intangibles | Acquired Above-Market Leases | Acquired Below-Market Leases | |||||||||||||
as of December 31, 2015 | ||||||||||||||||
Cost | $ | 1,914,664 | $ | 164,636 | $ | 5,383 | $ | (52,744 | ) | |||||||
Less: accumulated depreciation and amortization | (566,464 | ) | (82,476 | ) | (3,995 | ) | 40,810 | |||||||||
Net | $ | 1,348,200 | $ | 82,160 | $ | 1,388 | $ | (11,934 | ) | |||||||
Lease Intangibles | ||||||||||||||||
Assets | Liabilities | |||||||||||||||
Buildings and Improvements | Other Lease Intangibles | Acquired Above-Market Leases | Acquired Below-Market Leases | |||||||||||||
as of December 31, 2014 | ||||||||||||||||
Cost | $ | 2,039,765 | $ | 215,913 | $ | 11,785 | $ | (59,605 | ) | |||||||
Less: accumulated depreciation and amortization | (557,429 | ) | (123,242 | ) | (9,766 | ) | 42,621 | |||||||||
Net | $ | 1,482,336 | $ | 92,671 | $ | 2,019 | $ | (16,984 | ) | |||||||
Real Estate Development
We capitalize project costs related to the development and construction of real estate (including interest and related loan fees, property taxes, insurance, and other direct costs associated with the development) as a cost of the development. Indirect costs not clearly related to development and construction are expensed as incurred. Capitalization begins when we determine that the development is probable and significant development activities are underway. We cease capitalization when the development is completed and ready for its intended use or if the intended use changes such that capitalization is no longer appropriate.
Impairment of Real Estate Related Assets
For our consolidated real estate assets, we monitor events and changes in circumstances indicating that the carrying amounts of the real estate assets may not be recoverable. When such events or changes in circumstances are present, we assess potential impairment by comparing estimated future undiscounted cash flows expected to be generated over the life of the asset including its eventual disposition, to the carrying amount of the asset. In the event that the carrying amount exceeds the estimated future undiscounted cash flows and also exceeds the fair value of the asset, we recognize an impairment loss to adjust the carrying amount of the asset to its estimated fair value. Our process to estimate the fair value of an asset involves using third-party broker valuation estimates, bona fide purchase offers, or the expected sales price of an executed sales agreement, which would be considered Level 1 or Level 2 assumptions within the fair value hierarchy. To the extent that this type of third-party information is unavailable, we estimate projected cash flows and a risk-adjusted rate of return that we believe would be used by a third party market participant in estimating the fair value of an asset. This is considered a Level 3 assumption within the fair value hierarchy. These projected cash flows are prepared internally by the Company’s asset management professionals and are updated quarterly to reflect in place and projected leasing activity, market revenue and expense growth rates, market capitalization rates, discount rates, and changes in economic and other relevant conditions. The Company’s Chief Financial Officer, Chief Investment Officer, and Chief Accounting Officer review these projected cash flows to assure that the valuation is prepared using reasonable inputs and assumptions which are consistent with market data or with assumptions that would be used by a third-party market participant and assume the highest and best use of the real estate investment. For the years ended December 31, 2015, 2014 and 2013, we recorded non-cash impairment charges of approximately $0.1 million, $13.2 million and $4.9 million, respectively, related to the impairment of consolidated real
F-9
estate assets, including discontinued operations. The impairment losses recorded were primarily related to assets assessed for impairment due to changes in management’s estimates of the intended hold period for certain of our properties.
For our unconsolidated real estate assets, at each reporting date we compare the estimated fair value of our investment to the carrying amount. An impairment charge is recorded to the extent the fair value of our investment is less than the carrying amount and the decline in value is determined to be other than a temporary decline. We had no impairment charges related to our investments in unconsolidated entities for the years ended December 31, 2015, 2014 or 2013.
In evaluating our investments for impairment, management makes several estimates and assumptions, including, but not limited to, the projected date of disposition and sales price for each property, the estimated future cash flows of each property during our estimated ownership period, and for unconsolidated investments, the estimated future distributions from the investment. A change in these estimates and assumptions could result in understating or overstating the carrying amount of our investments which could be material to our financial statements.
We undergo continuous evaluations of property level performance, credit market conditions and financing options. If our assumptions regarding the cash flows expected to result from the use and eventual disposition of our properties decrease or our expected hold periods decrease, we may incur future impairment charges on our real estate related assets. In addition, we may incur impairment charges on assets classified as held for sale in the future if the carrying amount of the asset upon classification as held for sale exceeds the estimated fair value less costs to sell.
Cash and Cash Equivalents
We consider investments in highly-liquid money market funds or investments with original maturities of three months or less to be cash equivalents.
Restricted Cash
Restricted cash includes restricted money market accounts, as required by our lenders or by leases, for anticipated tenant improvements, property taxes and insurance, and certain tenant security deposits for our consolidated properties, as well as cash committed as part of a sale agreement for renovations at a disposed property.
Accounts Receivable, net
The following is a summary of our accounts receivable as of December 31, 2015 and 2014 (in thousands):
December 31, 2015 | December 31, 2014 | |||||||
Straight-line rental revenue receivable | $ | 73,420 | $ | 73,266 | ||||
Tenant receivables | 5,972 | 10,165 | ||||||
Non-tenant receivables | 1,549 | 1,150 | ||||||
Allowance for doubtful accounts | (4,713 | ) | (1,201 | ) | ||||
Total | $ | 76,228 | $ | 83,380 | ||||
Our allowance for doubtful accounts is an estimate based on management’s evaluation of accounts where it has determined that a tenant may not meet its financial obligations. In these situations, management uses its judgment, based on the facts and circumstances, and records a reserve for that tenant against amounts due to reduce the receivable to an amount it believes is collectible. These reserves are reevaluated and adjusted as additional information becomes available.
Prepaid Expenses and Other Assets
Prepaid expenses and other assets include prepaid insurance, prepaid real estate taxes, utility and other deposits of the properties we consolidate, as well as our deferred tax assets and prepaid directors’ and officers’ insurance.
Investments in Unconsolidated Entities
Investments in unconsolidated entities consist of our noncontrolling interests in properties. We account for these investments using the equity method of accounting in accordance with GAAP. We use the equity method of accounting when we have significant influence, but not control, of the decision-making involved in the operating and financial decisions of these
F-10
investments and thereby have some responsibility to create a return on our investment. The equity method of accounting requires these investments to be initially recorded at cost and subsequently increased (decreased) for our share of net income (loss), including eliminations for our share of inter-company transactions, and increased (decreased) for contributions (distributions). To the extent that we contribute assets to an unconsolidated entity, our investment in the unconsolidated entity is recorded at our cost basis in the assets that were contributed to the entity. To the extent that our cost basis is different than the basis reflected at the entity level, the basis difference is generally amortized over the life of the related asset and included in our share of equity in operations of investments.
For unconsolidated investments that have properties under development, we capitalize interest expense to our investment basis using our weighted average interest rate of consolidated debt. Capitalization begins when we determine that the development is probable and significant development activities are underway. We cease capitalization when the development is completed and ready for its intended use or if the intended use changes such that capitalization is no longer appropriate. For the year ended December 31, 2015, we capitalized interest expense of $0.2 million for an unconsolidated entity with property under development. For the year ended December 31, 2014, we had no capitalized interest expense associated with unconsolidated entities.
Deferred Financing Fees, net
Deferred financing fees are recorded at cost and are amortized to interest expense using a straight-line method that approximates the effective interest method over the anticipated life of the related debt. The following is a summary of our deferred financing fees as of December 31, 2015 and 2014 (in thousands):
December 31, 2015 | December 31, 2014 | ||||||
Cost | $ | 15,481 | $ | 24,704 | |||
Less: accumulated amortization | (3,516 | ) | (13,921 | ) | |||
Net | $ | 11,965 | $ | 10,783 | |||
Other Intangible Assets
Other intangible assets consist of above-market ground leases on properties where a third party owns and has leased the underlying land to us. As of December 31, 2015 and 2014, the cost basis and accumulated amortization related to our consolidated other intangibles assets were as follows (in thousands):
December 31, 2015 | December 31, 2014 | ||||||
Cost | $ | 11,177 | $ | 2,978 | |||
Less: accumulated depreciation and amortization | (1,091 | ) | (834 | ) | |||
Net | $ | 10,086 | $ | 2,144 | |||
We amortize the value of other intangible assets to expense over the estimated remaining useful lives which have ending dates of December 2032 and December 2044. Anticipated amortization associated with other intangible assets for each of the years ending December 31, 2016, through December 31, 2020, is as follows (in thousands):
2016 | $ | 397 | |
2017 | $ | 397 | |
2018 | $ | 397 | |
2019 | $ | 397 | |
2020 | $ | 397 | |
Real Estate Held for Sale
We classify properties as held for sale when certain criteria are met, in accordance with GAAP. At that time, we present the assets and obligations associated with the real estate held for sale separately in our consolidated balance sheet, and we cease recording depreciation and amortization expense related to that property. Real estate held for sale is reported at the lower of its carrying amount or its estimated fair value less estimated costs to sell. In the event that a property classified as held for sale no longer meets the criteria for held for sale classification, the property is reclassified as held for use at the lower of the fair value or the depreciated basis as if the property had continued to be used. As of December 31, 2015, we had no real estate held for sale.
F-11
We had three properties classified as real estate held for sale as of December 31, 2014, one of which was reclassified to held for use in June 2015.
Derivative Financial Instruments
We record all derivatives on the balance sheet at fair value. The accounting for changes in the fair value of derivatives depends on the intended use of the derivative, whether we have elected to designate a derivative in a hedging relationship and apply hedge accounting and whether the hedging relationship has satisfied the criteria necessary to apply hedge accounting. Derivatives designated and qualifying as a hedge of the exposure to changes in the fair value of an asset, liability, or firm commitment attributable to a particular risk, such as interest rate risk, are considered fair value hedges. For derivatives designated as fair value hedges, the changes in the fair value of both the derivative instrument and the hedged items are recorded in earnings. Derivatives designated and qualifying as a hedge of the exposure to variability in expected future cash flows, or other types of forecasted transactions, are considered cash flow hedges. For derivatives designated as cash flow hedges, the effective portions of changes in the fair value of the derivative are reported in accumulated other comprehensive income (loss) and are subsequently reclassified into earnings when the hedged item affects earnings. Changes in the fair value of derivative instruments not designated as hedges and ineffective portions of hedges are recognized in earnings in the affected period. Hedge accounting generally provides for the matching of the timing of gain or loss recognition on the hedging instrument with the recognition of the changes in the fair value of the hedged asset or liability that are attributable to the hedged risk in a fair value hedge or the earnings effect of the hedged forecasted transactions in a cash flow hedge. We may enter into derivative contracts that are intended to economically hedge certain of our risk even though hedge accounting does not apply or we elect not to apply hedge accounting.
As of December 31, 2015 and 2014, we do not have any derivatives designated as fair value hedges or hedges of net investments in foreign operations, nor are derivatives being used for trading or speculative purposes.
Valuation of Series A Convertible Preferred Stock
On September 4, 2012, we issued 10,000 shares of Series A participating, voting, convertible preferred stock (the “Series A Convertible Preferred Stock”) to Behringer Harvard Services Holdings, LLC (“Services Holdings”) as described further in Footnote 12 (Equity). The shares of Series A Convertible Preferred Stock are initially recorded at fair value and classified as temporary equity, outside the stockholders’ equity section, on our consolidated balance sheets. In estimating the fair value of these shares, management considered various potential outcomes for the conversion of the shares within the context of a probability weighted expected returns model. Subsequent to the date of issuance, the Series A Convertible Preferred Stock is adjusted to its maximum redemption value at the end of each reporting period. However, to the extent that the maximum redemption value of the Series A Convertible Preferred Stock does not exceed the fair value of the shares at the date of issuance, the shares are not adjusted below the fair value at the date of issuance.
Revenue Recognition
We recognize rental income generated from all leases of consolidated real estate assets on a straight-line basis over the terms of the respective leases, including the effect of rent holidays, if any. The total net increase to rental revenue due to straight-line rent adjustments for the years ended December 31, 2015, 2014 and 2013, was approximately $11.4 million, $6.4 million, and $6.4 million, respectively. When a tenant exceeds its tenant improvement allowance, this amount is reimbursed to us and recorded as a deferred rent liability, which is recognized as rental revenue over the life of the lease. The total net increase to rental revenue due to this deferred rent for the years ended December 31, 2015, 2014 and 2013, was approximately $3.1 million, $2.0 million, and $1.5 million, respectively. Our rental revenue also includes amortization of acquired above- and below-market leases. The total net increase to rental revenue due to the amortization of acquired above- and below-market leases for the years ended December 31, 2015, 2014 and 2013, was approximately $5.8 million, $4.1 million, and $9.5 million, respectively. Revenue relating to lease termination fees are recognized on a straight-line basis amortized from the time that a tenant’s right to occupy the leased space is modified through the end of the revised lease term. We recognized lease termination fees of approximately $3.5 million, $2.7 million, and $2.3 million for the years ended December 31, 2015, 2014 and 2013, respectively. Each of the amounts presented above include rental revenue amounts recognized in discontinued operations.
Income Taxes
We have elected to be taxed as a REIT under Sections 856 through 860 of the Internal Revenue Code of 1986, as amended (the “Code”), and have qualified as a REIT since the year ended December 31, 2004. The Company is generally not subject to federal income taxes to the extent we distribute our REIT taxable income to our stockholders currently each year and we meet certain other organizational and operational requirements. In addition to the Company, our business is conducted through our
F-12
operating partnership, Tier OP, and various subsidiaries, including limited liability companies, partnerships and corporations elected to be treated as taxable REIT subsidiaries. The Company and its subsidiaries are subject to state and local income taxes on operations located in states, cities, and other jurisdictions that impose an income tax. In addition, our taxable REIT subsidiaries are subject to federal, state, and local income taxes at regular corporate tax rates.
Stock Based Compensation
We have a stock-based incentive award plan for our employees, independent directors, and consultants. Compensation cost for restricted stock and restricted stock units is measured at the grant date based on the estimated fair value of the award and will be recognized as expense over the service period based on the tiered lapse schedule and estimated forfeiture rates. Stock options are granted at the fair market value on the date of grant with fair value estimated using the Black-Scholes-Merton option valuation model that incorporates assumptions surrounding volatility, distribution yield, the risk-free interest rate, expected life, and the exercise price as compared to the underlying stock price on the grant date. Any tax benefits associated with these share-based payments are classified as financing activities in the consolidated statements of cash flows. For the years ended December 31, 2015, 2014, and 2013 we had approximately $5.0 million, $1.4 million, and $0.8 million respectively, in compensation costs related to share-based payments.
401(k) Plan
We have a 401(k) defined contribution plan (“401(k) Plan”) for the benefit of our eligible employees. Each employee may contribute up to 100% of their annual compensation, subject to specific limitations under the Code. Our 401(k) Plan allows us to make discretionary contributions during each plan year. For the years ended December 31, 2015, 2014 and 2013, we expensed approximately $0.2 million, $0.2 million, and $0.3 million in employer contributions, respectively.
Concentration of Credit Risk
We have cash and cash equivalents and restricted cash deposited in certain financial institutions in excess of federally insured levels. We have diversified our accounts with several banking institutions in an attempt to minimize exposure to any one of these institutions. We regularly monitor the financial stability of these financial institutions and believe that we are not exposed to significant credit risk in cash and cash equivalents or restricted cash.
We have properties located in Houston, Texas, which subject us to the business risk associated with our geographic concentration in this market. The percentage of our total rental revenue from our Houston, Texas, market for the years ended December 31, 2015, 2014 and 2013, are 24.4%, 22.1%, and 20.4%, respectively.
Noncontrolling Interests
Noncontrolling interests consist of our third-party owners’ proportionate share of equity in certain consolidated real estate properties, restricted stock units issued to our independent directors, and in 2014, limited partnership units issued to third parties.
Earnings per Share
Earnings per share is calculated based on the weighted average number of common shares outstanding during each period. Stock options, units of limited partnership interest, Series A Convertible Preferred Stock, restricted stock, and restricted stock units are excluded from the calculation of earnings per share for all periods presented in this report because the effect would be anti-dilutive. Gain on sale of assets is included in the calculation of loss from continuing operations per share in accordance with SEC guidelines.
Reportable Segments
Our current business consists of owning, operating, acquiring, developing, investing in, and disposing of real estate assets. All of our consolidated revenues are from our consolidated real estate properties. Our chief operating decision maker evaluates operating performance on an individual property level and views each of our real estate assets as an individual operating segment. However, all of our properties are aggregated into one reportable segment as they have similar economic characteristics.
Subsequent Events
We have evaluated subsequent events for recognition or disclosure in our consolidated financial statements.
F-13
3. New Accounting Pronouncements
In April 2014, FASB issued guidance that changes the criteria for reporting a discontinued operation. Under the new guidance, only a disposal of a component that represents a major strategic shift of an organization qualifies for discontinued operations reporting. The guidance also requires expanded disclosures about discontinued operations and new disclosures in regards to individually significant disposals that do not qualify for discontinued operations reporting. This guidance is effective for the first interim or annual period beginning on or after December 15, 2014. Upon our adoption of this guidance on January 1, 2015, sales of our individual operating properties generally no longer qualify as discontinued operations. However, properties sold or initially classified as held for sale prior to January 1, 2015, continue to be reported as discontinued operations. Properties that were held for sale prior to January 1, 2015, that were reclassified to held for use after January 1, 2015, are reported as continuing operations.
In May 2014, the FASB issued guidance to clarify the principles for recognizing revenue and to develop a common revenue standard for GAAP and International Financial Reporting Standards. The standard outlines a single comprehensive model for entities to use in accounting for revenue arising from contracts with customers. This guidance is effective for fiscal years and interim periods within those years beginning after December 15, 2017, with early adoption permitted as of December 31, 2016. The guidance permits two implementation approaches, one requiring retrospective application of the new standard with restatement of prior years and one requiring prospective application of the new standard with disclosure of results under old standards. We are currently evaluating the impact this guidance will have on our financial statements when adopted.
In June 2014, the FASB issued an update which clarifies that entities should treat performance targets that can be met after the requisite service period of a share-based payment award as performance conditions that affect vesting. The compensation expense related to such awards will be delayed until it becomes probable that the performance target will be met. This guidance is effective for fiscal years and interim periods within those years beginning after December 15, 2015, with early adoption permitted, and may be applied either prospectively or retrospectively. The adoption of this guidance will not have a material impact on our financial statements.
In August 2014, the FASB issued guidance regarding management’s responsibility in evaluating whether there is a substantial doubt about an entity’s ability to continue as a going concern and to provide related footnote disclosures. This guidance is effective for fiscal years and interim periods within those years beginning after December 15, 2016. We do not believe the adoption of this guidance will have a material impact on our disclosures.
In January 2015, the FASB issued guidance simplifying income statement presentation by eliminating the concept of extraordinary items. An entity will no longer be allowed to separately disclose extraordinary items, net of tax, in the income statement after income from continuing operations if an event or transaction is unusual in nature and occurs infrequently. This guidance is effective for fiscal years and interim periods within those years beginning after December 15, 2015, with early adoption permitted and may be applied either prospectively or retrospectively. The adoption of this guidance will not have a material impact on our financial statements.
In February 2015, the FASB issued updated guidance related to accounting for consolidation of certain legal entities. This guidance is effective for fiscal years and interim periods within those years beginning after December 15, 2015, with early adoption permitted. The adoption of this guidance will not have a material impact on our financial statements, but additional disclosures will be required related to certain of our entities that were determined to be a VIE.
In April 2015, the FASB issued guidance related to accounting for debt issuance costs. The guidance simplifies presentation by requiring debt issuance costs to be presented as a deduction from the corresponding debt liability, consistent with the presentation of debt discounts or premiums. This guidance is effective for fiscal years and interim periods within those years beginning after December 15, 2015. The adoption of this guidance will change the classification of deferred financing fees on our balance sheet, but it will not otherwise have an impact on our financial statements.
4. Fair Value Measurements
Fair value, as defined by GAAP, is a market-based measurement, not an entity-specific measurement. Therefore, a fair value measurement should be determined based on the assumptions that market participants would use in pricing an asset or liability. As a basis for considering market participant assumptions in fair value measurements, a fair value hierarchy that distinguishes between market participant assumptions based on market data obtained from sources independent of the reporting entity (observable inputs that are classified within Levels 1 and 2 of the hierarchy) and the reporting entity’s own assumptions about market participant assumptions (unobservable inputs classified within Level 3 of the hierarchy) has been established.
F-14
Assets and Liabilities Measured at Fair Value on a Recurring Basis
Derivative financial instruments
We use interest rate swaps and caps to manage our interest rate risk. The valuation of these instruments is determined using widely accepted valuation techniques including discounted cash flow analysis of the expected cash flows of each derivative. This analysis reflects the contractual terms of the derivatives, including the period to maturity, and uses observable market-based inputs, including interest rate curves and implied volatilities. The fair values of interest rate swaps and caps are determined using the market standard methodology of netting the discounted future fixed cash receipts (or payments) and the discounted expected variable cash payments (or receipts). The variable cash payments (or receipts) are based on an expectation of future interest rates (forward curves) derived from observable market interest rate curves.
We incorporate credit valuation adjustments (“CVAs”) to appropriately reflect both our own nonperformance risk and the respective counterparty’s nonperformance risk in the fair value measurements. In adjusting the fair value of our derivative contracts for the effect of nonperformance risk, we have considered the impact of netting and any applicable credit enhancements, such as collateral postings, thresholds, mutual puts, and guarantees.
Although we have determined that the majority of the inputs used to value our derivatives fall within Level 2 of the fair value hierarchy, the CVAs associated with our derivatives utilize Level 3 inputs, such as estimates of current credit spreads, to evaluate the likelihood of default by us and our counterparties. However, we have assessed the significance of the impact of the CVAs on the overall valuation of our derivative positions and have determined that they are not significant. As a result, we have determined that our derivative valuations in their entirety are classified in Level 2 of the fair value hierarchy. Unrealized gains or losses on derivatives are recorded in accumulated other comprehensive income (loss) (“OCI”) within equity at each measurement date. Our derivative financial instruments are included in “other liabilities” on our consolidated balance sheets.
The following table sets forth our financial liabilities measured at fair value on a recurring basis, which equals book value, by level within the fair value hierarchy as of December 31, 2015 and 2014 (in thousands).
Basis of Fair Value Measurements | ||||||||||||||||
Quoted Prices In Active Markets for Identical Items (Level 1) | Significant Other Observable Inputs (Level 2) | Significant Unobservable Inputs (Level 3) | ||||||||||||||
Total Fair Value | ||||||||||||||||
Derivative financial instruments: | ||||||||||||||||
2015 | ||||||||||||||||
Liabilities | $ | (3,866 | ) | $ | — | $ | (3,866 | ) | $ | — | ||||||
2014 | ||||||||||||||||
Liabilities | $ | (789 | ) | $ | — | $ | (789 | ) | $ | — | ||||||
Assets and Liabilities Measured at Fair Value on a Nonrecurring Basis
Impairment of Real Estate Related Assets
We have recorded non-cash impairment charges related to a reduction in the fair value of certain of our assets. The inputs used to calculate the fair value of these assets included projected cash flows and a risk-adjusted rate of return that management estimated would be used by a market participant in valuing these assets or by obtaining third-party broker valuation estimates, bona fide purchase offers, or the expected sales price of an executed sales agreement.
During 2015, we recorded additional impairment losses of approximately $0.1 million for final estimated closing costs incurred in connection with the disposition of One and Two Chestnut Place, which was impaired at December 31, 2014, and sold in 2015. During 2014, we recorded impairment losses of approximately $13.2 million, including losses recorded as part of our discontinued operations. During 2013, we recorded impairment losses of approximately $4.9 million for a property that was disposed. We had no impairment losses for any of our assets in continuing operations during 2013.
F-15
The following table summarizes those assets which were measured at fair value and impaired during 2015 and 2014 (in thousands):
Basis of Fair Value Measurements | ||||||||||||||||||||
Fair Value of Assets at Impairment | Quoted Prices In Active Markets for Identical Items (Level 1) | Significant Other Observable Inputs (Level 2) | Significant Unobservable Inputs (Level 3) | Total Losses | ||||||||||||||||
for the year ended December 31, 2015 | ||||||||||||||||||||
Real estate | $ | 11,489 | $ | — | $ | 11,489 | $ | — | $ | (132 | ) | |||||||||
for the year ended December 31, 2014 | ||||||||||||||||||||
Real estate | $ | 11,489 | $ | — | $ | 11,489 | $ | — | $ | (4,940 | ) | |||||||||
Real estate held for sale | $ | 42,000 | $ | — | $ | — | $ | 42,000 | $ | (8,225 | ) | |||||||||
The following table sets forth quantitative information about the unobservable inputs (Level 3) of our real estate that was recorded at fair value as of the date of its impairment during the year ended December 31, 2014 (in thousands):
Fair Value of Assets at Impairment | Valuation Technique | Unobservable Input | Range | |||||||
Real estate on which impairment losses were recognized | $ | 42,000 | Discounted Cash Flow | Discount rate | 10% | |||||
Terminal capitalization rate | 9% | |||||||||
Market rent growth rate | 2% | |||||||||
Expense growth rate | 2% to 3% | |||||||||
Financial Instruments not Reported at Fair Value
Financial instruments held at December 31, 2015 and 2014, but not measured at fair value on a recurring basis include cash and cash equivalents, restricted cash, accounts receivable, notes payable, accounts payable, payables to related parties, distributions payable, accrued liabilities, and other liabilities. With the exception of notes payable, the financial statement carrying amounts of these items approximate their fair values due to their short-term nature. Estimated fair values for notes payable have been determined using recent trading activity and/or bid-ask spreads and are classified as Level 2 in the fair value hierarchy.
Carrying amounts and the related estimated fair value of our notes payable and our notes payable associated with real estate held for sale as of December 31, 2015 and 2014, are as follows (in thousands):
December 31, 2015 | December 31, 2014 | |||||||||||||||
Carrying Amount | Fair Value | Carrying Amount | Fair Value | |||||||||||||
Notes payable | $ | 1,080,425 | $ | 1,084,625 | $ | 1,194,085 | $ | 1,216,991 | ||||||||
Notes payable associated with real estate held for sale | $ | — | $ | — | $ | 97,257 | $ | 95,011 | ||||||||
5. Real Estate Activities
Acquisitions
On June 24, 2015, we acquired a 95% interest in a ground lease of 0.81 acres, including an existing building, to be used for future development located in the central business district of Austin, Texas (“Third + Shoal”). The purchase price for our interest was $7.5 million. Substantially all of the purchase price was allocated to a ground lease intangible that will be amortized over the initial term of the lease which ends in December 2044. The lease has a renewal option to extend the term through December 2113.
On June 25, 2015, we acquired a 95% interest in 4.0 acres of vacant land to be used for future development located in the Legacy Town Center submarket of Plano, Texas (“Legacy Land”). The purchase price for our interest was $6.2 million.
On July 23, 2015, we acquired various interests in real estate, both existing operating properties and unimproved land, located in Austin, Texas, (“The Domain”) for a contract purchase price of approximately $201.1 million which after applying
F-16
purchase credits received, equates to approximately $198.2 million total consideration paid. The acquisition included two wholly-owned office buildings, interests in two additional office buildings, various tracts of land, approximately $22.0 million for parcels of land zoned for residential development (“Domain LMN”) and a deposit of approximately $15.0 million for an interest in a multifamily residential property (“Domain K”). On July 24, 2015, we sold Domain LMN to an unrelated third party for a contract sales price of approximately $22.0 million. On October 16, 2015, we completed the acquisition of Domain K for a contract purchase price of approximately $15.0 million and concurrently sold it to an unrelated third-party for a contract sales price of approximately $15.0 million. On December 16, 2015, we sold unimproved land (“Domain A”) for a contract sales price of approximately $4.3 million. Acquisition costs for The Domain of approximately $0.8 million were expensed as incurred and are included in “general and administrative” in the accompanying consolidated statements of operations and comprehensive income (loss).
The table below reflects total consideration transferred for the purchase of The Domain that was allocated to tangible and identifiable intangible assets acquired and liabilities assumed based on their fair values at the acquisition date. Initial valuations are subject to change until our information is finalized, which is no later than twelve months from the acquisition date. The table also provides information regarding assets sold subsequent to the acquisition as detailed above (in thousands):
Assets acquired and liabilities assumed | Assets sold subsequent to acquisition | Net | |||||||||
Land | $ | 16,868 | $ | (4,087 | ) | $ | 12,781 | ||||
Land held for development (1) | 74,682 | (22,000 | ) | 52,682 | |||||||
Building and improvements | 57,324 | — | 57,324 | ||||||||
Prepaid expenses and other assets | 15,000 | (15,000 | ) | — | |||||||
Lease intangibles | 12,070 | — | 12,070 | ||||||||
Investment in Domain 2 & 7 | 26,784 | — | 26,784 | ||||||||
Accrued liabilities | (1,800 | ) | — | (1,800 | ) | ||||||
Acquired below-market leases | (2,741 | ) | — | (2,741 | ) | ||||||
Total | $ | 198,187 | $ | (41,087 | ) | $ | 157,100 | ||||
___________________
(1) | On August 28, 2015, we contributed a wholly-owned tract of land valued at approximately $14.0 million to an unconsolidated entity in which we own a 50% interest. |
On December 19, 2014, as a portion of the consideration received in the sale of 222 South Riverside Plaza, we acquired a 197,000 rentable square feet property in Dallas, Texas (“5950 Sherry Lane”), for an estimated purchase price of approximately $62.6 million. Total consideration transferred was allocated to tangible and identifiable intangible assets acquired and liabilities assumed based on their fair values at the acquisition date as set forth below (in thousands):
Land | $ | 10,002 | |
Building and improvements | 50,876 | ||
Lease intangibles | 3,809 | ||
Acquired below-market leases | (2,109 | ) | |
Total | $ | 62,578 | |
F-17
Our consolidated statements of operations include the operations of The Domain and 5950 Sherry Lane for the periods from July 23, 2015 and December 19, 2014, (their respective acquisition dates) through December 31, 2015, and December 31, 2014, respectively. The following summary presents the results of operations (in thousands) for the years ended December 31, 2015 and 2014, on an unaudited proforma basis, as if the acquisitions of The Domain and 5950 Sherry Lane had occurred on January 1, 2014. This unaudited proforma condensed consolidated financial information is presented for informational purposes only and does not purport to be indicative of what financial results would have been if the transactions reflected herein had occurred on the date set forth above or been in effect during the periods indicated, nor should it be viewed as indicative of our financial results in the future.
For the Year Ended December 31, | |||||||
2015 | 2014 | ||||||
Rental revenue | $ | 288,301 | $ | 305,245 | |||
Loss from continuing operations | $ | (52,680 | ) | $ | (79,156 | ) | |
Net loss attributable to common stockholders | $ | (33,838 | ) | $ | (21,754 | ) | |
Basic and diluted weighted average common shares outstanding | 48,960 | 49,876 | |||||
Basic and diluted loss per common share | $ | (0.69 | ) | $ | (0.44 | ) | |
Sales of Real Estate Reported in Continuing Operations
As discussed in Note 3, “New Accounting Pronouncements,” we adopted the provisions of the FASB guidance regarding the reporting of discontinued operations on January 1, 2015.
The following table presents our sales of real estate for the year ended December 31, 2015, that are reported in continuing operations (in thousands):
Date of Sale | Rentable Square Footage | Contract Sales Price | Proceeds from Sale | ||||||||||||
Property Name | Location | ||||||||||||||
One and Two Chestnut Place | 03/06/15 | Worcester, MA | 218 | $ | 14,000 | $ | 11,631 | ||||||||
United Plaza | 04/23/15 | Philadelphia, PA | 617 | 114,554 | 114,983 | ||||||||||
1650 Arch Street | 04/23/15 | Philadelphia, PA | 553 | 76,290 | 76,573 | ||||||||||
1325 G Street (1) (2) | 06/30/15 | Washington, D.C. | 307 | 152,000 | 145,520 | ||||||||||
Colorado Building (1) | 06/30/15 | Washington, D.C. | 128 | 50,000 | 43,916 | ||||||||||
Domain LMN (land) | 07/24/15 | Austin, TX | — | 22,000 | 22,000 | ||||||||||
Domain K (multifamily property) | 10/16/15 | Austin, TX | — | 15,000 | 15,000 | ||||||||||
Domain A (land) | 12/16/15 | Austin, TX | — | 4,250 | 4,086 | ||||||||||
1,823 | $ | 448,094 | $ | 433,709 | |||||||||||
__________________________
(1) | On June 30, 2015, our 1325 G Street and Colorado Building properties were each sold to entities in which we acquired a noncontrolling 10% interest and the properties were deconsolidated. |
(2) In connection with the sale of this property, approximately $100.0 million of proceeds from sale were used to pay off debt secured by the property.
The following table presents the amount contributed to net income (loss) from properties sold in 2015 and included in continuing operations. These amounts exclude any gains on the sale of these properties or related gains (losses) from the extinguishment of debt in connection with the sale of these properties for the years ended December 31, 2015, 2014 and 2013 (in thousands):
For the Year Ended December 31, | |||||||||||
2015 | 2014 | 2013 | |||||||||
Contribution to net income (loss) | $ | 183 | $ | (10,305 | ) | $ | (6,039 | ) | |||
F-18
Sales and Disposals of Real Estate Reported in Discontinued Operations
As discussed in Note 3, “New Accounting Pronouncements,” we adopted the provisions of the FASB guidance regarding the reporting of discontinued operations on January 1, 2015. The following presents our sales of real estate during the years ended December 31, 2015, 2014 and 2013, that are reported as discontinued operations in the accompanying consolidated statements of operations and comprehensive income (loss) because they were sold or classified as held for sale on or before December 31, 2014 (in thousands):
Date of Disposal | Rentable Square Footage (unaudited) | Contract Sales Price | Proceeds from Sale (B) | ||||||||||||
Property Name | Location | ||||||||||||||
2015 | |||||||||||||||
250 West Pratt (A) | 03/19/15 | Baltimore, MD | 368 | $ | 63,500 | $ | 55,229 | ||||||||
Fifth Third Center (A) | 04/07/15 | Cleveland, OH | 508 | 52,750 | 4,486 | ||||||||||
876 | $ | 59,715 | |||||||||||||
2014 | |||||||||||||||
City Hall Plaza | 9/16/2014 | Manchester, NH | 210 | $ | 19,750 | $ | 19,130 | ||||||||
222 South Riverside Plaza | 12/19/2014 | Chicago, IL | 1,184 | (C) | 223,670 | ||||||||||
1,394 | $ | 242,800 | |||||||||||||
2013 | |||||||||||||||
600 & 619 Alexander Road | 2/15/2013 | Princeton, NJ | 97 | $ | 9,600 | $ | 9,128 | ||||||||
5 & 15 Wayside | 3/22/2013 | Burlington, MA | 270 | $ | 69,321 | 65,652 | |||||||||
Riverview Tower | 5/2/2013 | Knoxville, TN | 334 | $ | 24,250 | — | |||||||||
Epic Center (D) | 5/13/2013 | Wichita, KS | 289 | $ | — | — | |||||||||
One Brittany Place (D) | 5/13/2013 | Wichita, KS | 57 | $ | — | — | |||||||||
Two Brittany Place (D) | 5/13/2013 | Wichita, KS | 58 | $ | — | — | |||||||||
Tice Building (D) | 8/30/2013 | Woodcliff Lakes, NJ | 120 | $ | — | — | |||||||||
One Edgewater Plaza (D) | 8/30/2013 | Staten Island, NY | 252 | $ | — | — | |||||||||
Energy Centre | 9/12/2013 | New Orleans, LA | 757 | $ | 86,500 | 80,720 | |||||||||
Ashford Perimeter (D) | 9/13/2013 | Atlanta, GA | 288 | $ | — | — | |||||||||
10 & 120 South Riverside | 11/14/2013 | Chicago, IL | 1,411 | $ | 361,000 | 340,366 | |||||||||
3,933 | $ | 495,866 | |||||||||||||
______________
(A) | These properties were held for sale as of December 31, 2014, and the operations were classified as discontinued operations. |
(B) | In 2015, proceeds from sale are reduced by approximately $47.1 million of debt that was assumed by the purchaser. In 2014, proceeds from sale include approximately $217.8 million in debt paid off with the proceeds of the sale of these properties. In 2013, proceeds from sale are reduced by approximately $24.3 million in debt assumed by the purchasers and includes approximately $407.0 million in debt paid off with the proceeds of the sale of these properties. |
(C) | The contract sales price for the 222 South Riverside Plaza property was approximately $247.0 million in cash, excluding transaction costs, credits, prorations, and adjustments; plus the conveyance of the 5950 Sherry Lane property in Dallas, Texas, from the purchaser to us. |
(D) | Ownership of each of these properties was transferred to the associated lender pursuant to a foreclosure or deed-in-lieu of foreclosure. |
6. Investments in Unconsolidated Entities
Investments in unconsolidated entities consist of our noncontrolling interests in certain properties. On June 30, 2015, we sold our previously wholly-owned Colorado Building and 1325 G Street properties each to separate entities in which we own 10% noncontrolling interests. On July 23, 2015, we acquired a 49.84% interest in Domain 2 and Domain 7 as part of our acquisition of The Domain. On August 28, 2015, we contributed Domain 8, a wholly-owned tract of land also acquired as a part of our acquisition of The Domain, to an unconsolidated entity in which we own a 50% interest and began an office building development project on the site. In January 2013 we sold our previously wholly-owned Paces West property to a joint venture in which we own a 10% noncontrolling interest and the property was deconsolidated. On November 30, 2015, Paces West was sold to an unaffiliated third party for a contract sales price of approximately $112.5 million, resulting in a gain on sale to us of approximately $3.4 million.
F-19
The following is a summary of our investments in unconsolidated entities as of December 31, 2015 and 2014 (in thousands):
Ownership Interest | Investment Balance | |||||||||||
Property Name | December 31, 2015 | December 31, 2014 | December 31, 2015 | December 31, 2014 | ||||||||
Wanamaker Building (A) | 60.00% | 60.00% | $ | 42,898 | $ | 38,609 | ||||||
Domain 2 & Domain 7 (B) | 49.84% | N/A | 26,588 | — | ||||||||
Domain 8 (B) | 50.00% | N/A | 14,193 | — | ||||||||
Paces West | 10.00% | 10.00% | — | 1,276 | ||||||||
Colorado Building | 10.00% | (C) | 949 | — | ||||||||
1325 G Street | 10.00% | (C) | 4,370 | — | ||||||||
Total | $ | 88,998 | $ | 39,885 | ||||||||
_________________
(A) All major decisions for this entity require a vote of 70% (and in some instances 75%) of the ownership group.
(B) All major decisions for this entity are made by the other owner.
(C) Colorado Building and 1325 G Street were wholly-owned consolidated properties prior to June 30, 2015.
The summarized balance sheets of our unconsolidated entities as of December 31, 2015 and 2014 are as follows (in thousands):
as of December 31, 2015 | Total | Wanamaker | Other (50% or less owned entities) | |||||||||
Real estate, net | $ | 379,646 | $ | 128,358 | $ | 251,288 | ||||||
Real estate intangibles, net | 54,470 | 12,087 | 42,383 | |||||||||
Cash, cash equivalents and restricted cash | 23,814 | 12,819 | 10,995 | |||||||||
Other assets | 19,828 | 9,817 | 10,011 | |||||||||
Total assets | $ | 477,758 | $ | 163,081 | $ | 314,677 | ||||||
Notes payable | $ | 249,532 | $ | 76,090 | $ | 173,442 | ||||||
Accounts payable | 8,187 | 21 | 8,166 | |||||||||
Other liabilities | 19,144 | 6,386 | 12,758 | |||||||||
Equity | 200,895 | 80,584 | 120,311 | |||||||||
Total liabilities and equity | $ | 477,758 | $ | 163,081 | $ | 314,677 | ||||||
Company’s share of equity | $ | 81,982 | $ | 48,350 | $ | 33,632 | ||||||
Basis differences (1) | 7,016 | (5,452 | ) | 12,468 | ||||||||
Carrying value of the Company’s investment in unconsolidated entities | $ | 88,998 | $ | 42,898 | $ | 46,100 | ||||||
________________
(1) | This amount represents the aggregate difference between our historical cost basis and the basis reflected at the joint venture level, which is typically amortized over the life of the related assets and liabilities. Basis differences occur from impairment of investments and upon the transfer of assets that were previously owned by us into a joint venture. In addition, certain acquisition, transaction and other costs may not be reflected in the net assets at the joint venture level. |
F-20
as of December 31, 2014 | Total | Wanamaker | Other (50% or less owned entities) | |||||||||
Real estate, net | $ | 191,433 | $ | 132,341 | $ | 59,092 | ||||||
Real estate intangibles, net | 27,245 | 13,396 | 13,849 | |||||||||
Cash, cash equivalents and restricted cash | 16,039 | 12,467 | 3,572 | |||||||||
Other assets | 15,007 | 9,932 | 5,075 | |||||||||
Total assets | $ | 249,724 | $ | 168,136 | $ | 81,588 | ||||||
Notes payable | $ | 152,540 | $ | 87,540 | $ | 65,000 | ||||||
Other liabilities | 10,933 | 7,109 | 3,824 | |||||||||
Equity | 86,251 | 73,487 | 12,764 | |||||||||
Total liabilities and equity | $ | 249,724 | $ | 168,136 | $ | 81,588 | ||||||
Company’s share of equity | $ | 45,368 | $ | 44,092 | $ | 1,276 | ||||||
Basis differences (1) | (5,483 | ) | (5,483 | ) | — | |||||||
Carrying value of the Company’s investment in unconsolidated entities | $ | 39,885 | $ | 38,609 | $ | 1,276 | ||||||
_______________
(1) | This amount represents the aggregate difference between our historical cost basis and the basis reflected at the joint venture level, which is typically amortized over the life of the related assets and liabilities. Basis differences occur from impairment of investments and upon the transfer of assets that were previously owned by us into a joint venture. In addition, certain acquisition, transaction and other costs may not be reflected in the net assets at the joint venture level. |
Our equity in operations of investments represents our proportionate share of the combined earnings and losses from our investments for the period of our ownership. The summarized statements of operations of our unconsolidated entities for the years ended December 31, 2015, 2014 and 2013, are as follows (in thousands):
2015 | Total | Wanamaker | Other (50% or less owned entities) | |||||||||
Revenue | $ | 56,848 | $ | 25,659 | $ | 31,189 | ||||||
Income (loss) from continuing operations | (11,067 | ) | 2,097 | (13,164 | ) | |||||||
Gain on sale of real estate | 30,700 | — | 30,700 | |||||||||
Net income | $ | 19,633 | $ | 2,097 | $ | 17,536 | ||||||
Company’s share of net income (loss) from continuing operations | $ | 53 | $ | 1,258 | $ | (1,205 | ) | |||||
Gain on sale of real estate | 3,403 | — | 3,403 | |||||||||
Elimination of inter-entity fees | 526 | 495 | 31 | |||||||||
Equity in operations of investments | $ | 3,982 | $ | 1,753 | $ | 2,229 | ||||||
2014 | Total | Wanamaker | Other (50% or less owned entities) | |||||||||
Revenue | $ | 38,067 | $ | 26,863 | $ | 11,204 | ||||||
Income (loss) from continuing operations | (327 | ) | 2,890 | (3,217 | ) | |||||||
Net income (loss) | $ | (327 | ) | $ | 2,890 | $ | (3,217 | ) | ||||
Company’s share of net income (loss) from continuing operations | $ | 1,310 | $ | 1,734 | $ | (424 | ) | |||||
Elimination of inter-entity fees | 526 | 522 | 4 | |||||||||
Equity in operations of investments | $ | 1,836 | $ | 2,256 | $ | (420 | ) | |||||
F-21
2013 | Total | Wanamaker | Other (50% or less owned entities) | |||||||||
Revenue | $ | 57,213 | $ | 26,506 | $ | 30,707 | ||||||
Loss from continuing operations | (8,433 | ) | (147 | ) | (8,286 | ) | ||||||
Gain on sale of real estate | 96,890 | — | 96,890 | |||||||||
Net income (loss) | $ | 88,457 | $ | (147 | ) | $ | 88,604 | |||||
Company’s share of net loss from continuing operations | $ | (911 | ) | $ | (88 | ) | $ | (823 | ) | |||
Gain on sale of real estate | 24,950 | — | 24,950 | |||||||||
Elimination of inter-entity fees | 508 | 504 | 4 | |||||||||
Equity in operations of investments | $ | 24,547 | $ | 416 | $ | 24,131 | ||||||
7. Real Estate Under Development
We capitalize interest, property taxes, insurance, and direct construction costs on our real estate under development, which included the development of a new commercial office building located at 2050 W. Sam Houston Parkway in Houston, Texas (“Two BriarLake Plaza”). For the year ended December 31, 2015, we capitalized a total of approximately $6.3 million for the development of Two BriarLake Plaza, including approximately $0.9 million in interest. For the year ended December 31, 2014, we capitalized a total of approximately $27.0 million for the development of Two BriarLake Plaza, including approximately $2.5 million in interest. We completed the major construction activity of Two BriarLake Plaza in the third quarter of 2014, and the property was classified within “land” and “buildings and improvements, net” on our consolidated balance sheet at that time. On October 1, 2015, the building became fully operational and available for occupancy. We have a construction loan that provided up to $66.0 million in available borrowings for the development. As of December 31, 2015, approximately $55.8 million has been drawn on the construction loan.
8. Leasing Activity
As Lessor
Future minimum base rental payments due to us under non-cancelable leases in effect as of December 31, 2015, for operating office properties we consolidate are as follows (in thousands):
Year | Amount | |||
2016 | $ | 171,070 | ||
2017 | 160,919 | |||
2018 | 146,562 | |||
2019 | 126,394 | |||
2020 | 108,131 | |||
Thereafter | 334,075 | |||
Total | $ | 1,047,151 | ||
As Lessee
We have land that is subject to long-term ground leases and we lease office space, parking space, and equipment. Total rent expense for the years ended December 31, 2015, 2014 and 2013, was approximately $3.0 million, $2.3 million and $1.2 million, respectively.
F-22
Future minimum base rental payments payable by us under these non-cancelable leases are as follows (in thousands):
Year | Amount | |||
2016 | $ | 2,966 | ||
2017 | 2,517 | |||
2018 | 2,125 | |||
2019 | 1,642 | |||
2020 | 1,526 | |||
Thereafter | 34,425 | |||
Total | $ | 45,201 | ||
9. Income Taxes
We elected to be taxed as a REIT under Sections 856 through 860 of the Internal Revenue Code of 1986, as amended (the “Code”), and have qualified as a REIT since the year ended December 31, 2004. The Company is generally not subject to federal income taxes to the extent we distribute our REIT taxable income to our stockholders currently each year and we meet certain other organizational and operational requirements.
Substantially all of our business is conducted through our operating partnership, Tier OP, and various subsidiaries, including limited liability companies (“LLCs”), partnerships and corporations elected to be treated as taxable REIT subsidiaries. One of our subsidiaries, IPC (US), LLC, is the successor entity to IPC (US), Inc., which we acquired on December 12, 2007, and elected to treat as a separate, subsidiary REIT beginning with the tax year ended December 31, 2008. On December 31, 2013, in an effort to eliminate duplicative efforts and simplify the overall structure of our business, we converted IPC (US), Inc. into IPC (US), LLC, and in so doing, we ceased the treatment of IPC (US), Inc. as a separate, subsidiary REIT and began treating IPC (US), LLC as a single-member LLC that is disregarded for federal income tax purposes from our parent REIT. Since the conversion took place more than five years subsequent to our acquisition of IPC (US), Inc., and in a year in which the normal ten year built-in gains tax lockout period was temporarily reduced to five years, no built-in gain taxes resulted from the conversion. The conversion produced capital losses in excess of capital gains by approximately $223.1 million, which can be carried forward for up to five years and used to offset capital gains for federal income tax purposes. In addition, the conversion caused the forfeiture of approximately $55.8 million of net operating losses (“NOLs”) that were incurred by IPC (US), Inc. prior to our acquisition. As these NOLs were fully reserved prior to this forfeiture, the deferred tax asset of approximately $19.5 million and the corresponding valuation allowance were reduced to zero during the year ended December 31, 2013.
The Company and its subsidiaries are subject to state and local income taxes on operations located in states and cities that impose an income tax. In addition, our taxable REIT subsidiaries are subject to federal, state, and local income taxes at regular corporate tax rates.
At December 31, 2015 and 2014, our deferred tax assets and liabilities are as follows (in thousands):
Year Ended December 31, | |||||||
2015 | 2014 | ||||||
Deferred tax assets: | |||||||
Net operating losses | $ | 2,240 | $ | 2,746 | |||
Depreciation and amortization | 3,561 | 2,947 | |||||
Other | 38 | 367 | |||||
Deferred tax assets, gross | 5,839 | 6,060 | |||||
Valuation allowance | (4,632 | ) | (3,564 | ) | |||
Deferred tax assets, net | $ | 1,207 | $ | 2,496 | |||
Deferred tax liabilities: | |||||||
Deferred revenue | $ | 429 | $ | 817 | |||
Depreciation and amortization | 908 | 2,077 | |||||
Other | — | 6 | |||||
Deferred tax liabilities | $ | 1,337 | $ | 2,900 | |||
Our deferred tax assets and deferred tax liabilities are recorded in our consolidated balance sheet in “prepaid expenses and other assets” and in “other liabilities,” respectively.
F-23
The following table summarizes the changes in our valuation allowance for the years ended December 31, 2015, 2014 and 2013 (in thousands):
Year Ended December 31, | |||||||||||
2015 | 2014 | 2013 | |||||||||
Balance at beginning of year | $ | 3,564 | $ | 3,234 | $ | 22,315 | |||||
Additions charged to expense | 2,434 | 351 | 451 | ||||||||
Deductions | (1,366 | ) | (21 | ) | (19,532 | ) | |||||
Balance at end of year | $ | 4,632 | $ | 3,564 | $ | 3,234 | |||||
During the years ended December 31, 2015 and 2014, we believe we had no liability for unrecognized tax benefits. Our policy is to include any interest and penalties related to income taxes within the income tax line item in our consolidated statements of operations. We generally remain subject to examination by tax authorities for the past three tax years.
At December 31, 2015, TIER REIT, Inc. had net operating loss carryforwards of approximately $529.0 million for income tax purposes that expire in years 2028 to 2035, and capital loss carryforwards of approximately $223.1 million for income tax purposes that expire in 2018.
The tax basis of our net assets and liabilities exceeds the book value by approximately $290.5 million at December 31, 2015, and approximately $273.1 million at December 31, 2014.
The following table reconciles our net income (loss) attributable to common stockholders to our taxable loss for the years ended December 31, 2015, 2014 and 2013 (in thousands):
Year Ended December 31, | |||||||||||
2015 | 2014 | 2013 | |||||||||
Net income (loss) attributable to common stockholders | $ | (32,108 | ) | $ | (17,442 | ) | $ | 15,552 | |||
Depreciation and amortization | 58,535 | 66,145 | 51,860 | ||||||||
Impairment losses | 132 | 13,147 | 4,870 | ||||||||
GAAP rent adjustments | (2,051 | ) | (11,510 | ) | (14,330 | ) | |||||
Loss on dispositions | (55,891 | ) | (62,747 | ) | (71,654 | ) | |||||
(Gain) loss on troubled debt restructuring and early extinguishment of debt | 118 | 15,539 | (29,388 | ) | |||||||
Unconsolidated tax entities - primarily IPC (US), Inc. | — | — | (21,903 | ) | |||||||
Long term capital gain on exchange of stock for member interest in IPC (US), LLC | — | — | 14,130 | ||||||||
Long term capital loss on investment allowed | — | — | (14,130 | ) | |||||||
Corporate reorganization and redemption | 5,518 | — | — | ||||||||
Other | 6,149 | 1,192 | (1,341 | ) | |||||||
Taxable income (loss) | $ | (19,598 | ) | $ | 4,324 | $ | (66,334 | ) | |||
The components of the benefit (provision) for income taxes from continuing operations for the years ended December 31, 2015, 2014 and 2013 are as follows (in thousands):
Year Ended December 31, | |||||||||||
2015 | 2014 | 2013 | |||||||||
Current: | |||||||||||
Federal | $ | (8 | ) | $ | (65 | ) | $ | (2 | ) | ||
State | (1,773 | ) | (776 | ) | (944 | ) | |||||
Total current | (1,781 | ) | (841 | ) | (946 | ) | |||||
Deferred: | |||||||||||
Federal | (25 | ) | 31 | 84 | |||||||
State | 299 | 838 | 344 | ||||||||
Total deferred | 274 | 869 | 428 | ||||||||
Total income tax benefit (provision) - continuing operations | $ | (1,507 | ) | $ | 28 | $ | (518 | ) | |||
F-24
10. Derivative Instruments and Hedging Activities
We may be exposed to the risk associated with variability of interest rates that might impact our cash flows and the results of our operations. Our objectives in using interest rate derivatives are to add stability to interest expense and to manage our exposure to interest rate movements. To accomplish this objective, we have used interest rate caps and swaps as part of our interest rate risk management strategy. Our interest rate caps and swaps involve the receipt of variable-rate amounts from counterparties in exchange for us making capped-rate or fixed-rate payments over the life of the agreements without exchange of the underlying notional amount. Our hedging strategy of entering into interest rate caps and swaps, therefore, is to eliminate or reduce, to the extent possible, the volatility of cash flows.
We had no derivative financial instruments outstanding as of December 31, 2013. The following table summarizes the notional values of our derivative financial instruments (in thousands) as of December 31, 2015 and 2014. The notional values provide an indication of the extent of our involvement in these instruments at December 31, 2015 and 2014, but do not represent exposure to credit, interest rate, or market risks:
Type/Description | Notional Value | Index | Strike Rate | Effective Date | Maturity Date | |||||||
Interest rate swap - cash flow hedge | $ | 125,000 | one-month LIBOR | 1.6775% | 12/31/14 | 10/31/19 | ||||||
Interest rate swap - cash flow hedge | $ | 125,000 | one-month LIBOR | 1.6935% | 04/30/15 | 10/31/19 | ||||||
Interest rate swap - cash flow hedge | $ | 125,000 | one-month LIBOR | 1.7615% | 06/30/15 | 05/31/22 | ||||||
Interest rate swap - cash flow hedge | $ | 150,000 | one-month LIBOR | 1.7695% | 06/30/15 | 05/31/22 | ||||||
The table below presents the fair value of our derivative financial instruments, included in “other liabilities” on our consolidated balance sheets, as of December 31, 2015 and 2014 (in thousands):
Derivatives designated as hedging instruments: | For the Year Ended December 31, | ||||||
2015 | 2014 | ||||||
Interest rate swaps | $ | (3,866 | ) | $ | (789 | ) | |
Total derivatives | $ | (3,866 | ) | $ | (789 | ) | |
The tables below present the effect of the change in fair value of derivative financial instruments in our consolidated statements of operations and comprehensive income (loss) for the years ended December 31, 2015, 2014 and 2013 (in thousands):
Derivatives in Cash Flow Hedging Relationship
Gain (loss) recognized in OCI on derivative (effective portion) for the Year Ended December 31, | |||||||||||
2015 | 2014 | 2013 | |||||||||
Interest rate caps | $ | — | $ | — | $ | 251 | |||||
Interest rate swaps | (3,077 | ) | (789 | ) | 1,428 | ||||||
Total | $ | (3,077 | ) | $ | (789 | ) | $ | 1,679 | |||
Amount of loss reclassified from OCI into income (effective portion) for the Year Ended December 31, | ||||||||||||
Location | 2015 | 2014 | 2013 | |||||||||
Interest expense (1) | $ | 5,381 | $ | 5 | $ | 1,006 | ||||||
Total | $ | 5,381 | $ | 5 | $ | 1,006 | ||||||
____________
(1) | Increases in fair value as a result of accrued interest associated with our swap and cap transactions are recorded in accumulated OCI and subsequently reclassified into income. Such amounts are shown net in the statements of changes in equity and offset dollar for dollar. |
Amounts reported in accumulated OCI related to derivatives will be reclassified to interest expense as interest payments and accruals are made on our variable-rate debt. During the next twelve months, we estimate that approximately $5.5 million will be reclassified as an increase to interest expense.
F-25
We have agreements with our derivative counterparties that contain provisions where if we default on any of our indebtedness, for at least 30 days, during which time such default has not been remedied, and in all cases provided that the aggregate amount of all such default is not less than $10.0 million for recourse debt or $75.0 million for non-recourse debt, then we could also be declared in default on our derivative obligations.
As of December 31, 2015, the fair value of our derivatives in a net liability position, which includes accrued interest but excludes any adjustment for nonperformance risk, related to these agreements was approximately $4.2 million. As of December 31, 2015, we have not posted any collateral related to these agreements. If we had breached any of these provisions at December 31, 2015, we could have been required to settle our obligations under the agreements at the termination value of approximately $4.2 million.
11. Notes Payable
Our notes payable were approximately $1.1 billion and $1.2 billion in principal amount at December 31, 2015 and 2014, respectively, and were secured by real estate assets with a carrying value of approximately $1.4 billion and $1.7 billion as of December 31, 2015 and 2014, respectively. As of December 31, 2015, all of our outstanding debt was fixed rate debt (or effectively fixed rate debt, through the use of interest rate swaps), with the exception of approximately $195.8 million of borrowings on our revolving line of credit and the construction loan for Two BriarLake Plaza. As of December 31, 2015, the stated annual interest rates on our outstanding notes payable, excluding mezzanine financing, ranged from 1.94% to 6.09%. We had mezzanine financing on one property with a stated annual interest rate of 9.80%. As of December 31, 2015, the effective weighted average interest rate for our consolidated notes payable is approximately 4.10%. For our loan that is in default and detailed below, we incur a default interest rate that is 500 basis points higher than the stated interest rate, which results in an overall effective weighted average interest rate of 4.33% for our consolidated notes payable and an increase in 2015 interest expense of approximately $1.0 million. We anticipate, although we can provide no assurance, that when this property is sold, or if ownership of this property is conveyed to the lender, the default interest will be forgiven.
Our loan agreements generally require us to comply with certain reporting and financial covenants. As of December 31, 2015, we were in default on a non-recourse property loan with an outstanding balance of approximately $48.8 million secured by our Fifth Third Center property located in Columbus, Ohio, which has a carrying value of approximately $36.2 million as of December 31, 2015, and we are currently working with the lender to dispose of this property on their behalf. As of December 31, 2015, other than the default discussed above, we believe we were in compliance with the covenants under each of our loan agreements, including our credit facility, and our notes payable had maturity dates that range from July 2016 to June 2022.
The following table summarizes our notes payable as of December 31, 2015, (in thousands):
Principal payments due in: | |||
2016 | $ | 193,771 | |
2017 | 130,021 | ||
2018 | 141,622 | ||
2019 | 251,723 | ||
2020 | 1,814 | ||
Thereafter | 361,474 | ||
Total | $ | 1,080,425 | |
Credit Facility
Through our operating partnership, Tier OP, we have a secured credit agreement providing for total borrowings of up to $750.0 million and an accordion feature that allows Tier OP to increase the aggregate commitment by up to $225.0 million. The facility consists of a $250.0 million term loan, a $275.0 million term loan, and a $225.0 million revolving line of credit. The $250.0 million term loan matures on December 18, 2019. The $275.0 million term loan matures on June 30, 2022. The revolving line of credit matures on December 18, 2018, and can be extended one additional year subject to certain conditions and payment of an extension fee. The annual interest rate on the credit facility is equal to either, at our election, (1) the “base rate” (calculated as the greatest of (i) the agent’s “prime rate”; (ii) 0.5% above the Federal Funds Effective Rate; or (iii) the LIBOR Market Index Rate plus 1.0%) plus the applicable margin or (2) LIBOR for an interest period of one, three, or six months plus the applicable margin. The applicable margin will be determined based on the ratio of total indebtedness to total asset value and ranges from 45 to 160 basis points for base rate loans and from 145 to 260 basis points for LIBOR loans. We have entered into interest rate swap
F-26
agreements to hedge interest rates on $525.0 million of these borrowings to manage our exposure to future interest rate movements. All amounts owed are guaranteed by us and certain subsidiaries of Tier OP. As of December 31, 2015, draws under the credit facility are secured by a perfected first priority lien and security interest in a collateral pool that consisted of 15 properties owned by certain of our subsidiaries. As of December 31, 2015, we believe we have met certain financial covenants for two consecutive quarters that will enable the secured credit facility to convert to an unsecured structure. As of December 31, 2015, we had approximately $525.0 million in borrowings outstanding under the term loans, and approximately $140.0 million in borrowings outstanding under the revolving line of credit with an additional $75.3 million of borrowings available under the facility as a whole. As of December 31, 2015, the weighted average effective interest rate for borrowings under the credit facility as a whole, inclusive of our interest rate swaps, was approximately 3.20%.
Troubled Debt Restructuring
We had no troubled debt restructuring in 2015 or 2014. In 2013, we sold two properties in which the proceeds were used to fully settle the related debt on each property at a discount and, pursuant to deeds-in-lieu of foreclosure, we transferred ownership of three properties to the associated lenders. These transactions were each accounted for as a full settlement of debt. For the year ended December 31, 2013, the above transactions resulted in a gain on troubled debt restructuring of approximately $36.7 million and was equal to approximately $0.74 in earnings per common share, on both a basic and diluted income per share basis and as retroactively adjusted for the one-for-six reverse stock split that was effected on June 2, 2015. The gain on troubled debt restructuring is included in our discontinued operations.
12. Equity
On June 2, 2015, we filed articles of amendment to our charter to effect a one-for-six reverse stock split of our existing common stock. All share and per share information presented below has been retroactively adjusted to reflect the impact of the reverse stock split.
Listing on NYSE and Tender Offer
On July 23, 2015, we listed our shares of common stock on the NYSE under the ticker symbol “TIER.” We believe that listing on the NYSE best positions us to maximize stockholder value over the long term by giving us access to potential additional capital for future growth and provides an opportunity for liquidity to those stockholders who may desire to sell their shares.
In connection with the NYSE listing, we commenced a modified “Dutch Auction” tender offer to purchase for cash up to $50.0 million of our shares of common stock. The tender offer expired on August 19, 2015, with 2,631,578 shares tendered and accepted at $19.00 per share for an aggregate purchase price of approximately $50.0 million.
Limited Partnership Units
On December 4, 2015, we exercised our call right with regard to the outstanding limited partnership interests in Tier OP held by third-parties, converting their interests (72,097 units) to cash (approximately $1.1 million). At December 31, 2015, Tier OP had no units of limited partnership interest held by third parties.
Series A Convertible Preferred Stock
As of December 31, 2015, we had outstanding 10,000 shares of the Series A Convertible Preferred Stock to Services Holdings. Management estimated the fair value of the shares to be approximately $2.7 million at the date of issuance. Due to the increase in our estimated stock value, the redemption value of the Series A Convertible Preferred Stock as of December 31, 2014, was greater than the estimated fair value of these shares at the date of issuance and the value of these shares was increased to approximately $4.6 million. In connection with the listing of our common stock on the NYSE on July 23, 2015, an automatic conversion of the Series A Convertible Preferred Stock was triggered. The determination of the number of shares of our common stock to be issued as a result of the conversion of the Series A Convertible Preferred Stock generally will amount to 10% of the excess of (a) the Conversion Company Value, as defined in the Articles Supplementary, which is based on the average daily closing price of our common stock for a 30-day trading period beginning 180 days after our listing date over (b) the Effective Date Value of our common stock, as defined in the Articles Supplementary. The Effective Date Value is based on a share price of approximately $25.95 per share. As a result, if the average daily closing price of our common stock for the 30-day trading period beginning 180 days after our listing date is less than approximately $25.95 per share, then no shares of common stock will be issued. The closing price of our common stock on December 31, 2015 was $14.75. Assuming the Conversion Company Value was based on the December 31, 2015, closing price of our common stock, no shares of common stock would be issued. Based on the lower Conversion Company Value, the carrying value of the Series A Convertible Preferred Stock was reduced in 2015 by approximately $1.9 million to its initial valuation of $2.7 million as required under accounting guidance.
F-27
Stock Plans
Our 2015 Equity Incentive Plan allows for equity-based incentive awards to be granted to our employees, non-employee directors, and persons (as specified in the plan) as detailed below. The 2015 Equity Incentive Plan was approved by our stockholders on December 3, 2015, and replaces the 2005 Incentive Award Plan, which expired in March 2015.
Stock options. As of December 31, 2015 and 2014, we had outstanding options held by our independent directors to purchase 12,495 shares of our common stock at a weighted average exercise price of $40.13 per share. These options have a maximum term of ten years and were exercisable one year after the date of grant. The options were anti-dilutive to earnings per share for each period presented.
Restricted stock units. We have outstanding restricted stock units (“RSUs”) held by our independent directors. These RSUs vest 13 months after the grant date. Subsequent to vesting, the RSUs will be converted to an equivalent number of shares of common stock upon the earlier to occur of the following events or dates: (i) separation from service for any reason other than cause; (ii) a change in control of the Company; (iii) death; or (iv) specific dates chosen by the independent directors that range from June 2016 to December 2020. Expense is measured at the grant date based on the estimated fair value of the award and is recognized over the vesting period. The RSUs were anti-dilutive to earnings per share for each period presented.
The following is a summary of the number of RSUs outstanding as of December 31, 2015 and 2014:
December 31, 2015 | December 31, 2014 | ||||||||||||
Units | Weighted Average Price per unit | Units | Weighted Average Price per unit | ||||||||||
Outstanding at the beginning of the year | 13,841 | $ | 24.69 | 6,235 | $ | 24.06 | |||||||
Issued | 18,597 | $ | 14.79 | 7,606 | $ | 25.20 | |||||||
Forfeited | (2 | ) | $ | 24.82 | — | $ | — | ||||||
Converted | (3,731 | ) | $ | 24.57 | — | $ | — | ||||||
Outstanding at the end of the year (1) | 28,705 | $ | 18.29 | 13,841 | $ | 24.69 | |||||||
_____________
(1) | As of December 31, 2015, 10,108 RSUs are vested. |
Restricted stock. We have outstanding restricted stock held by employees. For restricted stock issued in December 2015, restrictions lapse one-third on the grant date, one-third one year after the grant date, and one-third two years after the grant date. For restricted stock issued in January 2015, 2014 and 2013, restrictions lapse in 25% increments annually over the four-year period following the grant date. Compensation cost is measured at the grant date, based on the estimated fair value of the award and is recognized as expense over the service period based on a tiered lapse schedule and estimated forfeiture rates. The restricted stock was anti-dilutive to earnings per share for each period presented. The following is a summary of the number of shares of restricted stock outstanding as of December 31, 2015 and 2014:
December 31, 2015 | December 31, 2014 | ||||||||||||
Shares | Weighted Average Price per share | Shares | Weighted Average Price per share | ||||||||||
Outstanding at the beginning of the year | 118,563 | $ | 24.73 | 70,554 | $ | 24.06 | |||||||
Issued | 245,492 | $ | 20.34 | 75,011 | $ | 25.20 | |||||||
Forfeiture | (2,203 | ) | $ | 25.64 | (9,364 | ) | $ | 24.73 | |||||
Restrictions lapsed | (79,947 | ) | $ | 19.25 | (17,638 | ) | $ | 24.06 | |||||
Outstanding at the end of the year | 281,905 | $ | 22.46 | 118,563 | $ | 24.73 | |||||||
Distributions
Our board of directors reinstated quarterly cash distributions in the second quarter of 2015, at $0.18 per share of common stock and has authorized cash distributions in the same amount for each of the third and fourth quarters of 2015. Distributions declared for each quarter were paid in the subsequent quarter. Of the amounts distributed by us in 2015, 100% represented a return of capital.
F-28
The following table reflects the distributions declared for our common stock, Series A Convertible Preferred Stock, and noncontrolling interests during the years ended December 31, 2015 and 2014 (in thousands). Distributions to noncontrolling interests in 2014 included distributions made to third-party members related to certain non-wholly-owned real estate properties.
Common Stockholders | Preferred Stockholders | Noncontrolling Interests | |||||||||||||
Total | |||||||||||||||
2015 | |||||||||||||||
1st Quarter | $ | — | $ | — | $ | — | $ | — | |||||||
2nd Quarter | 9,028 | 9,011 | 2 | 15 | |||||||||||
3rd Quarter | 8,556 | 8,539 | 2 | 15 | |||||||||||
4th Quarter | 8,596 | 8,576 | 2 | 18 | |||||||||||
Total | $ | 26,180 | $ | 26,126 | $ | 6 | $ | 48 | |||||||
2014 | |||||||||||||||
1st Quarter | $ | 33 | $ | — | $ | — | $ | 33 | |||||||
2nd Quarter | — | — | — | — | |||||||||||
3rd Quarter | 4 | — | — | 4 | |||||||||||
4th Quarter | — | — | — | — | |||||||||||
Total | $ | 37 | $ | — | $ | — | $ | 37 | |||||||
13. Related Party Transactions
We previously purchased certain administrative services from BHT Advisors, LLC (“BHT Advisors”), such as human resources, shareholder services, and information technology. Effective June 30, 2015, we terminated the administrative services agreement and now perform each of these services internally. We also pay BHT Advisors acquisition fees related to the development of Two BriarLake Plaza. Upon notice of termination, we paid BHT Advisors approximately $2.7 million, which represents 0.75 times the gross amount of all service charges payable with respect to such terminated services for the trailing 12-month period ending with the last full month prior to the delivery of notice of termination.
HPT Management Services, LLC (“HPT Management”) previously provided property management services for substantially all of our properties. Effective June 30, 2015, we internalized the management of these properties and we exercised our buyout option, whereupon (1) we acquired and assumed certain assets and certain liabilities of HPT Management and (2) HPT Management irrevocably waived the non-solicitation and non-hire provisions of the management agreement with respect to certain persons, including employees of HPT Management providing property management functions on our behalf. We paid HPT Management approximately $7.5 million, which represents 0.8 times the gross amount of all management and oversight fees earned by HPT Management under the management agreement for the trailing 12-month period ending with the last full month prior to delivery of the notice. However, we anticipate future reconciliations of property management fees and construction management fees payable to HPT Management related to two of our properties.
Current board members, Messrs. Robert S. Aisner and M. Jason Mattox, serve as officers and are partial owners of the ultimate parent entity of BHT Advisors and HPT Management. As part of our self-management transaction completed in August 2012, Services Holdings has the right to designate two nominees to serve as directors of the Company and has designated Messrs. Aisner and Mattox as nominees to serve on our board. In connection with the listing of our common stock on the NYSE on July 23, 2015, an automatic conversion of the Series A Convertible Preferred Stock was triggered. The determination of the number of shares of our common stock to be issued as a result of the conversion will occur on March 2, 2016, and the associated nomination right will terminate at that time.
F-29
The following is a summary of the related party fees and costs we incurred with these entities during the years ended December 31, 2015, 2014 and 2013 (in thousands):
Year Ended December 31, | |||||||||||
2015 | 2014 | 2013 | |||||||||
BHT Advisors, acquisition fees | $ | 196 | $ | 704 | $ | 934 | |||||
BHT Advisors, other fees and reimbursement for services provided | 1,263 | 2,328 | 2,426 | ||||||||
BHT Advisors, termination fee | 2,706 | — | — | ||||||||
HPT Management, property and construction management fees | 5,272 | 11,369 | 13,191 | ||||||||
HPT Management, reimbursement of costs and expenses | 7,992 | 18,557 | 21,022 | ||||||||
HPT Management, buyout fee | 7,595 | — | — | ||||||||
Total | $ | 25,024 | $ | 32,958 | $ | 37,573 | |||||
Expensed | $ | 24,054 | $ | 30,909 | $ | 35,356 | |||||
Capitalized to real estate under development | — | 487 | 934 | ||||||||
Capitalized to buildings and improvements, net | 970 | 1,562 | 1,283 | ||||||||
Total | $ | 25,024 | $ | 32,958 | $ | 37,573 | |||||
At December 31, 2015 and 2014, we had payables to related parties of approximately $0.3 million and $2.0 million, respectively, consisting primarily of expense reimbursements payable to BHT Advisors and property management fees payable to HPT Management.
14. Commitments and Contingencies
As of December 31, 2015, we had commitments of approximately $38.6 million for future tenant improvements and leasing commissions.
We have employment agreements with five of our executive officers. The term of each employment agreement ends on July 15, 2018, provided that the term will automatically continue for an additional one-year period unless either party provides 60 days written notice of non-renewal prior to the expiration of the initial term. The agreements provide for lump sum payments and an immediate lapse of restrictions on compensation received under the long-term incentive plan upon termination of employment without cause. As a result, in the event we terminated all of these agreements without cause as of December 31, 2015, we would have recognized approximately $12.0 million in compensation expense.
F-30
15. Supplemental Cash Flow Information
Supplemental cash flow information is summarized below for the years ended December 31, 2015, 2014 and 2013 (in thousands):
2015 | 2014 | 2013 | |||||||||
Interest paid, net of amounts capitalized | $ | 54,608 | $ | 82,819 | $ | 106,946 | |||||
Income taxes paid | $ | 1,024 | $ | 1,054 | $ | 1,440 | |||||
Non-cash investing activities: | |||||||||||
Property and equipment additions in accounts payable and accrued liabilities | $ | 8,906 | $ | 26,193 | $ | 25,666 | |||||
Amortization of deferred financing fees in building and improvements, net | $ | 240 | $ | 913 | $ | — | |||||
Transfer of real estate and lease intangibles through cancellation of debt | $ | — | $ | — | $ | 52,361 | |||||
Sale of real estate and lease intangibles to unconsolidated joint venture | $ | — | $ | — | $ | 60,660 | |||||
Acquisition of real estate through exchange of real estate | $ | — | $ | 62,578 | $ | — | |||||
Contribution of land to non wholly-owed entity | $ | 14,002 | $ | — | $ | — | |||||
Liabilities assumed through the purchase of real estate | $ | 1,800 | $ | — | $ | — | |||||
Non-cash financing activities: | |||||||||||
Accrual for distributions declared | $ | 8,596 | $ | — | $ | — | |||||
Assumption of debt by unconsolidated joint venture | $ | — | $ | — | $ | 82,291 | |||||
Mortgage notes assumed by purchaser | $ | 47,074 | $ | — | $ | 24,250 | |||||
Cancellation of debt through transfer of real estate | $ | — | $ | — | $ | 57,934 | |||||
Cancellation of debt through discounted payoff | $ | — | $ | — | $ | 9,530 | |||||
Dilution of Series A Convertible Preferred Stock | $ | 1,926 | $ | — | $ | — | |||||
Accretion of Series A Convertible Preferred Stock | $ | — | $ | 1,926 | $ | — | |||||
Financing costs in accrued liabilities | $ | — | $ | 11 | $ | 65 | |||||
Unrealized loss on interest rate derivatives | $ | 3,077 | $ | — | $ | — | |||||
Contributions from noncontrolling interests | $ | 1,000 | $ | — | $ | — | |||||
16. Discontinued Operations and Real Estate Held for Sale
As discussed in Note 3, “New Accounting Pronouncements,” we adopted the provisions of the FASB guidance regarding the reporting of discontinued operations on January 1, 2015. During 2015, we disposed of two consolidated properties that had been held for sale of as December 31, 2014. During 2014, and 2013, we disposed of two and eleven consolidated properties, respectively.
F-31
The table below summarizes the results of operations for the properties that have been classified as discontinued operations in the accompanying consolidated statements of operations and comprehensive income (loss) for the years ended December 31, 2015, 2014 and 2013 (in thousands):
Year Ended December 31, | |||||||||||
2015 | 2014 | 2013 | |||||||||
Rental revenue | $ | 4,615 | $ | 52,193 | $ | 118,471 | |||||
Expenses | |||||||||||
Property operating expenses | 1,734 | 16,563 | 34,464 | ||||||||
Interest expense | 720 | 17,008 | 25,335 | ||||||||
Real estate taxes | 633 | 9,374 | 20,046 | ||||||||
Property management fees | 121 | 1,499 | 3,320 | ||||||||
Asset impairment losses | — | — | 4,879 | ||||||||
Depreciation and amortization | — | 23,498 | 49,217 | ||||||||
Total expenses | 3,208 | 67,942 | 137,261 | ||||||||
Provision for income taxes | — | — | (1 | ) | |||||||
Loss on early extinguishment of debt (1) | — | (15,136 | ) | (1,416 | ) | ||||||
Gain on troubled debt restructuring | — | — | 36,726 | ||||||||
Interest and other income (expense) | — | (9 | ) | 9 | |||||||
Income (loss) from discontinued operations | 1,407 | (30,894 | ) | 16,528 | |||||||
Gain on sale of discontinued operations | 15,383 | 90,221 | 40,436 | ||||||||
Discontinued operations | $ | 16,790 | $ | 59,327 | $ | 56,964 | |||||
_____________
(1) | The loss on early extinguishment of debt was comprised of the write-off of deferred financing fees and early termination fees associated with the sale of certain properties and the payoff of related debt. |
As of December 31, 2015, we had no properties classified as real estate held for sale. We had three properties classified as real estate held for sale as of December 31, 2014. During 2015, two of those properties were sold, and the other property was reclassified to held for use. In connection with the property reclassified to held for use, approximately $1.3 million in depreciation and amortization was recorded to adjust the depreciated basis to be as if the property had continued to be used during the period it was held for sale. The major classes of assets and obligations associated with real estate held for sale are as follows (in thousands):
December 31, 2014 | ||||
Land | $ | 10,977 | ||
Buildings and improvements, net of approximately $38.0 million in accumulated depreciation | 108,891 | |||
Accounts receivable and other assets, net of approximately $0.1 million in allowance for doubtful accounts | 7,290 | |||
Lease intangibles, net of approximately $15.5 million in accumulated amortization | 10,482 | |||
Assets associated with real estate held for sale | $ | 137,640 | ||
Notes payable | $ | 97,257 | ||
Acquired below-market leases, net of approximately $3.2 million in accumulated amortization | 1,513 | |||
Other liabilities | 9,573 | |||
Obligations associated with real estate held for sale | $ | 108,343 | ||
F-32
17. Quarterly Results (Unaudited)
Presented below is a summary of the unaudited quarterly financial information for the years ended December 31, 2015 and 2014 (in thousands, except per share data). As discussed in Note 3, “New Accounting Pronouncements,” effective January 1, 2015, we adopted the Financial Accounting Standards Board (“FASB”) guidance that changes the criteria for reporting a discontinued operation. This adoption impacts the comparability of our financial statements for 2015 compared to 2014, as disposals of individual operating properties generally no longer qualify as discontinued operations after January 1, 2015.
2015 Quarters Ended | March 31 | June 30 | September 30 | December 31 | ||||||||||||
Rental revenue | $ | 75,819 | $ | 70,038 | $ | 69,423 | $ | 67,085 | ||||||||
Loss from continuing operations before gain on sale of assets | $ | (15,998 | ) | $ | (51,693 | ) | $ | (16,171 | ) | $ | (11,568 | ) | ||||
Discontinued operations | 10,096 | 5,956 | 424 | 314 | ||||||||||||
Gain (loss) on sale of assets | — | 44,564 | (85 | ) | (2 | ) | ||||||||||
Net loss | $ | (5,902 | ) | $ | (1,173 | ) | $ | (15,832 | ) | $ | (11,256 | ) | ||||
Net loss attributable to common stockholders | $ | (5,892 | ) | $ | (1,151 | ) | $ | (13,849 | ) | $ | (11,216 | ) | ||||
Basic and diluted weighted average common shares outstanding (1) | 49,891 | 49,893 | 48,843 | 47,244 | ||||||||||||
Basic and diluted loss per common share (1) | $ | (0.12 | ) | $ | (0.02 | ) | $ | (0.28 | ) | $ | (0.24 | ) | ||||
2014 Quarters Ended | March 31 | June 30 | September 30 | December 31 | ||||||||||||
Rental revenue | $ | 70,060 | $ | 71,234 | $ | 72,157 | $ | 74,616 | ||||||||
Loss from continuing operations | $ | (25,563 | ) | $ | (14,109 | ) | $ | (14,431 | ) | $ | (20,752 | ) | ||||
Discontinued operations | (4,094 | ) | (3,191 | ) | (1,949 | ) | 68,561 | |||||||||
Net income (loss) | $ | (29,657 | ) | $ | (17,300 | ) | $ | (16,380 | ) | $ | 47,809 | |||||
Net income (loss) attributable to common stockholders | $ | (29,614 | ) | $ | (17,279 | ) | $ | (16,355 | ) | $ | 45,806 | |||||
Basic and diluted weighted average common shares outstanding (1) | 49,871 | 49,877 | 49,877 | 49,877 | ||||||||||||
Basic and diluted income (loss) per common share (1) | $ | (0.59 | ) | $ | (0.35 | ) | $ | (0.33 | ) | $ | 0.92 | |||||
__________________
(1) Amounts have been adjusted retroactively to reflect a one-for-six reverse stock split effected on June 2, 2015.
F-33
TIER REIT, Inc.
Valuation and Qualifying Accounts
Schedule II
December 31, 2015
(in thousands)
Allowance for Doubtful Accounts | Balance at Beginning of Year | Charged to Costs and Expenses | Charged to Other Accounts | Write-Offs, Net of Recoveries | Balance at End of Year | |||||||||||||||
Year to date December 31, 2015 | $ | 1,201 | $ | 791 | $ | 2,946 | $ | (225 | ) | $ | 4,713 | |||||||||
Year to date December 31, 2014 | $ | 1,289 | $ | 725 | $ | (45 | ) | $ | (768 | ) | $ | 1,201 | ||||||||
Year to date December 31, 2013 | $ | 1,263 | $ | 418 | $ | — | $ | (392 | ) | $ | 1,289 | |||||||||
F-34
TIER REIT, Inc. | ||||||||||||||||||||||||||||||||
Real Estate and Accumulated Depreciation | ||||||||||||||||||||||||||||||||
Schedule III | ||||||||||||||||||||||||||||||||
December 31, 2015 | ||||||||||||||||||||||||||||||||
(in thousands) | ||||||||||||||||||||||||||||||||
Gross amount | ||||||||||||||||||||||||||||||||
Initial cost | Costs capitalized | at which | ||||||||||||||||||||||||||||||
Building and | subsequent | carried at | Accumulated | Year of | Date | |||||||||||||||||||||||||||
Property Name | Location | Encumbrances | Land (1) | Improvements | to acquisition (2) | close of period (3) | depreciation | construction | acquired | |||||||||||||||||||||||
Lawson Commons | St. Paul, MN | $ | 665,000 | (4 | ) | $ | 2,021 | $ | 75,881 | $ | 8,149 | $ | 86,051 | $ | 33,794 | 1999 | 06/2005 | |||||||||||||||
Buena Vista Plaza | Burbank, CA | — | (4 | ) | 3,806 | 28,368 | 534 | 32,708 | 11,934 | 1991 | 07/2005 | |||||||||||||||||||||
Woodcrest Corporate Center | Cherry Hill, NJ | — | 5,927 | 49,977 | 4,756 | 60,660 | 21,546 | 1960 | 01/2006 | |||||||||||||||||||||||
Burnett Plaza | Ft. Worth, TX | — | (4 | ) | 6,239 | 157,171 | 25,548 | 188,958 | 69,472 | 1983 | 02/2006 | |||||||||||||||||||||
The Terrace Office Park | Austin, TX | — | (4 | ) | 17,330 | 124,551 | 15,038 | 156,919 | 53,009 | 1997-2002 | 06/2006 | |||||||||||||||||||||
Bank of America Plaza | Charlotte, NC | — | (4 | ) | 26,656 | 185,215 | 28,416 | 240,287 | 74,120 | 1974 | 10/2006 | |||||||||||||||||||||
Three Parkway | Philadelphia, PA | 63,315 | 7,905 | 69,033 | 16,141 | 93,079 | 29,484 | 1970 | 10/2006 | |||||||||||||||||||||||
One & Two Eldridge Place | Houston, TX | 70,884 | 6,605 | 89,506 | 17,381 | 113,492 | 39,527 | 1984-1986 | 12/2006 | |||||||||||||||||||||||
Centreport Office Center | Ft. Worth, TX | — | (4 | ) | 3,175 | 12,917 | (6,174 | ) | 9,918 | 3,080 | 1999 | 06/2007 | ||||||||||||||||||||
FOUR40 | Chicago, IL | — | (4 | ) | 23,285 | 265,099 | (73,706 | ) | 214,678 | 34,100 | 1984 | 11/2007 | ||||||||||||||||||||
111 Woodcrest | Cherry Hill, NJ | — | (4 | ) | 1,000 | 5,417 | (853 | ) | 5,564 | 1,652 | 1964 | 11/2007 | ||||||||||||||||||||
Fifth Third Center | Columbus, OH | 48,789 | 3,500 | 54,242 | (20,289 | ) | 37,453 | 3,944 | 1928 | 12/2007 | ||||||||||||||||||||||
One Oxmoor Place | Louisville, KY | — | (4 | ) | 2,851 | 17,614 | 2,590 | 23,055 | 6,825 | 1989 | 12/2007 | |||||||||||||||||||||
Hurstbourne Place | Louisville, KY | — | 4,587 | 30,203 | (12,536 | ) | 22,254 | 7,239 | 1982 | 12/2007 | ||||||||||||||||||||||
Hurstbourne Park | Louisville, KY | — | 2,297 | 12,728 | (2,109 | ) | 12,916 | 3,785 | 1971 | 12/2007 | ||||||||||||||||||||||
Hurstbourne Plaza (5) | Louisville, KY | — | 4,000 | 10,054 | (186 | ) | 13,868 | 9,538 | 1971 | 12/2007 | ||||||||||||||||||||||
Forum Office Park | Louisville, KY | — | (4 | ) | 6,811 | 32,548 | 9,758 | 49,117 | 13,807 | 1984 | 12/2007 | |||||||||||||||||||||
Lakeview | Louisville, KY | — | 1,468 | 8,574 | (2,594 | ) | 7,448 | 1,436 | 1989 | 12/2007 | ||||||||||||||||||||||
Steeplechase Place | Louisville, KY | — | 1,766 | 7,424 | 1,578 | 10,768 | 2,857 | 1989 | 12/2007 | |||||||||||||||||||||||
Hunnington | Louisville, KY | — | 978 | 5,507 | 329 | 6,814 | 1,833 | 1986 | 12/2007 | |||||||||||||||||||||||
Eisenhower I | Tampa, FL | — | (4 | ) | 2,602 | 25,054 | 9,669 | 37,325 | 11,121 | 1998 | 12/2007 | |||||||||||||||||||||
Plaza at MetroCenter | Nashville, TN | 23,253 | 3,341 | 35,333 | (2,903 | ) | 35,771 | 6,704 | 1985 | 12/2007 | ||||||||||||||||||||||
Loop Central | Houston, TX | — | (4 | ) | 11,653 | 86,587 | 17,210 | 115,450 | 35,457 | 1980-1982 | 12/2007 | |||||||||||||||||||||
801 Thompson | Rockville, MD | — | (4 | ) | 3,200 | 10,578 | 117 | 13,895 | 3,478 | 1963 | 12/2007 | |||||||||||||||||||||
500 E. Pratt | Baltimore, MD | 58,800 | — | 66,390 | 2,941 | 69,331 | 22,542 | 2004 | 12/2007 | |||||||||||||||||||||||
One BriarLake Plaza | Houston, TX | 94,583 | 9,602 | 119,660 | 10,300 | 139,562 | 38,465 | 2000 | 09/2008 | |||||||||||||||||||||||
Two BriarLake Plaza | Houston, TX | 55,801 | 2,446 | 81,748 | — | 84,194 | 2,538 | 2014 | 12/2009-9/2014 | |||||||||||||||||||||||
Three Eldridge Place | Houston ,TX | — | (4 | ) | 3,090 | 62,181 | 8,507 | 73,778 | 19,480 | 2009 | 12/2006-11/2009 | |||||||||||||||||||||
5950 Sherry Lane | Dallas, TX | — | (4 | ) | 10,002 | 50,876 | 4,272 | 65,150 | 2,484 | 1999 | 12/2014 | |||||||||||||||||||||
Third + Shoal | Austin., TX | — | — | 1,350 | 2,737 | 4,087 | 257 | 1995 | 6/2015 | |||||||||||||||||||||||
Domain 3 | Austin, TX | — | 6,781 | 32,923 | — | 39,704 | 549 | 1975/2001 | 7/2015 | |||||||||||||||||||||||
Domain 4 | Austin, TX | — | 5,988 | 24,401 | — | 30,389 | 407 | 1968/2001 | 7/2015 | |||||||||||||||||||||||
Land held for development | Plano, TX | — | 6,380 | — | — | 6,380 | — | N/A | 6/2015 | |||||||||||||||||||||||
Land held for development | Austin, TX | — | 38,679 | — | 10 | 38,689 | — | N/A | 7/2015 | |||||||||||||||||||||||
Totals | $ | 1,080,425 | $ | 235,971 | $ | 1,839,110 | $ | 64,631 | $ | 2,139,712 | $ | 566,464 | ||||||||||||||||||||
____________
Generally, each of our properties has a depreciable life of 25 years.
(1) Includes land and land held for development.
(2) Includes adjustments to basis, such as impairment losses.
(3) The aggregate cost for federal income tax purposes is approximately $2.3 billion.
(4) | 111 Woodcrest, Bank of America Plaza, Buena Vista Plaza, Burnett Plaza, Centreport Office Center, Eisenhower I, Three Eldridge Place, Forum Office Park, FOUR40, Lawson Commons, One Oxmoor Place, 5950 Sherry Lane, The Terrace Office Park, Loop Central, and 801 Thompson are each held as collateral for this note payable. |
(5) Hurstbourne Plaza is a retail shopping center. All of our other properties are office buildings.
F-35
A summary of activity for real estate and accumulated depreciation for the years ended December 31, 2015, 2014 and 2013, is as follows (in thousands):
Year Ended December 31, 2015 | Year Ended December 31, 2014 | Year Ended December 31, 2013 | |||||||||
Real Estate: | |||||||||||
Balance at beginning of year | $ | 2,326,195 | $ | 2,624,160 | $ | 3,222,358 | |||||
Acquisitions/improvements | 184,326 | 160,435 | 98,519 | ||||||||
Assets disposed/written-off | (370,809 | ) | (458,400 | ) | (696,717 | ) | |||||
Balance at end of the year | $ | 2,139,712 | $ | 2,326,195 | $ | 2,624,160 | |||||
Accumulated depreciation: | |||||||||||
Balance at beginning of year | $ | 557,429 | $ | 586,585 | $ | 593,389 | |||||
Depreciation expense | 99,131 | 112,394 | 128,599 | ||||||||
Assets disposed/written-off | (90,096 | ) | (141,550 | ) | (135,403 | ) | |||||
Balance at end of the year | $ | 566,464 | $ | 557,429 | $ | 586,585 | |||||
*****
F-36
EXHIBIT INDEX
Exhibit Number | Description | ||
3.1 | Ninth Articles of Amendment and Restatement (previously filed and incorporated by reference to Form 8-K filed on June 28, 2011) | ||
3.2 | Articles Supplementary (previously filed and incorporated by reference to Form 8-K filed on September 6, 2012) | ||
3.3 | Articles of Amendment of the Company (previously filed and incorporated by reference to Form 8-K filed on June 25, 2013) | ||
3.4 | Second Articles of Amendment to Ninth Articles of Amendment and Restatement of TIER REIT, Inc., effective as of June 2, 2015 (previously filed and incorporated by reference to Form 8-K filed on June 3, 2015) | ||
3.5 | Third Articles of Amendment to Ninth Articles of Amendment and Restatement of TIER REIT, Inc., effective as of June 2, 2015 (previously filed and incorporated by reference to Form 8-K filed on June 3, 2015) | ||
3.6 | Second Amended and Restated Bylaws (previously filed and incorporated by reference to Form 10-Q filed on August 8, 2011) | ||
3.7 | Amendment to the Second Amended and Restated Bylaws (previously filed and incorporated by reference to Form 8-K filed on February 5, 2013) | ||
3.8 | Amendment to the Second Amended and Restated Bylaws (previously filed and incorporated by reference to Form 8-K filed on June 25, 2013) | ||
4.1 | Statement regarding restrictions on transferability of shares of common stock (to appear on stock certificate or to be sent upon request and without charge to stockholders issued shares without certificates) (previously filed and incorporated by reference to Exhibit 4.4 to the Registrant’s Post-Effective Amendment No. 8 to Registration Statement on Form S-11 filed on April 24, 2008) | ||
10.1 | Third Amended and Restated Agreement of Limited Partnership of Behringer Harvard Operating Partnership I LP, dated as of August 31, 2012 (previously filed and incorporated by reference to Form 8-K filed on September 6, 2012) | ||
10.2 | 2005 Incentive Award Plan (previously filed and incorporated by reference to Annex A of the Registrant’s Definitive Proxy Statement on Schedule 14A filed on April 15, 2005) | ||
10.3 | Amendment to 2005 Incentive Award Plan (previously filed and incorporated by reference to Form 10-K filed on March 11, 2015) | ||
10.4 | Amendment No. 2 to 2005 Incentive Award Plan (previously filed and incorporated by reference to Form 10-K filed on March 11, 2015) | ||
10.5 | Form of Stock Option Agreement under Behringer Harvard REIT I, Inc. 2005 Incentive Award Plan (previously filed and incorporated by reference to the Registrant’s Post-Effective Amendment No. 1 to Form S-3 Registration Statement on Form S-11, Commission File No. 333-119945, filed on March 29, 2006) | ||
10.6 | Form of Restricted Stock Award Agreement under the Behringer Harvard REIT I, Inc. 2005 Incentive Award Plan (previously filed and incorporated by reference to Form 10-K filed on March 7, 2013) | ||
10.7 | Form of Restricted Stock Unit Award Agreement under the Company’s 2005 Incentive Award Plan (previously filed and incorporated by reference to Form 8-K filed on June 25, 2013) | ||
10.8 | TIER REIT, Inc. 2015 Equity Incentive Plan (incorporated by reference to Appendix A to the Company’s Definitive Proxy Statement filed with the Securities and Exchange Commission on September 18, 2015) | ||
10.9 | Form of Restricted Stock Unit Award Agreement for officers and non-employee directors with respect to time-based vesting under the TIER REIT, Inc. 2015 Equity Incentive Plan (previously filed and incorporated by reference to Form 8-K filed on December 3, 2015) | ||
10.10 | Form of Restricted Stock Unit Award Agreement with respect to performance-based vesting under the TIER REIT, Inc. 2015 Equity Incentive Plan (previously filed and incorporated by reference to Form 8-K filed on December 3, 2015) | ||
10.11 | Form of Restricted Stock Unit Award Agreement for non-employee directors with respect to time-based vesting under the TIER REIT, Inc. 2015 Equity Incentive Plan (previously filed and incorporated by reference to Form 8-K filed on December 3, 2015) | ||
10.12 | Form of Restricted Stock Award Agreement under the TIER REIT, Inc. 2015 Equity Incentive Plan (previously filed and incorporated by reference to Form 8-K filed on December 3, 2015) | ||
10.13 | Master Modification Agreement, dated as of August 31, 2012, by and among Behringer Harvard REIT I, Inc., Behringer Harvard REIT I Services Holdings, LLC, Behringer Advisors, LLC and HPT Management Services, LLC (previously filed and incorporated by reference to Form 8-K filed on September 6, 2012) | ||
10.14 | Administrative Services Agreement, dated as of August 31, 2012, by and between Behringer Harvard REIT I, Inc. and Behringer Advisors, LLC (previously filed and incorporated by reference to Form 8-K/A filed on January 3, 2013) | ||
Exhibit Number | Description | ||
10.15 | Sixth Amended and Restated Property Management Agreement, dated as of August 31, 2012, by and between Behringer Harvard REIT I, Inc., Behringer Harvard Operating Partnership I LP and HPT Management Services LP (previously filed and incorporated by reference to Form 8-K filed on September 6, 2012) | ||
10.16 | Behringer Harvard Holdings License Agreement, dated as of August 31, 2012, by and between Behringer Harvard REIT I, Inc. and Behringer Harvard Holdings, LLC (previously filed and incorporated by reference to Form 8-K filed September 6, 2012) | ||
10.17 | Agreement, dated November 13, 2008, by and among Behringer Harvard REIT I, Inc., Behringer Harvard Operating Partnership I LP, Behringer Advisors, LLC, HPT Management Services LP and HPT TIC Management Services LP (previously filed and incorporated by reference to Form 8-K filed on November 18, 2008) | ||
10.18 | Employment Agreement, dated as of September 1, 2012, by and between Behringer Harvard REIT I, Inc. and Scott W. Fordham (previously filed and incorporated by reference to Form 8-K filed on September 6, 2012) | ||
10.19 | First Amendment to Employment Agreement, effective as of May 27, 2014, by and between TIER REIT, Inc. and Tier Operating Partnership LP and Scott W. Fordham (previously filed and incorporated by reference to Form 8-K filed on May 27, 2014) | ||
10.20 | Second Amendment to Employment Agreement, effective as of January 27, 2015, by and between TIER REIT, Inc. and Tier Operating Partnership LP and Scott W. Fordham (previously filed and incorporated by reference to Form 8-K filed on February 2, 2015) | ||
10.21 | Third Amendment to Employment Agreement, effective as of July 15, 2015, by and between TIER REIT, Inc. and Tier Operating Partnership LP and Scott W. Fordham (previously filed and incorporated by reference to Form 8-K filed on July 15, 2015) | ||
10.22 | Employment Agreement, effective as of May 27, 2014, by and between TIER REIT, Inc. and Tier Operating Partnership LP and Dallas E. Lucas (previously filed and incorporated by reference to Form 8-K filed on May 27, 2014) | ||
10.23 | First Amendment to Employment Agreement, effective as of January 27, 2015, by and between TIER REIT, Inc. and Tier Operating Partnership LP and Dallas E. Lucas (previously filed and incorporated by reference to Form 8-K filed on February 2, 2015) | ||
10.24 | Second Amendment to Employment Agreement, effective as of July 15, 2015, by and between TIER REIT, Inc. and Tier Operating Partnership LP and Dallas E. Lucas (previously filed and incorporated by reference to Form 8-K filed on July 15, 2015) | ||
10.25 | Employment Agreement, dated as of September 1, 2012, by and between Behringer Harvard REIT I, Inc. and William J. Reister (previously filed and incorporated by reference to Form 8-K filed on September 6, 2012) | ||
10.26 | First Amendment to Employment Agreement, effective as of May 27, 2014, by and between TIER REIT, Inc. and Tier Operating Partnership LP and William J. Reister (previously filed and incorporated by reference to Form 8-K filed on May 27, 2014) | ||
10.27 | Second Amendment to Employment Agreement, effective as of January 27, 2015, by and between TIER REIT, Inc. and Tier Operating Partnership LP and William J. Reister (previously filed and incorporated by reference to Form 8-K filed on February 2, 2015) | ||
10.28 | Third Amendment to Employment Agreement, effective as of July 15, 2015, by and between TIER REIT, Inc. and Tier Operating Partnership LP and William J. Reister (previously filed and incorporated by reference to Form 8-K filed on July 15, 2015) | ||
10.29 | Employment Agreement, dated as of September 1, 2012, by and between Behringer Harvard REIT I, Inc. and Telisa Webb Schelin (previously filed and incorporated by reference to Form 8-K filed on September 6, 2012) | ||
10.30 | First Amendment to Employment Agreement, effective as of May 27, 2014, by and between TIER REIT, Inc. and Tier Operating Partnership LP and Telisa Webb Schelin (previously filed and incorporated by reference to Form 8-K filed on May 27, 2014) | ||
10.31 | Second Amendment to Employment Agreement, effective as of January 27, 2015, by and between TIER REIT, Inc. and Tier Operating Partnership LP and Telisa Webb Schelin (previously filed and incorporated by reference to Form 8-K filed on February 2, 2015) | ||
10.32 | Third Amendment to Employment Agreement, effective as of July 15, 2015, by and between TIER REIT, Inc. and Tier Operating Partnership LP and Telisa Webb Schelin (previously filed and incorporated by reference to Form 8-K filed on July 15, 2015) | ||
10.33 | Employment Agreement, dated as of September 1, 2012, by and between Behringer Harvard REIT I, Inc. and James E. Sharp (previously filed and incorporated by reference to Form 8-K filed on September 6, 2012) | ||
Exhibit Number | Description | ||
10.34 | First Amendment to Employment Agreement, effective as of May 27, 2014, by and between TIER REIT, Inc. and Tier Operating Partnership LP and James E. Sharp (previously filed and incorporated by reference to Form 8-K filed on May 27, 2014) | ||
10.35 | Second Amendment to Employment Agreement, effective as of January 27, 2015, by and between TIER REIT, Inc. and Tier Operating Partnership LP and James E. Sharp (previously filed and incorporated by reference to Form 8-K filed on February 2, 2015) | ||
10.36 | Third Amendment to Employment Agreement, effective as of July 15, 2015, by and between TIER REIT, Inc. and Tier Operating Partnership LP and James E. Sharp (previously filed and incorporated by reference to Form 8-K filed on July 15, 2015) | ||
10.37 | First Amendment to Amended and Restated Credit Agreement, dated as of July 20, 2015, by and among Tier Operating Partnership LP as Borrower; TIER REIT, Inc. as Parent; certain subsidiaries of TIER REIT, Inc. as signatory thereto; and Wells Fargo Bank National Association as Administrative Agent (previously filed and incorporated by reference to Form 8-K filed on July 20, 2015) | ||
10.38 | Amended and Restated Credit Agreement, dated as of June 30, 2015, by and among Tier Operating Partnership LP, as Borrower; TIER REIT, Inc., as Parent; the Financial Institutions party thereto and their assignees as Lenders; Wells Fargo Bank, National Association, as Administrative Agent; Wells Fargo Securities, LLC and J.P. Morgan Securities LLC, as Joint Lead Arrangers and Joint Bookrunners; JPMorgan Chase Bank, N.A., as Syndication Agent; and U.S. Bank National Association and Fifth Third Bank as Co-Documentation Agents (previously filed and incorporated by reference to Form 8-K filed on July 20, 2015) | ||
10.39 | Amended and Restated Guaranty, dated as of June 30, 2015, by TIER REIT, Inc. and the subsidiary guarantors identified on the signature pages thereto in favor of Wells Fargo Bank, National Association in its capacity as Administrative Agent for the Lenders under the Credit Agreement (previously filed and incorporated by reference to Form 8-K filed on July 20, 2015) | ||
21.1 | List of Subsidiaries (filed herewith) | ||
23.1 | Consent of Deloitte & Touche LLP (filed herewith) | ||
31.1 | Rule 13a-14(a) or Rule 15d-14(a) Certification of Chief Executive Officer (filed herewith) | ||
31.2 | Rule 13a-14(a) or Rule 15d-14(a) Certification of Chief Financial Officer (filed herewith) | ||
32.1* | Section 1350 Certification (furnished herewith) | ||
101 | The following financial information from TIER REIT, Inc.’s Annual Report on Form 10-K for the year ended December 31, 2015, formatted in XBRL (eXtensible Business Reporting Language): (i) Consolidated Balance Sheets, (ii) Consolidated Statements of Operations and Comprehensive Income (Loss), (iii) Consolidated Statements of Changes in Equity, (iv) Consolidated Statements of Cash Flows (v) Notes to Consolidated Financial Statements, and (vi) Financial Statement Schedules. | ||
* | In accordance with Item 601(b)(32) of Regulation S-K, this Exhibit is not deemed “filed” for purposes of Section 18 of the Exchange Act or otherwise subject to the liabilities of that section. Such certification will not be deemed incorporated by reference into any filing under the Securities Act of 1933, as amended, or the Exchange Act, except to the extent that the registrant specifically incorporates it by reference. | ||