Attached files
| file | filename |
|---|---|
| EX-99.1 - EX-99.1 - MB FINANCIAL INC /MD | a17-26404_4ex99d1.htm |
| 8-K - 8-K - MB FINANCIAL INC /MD | a17-26404_48k.htm |
Concurrent Offerings by MB Financial, Inc. and MB Financial Bank, N.A. Depositary Shares, Each Representing a 1/40th Interest in a Share of Series C Noncumulative Perpetual Preferred Stock of MB Financial, Inc. Subordinated Notes of MB Financial Bank, N.A. November 2017
MB Financial, Inc. (the “Company”) is conducting an offering of depositary shares, each representing a 1/40th interest in a share of the Company’s Series C Noncumulative Perpetual Preferred Stock. Concurrently, MB Financial Bank, N.A. (the “Bank”), a wholly owned subsidiary of the Company, is conducting an offering of subordinated notes. Neither offering is contingent on the successful completion of the other offering. The Company has filed a registration statement (including a prospectus) and a preliminary prospectus (which is subject to completion) with the Securities and Exchange Commission (the “SEC”) for the offering of depositary shares to which this communication relates. Before you invest in the depositary shares, you should read the prospectus in that registration statement, the preliminary prospectus supplement, the final prospectus supplement (when available) and the other documents the Company has filed with the SEC for more complete information about the Company and the offering of depositary shares. You may get these documents for free by visiting the SEC web site at www.sec.gov. Alternatively, you may obtain a copy of the prospectus and preliminary prospectus supplement by contacting: Merrill Lynch, Pierce, Fenner & Smith Incorporated at Attention: Prospectus Department, One Bryant Park, New York, NY 10036, Tel: 1-800-294-1322, or Email: dg.prospectus_requests@baml.com or UBS Securities LLC at Attention: Prospectus Department, 1285 Avenue of the Americas, New York, NY 10019, Tel: 1-888-827-7275 The subordinated notes to which this communication relates have not been registered under the Securities Act of 1933, as amended (the “Securities Act”), and are being offered and sold pursuant to regulations of the Office of the Comptroller of the Currency and in reliance on an exemption from the registration requirements of the Securities Act provided by Section 3(a)(2) of the Securities Act. Before you invest in the subordinated notes, you should read the preliminary offering circular relating to the subordinated notes, the final offering circular relating to the subordinated notes (when available) and the other documents incorporated by reference therein for more complete information about the Bank and the offering of subordinated notes. Copies of the preliminary offering circular may be obtained by contacting: Sandler O'Neill & Partners, L.P., Attn: Syndicate, 1251 Avenue of the Americas, 6th Floor, New York, NY 10020, Tel: 1-866-805-4128 or Email: syndicate@sandleroneill.com This presentation is for informational purposes only and shall not constitute an offer to sell or a solicitation of an offer to buy any securities of the Company or the Bank, nor shall there be any sale of such securities in any state or other jurisdiction in which an offer, solicitation or sale would be unlawful prior to registration or qualification under the securities laws of any such state or other jurisdiction in the absence of an applicable exemption from such registration or qualification requirements. The securities of the Company and the Bank are not deposits and are not insured by the Federal Deposit Insurance Corporation or any other governmental agency. 1 Disclosure Regarding Offerings
When used in this presentation and in reports of MB Financial, Inc. filed with or furnished to the SEC, in press releases or other public stockholder communications, or in oral statements made with the approval of an authorized executive officer, the words or phrases “believe,” “will,” “should,” “will likely result,” “are expected to,” “will continue,” “is anticipated,” “estimate,” “project,” “plans,” or similar expressions are intended to identify “forward-looking statements” within the meaning of the Private Securities Litigation Reform Act of 1995. You are cautioned not to place undue reliance on any forward-looking statements, which speak only as of the date made. These statements may relate to our future financial performance, strategic plans or objectives, revenues or earnings projections, or other financial items. By their nature, these statements are subject to numerous uncertainties that could cause actual results to differ materially from those anticipated in the statements. Important factors that could cause actual results to differ materially from the results anticipated or projected include, but are not limited to, the following: (1) our ability to consummate the offerings described herein in the size and manner described herein; (2) risks that funds obtained from capital raising activities, including but not limited to the offerings described herein, will not be utilized efficiently or effectively (3) expected revenues, cost savings, synergies and other benefits from our merger and acquisition activities (including the MB Financial-American Chartered merger in 2016) might not be realized within the expected time frames or at all and costs or difficulties relating to integration matters, including but not limited to customer and employee retention, might be greater than expected; (4) the credit risks of lending activities, including changes in the level and direction of loan delinquencies and write-offs and changes in estimates of the adequacy of the allowance for loan losses, which could necessitate additional provisions for loan losses, resulting both from originated loans and loans acquired from other financial institutions; (5) the quality and composition of our securities portfolio; (6) competitive pressures among depository institutions; (7) interest rate movements and their impact on customer behavior, net interest margin and the value of our mortgage servicing rights; (8) the possibility that our mortgage banking business may experience increased volatility in its revenues and earnings and the possibility that the profitability of our mortgage banking business could be significantly reduced if we are unable to originate and sell mortgage loans at profitable margins or if changes in interest rates negatively impact the value of our mortgage servicing rights; (9) the impact of repricing and competitors’ pricing initiatives on loan and deposit products; (10) fluctuations in real estate values; (11) results of examinations of us by regulatory authorities and the possibility that any such regulatory authority may, among other things, limit our business activities, require us to change our business mix, increase our allowance for loan and lease losses, write-down asset values or increase our capital levels, or affect our ability to borrow funds or maintain or increase deposits, which could adversely affect our liquidity and earnings (12) our ability to adapt successfully to technological changes to meet customers’ needs and developments in the market place; (13) the possibility that security measures implemented might not be sufficient to mitigate the risk of a cyber attack or cyber theft, and that such security measures might not protect against systems failures or interruptions; (14) our ability to realize the residual values of our direct finance, leveraged and operating leases; (15) our ability to access cost-effective funding; (16) changes in financial markets; (17) changes in economic conditions in general and in the Chicago metropolitan area in particular; (18) the costs, effects and outcomes of litigation; (19) new legislation or regulatory changes, including but not limited to the Dodd-Frank Wall Street Reform and Consumer Protection Act of 2010 (the “Dodd-Frank Act”) and regulations adopted thereunder, changes in capital requirements pursuant to the Dodd-Frank Act, changes in the interpretation and/or application of laws and regulations by regulatory authorities, other governmental initiatives affecting the financial services industry and changes in federal and/or state tax laws or interpretations thereof by taxing authorities; (20) changes in accounting principles, policies or guidelines; (21) our future acquisitions of other depository institutions or lines of business; and (22) future goodwill impairment due to changes in our business, changes in market conditions, or other factors. We do not undertake any obligation to update any forward-looking statement to reflect circumstances or events that occur after the date on which the forward-looking statement is made 2 Forward-Looking Statements
1. 2. 3. 4. 5. Planned Capital Raise Company Overview and Strategy Operating Segments Financial Highlights Non-GAAP Disclosure Appendix 3 Table of Contents
1. Planned Capital Raise 4

MB Fi nanci al Bank, Nati onal As s oci ati on §3(a)(2) exempt s ecuri ti es , offered purs ant to the regul ati ons of the Offi ce of the Comptrol l er of the Currency at 12 C.F.R §16.6 November 2027 through the maturi ty date or earl y redempti on date Redeemabl e at 100% of pri nci pal amount, pl us accrued and unpai d i nteres t begi nni ng i n November 2022 The Bank i ntends to us e the net proceeds of the offeri ng for general corporate purpos es Gol dman Sa chs & Co. LLC.; US Bancorp; Brean Capi tal , LLC 5 Comanagers Sa ndl er O'Nei l l + Partners , L.P. Bookrunner Use of Proceeds $[•] Principal Amount Optional Redemption Semi -a nnual l y on [•] and [•] of each year through [•], 2022, and thereafter on [•], [•], [•], and [•] of each year Interest Payments Maturity Date Krol l (A-) / Egan-Jones (A-) Expected Ratings Type Subordi nated Notes Security Issuer Terms of Bank-Level Subordinated Debt Offering
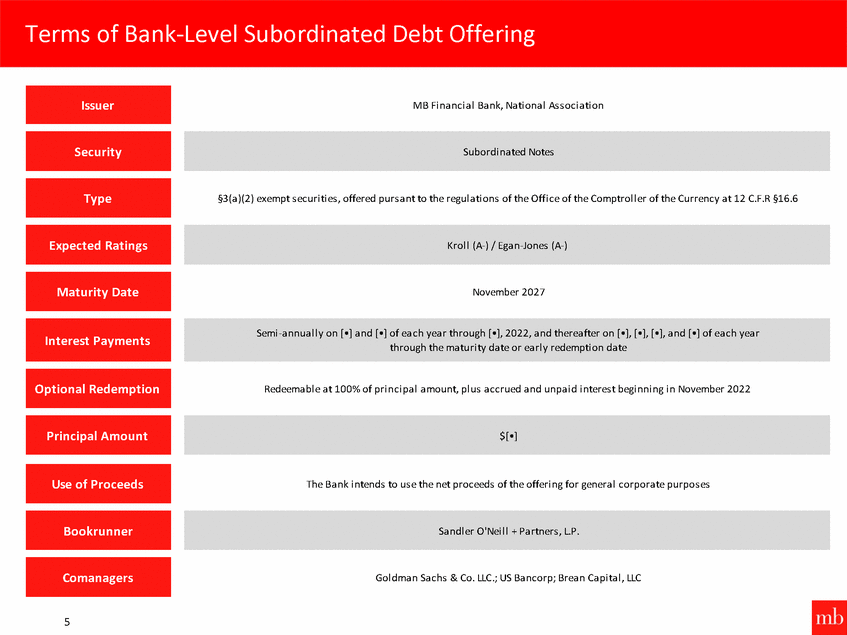
MB Fi nanci al , Inc. Seri es C Noncumul ati ve Perpetual Preferred Stock SEC Regi s tered Perpetual Redeemabl e at $25 per depos i tary s hare (equi val ent to $1,000 per s hare of preferred s tock) on [•] or on any di vi dend payment date thereafter and pri or to [•] wi thi n 90 days of a "regul atory capi tal treatment event" MB Fi nanci al i ntends to us e the net proceeds from thi s offeri ng to fund the redempti on of s ome or al l of the 4,000,000 outs tandi ng s hares of i ts Seri es A Preferred Stock, at a per s hare redempti on pri ce of $25 pl us the per s hare amount of any di vi dends that have been decl ared but not pai d pri or to the redempti on date, and for general corporate purpos es , whi ch may i ncl ude the repayment of i ndebtednes s J.P. Morgan Securi ti es LLC; Sa ndl er O'Nei l l + Partners , L.P. 6 Bank of Ameri ca Merri l l Lynch; UBS Securi ti es LLC; Bookrunners Use of Proceeds $[•] ([•] Depos i tary Shares ) Principal Amount Optional Redemption Quarterl y on [•], [•], [•], and [•] commenci ng on [•], 2018 Dividend Payments Maturity Date Moody’s (Ba3) / Krol l (BBB) / Egan-Jones (BBB+) Expected Ratings Type Depos i tary s hares , each repres enti ng a 1/40th i nteres t i n a s hare of Fi xed Rate Security Issuer Terms of Perpetual Preferred Equity Offering
2. Company Overview and Strategy 7
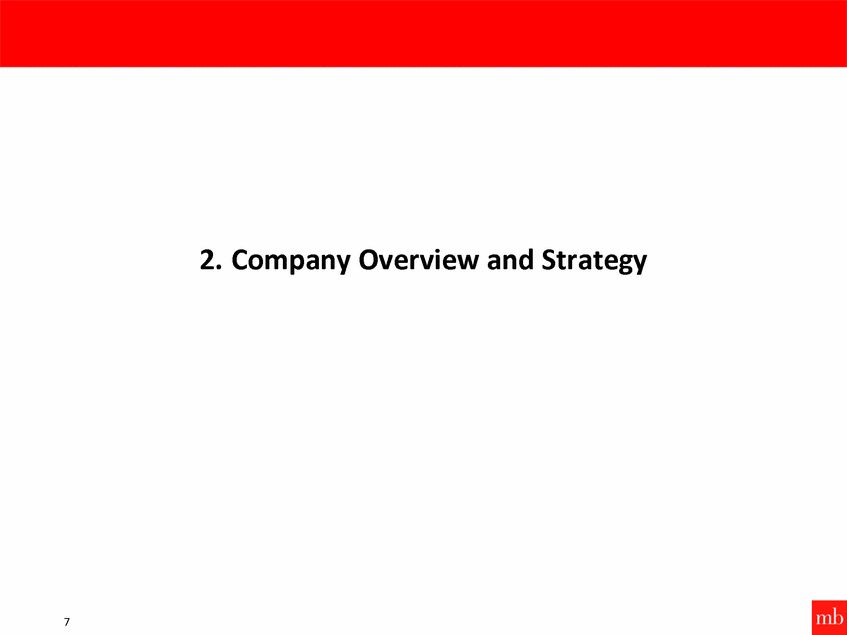
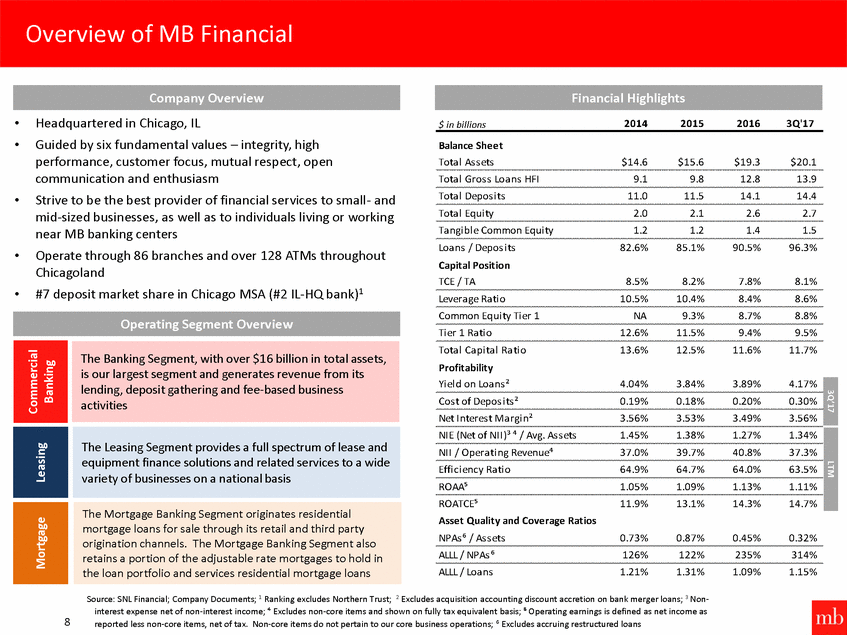
• • Headquartered in Chicago, IL Guided by six fundamental values – integrity, high performance, customer focus, mutual respect, open communication and enthusiasm Strive to be the best provider of financial services to small-and mid-sized businesses, as well as to individuals living or working near MB banking centers Operate through 86 branches and over 128 ATMs throughout Chicagoland #7 deposit market share in Chicago MSA (#2 IL-HQ bank)1 2014 2015 2016 3Q'17 $ in billions Balance Sheet Tota l As s ets $14.6 $15.6 $19.3 $20.1 Tota l Gros s Loa ns HFI 9.1 9.8 12.8 13.9 Tota l Depos i ts 11.0 11.5 14.1 14.4 • Tota l Equi ty 2.0 2.1 2.6 2.7 Ta ngi bl e Common Equi ty 1.2 1.2 1.4 1.5 Loa ns / Depos i ts Capital Position TCE / TA 82.6% 85.1% 90.5% 96.3% • 8.5% 8.2% 7.8% 8.1% • Levera ge Ra ti o 10.5% 10.4% 8.4% 8.6% Common Equi ty Ti er 1 NA 9.3% 8.7% 8.8% Ti er 1 Ra ti o 12.6% 11.5% 9.4% 9.5% Tota l Ca pi ta l Ra ti o Profitability 13.6% 12.5% 11.6% 11.7% equipment finance solutions and related services to a wide Asset Quality and Coverage Ratios NPAs 6 / As s ets 0.73% 0.87% 0.45% 0.32% ALLL / NPAs 6 126% 122% 235% 314% ALLL / Loa ns 1.21% 1.31% 1.09% 1.15% Source: SNL Financial; Company Documents; 1 Ranking excludes Northern Trust; 2 Excludes acquisition accounting discount accretion on bank merger loans; 3 Non-interest expense net of non-interest income; 4 Excludes non-core items and shown on fully tax equivalent basis; 5 Operating earnings is defined as net income as reported less non-core items, net of tax. Non-core items do not pertain to our core business operations; 6 Excludes accruing restructured loans 8 Commercial Banking Mortgage Leasing The Mortgage Banking Segment originates residential mortgage loans for sale through its retail and third party origination channels. The Mortgage Banking Segment also retains a portion of the adjustable rate mortgages to hold in the loan portfolio and services residential mortgage loans The Leasing Segment provides a full spectrum of lease and variety of businesses on a national basis Yi el d on Loa ns ²4.04%3.84%3.89%4.17% 3Q’17 Cos t of Depos i ts ²0.19%0.18%0.20%0.30% Net Interes t Ma rgi n²3.56%3.53%3.49%3.56% NIE (Net of NII)³ 4 / Avg. As s ets1.45%1.38%1.27%1.34% LTM NII / Opera ti ng Revenue437.0%39.7%40.8%37.3% Effi ci ency Ra ti o64.9%64.7%64.0%63.5% ROAA51.05%1.09%1.13%1.11% ROATCE511.9%13.1%14.3%14.7% The Banking Segment, with over $16 billion in total assets, is our largest segment and generates revenue from its lending, deposit gathering and fee-based business activities Operating Segment Overview Financial Highlights Company Overview Overview of MB Financial
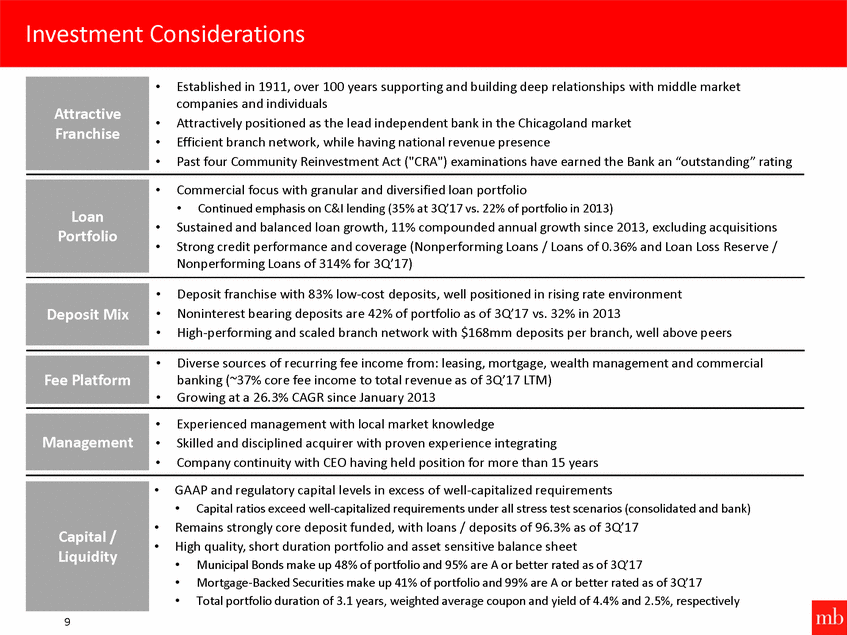
• Established in 1911, over 100 years supporting and building deep relationships with middle market companies and individuals Attractively positioned as the lead independent bank in the Chicagoland market Efficient branch network, while having national revenue presence Past four Community Reinvestment Act ("CRA") examinations have earned the Bank an “outstanding” rating • • • • Commercial focus with granular and diversified loan portfolio • Continued emphasis on C&I lending (35% at 3Q’17 vs. 22% of portfolio in 2013) • • Sustained and balanced loan growth, 11% compounded annual growth since 2013, excluding acquisitions Strong credit performance and coverage (Nonperforming Loans / Loans of 0.36% and Loan Loss Reserve / Nonperforming Loans of 314% for 3Q’17) • • • Deposit franchise with 83% low-cost deposits, well positioned in rising rate environment Noninterest bearing deposits are 42% of portfolio as of 3Q’17 vs. 32% in 2013 High-performing and scaled branch network with $168mm deposits per branch, well above peers • Diverse sources of recurring fee income from: leasing, mortgage, wealth management and commercial banking (~37% core fee income to total revenue as of 3Q’17 LTM) Growing at a 26.3% CAGR since January 2013 • • • • Experienced management with local market knowledge Skilled and disciplined acquirer with proven experience integrating Company continuity with CEO having held position for more than 15 years • GAAP and regulatory capital levels in excess of well-capitalized requirements • Capital ratios exceed well-capitalized requirements under all stress test scenarios (consolidated and bank) • • Remains strongly core deposit funded, with loans / deposits of 96.3% as of 3Q’17 High quality, short duration portfolio and asset sensitive balance sheet • • • Municipal Bonds make up 48% of portfolio and 95% are A or better rated as of 3Q’17 Mortgage-Backed Securities make up 41% of portfolio and 99% are A or better rated as of 3Q’17 Total portfolio duration of 3.1 years, weighted average coupon and yield of 4.4% and 2.5%, respectively 9 Capital / Liquidity Management Fee Platform Deposit Mix Loan Portfolio Attractive Franchise Investment Considerations
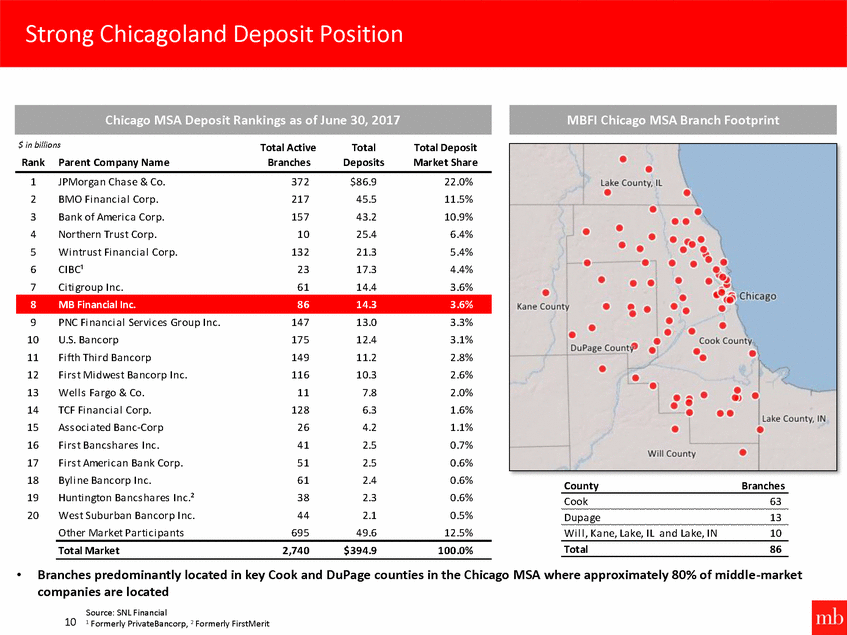
$ in billions Total Active Branches Total Deposits Total Deposit Market Share Rank Parent Company Name 1 2 3 4 5 6 7 JPMorga n Cha s e & Co. BMO Fi na nci a l Corp. Ba nk of Ameri ca Corp. Northern Trus t Corp. Wi ntrus t Fi na nci a l Corp. CIBC¹ Ci ti group Inc. 372 217 157 10 132 23 61 $86.9 45.5 43.2 25.4 21.3 17.3 14.4 22.0% 11.5% 10.9% 6.4% 5.4% 4.4% 3.6% 9 10 11 12 13 14 15 16 17 18 19 20 PNC Fi na nci a l Servi ces Group Inc. U.S. Ba ncorp Fi fth Thi rd Ba ncorp Fi rs t Mi dwes t Ba ncorp Inc. Wel l s Fa rgo & Co. TCF Fi na nci a l Corp. As s oci a ted Ba nc-Corp Fi rs t Ba ncs ha res Inc. Fi rs t Ameri ca n Ba nk Corp. Byl i ne Ba ncorp Inc. Hunti ngton Ba ncs ha res Inc.² Wes t Suburba n Ba ncorp Inc. Other Ma rket Pa rti ci pa nts 147 175 149 116 11 128 26 41 51 61 38 44 695 13.0 12.4 11.2 10.3 7.8 6.3 4.2 2.5 2.5 2.4 2.3 2.1 49.6 3.3% 3.1% 2.8% 2.6% 2.0% 1.6% 1.1% 0.7% 0.6% 0.6% 0.6% 0.5% 12.5% County Branches Cook 63 Dupa ge 13 Wi l l , Ka ne, La ke, IL a nd La ke, IN 10 Total 86 Total Market 2,740 $394.9 100.0% • Branches predominantly located in key Cook and DuPage counties in the Chicago MSA where approximately 80% of middle-market companies are located Source: SNL Financial 10 1 Formerly PrivateBancorp, 2 Formerly FirstMerit 8 MB Financial Inc. 86 14.3 3.6% MBFI Chicago MSA Branch Footprint Chicago MSA Deposit Rankings as of June 30, 2017 Strong Chicagoland Deposit Position
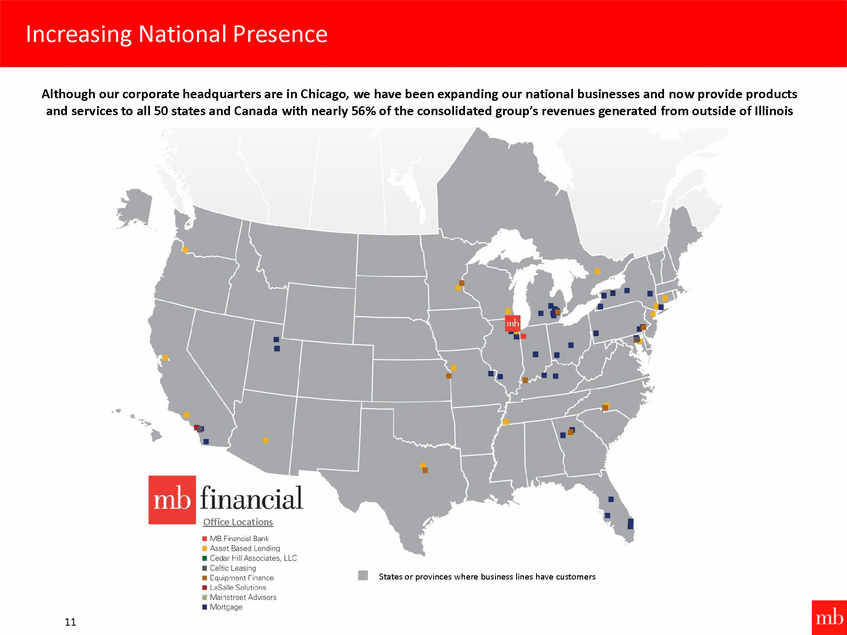
Increasing National Presence Although our corporate headquarters are in Chicago, we have been expanding our national businesses and now provide products and services to all 50 states and Canada with nearly 56% of the consolidated group's revenues generated from outside of Illinois .. • MB F nancial Bank Asset Based Lendinq • Cedar 1-'ill Associates, LLC • Celtic Leasing • [quip-nent rinance • LaSalle Solutions • Mai street Advisors • Mort!;age • States or provinces where business lines have customers 11
Priorities Results Build a Bank with Lower Risk and Consistently Better Returns than Peers • • • Top quartile peer profitability Superior credit quality Diversified balance sheet, revenues, and profits • Peer¹-leading risk-adjusted returns • • • • Add great customers, whether they borrow or not Maintain low credit risk and costs Attract and retain low-cost and stable funding Maintain strong liquidity and capital Develop Balance Sheet with Superior Profitability and Lower Risk • • • Diversified loan portfolio Valuable deposit franchise Low cost of funds • Core non-interest income provided 37% of total revenue in the nine months ended 9/30/2017 Lease financing revenue grew 17% in the nine months ended 9/30/2017 compared to the same period last year • • Grow high quality, recurring, and profitable fees Emphasis on leasing, capital markets, international banking, cards, commercial deposit services, treasury management, trust, asset management, and mortgage Grow select fee businesses nationally Focus Intensely on Fee Income • • • Very low turnover of “A” top-performing employees Highly successful banker training program Extensive training programs • • • Recruit and retain top talent Offer strong training programs Be an employer of choice Invest in Human Talent • • • LaSalle Systems Leasing (2002), First Oak Brook (2006), Cedar Hill Associates (2008), Corus Bank and 5 other FDIC-assisted acquisitions (2009 and 2010) Celtic Leasing (2012), Taylor Capital (2014) MSA Holdings (2015), American Chartered Bancorp (2016) • • Skilled and disciplined acquirer Long track record of successful integrations Make Opportunistic Acquisitions • • 12 ¹ Peers include ASB, BOKF, BXS, CBSH, CFR, FHN, FMBI, FNB, FULT, HBHC, IBKC, ONB, PB, SNV, STL, TCF, TRMK, UMBF, WBS, WTFC Company Strategic Priorities
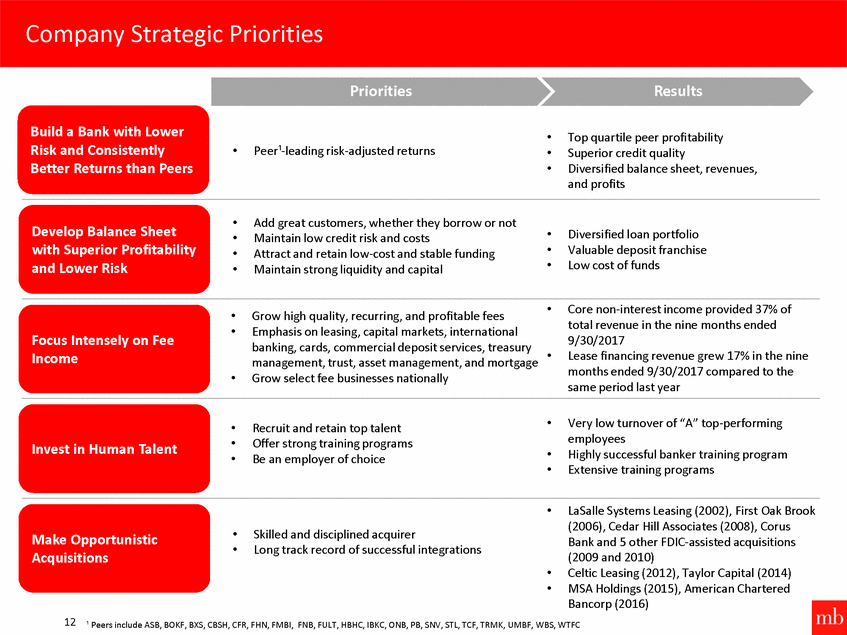
• • • In-market $1.6bn of core deposits <$50mm covered assets acquired Deposit Franchise Enhancing 2009 • • • Low-risk with FDIC guarantee In-market Accretive to capital and earnings Additional FDIC-Assisted Deals 2009 – 2010 Whole-Bank Acquisitions > $2.0 Billion in Assets 2006, 2014 and 2016 • • In-market Complementary commercial focus Source of experienced talent • • • National businesses Expands leasing (Celtic and LaSalle Solutions) and wealth management (MSA Holdings and Cedar Hill) business lines Enhanced fee income Specialty Finance and Wealth Management Acquisitions 2002, 2008, 2012 and 2015 • 13 Strategically Aligned Acquisition Strategy
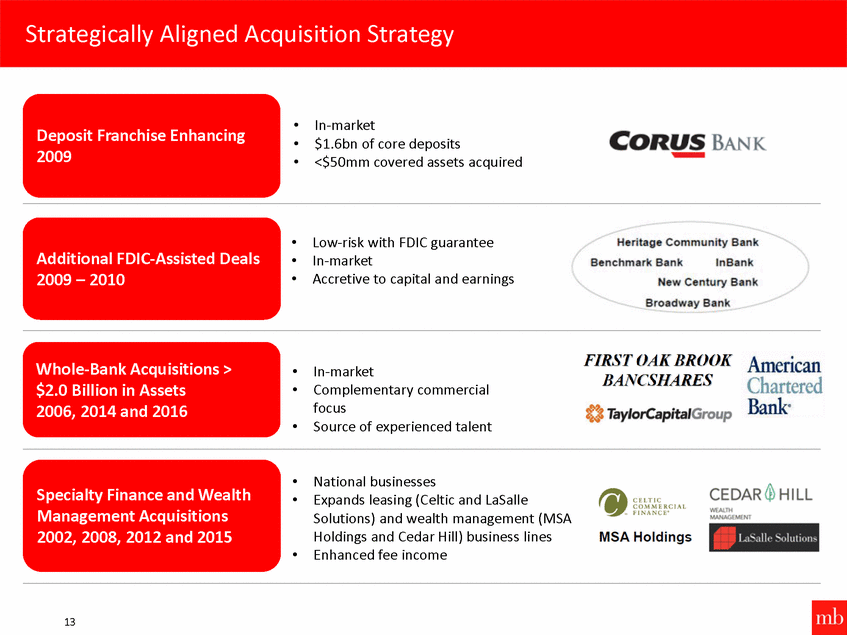
Randall Conte VP and CFO; EVP, CFO & COO of the Bank Jill York VP; EVP, Specialty Banking & M&A of the Bank Mitchell Feiger President & CEO Inc. and EVP and CFO of the Bank. Ms. York public accounting firm of McGladrey and 15 years and is a member of the Illinois CPA Mark Heckler EVP, Commercial Banking of the Bank Rosemarie Bouman VP; EVP Administration of the Bank Brian Wildman EVP, Consumer Banking of the Bank Mark Hoppe President & CEO of the Bank 14 Mr. Wildman has been EVP, Consumer Banking of the Bank since March 2016. Prior to joining the Company in 2003, he was First Vice President of Bank One and served in various management positions with its predecessor organization. He is a member of the Board of Trustees of Missionary Furlough Homes, Inc. Ms. Bouman has been VP of MB Financial and EVP, Administration of the Bank for over 11 years. Prior to MB’s acquisition of First Oak Brook, Ms. Bouman served as EVP, COO and CFO of First Oak Brook. She previously worked as an auditor with Arthur Andersen & Co. from 1979 to 1983. Mr. Heckler has been EVP, Commercial Banking of the Bank since March 2016. Prior to joining the Company in 2002, he was First Vice President of Bank One and served in various management positions with its predecessor organizations. Mr. Heckler also served as Chairman of the Board of Norwood Life Care, a not-for-profit senior living facility in Chicago. He is also a Board member of Delta Dental of Illinois Foundation (DDILF), and Chairman of its Finance Committee. Mr. Hoppe became President and CEO of the Bank after the MB-Taylor Capital Merger. Prior to the MB-Taylor Capital merger, Mr. Hoppe served as CEO of Taylor Capital. He also served in a variety of management positions with LaSalle Bank, N.A., including Executive Vice President from 1994 to 2001. Mr. Hoppe serves on the Board of Directors for Ann & Robert H. Lurie Children’s Hospital of Chicago. Ms. York has been VP of MB Financial and EVP, Specialty Banking and M&A of the Bank since April 2016. Prior to her current role, Ms. York was VP and CFO of MB Financial, previously served as a partner with the Pullen LLP. She was in public accounting for Society. Mr. Conte has been VP and CFO of MB Financial, Inc. and EVP and CFO of the Bank since April 2016 and EVP and COO of the Bank since MB-Taylor Capital Merger. Prior to the MB-Taylor Capital Merger, Mr. Conte was CFO of Taylor Capital and CFO and COO of Cole Taylor Bank. In addition, he oversaw the Retail Banking Group at Cole Taylor Bank. Mr. Conte joined Cole Taylor Bank in 2008 from LaSalle Bank Corporation, where he last served as EVP and head of operations for LaSalle Bank’s retail, consumer and business banking businesses. Mr. Feiger has been President and Chief Executive Officer of MB Financial, Inc. since February 1999. Mr. Feiger began his career with Touche Ross & Company in 1982. He serves on the Executive Committee of the Bankers Club of Illinois. Mr. Feiger has more than 30 years of experience in the banking industry, and has served as Chief Executive Officer of the Company for more than 15 years. MB Financial Senior Management Team
3. Operating Segments 15
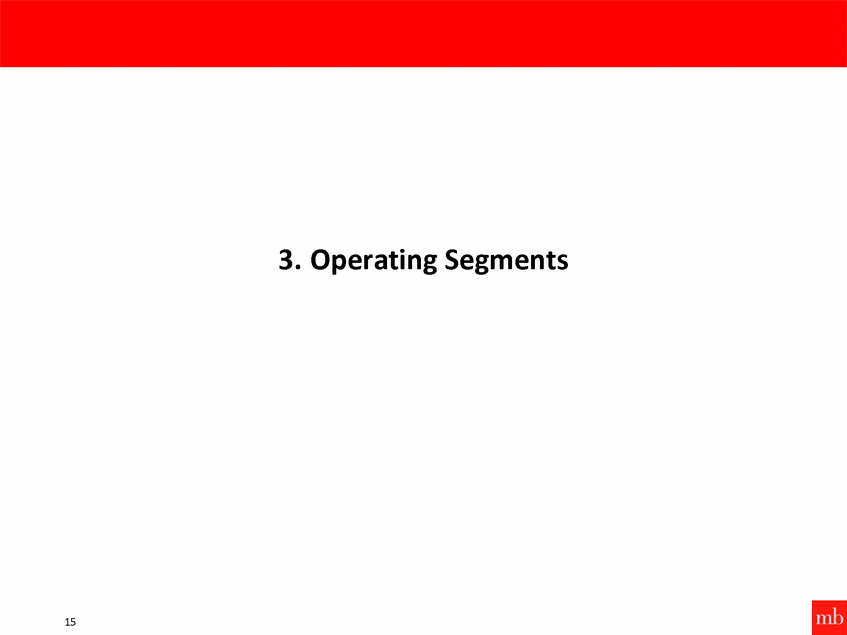
automation, payment system access, and fraud/risk mitigation tools banking centers 16 •Provides about 40% of deposits for the banking segment •High percentage of low-cost funding with a low reliance on CDs •Focuses on small businesses in our market and individuals that live or work near our •Key fee initiatives include card services and treasury management services for business banking customers ReRteatailil WeWaletahlthMMaannageemmenetnt •Provides private banking, trust, investment management and retirement plan services through a team of experienced advisors •Specializes in serving business owners, high-net worth families, foundations, and endowments •Focuses on asset management, low-cost deposits, and private banking services •Manages and advises on more than $8.0 billion of client assets through trust and asset management and subsidiary MSA Holdings, LLC TreaTsreuarsyurMy Maannaagemmeentnt •Focuses on providing high quality and recurring collection and payment solutions to commercial and business banking customers as well as strategic industry niches •Expanding nationally where we have distinguishable expertise and scalability •Broad suite of customizable services including data reporting, payment and collection AssAests-eBt Baasseed LLeenndidnging •Through 16 sales offices in the U.S. and Canada targets national middle-market companies, including manufacturers, distributors, and select service companies with sales from $25 million to $500 million, has borrowers in 36 states •Deal flow via marketing efforts and relationships with private equity firms, mezzanine and second lien capital providers, investment banks, consultants and other trusted advisors •Asset-based and hybrid ABL cash flow loans from $3 million to $30 million •Loans outstanding of $1.0 billion and commitments of $1.4 billion LeaLseeaseBBaannkkingg •Provides discounted lease loans and other banking services to lessors located throughout the country; these services include working capital loans, warehouse loans, and equity investments in leases •Lease Banking has nearly $2.0 billion in loans outstanding •Lease loans are underwritten primarily on the creditworthiness of the lessee •Lessees include mostly investment grade “Fortune 1000” companies located throughout the U.S. and large middle-market companies ComCommerecrciiaal Bannkiknging •Provides lending, depository and fee-based capital markets and international banking services to middle-market companies with revenues from $2 million to $500 million •“Relationship banking” culture; experienced calling officers •Commercial and industrial and commercial real estate loan portfolio – terms generally range from 1 to 5 years, with typical loan sizes between $3-30 million, and approximately 77% have a floating rate of interest indexed to LIBOR or Prime •Expanding into specialized commercial areas such as healthcare and financial services Banking Segment Overview
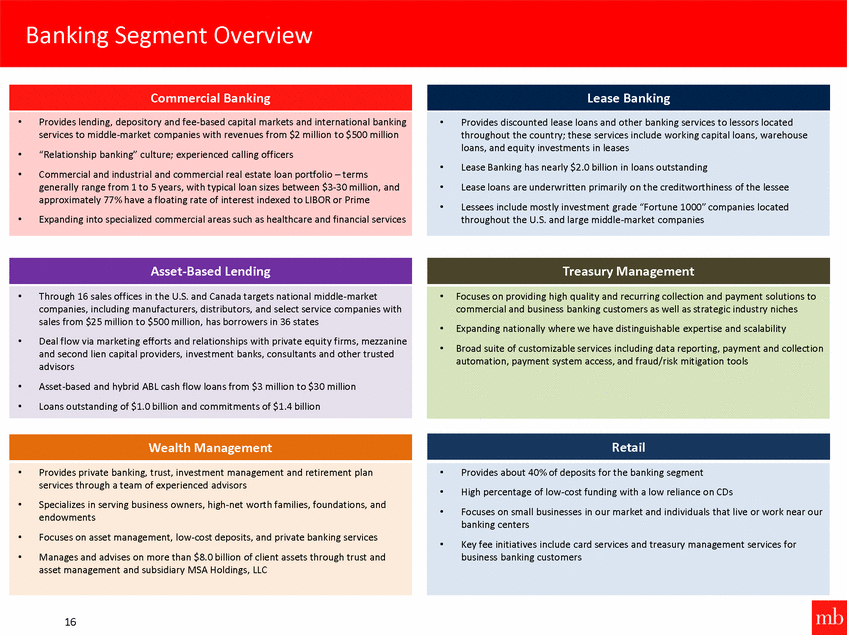
from $25 - $500mm distributors and select • Division total: $0.1bn • Cost of deposits: 0.01% Interest bearing bearing 85% accounts • Term loans supported estate on a national basis and Canada 17 Source: Company documents, financials as of September 30, 2017 Business Commercial and Industrial Lease Banking Emerging Markets Commercial Real Estate Commercial Specialty (Incl. Treasury Management) Asset-Based Lending Customers • Middle-market companies with revenues from $2 million - $500 million • Independent leasing companies and institutional vendor finance companies throughout country • Manufacturing • Distribution • Professional Services • Lesser extent CRE • Developers and investors whose projects are within Chicago area, will support established clients outside of Chicago • Specialized commercial areas such as healthcare and financial services • National middle-market companies with sales • Manufactures, service companies Loans • $2.8bn avg. loan portfolio • 1,751 loans / L-o-C • $1.7mm avg. loan size • 3.80% yield • $1.9bn avg. loan portfolio • 5,465 loans • $0.3mm avg. loan size • 3.49% yield • $1.6bn avg. loan portfolio • 3,680 loans • $0.4mm avg. loan size • 4.36% yield • $1.5bn avg. loan portfolio • 608 loans • $2.6mm avg. loan size • 4.03% yield • $1.4bn avg. loan portfolio • 1,075 loans • $1.4mm avg. loan size • 4.22% yield • $0.9bn avg. loan portfolio • 732 loans • $1.4mm avg. loan size • 4.90% yield Deposits • Division total: $2.4 bn • Cost of deposits: 0.12% Non-interest Interestbearing bearing66% 34% • Division total: $0.1bn • Cost of deposits: 0.07% Non-interest Interestbearing bearing76% 24% • Division total: $1.5bn • Cost of deposits: 0.05% Non-interest Interestbearing bearing72% 28% • Division total: $0.4mm • Cost of deposits: 0.11% Non-interest bearing63% 37% • Division total: $2.2bn • Cost of deposits: 0.20% Non-interest Interestbearing bearing 54% 46% Non-interest Interestbearing 15% Loan Products / Services • Lines of credit • Syndications • New market tax credit and ESOP financing plus deposit • TM and Capital Market services • Non-recourse debt • Lessor funding source • Equipment specialty • Technology • Healthcare • Material handling • Provides lending, deposit and fee-based products to Chicagoland companies that fall in the niche between C&I and business banking teams • Range of loan and property type financing to upper middle market and institutional clients throughout the Midwest • Lending to health care and financial services • Payment and collection automation, reporting and fraud/risk tools • Derivatives and interest rate risks, M&A advisory, trade services and FX • Revolving lines of credit supported by receivable/inventory by equipment and real Banking Segment Overview Commercial Banking
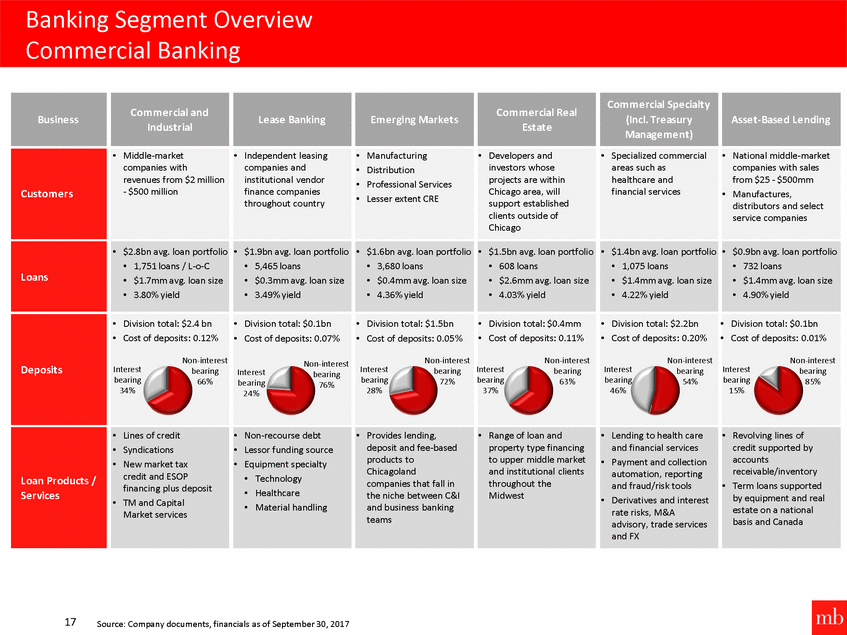
• Provides approximately 40% of deposits for banking segment Focuses on small businesses in our market and individuals that live or work near our banking centers Key fee initiatives include cross-selling of card and treasury management services for business banking customers Efficient branch model, deposits per branch of $168 million High percentage of low-cost funding with a low reliance on CDs Thorough and strategic coverage of Cook and DuPage counties • 18% CDs 24% NIB • • • 15% NOW • 24% Money Market 19% Savings Retail Banking Historical Trends1 $ in billions $5.6 $4.8 $4.8 Total Deposits: $5.6 billion Cost of Deposits YTD: 0.20% 2013 2014 2015 2016 2017 YTD Deposit Balances Cost of Deposits Source: Company documents, financial information as of September 30, 2017 1 Deposit balances and rates represent averages 18 $4.3 $4.6 0.20% 0.19% 0.15% 0.15% 0.15% Retail Deposit Composition1 Overview Banking Segment Overview Retail Banking
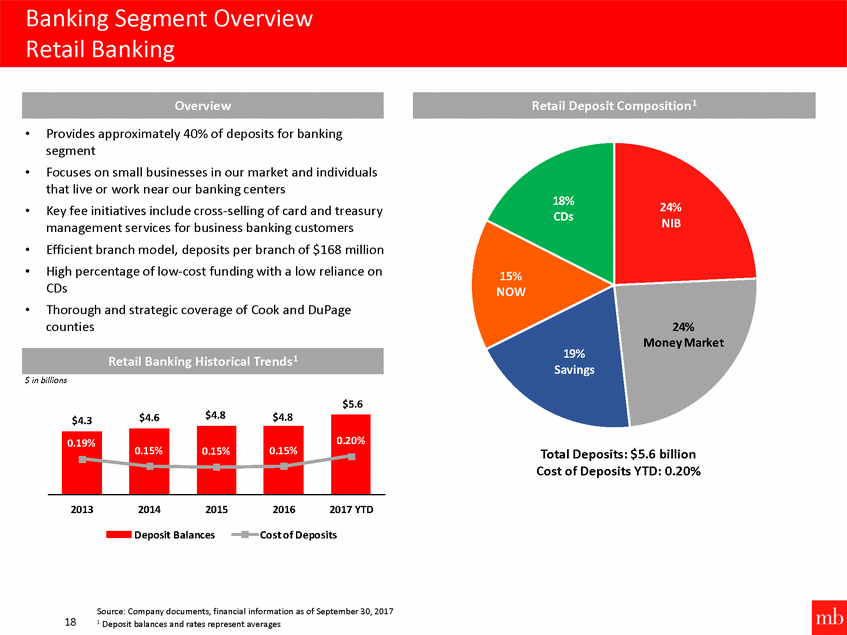
• National customer focus base in diversified industries ranging from the “Fortune 1000” to middle-market companies, as well as targeted verticals Broad equipment expertise, with capabilities in most types of essential-use capital equipment While quarterly fee revenue varies, growth has exceeded 7% per year since 2013 Credit experience has been excellent Strong returns on capital $ 79 $ 74 • $ 70 • • • 2013 2014 2015 2016 3Q17 LTM Business compa ni es Ma nufa cturi ng Di s tri buti on Equi pment s yntheti c a nd dol l a r out l ea s es Source: Company documents, financial information as of September 30, 2017 1 Direct lending subsidiaries are part of the Leasing Segment 19 FMV, ea rl y buy out, TRAC, a nd tra di ti ona l l oa ns FMV, purcha s e renewa l opti on a nd dol l a r out l ea s es Pri nci pa l l y fa i r ma rket va l ue (FMV) l ea s e products , res el l er of Ci s co ma i ntena nce Product Specialization Tra ns porta ti on Ma ri ne Technol ogy Hea l thca re Technol ogy Hea l thca re Ma teri a l Ha ndl i ng Equipment Specialization Mi ddl e-ma rket to l a rge Mi ddl e-ma rket Mi ddl e-ma rket compa ni es a nd a utonomous di vi s i ons of l a rge compa ni es Target Audience (National) $0.6 Bi l l i on $0.3 Bi l l i on $0.3 Bi l l i on Total Assets (September 30, 2017) Direct Lending Subsidiaries 1 (Leasing Segment) $ 60 $ 61 Overview $ in millionsLease Financing Fee Revenue Leasing Segment Overview Direct Leasing Subsidiaries
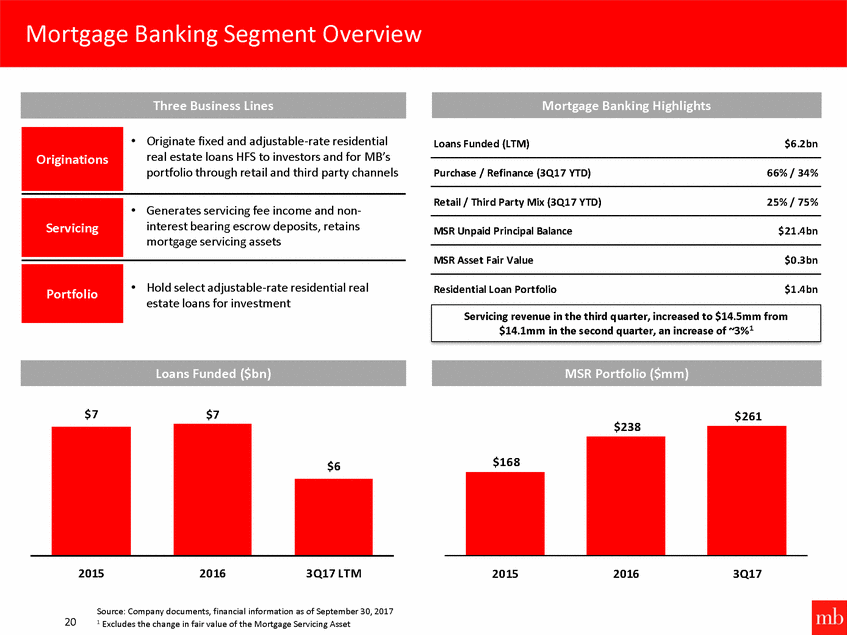
• Originate fixed and adjustable-rate residential real estate loans HFS to investors and for MB’s portfolio through retail and third party channels Loans Funded (LTM) $6.2bn Purchase / Refinance (3Q17 YTD) 66% / 34% Retail / Third Party Mix (3Q17 YTD) 25% / 75% • Generates servicing fee income and non-interest bearing escrow deposits, retains mortgage servicing assets MSR Unpaid Principal Balance $21.4bn MSR Asset Fair Value $0.3bn • Hold select adjustable-rate residential real estate loans for investment Residential Loan Portfolio $1.4bn $7 $7 $261 $238 2015 2016 3Q17 LTM 2015 2016 3Q17 Source: Company documents, financial information as of September 30, 2017 1 Excludes the change in fair value of the Mortgage Servicing Asset 20 $6 $168 MSR Portfolio ($mm) Loans Funded ($bn) Servicing revenue in the third quarter, increased to $14.5mm from $14.1mm in the second quarter, an increase of ~3%1 Portfolio Servicing Originations Three Business Lines Mortgage Banking Highlights Mortgage Banking Segment Overview
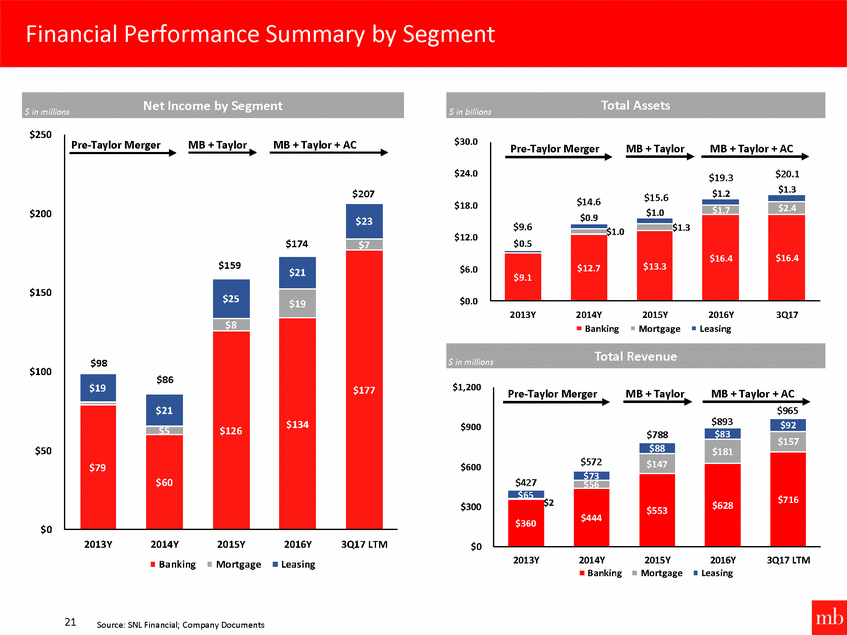
$250 $30.0 $24.0 $1.3 $1.2 $15.6 $18.0 $200 $1.0 $0.9 $12.0 $6.0 $150 $0.0 2013Y 2014Y 2015Y Mortgage 2016Y Leasing 3Q17 Banking $100 $1,200 $900 $50 $600 $300 $0 2013Y 2014Y 2015Y Mortgage 2016Y Leasing 3Q17 LTM $0 2013Y 2014Y 2015Y Mortgage 2016Y Leasing 3Q17 LTM Banking Banking 21 Source: SNL Financial; Company Documents Pre-Taylor MergerMB + TaylorMB + Taylor + AC $965 $893 $92 $788 $83 $157 $572 $88 $181 $716 $147 $628 $427 $73 $553 $2 $444 $360 $ in millionsTotal Revenue Pre-Taylor MergerMB + TaylorMB + Taylor + AC $207 $174 $23 $7 $177 $159 $21 $98 $25 $19 $8 $134 $126 $19 $86 $21 $79 $60 Pre-Taylor MergerMB + TaylorMB + Taylor + AC $19.3$20.1 $14.6 $2.4 $1.7 $1.3 $16.4 $16.4 $9.6 $0.5 $1.0 $12.7 $13.3 $9.1 $ in billionsTotal Assets $ in millionsNet Income by Segment Financial Performance Summary by Segment
4. Financial Highlights 22

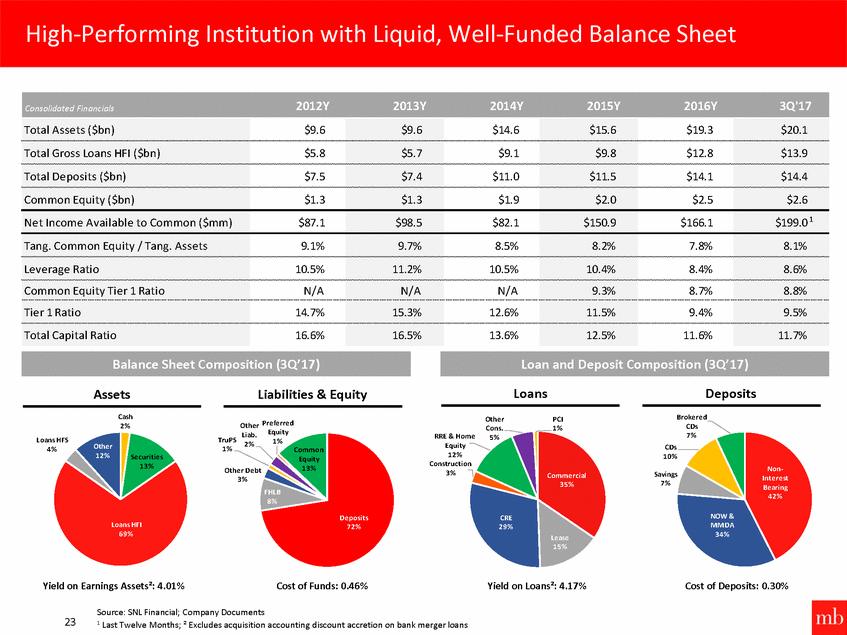
Assets Liabilities & Equity Loans Deposits Cash 2% Brokered CDs 7% Other Cons. 5% PCI 1% Other Preferred Equity 1% TruPS Liab. RRE & Home Equity 12% Construction 3% Loans HFS 4% 2% Other 12% CDs 10% 1% Common Equity 13% Securities 13% Non-Interest Bearing Other Debt 3% Savings 7% Commercial 35% F L NOW & MMDA 34% Deposits 72% CRE 29% Loans HFI 69% Lease 15% Yield on Earnings Assets²: 4.01% Cost of Funds: 0.46% Yield on Loans²: 4.17% Cost of Deposits: 0.30% Source: SNL Financial; Company Documents 1 Last Twelve Months; ² Excludes acquisition accounting discount accretion on bank merger loans 23 Loan and Deposit Composition (3Q’17) Balance Sheet Composition (3Q’17) Consolidated Financials2012Y 2013Y 2014Y 2015Y 2016Y 3Q'17 Total Assets ($bn) $9.6 $9.6 $14.6 $15.6 $19.3 $20.1 Total Gross Loans HFI ($bn) $5.8 $5.7 $9.1 $9.8 $12.8 $13.9 Total Deposits ($bn) $7.5 $7.4 $11.0 $11.5 $14.1 $14.4 Common Equity ($bn) $1.3 $1.3 $1.9 $2.0 $2.5 $2.6 Net Income Available to Common ($mm) $87.1 $98.5 $82.1 $150.9 $166.1 $199.0 1 Tang. Common Equity / Tang. Assets 9.1% 9.7% 8.5% 8.2% 7.8% 8.1% Leverage Ratio 10.5% 11.2% 10.5% 10.4% 8.4% 8.6% Common Equity Tier 1 Ratio N/A N/A N/A 9.3% 8.7% 8.8% Tier 1 Ratio 14.7% 15.3% 12.6% 11.5% 9.4% 9.5% Total Capital Ratio 16.6% 16.5% 13.6% 12.5% 11.6% 11.7% High-Performing Institution with Liquid, Well-Funded Balance Sheet
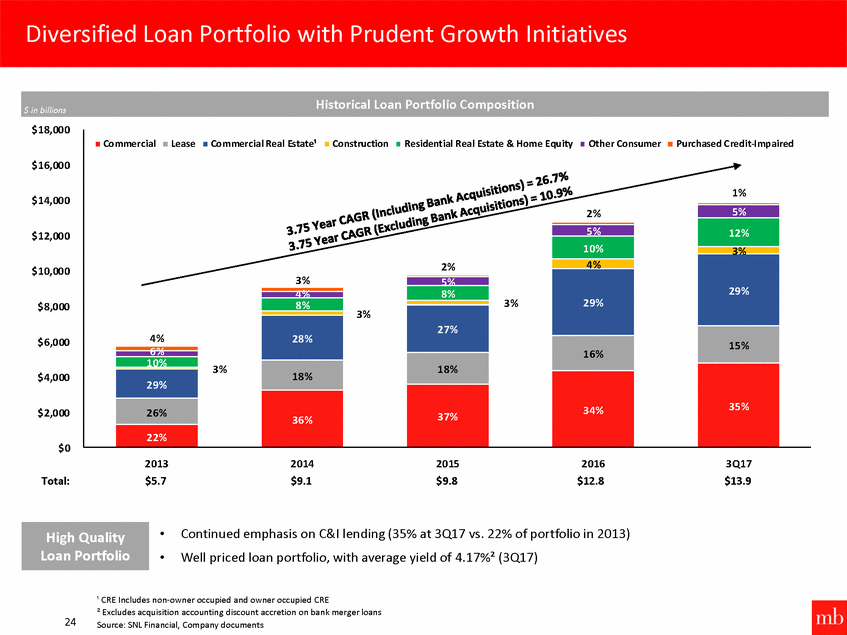
$18,000 $16,000 $14,000 $12,000 3% $10,000 $8,000 $6,000 $4,000 $2,000 $0 2013 $5.7 2014 $9.1 2015 $9.8 2016 $12.8 3Q17 $13.9 Total: • • Continued emphasis on C&I lending (35% at 3Q17 vs. 22% of portfolio in 2013) Well priced loan portfolio, with average yield of 4.17%² (3Q17) ¹ CRE Includes non-owner occupied and owner occupied CRE ² Excludes acquisition accounting discount accretion on bank merger loans Source: SNL Financial, Company documents 24 High Quality Loan Portfolio Commer cialLeaseCommer cial Real Estate¹ConstructionResident ial Real Estate & Home EquityOther ConsumerPurchased Credit-I mpaired 1% 2% 5% 12% 2% 5% 10% 29% 4% 29% 3% 3% 8% 4% 3% 8% 27% 28% 15% 16% 3% 18% 10% 18% 35% 29% 34% 37% 36% 26% 22% $ in billionsHistorical Loan Portfolio Composition Diversified Loan Portfolio with Prudent Growth Initiatives
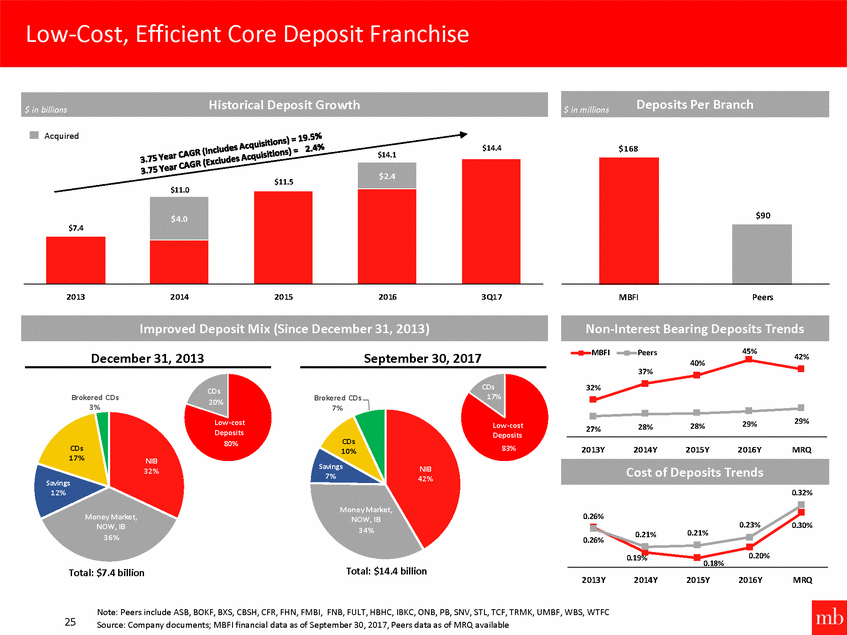
Acquired $14.4 $168 $14.1 $11.0 2013 2014 2015 2016 3Q17 MBFI Peers 45% MBFI Peer s December 31, 2013 September 30, 2017 42% 40% 37% CDs 17% 32% CDs 20% Brokered CDs 3% Brokered CDs 7% 29% Low-cost Deposits 80% 29% Low-cost Deposits 83% 28% 28% 27% CDs 10% Savings 7% CDs 17% 2013Y 2014Y 2015Y 2016Y MRQ NIB 32% NIB 42% Savings 12% 0.32% Money Market, NOW, IB 34% Market, NOW, IB 36% 0.26% 0.23% 0.30% 0.21% 0.21% 0.26% 0.20% 0.19% 0.18% Total: $14.4 billion Total: $7.4 billion 2013Y 2014Y 2015Y 2016Y MRQ Note: Peers include ASB, BOKF, BXS, CBSH, CFR, FHN, FMBI, FNB, FULT, HBHC, IBKC, ONB, PB, SNV, STL, TCF, TRMK, UMBF, WBS, WTFC Source: Company documents; MBFI financial data as of September 30, 2017, Peers data as of MRQ available 25 Cost of Deposits Trends Improved Deposit Mix (Since December 31, 2013) Non-Interest Bearing Deposits Trends $90 $11.5 $2.4 $7.4 $4.0 $ in millionsDeposits Per Branch $ in billionsHistorical Deposit Growth Low-Cost, Efficient Core Deposit Franchise
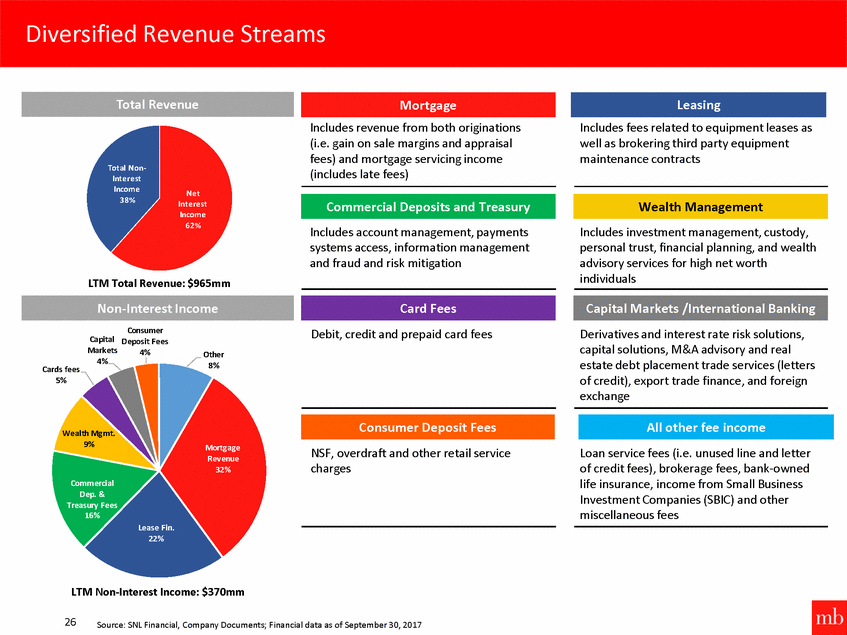
Includes revenue from both originations (i.e. gain on sale margins and appraisal fees) and mortgage servicing income (includes late fees) Includes fees related to equipment leases as well as brokering third party equipment maintenance contracts Total Non-Interest Income 38% Net Interest Income 62% Includes account management, payments systems access, information management and fraud and risk mitigation Includes investment management, custody, personal trust, financial planning, and wealth advisory services for high net worth individuals LTM Total Revenue: $965mm Consumer Deposit Fees 4% Debit, credit and prepaid card fees Derivatives and interest rate risk solutions, capital solutions, M&A advisory and real estate debt placement trade services (letters of credit), export trade finance, and foreign exchange Capital Markets 4% Other 8% Cards fees 5% Wealth Mgmt. 9% Mortgage Revenue NSF, overdraft and other retail service charges Loan service fees (i.e. unused line and letter of credit fees), brokerage fees, bank-owned life insurance, income from Small Business Investment Companies (SBIC) and other miscellaneous fees Commercial Dep. & Treasury Fees 16% Lease Fin. LTM Non-Interest Income: $370mm 26 Source: SNL Financial, Company Documents; Financial data as of September 30, 2017 All other fee income Consumer Deposit Fees Card Fees Capital Markets /International Banking Non-Interest Income Wealth Management Commercial Deposits and Treasury Mortgage Leasing Total Revenue Diversified Revenue Streams
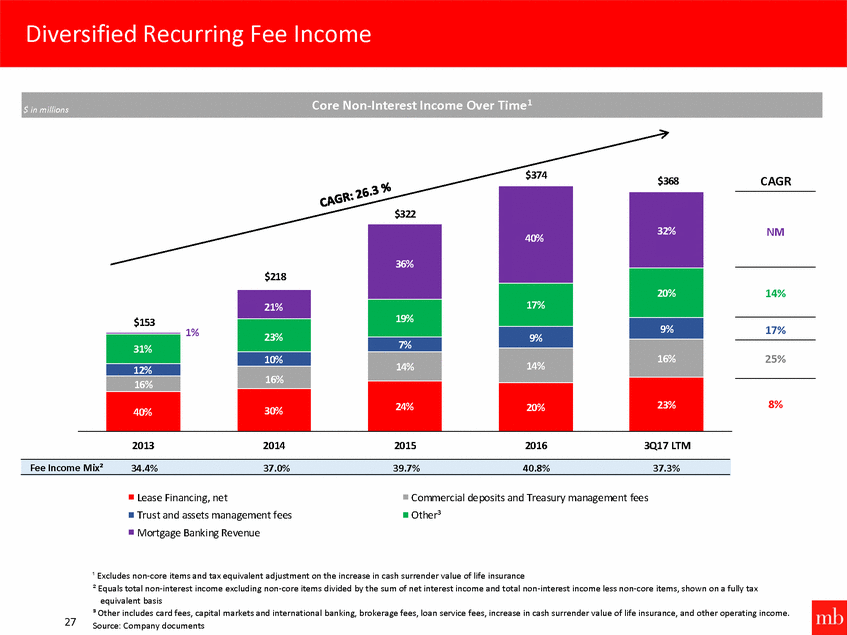
$374 CAGR $368 NM 14% 17% 1% 25% 8% 2013 2014 2015 2016 3Q17 LTM Lease Financing, net Trust and assets management fees Mortgage Banking Revenue Commercial deposits and Treasury management fees Other³ ¹ Excludes non-core items and tax equivalent adjustment on the increase in cash surrender value of life insurance ² Equals total non-interest income excluding non-core items divided by the sum of net interest income and total non-interest income less non-core items, shown on a fully tax equivalent basis ³ Other includes card fees, capital markets and international banking, brokerage fees, loan service fees, increase in cash surrender value of life insurance, and other operating income. Source: Company documents 27 Fee Income Mix²34.4%37.0%39.7%40.8%37.3% $322 40% 32% $218 36% 20% 17% $153 21% 19% 9% 23% 9% 31% 7% 16% 14% 10% 14% 12% 16% 23% 16% 24% 20% 30% 40% $ in millionsCore Non-Interest Income Over Time1 Diversified Recurring Fee Income
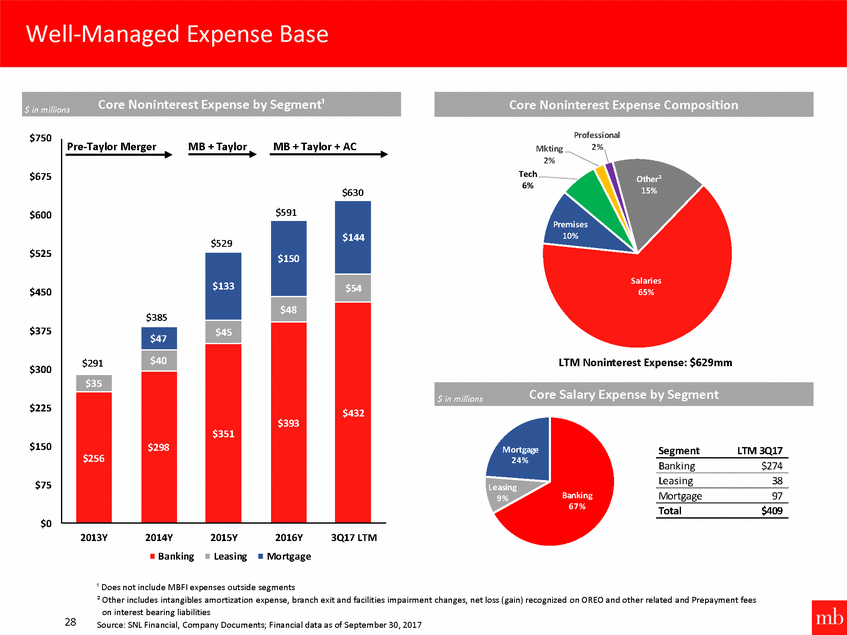
Professional $750 2% Mkting 2% Tech 6% $675 Other² 15% $600 Pr ises 10% $525 Salaries 65% $450 $375 LTM Noninterest Expense: $629mm $300 $225 $150 Mortgage 24% Segment LTM 3Q17 Banking $274 Leasing 38 $75 Leasing 9% Banking 67% Mortgage 97 Total $409 $0 2013Y 2014Y 2015Y 2016Y Mortgage 3Q17 LTM Banking Leasing ¹ Does not include MBFI expenses outside segments ² Other includes intangibles amortization expense, branch exit and facilities impairment changes, net loss (gain) recognized on OREO and other related and Prepayment fees on interest bearing liabilities Source: SNL Financial, Company Documents; Financial data as of September 30, 2017 28 $ in millionsCore Salary Expense by Segment Pre-Taylor MergerMB + TaylorMB + Taylor + AC $630 $591 $144 $529 $150 $385 $133 $54 $48 $432 $45 $393 $291 $47 $351 $40 $298 $35 $256 Core Noninterest Expense Composition $ in millionsCore Noninterest Expense by Segment¹ Well-Managed Expense Base
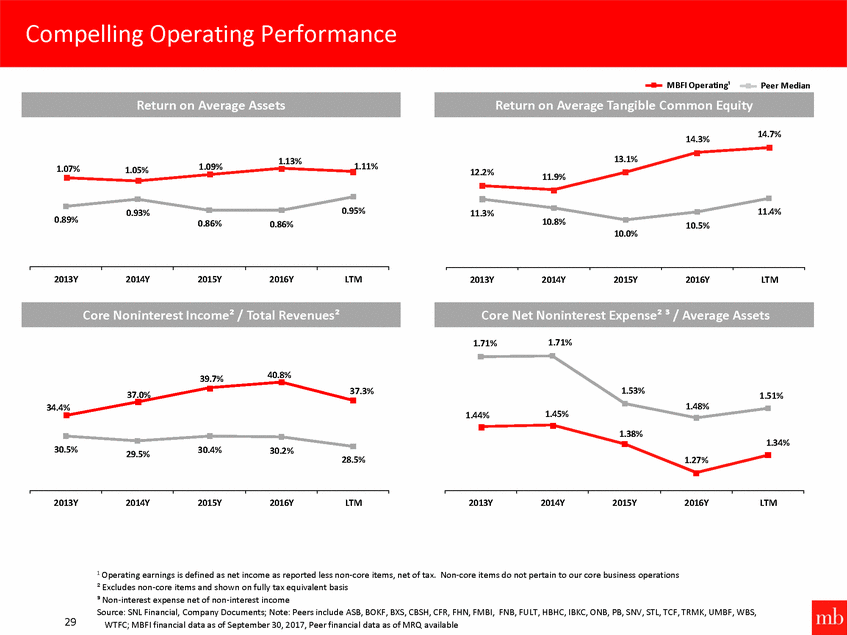
MBFI Operating¹ Peer Median 14.7% 14.3% 13.1% 1.13% 1.09% 1.11% 1.07% 1.05% 12.2% 11.9% 0.95% 11.4% 0.93% 11.3% 0.89% 10.8% 0.86% 0.86% 10.5% 10.0% 2013Y 2014Y 2015Y 2016Y LTM 2013Y 2014Y 2015Y 2016Y LTM 1.71% 1.71% 40.8% 39.7% 37.3% 1.53% 37.0% 1.51% 1.48% 34.4% 1.44% 1.45% 1.38% 1.34% 30.5% 30.4% 30.2% 29.5% 28.5% 1.27% 2013Y 2014Y 2015Y 2016Y LTM 2013Y 2014Y 2015Y 2016Y LTM 1 Operating earnings is defined as net income as reported less non-core items, net of tax. Non-core items do not pertain to our core business operations ² Excludes non-core items and shown on fully tax equivalent basis ³ Non-interest expense net of non-interest income Source: SNL Financial, Company Documents; Note: Peers include ASB, BOKF, BXS, CBSH, CFR, FHN, FMBI, FNB, FULT, HBHC, IBKC, ONB, PB, SNV, STL, TCF, TRMK, UMBF, WBS, WTFC; MBFI financial data as of September 30, 2017, Peer financial data as of MRQ available 29 Core Net Noninterest Expense² ³ / Average Assets Core Noninterest Income² / Total Revenues² Return on Average Tangible Common Equity Return on Average Assets Compelling Operating Performance
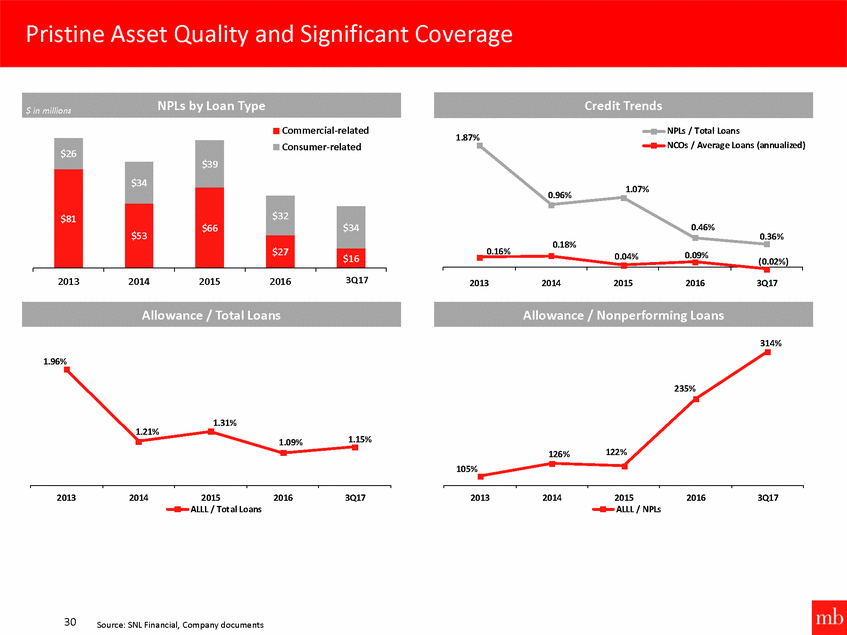
Commercial-related NPLs / Total Loans NCOs / Average Loans (annualized) 1.87% 1.07% 0.96% 0.46% 0.36% 0.18% 0.16% 0.09% 0.04% (0.02%) 6/303/Q210717 2013 2014 2015 2016 2013 2014 2015 2016 3Q17 314% 1.96% 235% 1.31% 1.21% 1.15% 1.09% 122% 126% 105% 2013 2014 2015 ALLL / Tot al Loans 2016 3Q17 2013 2014 2015 ALLL / NPLs 2016 3Q17 30 Source: SNL Financial, Company documents Allowance / Total Loans Allowance / Nonperforming Loans $26 $39 Consumer-related $34 $81 $66 $32 $53 $34 $27 $16 Credit Trends $ in millionsNPLs by Loan Type Pristine Asset Quality and Significant Coverage
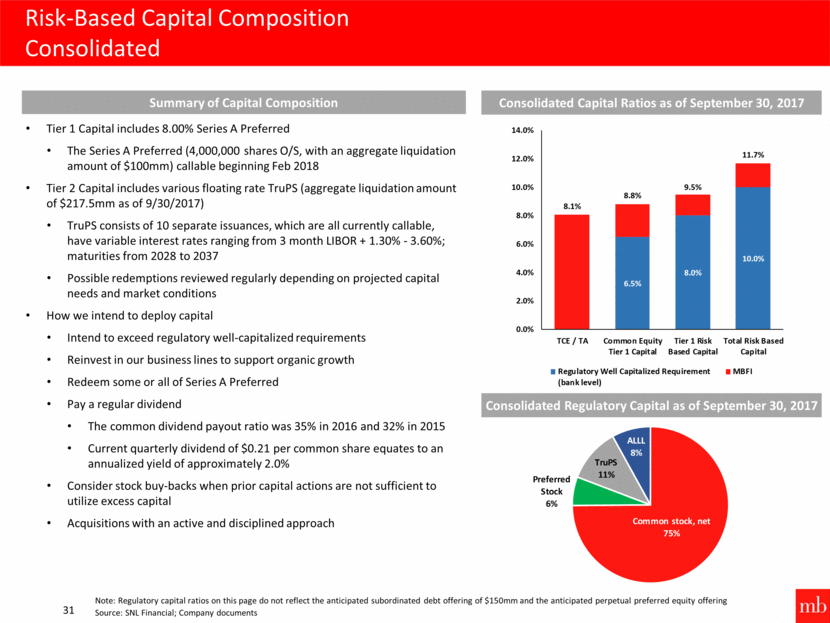
Risk-Based Capital Composition Consolidated 31 Consolidated Capital Ratios as of September 30, 2017 Consolidated Regulatory Capital as of September 30, 2017 Note: Regulatory capital ratios on this page do not reflect the anticipated subordinated debt offering of $150mm and the anticipated perpetual preferred equity offering Source: SNL Financial; Company documents Tier 1 Capital includes 8.00% Series A Preferred The Series A Preferred (4,000,000 shares O/S, with an aggregate liquidation amount of $100mm) callable beginning Feb 2018 Tier 2 Capital includes various floating rate TruPS (aggregate liquidation amount of $217.5mm as of 9/30/2017) TruPS consists of 10 separate issuances, which are all currently callable, have variable interest rates ranging from 3 month LIBOR + 1.30% - 3.60%; maturities from 2028 to 2037 Possible redemptions reviewed regularly depending on projected capital needs and market conditions How we intend to deploy capital Intend to exceed regulatory well-capitalized requirements Reinvest in our business lines to support organic growth Redeem some or all of Series A Preferred Pay a regular dividend The common dividend payout ratio was 35% in 2016 and 32% in 2015 Current quarterly dividend of $0.21 per common share equates to an annualized yield of approximately 2.0% Consider stock buy-backs when prior capital actions are not sufficient to utilize excess capital Acquisitions with an active and disciplined approach Summary of Capital Composition Common stock, net 75% Preferred Stock 6% TruPS 11% ALLL 8%
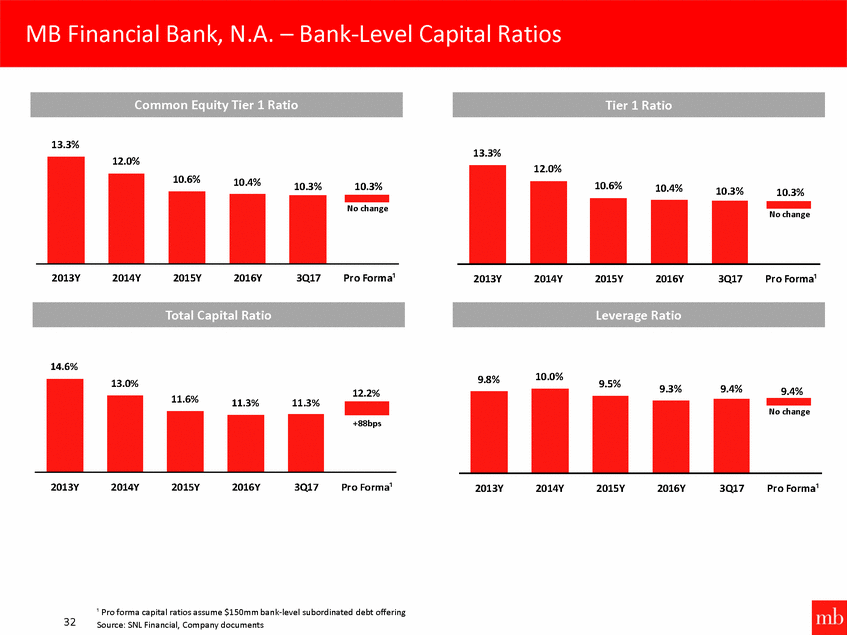
13.3% 13.3% 10.3% 10.3% 2013Y 2014Y 2015Y 2016Y 3Q17 Pr o Forma¹ 2013Y 2014Y 2015Y 2016Y 3Q17 Pr o Forma¹ 14.6% 10.0% 9.8% 9.5% 9.3% 9.4% 9.4% 12.2% 11.6% 11.3% 11.3% 2013Y 2014Y 2015Y 2016Y 3Q17 Pr o Forma¹ 2013Y 2014Y 2015Y 2016Y 3Q17 Pr o Forma¹ ¹ Pro forma capital ratios assume $150mm bank-level subordinated debt offering Source: SNL Financial, Company documents 32 No change 13.0% +88bps Total Capital Ratio Leverage Ratio 12.0% 10.6% 10.4% No change 12.0% 10.6%10.4%10.3% 10.3% No change Tier 1 Ratio Common Equity Tier 1 Ratio MB Financial Bank, N.A. – Bank-Level Capital Ratios
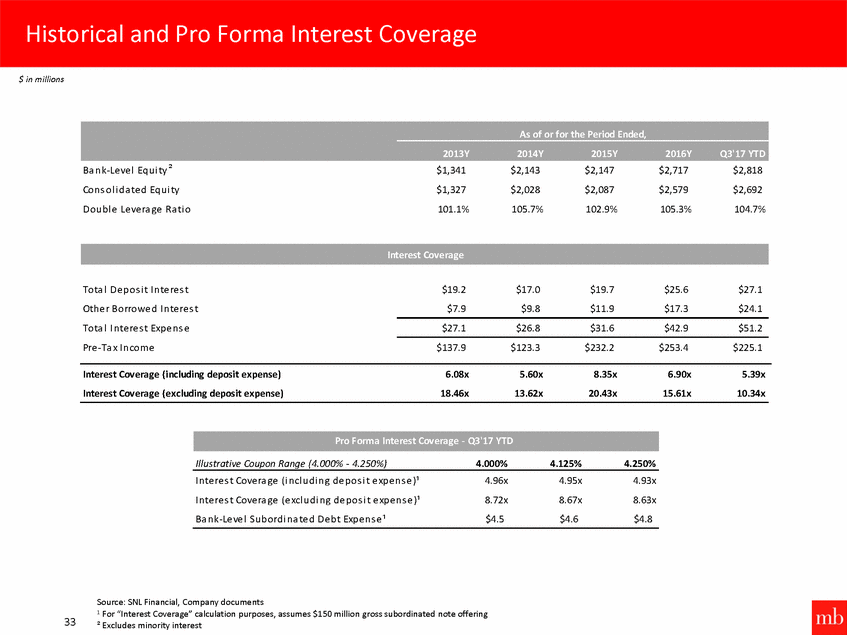
$ in millions Ba nk-Le ve l Equi ty ² Cons ol i da te d Equi ty Doubl e Le ve ra ge Ra ti o $1,341 $1,327 101.1% $2,143 $2,028 105.7% $2,147 $2,087 102.9% $2,717 $2,579 105.3% $2,818 $2,692 104.7% Tota l De pos i t I nte re s t Othe r Borrowe d I nte re s t Tota l I nte re s t Expe ns e Pre -Ta x I ncome $19.2 $7.9 $17.0 $9.8 $19.7 $11.9 $25.6 $17.3 $27.1 $24.1 $27.1 $26.8 $31.6 $42.9 $51.2 $137.9 $123.3 $232.2 $253.4 $225.1 Interest Coverage (including deposit expense) Interest Coverage (excluding deposit expense) 6.08x 18.46x 5.60x 13.62x 8.35x 20.43x 6.90x 15.61x 5.39x 10.34x Illustrative Coupon Range (4.000% - 4.250%) 4.000% 4.125% 4.250% I nte re s t Cove ra ge (i ncl udi ng de pos i t e xpe ns e )¹ I nte re s t Cove ra ge (e xcl udi ng de pos i t e xpe ns e )¹ Ba nk-Le ve l Subordi na te d De bt Expe ns e ¹ 4.96x 8.72x $4.5 4.95x 8.67x $4.6 4.93x 8.63x $4.8 Source: SNL Financial, Company documents 1 For “Interest Coverage” calculation purposes, assumes $150 million gross subordinated note offering ² Excludes minority interest 33 Pro Forma Interest Coverage - Q3'17 YTD Interest Coverage As of or for the Period Ended, 2013Y2014Y2015Y2016YQ3'17 YTD Historical and Pro Forma Interest Coverage
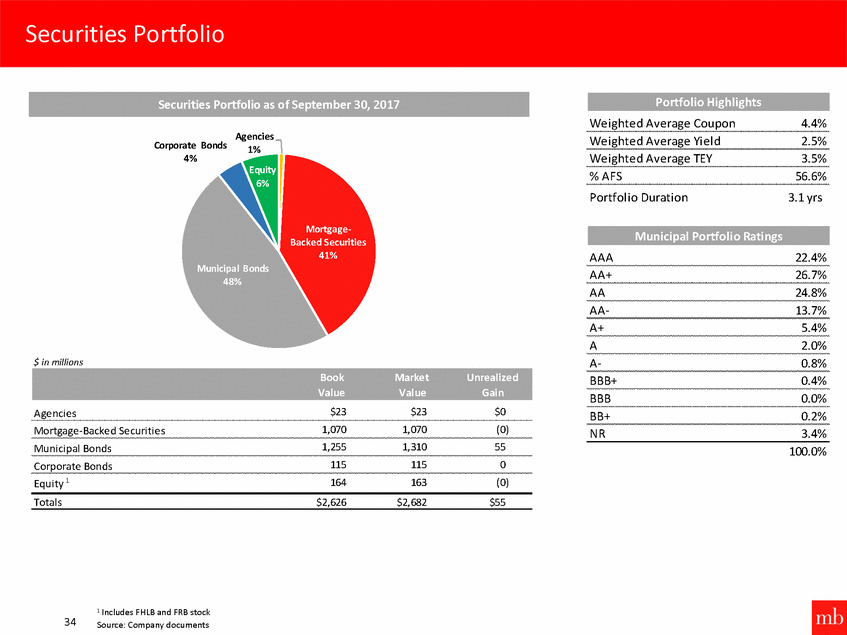
Portfolio Highlights Weighted Average Coupon 4.4% Agencies 1% Equity 6% Weighted Average Yield 2.5% Corporate Bonds 4% Weighted Average TEY 3.5% % AFS 56.6% Portfolio Duration 3.1 yrs Mort age-Backed ecurities 4 % AAA 22.4% Municipal Bonds 48% AA+ 26.7% AA 24.8% AA-13.7% A+ 5.4% A 2.0% $ in millions A-0.8% BBB+ 0.4% BBB 0.0% $23 $23 $0 Agencies BB+ 0.2% 1,070 1,070 (0) Mortgage-Backed Securities NR 3.4% 1,255 1,310 55 Municipal Bonds 100.0% 115 115 0 Corporate Bonds Equity 1 164 163 (0) Totals $2,626 $2,682 $55 1 Includes FHLB and FRB stock Source: Company documents 34 Book Market Unrealized Value Value Gain Municipal Portfolio Ratings Securities Portfolio as of September 30, 2017 Securities Portfolio
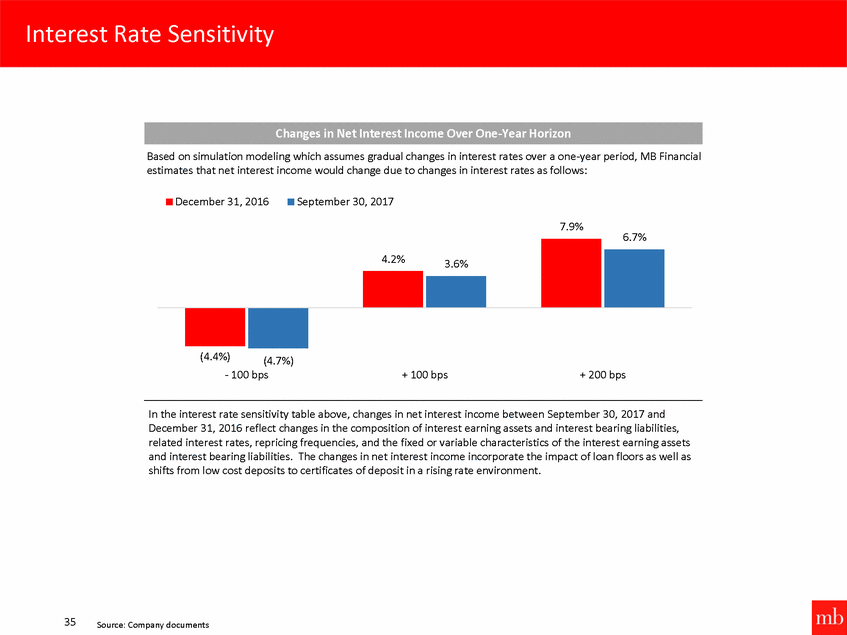
Based on simulation modeling which assumes gradual changes in interest rates over a one-year period, MB Financial estimates that net interest income would change due to changes in interest rates as follows: December 31, 2016 September 30, 2017 7.9% 6.7% (4.4%) (4.7%) - 100 bps + 100 bps + 200 bps In the interest rate sensitivity table above, changes in net interest income between September 30, 2017 and December 31, 2016 reflect changes in the composition of interest earning assets and interest bearing liabilities, related interest rates, repricing frequencies, and the fixed or variable characteristics of the interest earning assets and interest bearing liabilities. The changes in net interest income incorporate the impact of loan floors as well as shifts from low cost deposits to certificates of deposit in a rising rate environment. 35 Source: Company documents 4.2%3.6% Changes in Net Interest Income Over One-Year Horizon Interest Rate Sensitivity
5. Non-GAAP Disclosure Appendix 36

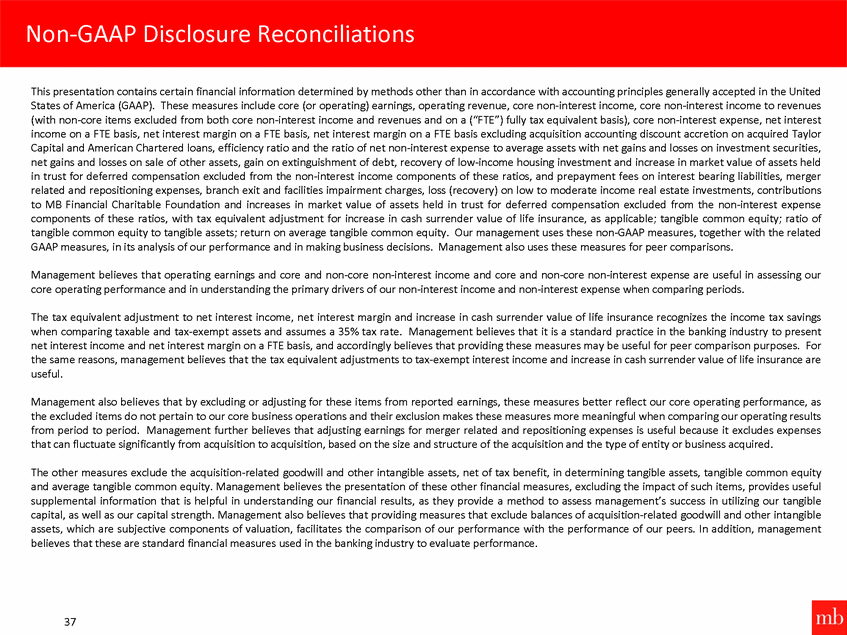
This presentation contains certain financial information determined by methods other than in accordance with accounting principles generally accepted in the United States of America (GAAP). These measures include core (or operating) earnings, operating revenue, core non-interest income, core non-interest income to revenues (with non-core items excluded from both core non-interest income and revenues and on a (“FTE”) fully tax equivalent basis), core non-interest expense, net interest income on a FTE basis, net interest margin on a FTE basis, net interest margin on a FTE basis excluding acquisition accounting discount accretion on acquired Taylor Capital and American Chartered loans, efficiency ratio and the ratio of net non-interest expense to average assets with net gains and losses on investment securities, net gains and losses on sale of other assets, gain on extinguishment of debt, recovery of low-income housing investment and increase in market value of assets held in trust for deferred compensation excluded from the non-interest income components of these ratios, and prepayment fees on interest bearing liabilities, merger related and repositioning expenses, branch exit and facilities impairment charges, loss (recovery) on low to moderate income real estate investments, contributions to MB Financial Charitable Foundation and increases in market value of assets held in trust for deferred compensation excluded from the non-interest expense components of these ratios, with tax equivalent adjustment for increase in cash surrender value of life insurance, as applicable; tangible common equity; ratio of tangible common equity to tangible assets; return on average tangible common equity. Our management uses these non-GAAP measures, together with the related GAAP measures, in its analysis of our performance and in making business decisions. Management also uses these measures for peer comparisons. Management believes that operating earnings and core and non-core non-interest income and core and non-core non-interest expense are useful in assessing our core operating performance and in understanding the primary drivers of our non-interest income and non-interest expense when comparing periods. The tax equivalent adjustment to net interest income, net interest margin and increase in cash surrender value of life insurance recognizes the income tax savings when comparing taxable and tax-exempt assets and assumes a 35% tax rate. Management believes that it is a standard practice in the banking industry to present net interest income and net interest margin on a FTE basis, and accordingly believes that providing these measures may be useful for peer comparison purposes. For the same reasons, management believes that the tax equivalent adjustments to tax-exempt interest income and increase in cash surrender value of life insurance are useful. Management also believes that by excluding or adjusting for these items from reported earnings, these measures better reflect our core operating performance, as the excluded items do not pertain to our core business operations and their exclusion makes these measures more meaningful when comparing our operating results from period to period. Management further believes that adjusting earnings for merger related and repositioning expenses is useful because it excludes expenses that can fluctuate significantly from acquisition to acquisition, based on the size and structure of the acquisition and the type of entity or business acquired. The other measures exclude the acquisition-related goodwill and other intangible assets, net of tax benefit, in determining tangible assets, tangible common equity and average tangible common equity. Management believes the presentation of these other financial measures, excluding the impact of such items, provides useful supplemental information that is helpful in understanding our financial results, as they provide a method to assess management’s success in utilizing our tangible capital, as well as our capital strength. Management also believes that providing measures that exclude balances of acquisition-related goodwill and other intangible assets, which are subjective components of valuation, facilitates the comparison of our performance with the performance of our peers. In addition, management believes that these are standard financial measures used in the banking industry to evaluate performance. 37 Non-GAAP Disclosure Reconciliations
The following table reconciles tangible common equity to common stockholders’ equity (in millions): 2012 2013 2014 2015 2016 3Q17 Common s tockhol de rs ' e qui ty - a s re porte d Le s s : goodwi l l Le s s : othe r i nta ngi bl e a s s e ts , ne t of ta x be ne fi t Ta ngi bl e common e qui ty $ 1,276 424 $ 1,327 423 $ 1,913 711 $ 1,972 725 $ 2,464 1,001 $ 2,577 1,000 19 15 25 29 41 37 $ 833 $ 889 $ 1,177 $ 1,218 $ 1,422 $ 1,540 The following table reconciles tangible assets to total assets (in millions): 2012 2013 2014 2015 2016 3Q17 Tota l a s s e ts - a s re porte d Le s s : goodwi l l Le s s : othe r i nta ngi bl e a s s e ts , ne t of ta x be ne fi t Ta ngi bl e a s s e ts $ 9,572 424 $ 9,641 423 $ 14,602 711 $ 15,585 725 $ 19,302 1,001 $ 20,117 1,000 19 15 25 29 41 37 $ 9,129 $ 9,203 $ 13,866 $ 14,831 $ 18,260 $ 19,080 38 Non-GAAP Disclosure Reconciliations
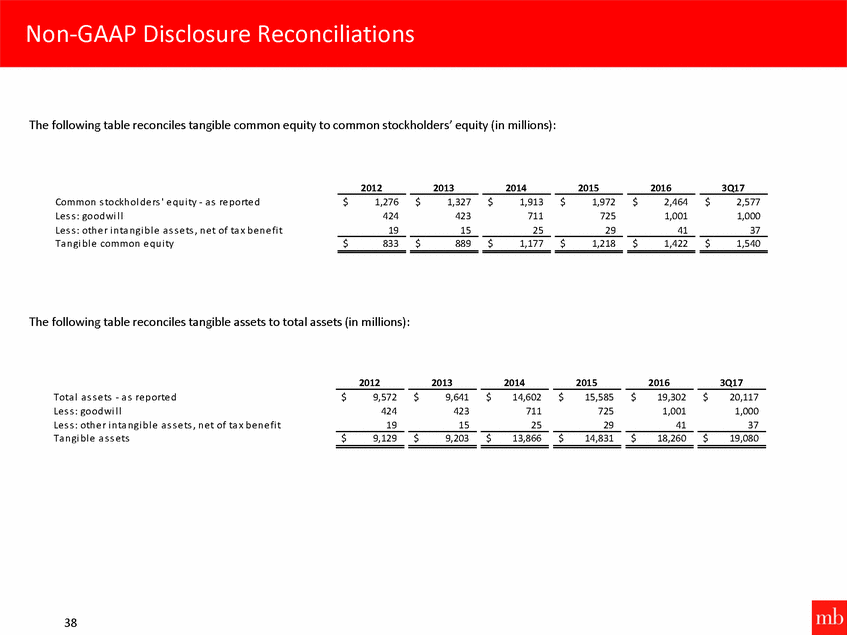
The following table reconciles average tangible common equity to average common stockholders’ equity (in millions): LTM 2013 2014 2015 2016 3Q17 Ave ra ge common s tockhol de rs ' e qui ty - a s re porte d Le s s : a ve ra ge goodwi l l Le s s : a ve ra ge othe r i nta ngi bl e a s s e ts , ne t of ta x be ne fi t Ave ra ge ta ngi bl e common e qui ty $ 1,298 423 $ 1,552 528 $ 1,944 712 $ 2,161 821 $ 2,493 999 17 18 24 32 39 $ 858 $ 1,006 $ 1,208 $ 1,308 $ 1,455 39 Non-GAAP Disclosure Reconciliations
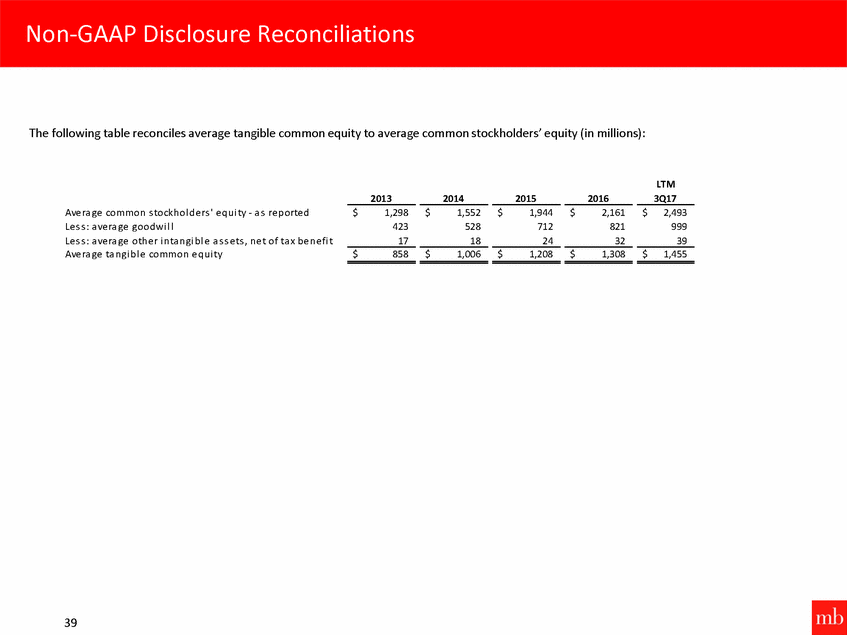
The following table reconciles loan yields on a fully tax equivalent basis and loan yields on a fully tax equivalent basis excluding discount accretion on acquired Taylor Capital and American Chartered loans for the periods presented: Three Months Ended Years Ended December 31, September 30, 2014 2015 2016 2017 Loa n yi e l ds , ful l y ta x e qui va l e nt (FTE) Le s s : e ffe ct of e xcl udi ng di s count a ccre ti on on a cqui re d Ta yl or Ca pi ta l a nd Ame ri ca n Cha rte re d l oa ns Loa n yi e l ds , FTE, e xcl udi ng di s count a ccre ti on on a cqui re d Ta yl or Ca pi ta l a nd Ame ri ca n Cha rte re d l oa ns 4.31% 4.24% 4.18% 4.42% 0.27% 0.40% 0.29% 0.25% 4.04% 3.84% 3.89% 4.17% The following table reconciles net interest margin to net interest margin on a fully tax equivalent basis and net interest margin on a fully tax equivalent basis excluding discount accretion on acquired Taylor Capital and American Chartered loans for the periods presented: Three Months Ended Years Ended December 31, September 30, 2014 2015 2016 2017 Ne t i nte re s t ma rgi n Pl us : ta x e qui va l e nt e ffe ct Ne t i nte re s t ma rgi n, FTE Le s s : e ffe ct of e xcl udi ng di s count a ccre ti on on a cqui re d Ta yl or Ca pi ta l a nd Ame ri ca n Cha rte re d l oa ns Ne t i nte re s t ma rgi n, FTE, e xcl udi ng di s count a ccre ti on on a cqui re d Ta yl or Ca pi ta l a nd Ame ri ca n Cha rte re d l oa ns 3.51% 3.60% 3.50% 3.60% 0.24% 0.21% 0.20% 0.16% 3.75% 3.81% 3.70% 3.76% 0.19% 0.28% 0.21% 0.20% 3.56% 3.53% 3.49% 3.56% 40 Non-GAAP Disclosure Reconciliations
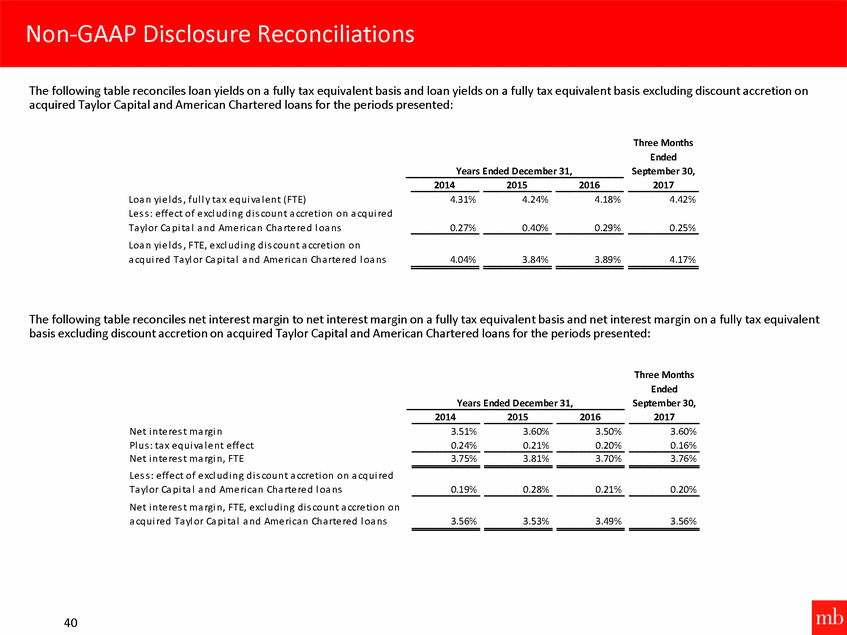
The following table presents a reconciliation of net income to operating earnings (in millions): Years Ended December 31, LTM 2013 2014 2015 2016 3Q17 Ne t i ncome , a s re porte d Non-core i te m a djus tme nts Ne t l os s e s (ga i ns ) on i nve s tme nt s e curi ti e s Ne t l os s e s (ga i ns ) on s a l e of othe r a s s e ts (Ga i n) on e xti ngui s hme nt of de bt Los s (re cove ry) on l ow to mode ra te i ncome re a l e s ta te i nve s tme nts Me rge r re l a te d a nd re pos i ti oni ng e xpe ns e s Bra nch e xi t a nd fa ci l i ti e s i mpa i rme nt cha rge s Pre pa yme nt fe e s on i nte re s t be a ri ng l i a bi l i ti e s Contri buti on to MB Fi na nci a l Cha ri ta bl e Founda ti on Tota l non-core i te ms I ncome ta x e xpe ns e on non-core i te ms I ncome ta x be ne fi t on a dopti ng ne w s tock-ba s e d compe ns a ti on gui da nce a nd re ve rs a l s of ta x l i a bi l i ti e s no l onge r ne e de d re l a te d to a cqui re d e nti ti e s Op e ra ti ng e a rni ngs Di vi de nds a nd a ccre ti on on pre fe rre d s ha re s Op e ra ti ng e a rni ngs a va i l a bl e to common s tockhol de rs $ 98.5 $ 86.1 $ 158.9 $ 174.1 $ 207.0 - 0.3 - 2.5 (3.5) (1.9) 0.2 - - (0.4) 0.8 - (0.6) 1.0 - - 2.5 - - 2.1 45.4 - - - 5.5 - 0.1 - 23.7 0.2 - (0.7) 15.5 1.8 - - 3.3 - 4.0 - $ 2.8 0.5 $ 48.0 13.7 $ 5.8 2.8 $ 28.3 10.1 $ 17.0 6.3 - - - 1.8 2.1 100.8 - 120.3 (4.0) 161.9 (8.0) 190.5 (8.0) 215.6 (8.0) $ 100.8 $ 116.3 $ 153.9 $ 182.5 $ 207.6 41 Non-GAAP Disclosure Reconciliations
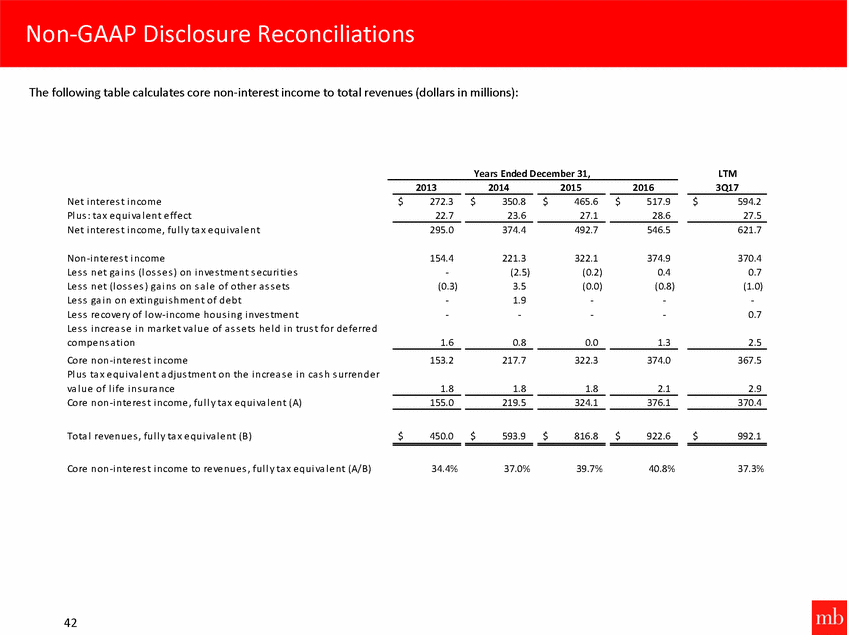
The following table calculates core non-interest income to total revenues (dollars in millions): Years Ended December 31, LTM 3Q17 2013 2014 2015 2016 Ne t i nte re s t i ncome Pl us : ta x e qui va l e nt e ffe ct Ne t i nte re s t i ncome , ful l y ta x e qui va l e nt $ 272.3 $ 350.8 $ 465.6 $ 517.9 $ 594.2 22.7 23.6 27.1 28.6 27.5 295.0 374.4 492.7 546.5 621.7 Non-i nte re s t i ncome Le s s ne t ga i ns (l os s e s ) on i nve s tme nt s e curi ti e s Le s s ne t (l os s e s ) ga i ns on s a l e of othe r a s s e ts Le s s ga i n on e xti ngui s hme nt of de bt Le s s re cove ry of l ow-i ncome hous i ng i nve s tme nt Le s s i ncre a s e i n ma rke t va l ue of a s s e ts he l d i n trus t for de fe rre d compe ns a ti on Core non-i nte re s t i ncome Pl us ta x e qui va l e nt a djus tme nt on the i ncre a s e i n ca s h s urre nde r va l ue of l i fe i ns ura nce Core non-i nte re s t i ncome , ful l y ta x e qui va l e nt (A) 154.4 - (0.3) - - 221.3 (2.5) 3.5 1.9 - 322.1 (0.2) (0.0) - - 374.9 0.4 (0.8) - - 370.4 0.7 (1.0) - 0.7 1.6 0.8 0.0 1.3 2.5 153.2 217.7 322.3 374.0 367.5 1.8 1.8 1.8 2.1 2.9 155.0 219.5 324.1 376.1 370.4 Tota l re ve nue s , ful l y ta x e qui va l e nt (B) $ 450.0$ 593.9$ 816.8$ 922.6 $ 992.1 Core non-i nte re s t i ncome to re ve nue s , ful l y ta x e qui va l e nt (A/B) 34.4% 37.0% 39.7% 40.8% 37.3% 42 Non-GAAP Disclosure Reconciliations
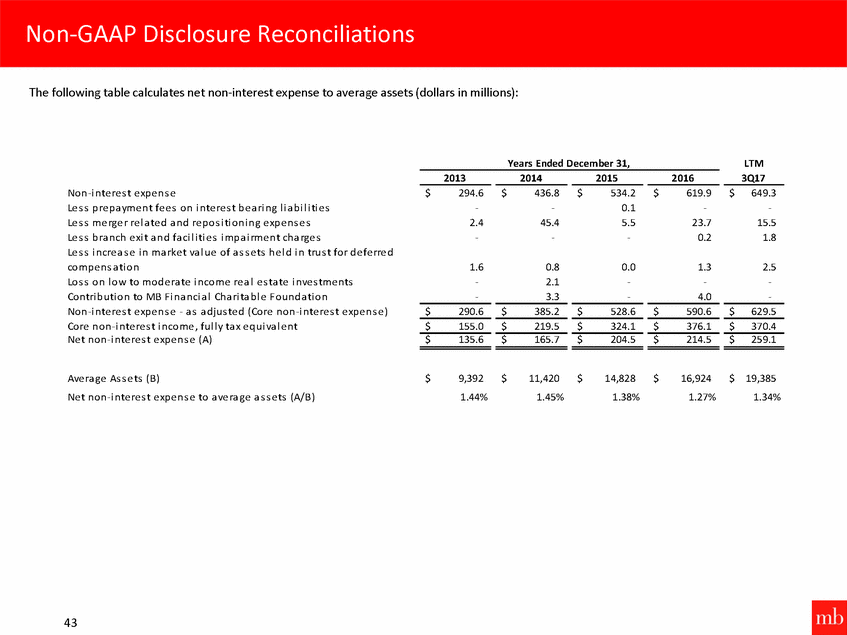
The following table calculates net non-interest expense to average assets (dollars in millions): Years Ended December 31, LTM 2013 2014 2015 2016 3Q17 Non-i nte re s t e xpe ns e Le s s pre pa yme nt fe e s on i nte re s t be a ri ng l i a bi l i ti e s Le s s me rge r re l a te d a nd re pos i ti oni ng e xpe ns e s Le s s bra nch e xi t a nd fa ci l i ti e s i mpa i rme nt cha rge s Le s s i ncre a s e i n ma rke t va l ue of a s s e ts he l d i n trus t for de fe rre d compe ns a ti on Los s on l ow to mode ra te i ncome re a l e s ta te i nve s tme nts Contri buti on to MB Fi na nci a l Cha ri ta bl e Founda ti on Non-i nte re s t e xpe ns e - a s a djus te d (Core non-i nte re s t e xpe ns e ) Core non-i nte re s t i ncome , ful l y ta x e qui va l e nt Ne t non-i nte re s t e xpe ns e (A) $ 294.6 - 2.4 - $ 436.8 - 45.4 - $ 534.2 0.1 5.5 - $ 619.9 - 23.7 0.2 $ 649.3 - 15.5 1.8 1.6 - 0.8 2.1 0.0 - 1.3 - 2.5 - - 3.3 - 4.0 - $ 290.6 $ 385.2 $ 528.6 $ 590.6 $ 629.5 $ 155.0 $ 219.5 $ 324.1 $ 376.1 $ 370.4 $ 135.6 $ 165.7 $ 204.5 $ 214.5 $ 259.1 Ave ra ge As s e ts (B) Ne t non-i nte re s t e xpe ns e to a ve ra ge a s s e ts (A/B) $ 9,392 1.44% $ 11,420 1.45% $ 14,828 1.38% $ 16,924 1.27% $ 19,385 1.34% 43 Non-GAAP Disclosure Reconciliations
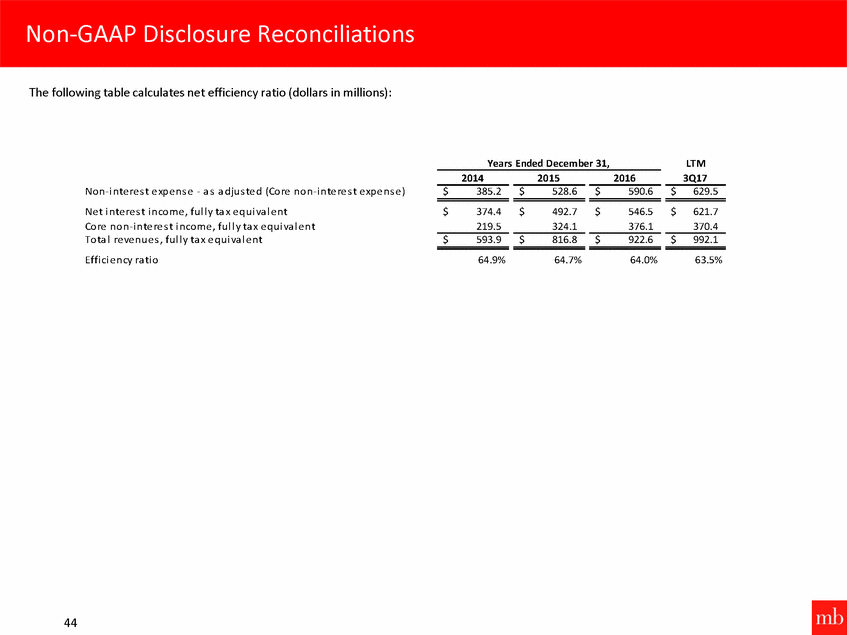
The following table calculates net efficiency ratio (dollars in millions): Years Ended December 31, LTM 3Q17 2014 2015 2016 Non-i nte re s t e xpe ns e - a s a djus te d (Core non-i nte re s t e xpe ns e ) Ne t i nte re s t i ncome , ful l y ta x e qui va l e nt Core non-i nte re s t i ncome , ful l y ta x e qui va l e nt Tota l re ve nue s , ful l y ta x e qui va l e nt Effi ci e ncy ra ti o $ 385.2 $ 528.6 $ 590.6 $ 629.5 $ 374.4 219.5 $ 492.7 324.1 $ 546.5 376.1 $ 621.7 370.4 $ 593.9 $ 816.8 $ 922.6 $ 992.1 64.9% 64.7% 64.0% 63.5% 44 Non-GAAP Disclosure Reconciliations
