Attached files
| file | filename |
|---|---|
| EX-32.2 - EXHIBIT 32.2 - NorthStar Realty Europe Corp. | nre09302017exhibit322.htm |
| EX-32.1 - EXHIBIT 32.1 - NorthStar Realty Europe Corp. | nre09302017exhibit321.htm |
| EX-31.2 - EXHIBIT 31.2 - NorthStar Realty Europe Corp. | nre09302017exhibit312.htm |
| EX-31.1 - EXHIBIT 31.1 - NorthStar Realty Europe Corp. | nre09302017exhibit311.htm |
| EX-10.2 - EXHIBIT 10.2 - NorthStar Realty Europe Corp. | nre09302017exhibit102.htm |
| EX-10.1 - EXHIBIT 10.1 - NorthStar Realty Europe Corp. | nre09302017exhibit101.htm |
UNITED STATES
SECURITIES AND EXCHANGE COMMISSION
Washington, D.C. 20549
FORM 10-Q
QUARTERLY REPORT PURSUANT TO SECTION 13 OR 15(d)
OF THE SECURITIES EXCHANGE ACT OF 1934
For the quarterly period ended September 30, 2017
Commission File Number: 001-37597
NORTHSTAR REALTY EUROPE CORP.
(Exact Name of Registrant as Specified in its Charter)
Maryland (State or Other Jurisdiction of Incorporation or Organization) | 32-0468861 (IRS Employer Identification No.) |
399 Park Avenue, 18th Floor, New York, NY 10022
(Address of Principal Executive Offices, Including Zip Code)
(212) 547-2600
(Registrant’s Telephone Number, Including Area Code)
Indicate by check mark whether the registrant (1) has filed all reports required to be filed by Section 13 or 15(d) of the Securities Exchange Act of 1934 during the preceding 12 months (or for such shorter period that the registrant was required to file such reports) and (2) has been subject to such filing requirements for the past 90 days. Yes x No o
Indicate by check mark whether the registrant has submitted electronically and posted on its corporate Web site, if any, every Interactive Data File required to be submitted and posted pursuant to Rule 405 of Regulation S-T (§232.405 of this chapter) during the preceding 12 months (or for such shorter period that the registrant was required to submit and post such files). Yes x No o
Indicate by check mark whether the registrant is a large accelerated filer, an accelerated filer, a non-accelerated filer, a smaller reporting company, or an emerging growth company. See the definitions of “large accelerated filer,” “accelerated filer,” “smaller reporting company,” and “emerging growth company” in Rule 12b-2 of the Exchange Act. (Check one):
Large accelerated filer o | Accelerated filer x | Non-accelerated filer o (Do not check if a smaller reporting company) | Smaller reporting company o Emerging growth company x | |||
If an emerging growth company, indicate by check mark if the registrant has elected not to use the extended transition period for complying with any new or revised financial accounting standards provided pursuant to Section 13(a) of the Exchange Act. x
Indicate by check mark whether the registrant is a shell company (as defined in Rule 12b-2 of the Exchange Act). Yes o No x
Indicate the number of shares outstanding of each of the registrant’s classes of common stock, as of the latest practicable date:
The Company has one class of common stock, $0.01 par value per share, 55,396,627 shares outstanding as of November 6, 2017.
NORTHSTAR REALTY EUROPE CORP.
FORM 10-Q
TABLE OF CONTENTS
Index | Page | |
2
FORWARD-LOOKING STATEMENTS
This Quarterly Report on Form 10-Q contains certain “forward-looking statements” within the meaning of the Private Securities Litigation Reform Act of 1995, Section 27A of the Securities Act of 1933, as amended, or Securities Act, and Section 21E of the Securities Exchange Act of 1934, as amended, or Exchange Act. Forward-looking statements are generally identifiable by use of forward-looking terminology such as “may,” “will,” “should,” “potential,” “intend,” “expect,” “seek,” “anticipate,” “estimate,” “believe,” “could,” “project,” “predict,” “continue,” “future” or other similar words or expressions. Forward-looking statements are not guarantees of performance and are based on certain assumptions, discuss future expectations, describe plans and strategies, contain projections of results of operations or of financial condition or state other forward-looking information. Such statements include, but are not limited to, those relating to the operating performance of our investments, our liquidity and financing needs, the effects of our current strategies and investment activities, our ability to grow our business, our expected leverage, our expected cost of capital, our ability to divest non-strategic properties, our management’s track record and our ability to raise and effectively deploy capital. Our ability to predict results or the actual effect of plans or strategies is inherently uncertain, particularly given the economic environment. Although we believe that the expectations reflected in such forward-looking statements are based on reasonable assumptions, our actual results and performance could differ materially from those set forth in the forward-looking statements and you should not unduly rely on these statements. These forward-looking statements involve risks, uncertainties and other factors that may cause our actual results in future periods to differ materially from those forward-looking statements. These factors include, but are not limited to:
• | the effect of economic conditions, particularly in Europe, on the valuation of our investments and on the tenants of the real property that we own; |
• | the effect of the Mergers (as defined in Note 1) on our business; |
• | the ability of Colony NorthStar Inc., or CLNS, to scale its operations in Europe to effectively manage our company; |
• | the unknown impact of the exit of the United Kingdom, or Brexit, or one or more other countries from the European Union, or EU, or the potential default of one or more countries in the EU or the potential break-up of the EU; |
• | our ability to qualify and remain qualified as a real estate investment trust, or REIT; |
• | adverse domestic or international economic geopolitical conditions and the impact on the commercial real estate industry; |
• | volatility, disruption or uncertainty in the financial markets; |
• | access to debt and equity capital and our liquidity; |
• | our substantial use of leverage and our ability to comply with the terms of our borrowing arrangements; |
• | our ability to monetize our assets on favorable terms or at all; |
• | our ability to obtain mortgage financing on our real estate portfolio on favorable terms or at all; |
• | our ability to acquire attractive investment opportunities and the impact of competition for attractive investment opportunities; |
• | the effect of an increased amount of activist stockholders owning our stock and stockholder activism generally; |
• | the effects of being an externally-managed company, including our reliance on CLNS and its affiliates and sub-advisors/co-venturers in providing management services to us, the payment of substantial base management and incentive fees to our manager, the allocation of investments by CLNS among us and CLNS’s other sponsored or managed companies and strategic vehicles and various conflicts of interest in our relationship with CLNS; |
• | performance of our investments relative to our expectations and the impact on our actual return on invested equity, as well as the cash provided by these investments and available for distribution; |
• | restrictions on our ability to engage in certain activities and the requirement that we may be required to access capital at inopportune times as a result of our borrowings; |
• | our ability to make borrowings under our credit facility; |
• | the impact of adverse conditions affecting office properties; |
• | illiquidity of properties in our portfolio; |
• | our ability to realize current and expected return over the life of our investments; |
• | tenant defaults or bankruptcy; |
3
• | any failure in our due diligence to identify all relevant facts in our underwriting process or otherwise; |
• | the impact of terrorism or hostilities involving Europe; |
• | our ability to manage our costs in line with our expectations and the impact on our cash available for distribution, or CAD, and net operating income, or NOI, of our properties; |
• | our ability to satisfy and manage our capital requirements; |
• | environmental and regulatory requirements, compliance costs and liabilities relating to owning and operating properties in our portfolio and to our business in general; |
• | effect of regulatory actions, litigation and contractual claims against us and our affiliates, including the potential settlement and litigation of such claims; |
• | changes in European, international and domestic laws or regulations governing various aspects of our business; |
• | future changes in foreign, federal, state and local tax law that may have an adverse impact on the cash flow and value of our investments; |
• | the impact that a rise in future interest rates may have on our floating rate financing; |
• | potential devaluation of foreign currencies, predominately the Euro and U.K. Pound Sterling, relative to the U.S. dollar due to quantitative easing in Europe, Brexit and/or other factors which could cause the U.S. dollar value of our investments to decline; |
• | general foreign exchange risk associated with properties located in European countries located outside of the Euro Area, including the United Kingdom; |
• | the loss of our exemption from the definition of an “investment company” under the Investment Company Act of 1940, as amended; |
• | CLNS’ ability to hire and retain qualified personnel and potential changes to key personnel providing management services to us; |
• | the lack of historical financial statements for properties we have acquired and may acquire in compliance with U.S. Securities and Exchange Commission, or SEC, requirements and U.S. generally accepted accounting principles, or U.S. GAAP, as well as the lack of familiarity of our tenants and third-party service providers with such requirements; |
• | the potential failure to maintain effective internal controls and disclosure controls and procedures; |
• | our status as an emerging growth company; and |
• | compliance with the rules governing REITs. |
The foregoing list of factors is not exhaustive. All forward-looking statements included in this Quarterly Report on Form 10-Q are based on information available to us on the date hereof and we are under no duty to update any of the forward-looking statements after the date of this report to conform these statements to actual results.
Factors that could have a material adverse effect on our operations and future prospects are set forth in our filings with the SEC included in Part I, Item 1A. of our Annual Report on Form 10-K for the fiscal year ended December 31, 2016 and in Part II, Item 1A. of this Form 10-Q, each under “Risk Factors.” The risk factors set forth in our filings with the SEC could cause our actual results to differ significantly from those contained in any forward-looking statement contained in this report.
4
PART I
Item 1. Financial Statements
NORTHSTAR REALTY EUROPE CORP. AND SUBSIDIARIES
CONSOLIDATED BALANCE SHEETS
(Dollars in Thousands)
(Unaudited)
September 30, 2017 | December 31, 2016 | ||||||
Assets | |||||||
Operating real estate, gross | $ | 1,751,141 | $ | 1,614,432 | |||
Less: accumulated depreciation | (96,805 | ) | (63,585 | ) | |||
Operating real estate, net | 1,654,336 | 1,550,847 | |||||
Preferred equity investments | 35,086 | — | |||||
Cash and cash equivalents | 49,728 | 66,308 | |||||
Restricted cash | 8,516 | 10,242 | |||||
Receivables, net of allowance of $611 and $553 as of September 30, 2017 and December 31, 2016, respectively | 8,114 | 6,015 | |||||
Assets held for sale | 76,141 | 28,208 | |||||
Derivative assets, at fair value | 8,054 | 13,729 | |||||
Intangible assets, net | 123,141 | 148,403 | |||||
Other assets, net | 26,117 | 21,640 | |||||
Total assets | $ | 1,989,233 | $ | 1,845,392 | |||
Liabilities | |||||||
Mortgage and other notes payable, net | $ | 1,272,758 | $ | 1,149,119 | |||
Accounts payable and accrued expenses | 25,318 | 28,004 | |||||
Due to related party (refer to Note 6) | 3,483 | 4,991 | |||||
Derivative liabilities, at fair value | 5,547 | — | |||||
Intangible liabilities, net | 29,911 | 30,802 | |||||
Liabilities held for sale | 2,453 | 2,041 | |||||
Other liabilities | 29,996 | 28,918 | |||||
Total liabilities | 1,369,466 | 1,243,875 | |||||
Commitments and contingencies | |||||||
Redeemable non-controlling interest (refer to Note 9) | 1,809 | 1,610 | |||||
Equity | |||||||
NorthStar Realty Europe Corp. Stockholders’ Equity | |||||||
Preferred stock, $0.01 par value, 200,000,000 shares authorized, no shares issued and outstanding as of September 30, 2017 and December 31, 2016 | — | — | |||||
Common stock, $0.01 par value, 1,000,000,000 shares authorized, 55,313,294 and 55,395,143 shares issued and outstanding as of September 30, 2017 and December 31, 2016, respectively | 554 | 554 | |||||
Additional paid-in capital | 937,195 | 925,473 | |||||
Retained earnings (accumulated deficit) | (340,198 | ) | (282,769 | ) | |||
Accumulated other comprehensive income (loss) | 15,281 | (51,424 | ) | ||||
Total NorthStar Realty Europe Corp. stockholders’ equity | 612,832 | 591,834 | |||||
Non-controlling interests | 5,126 | 8,073 | |||||
Total equity | 617,958 | 599,907 | |||||
Total liabilities, redeemable non-controlling interest and equity | $ | 1,989,233 | $ | 1,845,392 | |||
Refer to accompanying notes to consolidated financial statements.
5
NORTHSTAR REALTY EUROPE CORP. AND SUBSIDIARIES
CONSOLIDATED STATEMENTS OF OPERATIONS
(Dollars in Thousands, Except Per Share Data)
(Unaudited)
Three Months Ended September 30, | Nine Months Ended September 30, | ||||||||||||||
2017 | 2016 | 2017 | 2016 | ||||||||||||
Revenues | |||||||||||||||
Rental income | $ | 27,747 | $ | 29,798 | $ | 79,308 | $ | 98,622 | |||||||
Escalation income | 5,641 | 7,828 | 16,360 | 19,825 | |||||||||||
Interest income | 704 | — | 1,001 | — | |||||||||||
Other income | 171 | 149 | 708 | 899 | |||||||||||
Total revenues | 34,263 | 37,775 | 97,377 | 119,346 | |||||||||||
Expenses | |||||||||||||||
Properties - operating expenses | 7,519 | 9,493 | 22,521 | 27,263 | |||||||||||
Interest expense | 6,536 | 9,301 | 19,641 | 33,484 | |||||||||||
Transaction costs | 332 | 150 | 1,565 | 2,633 | |||||||||||
Impairment losses | — | — | — | 27,468 | |||||||||||
Management fee, related party | 3,585 | 3,548 | 10,716 | 10,548 | |||||||||||
Other expenses | 1,996 | 2,848 | 6,604 | 9,579 | |||||||||||
General and administrative expenses | 1,723 | 2,199 | 5,875 | 5,181 | |||||||||||
Compensation expense (1) | 2,839 | 5,194 | 20,094 | 12,225 | |||||||||||
Depreciation and amortization | 14,396 | 13,989 | 39,479 | 51,264 | |||||||||||
Total expenses | 38,926 | 46,722 | 126,495 | 179,645 | |||||||||||
Other income (loss) | |||||||||||||||
Unrealized gain (loss) on derivatives and other (refer to Note 10) | (3,472 | ) | (4,982 | ) | (12,068 | ) | (19,775 | ) | |||||||
Realized gain (loss) on sales and other | 1,681 | 3,814 | 8,632 | 6,188 | |||||||||||
Income (loss) before income tax benefit (expense) | (6,454 | ) | (10,115 | ) | (32,554 | ) | (73,886 | ) | |||||||
Income tax benefit (expense) | (352 | ) | (2,655 | ) | (316 | ) | (2,515 | ) | |||||||
Net income (loss) | (6,806 | ) | (12,770 | ) | (32,870 | ) | (76,401 | ) | |||||||
Net (income) loss attributable to non-controlling interests | 36 | 49 | 303 | 792 | |||||||||||
Net income (loss) attributable to NorthStar Realty Europe Corp. common stockholders | $ | (6,770 | ) | $ | (12,721 | ) | $ | (32,567 | ) | $ | (75,609 | ) | |||
Earnings (loss) per share: | |||||||||||||||
Basic | $ | (0.12 | ) | $ | (0.22 | ) | $ | (0.59 | ) | $ | (1.28 | ) | |||
Diluted | $ | (0.12 | ) | $ | (0.22 | ) | $ | (0.59 | ) | $ | (1.28 | ) | |||
Weighted average number of shares: | |||||||||||||||
Basic | 55,155,440 | 58,239,941 | 55,004,888 | 58,923,027 | |||||||||||
Diluted | 55,602,078 | 58,928,421 | 55,565,341 | 59,612,985 | |||||||||||
Dividends per share of common stock | $0.15 | $0.15 | $0.45 | $0.45 | |||||||||||
____________________
(1) | Compensation expense for the three and nine months ended September 30, 2017 and 2016 is comprised of equity-based compensation expenses. For the nine months ended September 30, 2017, compensation expense includes the impact of substantially all time based and certain performance based awards vesting in connection with the change of control of the Manager (refer to Note 7). |
Refer to accompanying notes to consolidated financial statements.
6
NORTHSTAR REALTY EUROPE CORP. AND SUBSIDIARIES
CONSOLIDATED STATEMENTS OF COMPREHENSIVE INCOME (LOSS)
(Dollars in Thousands)
(Unaudited)
Three Months Ended September 30, | Nine Months Ended September 30, | ||||||||||||||
2017 | 2016 | 2017 | 2016 | ||||||||||||
Net income (loss) | $ | (6,806 | ) | $ | (12,770 | ) | $ | (32,870 | ) | $ | (76,401 | ) | |||
Other comprehensive income (loss): | |||||||||||||||
Foreign currency translation adjustment, net | 20,532 | (4,964 | ) | 67,005 | (10,753 | ) | |||||||||
Total other comprehensive income (loss) | 20,532 | (4,964 | ) | 67,005 | (10,753 | ) | |||||||||
Comprehensive income (loss) | 13,726 | (17,734 | ) | 34,135 | (87,154 | ) | |||||||||
Comprehensive (income) loss attributable to non-controlling interests | 61 | (278 | ) | 3 | 739 | ||||||||||
Comprehensive income (loss) attributable to NorthStar Realty Europe Corp. common stockholders | $ | 13,787 | $ | (18,012 | ) | $ | 34,138 | $ | (86,415 | ) | |||||
Refer to accompanying notes to consolidated financial statements.
7
NORTHSTAR REALTY EUROPE CORP. AND SUBSIDIARIES
CONSOLIDATED STATEMENTS OF EQUITY
(Dollars and Shares in Thousands)
Common Stock | Additional Paid-in Capital | Retained Earnings (Accumulated Deficit) | Accumulated Other Comprehensive Income (Loss) | Total NorthStar Stockholders’ Equity | Non-controlling Interests | Total Equity | ||||||||||||||||||||||||
Shares | Amount | |||||||||||||||||||||||||||||
Balance as of December 31, 2015 | 59,326 | $ | 593 | $ | 968,662 | $ | (186,246 | ) | $ | 2,560 | $ | 785,569 | $ | 10,173 | $ | 795,742 | ||||||||||||||
Reallocation of interest in Operating Partnership (refer to Note 9) | — | — | 2,252 | — | — | 2,252 | (2,252 | ) | — | |||||||||||||||||||||
Amortization of equity-based compensation | — | — | 15,682 | — | — | 15,682 | 2,557 | 18,239 | ||||||||||||||||||||||
Issuance and vesting of restricted stock, net of tax withholding | 1,731 | 17 | (17 | ) | — | — | — | — | — | |||||||||||||||||||||
Tax withholding related to vesting of equity-based compensation | — | — | (2,546 | ) | — | — | (2,546 | ) | — | (2,546 | ) | |||||||||||||||||||
Retirement of shares of common stock | (5,662 | ) | (56 | ) | (58,560 | ) | — | — | (58,616 | ) | — | (58,616 | ) | |||||||||||||||||
Other comprehensive income (loss) | — | — | — | — | (53,984 | ) | (53,984 | ) | (1,242 | ) | (55,226 | ) | ||||||||||||||||||
Dividends on common stock and equity-based compensation | — | — | — | (34,770 | ) | — | (34,770 | ) | (414 | ) | (35,184 | ) | ||||||||||||||||||
Net income (loss) | — | — | — | (61,753 | ) | — | (61,753 | ) | (749 | ) | (62,502 | ) | ||||||||||||||||||
Balance as of December 31, 2016 | 55,395 | 554 | 925,473 | (282,769 | ) | (51,424 | ) | 591,834 | 8,073 | 599,907 | ||||||||||||||||||||
Reallocation of interest in Operating Partnership (refer to Note 9) | — | — | 1,817 | — | — | 1,817 | (1,817 | ) | — | |||||||||||||||||||||
Conversion of Common Units to common stock (refer to Note 9) | 263 | 3 | 3,054 | — | — | 3,057 | (3,057 | ) | — | |||||||||||||||||||||
Amortization of equity-based compensation (refer to Note 7) | — | — | 17,842 | — | — | 17,842 | 2,174 | 20,016 | ||||||||||||||||||||||
Issuance and vesting of restricted stock, net of tax withholding | 516 | 6 | (6 | ) | — | — | — | — | — | |||||||||||||||||||||
Tax withholding related to vesting of equity-based compensation | (861 | ) | (9 | ) | (10,985 | ) | — | — | (10,994 | ) | — | (10,994 | ) | |||||||||||||||||
Other comprehensive income (loss) | — | — | — | — | 66,705 | 66,705 | 300 | 67,005 | ||||||||||||||||||||||
Dividends on common stock and equity-based compensation | — | — | — | (24,862 | ) | — | (24,862 | ) | (244 | ) | (25,106 | ) | ||||||||||||||||||
Net income (loss) | — | — | — | (32,567 | ) | — | (32,567 | ) | (303 | ) | (32,870 | ) | ||||||||||||||||||
Balance as of September 30, 2017 (unaudited) | 55,313 | $ | 554 | $ | 937,195 | $ | (340,198 | ) | $ | 15,281 | $ | 612,832 | $ | 5,126 | $ | 617,958 | ||||||||||||||
Refer to accompanying notes to consolidated financial statements.
8
NORTHSTAR REALTY EUROPE CORP. AND SUBSIDIARIES
CONSOLIDATED STATEMENTS OF CASH FLOWS
(Dollars in Thousands)
(Unaudited)
Nine Months Ended September 30, | |||||||
2017 | 2016 | ||||||
Cash flows from operating activities: | |||||||
Net income (loss) | $ | (32,870 | ) | $ | (76,401 | ) | |
Adjustments to reconcile net income (loss) to net cash provided by (used in) operating activities: | |||||||
Depreciation and amortization | 39,479 | 51,264 | |||||
Amortization of deferred financing costs | 2,340 | 5,570 | |||||
Amortization of equity-based compensation | 20,016 | 11,456 | |||||
Allowance for uncollectible accounts | 403 | 425 | |||||
Unrealized (gain) loss on derivatives and other | 12,068 | 19,775 | |||||
Realized (gain) loss on sales and other | (8,632 | ) | (6,188 | ) | |||
Impairment losses | — | 27,468 | |||||
Amortization of capitalized above/below market leases | (256 | ) | 2,615 | ||||
Straight line rental income | (3,864 | ) | (6,049 | ) | |||
Deferred income taxes, net | (141 | ) | (2,189 | ) | |||
Changes in assets and liabilities: | |||||||
Restricted cash | 1,971 | (1,696 | ) | ||||
Receivables | (1,380 | ) | 154 | ||||
Other assets | (579 | ) | 2,669 | ||||
Accounts payable and accrued expenses | (6,412 | ) | (9,191 | ) | |||
Due to related party | (1,507 | ) | (340 | ) | |||
Other liabilities | 875 | 275 | |||||
Net cash provided by (used in) operating activities | 21,511 | 19,617 | |||||
Cash flows from investing activities: | |||||||
Improvements of operating real estate | (10,143 | ) | (7,858 | ) | |||
Origination of preferred equity investments | (35,086 | ) | — | ||||
Proceeds from sale of operating real estate | 48,622 | 364,771 | |||||
Other assets | (3,813 | ) | (8,320 | ) | |||
Changes in restricted cash | — | 10,026 | |||||
Net cash provided by (used in) investing activities | (420 | ) | 358,619 | ||||
Cash flows from financing activities: | |||||||
Repayment of mortgage and other notes payable | (12,888 | ) | (190,693 | ) | |||
Borrowings from credit facility | 35,000 | 65,000 | |||||
Borrowings from mortgage and other notes payable | 5,567 | 11,770 | |||||
Repayment of credit facility | (35,000 | ) | (65,000 | ) | |||
Repurchase of Senior Notes | — | (273,359 | ) | ||||
Payment of financing costs | (1,888 | ) | (3,946 | ) | |||
Purchase of derivative instruments | — | (380 | ) | ||||
Settlement of derivatives | 1,688 | (1,095 | ) | ||||
Retirement of shares of common stock | — | (29,132 | ) | ||||
Tax withholding related to vesting of equity-based compensation | (10,994 | ) | (195 | ) | |||
Dividends | (25,106 | ) | (26,859 | ) | |||
Distributions to non-controlling interest | — | (133 | ) | ||||
Net cash provided by (used in) financing activities | (43,621 | ) | (514,022 | ) | |||
Effect of foreign currency translation on cash and cash equivalents | 5,950 | 1,108 | |||||
Net increase (decrease) in cash and cash equivalents | (16,580 | ) | (134,678 | ) | |||
Cash and cash equivalents—beginning of period | 66,308 | 283,844 | |||||
Cash and cash equivalents—end of period | $ | 49,728 | $ | 149,166 | |||
Refer to accompanying notes to consolidated financial statements.
9
NORTHSTAR REALTY EUROPE CORP. AND SUBSIDIARIES
CONSOLIDATED STATEMENTS OF CASH FLOWS
(Dollars in Thousands) (Continued)
(Unaudited)
Nine Months Ended September 30, | |||||||
2017 | 2016 | ||||||
Supplemental disclosure of non-cash investing and financing activities: | |||||||
Reclassification of operating real estate to assets held for sale | $ | 45,224 | $ | 44,324 | |||
Conversion of Common Units to common stock | 3,057 | — | |||||
Reclassification of intangibles to assets and liabilities held for sale | 25,608 | 2,958 | |||||
Reclassification of other assets and liabilities to assets held for sale | 2,856 | — | |||||
Reclassification related to measurement adjustments/other | — | 5,587 | |||||
Retirement of shares of common stock | — | 1,753 | |||||
Reallocation of interest in Operating Partnership | 1,817 | 2,548 | |||||
Accrued capital expenditures and deferred assets | 689 | — | |||||
Refer to accompanying notes to consolidated financial statements.
10
NORTHSTAR REALTY EUROPE CORP. AND SUBSIDIARIES
NOTES TO CONSOLIDATED FINANCIAL STATEMENTS
(Unaudited)
1. | Formation and Organization |
NorthStar Realty Europe Corp. (“NorthStar Europe” or the “Company”) (NYSE: NRE), a publicly-traded real estate investment trust (“REIT”), is a European focused commercial real estate company with predominantly prime office properties in key cities within Germany, the United Kingdom and France (the “Core Portfolio”). The Company’s objective is to provide its stockholders with stable and recurring cash flow supplemented by capital growth over time.
The Company is externally managed and advised by an affiliate of the Manager. References to “the Manager” refer to NorthStar Asset Management Group Inc. (“NSAM”) for the period prior to the Mergers (refer below) and Colony NorthStar, Inc. (“Colony NorthStar” or “CLNS”), for the period subsequent to the Mergers. As part of the Mergers, NSAM changed its name to Colony NorthStar, Inc.
Substantially all of the Company’s assets, directly or indirectly, are held by, and the Company conducts its operations, directly or indirectly, through NorthStar Realty Europe Limited Partnership, a Delaware limited partnership and the operating partnership of the Company (the “Operating Partnership”). The Company has elected to be taxed, and will continue to conduct its operations so as to continue to qualify, as a REIT for U.S. federal income tax purposes.
All references herein to the Company refer to NorthStar Realty Europe Corp. and its consolidated subsidiaries, including the Operating Partnership, collectively, unless the context otherwise requires.
Merger Agreements among NSAM, NorthStar Realty and Colony Capital, Inc.
On January 10, 2017, the Company’s external manager, NSAM, completed a tri-party merger with NorthStar Realty Finance Corp. (“NorthStar Realty”) and Colony Capital, Inc. (“Colony”), pursuant to which the companies combined in an all-stock merger (“the Mergers”) of equals transaction to create a diversified real estate and investment management company. Under the terms of the merger agreement, NSAM, Colony and NorthStar Realty, through a series of transactions, merged with and into NSAM, which was renamed Colony NorthStar (NYSE: CLNS). Colony NorthStar is a leading global equity REIT with an embedded investment management platform.
Amended and Restated Management Agreement
On November 9, 2017, the Company entered into an amended and restated management agreement (the “Amended and Restated Management Agreement”) with an affiliate of our Manager, effective as of January 1, 2018. Refer to Note 14 “Subsequent Events” for a description of the terms of the Amended and Restated Management Agreement.
2. | Summary of Significant Accounting Policies |
Basis of Quarterly Presentation
The accompanying unaudited consolidated financial statements and related notes of the Company have been prepared in accordance with accounting principles generally accepted in the United States (“U.S. GAAP”) for interim financial reporting and the instructions to Form 10-Q and Rule 10-01 of Regulation S-X. Accordingly, certain information and note disclosures normally included in the consolidated financial statements prepared under U.S. GAAP have been condensed or omitted. In the opinion of management, all adjustments considered necessary for a fair statement of the Company’s financial position, results of operations and cash flows have been included and are of a normal and recurring nature. The operating results presented for interim periods are not necessarily indicative of the results that may be expected for any other interim period or for the entire year. These consolidated financial statements should be read in conjunction with the Company’s consolidated financial statements and notes thereto included in the Company’s Annual Report on Form 10-K for the fiscal year ended December 31, 2016, which was filed with the U.S. Securities and Exchange Commission (the “SEC”).
Principles of Consolidation
The consolidated financial statements include the accounts of the Company, the Operating Partnership and their consolidated subsidiaries. The Company consolidates variable interest entities (“VIE”) where the Company is the primary beneficiary and voting interest entities which are generally majority owned or otherwise controlled by the Company. All significant intercompany balances are eliminated in consolidation.
Variable Interest Entities
A VIE is an entity that lacks one or more of the characteristics of a voting interest entity. A VIE is defined as an entity in which equity investors do not have the characteristics of a controlling financial interest or do not have sufficient equity at risk for the entity to finance its activities without additional subordinated financial support from other parties. The determination of whether
11
NORTHSTAR REALTY EUROPE CORP. AND SUBSIDIARIES
NOTES TO CONSOLIDATED FINANCIAL STATEMENTS (Continued)
(Unaudited)
an entity is a VIE includes both a qualitative and quantitative analysis. The Company bases its qualitative analysis on its review of the design of the entity, its organizational structure including decision-making ability and relevant financial agreements and the quantitative analysis on the forecasted cash flow of the entity. The Company reassesses its initial evaluation of an entity as a VIE upon the occurrence of certain reconsideration events.
A VIE must be consolidated only by its primary beneficiary, which is defined as the party who, along with its affiliates and agents has both the: (i) power to direct the activities that most significantly impact the VIE’s economic performance; and (ii) obligation to absorb the losses of the VIE or the right to receive the benefits from the VIE, which could be significant to the VIE. The Company determines whether it is the primary beneficiary of a VIE by considering qualitative and quantitative factors, including, but not limited to: which activities most significantly impact the VIE’s economic performance and which party controls such activities; the amount and characteristics of its investment; the obligation or likelihood for the Company or other interests to provide financial support; consideration of the VIE’s purpose and design, including the risks the VIE was designed to create and pass through to its variable interest holders and the similarity with and significance to the business activities of the Company and the other interests. The Company reassesses its determination of whether it is the primary beneficiary of a VIE each reporting period. Significant judgments related to these determinations include estimates about the current and future fair value and performance of investments held by these VIEs and general market conditions.
The Company will evaluate its investments to determine whether they are a VIE. The Company analyzes new investments and financings, as well as reconsideration events for existing investments and financings, which vary depending on type of investment or financing.
Voting Interest Entities
A voting interest entity is an entity in which the total equity investment at risk is sufficient to enable it to finance its activities independently and the equity holders have the power to direct the activities of the entity that most significantly impact its economic performance, the obligation to absorb the losses of the entity and the right to receive the residual returns of the entity. The usual condition for a controlling financial interest in a voting interest entity is ownership of a majority voting interest. If the Company has a majority voting interest in a voting interest entity, the entity will generally be consolidated. The Company does not consolidate a voting interest entity if there are substantive participating rights by other parties and/or kick-out rights by a single party or through a simple majority vote.
The Company performs on-going reassessments of whether entities previously evaluated under the voting interest framework have become VIEs, based on certain events, and therefore subject to the VIE consolidation framework.
Non-controlling Interests
A non-controlling interest in a consolidated subsidiary is defined as the portion of the equity (net assets) in a subsidiary not attributable, directly or indirectly, to the Company. A non-controlling interest is required to be presented as a separate component of equity on the consolidated balance sheets and presented separately as net income (loss) and other comprehensive income (loss) (“OCI”) attributable to non-controlling interests. An allocation to a non-controlling interest may differ from the stated ownership percentage interest in such entity as a result of a preferred return and allocation formula, if any, as described in such governing documents.
Estimates
The preparation of consolidated financial statements in conformity with U.S. GAAP requires management to make estimates and assumptions that could affect the amounts reported in the consolidated financial statements and accompanying notes. Actual results could materially differ from those estimates and assumptions.
Reclassifications
Certain prior period amounts have been reclassified in the consolidated financial statements to conform to current period presentation including the gain (loss) on net cash on derivatives from unrealized gain (loss) to realized gain (loss) on the consolidated statements of operations for the three and nine months ended September 30, 2016 (refer to Note 10).
Comprehensive Income (Loss)
The Company reports consolidated comprehensive income (loss) in separate statements following the consolidated statements of operations. Comprehensive income (loss) is defined as the change in equity resulting from net income (loss) and OCI. The components of OCI principally include the foreign currency translation adjustment, net.
12
NORTHSTAR REALTY EUROPE CORP. AND SUBSIDIARIES
NOTES TO CONSOLIDATED FINANCIAL STATEMENTS (Continued)
(Unaudited)
Restricted Cash
Restricted cash primarily consists of amounts related to operating real estate such as escrows for taxes, insurance, capital expenditures, tenant security deposits and payments required under certain lease agreements and amounts related to the Company’s borrowings.
Operating Real Estate
Operating real estate is carried at historical cost less accumulated depreciation. Ordinary repairs and maintenance are expensed as incurred. Major replacements and improvements which extend the life of the asset are capitalized and depreciated over their useful life. Operating real estate is depreciated using the straight-line method over the estimated useful lives of the assets.
The Company accounts for purchases of operating real estate that qualify as business combinations using the acquisition method, where the purchase price is allocated to tangible assets such as land, building, tenant and land improvements and other identified intangibles, such as in-place leases, above/below-market leases and goodwill. Costs directly related to an acquisition deemed to be a business combination are expensed and included in transaction costs in the consolidated statements of operations.
Operating real estate is depreciated using the straight-line method over the estimated useful lives of the assets, summarized as follows:
Category: | Term: | |
Building | 40 years | |
Building improvements | Lesser of the useful life or remaining life of the building | |
Building leasehold interests | Lesser of 40 years or remaining term of the lease | |
Tenant improvements | Lesser of the useful life or remaining term of the lease | |
Preferred Equity Investments
Preferred equity investments are generally intended to be held to maturity and, accordingly, are carried at cost, net of unamortized loan fees, premium, discount and unfunded commitments, if any. Preferred equity investments that are deemed to be impaired are carried at amortized cost less a loan loss reserve, if deemed appropriate, which approximates fair value. Preferred equity investments where the Company does not have the intent to hold the investment for the foreseeable future or until its expected payoff are classified as held for sale and recorded at the lower of cost or fair value.
Assets and Liabilities Held For Sale
Operating real estate which has met the criteria to be classified as held for sale is separately presented on the consolidated balance sheets. Such operating real estate is recorded at the lower of its carrying value or its estimated fair value less the cost to sell net of the intangible assets associated with the asset, with any write-down to fair value less cost to sell recorded as an impairment loss. Once a property is determined to be held for sale, depreciation is no longer recorded. The Company records a gain or loss on sale of real estate when title is conveyed to the buyer and the Company has no substantial economic involvement with the property. If the sales criteria for the full accrual method are not met, the Company defers some or all of the gain or loss recognition by applying the finance, leasing, profit sharing, deposit, installment or cost recovery method, as appropriate, until the sales criteria are met.
Deferred Costs
Deferred costs primarily include deferred financing costs and deferred lease costs. Deferred financing costs represent commitment fees, legal and other third-party costs associated with obtaining financing. Costs related to revolving credit facilities are recorded in other assets and are amortized to interest expense using the straight-line basis over the term of the facility. Costs related to other borrowings are recorded net against the carrying value of such borrowings and are amortized into interest expense using the effective interest method or straight-line method depending on the type of financing. Unamortized deferred financing costs are expensed when the associated borrowing is repaid before maturity to realized gain (loss) on sales and other. Costs incurred in seeking financing transactions, which do not close, are expensed in the period in which it is determined that the financing will not occur. Deferred lease costs consist of fees incurred to initiate and renew operating leases, which are amortized on a straight-line basis over the remaining lease term and are recorded to depreciation and amortization in the consolidated statements of operations.
Intangible Assets and Intangible Liabilities
The Company records acquired identified intangibles, which includes intangible assets (such as value of the above-market leases, in-place leases, below-market ground leases, goodwill and other intangibles) and intangible liabilities (such as the value of below-market leases), based on estimated fair value. The value allocated to the above or below-market leases is amortized net to rental income, the value of below-market ground leases is amortized into properties - operating expense and in-place leases is amortized
13
NORTHSTAR REALTY EUROPE CORP. AND SUBSIDIARIES
NOTES TO CONSOLIDATED FINANCIAL STATEMENTS (Continued)
(Unaudited)
into depreciation and amortization expense, respectively, in the consolidated statements of operations on a straight-line basis over the respective remaining lease term.
Goodwill represents the excess of the purchase price over the fair value of net tangible and intangible assets acquired in a business combination and is not amortized. The Company analyzes goodwill for impairment on an annual basis and whenever events or changes in circumstances indicate that the carrying value of goodwill may not be fully recoverable. The Company first assesses qualitative factors to determine whether it is more likely than not that the fair value of a reporting unit, related to such goodwill, is less than the carrying amount as a basis to determine whether the two-step impairment test is necessary. The first step in the impairment test compares the fair value of the reporting unit with its carrying amount. If the carrying amount exceeds fair value, the second step is required to determine the amount of the impairment loss, if any, by comparing the implied fair value of the reporting unit goodwill with the carrying amount of such goodwill. The implied fair value of goodwill is derived by performing a hypothetical purchase price allocation for the reporting unit as of the measurement date, allocating the reporting unit’s estimated fair value to its net assets and identifiable intangible assets. The residual amount represents the implied fair value of goodwill. To the extent this amount is below the carrying value of goodwill, an impairment loss is recorded in the consolidated statements of operations.
The following table presents identified intangibles as of September 30, 2017 and December 31, 2016 (dollars in thousands):
September 30, 2017 | December 31, 2016 | ||||||||||||||||||||||
Gross Amount | Accumulated Amortization | Net | Gross Amount | Accumulated Amortization | Net | ||||||||||||||||||
Intangible assets: | |||||||||||||||||||||||
In-place lease | $ | 85,507 | $ | (37,932 | ) | $ | 47,575 | $ | 84,743 | $ | (29,012 | ) | $ | 55,731 | |||||||||
Above-market lease | 37,961 | (11,117 | ) | 26,844 | 36,704 | (8,198 | ) | 28,506 | |||||||||||||||
Below-market ground lease | 34,242 | (1,000 | ) | 33,242 | 51,218 | (832 | ) | 50,386 | |||||||||||||||
Goodwill(1) | 15,480 | N/A | 15,480 | 13,780 | N/A | 13,780 | |||||||||||||||||
Total | $ | 173,190 | $ | (50,049 | ) | $ | 123,141 | $ | 186,445 | $ | (38,042 | ) | $ | 148,403 | |||||||||
Intangible liabilities: | |||||||||||||||||||||||
Below-market lease | $ | 37,554 | $ | (12,917 | ) | $ | 24,637 | $ | 34,163 | $ | (8,104 | ) | $ | 26,059 | |||||||||
Above-market ground lease | 5,437 | (163 | ) | 5,274 | 4,839 | (96 | ) | 4,743 | |||||||||||||||
Total | $ | 42,991 | $ | (13,080 | ) | $ | 29,911 | $ | 39,002 | $ | (8,200 | ) | $ | 30,802 | |||||||||
(1) | Represents goodwill associated with certain acquisitions in exchange for shares in the underlying portfolios. The goodwill and a corresponding deferred tax liability was recorded at acquisition based on tax basis differences. |
14
NORTHSTAR REALTY EUROPE CORP. AND SUBSIDIARIES
NOTES TO CONSOLIDATED FINANCIAL STATEMENTS (Continued)
(Unaudited)
Other Assets and Other Liabilities
The following tables present a summary of other assets and other liabilities as of September 30, 2017 and December 31, 2016 (dollars in thousands):
September 30, 2017 | December 31, 2016 | ||||||
Other assets: | |||||||
Prepaid expenses | $ | 3,025 | $ | 1,951 | |||
Deferred leasing and other costs, net | 6,547 | 3,029 | |||||
Deferred tax assets, net | 32 | — | |||||
Straight-line rent, net | 12,502 | 10,182 | |||||
Escrow receivable | 3,242 | 6,168 | |||||
Other | 769 | 310 | |||||
Total | $ | 26,117 | $ | 21,640 | |||
September 30, 2017 | December 31, 2016 | ||||||
Other liabilities: | |||||||
Deferred tax liabilities | $ | 10,284 | $ | 8,916 | |||
Prepaid rent received and unearned revenue | 9,942 | 13,585 | |||||
Tenant security deposits | 4,322 | 4,322 | |||||
Prepaid escalation and other income | 5,163 | 1,560 | |||||
Other | 285 | 535 | |||||
Total | $ | 29,996 | $ | 28,918 | |||
Revenue Recognition
Operating Real Estate
Rental and escalation income from operating real estate is derived from leasing of space to various types of tenants. Rental revenue recognition commences when the tenant takes possession of the leased space and the leased space is substantially ready for its intended use. The leases are for fixed terms of varying length and generally provide for annual rentals, subject to indexation, and expense reimbursements to be paid in quarterly or monthly installments. Rental income from leases is recognized on a straight-line basis over the term of the respective leases. The excess of rents recognized over amounts contractually due pursuant to the underlying leases are included in other assets, net on the consolidated balance sheets. The Company amortizes any tenant inducements as a reduction of revenue utilizing the straight-line method over the term of the lease. Escalation income represents revenue from tenant leases which provide for the recovery of all or a portion of the operating expenses and real estate taxes paid by the Company on behalf of the respective property. This revenue is accrued in the same period as the expenses are incurred.
In a situation in which a lease or leases associated with a significant tenant have been, or are expected to be, terminated early, the Company evaluates the remaining useful life of depreciable or amortizable assets in the asset group related to the lease that will be terminated (i.e., tenant improvements, above and below market lease intangibles, in-place lease value and leasing commissions). Based upon consideration of the facts and circumstances surrounding the termination, the Company may write-off or accelerate the depreciation and amortization associated with the asset group. Such amounts are included within depreciation and amortization in the consolidated statements of operations.
Preferred Equity Investments
Interest income is recognized on an accrual basis and any related premium, discount, origination costs and fees are amortized over the life of the investment using the effective interest method. The amortization is reflected as an adjustment to interest income in the consolidated statements of operations. The amortization of a premium or accretion of a discount is discontinued if such investment is reclassified to held for sale.
15
NORTHSTAR REALTY EUROPE CORP. AND SUBSIDIARIES
NOTES TO CONSOLIDATED FINANCIAL STATEMENTS (Continued)
(Unaudited)
Impairment on Investments
Operating Real Estate
The Company’s real estate portfolio is reviewed on a quarterly basis, or more frequently as necessary, to assess whether there are any indicators that the value of its operating real estate may be impaired or that its carrying value may not be recoverable. A property’s value is considered impaired if the Company’s estimate of the aggregate expected future undiscounted cash flow to be generated by the property is less than the carrying value of the property. In conducting this review, the Company considers global macroeconomic factors, real estate sector conditions, together with investment specific and other factors. To the extent an impairment has occurred, the loss is measured as the excess of the carrying value of the property over the estimated fair value of the property and recorded in impairment losses in the consolidated statements of operations. For the three and nine months ended September 30, 2017 and the three months ended September 30, 2016, the Company did not recognize any impairment losses. For the nine months ended September 30, 2016, the Company recognized $27.5 million of impairment losses.
An allowance for a doubtful account for a tenant receivable is established based on a periodic review of aged receivables resulting from estimated losses due to the inability of a tenant to make required rent and other payments contractually due. Additionally, the Company establishes, on a current basis, an allowance for future tenant credit losses on unbilled rent receivable based on an evaluation of the collectability of such amounts.
Preferred Equity Investments
Preferred equity investments are considered impaired when, based on current information and events, it is probable that the Company will not be able to collect all principal and interest amounts due according to the contractual terms. The Company assesses the credit quality of the portfolio and adequacy of investment loss reserves on a quarterly basis or more frequently as necessary. Significant judgment of the Company is required in this analysis. The Company considers the estimated net recoverable value of the investment as well as other factors, including but not limited to the fair value of any collateral, the amount and the status of any senior debt, the quality and financial condition of the borrower and the competitive situation of the area where the underlying collateral is located. Because this determination is based on projections of future economic events, which are inherently subjective, the amount ultimately realized may differ materially from the carrying value as of the balance sheet date. If upon completion of the assessment, the estimated fair value of the underlying collateral is less than the net carrying value of the investment, an investment loss reserve is recorded with a corresponding charge to provision for investment losses. The investment loss reserve for each investment is maintained at a level that is determined to be adequate by management to absorb probable losses.
Income recognition is suspended for an investment at the earlier of the date at which payments become 90-days past due or when, in the opinion of the Company, a full recovery of income and principal becomes doubtful. When the ultimate collectability of the principal of an impaired investment is in doubt, all payments are applied to principal under the cost recovery method. When the ultimate collectability of the principal of an impaired investment is not in doubt, contractual interest is recorded as interest income when received, under the cash basis method until an accrual is resumed when the investment becomes contractually current and performance is demonstrated to be resumed. Interest accrued and not collected will be reversed against interest income. An investment is written off when it is no longer realizable and/or legally discharged. As of September 30, 2017, the Company did not have any impaired preferred equity investments.
Equity-Based Compensation
The Company accounts for equity-based compensation awards using the fair value method, which requires an estimate of fair value of the award. Awards may be based on a variety of measures such as time, performance, market or a combination thereof. For time-based awards, fair value is determined based on the stock price on the grant date. The Company recognizes compensation expense over the vesting period on a straight-line basis or the attribution method depending if the grant is to an employee or non-employee. For performance-based awards, fair value is determined based on the stock price at the date of grant and an estimate of the probable achievement of such measure. The Company recognizes compensation expense over the requisite service period, net of estimated forfeitures, using the accelerated attribution expense method. For market-based measures, fair value is determined using a Monte Carlo analysis under a risk-neutral premise using a risk-free interest rate. The Company recognizes compensation expense, over the requisite service period, net of estimated forfeitures, on a straight-line basis. For awards with a combination of performance or market measures, the Company estimates the fair value as if it were two separate awards. First, the Company estimates the probability of achieving the performance measure. If it is not probable the performance condition will be met, the Company records the compensation expense based on the fair value of the market measure, as described above. This expense is recorded even if the market-based measure is never met. If the performance-based measure is subsequently estimated to be achieved, the Company records compensation expense based on the performance-based measure. The Company would then record a cumulative catch-up adjustment for any additional compensation expense.
16
NORTHSTAR REALTY EUROPE CORP. AND SUBSIDIARIES
NOTES TO CONSOLIDATED FINANCIAL STATEMENTS (Continued)
(Unaudited)
Equity-based compensation issued to non-employees is accounted for using the fair value of the award at the earlier of the performance commitment date or performance completion date. Time-based awards are remeasured every quarter based on the stock price as of the end of the reporting period until such awards vest, if any.
Derivatives
The Company seeks to use derivative instruments to manage exposure to interest rate risk and foreign currency exchange rate risk. The change in fair value for a derivative is recorded in unrealized gain (loss) on derivatives and other in the consolidated statements of operations.
The Company’s derivative instruments are recorded on the consolidated balance sheets at fair value and do not qualify as hedges under U.S. GAAP.
Foreign Currency
Assets and liabilities denominated in a foreign currency for which the functional currency is a foreign currency are translated using the currency exchange rate in effect at the end of the period presented and the results of operations for such entities are translated into U.S. dollars using the average currency exchange rate in effect during the period. The resulting foreign currency translation adjustment (“CTA”), net, is recorded as a component of accumulated OCI in the consolidated statements of equity. For the three months ended September 30, 2017 and 2016, the Company reclassified $0.1 million and $11.5 million, respectively, of CTA to realized gain (loss) on sales and other in the consolidated statements of operations due to the sale of certain real estate assets. For the nine months ended September 30, 2017 and 2016, the Company reclassified $(0.3) million and $11.9 million, respectively, of CTA to realized gain (loss) on sales and other in the consolidated statements of operations due to the sale of certain real estate assets (refer to Note 3).
Assets and liabilities denominated in a foreign currency for which the functional currency is the U.S. dollar are remeasured using the currency exchange rate in effect at the end of the period presented and the results of operations for such entities are remeasured into U.S. dollars using the average currency exchange rate in effect during the period. The resulting foreign currency remeasurement adjustment is recorded in unrealized gain (loss) on derivatives and other in the consolidated statements of operations.
Earnings Per Share
The Company’s basic earnings per share (“EPS”) is calculated by dividing net income (loss) attributable to common stockholders by the weighted average number of common stock outstanding. Diluted EPS includes restricted stock and the potential dilution that could occur if outstanding restricted stock units (“RSUs”) or other contracts to issue common stock, assuming performance hurdles have been met, were converted to common stock (including limited partnership interests in the Operating Partnership owned by holders other than the Company (“Common Units”) and Common Units which are structured as profits interests (“LTIP Units” collectively referred to as Unit Holders) (refer to Note 7), where such exercise or conversion would result in a lower EPS. The dilutive effect of such RSUs and Unit Holders is calculated assuming all units are converted to common stock.
Income Taxes
The Company has elected to be taxed as a REIT for U.S. federal income tax purposes and will continue to comply with the related provisions of the Internal Revenue Code of 1986, as amended, the (“Internal Revenue Code”). Accordingly, the Company generally will not be subject to U.S. federal income tax to the extent of its distributions to stockholders and as long as certain asset, income and share ownership tests are met. To maintain its qualification as a REIT, the Company must annually distribute at least 90% of its REIT taxable income to its stockholders and meet certain other requirements. Under certain circumstances, federal income and excise taxes may be due on its undistributed taxable income. The Company distributes to its stockholders 100% of its taxable income and therefore no provision for U.S. federal income taxes has been included in the accompanying consolidated financial statements for the three and nine months ended September 30, 2017 and 2016.
The Company conducts its business through foreign subsidiaries which may be subject to local level income tax in the European jurisdictions it operates. The Company has also elected taxable REIT subsidiary (“TRS”) status for one of the Company’s foreign subsidiaries. This enables the Company to provide services that would otherwise be considered impermissible for REITs and participate in activities that do not qualify as “rents from real property.” The TRS is not resident in the U.S. and, as such, not subject to U.S. taxation but is subject to foreign income taxes only. In addition, the REIT will not generally be subject to any additional U.S. taxes on the repatriation of its earnings.
For the Company’s foreign subsidiaries, including the Company’s foreign TRS, deferred tax assets and liabilities are established for temporary differences between the financial reporting basis and the foreign tax basis of assets and liabilities at the enacted tax rates expected to be in effect when the temporary differences reverse. The Company evaluates the realizability of its deferred tax assets (e.g. net operating loss) and recognizes a valuation allowance if, based on the available evidence, it is more likely than not
17
NORTHSTAR REALTY EUROPE CORP. AND SUBSIDIARIES
NOTES TO CONSOLIDATED FINANCIAL STATEMENTS (Continued)
(Unaudited)
that some portion or all of its deferred tax assets will not be realized. When evaluating the realizability of its deferred tax assets, the Company considers estimates of expected future taxable income, existing and projected book/tax differences, tax planning strategies available and the general and industry specific economic outlook. This realizability analysis is inherently subjective, as it requires the Company to forecast its business and general economic environment in future periods. Due to past and projected losses in certain local jurisdictions where the Company does not have carryback potential and/or cannot sufficiently forecast future taxable income, the Company recognized net cumulative valuation allowances against the Company’s deferred tax assets. The Company will continue to review its deferred tax assets in accordance with U.S. GAAP.
The Company recorded an income tax expense for the three months ended September 30, 2017 and 2016 of $0.4 million and $2.7 million, respectively. The Company recorded an income tax expense for the nine months ended September 30, 2017 and 2016 of $0.3 million and $2.5 million, respectively.
Other
Refer to Note 2 of the consolidated financial statements in the Company’s Annual Report on Form 10-K for the fiscal year ended December 31, 2016 for further disclosure of the Company’s significant accounting policies.
Recent Accounting Pronouncements: Accounting Standards Adopted in 2017
In March 2016, the Financial Accounting Standards Board (“FASB”) issued guidance (Accounting Standards Update “ASU” No. 2016-05) clarifying that an assessment of whether an embedded contingent put or call option is clearly and closely related to a borrowing requires only an analysis of the four-step decision sequence. Additionally, entities are not required to separately assess whether the contingency itself is clearly and closely related. Entities are required to apply the guidance to existing instruments in scope using a modified retrospective transition method as of the period of adoption. The guidance is effective for fiscal years beginning after December 15, 2016 and interim periods within those years. The Company has adopted this guidance and it did not have any material impact on its consolidated financial position, results of operations and financial statement disclosures.
In March 2016, the FASB issued guidance (ASU No. 2016-09) which amends several aspects of the accounting for equity-based payment transactions, including the income tax consequences, classification of awards as either equity or liabilities and classification on the statements of cash flows. The guidance is effective for interim and annual reporting periods in fiscal years beginning after December 15, 2016. The Company has adopted this guidance and has made a policy election to account for forfeitures upon occurrence. The adoption did not have a material impact on the Company’s consolidated financial position, results of operations and financial statement disclosures.
Recent Accounting Pronouncements: Future Application of Accounting Standards
In May 2014, FASB issued an accounting update (ASU No. 2014-09) requiring a company to recognize as revenue the amount of consideration it expects to be entitled to in connection with the transfer of promised goods or services to customers. The accounting standard update will replace most of the existing revenue recognition guidance currently promulgated by U.S. GAAP. In July 2015, the FASB decided to delay the effective date of the new revenue standard by one year. The effective date of the new revenue standard for the Company will be January 1, 2018. The Company has commenced the process of adopting the new revenue standard; including forming a project team and compiling an inventory of the sources of revenue the Company expects will be impacted by the adoption of this standard. The Company plans to adopt the standard on its required effective date of January 1, 2018 using the modified retrospective approach. The new revenue standard specifically excludes revenue streams for which specific guidance is stipulated in other sections of the codification, therefore it will not impact rental income or interest income generated on financial instruments such as preferred equity investments. Rental revenue from lease contracts represents a significant portion of our total revenues and is a specific scope exception provided by this guidance. However, common area maintenance and other tenant reimbursable expenses provided to the lessee are considered a non-lease component and will be required to be separated from rental revenue and recorded on a separate financial statement line item upon adoption of the new accounting guidance on leases discussed below. The Company expects to apply the revenue recognition guidance related to its non-lease components within leases on January 1, 2019, upon its adoption of the lease accounting update. While this revenue stream is subject to the application of the new revenue recognition standard, the Company believes that the pattern and timing of recognition of income will be consistent with the current accounting model.
In February 2016, the FASB issued an accounting update (ASU No. 2016-02) that sets out the principles for the recognition, measurement, presentation and disclosure of leases for both parties to a contract (i.e., lessees and lessors). The update requires lessees to apply a dual approach, classifying leases as either finance or operating leases based on the principle of whether or not the lease is effectively a financed purchase of the leased asset by the lessee. This classification will determine whether the lease expense is recognized based on an effective interest method or on a straight-line basis over the term of the lease. A lessee is also required to record a right-of-use asset and a lease liability for all leases with a term of greater than 12 months regardless of their
18
NORTHSTAR REALTY EUROPE CORP. AND SUBSIDIARIES
NOTES TO CONSOLIDATED FINANCIAL STATEMENTS (Continued)
(Unaudited)
classification. Leases with a term of 12 months or less will be accounted for similar to existing guidance for operating leases today. The update is expected to result in the recognition of a right-to-use asset and related liability to account for the Company’s future obligations under its ground lease arrangements for which it is the lessee. As of September 30, 2017, the Company has three ground lease agreements with annual payments of $0.8 million. Additionally, the new update will require that lessees and lessors capitalize, as initial direct costs, only those costs that are incurred due to the execution of a lease. Under this guidance, allocated payroll costs and other costs that are incurred regardless of whether the lease is obtained will no longer be capitalized as initial direct costs and instead will be expensed as incurred. Lessors will continue to account for leases using an approach that is substantially equivalent to existing guidance for sales-type leases, direct financing leases and operating leases. The new guidance is to be applied using a modified retrospective approach at the beginning of the earliest comparative period in the financial statements and is effective for fiscal years beginning after December 15, 2018, including interim periods within those fiscal years. The Company is evaluating the impact, if any, that this guidance will have on its consolidated financial position, results of operations and financial statement disclosures.
In June 2016, the FASB issued guidance (ASU No. 2016-13) that changes the impairment model for most financial instruments by requiring companies to recognize an allowance for expected losses, rather than incurred losses as required currently by the other-than-temporary impairment model. The guidance will apply to most financial assets measured at amortized cost and certain other instruments, including trade and other receivables, loans, held-to-maturity debt securities, net investments in leases and off-balance-sheet credit exposures (e.g., loan commitments). The new guidance is effective for reporting periods beginning after December 15, 2019 and will be applied as a cumulative adjustment to retained earnings as of the effective date. The Company is evaluating the impact, if any, that this guidance will have on its consolidated financial position, results of operations and financial statement disclosures.
In August 2016, the FASB issued guidance (ASU No. 2016-15) that makes eight targeted changes to how cash receipts and cash payments are presented and classified in the statement of cash flows. The guidance is effective for fiscal years beginning after December 15, 2017 and interim periods within those fiscal years. If an entity early adopts the amendments in an interim period, any adjustments should be reflected as of the beginning of the fiscal year that includes that interim period. The new guidance requires adoption on a retrospective basis unless it is impracticable to apply, in which case the Company would be required to apply the amendments prospectively as of the earliest date practicable. The Company does not expect the adoption of this standard to have a material impact on its consolidated statements of cash flows.
In November 2016, the FASB issued guidance (ASU No. 2016-18) which requires entities to show the changes in the total of cash and cash equivalents and restricted cash and restricted cash equivalents in the statement of cash flows. Entities will no longer be permitted to present transfers between cash and cash equivalents and restricted cash and restricted cash equivalents in the statement of cash flows. The guidance is effective for reporting periods beginning after December 15, 2017 and will be applied retrospectively to all periods presented. The Company does not expect the adoption of this standard to have a material impact on its consolidated statement of cash flows.
In January 2017, the FASB issued guidance (ASU No. 2017-01) to clarify the definition of a business under ASC 805. This new standard clarifies the definition of a business and provides a screen to determine when an integrated set of assets and activities is not a business. The screen requires that when substantially all of the fair value of the gross assets acquired (or disposed of) is concentrated in a single identifiable asset or a group of similar identifiable assets, the set is not a business. The guidance is effective for fiscal years, and interim periods within those years, beginning December 15, 2017. The amendments in this update will be applied on a prospective basis. The Company expects that acquisitions of real estate or in-substance real estate will not meet the revised definition of a business because substantially all of the fair value is concentrated in a single identifiable asset or group of similar identifiable assets (i.e. land, buildings, and related intangible assets). The Company is evaluating the impact, if any, that this guidance will have on its consolidated financial position, results of operations and financial statement disclosures.
In January 2017, the FASB issued guidance (ASU No. 2017-04) which removes Step 2 from the goodwill impairment test. The guidance is effective for annual or any interim goodwill impairment tests in fiscal years beginning after December 15, 2019. The Company is evaluating the impact, if any, that this guidance will have on its consolidated financial position, results of operations and financial statement disclosures.
In February 2017, the FASB issued an accounting update (ASU No. 2017-05) which clarifies the scope of recently established guidance on nonfinancial asset derecognition, which applies to the derecognition of all nonfinancial assets and in-substance nonfinancial assets. In addition, the guidance clarifies the accounting for partial sales of nonfinancial assets and in-substance nonfinancial assets to align with the new revenue recognition standard to be more consistent with the accounting for sale of a business. Specifically, in a partial sale to a noncustomer, when a noncontrolling interest is received or retained, the latter is considered a noncash consideration and measured at fair value, which would result in full gain or loss recognized upon sale. This guidance has the same effective date as the new revenue guidance, which is January 1, 2018, with early adoption permitted beginning
19
NORTHSTAR REALTY EUROPE CORP. AND SUBSIDIARIES
NOTES TO CONSOLIDATED FINANCIAL STATEMENTS (Continued)
(Unaudited)
January 1, 2017. Both the revenue guidance and this update must be adopted concurrently. While the options for transition are similar to the new revenue guidance, either full retrospective or modified retrospective, the transition approach need not be aligned between both updates. The Company is evaluating the impact, if any, that this guidance will have on its consolidated financial position, results of operations and financial statement disclosures.
In May 2017, the FASB issued guidance (ASU No. 2017-09) clarifying when to account for a change to the terms or conditions of a share-based payment award as a modification. The guidance is effective for fiscal years beginning after December 15, 2017 and interim periods within those years. The Company is evaluating the impact, if any, that this guidance will have on its consolidated financial position, results of operations and financial statement disclosures.
3. | Operating Real Estate |
The following table presents operating real estate, net as of September 30, 2017 and December 31, 2016 (dollars in thousands):
September 30, 2017 | December 31, 2016 | |||||||
Land | $ | 400,366 | $ | 360,555 | ||||
Buildings and improvements | 1,095,858 | 980,053 | ||||||
Building, leasehold interests and improvements | 189,873 | 212,864 | ||||||
Furniture, fixtures and equipment | 854 | 1,214 | ||||||
Tenant improvements | 64,190 | 59,746 | ||||||
Operating real estate, gross | 1,751,141 | 1,614,432 | ||||||
Less: accumulated depreciation | (96,805 | ) | (63,585 | ) | ||||
Operating real estate, net | $ | 1,654,336 | $ | 1,550,847 | ||||
Real Estate Held for Sale
The following table summarizes the Company’s operating real estate held for sale as of September 30, 2017 (dollars in thousands):
Assets(1) | Liabilities(1) | |||||||||||||||||||||||||||||||
Location | Type | Properties | Operating Real Estate, Net | Intangible Assets, Net | Other Assets | Total(2) | Intangible Liabilities, Net | Other Liabilities | Total(2) | |||||||||||||||||||||||
Woking, United Kingdom | Office | 1 | $ | 45,224 | $ | 26,211 | $ | 4,706 | $ | 76,141 | $ | 603 | $ | 1,850 | $ | 2,453 | ||||||||||||||||
Total | 1 | $ | 45,224 | $ | 26,211 | $ | 4,706 | $ | 76,141 | $ | 603 | $ | 1,850 | $ | 2,453 | |||||||||||||||||
___________________
(1) | The assets and liabilities classified as held for sale are expected to be sold on the open market as a share sale subject to standard industry terms and conditions. The asset contributed $2.3 million and $2.2 million of revenue and income before income tax benefit (expense) of $0.7 million and $0.3 million for the three months ended September 30, 2017 and 2016, respectively. The asset contributed $7.0 million and $6.6 million of revenue and income before income tax benefit (expense) of $2.3 million and $0.3 million for the nine months ended September 30, 2017 and 2016, respectively. |
(2) | Represents operating real estate and intangible assets, net of accumulated depreciation and amortization of $8.9 million prior to being reclassified into held for sale. |
Real Estate Sales
The following table summarizes the Company’s real estate sales for the three and nine months ended September 30, 2017 (dollars in thousands):
Three Months Ended September 30,(1) | Nine Months Ended September 30,(1) | ||||||||||||||
2017 | 2016 | 2017 | 2016 | ||||||||||||
Properties | 2 | 8 | 5 | 14 | |||||||||||
Carrying Value(2) | $ | 9,686 | $ | 243,455 | $ | 36,874 | $ | 282,841 | |||||||
Sales Price | $ | 11,259 | $ | 242,195 | $ | 44,918 | $ | 293,511 | |||||||
Net Proceeds(3) | $ | 10,772 | $ | 237,743 | $ | 43,782 | $ | 284,679 | |||||||
Realized Gain (Loss) | $ | 1,086 | $ | (5,713 | ) | $ | 6,909 | $ | 1,840 | ||||||
__________________
(1) | Nine months ended September 30, 2017 and 2016 amounts are translated using the average exchange rate for the nine months ended September 30, 2017. Three months ended September 30, 2017 and 2016 amounts are translated using the average exchange rate for the three months ended September 30, 2017. |
20
NORTHSTAR REALTY EUROPE CORP. AND SUBSIDIARIES
NOTES TO CONSOLIDATED FINANCIAL STATEMENTS (Continued)
(Unaudited)
(2) | Includes the assets and liabilities related to share sales. |
(3) | Represents proceeds net of sales costs and excludes the associated property debt repayments of $2.1 million and $10.2 million for the three and nine months ended September 30, 2017, respectively. |
As of September 30, 2017, there were $1.8 million in certain escrow accounts that were not held by the Company which the Company could potentially record as a realized gain. The Company also recorded an additional realized gain for the three and nine months ended September 30, 2017 related to the release of escrow accounts from prior disposals of $0.8 million and $2.7 million, respectively.
4. | Preferred Equity Investments |
In May 2017, the Company partnered with a property developer in China to acquire 20 Gresham Street, a Class A office building in London, United Kingdom and the Company invested $35.1 million (£26.2 million) of preferred equity, which the Company accounts for as a debt investment.
The following table presents one preferred equity investment as of September 30, 2017 (dollars in thousands):
September 30, 2017 | |||||||||||||
Asset Type | Principal Amount | Carrying Value | Fixed Rate | Mandatory Redemption | |||||||||
Preferred equity investment | $ | 35,086 | $ | 35,086 | 8.00 | % | May 2020 | ||||||
Credit Quality Monitoring
The Company’s preferred equity investment is secured by interests in entities that directly own real estate properties, which serve as the primary source of cash for the payment of principal and interest. The Company evaluates its preferred equity investment at least quarterly and determines the relative credit quality principally based on: (i) whether the borrower is currently paying debt service in accordance with its contractual terms; and (ii) whether the Company believes the borrower will be able to perform under its contractual terms in the future, as well as the Company’s expectations as to the ultimate recovery of principal at maturity. The Company categorizes a preferred equity investment for which it expects to receive full payment of contractual principal and interest payments as “performing.” The Company will categorize a weaker credit quality preferred equity investment that is currently performing, but for which it believes future collection of all or some portion of principal and interest is in doubt, into a category called “performing with a loan loss reserve.” The Company will categorize a weaker credit quality preferred equity investment that is not performing, which the Company defines as a loan in maturity default and/or past due at least 90 days on its contractual debt service payments, as a non-performing loan (“NPL”).
As of September 30, 2017, the Company’s preferred equity investment was performing in accordance with the contractual terms of its governing documents, in all material respects, and was categorized as a performing loan. For the three and nine months ended September 30, 2017, the preferred equity investment contributed all interest income recorded on the consolidated statement of operations.
21
NORTHSTAR REALTY EUROPE CORP. AND SUBSIDIARIES
NOTES TO CONSOLIDATED FINANCIAL STATEMENTS (Continued)
(Unaudited)
5. | Borrowings |
The following table presents borrowings as of September 30, 2017 and December 31, 2016 (dollars in thousands):
September 30, 2017 | December 31, 2016 | |||||||||||||||||||
Final Maturity | Contractual Interest Rate(3) | Principal Amount | Carrying Value | Principal Amount | Carrying Value | |||||||||||||||
Mortgage and other notes payable:(1) | ||||||||||||||||||||
U.K. Complex(2) | Jan-20 | GBP LIBOR + 1.75% | $ | 54,404 | $ | 53,720 | $ | 50,116 | $ | 49,284 | ||||||||||
U.K. Complex - Mezzanine(2) | Jan-20 | 8.325% | 12,555 | 12,496 | 11,565 | 11,497 | ||||||||||||||
Trias Portfolio 1(4)(6) | Apr-20 | EURIBOR + 2.70% | 10,234 | 10,018 | 9,477 | 13,301 | ||||||||||||||
Trias Portfolio 2(4)(6)(8) | Dec-20 | EURIBOR + 1.55% | 90,309 | 89,423 | 78,952 | 78,708 | ||||||||||||||
Trias Portfolio 3(4)(6) | Apr-20 | EURIBOR + 1.65% | 44,193 | 42,972 | 45,170 | 39,568 | ||||||||||||||
Trias Portfolio 4(4)(6) | Apr-20 | GBP LIBOR + 2.70% | 17,198 | 16,839 | 15,843 | 15,446 | ||||||||||||||
SEB Portfolio 1(6) | Jul-24(9) | EURIBOR + 1.55%(9) | 312,924 | 308,412 | 278,539 | 274,614 | ||||||||||||||
SEB Portfolio 2(6) | Jul-24(9) | GBP LIBOR + 1.55%(9) | 248,975 | 245,310 | 229,353 | 226,078 | ||||||||||||||
SEB Portfolio - Preferred(5) | Apr-60 | 2.30% | 101,140 | 100,838 | 90,033 | 89,720 | ||||||||||||||
Trianon Tower(4) | Jul-23 | EURIBOR + 1.30% | 389,822 | 388,243 | 347,012 | 345,422 | ||||||||||||||
Other - Preferred(7) | Oct-45 | 1.00% | 4,488 | 4,487 | 6,151 | 5,481 | ||||||||||||||
Total mortgage and other notes payable | $ | 1,286,242 | $ | 1,272,758 | $ | 1,162,211 | $ | 1,149,119 | ||||||||||||
________________________
(1) | All mortgage notes and other notes payable are denominated in local currencies, as such, the principal amount generally increased due to the change in the Euro or U.K. Pound Sterling compared to the U.S. dollar. All borrowings are non-recourse and are interest-only through maturity, subject to compliance with covenants of the respective borrowing, and denominated in the same currency as the assets securing the borrowing. |
(2) | Includes mortgage note borrowings associated with an asset held for sale with an aggregate principal balance of $67.0 million. |
(3) | All floating rate debt is subject to interest caps of 0.5% for EURIBOR and 2.0% for GBP LIBOR which are used to manage interest rate exposure. |
(4) | Trias Portfolio represents the cross-collateralized borrowings among the IVG Portfolio, Internos Portfolio and Deka Portfolio. Such three portfolios were not under common control or management at the time of acquisition. |
(5) | Represents preferred equity certificates with a contractual interest rate of 2.3% through May 2019, which can be prepaid at that time without penalty in part or in full, which increases to EURIBOR plus 12.0% through May 2022 and subsequently to EURIBOR plus 15.0% through final maturity. Certain prepayments prior to May 2019 are subject to the payment of the unpaid coupon on outstanding principal amount through May 2019. |
(6) | Prepayment provisions include a fee based on principal amount ranging from 0.25% to 1.0% through December 2019 for the Trias Portfolio borrowings and 1.0% to 2.0% through July 2020 for the SEB Portfolio borrowings and 0.60% through June 30, 2018 and 0.30% through June 30, 2019 for Trianon Tower. |
(7) | Represents preferred equity certificates each with a fixed contractual interest rate of 1.0% per annum plus variable interest based on specified income levels associated with the German property companies of the Trias Portfolios which can be prepaid at any time without penalty through final maturity, which is thirty years from the issuance date. |
(8) | In June 2017, the Company amended and restated the agreement to increase the loan amount by $5.9 million and reduce future minimum capital expenditure spending requirements. |
(9) | In September 2017, the Company amended and restated the agreement to reduce the margin from 1.80% to 1.55% and extended the maturity date from April 1, 2022 to July 20, 2024. |
The following table presents a reconciliation of principal amount to carrying value of the Company’s mortgage and other notes payable as of September 30, 2017 and December 31, 2016 (dollars in thousands):
September 30, 2017 | December 31, 2016 | |||||||
Principal amount | $ | 1,286,242 | $ | 1,162,211 | ||||
Deferred financing costs, net | (13,484 | ) | (13,092 | ) | ||||
Carrying value | $ | 1,272,758 | $ | 1,149,119 | ||||
22
NORTHSTAR REALTY EUROPE CORP. AND SUBSIDIARIES
NOTES TO CONSOLIDATED FINANCIAL STATEMENTS (Continued)
(Unaudited)
The following table presents scheduled principal on borrowings, based on final maturity as of September 30, 2017 (dollars in thousands):
Mortgage and Other Notes Payable | ||||
October 1 to December 31, 2017 | $ | — | ||
Years ending December 31: | ||||
2018 | — | |||
2019 | — | |||
2020 | 228,893 | |||
2021 | — | |||
2022 and thereafter | 1,057,349 | |||
Total | $ | 1,286,242 | ||
As of September 30, 2017 and December 31, 2016, the Company was in compliance with all of its financial covenants.
Senior Notes
In July 2015, the Company issued $340.0 million principal amount of 4.625% senior stock-settlable notes due December 2016 (the “Senior Notes”) for aggregate net proceeds of $331.0 million, after deducting the underwriters’ discount and other expenses. The Senior Notes were senior unsubordinated and unsecured obligations of the Company and NorthStar Realty and NorthStar Realty’s operating partnership guaranteed payments on the Senior Notes.
The proceeds from the issuance of the Senior Notes were distributed to subsidiaries of NorthStar Realty, which used such amounts for general corporate purposes, including, among other things, the funding of acquisitions, including the Trianon Tower and the repayment of NorthStar Realty’s borrowings. Such distribution to NorthStar Realty was recorded in equity in net transactions with NorthStar Realty. During 2016, the Company repurchased approximately $272.3 million of the Senior Notes, at a slight premium to par value, through privately negotiated transactions and settled the remaining Senior Notes in cash at maturity.
Credit Facility
In May 2016, the Company entered into a $75.0 million corporate revolving credit facility (the “Credit Facility”) with certain commercial bank lenders, with an initial one year term. The Credit Facility was secured by collateral relating to a borrowing base at that time and guarantees by certain subsidiaries of the Company. In October 2016, the Company permanently reduced the aggregate commitments under the Credit Facility to $35.0 million. In April 2017, the Company amended and restated the Credit Facility with aggregate commitments of $35 million and an initial two year term. The Credit Facility no longer contains a limitation on availability based on a borrowing base and the interest rate remains the same. The Credit Facility has an accordion feature, allowing the total facility to increase to $70 million. As of September 30, 2017, there is no outstanding balance on the Credit Facility.
6. Related Party Arrangements
On November 9, 2017, the Company entered into an Amended and Restated Management Agreement with an affiliate of the Manager, effective as of January 1, 2018. The description of the management agreement included in this Note 6 relates to the original agreement that was entered into in November 2015 and which will be superseded as of January 1, 2018 by the Amended and Restated Management Agreement. Refer to Note 14 “Subsequent Events” for a description of the terms of the Amended and Restated Management Agreement.
Colony NorthStar, Inc.
Management Agreement
The Company entered into a management agreement with an affiliate of the Manager in November 2015. As asset manager, the Manager is responsible for the Company’s day-to-day operations, subject to supervision and management of the Company’s board of directors (the “Board”). Through its global network of subsidiaries and branch offices, the Manager performs services and engages in activities relating to, among other things, investments and financing, portfolio management and other administrative services, such as accounting and investor relations, to the Company and its subsidiaries. The management agreement with the Manager provides for a base management fee and incentive fee.
23
NORTHSTAR REALTY EUROPE CORP. AND SUBSIDIARIES
NOTES TO CONSOLIDATED FINANCIAL STATEMENTS (Continued)
(Unaudited)
Base Management Fee
For the three months ended September 30, 2017 and 2016, the Company incurred $3.6 million and $3.5 million, respectively, related to the base management fee. For the nine months ended September 30, 2017 and 2016, the Company incurred $10.7 million and $10.5 million, respectively, related to the base management fee. As of September 30, 2017, $3.5 million is recorded in due to related party on the consolidated balance sheets. The base management fee to the Manager could increase subsequent to September 30, 2017 by an amount equal to 1.5% per annum of the sum of:
• | any equity the Company issues in exchange or conversion of exchangeable or stock-settlable notes; |
• | any other issuances by the Company of common equity, preferred equity or other forms of equity, including but not limited to LTIP Units in the Operating Partnership (excluding units issued to the Company and equity-based compensation, but including issuances related to an acquisition, investment, joint venture or partnership); and |
• | cumulative cash available for distribution (“CAD”), if any, of the Company in excess of cumulative distributions paid on common stock, LTIP Units or other equity awards which began with the Company’s fiscal quarter ended March 31, 2016. |
Incentive Fee
For the three and nine months ended September 30, 2017 and 2016, the Company did not incur an incentive fee. The incentive fee is calculated and payable quarterly in arrears in cash, equal to:
• | the product of: (a) 15.0% and (b) the Company’s CAD before such incentive fee, divided by the weighted average shares outstanding for the calendar quarter, of any amount in excess of $0.30 per share and up to $0.36 per share; plus |
• | the product of: (a) 25.0% and (b) the Company’s CAD before such incentive fee, divided by the weighted average shares outstanding for the calendar quarter, of any amount in excess of $0.36 per share; |
• | multiplied by the Company’s weighted average shares outstanding for the calendar quarter. |
Weighted average shares represents the number of shares of the Company’s common stock, LTIP Units or other equity-based awards (with some exclusions), outstanding on a daily weighted average basis. With respect to the base management fee, all equity issuances are allocated on a daily weighted average basis during the fiscal quarter of issuance. With respect to the incentive fee, such amounts will be appropriately adjusted from time to time to take into account the effect of any stock split, reverse stock split, stock dividend, reclassification, recapitalization or other similar transaction.
Additional Management Agreement Terms
The Company’s management agreement with the Manager provides that in the event of a change of control of the Manager or other event that could be deemed an assignment of the management agreement, the Company will consider such assignment in good faith and not unreasonably withhold, condition or delay the Company’s consent. The management agreement further provides that the Company anticipates consent would be granted for an assignment or deemed assignment to a party with expertise in commercial real estate and over $10 billion of assets under management. The management agreement also provides that, notwithstanding anything in the agreement to the contrary, to the maximum extent permitted by applicable law, rules and regulations, in connection with any merger, sale of all or substantially all of the assets, change of control, reorganization, consolidation or any similar transaction by the Company or the Manager, directly or indirectly, the surviving entity will succeed to the terms of the management agreement.
Payment of Costs and Expenses and Expense Allocation
The Company is responsible for all of its direct costs and expenses and reimburses the Manager for costs and expenses incurred by the Manager on the Company’s behalf. In addition, the Manager may allocate indirect costs to the Company related to employees, occupancy and other general and administrative costs and expenses in accordance with the terms of, and subject to the limitations contained in, the Company’s management agreement with the Manager (the “G&A Allocation”). The Company’s management agreement with the Manager provides that the amount of the G&A Allocation will not exceed the following: (i) 20% of the total of: (a) the Company’s general and administrative expenses as reported in their consolidated financial statements excluding: (1) equity-based compensation expense, (2) non-recurring items, (3) fees payable to the Manager under the terms of the applicable management agreement and (4) any allocation of expenses to the Company’s (“NRE’s G&A”); and (b) the Manager’s general and administrative expenses as reported in its consolidated financial statements, excluding equity-based compensation expense and adding back any costs or expenses allocated to any managed company of the Manager; less (ii) NRE’s G&A. The G&A Allocation may include the Company’s allocable share of the Manager’s compensation and benefit costs associated with dedicated or partially dedicated personnel who spend all or a portion of their time managing the Company’s affairs, based upon the percentage of time devoted by such personnel to the Company’s affairs. The G&A Allocation may also include rental and occupancy, technology,
24
NORTHSTAR REALTY EUROPE CORP. AND SUBSIDIARIES
NOTES TO CONSOLIDATED FINANCIAL STATEMENTS (Continued)
(Unaudited)
office supplies, travel and entertainment and other general and administrative costs and expenses, which may be allocated based on various methodologies, such as weighted average employee count or the percentage of time devoted by personnel to such the Company affairs. In addition, the Company will pay directly or reimburse the Manager for an allocable portion of any severance paid pursuant to any employment, consulting or similar service agreements in effect between the Manager and any of its executives, employees or other service providers.
The Company’s obligation to reimburse the Manager for the G&A Allocation and any severance, at the Manager’s discretion, and the 20% cap on the G&A Allocation, as described above, applies on an aggregate basis to the Company.
For the three and nine months ended September 30, 2017 and three months ended September 30, 2016 the Manager did not allocate any general and administrative expenses to the Company. For the nine months ended September 30, 2016, the Manager allocated $0.1 million to the Company. For the three and nine months ended September 30, 2017 and 2016, the Manager did not allocate any severance to the Company.
In addition, the management agreement provides that the Company and any company spun-off from the Company, shall pay directly or reimburse the Manager for up to 50% of any long-term bonus or other compensation that the Manager’s compensation committee determines shall be paid and/or settled in the form of equity and/or equity-based compensation to executives, employees and service providers of the Managers’ during any year. Subject to this limitation and limitations contained in any applicable management agreement between the Manager and any company spun-off from the Company, the amount paid by the Company and any company spun-off from the Company will be determined by the Manager in its discretion. At the discretion of the Manager’s compensation committee, this compensation may be granted in shares of the Company’s restricted stock, restricted stock units, long-term incentive plan units or other forms of equity compensation or stock-based awards; provided that if at any time a sufficient number of shares of the Company’s common stock are not available for issuance under the Company’s equity compensation plan, such compensation shall be paid in the form of RSUs, LTIP Units or other securities that may be settled in cash. The Company’s equity compensation for each year may be allocated on an individual-by-individual basis at the discretion of the Manager’s compensation committee and, as long as the aggregate amount of the equity compensation for such year does not exceed the limits set forth in the management agreement, the proportion of any particular individual’s equity compensation may be greater or less than 50%.
The Company does not have employment agreements with its named executive officers, but the Company has generally agreed to pay directly or reimburse the Manager for the portion of any severance paid by the Manager or any of its affiliates to an individual pursuant to the terms of any employment, consulting or similar service agreement, including any employment agreements with Colony NorthStar or its subsidiaries and its named executive officers, that corresponds to or is attributable to: (i) the equity compensation that the Company is required to pay directly or reimburse the Manager pursuant to the management agreement; (ii) any cash and/or equity compensation paid directly by the Company to such individual as an employee or other service provider of the Company; and (iii) any amounts paid to such individual by the Manager or any of its affiliates that the Company is obligated to reimburse the Manager pursuant to the management agreement. With respect to Mahbod Nia only, in lieu of the foregoing severance payment or reimbursement, the Company has agreed to pay directly or reimburse the Manager for 50% of any cash payments made by the Manager or any of its affiliates in connection with the termination of Mr. Nia’s employment either without cause or upon the non-renewal of Mr. Nia’s term of employment by the employer or by Mr. Nia for good reason; provided that the Board consented to the taking of such action (or, with respect to a termination for good reason, any action taken with the intent to create good reason). Because the Company’s obligation to pay these amounts is owed to the Manager and not directly to the Company’s named executive officers and the Company does not control the terms of the agreements between the Manager or its affiliates and the Company’s named executive officers, the discussion above does not include these amounts or a discussion of any arrangements that the Manager or its affiliates may have with the Company’s named executive officers pursuant to which our obligations to the Manager may arise.
Manager Ownership of Common Stock
As of September 30, 2017, Colony NorthStar and its subsidiaries owned 4.9 million shares of the Company’s common stock, or approximately 9.0% of the total outstanding common stock.
7. | Compensation Expense |
The following summarizes the equity-based compensation for the three and nine months ended September 30, 2017 and 2016:
For the three months ended September 30, 2017 and 2016, the Company recorded $2.8 million and $5.2 million, respectively, of equity-based compensation expense which is recorded in compensation expenses on the consolidated statements of operations. For the nine months ended September 30, 2017 and 2016, the Company recorded $20.1 million and $12.2 million, respectively, of equity-based compensation expense which is recorded in compensation expenses on the consolidated statements of operations.
25
NORTHSTAR REALTY EUROPE CORP. AND SUBSIDIARIES
NOTES TO CONSOLIDATED FINANCIAL STATEMENTS (Continued)
(Unaudited)
In connection with the change of control of NSAM as a result of the Mergers, substantially all outstanding equity awards of the Company that were subject to vesting based solely on continued employment or services and a portion of the outstanding equity awards of the Company that were subject to vesting based on the achievement of additional performance-based criteria vested. As of September 30, 2017, equity-based compensation expense to be recognized over the remaining vesting period through January 2020 is $8.2 million, provided there are no additional forfeitures.
2015 Omnibus Stock Incentive Plan
Pursuant to the NorthStar Realty Europe Corp. 2015 Omnibus Stock Incentive Plan (the “2015 Plan”), the Company may issue equity awards to directors, officers, employees, co-employees, consultants and advisors of the Company, the Manager or of any parent or subsidiary who provides services to the Company. The number of shares that may be issued under the 2015 Plan equals 10 million shares of common stock, plus on January 1, 2017 and each January 1 thereafter, an additional 2% of the number of shares of common stock issued and outstanding on the immediately preceding December 31. In addition, shares of common stock underlying any awards that are forfeited, canceled, held back upon exercise of a stock option or settlement of an award to cover the exercise price or tax withholding, reacquired by the Company prior to vesting, satisfied without the issuance of common stock or otherwise terminated (other than by exercise) will be added back to the shares of common stock available for issuance under the 2015 Plan. As of September 30, 2017, under the 2015 Plan, a total of 1.2 million shares of common stock had been issued (net of forfeitures and shares held back for tax withholding), 1.7 million shares were reserved for issuance pursuant to outstanding equity awards (including 0.1 million reserved for issuance upon conversion of outstanding LTIP Units and1.6 million reserved for issuance pursuant to the outstanding Absolute RSUs and Relative RSUs) and 8.2 million otherwise unreserved shares remained available for issuance.
All of the equity awards issued by the Company since the spin-off from NorthStar Realty on November 1, 2015 (the “Spin-off”) have been issued under the 2015 Plan. During the nine months ended September 30, 2017, the Company issued 500,642 restricted shares of common stock under the 2015 Plan to employees of the Manager or its subsidiaries in accordance with the terms of the management agreement described above in Note 6, of which 379,594 vested in connection with the Mergers.
In March 2016, as contemplated in connection with the Spin-off, the Company granted an aggregate of 995,698 restricted shares of common stock and 1,493,551 restricted stock units (“RSUs”) to employees of the Manager or one of its subsidiaries under the 2015 Plan. The restricted shares of common stock were subject to vesting over the approximately four year period ending December 31, 2019, subject to continued employment with the Manager or one of its subsidiaries and the RSUs were market-based awards subject to the achievement of performance-based vesting conditions and continued employment with the Manager or one of its subsidiaries. Approximately one-half of these RSUs are subject to the achievement of performance-based hurdles relating to the Company’s absolute total stockholder return and continued employment with the Manager or one of its subsidiaries over the approximately four year period from the grant date through December 31, 2019 (the “Absolute RSUs”). The other approximately one-half of these RSUs are subject to the achievement of performance-based hurdles based on the Company’s total stockholder return relative to the MSCI US REIT Index and continued employment with the Manager or one of its subsidiaries over the approximately four year period from the grant date through December 31, 2019 (the “Relative RSUs”). Award recipients may earn up to 100% of the Absolute RSUs that were granted and up to 125% of the Relative RSUs that were granted. Upon vesting pursuant to the terms of the Absolute RSUs and Relative RSUs, the RSUs that vest will be settled in shares of common stock and the recipients will be entitled to receive the distributions that would have been paid with respect to a share of common stock (for each share that vests) on or after the date the RSUs were initially granted. In accordance with their terms, all of these restricted shares of common stock that remained outstanding vested in connection with the Mergers. The Absolute and Relative RSUs were not affected by the Mergers and remain outstanding, subject to forfeitures occurring in connection with termination of employment with the Manager or one of its subsidiaries.
Pre-Spin-Off NorthStar Realty Equity Awards
In addition to equity awards issued under the 2015 Plan, the Company also had equity subject to outstanding equity-based awards granted by NorthStar Realty prior to the Spin-Off. In connection with the Spin-Off, holders of shares of common stock of NorthStar Realty and LTIP units of NorthStar Realty’s operating partnership subject to outstanding equity awards received one share of the Company’s common stock or one Common Unit in the Operating Partnership, respectively, for every six shares of common stock of NorthStar Realty or LTIP units of NorthStar Realty’s operating partnership held. Other equity and equity-based awards relating to NorthStar Realty’s common stock, such as RSUs, were adjusted to also relate to one-sixth of a share of the Company’s common stock, but otherwise generally remained subject to the same vesting and other terms that applied prior to the Spin-off. Performance-based vesting conditions based on total stockholder return of NorthStar Realty or NorthStar Realty and NSAM were adjusted to refer to combined total stockholder return of NorthStar Realty and the Company or NorthStar Realty, NSAM and the Company, respectively, with respect to periods after the Spin-Off and references to a change of control or similar term in outstanding awards, which referred to a change of control of either NorthStar Realty or NSAM, were adjusted, to the extent such awards relate to
26
NORTHSTAR REALTY EUROPE CORP. AND SUBSIDIARIES
NOTES TO CONSOLIDATED FINANCIAL STATEMENTS (Continued)
(Unaudited)
common stock of the Company or Common Units in the Operating Partnership, to refer to a change of control of either the Company or NSAM.
Following the Spin-off, NorthStar Realty and the compensation committee of its Board continued to administer all awards granted by NorthStar Realty prior to the Spin-Off, but the Company was obligated to issue shares of the Company’s common stock or other equity awards of its subsidiaries or make cash payments in lieu thereof or with respect to dividend or distribution equivalent obligations to the extent required by these awards. These awards continued to be governed by the NorthStar Realty equity plans, as applicable, and shares of the Company’s common stock issued pursuant to these awards were not be issued pursuant to, and did not reduce availability under, the 2015 Plan. In connection with the Mergers, all of these outstanding equity-based awards (other than an RSU relating to 83,333 shares of the Company’s common stock) vested or were forfeited.
The following table presents activity related to the issuance, vesting, conversion and forfeitures of restricted stock and Common Units. The balance as of September 30, 2017 represents vested Common Units and unvested market-based RSUs (grants in thousands):
Nine Months Ended September 30, 2017 | ||||||||||||||||||
Restricted Stock(1) | Common Units(3) | Restricted Stock Units(4) | Performance RSUs(5) | Total Grants | Weighted Average Grant Price | |||||||||||||
December 31, 2016 | 1,139 | 688 | 83 | 1,868 | 3,778 | $ | 11.29 | |||||||||||
Granted | 516 | — | — | — | 516 | 12.69 | ||||||||||||
Converted | — | (263 | ) | — | — | (263 | ) | 21.10 | ||||||||||
Vested(2) | (1,534 | ) | — | — | (178 | ) | (1,712 | ) | 10.22 | |||||||||
Forfeited(6) | — | — | — | (237 | ) | (237 | ) | 4.87 | ||||||||||
September 30, 2017 | 121 | 425 | 83 | 1,453 | 2,082 | $ | 11.99 | |||||||||||
(1) | Represents restricted stock included in common stock. |
(2) | Vested primarily includes the acceleration of substantially all outstanding equity awards of the Company in connection with the change of control of NSAM as a result of the Mergers. |
(3) | Includes vested and unvested Common Units in the Operating Partnership issued in the Spin-Off with respect to equity-based awards granted by NorthStar Realty prior to the Spin-Off. As of September 30, 2017, all of these Common Units in the Operating Partnership were vested. |
(4) | Relates to an equity-based award granted by NorthStar Realty prior to the Spin-Off and represents a non-employee grant subject to service-based vesting conditions, which was scheduled to vest on January 22, 2019, however, in September 2017, pursuant to the terms of the RSU award, a vesting event occurred and on October 2, 2017, the Company issued 83,333 shares of common stock in settlement of these RSUs. The RSUs were entitled to dividend equivalents prior to vesting and were settled in cash. |
(5) | As of September 30, 2017, represented outstanding Absolute and Relative RSUs. |
(6) | Includes the forfeiture of performance based RSUs issued to NSAM executives as part of historical bonus plans in connection with the change of control of NSAM. |
8. | Stockholders’ Equity |
Share Repurchase
In November 2015, the Company’s board of directors authorized the repurchase of up to $100 million of its outstanding common stock. That authorization expired in November 2016 and at such time the Board authorized an additional repurchase of up to $100 million of its outstanding common stock through November 2017. For the nine months ended September 30, 2017, the Company did not repurchase any shares of its common stock. For the nine months ended September 30, 2016, the Company repurchased 3.0 million shares of its common stock for approximately $30.9 million. From the original authorization in November 2015 through September 30, 2017, the Company repurchased 9.3 million shares of its common stock for approximately $100.0 million.
Director Grants
In August 2017, the Company issued 30,340 shares of common stock with a fair value at the date of grant of $0.4 million to its independent directors as an annual grant of equity. The stock fully vested at issuance.
27
NORTHSTAR REALTY EUROPE CORP. AND SUBSIDIARIES
NOTES TO CONSOLIDATED FINANCIAL STATEMENTS (Continued)
(Unaudited)
Dividends
The following table presents dividends declared (on a per share basis) with respect to the nine months ended September 30, 2017 and 2016:
Common Stock | ||||
Declaration Date | Dividend Per Share | |||
2017 | ||||
May 1 | $ | 0.15 | ||
August 2 | $ | 0.15 | ||
November 6 | $ | 0.15 | ||
2016 | ||||
May 10 | $ | 0.15 | ||
August 3 | $ | 0.15 | ||
November 2 | $ | 0.15 | ||
Earnings Per Share
The following table presents EPS for the three and nine months ended September 30, 2017 and 2016 (dollars and shares in thousands, except per share data):
Three Months Ended September 30, | Nine Months Ended September 30, | ||||||||||||||
2017 | 2016 | 2017 | 2016 | ||||||||||||
Numerator: | |||||||||||||||
Net income (loss) attributable to NorthStar Realty Europe Corp. common stockholders | $ | (6,770 | ) | $ | (12,721 | ) | $ | (32,567 | ) | $ | (75,609 | ) | |||
Net income (loss) attributable to Unit Holders non-controlling interest | (62 | ) | (151 | ) | (372 | ) | (851 | ) | |||||||
Net income (loss) attributable to common stockholders and Unit Holders(1) | $ | (6,832 | ) | $ | (12,872 | ) | $ | (32,939 | ) | $ | (76,460 | ) | |||
Denominator:(2) | |||||||||||||||
Weighted average shares of common stock | 55,155 | 58,240 | 55,005 | 58,923 | |||||||||||
Weighted average Unit Holders(1) | 447 | 688 | 560 | 690 | |||||||||||
Weighted average shares of common stock and Unit Holders(2) | 55,602 | 58,928 | 55,565 | 59,613 | |||||||||||
Earnings (loss) per share: | |||||||||||||||
Basic | $ | (0.12 | ) | $ | (0.22 | ) | $ | (0.59 | ) | $ | (1.28 | ) | |||
Diluted | $ | (0.12 | ) | $ | (0.22 | ) | $ | (0.59 | ) | $ | (1.28 | ) | |||
____________________________________________________________
(1) | The EPS calculation takes into account Unit Holders, which receive non-forfeitable dividends from the date of grant, share equally in the Company’s net income (loss) and convert on a one-for-one basis into common stock. |
(2) | Excludes the effect of restricted stock and RSUs outstanding that were not dilutive as of September 30, 2017. These instruments could potentially impact diluted EPS in future periods, depending on changes in the Company’s stock price and other factors. |
9. | Non-controlling Interests |
Operating Partnership
Non-controlling interests include the aggregate Units Holders’ interest in the Operating Partnership. Net income (loss) attributable to the non-controlling interest is based on the weighted average Unit Holders’ ownership percentage of the Operating Partnership for the respective period. The issuance of additional common stock, Common Units or LTIP Units changes the percentage ownership of both the Unit Holders and the Company. Since a Common Unit or LTIP Unit is generally redeemable for cash or common stock at the option of the Company, it is deemed to be equivalent to common stock. Therefore, such transactions are treated as capital transactions and result in an allocation between stockholders’ equity and non-controlling interests on the accompanying consolidated balance sheets to account for the change in the ownership of the underlying equity in the Operating Partnership. On a quarterly basis, the carrying value of such non-controlling interest is allocated based on the number of Unit Holders in total in proportion to the number of Units Holders plus the number of shares of common stock outstanding. As of September 30, 2017, 425,991 Common Units and LTIP Units were outstanding, representing a 0.8% ownership and non-controlling interest in the Operating Partnership. Net income (loss) attributable to the Operating Partnership non-controlling interest for the three months ended
28
NORTHSTAR REALTY EUROPE CORP. AND SUBSIDIARIES
NOTES TO CONSOLIDATED FINANCIAL STATEMENTS (Continued)
(Unaudited)
September 30, 2017 and 2016 was a net loss of $0.1 million and $0.2 million, respectively. Net income (loss) attributable to the Operating Partnership non-controlling interest for the nine months ended September 30, 2017 and 2016 was a net loss of $0.4 million and $0.9 million, respectively.
Redeemable Non-controlling Interest
In connection with the acquisition of the Trianon Tower in July 2015, the Company sold a 5.5% non-controlling interest in certain subsidiaries that own the Trianon Tower for $1.5 million. In conjunction with the sale, the Company entered into a put option whereby the holder may redeem its interest for cash at the greater of fair market value of such non-controlling interest or €2.1 million beginning in November 2020 through January 2021. The Company recorded the non-controlling interest at its acquisition date fair value as temporary equity due to the redemption option. The carrying amount of redeemable noncontrolling interests is adjusted to its redemption value at the end of each reporting period, but no less than its initial carrying value, with such adjustments recognized in additional paid-in capital.
10. | Risk Management and Derivative Activities |
Derivatives
The Company uses derivative instruments primarily to manage interest rate and currency risk and such derivatives are not considered speculative. These derivative instruments are in the form of interest cap agreements where the primary objective is to minimize interest rate risks associated with investment and financing activities and foreign currency forward agreements where the primary objective is to minimize foreign currency exchange rate risks associated with operating activities. The counterparties of these arrangements are major financial institutions with which the Company may also have other financial relationships. The Company is exposed to credit risk in the event of non-performance by these counterparties and it monitors their financial condition; however, the Company currently does not anticipate that any of the counterparties will fail to meet their obligations.
The following tables present derivative instruments that were not designated as hedges under U.S. GAAP as of September 30, 2017 and December 31, 2016 (dollars in thousands):
Number | Notional Amount | Fair Value Asset (Liability) | Range of Fixed GBP LIBOR / EURIBOR | Range of Maturity | ||||||||||
As of September 30, 2017: | ||||||||||||||
Interest rate caps | 32 | $ | 1,232,671 | $ | 7,747 | (1) | January 2020 - July 2023 | |||||||
Foreign currency forwards, net(2) | 9 | 79,232 | (5,240 | ) | N/A | November 2017 - November 2018 | ||||||||
Total | 41 | $ | 1,311,903 | $ | 2,507 | |||||||||
As of December 31, 2016: | ||||||||||||||
Interest rate caps | 32 | $ | 1,107,400 | $ | 8,659 | (1) | January 2020 - July 2023 | |||||||
Foreign currency forwards(2) | 20 | 72,806 | 5,070 | N/A | February 2017 - November 2017 | |||||||||
Total | 52 | $ | 1,180,206 | $ | 13,729 | |||||||||
_____________________________
(1) Includes a range of interest rate caps of 0.5% for EURIBOR and 2.0% for GBP LIBOR.
(2) Includes Euro and U.K. Pounds Sterling currency forwards.
The following table presents the fair value of derivative instruments, as well as their classification on the consolidated balance sheets, as of September 30, 2017 and December 31, 2016 (dollars in thousands):
Balance Sheet | September 30, 2017 | December 31, 2016 | |||||||
Location | |||||||||
Interest rate caps | Derivative assets | $ | 7,747 | $ | 8,659 | ||||
Foreign currency forwards | Derivative assets | $ | 307 | $ | 5,070 | ||||
Foreign currency forwards | Derivative liabilities | $ | 5,547 | $ | — | ||||
29
NORTHSTAR REALTY EUROPE CORP. AND SUBSIDIARIES
NOTES TO CONSOLIDATED FINANCIAL STATEMENTS (Continued)
(Unaudited)
The following table presents the effect of derivative instruments in the consolidated statements of operations for the three and nine months ended September 30, 2017 and 2016 (dollars in thousands):
Three Months Ended September 30, | Nine Months Ended September 30, | ||||||||||||||||
2017 | 2016 | 2017 | 2016 | ||||||||||||||
Amount of gain (loss) recognized in earnings: | Statements of operations location: | ||||||||||||||||
Adjustment to fair value of interest rate caps | Unrealized gain (loss) on derivatives and other(1) | $ | (1,235 | ) | $ | (4,309 | ) | $ | (1,949 | ) | $ | (18,483 | ) | ||||
Adjustment to fair value of foreign currency forwards | Unrealized gain (loss) on derivatives and other (1) | (2,737 | ) | (581 | ) | (10,309 | ) | (374 | ) | ||||||||
Net cash receipt (payment) on derivatives | Realized gain (loss) on sales and other | 232 | 100 | 1,688 | (1,095 | ) | |||||||||||
_____________________________
(1) Excludes the unrealized gain (loss) relating to foreign currency remeasurement adjustments.
The Company’s counterparties held no cash margin as collateral against the Company’s derivative contracts as of September 30, 2017 and December 31, 2016. The Company had no derivative financial instruments that were designated as hedges in qualifying hedging relationships as of September 30, 2017 and December 31, 2016.
11. | Fair Value |
Fair Value Measurement
The fair value of financial instruments is categorized based on the priority of the inputs to the valuation technique and categorized into a three-level fair value hierarchy. The fair value hierarchy gives the highest priority to quoted prices in active markets for identical assets or liabilities (Level 1) and the lowest priority to unobservable inputs (Level 3). If the inputs used to measure the financial instruments fall within different levels of the hierarchy, the categorization is based on the lowest level input that is significant to the fair value measurement of the instrument.
Financial assets and liabilities are recorded at fair value on the consolidated balance sheets and are categorized based on the inputs to the valuation techniques as follows:
Level 1. | Quoted prices for identical assets or liabilities in an active market. |
Level 2. | Financial assets and liabilities whose values are based on the following: |
(a) | Quoted prices for similar assets or liabilities in active markets. |
(b) | Quoted prices for identical or similar assets or liabilities in non-active markets. |
(c) | Pricing models whose inputs are observable for substantially the full term of the asset or liability. |
(d) | Pricing models whose inputs are derived principally from or corroborated by observable market data for substantially the full term of the asset or liability. |
Level 3. | Prices or valuation techniques based on inputs that are both unobservable and significant to the overall fair value measurement. |
Assets and Liabilities Measured at Fair Value on a Recurring Basis
The following is a description of the valuation techniques used to measure fair value of assets and liabilities accounted for at fair value on a recurring basis and the general classification of these instruments pursuant to the fair value hierarchy.
Derivative Instruments
Derivative instruments consist of interest rate contracts and foreign exchange contracts that are traded over-the-counter, and are valued using a third-party service provider. These quotations are not adjusted and are generally based on valuation models with observable inputs such as contractual cash flow, yield curve, foreign currency rates and credit spreads and as such, are classified as Level 2 of the fair value hierarchy. Derivative instruments are also assessed for credit valuation adjustments due to the risk of non-performance by the Company and derivative counterparties.
30
NORTHSTAR REALTY EUROPE CORP. AND SUBSIDIARIES
NOTES TO CONSOLIDATED FINANCIAL STATEMENTS (Continued)
(Unaudited)
Fair Value of Financial Instruments
In addition to the above disclosures regarding financial assets or liabilities which are recorded at fair value, U.S. GAAP requires disclosure of fair value about all financial instruments. The following disclosure of estimated fair value of financial instruments was determined by the Company using available market information and appropriate valuation methodologies. Considerable judgment is necessary to interpret market data and develop estimated fair value. Accordingly, the estimates presented herein are not necessarily indicative of the amounts the Company could realize on disposition of the financial instruments. The use of different market assumptions and/or estimation methodologies may have a material effect on estimated fair value.
The following table presents the principal amount, carrying value and fair value of certain financial assets and liabilities as of September 30, 2017 and December 31, 2016 (dollars in thousands):
September 30, 2017 | December 31, 2016 | ||||||||||||||||||||||
Principal/Notional Amount | Carrying Value | Fair Value | Principal/Notional Amount | Carrying Value | Fair Value | ||||||||||||||||||
Financial assets:(1) | |||||||||||||||||||||||
Derivative assets | $ | 1,236,496 | $ | 8,054 | $ | 8,054 | $ | 1,180,206 | $ | 13,729 | $ | 13,729 | |||||||||||
Preferred equity investment | 35,086 | 35,086 | 35,086 | — | — | — | |||||||||||||||||
Financial liabilities:(1) | |||||||||||||||||||||||
Mortgage and other notes payable, net | $ | 1,286,242 | $ | 1,272,758 | $ | 1,268,464 | $ | 1,162,211 | $ | 1,149,119 | $ | 1,146,134 | |||||||||||
Derivative liabilities | 75,407 | 5,547 | 5,547 | — | — | — | |||||||||||||||||
(1) | The fair value of other financial instruments not included in this table is estimated to approximate their carrying value. |
Disclosure about fair value of financial instruments is based on pertinent information available to management as of the reporting date. Although management is not aware of any factors that would significantly affect fair value, such amounts have not been comprehensively revalued for purposes of these consolidated financial statements since that date and current estimates of fair value may differ significantly from the amounts presented herein.
Mortgage and Other Notes Payable
For mortgage and other notes payable, the Company primarily uses rates currently available with similar terms and remaining maturities to estimate fair value. These measurements are determined using rates as of the end of the reporting period or market credit spreads over the rate payable on fixed rate of like maturities. These fair value measurements are based on observable inputs, and as such, are classified as Level 2 of the fair value hierarchy.
Preferred Equity Investments
For preferred equity investments, fair value was computed by comparing the current yield to the estimated yield for newly originated loans with similar credit risk or the market yield at which a third party might expect to purchase such investment. Fair value was determined assuming fully-extended maturities regardless of structural or economic tests required to achieve such extended maturities. These fair value measurements are generally based on unobservable inputs and, as such, are classified as Level 3 of the fair value hierarchy.
12. | Commitments and Contingencies |
The Company is involved in various litigation matters arising in the ordinary course of its business. Although the Company is unable to predict with certainty the eventual outcome of any litigation, in the opinion of management, the current legal proceedings are not expected to have a material adverse effect on the Company’s financial position or results of operations.
The Company engages third-party service providers for its portfolio who are remunerated based on either a fixed fee or a percentage of rental income. The contract terms vary by party and are subject to termination options. These costs are recorded in properties - operating expense and other expenses in the consolidated statements of operations.
As part of the terms of agreements relating to certain assets the Company disposed, as is customary for such transactions in Europe, the Company agreed to provide certain warranties to the buyer.
Risk Management
Concentrations of credit risk arise when a number of tenants related to the Company’s investments are engaged in similar business activities or located in the same geographic region to be similarly affected by changes in economic conditions. The Company
31
NORTHSTAR REALTY EUROPE CORP. AND SUBSIDIARIES
NOTES TO CONSOLIDATED FINANCIAL STATEMENTS (Continued)
(Unaudited)
monitors its portfolios to identify potential concentrations of credit risks. For the three and nine months ended September 30, 2017, one tenant, DekaBank Deutsche Girozentrale, accounted for more than 10% of the Company’s total revenue. This tenant has 6.7 years remaining on its lease. Otherwise, the Company has no other tenant that generates 10% or more of its total revenue. Additionally, for the three and nine months ended September 30, 2017, Germany, France, the United Kingdom and the Netherlands each accounted for more than 10% of the Company’s total revenue. The Company believes the remainder of its portfolio is well diversified and does not contain any unusual concentrations of credit risks.
13. | Segment Reporting |
The Company currently conducts its business through the following three segments, based on how management reviews and manages its business:
• | Real Estate Equity- Focused on European prime office properties located in key cities within Germany, the United Kingdom and France. |
• | Preferred Equity - Represents the Company’s preferred equity investment secured by interest in an European prime office property. |
• | Corporate - The corporate segment includes corporate level interest expense, management fee and general and administrative expenses. |
32
NORTHSTAR REALTY EUROPE CORP. AND SUBSIDIARIES
NOTES TO CONSOLIDATED FINANCIAL STATEMENTS (Continued)
(Unaudited)
The following tables present segment reporting for the three and nine months ended September 30, 2017 and 2016 (dollars in thousands):
Three Months Ended September 30, 2017 | |||||||||||||||
Statement of Operations: | Real Estate Equity | Preferred Equity | Corporate | Total | |||||||||||
Rental income | $ | 27,747 | $ | — | $ | — | $ | 27,747 | |||||||
Escalation income | 5,641 | — | — | 5,641 | |||||||||||
Interest income | — | 704 | — | 704 | |||||||||||
Interest expense(1) | 6,325 | — | 211 | 6,536 | |||||||||||
Management fee, related party | — | — | 3,585 | 3,585 | |||||||||||
Transaction costs | — | — | 332 | 332 | |||||||||||
Depreciation and amortization | 14,396 | — | — | 14,396 | |||||||||||
Other, net | 8,802 | (2) | — | 6,895 | (3) | 15,697 | |||||||||
Income (loss) before income tax benefit (expense) | 3,865 | 704 | (11,023 | ) | (6,454 | ) | |||||||||
Income tax benefit (expense) | (352 | ) | — | — | (352 | ) | |||||||||
Net income (loss) | $ | 3,513 | $ | 704 | $ | (11,023 | ) | $ | (6,806 | ) | |||||
___________________________________
(1) | Includes $0.6 million and $0.1 million of amortization of deferred financing costs in the real estate equity and corporate segments, respectively. |
(2) | Primarily relates to properties - operating expenses and unrealized loss on interest rate caps offset by other income. |
(3) | Primarily relates to general and administrative expense and unrealized loss on foreign currency forwards. |
Three Months Ended September 30, 2016 | |||||||||||
Statement of Operations:(1) | Real Estate Equity | Corporate | Total | ||||||||
Rental income | $ | 29,798 | $ | — | $ | 29,798 | |||||
Escalation income | 7,828 | — | 7,828 | ||||||||
Interest expense(2) | 7,132 | 2,169 | 9,301 | ||||||||
Management fee, related party | — | 3,548 | 3,548 | ||||||||
Transaction costs | — | 150 | 150 | ||||||||
Depreciation and amortization | 13,989 | — | 13,989 | ||||||||
Other, net | 12,694 | (3) | 8,059 | (4) | 20,753 | ||||||
Income (loss) before income tax benefit (expense) | 3,820 | (13,935 | ) | (10,115 | ) | ||||||
Income tax benefit (expense) | (2,655 | ) | — | (2,655 | ) | ||||||
Net income (loss) | $ | 1,165 | $ | (13,935 | ) | $ | (12,770 | ) | |||
___________________________________
(1) | The Company did not have a preferred equity segment for the three months ended September 30, 2016. |
(2) | Includes $0.9 million of amortization of deferred financing costs in both the real estate and corporate segments. |
(3) | Primarily relates to properties - operating expense and realized loss on the sale of real estate offset by the realized gain on foreign currency translation and other. |
(4) | Primarily relates to general and administrative expense and unrealized loss on foreign currency forwards. |
33
NORTHSTAR REALTY EUROPE CORP. AND SUBSIDIARIES
NOTES TO CONSOLIDATED FINANCIAL STATEMENTS (Continued)
(Unaudited)
Nine Months Ended September 30, 2017 | |||||||||||||||
Statement of Operations: | Real Estate Equity | Preferred Equity | Corporate | Total | |||||||||||
Rental income | $ | 79,308 | $ | — | $ | — | $ | 79,308 | |||||||
Escalation income | 16,360 | — | — | 16,360 | |||||||||||
Interest income | — | 1,001 | — | 1,001 | |||||||||||
Interest expense(1) | 18,896 | — | 745 | 19,641 | |||||||||||
Management fee, related party | — | — | 10,716 | 10,716 | |||||||||||
Transaction costs | — | 538 | 1,027 | 1,565 | |||||||||||
Depreciation and amortization | 39,479 | — | — | 39,479 | |||||||||||
Other, net | 23,575 | (2) | (6 | ) | 34,253 | (3) | 57,822 | ||||||||
Income (loss) before income tax benefit (expense) | 13,718 | 469 | (46,741 | ) | (32,554 | ) | |||||||||
Income tax benefit (expense) | (316 | ) | — | — | (316 | ) | |||||||||
Net income (loss) | $ | 13,402 | $ | 469 | $ | (46,741 | ) | $ | (32,870 | ) | |||||
___________________________________
(1) | Includes $2.0 million and $0.3 million of amortization of deferred financing costs in the real estate equity and corporate segments, respectively. |
(2) | Primarily relates to properties - operating expense and unrealized loss on interest rate caps offset by the realized gain on the sale of real estate and other income. |
(3) | Primarily relates to general and administrative expense, compensation expense and unrealized loss on foreign currency forwards. |
Nine Months Ended September 30, 2016 | |||||||||||
Statement of Operations:(1) | Real Estate Equity | Corporate | Total | ||||||||
Rental income | $ | 98,622 | $ | — | $ | 98,622 | |||||
Escalation income | 19,825 | — | 19,825 | ||||||||
Interest expense(2) | 24,249 | 9,235 | 33,484 | ||||||||
Management fee, related party | — | 10,548 | 10,548 | ||||||||
Transaction costs | — | 2,633 | 2,633 | ||||||||
Depreciation and amortization | 51,264 | — | 51,264 | ||||||||
Other, net | 70,646 | (3) | 23,758 | (4) | 94,404 | ||||||
Income (loss) before income tax benefit (expense) | (27,712 | ) | (46,174 | ) | (73,886 | ) | |||||
Income tax benefit (expense) | (2,515 | ) | — | (2,515 | ) | ||||||
Net income (loss) | $ | (30,227 | ) | $ | (46,174 | ) | $ | (76,401 | ) | ||
___________________________________
(1) | The Company did not have a preferred equity segment for the nine months ended September 30, 2016. |
(2) | Includes $2.6 million and $2.9 million of amortization of deferred financing costs in the real estate equity and corporate segment, respectively. |
(3) | Primarily relates to properties - operating expense, unrealized loss on derivatives and impairment loss of $27.5 million offset by the realized gain on the sale of real estate and other income. |
(4) | Primarily relates to general and administrative expense, compensation expense, realized loss related to the write-off of the deferred financing costs associated with the repurchase of the Senior Notes and includes an allocation of general and administrative expenses from the Manager of $0.1 million. |
The following table presents total assets by segment as of September 30, 2017 and December 31, 2016 (dollars in thousands):
Total Assets | Real Estate Equity | Preferred Equity | Corporate | Total | |||||||||||
September 30, 2017 | $ | 1,949,289 | $ | 36,385 | (1) | $ | 3,559 | $ | 1,989,233 | ||||||
December 31, 2016 | $ | 1,835,531 | $ | — | $ | 9,861 | $ | 1,845,392 | |||||||
___________________________________
(1) | Represents the preferred equity investment and accrued interest income. |
34
NORTHSTAR REALTY EUROPE CORP. AND SUBSIDIARIES
NOTES TO CONSOLIDATED FINANCIAL STATEMENTS (Continued)
(Unaudited)
Geography
The following table presents geographic information about the Company's total rental and escalation income (in thousands):
Three Months Ended September 30, | Nine Months Ended September 30, | ||||||||||||||
2017 | 2016(1) | 2017 | 2016(1) | ||||||||||||
Germany | $ | 13,878 | $ | 15,716 | $ | 39,612 | $ | 44,968 | |||||||
United Kingdom | 10,663 | 10,365 | 28,152 | 30,349 | |||||||||||
France | 5,837 | 5,685 | 16,632 | 16,554 | |||||||||||
Netherlands | 2,774 | 3,576 | 10,023 | 13,359 | |||||||||||
Other | 236 | 2,284 | 1,249 | 13,217 | |||||||||||
Total | $ | 33,388 | $ | 37,626 | $ | 95,668 | $ | 118,447 | |||||||
___________________________________
(1) | Amount represented for the three and nine months ended September 30, 2016 are translated using the average exchange rate for the three and nine months ended September 30, 2017, respectively. |
14. | Subsequent Events |
Dividends
On November 6, 2017, the Company declared a dividend of $0.15 per share of common stock. The common stock dividend is expected be paid on November 24, 2017 to stockholders of record as of the close of business on November 20, 2017.
Amended and Restated Management Agreement
On November 9, 2017, the Company entered into an Amended and Restated Management Agreement with CNI NRE Advisors, LLC, a Delaware limited liability company (unless the context requires otherwise, together with its affiliates, the “Asset Manager”), an affiliate of Colony NorthStar, effective as of January 1, 2018.
Under the Amended and Restated Management Agreement, the Asset Manager is generally responsible to manage the Company’s day to day operations, subject to the supervision and management of the Board. The Asset Manager is required to provide the Company with a management team and other appropriate employees and resources necessary to manage the Company.
Term; Renewals
The Amended and Restated Management Agreement provides for an initial term (beginning January 1, 2018) of five years (the “Initial Term”), with subsequent automatic renewals for additional three-year terms, unless either party provides notice to the other party of its intention to decline to renew the agreement at least six months prior to the expiration of the then-current term.
During the Initial Term, the Company can only terminate the Amended and Restated Management Agreement for certain specified events (as described in the Amended and Restated Management Agreement) which include: (i) certain acts of fraud, misappropriation, embezzlement, uncured gross negligence or uncured bad faith breaches of the Amended and Restated Management Agreement, in each case, by the Asset Manager which result in a material adverse effect on the Company, (ii) commencement of bankruptcy or insolvency proceedings relating to the Asset Manager that are not dismissed within 60 days, (iii) dissolution of Asset Manager, (iv) a final determination by a court or the Internal Revenue Service that a provision of the Amended and Restated Agreement caused or will cause the Company to fail to qualify as a REIT and Asset Manager refuses to amend the Amended and Restated Agreement within 60 days to amend the agreement in a manner that would allow the Company to qualify as a REIT. As used in this paragraph, “Asset Manager” refers to CNI NRE Advisors, LLC.
If the Company elects not to renew the Amended and Restated Management Agreement at the end of a term, it will be obligated to pay the Asset Manager a termination fee (the “Termination Fee”) equal to three times the amount of the base management fees earned by the Asset Manager over the four recent quarters immediately preceding the non-renewal. In addition, if at any time after the Initial Term, the Company undergoes a “change of control” (as defined in the Amended and Restated Management Agreement), the Company may elect to terminate the agreement but upon any such termination it will be obligated to pay the Termination Fee to the Asset Manager.
Assignment
The Amended and Restated Management Agreement provides that in the event of a change of control of the Asset Manager or other event that could be deemed an assignment of the Amended and Restated Management Agreement, the Company will consider
35
NORTHSTAR REALTY EUROPE CORP. AND SUBSIDIARIES
NOTES TO CONSOLIDATED FINANCIAL STATEMENTS (Continued)
(Unaudited)
such assignment in good faith and not unreasonably withhold, condition or delay the Company’s consent. The Amended and Restated Management Agreement further provides that the Company anticipates consent would be granted for an assignment or deemed assignment to a party with expertise in commercial real estate and over $10 billion of assets under management. The Amended and Restated Management Agreement also provides that, notwithstanding anything in the agreement to the contrary, to the maximum extent permitted by applicable law, rules and regulations, in connection with any merger, sale of all or substantially all of the assets, change of control, reorganization, consolidation or any similar transaction by the Company or the Asset Manager, directly or indirectly, the surviving entity will succeed to the terms of the Amended and Restated Management Agreement.
Base Management Fee
Pursuant to the Amended and Restated Management Agreement, beginning January 1, 2018, the Company is obligated to pay the Asset Manager a base management fee per annum equal to:
• | 1.50% of the Company’s EPRA NAV (as defined in the Amended and Restated Management Agreement) for EPRA NAV amounts up to and including $2.0 billion; plus |
• | 1.25% of the Company’s EPRA NAV on any EPRA NAV amount exceeding $2.0 billion. |
The base management fee is payable, quarterly in arrears, in cash.
Incentive Fee
In addition to the base management fees, the Company is obligated to pay the Asset Manager an incentive fee, if any (the “Incentive Fee”), with respect to each measurement period equal to twenty percent (20%) of: (i) the excess of (a) the Company’s Total Stockholder Return (as defined in the Amended and Restated Management Agreement, which includes stock price appreciation and dividends received and is subject to a high watermark price established when a prior incentive fee is realized) for the relevant measurement period above (b) a 10% cumulative annual hurdle rate, multiplied by (ii) the Company’s Weighted Average Shares (as defined in the Amended and Restated Management Agreement) during the measurement period. The first measurement period for the incentive fee will begin January 1, 2018 and end on December 31 of the applicable calendar year and subsequent measurement periods will begin on January 1 of the subsequent calendar year. Subject to the conditions set forth in Section 4(d) of the Amended and Restated Management Agreement for common stock payments, the Company may elect to pay the Incentive Fee, if any, in cash or in shares of restricted common stock or shares of unrestricted common stock repurchased by the Company in the open market or a combination thereof. Any shares of common stock delivered by the Company will be subject to lock-up restrictions that will be released in equal 1/3 increments on each anniversary of the end of the measurement period with respect to which such incentive fee was earned. In calculating the value of the shares of the Company’s common stock paid in satisfaction of the Incentive Fee obligation, the shares of restricted common stock will be valued at the higher of: (i) the volume weighted average trading price per share for the ten consecutive trading days (as defined in the Amended and Restated Management Agreement) ending on the trading day prior to the date the payment is due and (ii) the Company’s EPRA NAV per share, based on the Company’s most recently published EPRA NAV and the Weighted Average Shares as of the end of the period with respect to which such EPRA NAV was published.
Costs and Expenses
The Company is responsible to pay (or reimburse the Asset Manager) for all of the Company’s direct, out of pocket costs and expenses of the Company as a stand alone company incurred by or on behalf of the Company and its subsidiaries, all of which must be reasonable, customary and documented. Internalized Service Costs (as defined below) are not intended to be covered costs and expense under this provision and are subject to the limits described in the next paragraph.
In addition to the expenses described in the prior paragraph, for each calendar quarter, beginning with the first quarter of 2018, the Company is obligated to reimburse the Asset Manager for (i) all direct, reasonable, customary and documented costs and expenses incurred by the Asset Manager for salaries, wages, bonuses, payroll taxes and employee benefits for personnel employed by the Asset Manager: (a) who solely provide services to the Company which prior to January 1, 2018 were provided by unaffiliated third parties, including accounting and treasury services or (b) who were hired by the Asset Manager after January 1, 2018 but who solely provide services to the Company in respect of one of the categories of services previously internalized pursuant to clause (a) and who were not hired in connection with any event which otherwise resulted in an increase to the Company’s net asset value (such costs and expenses set forth in clauses (i) and (ii), the “Internalized Service Costs”), plus (ii) 20% of the amount calculated under clause (i) to cover reasonable overhead charges with respect to such personnel, provided that the Company shall not be obligated to reimburse the Asset Manager for such costs and expenses to the extent they exceed the following quarterly limits:
36
NORTHSTAR REALTY EUROPE CORP. AND SUBSIDIARIES
NOTES TO CONSOLIDATED FINANCIAL STATEMENTS (Continued)
(Unaudited)
• | 0.0375% of the Company’s aggregate gross asset value as of the end of the prior calendar quarter (excluding cash and cash equivalents and certain other exclusions) as calculated for purposes of determining EPRA NAV (“GAV”), for GAV amounts to and including $2.5 billion, plus |
• | 0.0313% of GAV amounts between $2.5 billion and $5.0 billion, plus |
• | 0.025% of GAV amounts exceeding $5.0 billion. |
If the Asset Manager’s actual Internalized Service Costs during any quarter exceed the quarterly limit described in the preceding paragraph (the cumulative excess amounts, if any, in respect of each quarter during a calendar year, the (“Quarterly Cap Excess Amount”), the Company is obligated to reimburse the Asset Manager on an annual basis for an amount equal to the lesser of (i) the Quarterly Cap Excess Amount and (ii) the sum of the amounts, if any, determined for each quarter within such calendar year by which Internalized Services Costs in respect of such quarter were less than the quarterly limits described in the prior paragraph.
Equity Based Compensation
In addition, the Company expects to make annual equity compensation grants to management of the Company and other employees of the Asset Manager, provided that the aggregate annual grant amount, type and other terms of such equity compensation must by approved the Company’s Compensation Committee. The Asset Manager will have discretion in allocating the aggregate grant among the Company’s management and other employees of the Asset Manager.
Under the Amended and Restated Management Agreement, beginning with the Company’s 2018 annual stockholders’ meeting, the Asset Manager will have the right to nominate one director (who is expected to be one of the Company’s current directors employed by the Asset Manager) to the Company’s board of directors.
Transaction Expenses
The Company agreed to pay for up to $2.5 million of fees and expenses payable by the Asset Manager to its external financial advisors in connection with the negotiation and execution of the Amended and Restated Management Agreement.
Colony NorthStar Ownership Waiver and Voting Agreement
In connection with the entry into the Amended and Restated Management Agreement, the Company provided Colony NorthStar with an ownership waiver under the Company’s Articles of Amendment and Restatement, allowing Colony NorthStar to purchase up to 45% of the Company’s stock. The waiver provides that if the Amended and Restated Management Agreement is terminated, Colony NorthStar may not purchase any shares of the Company’s common stock to the extent Colony NorthStar owns (or would own as a result of such purchase) more than 9.8% of the Company’s capital stock. In connection with the waiver, Colony NorthStar also agreed that for all matters submitted to a vote of the Company’s stockholders, to the extent Colony NorthStar owns more than 25% of the Company’s common stock (such shares owned by Colony NorthStar in excess of the 25% threshold, the “Excess Shares”), it will vote the Excess Shares in the same proportion that the remaining shares of the Company not owned by Colony NorthStar or its affiliates are voted. If the Amended and Restated Management Agreement is terminated, then beginning on the third anniversary of such termination, the threshold described in the prior sentence will be reduced from 25% to 9.8%.
37
Item 2. Management’s Discussion and Analysis of Financial Condition and Results of Operations
The following discussion should be read in conjunction with our unaudited consolidated financial statements and notes thereto included in Item 1. “Financial Statements” of this report. References to “NorthStar Europe,” “we,” “us” or “our” refer to NorthStar Realty Europe Corp. and its subsidiaries unless the context specifically requires otherwise. References to “our Manager” refer to NorthStar Asset Management Group Inc., or NSAM, for the period prior to the Mergers (refer below) and Colony NorthStar, Inc., for the period subsequent to the Mergers. As part of the Mergers, NSAM changed its name to Colony NorthStar, Inc.
Introduction
NorthStar Realty Europe Corp., a publicly-traded REIT, (NYSE: NRE), is a European focused commercial real estate company with predominantly prime office properties in key cities within Germany, the United Kingdom and France, or the Core Portfolio. Our objective is to provide our stockholders with stable and recurring cash flow supplemented by capital growth over time.
We are externally managed and advised by an affiliate of our Manager. Substantially all of our assets are directly or indirectly are held by, and we conduct our operations, directly or indirectly, through NorthStar Realty Europe Limited Partnership, a Delaware limited partnership and our operating partnership, or our Operating Partnership. We have elected to be taxed, and will continue to conduct our operations so as to continue to qualify, as a REIT for U.S. federal income tax purposes.
Significant Developments
Mergers Agreement among NSAM, NorthStar Realty and Colony Capital, Inc.
On January 10, 2017, our external manager, NSAM completed a tri-party merger with NorthStar Realty Finance Corp., or NorthStar Realty, and Colony Capital, Inc., or Colony, pursuant to which the companies combined in an all-stock merger of equals transaction to create a diversified real estate and investment management company. Under the terms of the merger agreement, NSAM, Colony and NorthStar Realty, through a series of transactions, merged with and into NSAM, which was renamed Colony NorthStar. Colony NorthStar is a leading global equity REIT with an embedded investment management platform.
Investments
In May 2017, we partnered with a leading property developer in China to acquire 20 Gresham Street, a Class A office building in London, United Kingdom with 22,557 square meters, 100% occupancy and a 6.8 year weighted average lease term to expiry. We invested approximately $35 million (£26 million) of preferred equity with a base yield of 8% plus equity participation rights.
Sales
During the three months ended September 30, 2017 we sold two properties, exiting Spain and further reducing our presence in the Netherlands.
Amended and Restated Management Agreement
On November 9, 2017, we entered into an amended and restated management agreement, or the Amended and Restated Management Agreement with an affiliate of our Manager, effective as of January 1, 2018. Refer to Note 14 “Subsequent Events” in our accompanying consolidated financial statements included in Part I Item 1. “Financial Statements” for a description of the terms of the Amended and Restated Management Agreement.
Summary of Business
Our primary business line is investing in European real estate. We are predominantly focused on the Core Portfolio.
38
Our Investments
Our portfolio as of September 30, 2017 includes the following (dollars in millions):
Investment Type | Primary Location(s) | Property Type | Cost(1) | Count | Ownership Interest | ||||||||
Real estate equity | |||||||||||||
U.K. Complex | United Kingdom | Multi-tenant office | $ | 77 | 1 | (4) | 93% | ||||||
SEB Portfolio | Germany, United Kingdom, France | Multi-tenant office | 1,016 | 7 | 95% | (2) | |||||||
Trias Portfolio(3) | Germany, United Kingdom, France | Office/Hotel/Industrial/Retail | 360 | 15 | 95% | (2) | |||||||
Trianon Tower | Germany | Multi-tenant office | 690 | 3 | 95% | (2) | |||||||
Total real estate equity | 2,143 | 26 | |||||||||||
Preferred Equity | |||||||||||||
Preferred equity investment | 35 | 1 | |||||||||||
Total preferred equity | 35 | 1 | |||||||||||
Total investments | $ | 2,178 | 27 | ||||||||||
__________________
(1) | Amount includes transaction costs incurred, deferred financing costs and other assets assumed and is translated using exchange rates as of September 30, 2017. |
(2) | We are entitled to 100% of the economic benefits and incur 100% of the economic losses in accordance with the applicable governing documents. |
(3) | Trias Portfolio represents the IVG Portfolio, Internos Portfolio and Deka Portfolio. Such three portfolios were not under common control or management at the time of acquisition. |
(4) | Includes one asset held for sale. |
Real Estate Equity
Overview
Our real estate equity investment strategy is focused on European prime office properties located in key cities within Germany, the United Kingdom and France.
Our Portfolio
The following presents a summary of our portfolio as of September 30, 2017:
Portfolio by Geographic Location | ||||
September 30, 2017(4) | December 31, 2016(4) | |||
Total portfolio, at cost(1) | $2.1 billion | 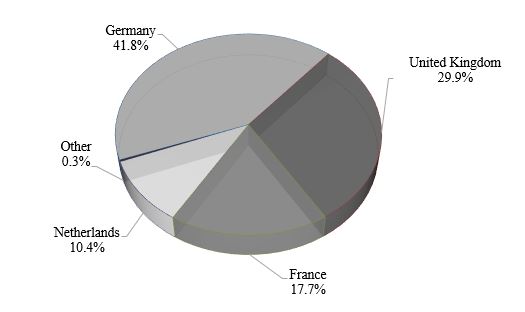 | 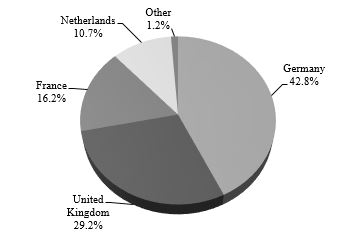 | |
Number of properties | 26 | |||
Number of countries | 5 | |||
Total square meters(2) | 343,960 | |||
Weighted average occupancy | 86% | |||
Weighted average lease term | 6.4 years | |||
In-place rental income:(3) | ||||
Core Portfolio | 86% | |||
Other markets | 14% | |||
___________________________________
(1) | Amount includes transaction costs incurred, deferred financing costs and other assets assumed and is translated using exchange rates as of September 30, 2017. |
(2) | Based on contractual rentable area, located in many key European markets, including Frankfurt, Hamburg, Berlin, London and Paris. |
(3) | In-place rental income represents gross rent adjusted for vacancies based on the rent roll as of September 30, 2017 and is translated using exchange rates as of September 30, 2017. |
(4) | Other represents assets in Portugal as of September 30, 2017 and Spain, Portugal and Italy as of December 31, 2016. |
39
The following table presents significant tenants in our portfolio, based on in-place rental income as of September 30, 2017:
Significant tenants: | Asset (Location) | Industry | Square Meters(1) | Percentage of In-Place Rental Income | Weighted Average Lease Term (in years) | |||||
DekaBank Deutsche Girozentrale | Trianon (Frankfurt, Germany) | Finance | 36,524 | 19% | 6.7 | |||||
BNP PARIBAS RE | Mac Donald (Paris, France) | Finance | 15,406 | 9% | 2.3 | |||||
Deutsche Bundesbank | Trianon (Frankfurt, Germany) | Finance | 15,304 | 5% | 9.2 | |||||
Deloitte Holding B.V. | Maastoren (Rotterdam, Netherlands) | Legal, Tax & Management Consultancy | 23,547 | 5% | 9.6 | |||||
BNP PARIBAS SA | Berges de Seine (Paris, France) | Finance | 11,235 | 5% | 3.6 | |||||
Cushman & Wakefield LLP | Portman Square (London, UK) | Legal, Tax & Management Consultancy | 5,150 | 5% | 7.5 | |||||
Morgan Lewis & Bockius LLP | Condor House (London, UK) | Legal, Tax & Management Consultancy | 4,848 | 4% | 8.0 | |||||
Invesco UK Limited | Portman Square (London, UK) | Finance | 3,126 | 4% | 9.9 | |||||
PAREXEL International GmbH | Parexel (Berlin, Germany) | Legal, Tax & Management Consultancy | 18,254 | 3% | 16.7 | |||||
Moelis & Co UK LLP | Condor House (London, UK) | Other | 3,366 | 3% | 7.5 | |||||
136,760 | 61% | 7.2 | ||||||||
__________________
(1) | Based on contractual rentable area. |
The following table presents NOI, square meters and weighted average lease term concentration by country for our portfolio as of September 30, 2017:
Country | Number of Properties | Percentage of NOI | Square Meters(1) | Weighted Average Lease Term (in years) | ||||||
Germany | 11 | 42 | % | 153,463 | 7.2 | |||||
United Kingdom | 5 | 28 | % | 46,520 | 7.1 | |||||
France | 4 | 18 | % | 32,075 | 3.5 | |||||
Other(2) | 6 | 12 | % | 111,902 | 6.2 | |||||
Total | 26 | 100 | % | 343,960 | 6.4 | |||||
__________________
(1) | Based on contractual rentable area. |
(2) | Includes assets in Portugal, Netherlands and assets outside our Core Portfolio in Germany, the United Kingdom and France. |
Preferred Equity
In May 2017, we partnered with a leading property developer in China to acquire a Class A office building in London, United Kingdom with 22,557 square meters, 100% occupancy and a 6.8 year weighted average lease term to expiry. We invested approximately $35.1 million (£26 million) of preferred equity with a base yield of 8% plus equity participation rights.
Sources of Operating Revenues and Cash Flows
We primarily generate revenue from rental and other operating income from our properties. Our income is primarily derived through the difference between the revenue and the operating and financing expenses of our investments. We may also continue to acquire investments that generate attractive returns without any leverage.
Profitability and Performance Metrics
We calculate cash available for distribution, or CAD, and net operating income, or NOI, as metrics to evaluate the profitability and performance of our business (refer to “Non-GAAP Financial Measures” for a description of these metrics).
Outlook and Recent Trends
The European economy posted another solid quarter of economic growth. During the third quarter of 2017, Gross Domestic Product in the European Union, or EU, grew by 2.5% year on year reflecting the strongest annual growth since 2011. Unemployment in the EU continued to fall, reaching 7.5% in September 2017 (down from 8.4% a year earlier), the lowest level recorded since November 2008. The U.K. economy began to slow in 2017, posting 0.4% growth during the third quarter (or 1.5% year-on-year), as elevated levels of inflation due to a weaker U.K. Pound Sterling eroded real incomes and hampered consumer demand, while general uncertainty associated with Brexit weighed on business sentiment and investment. On November 2, 2017 the Bank of
40
England, or BOE, raised the U.K. base interest rate from 0.25% to 0.5%, the first interest rate rise in a decade, in an effort to contain inflation which was 3% in the year to September (in excess of the BOE’s stated target of 2.0%). The BOE signaled that any further increases would likely be at a gradual pace and limited in number. The BOE’s cautious tone is reflective of the outlook for the U.K. economy which remains uncertain and likely to be highly dependent on the duration and perceived outcome of ongoing Brexit negotiations.
The Eurozone economy remains buoyant achieving 2.5% year on year GDP growth in the third quarter. In October 2017, the International Monetary Fund, or IMF, upgraded its 2017 GDP forecast for the Euro Area up to 1.9% reflecting an acceleration in exports and continued strength in consumer demand. Unemployment fell to 8.9%, its lowest level since January 2009. This stronger than anticipated economic recovery resulted in the European Central Bank, or ECB, signaling its intention to begin reducing the level of economic stimulus it provides. On October 26, 2017, the ECB announced its decision to maintain interest rates at zero percent and signaled its intention to halve its bond purchase program from €60 billion to €30 billion per month from January 2018 through September 2018, while signaling its commitment to further extend the program, increase its size, or both, should the outlook for inflation in the Eurozone deteriorate. Inflation stood at 1.4% in the year to October, below the ECB’s target of just under 2%. We continue to believe that any unwinding of stimulus is likely to be gradual and subject to ongoing review based on the future economic performance and inflation outlook of the region, which is consistent with the ECB’s recent commentary.
European commercial real estate investment volume totaled €66 billion in the third quarter of 2017, and €197 billion in the first nine months of 2017, 16% above the same period in 2016. The office sector represented approximately 49% of total third quarter investment volume. Prime property yields in most asset classes and markets were stable during the third quarter and continue to remain at a significant premium to sovereign yields.
Driven by strong demand for office and industrial properties including a number of large transactions in these sectors, German transaction volume reached €39.1 billion during the first nine months of 2017 (20% above the same period last year), the highest level in the first nine months since 2007.
Total U.K. investment volume reached £17.1 billion in the third quarter, more than double the volume during the same period last year. London office investment transactions totaled £4.8 billion in the third quarter 2017, representing a quarterly increase of 51% and a significant increase on the same period last year when investment volume stood at £3.2 billion and £1.7 billion, respectively. For the first nine months of 2017, London investment volume reached £13 billion, equaling the investment volume for the full year 2016.
Total French investment volume was €15.1 billion in the first nine months of 2017 (13% below the same period in 2016), driven by weaker appetite in the run up to the recent general election and a shortage of larger transactions.
The new supply pipeline remains subdued across all major European office markets. Improving occupier demand coupled with low supply continues to place downward pressure on vacancy rates and gradual upward pressure on rents across major European office markets, which may be further exacerbated by rising inflation levels as many leases across Europe are structured with inflation linked uplifts.
Investing Strategy
We seek to provide our stockholders with a stable and recurring cash flow for distribution supplemented by capital growth over time. Our business is predominantly focused on our Core Portfolio. Our Core Portfolio is not only the largest economies in Europe, but are the most established, liquid and among the most stable office markets in Europe. We seek to utilize our established local networks to source suitable investment opportunities. We have a long term investment approach and expect to make equity investments, directly or indirectly through joint ventures.
Financing Strategy
We pursue a variety of financing arrangements such as mortgage notes and bank loans available from the commercial mortgage-backed securities market, finance companies and banks. In addition, we may use corporate-level financing such as credit facilities and other term borrowings. We generally seek to limit our reliance on recourse borrowings. Borrowing levels for our investments may be dependent upon the nature of the investments and the related financing that is available.
Attractive long-term, non-recourse, non-mark-to-market, financing continues to be available in the European markets. We predominately use floating rate financing and we seek to mitigate the risk of interest rates rising through hedging arrangements including interest rate caps.
In April 2017, we amended and restated our revolving credit facility, or Credit Facility, with a commitment of $35 million and with an initial two year term. The Credit Facility no longer contains a limitation on availability based on a borrowing base and the interest rate remains the same.
41
In June 2017, we amended and restated the Trias mortgage note agreement to increase the loan amount by $6 million and reduce future minimum capital expenditure spending requirements. In September 2017, we amended and restated the financing terms for $562 million of the SEB mortgage note agreement to reduce the margin from 1.80% to 1.55% and extended the maturity date from April 1, 2022 to July 20, 2024.
Refer to Item 2, “Management’s Discussion and Analysis of Financial Condition and Results of Operations - Liquidity and Capital Resources” for discussion of liquidity requirements and sources of capital resources.
Risk Management
Risk management is a significant component of our strategy to deliver consistent risk-adjusted returns to our stockholders. Given our need to maintain our qualification as a REIT for U.S. federal income tax purposes, we closely monitor our portfolio and actively seek to manage risks associated with, among other things, our assets, interest rates and foreign exchange rates. In addition, the audit committee of our board of directors, or the Board, in consultation with management, will periodically review our policies with respect to risk assessment and risk management, including key risks to which we are subject, such as credit risk, liquidity risk, financing risk, foreign currency risk and market risk, and the steps that management has taken to monitor and control such risks. The audit committee of the Board maintains oversight of financial reporting risk matters.
Underwriting
Prior to making any equity investments, our underwriting team, in conjunction with third-party providers, undertakes a rigorous asset-level due diligence process, involving intensive data collection and analysis, to seek to ensure that we understand fully the state of the market and the risk-reward profile of the asset. In addition, we evaluate material accounting, legal, financial and business matters in connection with such investment. These issues and risks are built into the valuation of an asset and ultimate pricing of an investment.
During the underwriting process, we review the following data, including, but not limited to: property financial data including historic and budgeted financial statements, liquidity and capital expenditure plans, property operating metrics (including occupancy, leasing activity, lease expirations, sales information, tenant credit review, tenant delinquency reports, operating expense efficiency and property management efficiency) and local real estate market conditions including vacancy rates, absorption, new supply, rent levels and comparable sale transactions, as applicable.
In addition to evaluating the merits of any proposed investment, we evaluate the diversification of our portfolio of assets. Prior to making a final investment decision, we determine whether a target asset will cause our portfolio of assets to be too heavily concentrated with, or cause too much exposure to, any one real estate sector, geographic region, source of cash flow such as tenants or borrowers, or other geopolitical issues. If we determine that a proposed investment presents excessive concentration risk, we may decide not to pursue an otherwise attractive investment.
Portfolio Management
Our Manager performs portfolio management services on our behalf. In addition, we rely on the services of local third-party service providers. The comprehensive portfolio management process includes day-to-day oversight by the portfolio management team, regular management meetings and a quarterly investment review process. These processes are designed to enable management to evaluate and proactively identify investment-specific matters and trends on a portfolio-wide basis. Nevertheless, we cannot be certain that such review will identify all potential issues within our portfolio due to, among other things, adverse economic conditions or events adversely affecting specific investments; therefore, potential future losses may also stem from investments that are not identified during these investment reviews.
Our Manager uses many methods to actively manage our risks to seek to preserve income and capital, which includes our ability to manage our investments and our tenants in a manner that preserves cost and income and minimizes credit losses that could decrease income and portfolio value. Frequent re-underwriting, dialogue with tenants/partners and regular inspections of our properties have proven to be an effective process for identifying issues early. Monitoring tenant creditworthiness is an important component of our portfolio management process, which may include, to the extent available, a review of financial statements and operating statistics, delinquencies, third party ratings and market data. During the quarterly portfolio review, or more frequently if necessary, investments may be put on highly-monitored status and identified for possible asset impairment based upon several factors, including missed or late contractual payments, tenant rating downgrades (where applicable) and other data that may indicate a potential issue in our ability to recover our invested capital from an investment.
We may need to make unplanned capital expenditures in connection with changes in laws and governmental regulations in relation to real estate. Where properties are being repositioned or refurbished, we may also be exposed to unforeseen changes in scope of capital expenditures.
Given our need to maintain our qualification as a REIT for U.S. federal income tax purposes, and in order to maximize returns and manage portfolio risk, we may dispose of an asset earlier than anticipated or hold an asset longer than anticipated if we determine it to be appropriate depending upon prevailing market conditions or factors regarding a particular asset. We can provide
42
no assurances, however, that we will be successful in identifying or managing all of the risks associated with acquiring, holding or disposing of a particular investment or that we will not realize losses on certain dispositions.
Interest Rate and Foreign Currency Hedging
Subject to maintaining our qualification as a REIT for U.S. federal income tax purposes, we may mitigate the risk of interest rate volatility through the use of hedging instruments, such as interest rate swap agreements and interest rate cap agreements. The goal of our interest rate management strategy is to minimize or eliminate the effects of interest rate changes on the value of our assets, to improve risk-adjusted returns and, where possible, to lock in, on a long-term basis, a favorable spread between the yield on our assets and the cost of financing such assets.
In addition, because we are exposed to foreign currency exchange rate fluctuations, we employ foreign currency risk management strategies, including the use of, among others, currency hedges, and matched currency financing.
We can provide no assurances, however, that our efforts to manage interest rate and foreign currency exchange rate volatility will successfully mitigate the risks of such volatility on our portfolio.
Critical Accounting Policies
Our consolidated financial statements are prepared in accordance with accounting principles generally accepted in the United States, or U.S. GAAP, which requires the use of estimates and assumptions that involve the exercise of judgment and that affect the reported amounts of assets and liabilities at the date of the consolidated financial statements and the reported amounts of revenues and expenses during the reporting period. There have been no material changes to our critical accounting policies since the filing of our Annual Report on Form 10-K for the fiscal year ended December 31, 2016.
Recent Accounting Pronouncements
For recent accounting pronouncements, refer to Note 2, “Significant Accounting Policies” in our accompanying consolidated financial statements included in Part I Item 1. “Financial Statements.”
43
Results of Operations
The following presents a summary of our activity for the three and nine months ended September 30, 2017 and 2016:
Comparison of the Three Months Ended September 30, 2017 to September 30, 2016 (dollars in thousands):
Three Months Ended September 30, | Increase (Decrease) | |||||||||||||
2017 | 2016 | Amount | % | |||||||||||
Revenues | ||||||||||||||
Rental income | $ | 27,747 | $ | 29,798 | $ | (2,051 | ) | (7 | )% | |||||
Escalation income | 5,641 | 7,828 | (2,187 | ) | (28 | )% | ||||||||
Interest income | 704 | — | 704 | 100 | % | |||||||||
Other income | 171 | 149 | 22 | 15 | % | |||||||||
Total revenues | 34,263 | 37,775 | (3,512 | ) | (9 | )% | ||||||||
Expenses | ||||||||||||||
Properties - operating expenses | 7,519 | 9,493 | (1,974 | ) | (21 | )% | ||||||||
Interest expense | 6,536 | 9,301 | (2,765 | ) | (30 | )% | ||||||||
Transaction costs | 332 | 150 | 182 | 121 | % | |||||||||
Management fee, related party | 3,585 | 3,548 | 37 | 1 | % | |||||||||
Other expenses | 1,996 | 2,848 | (852 | ) | (30 | )% | ||||||||
General and administrative expenses | 1,723 | 2,199 | (476 | ) | (22 | )% | ||||||||
Compensation expense | 2,839 | 5,194 | (2,355 | ) | (45 | )% | ||||||||
Depreciation and amortization | 14,396 | 13,989 | 407 | 3 | % | |||||||||
Total expenses | 38,926 | 46,722 | (7,796 | ) | (17 | )% | ||||||||
Other income (loss) | ||||||||||||||
Unrealized gain (loss) on derivatives and other | (3,472 | ) | (4,982 | ) | 1,510 | (30 | )% | |||||||
Realized gain (loss) on sales and other | 1,681 | 3,814 | (2,133 | ) | (56 | )% | ||||||||
Income (loss) before income tax benefit (expense) | (6,454 | ) | (10,115 | ) | 3,661 | (36 | )% | |||||||
Income tax benefit (expense) | (352 | ) | (2,655 | ) | 2,303 | (87 | )% | |||||||
Net income (loss) | $ | (6,806 | ) | $ | (12,770 | ) | $ | 5,964 | (47 | )% | ||||
Revenues
Rental Income
Rental income consists of rental revenue in our real estate equity segment. Rental income decreased $2.1 million, primarily due to lease extensions signed at the Maastoren property ($0.7 million down in the third quarter 2017) and a vacancy in the Trianon property, which has now been re-let ($0.7 million per quarter contractual rent) and the disposal of 18 properties during 2016.
Escalation Income
Escalation income consists of tenant recoveries in our real estate equity segment. Escalation income decreased $2.2 million, primarily due to the disposal of 18 properties during 2016 and the timing of certain recoverable expenses offset by an increase in recoverable operating expenses. There is a corresponding decrease in properties - operating expenses and a majority of these costs are recovered from our tenants.
Interest Income
Interest income relates to our preferred equity investment originated in the second quarter 2017 in our preferred equity segment.
Other Income
Other income is principally related to lease surrender premiums, insurance refunds and termination fees in our real estate equity segment. Other income increased for the three months ended September 30, 2017 due to a one-time insurance refund relating to a repair in the third quarter of 2017.
Expenses
Properties - Operating Expenses
Properties - operating expenses decreased $2.0 million due to the disposal of 18 properties during 2016 and the timing of certain recoverable expenses offset by an increase in recoverable repairs and maintenance during 2017 in our real estate equity segment. There is a corresponding decrease in escalation income and a majority of these costs are recovered from our tenants.
44
Interest Expense
Interest expense decreased $2.8 million due to the disposal of 18 properties during 2016, the refinancing of certain mortgage notes and repayments of certain mortgage notes in our real estate equity segment in the third quarter 2017 and the repayment of our senior stock-settlable notes in our corporate segment in 2016.
Transaction Costs
Transaction costs for the three months ended September 30, 2017 primarily relates to costs associated with amending the management agreement in our corporate segment. Transaction costs for the three months ended September 30, 2016 primarily relates to costs associated with exploring potential transactions in our corporate segment.
Management Fee, Related Party
Management fee, related party relates to the management fee incurred to our Manager in our corporate segment (refer to “Related Parties Arrangements” below for more information).
Other Expenses
Other expenses primarily represent third-party service provider fees such as audit and legal fees and other compliance related fees related to portfolio management of our real estate equity segment. The decrease of $0.7 million is due to the disposal of 18 properties during 2016.
General and Administrative Expenses
General and administrative expenses are incurred in our corporate segment. For the three months ended September 30, 2017, our Manager did not allocate any general and administrative expenses to us. For the three months ended September 30, 2016, our Manager allocated $0.1 million.
Compensation Expense
Compensation expense is comprised of time-based and performance equity-based based awards in our corporate segment. The decrease for the three months ended September 30, 2017, is due to the acceleration of a material portion of our equity awards due to the Mergers which occurred in the first quarter of 2017 offset by the issuance of board grants which fully vested at issuance in the third quarter 2017. Refer to Note 7 to the Notes to Consolidated Financial Statements (unaudited) for further information.
Depreciation and Amortization
Depreciation and amortization expense increased due to the write-off of intangibles due to lease terminations in the third quarter 2017 offset by the disposal of 18 properties during 2016 in our real estate equity segment.
Other Income (Loss)
Unrealized Gain (Loss) on Derivatives and Other
Unrealized gain (loss) on derivatives and other is primarily related to the non-cash change in fair value of derivative instruments. The loss related to foreign currency forwards used to hedge projected net property level cash flows in our corporate segment was due to the strengthened the U.K. Pound Sterling and the Euro against the U.S. dollar. The decrease in the loss related to the interest rate caps in our real estate equity segment relates to the movement in interest rate spreads and time value across Europe.
The following table presents a summary of unrealized gain (loss) on derivatives and other for the three months ended September 30, 2017 and 2016 (dollars in thousands):
Three Months Ended September 30, | ||||||||||||||||||||||||
2017 | 2016 | |||||||||||||||||||||||
Real Estate Equity | Corporate | Total | Real Estate Equity | Corporate | Total | |||||||||||||||||||
Change in fair value of: | ||||||||||||||||||||||||
Derivatives, at fair value | ||||||||||||||||||||||||
Interest rate caps | $ | (1,235 | ) | $ | — | $ | (1,235 | ) | $ | (4,309 | ) | $ | — | $ | (4,309 | ) | ||||||||
Foreign currency forwards | — | (2,737 | ) | (2,737 | ) | — | (581 | ) | (581 | ) | ||||||||||||||
Foreign currency remeasurement and other | 284 | 216 | 500 | (21 | ) | (71 | ) | (92 | ) | |||||||||||||||
Total unrealized gain (loss) on derivatives and other | $ | (951 | ) | $ | (2,521 | ) | $ | (3,472 | ) | $ | (4,330 | ) | $ | (652 | ) | $ | (4,982 | ) | ||||||
Realized Gain (Loss) on Sales and Other
The following table presents a summary of realized gain (loss) on sales and other for the three months ended September 30, 2017 and 2016 (dollars in thousands):
45
Three Months Ended September 30, | ||||||||||||||||||||||||
2017 | 2016 | |||||||||||||||||||||||
Real Estate Equity | Corporate | Total | Real Estate Equity | Corporate | Total | |||||||||||||||||||
Sale of real estate investments(1) | $ | 1,086 | $ | — | $ | 1,086 | $ | (5,713 | ) | $ | — | $ | (5,713 | ) | ||||||||||
Foreign currency transactions(2) | 81 | (172 | ) | (91 | ) | 12,204 | 23 | 12,227 | ||||||||||||||||
Other(3) | 454 | — | 454 | (2,800 | ) | — | (2,800 | ) | ||||||||||||||||
Net cash payments (receipts) on derivatives | — | 232 | 232 | — | 100 | 100 | ||||||||||||||||||
Total realized gain (loss) on sales and other | $ | 1,621 | $ | 60 | $ | 1,681 | $ | 3,691 | $ | 123 | $ | 3,814 | ||||||||||||
_____________
(1) | Excludes escrow arrangements entered into for specific indemnification obligations in relation to the sales. |
(2) | Includes, for the three months ended September 30, 2017 and 2016, $0.1 million and $11.5 million, respectively, relating to the reclassification of the currency translation adjustment from a component of accumulated other comprehensive income, or OCI, to realized gain due to the sale of certain real estate assets. |
(3) | Includes the release of certain escrow arrangements for specific indemnification obligations in relation to the sales offset by the write-off of deferred financing costs due to the repayment of certain mortgage and other notes payable. |
Income Tax Benefit (Expense)
The income tax expense for the three months ended September 30, 2017 represents a net expense of $0.4 million related to our real estate equity segment. The income tax expense for the three months ended September 30, 2016 represents a net expense of$2.7 million related to our real estate equity segment.
Same Store Analysis
The following table presents our same store analysis for the real estate equity segment which excludes properties that were acquired or sold at any time during the three months ended September 30, 2017 and 2016 (dollars in thousands):
Same Store(3) | ||||||||||||||
Three Months Ended September 30, | Increase (Decrease) | |||||||||||||
2017 | 2016(1) | Amount | % | |||||||||||
Occupancy (end of period) | 85.5 | % | 86.0 | % | ||||||||||
Same store | ||||||||||||||
Rental income(2) | $ | 26,799 | $ | 27,977 | $ | (1,178 | ) | |||||||
Escalation income | 5,526 | 6,200 | (674 | ) | ||||||||||
Other income | 187 | 128 | 59 | |||||||||||
Total revenues | 32,512 | 34,305 | (1,793 | ) | (5.2 | )% | ||||||||
Utilities | 1,892 | 2,063 | (171 | ) | ||||||||||
Real estate taxes and insurance | 1,337 | 1,236 | 101 | |||||||||||
Non-recoverable value added tax (VAT) | 536 | 478 | 58 | |||||||||||
Management fees | 589 | 435 | 154 | |||||||||||
Repairs and maintenance | 2,446 | 2,735 | (289 | ) | ||||||||||
Ground rent(2) | 193 | 177 | 16 | |||||||||||
Other | 332 | 313 | 19 | |||||||||||
Properties - operating expenses | 7,325 | 7,437 | (112 | ) | (1.5 | )% | ||||||||
Same store net operating income | $ | 25,187 | $ | 26,868 | $ | (1,681 | ) | (6.3 | )% | |||||
Same store net operating income - Core(4) | $ | 22,235 | $ | 23,410 | $ | (1,175 | ) | (5.0 | )% | |||||
__________________
(1) | Three months ended September 30, 2016 is translated using the average exchange rate for the three months ended September 30, 2017. |
(2) | Adjusted to exclude amortization of above/below market leases. |
(3) | We believe same store net operating income, a non-GAAP metric, is a useful metric of the operating performance as it reflects the operating performance of the real estate portfolio excluding effects of non-cash adjustments and provides a better measure of operational performance for a quarter-over-quarter comparison. Same store net operating income is presented for the same store portfolio, which represents all properties that were owned by us in the end of the reporting period. We define same store net operating income as NOI excluding (i) properties that were acquired or sold during the period, (ii) impact of foreign currency changes and (iii) amortization of above/below market leases. We consider same store net operating income to be an appropriate and useful supplemental performance measure. Same store net operating income should not be considered as an alternative to net income (loss), determined in accordance with U.S. GAAP, as an indicator of operating performance. In addition, our methodology for calculating same store net operating income involves subjective judgment and discretion and may differ from the methodologies used by other comparable companies, including other REITs, when calculating the same or similar supplemental financial measures and may not be comparable with these companies. |
(4) | Core represents prime office properties in key cities within Germany, the United Kingdom and France. |
46
Same Store Revenue
Same store rental income decreased as a result of lease extensions signed at the Maastoren property ($0.7 million down in the third quarter 2017) and a vacancy in the Trianon property, which has now been re-let ($0.7 million per quarter contractual rent). Same store escalation income decreased due to decreased operating expenses, of which, a majority of these costs are recovered from our tenants. Same store other income increased due to one-time insurance refund in the third quarter of 2017.
Same Store Expense
Same store properties - operating expenses decreased due to the timing of certain recoverable expenses.
Reconciliation Net Income to Same Store
The following table presents a reconciliation from net income (loss) to same store net operating income for the real estate equity segment for the three months ended September 30, 2017 and 2016 (dollars in thousands):
Same Store Reconciliation | ||||||||
Three Months Ended September 30, | ||||||||
2017 | 2016 | |||||||
Net income (loss) | $ | (6,806 | ) | $ | (12,770 | ) | ||
Corporate segment net (income) loss(1) | 11,023 | 13,935 | ||||||
Other (income) loss(3) | 21,738 | 27,283 | ||||||
Net operating income | 25,955 | 28,448 | ||||||
Sale of real estate investments and other(4) | (64 | ) | (1,580 | ) | (5) | |||
Interest income(2) | (704 | ) | — | |||||
Same store net operating income | $ | 25,187 | $ | 26,868 | ||||
__________________
(1) | Includes management fees, general and administrative expense, compensation expense, corporate interest expense and corporate transaction costs. |
(2) | Represents interest income earned in the preferred equity segment. |
(3) | Includes depreciation and amortization expense, transaction costs and other expenses in the real estate equity segment. |
(4) | Represents the impact of assets sold during the period. |
(5) | Three months ended September 30, 2016 is translated using the average exchange rate for the three months ended September 30, 2017. |
47
Comparison of the Nine Months Ended September 30, 2017 to September 30, 2016 (dollars in thousands):
Nine Months Ended September 30, | Increase (Decrease) | |||||||||||||
2017 | 2016 | Amount | % | |||||||||||
Revenues | ||||||||||||||
Rental income | $ | 79,308 | $ | 98,622 | $ | (19,314 | ) | (20 | )% | |||||
Escalation income | 16,360 | 19,825 | (3,465 | ) | (17 | )% | ||||||||
Interest income | 1,001 | — | 1,001 | 100 | % | |||||||||
Other income | 708 | 899 | (191 | ) | (21 | )% | ||||||||
Total revenues | 97,377 | 119,346 | (21,969 | ) | (18 | )% | ||||||||
Expenses | ||||||||||||||
Properties - operating expenses | 22,521 | 27,263 | (4,742 | ) | (17 | )% | ||||||||
Interest expense | 19,641 | 33,484 | (13,843 | ) | (41 | )% | ||||||||
Transaction costs | 1,565 | 2,633 | (1,068 | ) | (41 | )% | ||||||||
Impairment losses | — | 27,468 | (27,468 | ) | (100 | )% | ||||||||
Management fee, related party | 10,716 | 10,548 | 168 | 2 | % | |||||||||
Other expenses | 6,604 | 9,579 | (2,975 | ) | (31 | )% | ||||||||
General and administrative expenses | 5,875 | 5,181 | 694 | 13 | % | |||||||||
Compensation expense | 20,094 | 12,225 | 7,869 | 64 | % | |||||||||
Depreciation and amortization | 39,479 | 51,264 | (11,785 | ) | (23 | )% | ||||||||
Total expenses | 126,495 | 179,645 | (53,150 | ) | (30 | )% | ||||||||
Other income (loss) | ||||||||||||||
Unrealized gain (loss) on derivatives and other | (12,068 | ) | (19,775 | ) | 7,707 | (39 | )% | |||||||
Realized gain (loss) on sales and other | 8,632 | 6,188 | 2,444 | 39 | % | |||||||||
Income (loss) before income tax benefit (expense) | (32,554 | ) | (73,886 | ) | 41,332 | (56 | )% | |||||||
Income tax benefit (expense) | (316 | ) | (2,515 | ) | 2,199 | (87 | )% | |||||||
Net income (loss) | $ | (32,870 | ) | $ | (76,401 | ) | $ | 43,531 | (57 | )% | ||||
Revenues
Rental Income
Rental income consists of rental revenue in our real estate equity segment. Rental income decreased $19.3 million, primarily due to the disposal of 18 properties during 2016.
Escalation Income
Escalation income consists of tenant recoveries in our real estate equity segment. Escalation income decreased $3.5 million, primarily due to the disposal of 18 properties during 2016 and the timing of certain recoverable expenses offset by an increase in recoverable operating expenses. There is a corresponding decrease in properties - operating expenses and a majority of these costs are recovered from our tenants.
Interest Income
Interest income relates to our preferred equity investment originated in the second quarter 2017 in our preferred equity segment.
Other Income
Other income is principally related to lease surrender premiums and termination fees in our real estate equity segment. Other income decreased for the nine months ended September 30, 2017 due to a significant lease surrender premium in the first quarter of 2016.
Expenses
Properties - Operating Expenses
Properties - operating expenses decreased $4.7 million due to the disposal of 18 properties during 2016 and the timing of certain recoverable expenses offset by an increase in recoverable repairs and maintenance during 2017 in our real estate equity segment. There is a corresponding decrease in escalation income and a majority of these costs are recovered from our tenants.
48
Interest Expense
Interest expense decreased $13.8 million due to the disposal of 18 properties during 2016, the refinancing of certain mortgage notes in our real estate equity segment in the third quarter of 2017 and the repayment of our senior stock-settlable notes in our corporate segment in 2016.
Transaction Costs
Transaction costs for the nine months ended September 30, 2017 primarily relate to costs related to the Mergers in our corporate segment, costs associated with amending the management agreement in our corporate segment and other transaction costs in our preferred equity segment. A transaction fee was paid to a third party and reimbursed in total by the entity that originated our preferred equity investment resulting in no impact to transaction costs. Transaction costs for the nine months ended September 30, 2016 primarily represented expenses such as real estate transfer tax and professional fees related to the acquisition of the assets in our real estate equity segment and the spin-off from NorthStar Realty in our corporate segment.
Management Fee, Related Party
Management fee, related party relates to the management fee incurred to our Manager in our corporate segment (refer to “Related Parties Arrangements” below for more information).
Other Expenses
Other expenses primarily represent third-party service provider fees such as audit and legal fees and other compliance related fees related to portfolio management of our real estate equity segment.
General and Administrative Expenses
General and administrative expenses are incurred in our corporate segment. The increase is due to payroll taxes associated with the acceleration of equity awards due to the Mergers in the first quarter 2017. For the nine months ended September 30, 2017, our Manager did not allocate any general and administrative expenses to us. For the nine months ended September 30, 2016, our Manager allocated $0.1 million.
Compensation Expense
Compensation expense is comprised of time-based and performance equity-based based awards in our corporate segment. The increase for the nine months ended September 30, 2017, is due to the acceleration of a material portion of our equity awards due to the Mergers offset by the issuance of board grants which fully vested at issuance in the third quarter 2017. Refer to Note 6 to the Notes to Consolidated Financial Statements (unaudited) for further information.
Depreciation and Amortization
Depreciation and amortization expense decreased due to the disposal of 18 properties during 2016 and assets being reclassified into held for sale offset by the write-off of intangibles due to lease terminations in our real estate equity segment in the first and second quarter 2017.
Other Income (Loss)
Unrealized Gain (Loss) on Derivatives and Other
Unrealized gain (loss) on derivatives and other is primarily related to the non-cash change in fair value of derivative instruments. The loss related to the foreign currency forwards used to hedge projected net property level cash flows in our corporate segment was due to the strengthened U.K. Pound Sterling and the Euro against the U.S. dollar. The decreased loss in the interest rate caps in our real estate equity segment relates to the movement in interest rate spreads and time value across Europe.
The following table presents a summary of unrealized gain (loss) on derivatives and other for the nine months ended September 30, 2017 and 2016 (dollars in thousands):
Nine Months Ended September 30, | ||||||||||||||||||||||||
2017 | 2016 | |||||||||||||||||||||||
Real Estate Equity | Corporate | Total | Real Estate Equity | Corporate | Total | |||||||||||||||||||
Change in fair value of: | ||||||||||||||||||||||||
Derivatives, at fair value | ||||||||||||||||||||||||
Interest rate caps | $ | (1,949 | ) | $ | — | $ | (1,949 | ) | $ | (18,483 | ) | $ | — | $ | (18,483 | ) | ||||||||
Foreign currency forwards | — | (10,309 | ) | (10,309 | ) | — | (374 | ) | (374 | ) | ||||||||||||||
Foreign currency remeasurement and other | 37 | 153 | 190 | (232 | ) | (686 | ) | (918 | ) | |||||||||||||||
Total unrealized gain (loss) on derivatives and other | $ | (1,912 | ) | $ | (10,156 | ) | $ | (12,068 | ) | $ | (18,715 | ) | $ | (1,060 | ) | $ | (19,775 | ) | ||||||
49
Realized Gain (Loss) on Sales and Other
The following table presents a summary of realized gain (loss) on sales and other for the nine months ended September 30, 2017 and 2016 (dollars in thousands):
Nine Months Ended September 30, | ||||||||||||||||||||||||||||
2017 | 2016 | |||||||||||||||||||||||||||
Real Estate Equity | Corporate | Preferred Equity | Total | Real Estate Equity | Corporate | Total | ||||||||||||||||||||||
Sale of real estate investments(1) | $ | 6,909 | $ | — | $ | — | $ | 6,909 | $ | 1,840 | $ | — | $ | 1,840 | ||||||||||||||
Foreign currency transactions(2) | (242 | ) | (166 | ) | (6 | ) | (414 | ) | 12,380 | — | 12,380 | |||||||||||||||||
Other(3) | 449 | — | — | 449 | (3,379 | ) | (3,558 | ) | (6,937 | ) | ||||||||||||||||||
Net cash payments (receipts) on derivatives | 1,688 | — | 1,688 | — | (1,095 | ) | (1,095 | ) | ||||||||||||||||||||
Total realized gain (loss) on sales and other | $ | 7,116 | $ | 1,522 | $ | (6 | ) | $ | 8,632 | $ | 10,841 | $ | (4,653 | ) | $ | 6,188 | ||||||||||||
_____________
(1) | Excludes escrow arrangements entered into for specific indemnification obligations in relation to the sales. |
(2) | Includes, for the nine months ended September 30, 2017 and 2016, $(0.3) million and $11.9 million relating to the reclassification of the currency translation adjustment from a component of accumulated OCI to realized gains (loss) due to the sale of certain real estate assets. |
(3) | Includes the release of certain escrow arrangements for specific indemnification obligations in relation to the sales offset by the write-off of deferred financing costs due to the repayment of certain mortgage and other notes payable. |
Income Tax Benefit (Expense)
The income tax expense for the nine months ended September 30, 2017 represents a net tax expense of $0.3 million in our real estate equity segment. The income tax benefit for the nine months ended September 30, 2016 represents a net tax expense of $2.5 million primarily related to sales in our real estate equity segment.
Liquidity and Capital Resources
Our financing strategy is to employ investment-level financing to prudently leverage our investments and deliver attractive risk-adjusted returns to our stockholders through a wide range of secured and unsecured debt and public and private equity capital sources to fund our investment activities. In addition to investment-specific financings, we may use and have used credit facilities and repaid facilities on a shorter term basis and public and private, secured and unsecured debt issuances on a longer term basis. Our current primary liquidity needs are to fund:
• | our operating expenses and investment activities, including the repurchase of our common stock; |
• | acquisitions of our target assets and related ongoing commitments; |
• | capital improvements |
• | distributions to our stockholders; |
• | principal and interest payments on our borrowings; and |
• | income tax liabilities of taxable REIT subsidiaries and we are subject to limitations as a REIT. |
Our current primary sources of liquidity are:
• | net proceeds from asset disposals; |
• | financings secured by our assets such as mortgage notes, long-term senior and subordinate corporate capital such as revolving credit facilities, senior term loans, senior notes, senior exchangeable notes and perpetual preferred stock and common stock; |
• | cash on hand; and |
• | cash flow generated from our investments, both from operations and return of capital. |
We seek to meet our long-term liquidity requirements, including the repayment of borrowings and our investment funding needs, through existing cash resources, issuance of debt or equity capital, return of capital from investments and the liquidation or refinancing of assets. Nonetheless, our ability to meet a long-term (beyond one year) liquidity requirement may be subject to obtaining additional debt and equity financing. Any decision by our lenders and investors to provide us with financing will depend upon a number of factors, such as our compliance with the terms of our existing credit arrangements, our financial performance, industry or market trends, the general availability of and rates applicable to financing transactions, such lenders’ and investors’ resources and policies concerning the terms under which they make capital commitments and the relative attractiveness of alternative investment or lending opportunities.
50
As a REIT, we are required to distribute at least 90% of our annual REIT taxable income to our stockholders, including taxable income where we do not receive corresponding cash, and we intend to distribute all or substantially all of our REIT taxable income in order to comply with the REIT distribution requirements of the Internal Revenue Code and to avoid federal income tax and the non-deductible excise tax. On a quarterly basis, the Board determines an appropriate common stock dividend based upon numerous factors, including CAD, REIT qualification requirements, availability of existing cash balances, borrowing capacity under existing credit agreements, access to cash in the capital markets and other financing sources, our view of our ability to realize gains in the future through appreciation in the value of our assets, general economic conditions and economic conditions that more specifically impact our business or prospects. Future dividend levels are subject to adjustment based upon our evaluation of the factors described above, as well as other factors that the Board may, from time-to-time, deem relevant to consider when determining an appropriate common stock dividend.
In November 2015, the Board authorized the repurchase of up to $100 million of our outstanding common stock. That authorization expired in November 2016 and at such time the Board authorized an additional repurchase of up to $100 million of its outstanding common stock through November 2017. For the nine months ended September 30, 2017, we did not repurchase any shares of our common stock.
We believe that our existing sources of funds should be adequate for purposes of meeting our short-term liquidity needs. We expect our contractual rental income is sufficient to meet our expected capital expenditures, interest expense, property operating and general and administrative expenses as well as common dividends declared by us. We may seek to raise additional capital in order to finance new acquisitions. Unrestricted cash as of October 31, 2017 was approximately $46 million and $35 million of availability under the Credit Facility.
Cash Flows
The following presents a summary of our consolidated statements of cash flows for the nine September 30, 2017 and 2016 (dollars in thousands).
Nine Months Ended September 30, | ||||||||
Cash flow provided by (used in): | 2017 | 2016 | ||||||
Operating activities | $ | 21,511 | $ | 19,617 | ||||
Investing activities | (420 | ) | 358,619 | |||||
Financing activities | (43,621 | ) | (514,022 | ) | ||||
Effect of foreign currency translation on cash and cash equivalents | 5,950 | 1,108 | ||||||
Net increase (decrease) in cash and cash equivalents | $ | (16,580 | ) | $ | (134,678 | ) | ||
Nine Months Ended September 30, 2017 Compared to September 30, 2016
Net cash provided by operating activities was $21.5 million for the nine months ended September 30, 2017 compared to $19.6 million for the nine months ended September 30, 2016. The increase was primarily due to an increase in the change in operating assets and liabilities due to the timing of payments and collection of receivables, offset by a decrease of net cash provided by operating activities before changes in operating assets and liabilities related to the disposal of 18 properties.
Net cash used in investing activities was $0.4 million for the nine months ended September 30, 2017 compared to net cash provided by $358.6 million for the nine months ended September 30, 2016. Cash flow used in investing activities for the nine months ended September 30, 2017 was primarily due to proceeds from the sale of real estate of $48.6 million which includes $43.8 million relating to 2017 sales and $4.8 million relating to 2016 sales, offset by the origination of our preferred equity investment, improvements of our operating real estate and changes in other assets which includes leasing costs of $3.0 million and escrow receivables of $0.7 million. Cash flow provided by the nine months ended September 30, 2016 was primarily due to proceeds from the sale of operating real estate offset by improvements of our operating real estate.
Net cash used in financing activities was $43.6 million nine months ended September 30, 2017 compared to $514.0 million for the nine months ended September 30, 2016. Cash flow used in financing activities for the nine months ended September 30, 2017 was primarily due to the net cash payment on tax withholding of $11.0 million, repayments of mortgage notes and other notes payable of $13.2 million and dividend payments of $25.1 million offset by borrowings from mortgage note and other notes payable of $5.9 million and net cash received from the settlement of the foreign currency forwards of $1.7 million. Net cash flow used in financing activities for the nine months ended September 30, 2016 was primarily due to $273.4 million from the repurchase of Senior Notes, the repayment of mortgage notes and other notes payable of $190.7 million, repayment of the credit facility of $65.0 million, retirement of shares of common stock of $29.1 million and dividend payments of $26.9 million offset by $65.0 million from the borrowing under the credit facility.
51
Off-Balance Sheet Arrangements
We currently do not have any off-balance sheet arrangements.
Related Party Arrangements
Colony NorthStar, Inc.
On November 9, 2017, we entered into an amended and restated management agreement, or the Amended and Restated Management Agreement, with an affiliate of our Manager, effective as of January 1, 2018. The description of the management agreement included below relates to the original agreement that was entered into in November 2015 and which will be superseded as of January 1, 2018 by the Amended and Restated Management Agreement. See Note 14 “Subsequent Events” in our accompanying consolidated financial statements included in Part I Item 1. “Financial Statements” for a description of the terms of the Amended and Restated Management Agreement.
Base Management Fee
For the three months ended September 30, 2017 and 2016, we incurred $3.6 million and $3.5 million, respectively, related to the base management fee. For the nine months ended September 30, 2017 and 2016, we incurred $10.7 million and $10.5 million respectively, related to the base management fee. The base management fee to our Manager could increase subsequent to September 30, 2017 by an amount equal to 1.5% per annum of the sum of:
• | any equity we issue in exchange or conversion of exchangeable or stock-settlable notes; |
• | any other issuances by us of common equity, preferred equity or other forms of equity, including but not limited to limited partnership interests in the Operating Partnership, which are structured as profits interests, or LTIP units (excluding units issued to us and equity-based compensation, but including issuances related to an acquisition, investment, joint venture or partnership); and |
• | cumulative CAD, if any, in excess of cumulative distributions paid on common stock, LTIP Units or other equity awards which began with our fiscal quarter ended March 31, 2016. |
Incentive Fee
For the three and nine months ended September 30, 2017 and 2016, we did not incur an incentive fee. The incentive fee is calculated and payable quarterly in arrears in cash, equal to:
• | the product of: (a) 15% and (b) our CAD before such incentive fee, divided by the weighted average shares outstanding for the calendar quarter, of any amount in excess of $0.30 per share and up to $0.36 per share; plus |
• | the product of: (a) 25% and (b) our CAD before such incentive fee, divided by the weighted average shares outstanding for the calendar quarter, of any amount in excess of $0.36 per share; |
• | multiplied by our weighted average shares outstanding for the calendar quarter. |
Weighted average shares represents the number of shares of our common stock, LTIP Units or other equity-based awards (with some exclusions), outstanding on a daily weighted average basis. With respect to the base management fee, all equity issuances are allocated on a daily weighted average basis during the fiscal quarter of issuance. With respect to the incentive fee, such amounts will be appropriately adjusted from time to time to take into account the effect of any stock split, reverse stock split, stock dividend, reclassification, recapitalization or other similar transaction.
Additional Management Agreement Terms
Our management agreement with our Manager provides that in the event of a change of control of our Manager or other event that could be deemed an assignment of the management agreement, we will consider such assignment in good faith and not unreasonably withhold, condition or delay our consent. The management agreement further provides that we anticipate consent would be granted for an assignment or deemed assignment to a party with expertise in commercial real estate and over $10 billion of assets under management. The management agreement also provides that, notwithstanding anything in the agreement to the contrary, to the maximum extent permitted by applicable law, rules and regulations, in connection with any merger, sale of all or substantially all of the assets, change of control, reorganization, consolidation or any similar transaction of us or our Manager, directly or indirectly, the surviving entity will succeed to the terms of the management agreement.
Payment of Costs and Expenses and Expense Allocation
We are responsible for all of our direct costs and expenses and reimburse our Manager for costs and expenses incurred by our Manager on our behalf. In addition, our Manager may allocate indirect costs to us related to employees, occupancy and other general and administrative costs and expenses in accordance with the terms of, and subject to the limitations contained in, our management agreement with our Manager, or the G&A Allocation. Our management agreement with our Manager provides that
52
the amount of the G&A Allocation will not exceed the following: (i) 20% of the total of: (a) our general and administrative expenses as reported in our consolidated financial statements excluding (1) equity-based compensation expense, (2) non-recurring items, (3) fees payable to our Manager under the terms of the applicable management agreement and (4) any allocation of expenses to us, or NRE’s G&A; and (b) our Manager’s general and administrative expenses as reported in its consolidated financial statements, excluding equity-based compensation expense and adding back any costs or expenses allocated to any managed company of our Manager; less (ii) NRE’s G&A. The G&A Allocation may include our allocable share of our Manager’s compensation and benefit costs associated with dedicated or partially dedicated personnel who spend all or a portion of their time managing our affairs, based upon the percentage of time devoted by such personnel to our affairs. The G&A Allocation may also include rental and occupancy, technology, office supplies, travel and entertainment and other general and administrative costs and expenses, which may be allocated based on various methodologies, such as weighted average employee count or the percentage of time devoted by personnel to our affairs. In addition, we will pay directly or reimburse our Manager for an allocable portion of any severance paid pursuant to any employment, consulting or similar service agreements in effect between our Manager and any of its executives, employees or other service providers.
Our obligation to reimburse our Manager for the G&A Allocation and any severance, at our Manager’s discretion, and the 20% cap on the G&A Allocation, as described above, applies on an aggregate basis to us.
For the three and nine months ended September 30, 2017 and the nine September 30, 2016 our Manager did not allocate any general and administrative expenses to us. For the nine September 30, 2016, our Manager allocated $0.1 million to us. For the three and nine months ended September 30, 2017 and 2016, our Manager did not allocate any severance to us.
In addition, the management agreement provides that, we, together with any company spun-off from us shall pay directly or reimburse our Manager for up to 50% of any long-term bonus or other compensation that our Manager’s compensation committee determines shall be paid and/or settled in the form of equity and/or equity-based compensation to executives, employees and service providers of our Manager during any year. Subject to this limitation and limitations contained in any applicable management agreement between our Manager and any company spun-off from us, the amount paid by us and any company spun-off from us will be determined by our Manager in its discretion. At the discretion of our Manager’s compensation committee, this compensation may be granted in shares of our restricted stock, restricted stock units, LTIP Units or other forms of equity compensation or stock-based awards; provided that if at any time a sufficient number of shares of our common stock are not available for issuance under our equity compensation plan, such compensation shall be paid in the form of RSUs, LTIP Units or other securities that may be settled in cash. Our equity compensation for each year may be allocated on an individual-by-individual basis at the discretion of our Manager compensation committee and, as long as the aggregate amount of the equity compensation for such year does not exceed the limits set forth in the management agreement, the proportion of any particular individual’s equity compensation may be greater or less than 50%.
We do not have employment agreements with our named executive officers, but we have generally agreed to pay directly or reimburse our Manager for the portion of any severance paid by our Manager or any of its affiliates to an individual pursuant to the terms of any employment, consulting or similar service agreement, including any employment agreements with Colony NorthStar or its subsidiaries and our named executive officers, that corresponds to or is attributable to: (i) the equity compensation that we are required to pay directly or reimburse our Manager pursuant to the management agreement; (ii) any cash and/or equity compensation paid directly by us to such individual as an employee or our other service providers; and (iii) any amounts paid to such individual by our Manager or any of its affiliates that we are obligated to reimburse our Manager pursuant to the management agreement. With respect to Mahbod Nia, in lieu of the foregoing severance payment or reimbursement, we have agreed to pay directly or reimburse our Manager for 50% of any cash payments made by our Manager or any of its affiliates in connection with the termination of Mr. Nia’s employment either without cause or upon the non-renewal of the named executive officer’s term of employment by his employer or by Mr. Nia for good reason; provided that the Board consented to the taking of such action (or, with respect to a termination for good reason, any action taken with the intent to create good reason). Because our obligation to pay these amounts is owed to our Manager and not directly to our named executive officers and we do not control the terms of the agreements between our Manager or its affiliates and our named executive officers, the discussion above does not include these amounts or a discussion of any arrangements that our Manager or its affiliates may have with our named executive officers pursuant to which our obligations to our Manager may arise.
Manager Ownership of Common Stock
As of September 30, 2017, Colony NorthStar and its subsidiaries owned 4.9 million shares of our common stock, or 9.0% of the total outstanding common stock.
53
Recent Developments
Dividends
On November 6, 2017, we declared a dividend of $0.15 per share of common stock. The common stock dividend will be paid on November 24, 2017 to stockholders of record as of the close of business on November 20, 2017.
Amended and Restated Management Agreement
On November 9, 2017, we entered into the Amended and Restated Management Agreement with an affiliate of our Manager, effective as of January 1, 2018. Refer to Note 14 “Subsequent Events” in our accompanying consolidated financial statements included in Part I Item 1. “Financial Statements” for a description of the terms of the Amended and Restated Management Agreement.
Inflation
Virtually all of our assets and liabilities are interest rate and foreign currency exchange rate sensitive in nature. As a result, interest rates, foreign currency exchange rates and other factors influence our performance significantly more than inflation does. A change in interest rates and foreign currency exchange rates may correlate with inflation rates. With the exception of the United Kingdom, rent is generally adjusted annually based on local consumer price indices. In the United Kingdom, rent is typically subject to an upward only rent review usually every three to five years.
Refer to Item 3. “Quantitative and Qualitative Disclosures About Market Risk” for additional details.
Non-GAAP Financial Measures
We use CAD and NOI, each a non-GAAP measure, to evaluate our profitability.
Cash Available for Distribution
We believe that CAD provides investors and management with a meaningful indicator of operating performance. We also believe that CAD is useful because it adjusts for a variety of items that are consistent with presenting a measure of operating performance (such as transaction costs, depreciation and amortization, equity-based compensation, realized gain (loss) on sales and other, asset impairment and non-recurring bad debt expense). We adjust for transaction costs because these costs are not a meaningful indicator of our operating performance. For instance, these transaction costs include costs such as professional fees associated with new investments, which are expenses related to specific transactions. Management also believes that quarterly distributions are principally based on operating performance and our board of directors includes CAD as one of several metrics it reviews to determine quarterly distributions to stockholders. The definition of CAD may be adjusted from time to time for our reporting purposes in our discretion, acting through our audit committee or otherwise. CAD may fluctuate from period to period based upon a variety of factors, including, but not limited to, the timing and amount of investments, repayments and asset sales, capital raised, use of leverage, changes in the expected yield of investments and the overall conditions in commercial real estate and the economy generally.
We calculate CAD by subtracting from or adding to net income (loss) attributable to common stockholders, non-controlling interests and the following items: depreciation and amortization items including straight-line rental income or expense (excluding amortization of rent free periods), amortization of above/below market leases, amortization of deferred financing costs, amortization of discount on financings and other and equity-based compensation; unrealized gain (loss) on derivatives and other; realized gain (loss) on sales and other (excluding any realized gain (loss) on foreign currency derivatives); impairment on depreciable property; non-recurring bad debt expense; acquisition gains or losses; transaction costs; foreign currency gains (losses); impairment on goodwill and other intangible assets; and one-time events pursuant to changes in U.S. GAAP and certain other non-recurring items. These items, if applicable, include any adjustments for unconsolidated ventures.
CAD should not be considered as an alternative to net income (loss) attributable to common stockholders, determined in accordance with U.S. GAAP, as an indicator of operating performance. In addition, our methodology for calculating CAD involves subjective judgment and discretion and may differ from the methodologies used by other comparable companies, including other REITs, when calculating the same or similar supplemental financial measures and may not be comparable with these companies.
54
The following table presents a reconciliation of CAD to net income (loss) attributable to common stockholders for the three and nine months ended September 30, 2017 (dollars in thousands):
Three Months Ended September 30, | Nine Months Ended September 30, | ||||||||||||||
2017 | 2016 | 2017 | 2016 | ||||||||||||
Net income (loss) attributable to common stockholders | $ | (6,770 | ) | $ | (12,721 | ) | $ | (32,567 | ) | $ | (75,609 | ) | |||
Non-controlling interests | (36 | ) | (49 | ) | (303 | ) | (792 | ) | |||||||
Adjustments: | |||||||||||||||
Depreciation and amortization items(1)(2) | 17,096 | 20,870 | 61,656 | 71,300 | |||||||||||
Impairment losses | — | — | — | 27,468 | |||||||||||
Unrealized (gain) loss on derivatives and other | 3,472 | 4,982 | 12,068 | 19,775 | |||||||||||
Realized (gain) loss on sales and other(3)(4) | (1,449 | ) | (3,714 | ) | (6,944 | ) | (7,283 | ) | |||||||
Transaction costs and other(5)(6) | 438 | 4,564 | 2,480 | 7,333 | |||||||||||
CAD | $ | 12,751 | $ | 13,932 | $ | 36,390 | $ | 42,192 | |||||||
__________________
(1) | Three months ended September 30, 2017 represents an adjustment to exclude depreciation and amortization of $(14.4) million, amortization expense of capitalized above/below market leases of $0.8 million, amortization of deferred financing costs of $(0.7) million and amortization of equity-based compensation of $(2.8) million. Three months ended September 30, 2016 represents an adjustment to exclude depreciation and amortization of $(14.0) million, amortization of above/below market leases of $0.1 million, amortization of deferred financing costs of $(1.8) million and amortization of equity-based compensation of $(5.2) million. |
(2) | Nine months ended September 30, 2017 represents an adjustment to exclude depreciation and amortization of $(39.5) million, amortization expense of capitalized above/below market leases of $0.3 million, amortization of deferred financing costs of $(2.3) million and amortization of equity-based compensation of $(20.1) million. Nine months ended September 30, 2016 represents an adjustment to exclude depreciation and amortization of $(51.3) million, amortization expense of capitalized above/below market leases of $(2.2) million, amortization of deferred financing costs of $(5.5) million and amortization of equity-based compensation of $(12.2) million. |
(3) | Three months ended September 30, 2017 CAD includes a $0.2 million net gain related to the settlement of foreign currency derivatives. Three months ended September 30, 2016 CAD includes a $0.1 million net gain related to the settlement of foreign currency derivatives. |
(4) | Nine months ended September 30, 2017 CAD includes a $1.7 million net gain related to the settlement of foreign currency derivatives. Nine months ended September 30, 2016 CAD includes a $(1.1) million net loss related to the settlement of foreign currency derivatives. |
(5) | Three months ended September 30, 2017 represents an adjustment to exclude $(0.3) million of transaction costs and $(0.1) million of taxes associated with the capital gain tax on the sale of real estate investments. Three months ended September 30, 2016 represents an adjustment to exclude $(0.3) million of transaction costs and $(4.3) million of taxes associated with the capital gain tax on the sale of real estate investments. |
(6) | Nine months ended September 30, 2017 represents an adjustment to exclude $(1.6) million of transaction costs relating to the Mergers and transaction fees related to our preferred equity investment and $(0.9) million of payroll taxes associated with the acceleration of equity awards due to the Mergers. Nine months ended September 30, 2016 represents an adjustment to exclude $(3.0) million of transaction costs and $(4.3) million of taxes associated with the capital gain tax on the sale of real estate investments. |
Net Operating Income (NOI)
We believe NOI is a useful metric of the operating performance of our real estate portfolio in the aggregate. Portfolio results and performance metrics represent 100% for all consolidated investments. Net operating income represents total property and related revenues, adjusted for: (i) amortization of above/below market leases; (ii) straight-line rent (except with respect to rent free period); (iii) other items such as adjustments related to joint ventures and non-recurring bad debt expense and less property operating expenses. However, the usefulness of NOI is limited because it excludes general and administrative costs, interest expense, transaction costs, depreciation and amortization expense, realized gains (losses) on sales and other and other items under U.S. GAAP and capital expenditures and leasing costs necessary to maintain the operating performance of properties, all of which may be significant economic costs. NOI may fail to capture significant trends in these components of U.S. GAAP net income (loss) which further limits its usefulness.
NOI should not be considered as an alternative to net income (loss), determined in accordance with U.S. GAAP, as an indicator of operating performance. In addition, our methodology for calculating NOI involves subjective judgment and discretion and may differ from the methodologies used by other comparable companies, including other REITs, when calculating the same or similar supplemental financial measures and may not be comparable with these companies.
55
The following table presents a reconciliation of NOI of our real estate equity and preferred equity segments to property and other related revenues less property operating expenses for the three and nine months ended September 30, 2017 and 2016 (dollars in thousands):
Three Months Ended September30, | Nine Months Ended September30, | ||||||||||||||
2017 | 2016 | 2017 | 2016 | ||||||||||||
Rental income | $ | 27,747 | $ | 29,798 | $ | 79,308 | $ | 98,622 | |||||||
Escalation income | 5,641 | 7,828 | 16,360 | 19,825 | |||||||||||
Other income | 171 | 149 | 708 | 899 | |||||||||||
Total property and other income | 33,559 | 37,775 | 96,376 | 119,346 | |||||||||||
Properties - operating expenses | 7,519 | 9,493 | 22,521 | 27,263 | |||||||||||
Adjustments: | |||||||||||||||
Interest income | 704 | — | 1,001 | — | |||||||||||
Amortization and other items(1)(2) | (789 | ) | 166 | (257 | ) | 2,815 | |||||||||
NOI(3) | $ | 25,955 | $ | 28,448 | $ | 74,599 | $ | 94,898 | |||||||
___________________
(1) | Three months ended September 30, 2017 primarily includes $0.8 million of amortization of above/below market leases. Three months ended September 30, 2016 primarily includes $(0.1) million of amortization of above/below market leases. |
(2) | Nine months ended September 30, 2017 primarily includes $0.3 million of amortization of above/below market leases. Nine months ended September 30, 2016 primarily includes $(2.2) million of amortization of above/below market lease and $(0.6) million of non-recurring bad debt expense. |
(3) | The following table presents a reconciliation of net income (loss) to NOI of our real estate segment for the three and nine months ended September 30, 2017 and 2016 (dollars in thousands): |
Three Months Ended September 30, | Nine Months Ended September 30, | ||||||||||||||
2017 | 2016 | 2017 | 2016 | ||||||||||||
Net income (loss) | $ | (6,806 | ) | $ | (12,770 | ) | $ | (32,870 | ) | $ | (76,401 | ) | |||
Remaining segments(i) | 10,319 | 13,935 | 46,272 | 46,174 | |||||||||||
Real estate segment adjustments: | |||||||||||||||
Interest expense | 6,325 | 7,132 | 18,896 | 24,249 | |||||||||||
Other expenses | 1,974 | 2,850 | 6,389 | 9,547 | |||||||||||
Depreciation and amortization | 14,396 | 13,989 | 39,479 | 51,264 | |||||||||||
Unrealized (gain) loss on derivatives and other | 951 | 4,330 | 1,912 | 18,715 | |||||||||||
Realized (gain) loss on sales and other | (1,621 | ) | (3,691 | ) | (7,116 | ) | (10,841 | ) | |||||||
Income tax (benefit) expense | 352 | 2,655 | 316 | 2,515 | |||||||||||
Impairment losses | — | — | — | 27,468 | |||||||||||
Other items | 65 | 18 | 1,321 | 2,208 | |||||||||||
Net (income) loss - Real estate segment | 22,442 | 27,283 | 61,197 | 125,125 | |||||||||||
NOI | $ | 25,955 | $ | 28,448 | $ | 74,599 | $ | 94,898 | |||||||
______________________
(i) | Represents the net (income) loss in our corporate and preferred equity segments to reconcile to net operating income. |
56
Item 3. Quantitative and Qualitative Disclosures About Market Risk
We are primarily subject to interest rate risk, credit risk and foreign currency exchange rate risk. These risks are dependent on various factors beyond our control, including monetary and fiscal policies, domestic and international economic conditions and political considerations. Our market risk sensitive assets, liabilities and related derivative positions are held for investment and not for trading purposes.
Interest Rate Risk
Changes in interest rates affect our net income primarily related to the impact to interest expense incurred in connection with our borrowings and derivatives.
Substantially all of our investments are financed with non-recourse mortgage notes. We predominately use floating rate financing and we seek to generally mitigate the risk of interest rates rising through derivative instruments including interest rate caps. As of September 30, 2017, a hypothetical 100 basis point increase in the interest rate applied to our liabilities would result in a decrease in net income of approximately $7.4 million annually, respectively.
A change in interest rates could affect the value of our properties, which may be influenced by changes in interest rates and credit spreads (as discussed below) because value is typically derived by discounting expected future cash flow generated by the property using interest rates plus a risk premium based on the property type and creditworthiness of the tenants. A lower risk-free rate generally results in a lower discount rate and, therefore, a higher valuation, and vice versa; however, an increase in the risk-free rate would not impact our net income.
We use derivative instruments to manage interest rate exposure. These derivatives are typically in the form of interest rate cap agreements and the primary objective is to minimize interest rate risks associated with our investments and financing activities. The counterparties of these arrangements are major financial institutions with which we may also have other financial relationships. We are exposed to credit risk in the event of non-performance by these counterparties and we monitor their financial condition.
As of September 30, 2017, none of our derivatives qualified for hedge accounting treatment, therefore, gains (losses) resulting from their fair value measurement at the end of each reporting period are recognized as an increase or decrease in unrealized gain (loss) on derivatives and other in our consolidated statements of operations. In addition, we are, and may in the future be, subject to additional expense based on the notional amount of the derivative and a specified spread over the applicable index. Because the fair value of these instruments can vary significantly between periods, we may experience significant fluctuations in the amount of our unrealized gain (loss) in any given period.
Subject to maintaining our qualification as a REIT for U.S. federal income tax purposes, we may mitigate the risk of interest rate volatility through the use of hedging instruments, such as interest rate swap agreements and interest rate cap agreements. The goal of our interest rate management strategy is to minimize or eliminate the effects of interest rate changes on the value of our assets, to improve risk-adjusted returns and, where possible, to lock in, on a long-term basis, a favorable spread between the yield on our assets and the cost of financing such assets.
We can provide no assurances, however, that our efforts to manage interest rate volatility will successfully mitigate the risks of such volatility on our portfolio.
Credit Risk
We are subject to the credit risk of the tenants of our properties. We seek to undertake a credit evaluation of each tenant prior to acquiring properties. This analysis includes due diligence of each tenant’s business as well as an assessment of the strategic importance of the underlying real estate to the tenant’s core business operations. Where appropriate, we may seek to augment the tenant’s commitment to the property by structuring various credit enhancement mechanisms into the underlying leases. These mechanisms could include security deposit requirements, letters of credit or guarantees from entities we deem creditworthy. Additionally, we perform ongoing monitoring of creditworthiness of our tenants which is an important component of our portfolio management process. Such monitoring may include, to the extent available, a review of financial statements and operating statistics, delinquencies, third party ratings and market data. In addition, our preferred equity investment is subject to credit risk through our borrower’s ability to make required interest payments on scheduled due dates. We seek to manage credit risk through our Advisor’s comprehensive credit analysis prior to making an investment, actively monitoring our investment and the underlying credit quality, including subordination and diversification of our investment. Our analysis is based on a broad range of real estate, financial, economic and borrower-related factors, which we believe are critical to the evaluation of credit risk inherent in a transaction. For the nine months ended September 30, 2017, our preferred equity investment contributed all of our interest income.
We are subject to the credit risk of the borrower when we originate preferred equity investments. We seek to undertake a rigorous credit evaluation of our borrower prior to making an investment. This analysis includes an extensive due diligence investigation of the borrower’s creditworthiness and business as well as an assessment of the strategic importance of the underlying real estate to the borrower’s core business operations.
57
Foreign Currency Exchange Rate Risk
We are subject to risks related to changes in foreign currency exchange rates as a result of our ownership of, or commitments to acquire, properties within Europe, predominantly the U.S. dollar/Euro and U.S. dollar/U.K. Pounds Sterling exchange rate. As a result, changes in exchange rate fluctuations may positively or negatively affect our consolidated revenues and expenses (as expressed in U.S. dollars) from our business. We may use several strategies to mitigate our exposure to exchange rate risk to hedge our equity and/or net income, including using local currency denominated financing and entering into forward or option foreign currency purchase contracts.
In addition, because we are exposed to foreign currency exchange rate fluctuations, we employ foreign currency risk management strategies, including the use of, among others, currency hedges, and matched currency financing.
The following chart represents the change in the U.S. dollar/Euro and U.S. dollar/U.K. Pounds Sterling exchange rate during the nine months ended September 30, 2017 and 2016:
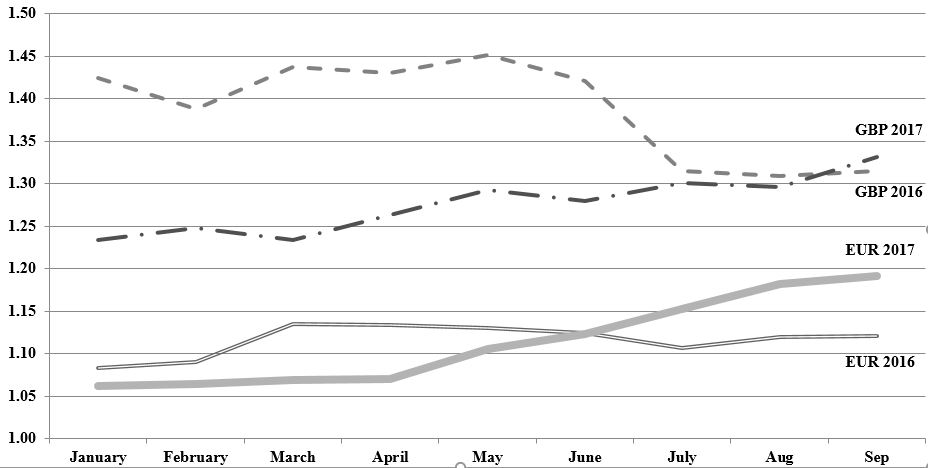 |
Source: Oanda
Our properties and the rent payments under our leases for these properties are denominated predominantly in Euro and U.K. Pounds Sterling and we expect substantially all of our future leases for properties we may acquire in Europe to be denominated in the local currency of the country in which the underlying property is located. Additionally, our non-recourse mortgage borrowings are denominated in the same currency as the assets securing the borrowing. A majority portion of our operating expenses and borrowings with respect to such European properties are also transacted in local currency, however we do have corporate expenses, such as our dividend, that are paid in U.S. dollar. We report our results of operations and consolidated financial information in the U.S. dollars. Consequently, our results of operations as reported in U.S. dollars are impacted by fluctuations in the value of the local currencies in which we conduct our European business.
In an effort to mitigate the risk of fluctuations in foreign currency exchange rates, we, and our Operating Partnership, seek to actively manage our revenues and expenses so that we incur a significant portion of our expenses, including our operating costs and borrowings, in the same local currencies in which we receive our revenues. In addition, subject to satisfying the requirements for qualification as a REIT, we engage in various hedging strategies, which may include currency futures, swaps, forwards and options. We expect that these strategies and instruments may allow us to reduce, but not eliminate, the risk of fluctuations in foreign currency exchange rates. The counterparties to these arrangements are major financial institutions with which we may also have other financial relationships. As of September 30, 2017, we have entered into foreign currency forwards with respect to the project net property level cash flows which are hedged for 14 months.
Based on our portfolio, a hypothetical 10% appreciation or depreciation in the applicable exchange rate to the U.S dollar applied to our assets and liabilities and related derivatives would result in an increase or decrease of stockholders’ equity of approximately $66.7 million, respectively. Such amount would be recorded in OCI. In addition, we enter into derivative instruments to manage foreign currency exposure of our operating income. A hypothetical 10% increase or decrease in applicable exchange rate to the U.S dollar applied to our assets and liabilities and related derivatives would result in an increase or decrease of net operating income adjusted for interest and other expenses of approximately $2.5 million annually, respectively.
We can provide no assurances, however, that our efforts to manage foreign currency exchange rate volatility will successfully mitigate the risks of such volatility on our portfolio.
58
Item 4. Controls and Procedures
Disclosure Controls and Procedures
As of the end of the period covered by this report, management conducted an evaluation as required under Rules 13a-15(b) and 15d-15(b) under the Securities Exchange Act of 1934, as amended, or Exchange Act, under the supervision and with the participation of the Company’s Chief Executive Officer and Chief Financial Officer of the effectiveness of the Company’s disclosure controls and procedures (as defined in Rules 13a-15(e) and 15d-15(e) under the Exchange Act).
Based on this evaluation, the Company’s Chief Executive Officer and Chief Financial Officer concluded that, as of the end of the period covered by this report, the Company’s disclosure controls and procedures are effective. Notwithstanding the foregoing, a control system, no matter how well designed and operated, can provide only reasonable, not absolute, assurance that it will detect or uncover failures to disclose material information otherwise required to be set forth in the Company’s periodic reports.
Internal Control over Financial Reporting
(a) Changes in internal control over financial reporting.
As a result of the Merger, our Manager is in the process of integrating the systems, processes and internal controls of Colony, NSAM and NRF, and we expect the integration to be sufficiently completed at the end of the current fiscal year. The Company leverages these systems, processes and internal controls to conduct it operations. We will continue to review our internal control practices, in conjunction with our Manager, in consideration of future integration and post merger activities.
Except as described above in the preceding paragraph, during the quarter ended September 30, 2017, there was no change in our internal control over financial reporting (as defined in Rules 13a-15(f) and 15d-15(f) under the Exchange Act) that has materially affected, or is reasonably likely to materially affect, our internal control over financial reporting.
59
PART II Other Information
Item 1. Legal Proceedings
We are involved in various litigation matters arising in the ordinary course of our business. Although we are unable to predict with certainty the eventual outcome of any litigation, in the opinion of management, our current legal proceedings are not expected to have a material adverse effect on our financial position or results of operations. Refer to Note 12, “Commitments and Contingencies” in Part I, Item 1. “Financial Statements” for further disclosure regarding legal proceedings.
Item 1A. Risk Factors
There have been no material changes to the risk factors previously disclosed in our Annual Report on Form 10-K for the fiscal year ended December 31, 2016.
You should carefully consider all information contained in this interim report on Form 10-Q, including our interim consolidated financial statements and the related notes thereto before making a decision to purchase our securities. The risks and uncertainties described are not the only ones facing us. Additional risks and uncertainties not presently known to us, or not presently deemed material by us, may also impair our operations and performance.
If any of the following risks actually occur, our business, financial condition or results of operations could be materially adversely affected. If that happens, the trading price of our securities could decline, and you may lose all or part of your investment.
60
Item 4. Mine Safety Disclosures
None.
61
Item 5. Other Information
Amended and Restated Management Agreement and Ownership Waiver
Refer to Note 14 “Subsequent Events” in our accompanying consolidated financial statements included in Part I Item 1. “Financial Statements” for a description of the the Amended and Restated Management Agreement and Ownership Waiver ended into on November 9, 2017 between the Company and the Asset Manager. Such description does no purport to describe all of the terms of such agreements and is qualified by reference to the Amended and Restated Management Agreement and Ownership Waiver, which are filed as Exhibit 10.2 and Exhibit 10.3., respectively, to this Quarterly Report on Form 10-Q and are incorporated herein by reference.
Resignation of Director
On November 7, 2017, David T. Hamamoto, the chairman of the board of directors (the “Board”) of the Company, announced his intention to resign from the Board, effective as of January 11, 2018. The decision by Mr. Hamamoto was not a result of any disagreement with the Company on any matter relating to the Company’s operations, polices or practices.
Additionally, on November 6, 2017, the Nominating and Corporate Governance Committee of the Company recommended, and the Board approved, effective January 11, 2018 (i) the appointment of Richard B. Saltzman as the Chairman of the Board and (ii) the election of Mahbod Nia, the Company’s Chief Executive Officer and President, to fill the vacancy created by Mr. Hamamoto’s resignation. Mr. Nia will serve as a director until the next annual meeting of the stockholders of the Company and until his successor has been elected and qualified or until his earlier death, resignation or removal. Mr. Nia will not receive any compensation in connection with his service on the Board.
There are no arrangements or understandings between Mr. Nia and any other person pursuant to which he was elected as a director of the Company. As described elsewhere in this Quarterly Report on Form 10-Q, the Company is party to a management agreement with an affiliate of the Manager, pursuant to which such affiliate of the Manager manages the Company’s operations and the Company is obligated to pay certain base and incentive management fees to its manager in accordance with and subject to the terms of such management agreement.
Item 6. Exhibits
Exhibit Number | Description of Exhibit | ||
10.1 | * | ||
10.2 | * | ||
31.1 | * | ||
31.2 | * | ||
32.1 | * | ||
32.2 | * | ||
101.0 | * | The following materials from the NorthStar Realty Europe Corp. Quarterly Report on Form 10-Q for the quarterly period ended September 30, 2017, formatted in XBRL (eXtensible Business Reporting Language): (i) Consolidated Balance Sheets as of September 30, 2017 (unaudited) and December 31, 2016; (ii) Consolidated Statements of Operations (unaudited) for the three and nine months ended September 30, 2017 and 2016; (iii) Consolidated Statements of Comprehensive Income (Loss) (unaudited) for the three and nine months ended September 30, 2017 and 2016; (iv) Consolidated Statements of Equity for the nine months ended September 30, 2017 (unaudited) and year ended December 31, 2016; (v) Consolidated Statements of Cash Flows (unaudited) for the nine months ended September 30, 2017 and 2016; and (vi) Notes to Consolidated Financial Statements (unaudited) | |
____________________________________________________________
* Filed herewith.
+ Denotes management contract or compensatory plan or arrangement required to be filed as an exhibit hereto.
62
SIGNATURES
Pursuant to the requirements of the Securities Exchange Act of 1934, the Registrant has duly caused this report to be signed on its behalf by the undersigned thereunto duly authorized.
NorthStar Realty Europe Corp. | |||||
Date: | November 9, 2017 | By: | /s/ MAHBOD NIA | ||
Mahbod Nia | |||||
Chief Executive Officer | |||||
By: | /s/ KEITH A. FELDMAN | ||||
Keith A. Feldman | |||||
Chief Financial Officer and Treasurer | |||||
63