Attached files
| file | filename |
|---|---|
| 8-K - FORM 8-K - Square, Inc. | d487489d8k.htm |

Exhibit 99.1
CURATORS COFFEE
London, UK
Q1 2017 Shareholder Letter
SQUARE.COM/INVESTORS
HIGHLIGHTS:
| • | Top-line growth accelerated from the second quarter of 2017: Total net revenue increased 33% year over year, up from 26%, and Adjusted Revenue increased 45% year over year, up from 41%. |
| • | We launched Square Register, our first all-in-one hardware offering, and we brought our contactless and chip reader to Canada and Square Stand to Australia. |
| • | Our open platform strategy is working: Sellers using business systems that are integrated with Square contributed nearly 20% of third-quarter GPV. |
| • | Virtual Terminal, which was built with our E-Commerce API, is our fastest product to reach $1 billion in cumulative GPV. |
THIRD QUARTER 2017 KEY RESULTS:
| GROSS PAYMENT VOLUME (GPV) | TOTAL NET REVENUE | NET INCOME (LOSS) | ||
|
|
| ||
| GPV MIX BY SELLER SIZE | ADJUSTED REVENUE | ADJUSTED EBITDA | ||
|
|
| ||
A reconciliation of non-GAAP metrics used in this letter to their nearest GAAP equivalents is provided at the end of this letter.
Adjusted Revenue is defined as total net revenue less transaction-based revenue from Starbucks and transaction-based costs.
Adjusted EBITDA margin is calculated as Adjusted EBITDA divided by Adjusted Revenue.
2
| TO OUR SHAREHOLDERS: | NOVEMBER 8, 2017 | |
|
In the third quarter, we saw ongoing strength in both transaction-based and subscription and services-based revenue. Top-line growth accelerated from the second quarter of 2017: Total net revenue increased 33% year over year, up from 26%, and Adjusted Revenue increased 45% year over year, up from 41%. We grew GPV 31% year over year, with particular strength in midmarket sellers. GPV from this segment grew 64% year over year and represented 20% of total GPV, up from 14% in the third quarter of 2016. Net loss of $16 million was an improvement of $16 million year over year. And Adjusted EBITDA of $34 million was an improvement of 195% year over year, driven by strong top-line growth and ongoing operating expense leverage.
We launched Square Register, our first all-in-one hardware offering, and we brought Square Stand to Australia and our contactless and chip reader to Canada.
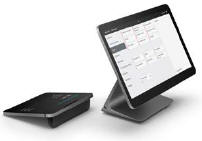
We designed and built Square Register in-house, combining our hardware, point-of-sale software, and payments technology into a powerful, all-in-one offering. Square Register does not require a third-party mobile phone or tablet. The dedicated hardware consists of two screens: a seller display and a customer display with a built-in card reader that accepts tap, dip, and swipe payments. The customer display increases transaction accuracy and speed, and creates an opportunity to establish a seller-buyer connection with digital receipts (which contain a feedback channel) and to seamlessly engage the customer with Square Loyalty—amplifying the strengths of Square’s customer-focused point of sale.
Best Beverage Catering is a nationwide events company that manages food and beverage experiences at festivals, clubs, and private events throughout the U.S. One such venue, Mountain Winery in Saratoga, California, likes how Square Register’s sleek design matches the winery’s aesthetic, while the customer display and quick transaction speed improve line efficiency. Best Beverage is excited to get Square Register into more of their 100+ venues and festivals next year.
|
Midmarket sellers are sellers that generate more than $500,000 in annualized GPV.
Square Register with customer display undocked.
Square Register with customer display docked.
“Square Register is a perfect fit for our chaotic event venues and festivals. I love the ability to connect via ethernet in unpredictable outdoor environments, the customer display allows us to communicate in loud spaces, and it’s given us peace of mind that we’ll no longer need to manage updates for a fleet of tablets.”
RYAN MENDEZ Best Beverage |


3
| Square Register, along with Square Stand, expands our suite of countertop hardware products. We continue to see strong demand for Square Stand because sellers want an elegant countertop solution that works with the tools they already own and streamlines their operations as they grow. In October, we launched Square Stand for contactless and chip in Australia to serve a wider range of sellers, enabling them to turn an iPad into a point-of-sale system and run their business from their countertop device.
We’re also bringing our contactless and chip reader to more markets around the world. In October we launched the reader in Canada, enabling sellers to accept contactless payments, including Apple Pay, Android Pay, and, for the first time, Interac Flash. This greatly expands our opportunity in Canada, as Interac represents approximately half of all card transactions1 and contactless is becoming the preferred way to pay.2 More than 70% of Canadian Square sellers did not accept card payments before using Square,3 which underscores the fact that our managed payment solutions fulfill a significant need in this market.
Our open platform strategy is working: Sellers using business systems that are integrated with Square contributed nearly 20% of third-quarter GPV.
Build with Square is a set of tools (APIs) that enables sellers to integrate products and data from Square with other business systems. Sellers and developers have been using our E-Commerce and Point of Sale APIs to integrate Square with their app, website, or point of sale, which has led to Square-connected apps for everything from tea shops to taxis.
As we continue to expand Build with Square, sellers tell us they want to connect Square to more of their business systems. For example, larger sellers often have sophisticated ERP (enterprise resource planning) needs like accounting and purchase order and human resources management. We recently announced a partnership to allow sellers to integrate Square with SAP Business One and manage their payments, sales, and operations in one place. We will enable integrations with more third-party systems used by our sellers to manage their business. We also have APIs for sellers to manage their item catalog more effectively, such as implementing real-time price changes at scale (e.g., for holiday promotions), and to connect |
Interac is Canada’s only domestic debit payment network for in-person purchasing of goods and services. Interac Flash is Interac’s contactless solution.
API stands for “application application programming interface.” Developers use APIs to more easily share information and use functionality from another application.
Sellers often have established business systems that are tailored to their individual needs. Our open platform enables sellers (or developers) to connect Square with these systems, such as:
• Accounting • Custom point-of-sale applications • CRM (customer relationship management) software • Customer databases • E-commerce websites • Employee management • ERP software • Item, inventory, and order management • Product catalogs |
4
| their inventory to their online sales. This generates integrated reporting across sales channels, which is especially important for businesses that sell online and in person and share inventory between channels.
Rifle Paper Co. is a stationery and lifestyle brand based in Winter Park, Florida, founded and owned by wife-and-husband team Anna and Nathan Bond. They have used Square for four years, as Rifle Paper Co. quickly expanded from a small business based out of their home to an international brand. Today, Square enables Rifle Paper Co. to easily manage its multichannel retail business through one platform as it continues to grow. Rifle Paper Co. uses Square’s integration with SAP Business One for back-office functions and wholesale ordering, and uses Square for Retail, Square Stand, and our contactless and chip reader in its retail store. It relies on Square for pop-up sample sales and leverages Square’s integration with Magento, an e-commerce platform, to run its online store.
As online and offline commerce merge, the ability to manage a seamless omnichannel experience becomes more important. This is a particular need for marketplaces like Eventbrite, a leading global platform for live experiences. In September we announced a partnership with Eventbrite to process payments for its online, mobile, and in-person transactions. Our omnichannel payment, reporting, and management capabilities will enable Eventbrite to offer its event creators a fully integrated solution for taking payments anywhere, and provide its attendees with a seamless purchasing experience. Through our experience growing Caviar, we’ve learned what a marketplace needs for payments, catalog support, and order management. And we recently introduced multiparty settlement, an important capability for marketplaces that enables them to distribute payments to multiple parties (i.e. for a single payment, the marketplace can take a percentage and also distribute the remaining amount to the individual seller). Importantly, any marketplace will be able to build its own solutions on top of these capabilities, allowing Square to reach a new seller segment.
We expect Build with Square and our open platform to play an important role as we continue to grow up-market: In the third quarter, more than 20% of our midmarket sellers used business systems that are integrated with Square. |
Square for Retail is an end-to-end retail point-of-sale solution that fully integrates with our managed payments offering and hardware.
“ Square made it simple for us to connect our online and retail platforms to SAP. It’s exactly what we needed to continue growing our brand.”
Tom Gustafson Rifle Paper Co. |

5
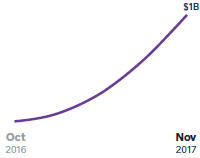
| Virtual Terminal, which was built with our E-Commerce API, is our fastest product to reach $1 billion in cumulative GPV.
Virtual Terminal allows sellers to key in payments from a web browser. This shift in product context away from a mobile device is subtle on the surface, but significant for sellers that run their businesses on a computer where companion tools such as email, customer lists, and scheduling operate alongside Virtual Terminal. Nearly 75% of Virtual Terminal GPV comes from sellers that use the product as their primary way to process payments with Square. Virtual Terminal also continues to attract new sellers: To date, approximately half of the product’s GPV comes from sellers that are new to the Square ecosystem.
We used our E-Commerce API to build and launch Virtual Terminal in just two months, which shows how quickly we can move when we leverage the breadth and agility of our platform. Virtual Terminal is our fastest product to reach $1 billion in cumulative GPV, with more than $350 million processed in the third quarter.
FINANCIAL DISCUSSION:
Gross Payment Volume (GPV)
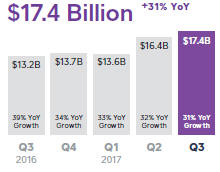
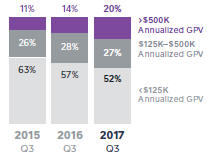
In the third quarter of 2017, we processed $17.4 billion of GPV, up 31% year over year. This is comparable to 32% year-over-year growth in the second quarter of 2017. GPV from larger sellers, which we define as all sellers that generate more than $125,000 in annualized GPV, increased 44% year over year and accounted for 48% of total GPV, up from 43% in the third quarter of 2016. Midmarket sellers, which we define as larger sellers that generate more than $500,000 in annualized GPV, continue to demonstrate strong growth. GPV from midmarket sellers grew 64% year over year, an acceleration from 61% in the second quarter.
Revenue
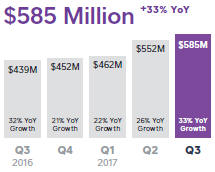
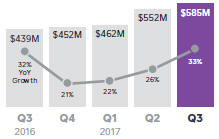
Total net revenue was $585 million in the third quarter of 2017, up 33% year over year. This compares to 26% year-over-year growth in the second |
VIRTUAL TERMINAL CUMULATIVE GPV
|
6
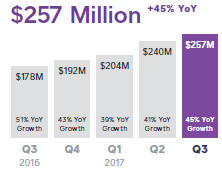
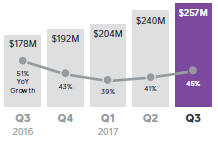
| quarter of 2017. Excluding Starbucks revenue from prior periods, total net revenue grew 36% year over year in both the second and third quarters of 2017. Adjusted Revenue was $257 million, up 45% year over year, an acceleration from 41% year-over-year growth in the second quarter of 2017.
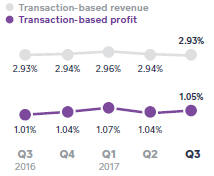
Transaction-based revenue was $510 million in the quarter, up 31% year over year. Transaction-based revenue as a percentage of GPV was 2.93%, flat compared to the third quarter of 2016. Transaction-based profit as a percentage of GPV was 1.05% in the third quarter of 2017, up from 1.01% in the third quarter of 2016. Strong growth in Invoices, Virtual Terminal, and E-Commerce API payments, which all have higher rates than our card-present transactions, as well as improvements in our transaction cost profile, offset the impact from custom pricing for certain larger sellers.
Subscription and services-based revenue was $65 million in the third quarter of 2017, up 84% year over year. Instant Deposit, Caviar, and Square Capital contributed the majority of subscription and services-based revenue. Specifically, Instant Deposit volume of $2 billion in the third quarter benefited from increased usage by Square sellers and Cash app individuals, both of whom value speed to access their funds. Square Capital facilitated 47,000 business loans totaling $303 million, up 45% year over year.
Hardware revenue was $10 million in the third quarter of 2017, up 23% year over year and slightly down on a sequential basis. Hardware revenue and growth rates have normalized since the first half of 2016 when the contactless and chip reader began shipping. Hardware costs were $19 million in the quarter, up 20% year over year, including a $2.3 million charge related to the bankruptcy of one of our distribution partners. Excluding this charge, hardware costs increased 5% on a year-over-year basis.
Operating Expenses/Earnings
Total operating expenses were $234 million in the third quarter of 2017, up 28% year over year. Non-GAAP operating expenses of $186 million were up 34% year over year, representing 72% of Adjusted Revenue. • Product development expenses were $83 million on a GAAP basis and $53 million on a non-GAAP basis, up 17% and 22%, respectively, year |
TOTAL NET REVENUE
ADJUSTED REVENUE
Adjusted Revenue is defined as total net revenue less transaction-based revenue from Starbucks and transaction-based costs.
AS A PERCENTAGE OF GPV:
|
7
| over year. Similar to previous quarters, the increase was driven by personnel costs related to engineering, product, and design. • Sales and marketing expenses were $67 million on a GAAP basis and $61 million on a non-GAAP basis, both up 42% year over year. The increase was driven primarily by costs related to growth in the Cash app, increased marketing spend, and growth in our sales and go-to-market teams. Importantly, we continue to maintain a consistent payback period even as sales and marketing expenses have increased. • General and administrative expenses were $64 million on a GAAP basis and $52 million on a non-GAAP basis, up 23% and 33%, respectively, year over year. The increase was due primarily to personnel costs in legal, finance, compliance, and Square Capital business operations. • Transaction, loan, and advance losses were $20 million. Transaction losses as a percentage of GPV were 0.1%, in line with our historical average.
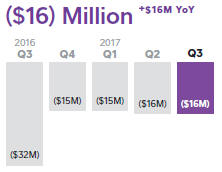
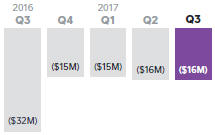
Net loss was $16 million in the third quarter of 2017, compared to a net loss of $32 million in the third quarter of 2016. Net loss per share, basic and diluted, was $0.04, compared to a net loss per share of $0.09 in the third quarter of 2016. We had 384 million weighted-average basic shares in the third quarter of 2017.
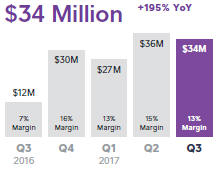
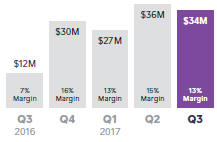
Adjusted EBITDA was $34 million in the third quarter of 2017, compared to $12 million in the third quarter of 2016, representing a 195% year-over-year increase. Third-quarter Adjusted EBITDA margin of 13% is an improvement of 7 percentage points year over year. Improvement in Adjusted EBITDA reflects strong top-line growth and ongoing operating expense leverage.
Adjusted Net Income Per Share (Adjusted EPS) was $0.07 based on 432 million weighted-average diluted shares for the third quarter of 2017. This represents an improvement of $0.06 from the third quarter of 2016.
Balance Sheet/Cash Flow
We ended the third quarter of 2017 with $1.1 billion in cash, cash equivalents, restricted cash, and investments in marketable securities, which is flat compared to the end of the second quarter of 2017. We also made an investment of $25 million in Eventbrite in the third quarter of 2017. |
NET INCOME (LOSS)
ADJUSTED EBITDA
A reconciliation of non-GAAP metrics used in this letter to their nearest GAAP equivalents is provided at the end of this letter. Adjusted EBITDA margin is calculated as Adjusted EBITDA divided by Adjusted Revenue.
Adjusted EPS is computed by dividing net loss, excluding transaction-based revenue and transaction-based costs related to Starbucks, share-based compensation expense, amortization of intangible assets, amortization of debt discount and issuance costs, loss on sale of property and equipment, and certain litigation settlement expenses, by the weighted-average number of shares of common stock during the period, including the dilutive effect of all potential shares. |
8
GUIDANCE:
Based on our year-to-date performance, we are raising our guidance for the full year.
| Q4
|
Current 2017
|
Previous 2017
| ||||
| Total net revenue |
$585M to $595M | $2.18B to $2.19B | $2.14B to $2.16B | |||
| Adjusted Revenue |
$262M to $265M | $963M to $966M | $925M to $935M | |||
| Adj. Revenue YoY growth (midpoint) |
37%
|
41%
|
35%
| |||
|
|
|
| ||||
| Adjusted EBITDA |
$34M to $37M | $132M to $135M | $120M to $128M | |||
| Adj. EBITDA margin (midpoint)
|
13%
|
14%
|
13%
| |||
|
|
|
| ||||
| Net income (loss) per share |
$(0.07) to $(0.06) | $(0.20) to $(0.19) | $(0.21) to $(0.19) | |||
| Adjusted EPS (diluted) |
$0.05 to $0.06 | $0.24 to $0.25 | $0.21 to $0.23 | |||
We have not reconciled Adjusted EBITDA, Adjusted EBITDA margin, and Adjusted EPS guidance to their GAAP equivalents as a result of the uncertainty regarding, and the potential variability of, reconciling items such as share-based compensation expense and weighted-average fully diluted shares outstanding. Accordingly, a reconciliation of these non-GAAP guidance metrics to their corresponding GAAP equivalents is not available without unreasonable effort. However, we have provided a reconciliation of GAAP to non-GAAP metrics in tables at the end of this letter. It is important to note that the actual amount of such reconciling items would have a significant impact if they were included in our Adjusted EBITDA, Adjusted EBITDA margin, and Adjusted EPS.
9
| Earnings Webcast
Square (NYSE:SQ) will host a conference call and earnings webcast at 2:00 p.m.
We will release financial results for the fourth quarter and full year of 2017 on |
MEDIA CONTACT press@squareup.com
INVESTOR RELATIONS CONTACT ir@squareup.com |

|

| |
| Jack Dorsey | Sarah Friar | |
| CEO | CFO |
1 Financial cards and payments in Canada, Euromonitor International, October 2016
2 Canadian Payment Methods and Trends Report finds cash is king, for now, November 2016
3 Square study conducted in the second quarter of 2017 of 1,670 Square sellers in Canada
10

|
“In our cake boutiques, Square helps us scale quickly with a point of sale that’s intuitive and elegantly designed. As our e-commerce business grows, we use Square to manage our boutique and online sales from one platform and create a personalized experience for our customers.
“As we expand Lady M across the country, our team can access real-time product, location, and sales data to make more informed business decisions.”
Ken Romaniszyn CEO Lady M Confections |
11
SAFE HARBOR STATEMENT
This letter contains forward-looking statements within the meaning of the Safe Harbor provisions of the Private Securities Litigation Reform Act of 1995. All statements other than statements of historical fact could be deemed forward-looking, including, but not limited to, statements regarding the future performance of Square, Inc. and its consolidated subsidiaries (the Company); the Company’s expected financial results for future periods; future growth in the Company’s businesses and products; the cessation of transaction-based revenue from Starbucks; the Company’s expectations regarding scale, profitability, and the demand for or benefits from its products, product features, and services in the U.S. and in international markets; the expected impact of the Company’s recent partnerships; and management’s statements related to business strategy, plans, and objectives for future operations. In some cases, forward-looking statements can be identified by terms such as “may,” “will,” “appears,” “should,” “expects,” “plans,” “anticipates,” “could,” “intends,” “target,” “projects,” “contemplates,” “believes,” “estimates,” “predicts,” “potential,” or “continue,” or the negative of these words or other similar terms or expressions that concern our expectations, strategy, plans, or intentions. Such statements are subject to a number of risks, uncertainties, and assumptions, and investors are cautioned not to place undue reliance on these statements. Actual results could differ materially from those expressed or implied, and reported results should not be considered as an indication of future performance.
Risks that contribute to the uncertain nature of the forward-looking statements include, among others, the Company’s ability to deal with the substantial and increasingly intense competition in its industry; changes to the rules and practices of payment card networks and acquiring processors; the effect of evolving regulations and oversight related to the Company’s provision of payments services and other financial services; the effect of management changes and business initiatives; and changes in political, business, and economic conditions; as well as other risks listed or described from time to time in the Company’s filings with the Securities and Exchange Commission (the SEC), including the Company’s Quarterly Report on Form 10-Q for the fiscal quarter ended June 30, 2017, which is on file with the SEC and available on the investor relations page of the Company’s website. Except as required by law, the Company assumes no obligation to update any of the statements in this letter.
KEY OPERATING METRICS AND NON-GAAP FINANCIAL MEASURES
To supplement our financial information presented in accordance with generally accepted accounting principles in the United States (GAAP), we consider certain operating and financial measures that are not prepared in accordance with GAAP, including Gross Payment Volume, Adjusted Revenue, Adjusted EBITDA, Adjusted EBITDA margin, Adjusted Net Income (Loss), and Adjusted EPS. We believe these metrics and measures are useful to facilitate period-to-period comparisons of our business and to facilitate comparisons of our performance to that of other payments solution providers. Each of these metrics and measures excludes the effect of our processing agreement with Starbucks, which transitioned to another payments solution provider in the fourth quarter of 2016. As a result, we believe it is useful to exclude Starbucks activity to clearly show the impact Starbucks has had on our financial results historically. Our agreements with other sellers generally provide both those sellers and us the unilateral right to terminate such agreements at any time, without fine or penalty.
We define Gross Payment Volume (GPV) as the total dollar amount of all card payments processed by sellers using Square, net of refunds. Additionally, GPV includes Square Cash activity related to peer-to-peer payments sent from a credit card, and Square Cash for Business. GPV excludes card payments processed for Starbucks.
Adjusted Revenue is a non-GAAP financial measure that we define as our total net revenue less transaction-based costs, adjusted to eliminate the effect of activity with Starbucks. As described above, Starbucks completed its previously announced transition to another payments solutions provider and has ceased using our payments solutions altogether, and we believe that providing Adjusted Revenue metrics that exclude the impact of our agreement with Starbucks is useful to investors. We believe it is useful to subtract transaction-based costs from total net revenue to derive Adjusted Revenue as this is a primary metric used by management to measure our business performance, and it affords greater comparability to other payments solution providers. Adjusted Revenue has limitations as a financial measure, should be considered as supplemental in nature, and is not meant as a substitute for the related financial information prepared in accordance with GAAP.
Adjusted EBITDA, Adjusted Net Income (Loss), and Adjusted EPS are non-GAAP financial measures that represent our net loss and net loss per share, adjusted to eliminate the effect of Starbucks transaction-based revenue, Starbucks transaction-based costs, share-based compensation expenses, amortization of intangible assets, amortization of debt discount and issuance costs in connection with our offering of convertible senior notes in the first quarter of 2017, the litigation settlement with Robert E. Morley, the gain or loss on the sale of property and equipment, and impairment of intangible assets. In addition to the items above, Adjusted EBITDA as a non-GAAP financial measure also excludes depreciation, other cash interest income and expense, other income and expense, and provision or benefit from income taxes. Basic Adjusted Net Income (Loss) Per Share is computed by dividing the Adjusted Net Income (Loss) by the weighted-average number of shares of common stock outstanding during the period. Diluted Adjusted Net Income Per Share is computed by dividing Adjusted Net Income by the weighted-average number of shares of common stock outstanding, adjusted for the dilutive effect of all potential shares. In periods when we recorded an Adjusted Net Loss, the Diluted Adjusted Net Loss Per Share is the same as Basic Adjusted Net Loss Per Share because the effects of potentially dilutive items were anti-dilutive given the Adjusted Net Loss position.
We have included Adjusted EBITDA and Adjusted EPS because they are key measures used by our management to evaluate our operating performance, generate future operating plans, and make strategic decisions, including those relating to operating expenses and the allocation of internal resources. Accordingly, we believe that Adjusted EBITDA and Adjusted EPS provide useful information to investors and others in understanding and evaluating our
12
operating results in the same manner as our management and board of directors. In addition, they provide useful measures for period-to-period comparisons of our business, as they remove the effect of certain non-cash items and certain variable charges. Adjusted EBITDA and Adjusted EPS have limitations as financial measures, should be considered as supplemental in nature, and are not meant as substitutes for the related financial information prepared in accordance with GAAP.
These non-GAAP financial measures should not be considered in isolation from, or as a substitute for, financial information prepared in accordance with GAAP. These non-GAAP financial measures are not based on any standardized methodology prescribed by GAAP and are not necessarily comparable to similarly titled measures presented by other companies.
13
| Condensed Consolidated Statements of Operations | UNAUDITED | |
| In thousands, except per share data |
| THREE MONTHS ENDED | NINE MONTHS ENDED | |||||||||||||||
| Sep 30, 2017 | Sep 30, 2016 | Sep 30, 2017 | Sep 30, 2016 | |||||||||||||
| Revenue: |
||||||||||||||||
| Transaction-based revenue |
$ | 510,019 | $ | 388,347 | $ | 1,395,562 | $ | 1,053,664 | ||||||||
| Starbucks transaction-based revenue |
— | 7,164 | — | 78,869 | ||||||||||||
| Subscription and services-based revenue |
65,051 | 35,320 | 173,262 | 88,833 | ||||||||||||
| Hardware revenue |
10,089 | 8,171 | 29,394 | 35,438 | ||||||||||||
|
|
|
|
|
|
|
|
||||||||||
| Total net revenue |
585,159 | 439,002 | 1,598,218 | 1,256,804 | ||||||||||||
|
|
|
|
|
|
|
|
||||||||||
| Cost of revenue: |
||||||||||||||||
| Transaction-based costs |
328,043 | 254,061 | 896,913 | 683,194 | ||||||||||||
| Starbucks transaction-based costs |
— | 4,528 | — | 69,810 | ||||||||||||
| Subscription and services-based costs |
18,169 | 12,524 | 51,161 | 31,701 | ||||||||||||
| Hardware costs |
18,775 | 15,689 | 45,610 | 56,444 | ||||||||||||
| Amortization of acquired technology |
1,556 | 1,886 | 5,058 | 6,142 | ||||||||||||
|
|
|
|
|
|
|
|
||||||||||
| Total cost of revenue |
366,543 | 288,688 | 998,742 | 847,291 | ||||||||||||
|
|
|
|
|
|
|
|
||||||||||
| Gross profit |
218,616 | 150,314 | 599,476 | 409,513 | ||||||||||||
|
|
|
|
|
|
|
|
||||||||||
| Operating expenses: |
||||||||||||||||
| Product development |
82,547 | 70,418 | 229,255 | 203,648 | ||||||||||||
| Sales and marketing |
66,533 | 46,754 | 176,349 | 124,470 | ||||||||||||
| General and administrative |
64,312 | 52,075 | 184,235 | 198,966 | ||||||||||||
| Transaction, loan and advance losses |
19,893 | 12,885 | 50,185 | 38,201 | ||||||||||||
| Amortization of acquired customer assets |
222 | 164 | 649 | 703 | ||||||||||||
|
|
|
|
|
|
|
|
||||||||||
| Total operating expenses |
233,507 | 182,296 | 640,673 | 565,988 | ||||||||||||
|
|
|
|
|
|
|
|
||||||||||
| Operating loss |
(14,891) | (31,982) | (41,197) | (156,475) | ||||||||||||
|
|
|
|
|
|
|
|
||||||||||
| Interest and other (income) expense, net |
1,854 | 111 | 5,619 | (933) | ||||||||||||
|
|
|
|
|
|
|
|
||||||||||
| Loss before income tax |
(16,745) | (32,093) | (46,816) | (155,542) | ||||||||||||
|
|
|
|
|
|
|
|
||||||||||
| Provision (benefit) for income taxes |
(647) | 230 | 334 | 881 | ||||||||||||
|
|
|
|
|
|
|
|
||||||||||
| Net loss |
$ | (16,098) | $ | (32,323) | $ | (47,150) | $ | (156,423) | ||||||||
|
|
|
|
|
|
|
|
||||||||||
| Net loss per share: |
||||||||||||||||
| Basic |
$ | (0.04) | $ | (0.09) | $ | (0.13) | $ | (0.46) | ||||||||
|
|
|
|
|
|
|
|
||||||||||
| Diluted |
$ | (0.04) | $ | (0.09) | $ | (0.13) | $ | (0.46) | ||||||||
|
|
|
|
|
|
|
|
||||||||||
| Weighted-average shares used to compute net loss per share: |
||||||||||||||||
| Basic |
383,951 | 343,893 | 375,743 | 336,593 | ||||||||||||
|
|
|
|
|
|
|
|
||||||||||
| Diluted |
383,951 | 343,893 | 375,743 | 336,593 | ||||||||||||
|
|
|
|
|
|
|
|
||||||||||
14
| Condensed Consolidated Balance Sheets | UNAUDITED In thousands, except share and per share data |
| Assets | Sep 30, 2017 | Dec 31, 2016 | ||||||||
| Current assets: | ||||||||||
| Cash and cash equivalents |
$ | 658,412 | $ | 452,030 | ||||||
| Short-term investments |
|
209,959 | 59,901 | |||||||
| Restricted cash |
20,533 | 22,131 | ||||||||
| Settlements receivable |
587,630 | 321,102 | ||||||||
| Customer funds |
85,473 | 43,574 | ||||||||
| Loans held for sale |
58,331 | 42,144 | ||||||||
| Other current assets |
66,539 | 60,543 | ||||||||
|
|
|
|
||||||||
| Total current assets | 1,686,877 | 1,001,425 | ||||||||
|
|
|
|
||||||||
| Property and equipment, net | 88,666 | 88,328 | ||||||||
| Goodwill | 57,961 | 57,173 | ||||||||
| Acquired intangible assets, net | 14,648 | 19,292 | ||||||||
| Long-term investments | 191,335 | 27,366 | ||||||||
| Restricted cash | 14,565 | 14,584 | ||||||||
| Other non-current assets | 29,800 | 3,194 | ||||||||
|
|
|
|
||||||||
| Total assets | $ | 2,083,852 | $ | 1,211,362 | ||||||
|
|
|
|
||||||||
| Liabilities and Stockholders’ Equity | ||||||||||
| Current liabilities: | ||||||||||
| Accounts payable |
$ | 13,529 | $ | 12,602 | ||||||
| Customers payable |
727,341 | 431,632 | ||||||||
| Settlements payable |
81,414 | 51,151 | ||||||||
| Accrued transaction losses |
26,720 | 20,064 | ||||||||
| Accrued expenses |
60,626 | 39,543 | ||||||||
| Other current liabilities |
21,049 | 22,472 | ||||||||
|
|
|
|
||||||||
| Total current liabilities | 930,679 | 577,464 | ||||||||
|
|
|
|
||||||||
| Long-term debt | 354,237 | — | ||||||||
| Other non-current liabilities | 66,027 | 57,745 | ||||||||
|
|
|
|
||||||||
| Total liabilities | 1,350,943 | 635,209 | ||||||||
|
|
|
|
||||||||
| Stockholders’ equity: | ||||||||||
| Preferred stock, $0.0000001 par value: 100,000,000 shares authorized at September |
||||||||||
| 30, 2017, and December 31, 2016. None issued and outstanding at September 30, 2017, and December 31, 2016. |
— | — | ||||||||
| Class A common stock, $0.0000001 par value: 1,000,000,000 shares authorized at |
||||||||||
| September 30, 201 7, and December 31, 2016; 263,379,421 and 198,746,620 issued and outstanding at September 30, 2017, and December 31, 2016, respectively. |
— | — | ||||||||
| Class B common stock, $0.0000001 par value: 500,000,000 shares authorized at |
||||||||||
| September 30, 2017, and December 31, 2016; 124,422,721 and 165,800,756 issued and outstanding at September 30, 2017, and December 31, 2016, respectively. |
— | — | ||||||||
| Additional paid-in capital |
1,560,374 | 1,357,381 | ||||||||
| Accumulated deficit |
(827,072) | (779,239) | ||||||||
| Accumulated other comprehensive loss |
(393) | (1,989) | ||||||||
|
|
|
|
||||||||
| Total stockholders’ equity | 732,909 | 576,153 | ||||||||
|
|
|
|
||||||||
| Total liabilities and stockholders’ equity | $ | 2,083,852 | $ | 1,211,362 | ||||||
|
|
|
|
||||||||
15
| Condensed Consolidated Statements of Cash Flows | UNAUDITED In thousands |
| NINE MONTHS ENDED | ||||||||||
| Cash Flows from Operating Activities | Sep 30, 2017 | Sep 30, 2016 | ||||||||
| Net loss | $ | (47,150) | $ | (156,423) | ||||||
| Adjustments to reconcile net loss to net cash provided by operating activities: | ||||||||||
| Depreciation and amortization |
27,647 | 27,817 | ||||||||
| Non-cash interest and other expense |
9,969 | (88) | ||||||||
| Share-based compensation |
111,311 | 104,899 | ||||||||
| Transaction, loan and advance losses |
50,185 | 38,201 | ||||||||
| Deferred provision for income taxes |
133 | (104) | ||||||||
| Changes in operating assets and liabilities: |
||||||||||
| Settlements receivable |
(271,235) | (92,207) | ||||||||
| Customer funds |
(41,899) | (19,000) | ||||||||
| Purchase of loans held for sale |
(874,498) | (421,243) | ||||||||
| Sales and principal payments of loans held for sale |
852,187 | 393,221 | ||||||||
| Other current assets |
(6,262) | 24,685 | ||||||||
| Other non-current assets |
(1,699) | 145 | ||||||||
| Accounts payable |
1,223 | (867) | ||||||||
| Customers payable |
295,406 | 139,105 | ||||||||
| Settlements payable |
30,263 | 14,410 | ||||||||
| Charge-offs to accrued transaction losses |
(33,081) | (32,623) | ||||||||
| Accrued expenses |
20,328 | 86 | ||||||||
| Other current liabilities |
(1,125) | 845 | ||||||||
| Other non-current liabilities |
8,614 | 2,376 | ||||||||
|
|
|
|
||||||||
| Net cash provided by operating activities |
130,317 | 23,235 | ||||||||
|
|
|
|
||||||||
| Cash Flows from Investing Activities | ||||||||||
| Purchase of marketable securities |
(485,484) | (139,103) | ||||||||
| Proceeds from maturities of marketable securities |
106,079 | 26,268 | ||||||||
| Proceeds from sale of marketable securities |
65,121 | 20,962 | ||||||||
| Purchase of property and equipment |
(19,625) | (19,674) | ||||||||
| Payment for investment in privately held entity |
(25,000) | — | ||||||||
| Payment for acquisition of intangible assets |
— | (400) | ||||||||
| Business acquisitions, net of cash acquired |
(1,600) | — | ||||||||
|
|
|
|
||||||||
| Net cash used in investing activities: |
(360,509) | (111,947) | ||||||||
|
|
|
|
||||||||
16
| Condensed Consolidated Statements of Cash Flows (continued) | UNAUDITED In thousands |
| NINE MONTHS ENDED | ||||||||||
| Cash Flows from Financing Activities | Sep 30, 2017 | Sep 30, 2016 | ||||||||
| Proceeds from issuance of convertible senior notes, net |
428,250 | — | ||||||||
| Purchase of convertible senior note hedges |
(92,136) | — | ||||||||
| Proceeds from issuance of warrants |
57,244 | — | ||||||||
| Payment for termination of Starbucks warrant |
(54,808) | — | ||||||||
| Principal payments on capital lease obligation |
(1,020) | — | ||||||||
| Payments of offering costs related to initial public offering |
— | (5,530) | ||||||||
| Proceeds from the exercise of stock options and purchases under the employee stock purchase plan, net |
111,889 | 48,304 | ||||||||
| Payments for tax withholding related to vesting of restricted stock units |
(18,298) | — | ||||||||
|
|
|
|
||||||||
| Net cash provided by financing activities |
431,121 | 42,774 | ||||||||
|
|
|
|
||||||||
| Effect of foreign exchange rate changes on cash and cash equivalents |
3,836 | 2,536 | ||||||||
|
|
|
|
||||||||
| Net increase (decrease) in cash, cash equivalents and restricted cash |
204,765 | (43,402) | ||||||||
| Cash, cash equivalents and restricted cash, beginning of period | 488,745 | 489,552 | ||||||||
|
|
|
|
||||||||
| Cash, cash equivalents and restricted cash, end of period | $ | 693,510 | $ | 446,150 | ||||||
|
|
|
|
||||||||
17
| Key Operating Metrics and Non-GAAP Financial Measures | UNAUDITED | |
| In thousands, except GPV and per share data |
| THREE MONTHS ENDED | NINE MONTHS ENDED | |||||||||||||||
| Sep 30, 2017 | Sep 30, 2016 | Sep 30, 2017 | Sep 30, 2016 | |||||||||||||
| Gross Payment Volume (GPV) (in millions) | $ | 17,386 | $ | 13,248 | $ | 47,454 | $ | 35,989 | ||||||||
| Adjusted Revenue | $ | 257,116 | $ | 177,777 | $ | 701,305 | $ | 494,741 | ||||||||
| Adjusted EBITDA | $ | 34,304 | $ | 11,623 | $ | 97,825 | $ | 15,094 | ||||||||
| Adjusted Net Income (Loss) Per Share: | ||||||||||||||||
| Basic |
$ | 0.08 | $ | 0.01 | $ | 0.21 | $ | (0.02) | ||||||||
| Diluted |
$ | 0.07 | $ | 0.01 | $ | 0.19 | $ | (0.02) | ||||||||
|
Adjusted Revenue Reconciliation |
UNAUDITED | |||||||||||||||
| |
In thousands |
|
||||||||||||||
| THREE MONTHS ENDED | NINE MONTHS ENDED | |||||||||||||||
| Sep 30, 2017 | Sep 30, 2016 | Sep 30, 2017 | Sep 30, 2016 | |||||||||||||
| Total net revenue | $ | 585,159 | $ | 439,002 | $ | 1,598,218 | $ | 1,256,804 | ||||||||
| Less: Starbucks transaction-based revenue | — | 7,164 | — | 78,869 | ||||||||||||
| Less: transaction-based costs | 328,043 | 254,061 | 896,913 | 683,194 | ||||||||||||
|
|
|
|
|
|
|
|
||||||||||
| Adjusted Revenue |
$ | 257,116 | $ | 177,777 | $ | 701,305 | $ | 494,741 | ||||||||
|
|
|
|
|
|
|
|
||||||||||
|
Adjusted EBITDA Reconciliation |
UNAUDITED | |||||||||||||||
|
|
In thousands
|
| ||||||||||||||
| THREE MONTHS ENDED | NINE MONTHS ENDED | |||||||||||||||
| Sep 30, 2017 | Sep 30, 2016 | Sep 30, 2017 | Sep 30, 2016 | |||||||||||||
| Net loss | $ | (16,098) | $ | (32,323) | $ | (47,150) | $ | (156,423) | ||||||||
| Starbucks transaction-based revenue | — | (7,164) | — | (78,869) | ||||||||||||
| Starbucks transaction-based costs | — | 4,528 | — | 69,810 | ||||||||||||
| Share-based compensation expense | 40,048 | 36,779 | 111,311 | 104,899 | ||||||||||||
| Depreciation and amortization | 9,085 | 9,681 | 27,647 | 27,817 | ||||||||||||
| Litigation settlement expense | — | — | — | 48,000 | ||||||||||||
| Interest and other (income) expense, net | 1,854 | 111 | 5,619 | (933) | ||||||||||||
| Provision (benefit) for income taxes | (647) | 230 | 334 | 881 | ||||||||||||
| Gain (loss) on sale of property and equipment | 62 | (219) | 64 | (88) | ||||||||||||
|
|
|
|
|
|
|
|
||||||||||
| Adjusted EBITDA |
$ | 34,304 | $ | 11,623 | $ | 97,825 | $ | 15,094 | ||||||||
|
|
|
|
|
|
|
|
||||||||||
18
| Adjusted Net Income (Loss) Reconciliation | UNAUDITED | |
| In thousands, except per share data |
| THREE MONTHS ENDED | NINE MONTHS ENDED | |||||||||||||||
| Sep 30, 2017 | Sep 30, 2016 | Sep 30, 2017 | Sep 30, 2016 | |||||||||||||
| Net loss | $ | (16,098) | $ | (32,323) | $ | (47,150) | $ | (156,423) | ||||||||
| Starbucks transaction-based revenue | — | (7,164) | — | (78,869) | ||||||||||||
| Starbucks transaction-based costs | — | 4,528 | — | 69,810 | ||||||||||||
| Share-based compensation expense | 40,048 | 36,779 | 111,311 | 104,899 | ||||||||||||
| Amortization of intangible assets | 1,804 | 2,076 | 5,868 | 6,924 | ||||||||||||
| Litigation settlement expense | — | — | — | 48,000 | ||||||||||||
| Amortization of debt discount and issuance costs | 4,277 | — | 9,889 | — | ||||||||||||
| Gain (loss) on sale of property and equipment | 62 | (219) | 64 | (88) | ||||||||||||
|
|
|
|
|
|
|
|
||||||||||
| Adjusted Net Income (Loss) |
$ | 30,093 | $ | 3,677 | $ | 79,982 | $ | (5,747) | ||||||||
|
|
|
|
|
|
|
|
||||||||||
| Adjusted Net Income (Loss) Per Share: |
||||||||||||||||
| Basic |
$ | 0.08 | $ | 0.01 | $ | 0.21 | $ | (0.02) | ||||||||
|
|
|
|
|
|
|
|
||||||||||
| Diluted |
$ | 0.07 | $ | 0.01 | $ | 0.19 | $ | (0.02) | ||||||||
|
|
|
|
|
|
|
|
||||||||||
|
Weighted-average shares used to compute Adjusted Net Income (Loss) |
||||||||||||||||
| Per Share: |
||||||||||||||||
|
Basic |
383,951 | 343,893 | 375,743 | 336,593 | ||||||||||||
|
|
|
|
|
|
|
|
||||||||||
| Diluted |
432,284 | 370,746 | 418,419 | 336,593 | ||||||||||||
|
|
|
|
|
|
|
|
||||||||||
| Adjusted Revenue Guidance Reconciliation | UNAUDITED | |
| In thousands |
| THREE MONTHS ENDED | YEAR ENDED | |||||||
| Dec 31, 2017 | Dec 31, 2017 | |||||||
| Total net revenue | $ | 585,000 -595,000 | $ | 2,183,218 - 2,193,218 | ||||
| Less: Transaction-based costs | 323,000 - 330,000 | 1,219,913 - 1,226,913 | ||||||
|
|
|
|
||||||
| Adjusted Revenue |
$ | 262,000 -265,000 | $ | 963,305 - 966,305 | ||||
|
|
|
|
||||||
19
| Non-GAAP Operating Expenses | |
UNAUDITED In thousands, |
|
| THREE MONTHS ENDED | NINE MONTHS ENDED | |||||||||||||||
| Sep 30, 2017 | Sep 30, 2016 | Sep 30, 2017 | Sep 30, 2016 | |||||||||||||
| Operating expenses | $ | (233,507) | $ | (182,296) | $ | (640,673) | $ | (565,988) | ||||||||
| Share-based compensation | 40,019 | 36,779 | 111,264 | 104,899 | ||||||||||||
| Depreciation and amortization | 7,498 | 7,230 | 22,429 | 19,992 | ||||||||||||
| Litigation settlement expense | — | — | — | 48,000 | ||||||||||||
| Loss (gain) on sale of fixed assets | 62 | (219) | 64 | (88) | ||||||||||||
|
|
|
|
|
|
|
|
||||||||||
| Non-GAAP operating expenses |
$ | (185,928) | $ | (138,506) | $ | (506,916) | $ | (393,185) | ||||||||
|
|
|
|
|
|
|
|
||||||||||
| Product development | $ | (82,547) | $ | (70,418) | $ | (229,255) | $ | (203,648) | ||||||||
| Share-based compensation | 25,254 | 23,949 | 69,746 | 70,064 | ||||||||||||
| Depreciation and amortization | 4,586 | 3,282 | 11,734 | 9,551 | ||||||||||||
| Loss (gain) on sale of fixed assets | — | (169) | — | — | ||||||||||||
|
|
|
|
|
|
|
|
||||||||||
| Non-GAAP product development |
$ | (52,707) | $ | (43,356) | $ | (147,775) | $ | (124,033) | ||||||||
|
|
|
|
|
|
|
|
||||||||||
| Sales and marketing | $ | (66,533) | $ | (46,754) | $ | (176,349) | $ | (124,470) | ||||||||
| Share-based compensation | 4,579 | 3,697 | 12,869 | 9,963 | ||||||||||||
| Depreciation and amortization | 650 | 5 | 825 | 13 | ||||||||||||
| Loss (gain) on sale of fixed assets | 62 | 14 | 122 | 32 | ||||||||||||
|
|
|
|
|
|
|
|
||||||||||
| Non-GAAP sales and marketing |
$ | (61,242) | $ | (43,038) | $ | (162,533) | $ | (114,462) | ||||||||
|
|
|
|
|
|
|
|
||||||||||
| General and administrative | $ | (64,312) | $ | (52,075) | $ | (184,235) | $ | (198,966) | ||||||||
| Share-based compensation | 10,186 | 9,133 | 28,649 | 24,872 | ||||||||||||
| Depreciation and amortization | 2,040 | 3,779 | 9,221 | 9,725 | ||||||||||||
| Litigation settlement expense | — | — | — | 48,000 | ||||||||||||
| Loss (gain) on sale of fixed assets | — | (64) | (58) | (120) | ||||||||||||
|
|
|
|
|
|
|
|
||||||||||
| Non-GAAP general and administrative |
$ | (52,086) | $ | (39,227) | $ | (146,423) | $ | (116,489) | ||||||||
|
|
|
|
|
|
|
|
||||||||||
| Depreciation and Amortization by Function | |
UNAUDITED In thousands, |
|
| THREE MONTHS ENDED | NINE MONTHS ENDED | |||||||||||||||
| Sep 30, 2017 | Sep 30, 2016 | Sep 30, 2017 | Sep 30, 2016 | |||||||||||||
| Cost of revenue | $ | 1,587 | $ | 2,451 | $ | 5,218 | $ | 7,825 | ||||||||
| Product development | 4,586 | 3,282 | 11,734 | 9,551 | ||||||||||||
| Sales and marketing | 650 | 5 | 825 | 13 | ||||||||||||
| General and administrative | 2,040 | 3,779 | 9,221 | 9,725 | ||||||||||||
| Amortization of acquired customer assets | 222 | 164 | 649 | 703 | ||||||||||||
|
|
|
|
|
|
|
|
||||||||||
| Total depreciation and amortization |
$ | 9,085 | $ | 9,681 | $ | 27,647 | $ | 27,817 | ||||||||
|
|
|
|
|
|
|
|
||||||||||
20