Attached files
| file | filename |
|---|---|
| EX-99.1 - EXHIBIT 99.1 - Prestige Consumer Healthcare Inc. | exhibit991fy18-q2earningsr.htm |
| EX-10.1 - EXHIBIT 10.1 - Prestige Consumer Healthcare Inc. | exhibit101pbhexecutiveseve.htm |
| 8-K - 8-K - Prestige Consumer Healthcare Inc. | a8-kpressreleaseseptember3.htm |

Exhibit 99.2

This presentation contains certain “forward-looking” statements within the meaning of the Private Securities Litigation Reform Act of 1995, such
as statements regarding the Company’s expected financial performance, including revenue growth, adjusted EPS, and adjusted free cash flow;
the Company’s expected leverage and ability to de-lever; the market position and consumption trends for the Company’s brands; the Company’s
focus on brand-building; and the Company’s expectations regarding delivery patterns. Words such as “trend,” “continue,” “will,” “expect,” “project,”
“anticipate,” “likely,” “estimate,” “may,” “should,” “could,” “would,” and similar expressions identify forward-looking statements. Such forward-
looking statements represent the Company’s expectations and beliefs and involve a number of known and unknown risks, uncertainties and
other factors that may cause actual results to differ materially from those expressed or implied by such forward-looking statements. These
factors include, among others, general economic and business conditions, regulatory matters, competitive pressures, supplier issues, disruptions
to distribution, unexpected costs or liabilities, and other risks set forth in Part I, Item 1A. Risk Factors in the Company’s Annual Report on Form 10-
K for the year ended March 31, 2017. You are cautioned not to place undue reliance on these forward-looking statements, which speak only as of
the date this presentation. Except to the extent required by applicable law, the Company undertakes no obligation to update any forward-looking
statement contained in this presentation, whether as a result of new information, future events, or otherwise.
All adjusted GAAP numbers presented are footnoted and reconciled to their closest GAAP measurement in the attached reconciliation schedules
or in our November 2, 2017 earnings release in the “About Non-GAAP Financial Measures” section.


Q2 Revenue of $258.0 million, up 20.0% versus PY Q2
Revenue decline of 0.3%(1) pro forma for the Fleet acquisition
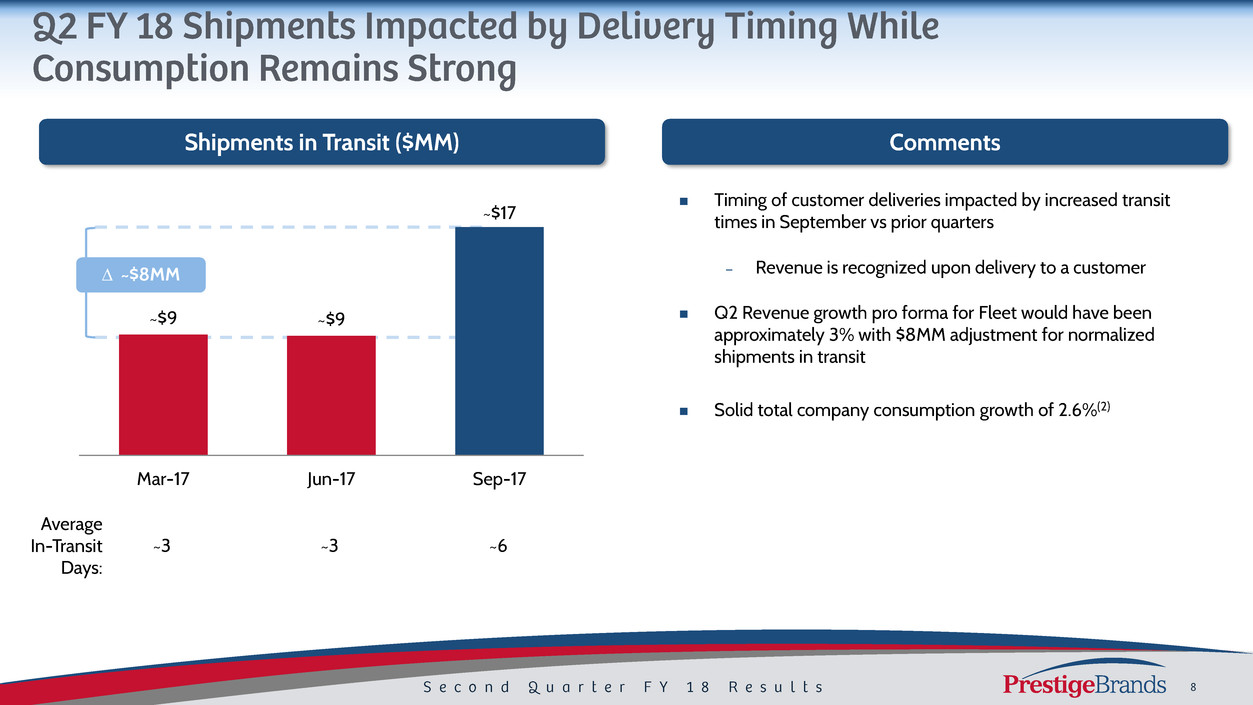
– Revenue impacted by ~$8 million from timing of customer deliveries at quarter-end
– Expect delivery patterns to normalize over the next few months
Organic Revenue growth met expectations excluding impact of increased delivery times
Solid total company consumption growth of +2.6%(2)
Adjusted Gross Margin of 56.3%(3) in line with expectations
Adjusted EPS of $0.61(3)
Continued solid Adjusted Free Cash Flow of $54.8 million(3), resulting in leverage of 5.5x(4)
Fleet focus fully shifted to brand building and supply chain opportunities
Continued de-leveraging in the second half, building future M&A capacity
Consistent pipeline of M&A opportunities in the market


Shipments in Transit ($MM) Comments
Timing of customer deliveries impacted by increased transit
times in September vs prior quarters
– Revenue is recognized upon delivery to a customer
Q2 Revenue growth pro forma for Fleet would have been
approximately 3% with $8MM adjustment for normalized
shipments in transit
Solid total company consumption growth of 2.6%(2)
~$9 ~$9
~$17
Mar-17 Jun-17 Sep-17
~3 ~3 ~6
Average
In-Transit
Days:
~$8MM

Category Leading, Trusted Brands
On Trend & Innovative
Retail Traffic Driver
E-Commerce Brand of Choice
#1 share brands
represent ~60% of sales
Brands drive long-term
category growth
Consumer driven
innovation
Aligned with macro-
Health & Wellness trend
Need-based products
sought by consumers
Retail channel
agnostic
Channel remains an
opportunity, not a
threat
Ongoing channel
investments

Strong Innovation Pipeline
Ongoing brand initiatives driven by
consumer insights
Simply launched spring 2017; largely
incremental to brand and category
Appealing to younger, millennial
consumers
Significant Runway for Growth
2017
Target
Household penetration long-term
opportunity
Many non-users willing to try
Brand building playbook developed
% of Households Buying
Single Digit
Category Leadership*
CategoryFeminin Hygiene
Category
All Other
Retail Dollar Sales Growth
Private Label
Feminine Hygiene Market Share
~2x
*IRI MULO L52 week period ending 9/10/17.


Overall financial performance in Q2 and 1H FY 18 impacted by timing of deliveries
− Q2 Revenue of $258.0 million, an increase of 20.0% vs prior year
− Q2 Adjusted EBITDA(3) of $86.5 million, an increase of 10.7% vs prior year
− Q2 Adjusted EPS of $0.61(3), a decrease of 3.2% vs prior year, and 1H 2018 Adjusted EPS of $1.27(3), up 4.1% vs prior year
$258.0
$86.5
$215.1
$78.1
Total Revenue Adjusted EBITDA Adjusted EPS
Q2 FY 18 Q2 FY 17
20.0%
10.7% (3.2%)
$0.61 $0.63
(3) (3)
Dollar values in millions, except per share data.
$514.6
$177.2
$424.6
$154.7
Total Revenue Adjusted EBITDA Adjusted EPS
1H FY 18 1H FY 17
21.2%
14.5% 4.1%
$1.27 $1.22
(3) (3)

Q2 FY 18 Q2 FY 17 % Chg Q2 FY 18 Q2 FY 17 % Chg
Total Revenue 258.0$ 215.1$ 20.0% 514.6$ 424.6$ 21.2%
Adjusted Gross Margin 145.2 124.0 17.2% 291.3 245.6 18.6%
% Margin 56.3% 57.6% 56.6% 57.8%
Adjusted A&P 39.4 28.6 37.9% 76.3 56.2 35.7%
% Total Revenue 15.3% 13.3% 14.8% 13.2%
Adjusted G&A 20.7 17.3 19.7% 40.4 34.6 16.8%
% Total Revenue 8.0% 8.0% 7.9% 8.1%
D&A (ex. COGS D&A) 7.2 6.0 19.4% 14.4 12.8 11.7%
% Total Revenue 2.8% 2.8% 2.8% 3.0%
Adjusted Operating Income 78.0$ 72.1$ 8.1% 160.2$ 141.9$ 12.9%
% Margin 30.2% 33.5% 31.1% 33.4%
Adjusted Earnings Per Share 0.61$ 0.63$ (3.2%) 1.27$ 1.22$ 4.1%
Adjusted EBITDA 86.5$ 78.1$ 10.7% 177.2$ 154.7$ 14.5%
% Margin 33.5% 36.3% 34.4% 36.4%
Revenue growth of +20.0%
– Revenue decline of 0.3%(1)
pro forma for Fleet, due to a
meaningful increase in
transit times in September
– Fleet contributed $51.7
million of Revenue during
the quarter
Adjusted Gross Margin(3) of 56.3%
Adjusted A&P(3) 15.3% of
Revenue, $10.8 million more
than Q2 FY 17
Dollar values in millions, except per share data.
(3)
(3)
(3)
(3)
(3)
(3)

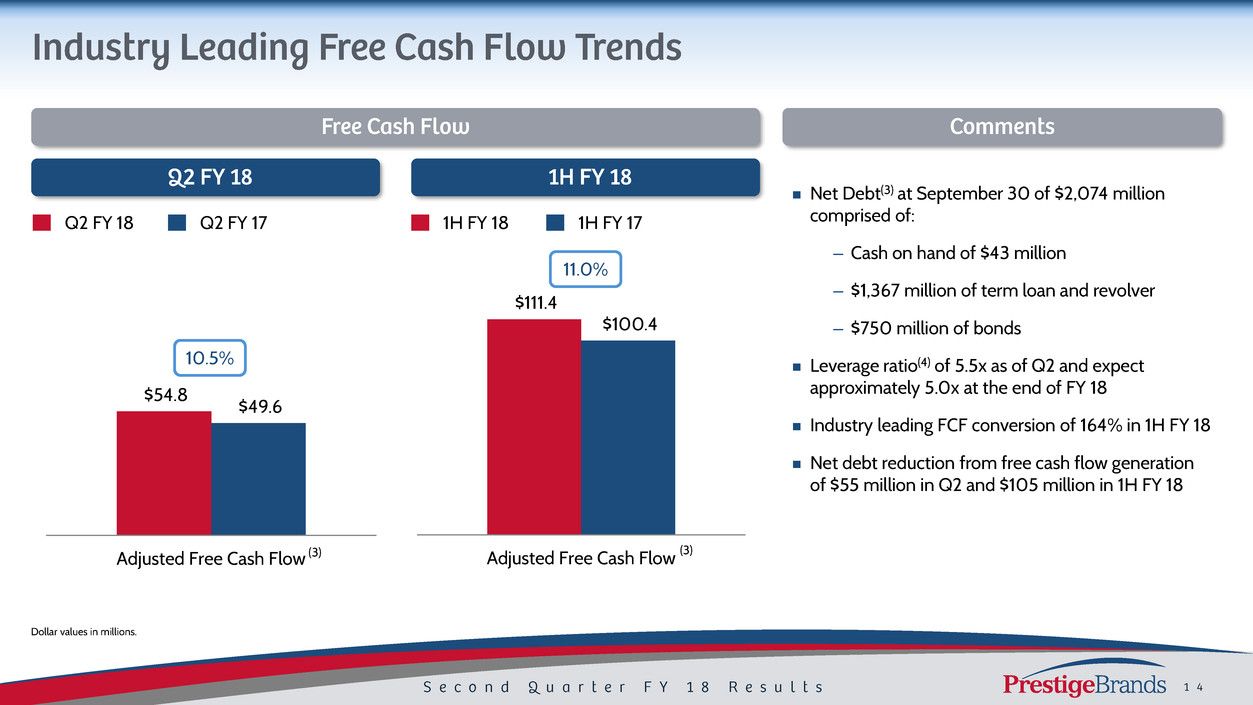
Net Debt(3) at September 30 of $2,074 million
comprised of:
– Cash on hand of $43 million
– $1,367 million of term loan and revolver
– $750 million of bonds
Leverage ratio(4) of 5.5x as of Q2 and expect
approximately 5.0x at the end of FY 18
Industry leading FCF conversion of 164% in 1H FY 18
Net debt reduction from free cash flow generation
of $55 million in Q2 and $105 million in 1H FY 18
Q2 FY 18 Q2 FY 17 1H FY 18 1H FY 17
$54.8
$49.6
Adjusted Free Cash Flow
$111.4
$100.4
Adjusted Free Cash Flow
11.0%
10.5%
(3) (3)
Dollar values in millions.


Continued solid consumption trends in our largest and category leading brands
Continue to gain share across portfolio
A focus on winning with the consumer continues positions us for long-term growth despite continued
headwinds at retail
Revenue growth of +18% to +20% ($1,040 to $1,060 million)
Pro forma for the Fleet acquisition, Revenue growth of +2.0% to +2.5%
FY 18 Revenue outlook implies growth of +1.2% in 1H and +2.8% to +3.8% in 2H pro forma for Fleet
– Exclusive of revenue timing shift, 2H FY 18 growth of +1.2% to +2.2%
Adjusted EPS +9% to +13% ($2.58 to $2.68 per share)(5)
Adjusted Free Cash Flow of $205 million or more(6)
Dollar values in millions, except per share data.


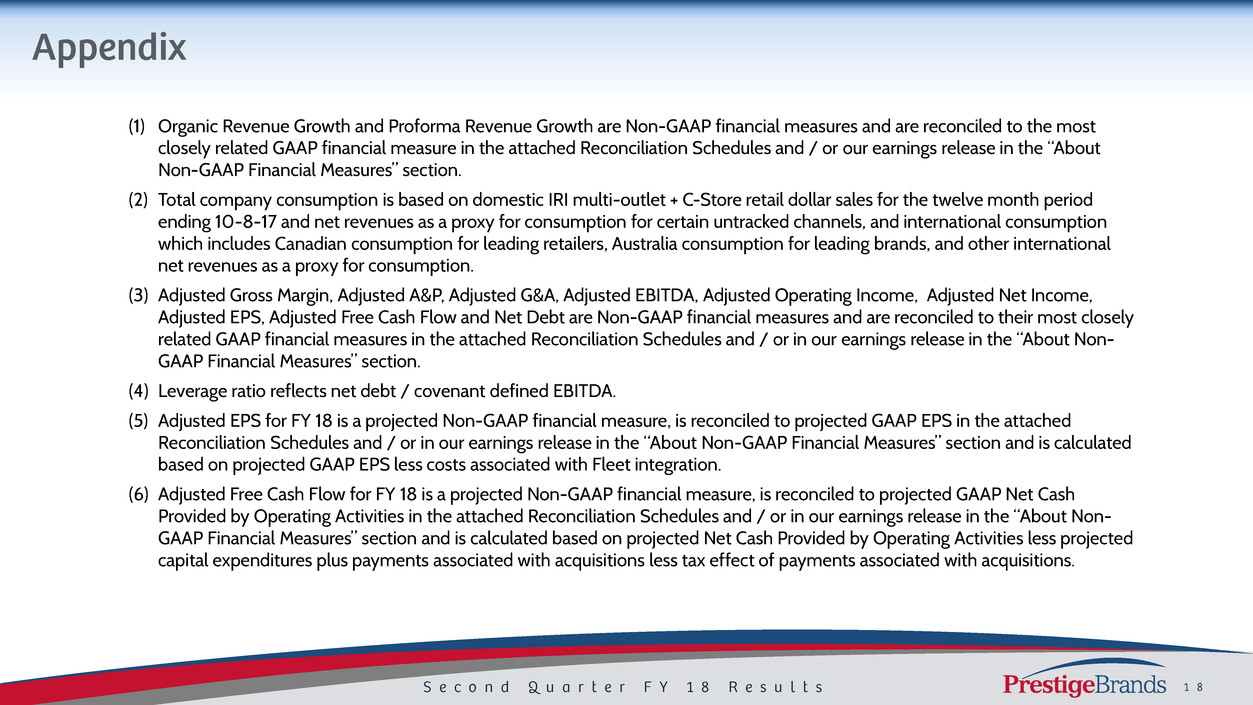
(1) Organic Revenue Growth and Proforma Revenue Growth are Non-GAAP financial measures and are reconciled to the most
closely related GAAP financial measure in the attached Reconciliation Schedules and / or our earnings release in the “About
Non-GAAP Financial Measures” section.
(2) Total company consumption is based on domestic IRI multi-outlet + C-Store retail dollar sales for the twelve month period
ending 10-8-17 and net revenues as a proxy for consumption for certain untracked channels, and international consumption
which includes Canadian consumption for leading retailers, Australia consumption for leading brands, and other international
net revenues as a proxy for consumption.
(3) Adjusted Gross Margin, Adjusted A&P, Adjusted G&A, Adjusted EBITDA, Adjusted Operating Income, Adjusted Net Income,
Adjusted EPS, Adjusted Free Cash Flow and Net Debt are Non-GAAP financial measures and are reconciled to their most closely
related GAAP financial measures in the attached Reconciliation Schedules and / or in our earnings release in the “About Non-
GAAP Financial Measures” section.
(4) Leverage ratio reflects net debt / covenant defined EBITDA.
(5) Adjusted EPS for FY 18 is a projected Non-GAAP financial measure, is reconciled to projected GAAP EPS in the attached
Reconciliation Schedules and / or in our earnings release in the “About Non-GAAP Financial Measures” section and is calculated
based on projected GAAP EPS less costs associated with Fleet integration.
(6) Adjusted Free Cash Flow for FY 18 is a projected Non-GAAP financial measure, is reconciled to projected GAAP Net Cash
Provided by Operating Activities in the attached Reconciliation Schedules and / or in our earnings release in the “About Non-
GAAP Financial Measures” section and is calculated based on projected Net Cash Provided by Operating Activities less projected
capital expenditures plus payments associated with acquisitions less tax effect of payments associated with acquisitions.

Three Months Ended Sept. 30, Six Months Ended Sept. 30,
2017 2016 2017 2016
(In Thousands)
GAAP Total Revenues 258,026$ 215,052$ 514,599$ 424,627$
Revenue Growth 20.0% 21.2%
Adjustments:
Revenue associated with acquisitions (51,662) - (106,549) -
Revenues associated with divested brands - (5,945) - (16,984)
Non-GAAP Organic Revenues 206,364$ 209,107$ 408,050$ 407,643$
Non-GAAP Organic Revenue Growth (1.3%) 0.1%
Non-GAAP Organic Revenues 206,364$ 209,107$ 408,050$ 407,643$
Revenues associated with acquisitions 51,662 49,798 106,549 100,999
Non-GAAP Proforma Revenues 258,026$ 258,905$ 514,599$ 508,642$
Non-GAAP Proforma Revenue Growth (0.3%) 1.2%

Three Months Ended Sept. 30, Six Months Ended Sept. 30,
2017 2016 2017 2016
(In Thousands)
GAAP Total Revenues 258,026$ 215,052$ 514,599$ 424,627$
GAAP Gross Profit 144,098$ 123,965$ 287,574$ 245,556$
Adjustments:
Integration, transition and other costs associated with
acquisitions 1,143 - 3,719 -
Total adjustments 1,143 - 3,719 -
Non-GAAP Adjusted Gross Margin 145,241$ 123,965$ 291,293$ 245,556$
Non-GAAP Adjusted Gross Margin as a Percentage of GAAP Total
Revenues 56.3% 57.6% 56.6% 57.8%

Three Months Ended Sept. 30, Six Months Ended Sept. 30,
2017 2016 2017 2016
(In Thousands)
GAAP Advertising and Promotion Expense 39,188$ 28,592$ 76,132$ 56,227$
GAAP Advertising and Promotion Expense as a Percentage of
GAAP Total Revenue 15.2% 13.3% 14.8% 13.2%
Adjustments:
Integration, transition and other costs associated with
acquisitions (231) - (192) -
Total adjustments (231) - (192) -
Non-GAAP Adjusted Advertising and Promotion Expense 39,419$ 28,592$ 76,324$ 56,227$
Non-GAAP Adjusted Advertising and Promotion Expense as a
Percentage of GAAP Total Revenues 15.3% 13.3% 14.8% 13.2%

Three Months Ended Sept. 30, Six Months Ended Sept. 30,
2017 2016 2017 2016
(In Thousands)
GAAP General and Administrative Expense 21,567$ 18,795$ 41,903$ 38,252$
GAAP General and Administrative Expense as a Percentage of
GAAP Total Revenue 8.4% 8.7% 8.1% 9.0%
Adjustments:
Integration, transition and other costs associated with
acquisitions and divestitures 888 1,521 1,472 3,646
Total adjustments 888 1,521 1,472 3,646
Non-GAAP Adjusted General and Administrative Expense 20,679$ 17,274$ 40,431$ 34,606$
Non-GAAP Adjusted General and Administrative Expense
Percentage as a Percentage of GAAP Total Revenues 8.0% 8.0% 7.9% 8.1%

Three Months Ended Sept. 30, Six Months Ended Sept. 30,
2017 2016 2017 2016
(In Thousands)
GAAP Net Income 30,705$ 32,195$ 64,464$ 26,664$
Interest expense, net 26,836 20,830 53,177 41,957
Provision for income taxes 18,616 18,033 37,545 14,651
Depreciation and amortization 8,534 6,016 17,041 12,848
Non-GAAP EBITDA 84,691 77,074 172,227 96,120
Non-GAAP EBITDA Margin 32.8% 35.8% 33.5% 22.6%
Adjustments:
Integration, transition and other costs associated with acquisitions
and divestitures in Cost of Goods Sold 1,143 - 3,719 -
Integration, transition and other costs associated with acquisitions
and divestitures in Advertising and Promotion Expense (231) - (192) -
Integration, transition and other costs associated with acquisitions
and divestitures in General and Administrative Expense 888 1,521 1,472 3,646
(Gain) loss on divestitures - (496) - 54,957
Total adjustments 1,800 1,025 4,999 58,603
Non-GAAP Adjusted EBITDA 86,491$ 78,099$ 177,226$ 154,723$
Non-GAAP Adjusted EBITDA Margin 33.5% 36.3% 34.4% 36.4%

Three Months Ended Sept. 30, Six Months Ended Sept. 30,
2017 2016 2017 2016
Net
Income EPS
Net
Income EPS
Net
Income EPS
Net
Income EPS
(In Thousands, except per share data)
GAAP Net Income 30,705$ 0.57$ 32,195$ 0.60$ 64,464$ 1.20$ 26,664$ 0.50$
Adjustments:
Integration, transition and other costs associated with
acquisitions and divestitures in Cost of Goods Sold 1,143 0.02 - - 3,719 0.07 - -
Integration, transition and other costs associated with
acquisitions and divestitures in Advertising and
Promotion Expense (231) - - - (192) - - -
Integration, transition and other costs associated with
acquisitions and divetitures in General and
Administrative Expense 888 0.02 1,521 0.03 1,472 0.03 3,646 0.07
Accelerated amortization of debt origination costs - - 1,131 0.02 - - 1,131 0.02
(Gain) loss on divestitures - - (496) (0.01) - - 54,957 1.03
Tax impact of adjustments (658) (0.01) (566) (0.01) (1,825) (0.03) (21,224) (0.40)
Normalized tax rate adjustment 614 0.01 - - 312 - - -
Total Adjustments 1,756 0.04 1,590 0.03 3,486 0.07 38,510 0.72
Non-GAAP Adjusted Net Income and Adjusted EPS 32,461$ 0.61$ 33,785$ 0.63$ 67,950$ 1.27$ 65,174$ 1.22$

Three Months Ended Sept. 30, Six Months Ended Sept. 30,
2017 2016 2017 2016
(In Thousands)
GAAP Net Income 30,705$ 32,195$ 64,464$ 26,664$
Adjustments:
Adjustments to reconcile net income to net
cash provided by operating activities as shown in
the Statement of Cash Flows 21,530 9,842 43,513 67,188
Changes in operating assets and liabilities, net of
effects from acquisitions as shown in the
Statement of Cash Flows
2,184 7,744 563 7,230
Total Adjustments 23,714 17,586 44,076 74,418
GAAP Net cash provided by operating activities 54,419 49,781 108,540 101,082
Purchase of property and equipment (2,231) (509) (4,785) (1,404)
Non-GAAP Free Cash Flow 52,188 49,272 103,755 99,678
Integration, transition and other payments
associated with acquisitions and divestitures 2,654 352 7,602 683
Non-GAAP Adjusted Free Cash Flow 54,842$ 49,624$ 111,357$ 100,361$

2018 Projected EPS
Low High
Projected FY'18 GAAP EPS 2.51$ 2.61$
Adjustments:
Costs associated with Fleet integration 0.07 0.07
Total Adjustments 0.07 0.07
Projected Non-GAAP Adjusted EPS 2.58$ 2.68$
2018
Projected
Free Cash
Flow
(In millions)
Projected FY'18 GAAP Net Cash provided by operating activities 210$
Additions to property and equipment for cash (10)
rojected Non-GAAP Free Cash Flow 200
Paym nts associated with acquisitions 8
Tax effect of payments associated with acquisitions (3)
Adjusted Non-GAAP Adjusted Free Cash Flow 205$
