Attached files
| file | filename |
|---|---|
| 8-K - CURRENT REPORT - ZAGG Inc | f8k110117_zagginc.htm |
| EX-99.2 - RESULTS OF OPERATIONS PRESS RELEASE DATED NOVEMBER 1, 2017 - ZAGG Inc | f8k110117ex99-2_zagg.htm |
| EX-99.1 - SUPPLEMENTAL FINANCIAL INFORMATION - FINANCIAL TABLES FOR THE THREE AND NINE MON - ZAGG Inc | f8k110117ex99-1_zagg.htm |
Exhibit 99.3

Supplemental Financial Information – CFO Commentary
November 1, 2017
Document reference information
The commentary in this document can be referenced in the financial information found in the earnings release issued earlier today. The release can be found at investors.ZAGG.com, or in the Form 8-K furnished to the Securities and Exchange Commission website at sec.gov.
Third Quarter Summary Results
(Third quarter 2017 versus same period in the prior year. In millions, except per share amounts.)
Summary Financial Results
| Three Months Ended | ||||||||
| Q3 2017 | Q3 2016 | |||||||
| Net Sales | $ | 134.4 | $ | 124.7 | ||||
| Gross Margin | $ | 48.4 | $ | 43.1 | ||||
| Gross Margin % | 36 | % | 35 | % | ||||
| Net Income (Loss) | $ | 9.8 | $ | (7.1 | ) | |||
| Diluted Earnings (Loss) per Share | $ | 0.34 | $ | (0.25 | ) | |||
| Adjusted EBITDA | $ | 22.4 | $ | 17.8 | ||||
Sales by Category
| Three Months Ended | ||||||||||||||||
| Q3 2017 | % Total | Q3 2016 | % Total | |||||||||||||
| Screen Protection | $ | 76.3 | 57 | % | $ | 64.6 | 52 | % | ||||||||
| Power Cases | $ | 16.3 | 12 | % | $ | 15.5 | 12 | % | ||||||||
| Power Management | $ | 25.1 | 19 | % | $ | 27.2 | 22 | % | ||||||||
| Audio | $ | 7.9 | 6 | % | $ | 7.8 | 6 | % | ||||||||
| Keyboards | $ | 7.5 | 5 | % | $ | 8.0 | 6 | % | ||||||||
| Other | $ | 1.3 | 1 | % | $ | 1.6 | 2 | % | ||||||||
Sales by Region/Channel
| Three Months Ended | ||||||||||||
| Q3 2017 | Q3 2016 | % Growth | ||||||||||
| Domestic | $ | 114.0 | $ | 108.8 | 5 | % | ||||||
| International | $ | 20.4 | $ | 15.9 | 28 | % | ||||||
Sales by Channel
| Three Months Ended | ||||||||||||
| Q3 2017 | Q3 2016 | % Growth | ||||||||||
| Retail | $ | 121.2 | $ | 111.7 | 9 | % | ||||||
| Online | $ | 9.1 | $ | 8.3 | 10 | % | ||||||
| Franchise & Kiosks | $ | 4.1 | $ | 4.7 | (13 | %) | ||||||
2017 Third Quarter Results Discussion
(All comparisons are 2017 consolidated versus 2016 consolidated, unless otherwise noted)
Net sales

Net sales increased 8% to $134.4 million, compared to $124.7 million due primarily to (1) increased sales of screen protection products in key wireless and retail accounts, particularly in international markets, and (2) the launch of the mophie wireless charging pad. During the third quarter of 2016, the Company launched a new line of power station products and loaded-in a significant amount of product to retail, however, there was no similar power station launch in the third quarter of 2017, resulting in a decline in overall power management sales.
Gross profit/margin
Gross profit increased to $48.4 million or 36%, compared to $43.1 million or 35%. Typically, the Company experiences higher gross profit margin in periods when the mix of screen protection products increases. The mix of screen protection products increased during the three months ended September 30, 2017 to approximately 57% of net sales compared to approximately 52% of net sales during the three months ended September 30, 2016, benefiting overall gross profit margin.
Operating expense/margin
Operating expense decreased 42% to $32.5 million compared to $55.9 million and with the increase in sales and reduction in operating expense, overall leverage improved to 24% of sales compared to 45% last year. The decrease in operating expense was primarily attributable to (1) a $24.3 million impairment charge in 2016 that did not recur in 2017 and (2) an overall reduction in amortization expense related to intangible assets.
Net income (loss)
Net income was $9.8 million compared to net loss of $(7.1) million. Earnings per share was $0.34 (on 28.4 million shares) compared to loss per share of $(0.25) (on 28.1 million shares)
Adjusted EBITDA
Consolidated Adjusted EBITDA was $22.4 million compared to $17.8 million.
2017 Year-to-Date Summary Results
(First nine months 2017 versus same period in the prior year. In millions, except per share amounts.)
| 2 |
Summary Financial Results
| Nine Months Ended | ||||||||
| Q3 2017 | Q3 2016 | |||||||
| Net Sales | $ | 342.6 | $ | 286.9 | ||||
| Gross Margin | $ | 112.8 | $ | 97.7 | ||||
| Gross Margin % | 33 | % | 34 | % | ||||
| Net Income (Loss) | $ | 7.0 | $ | (11.4 | ) | |||
| Diluted Earnings (Loss) per Share | $ | 0.25 | $ | (0.41 | ) | |||
| Adjusted EBITDA | $ | 37.2 | $ | 33.5 | ||||
Sales by Category
| Nine Months Ended | ||||||||||||||||
| Q3 2017 | % Total | Q3 2016 | % Total | |||||||||||||
| Screen Protection | $ | 178.0 | 52 | % | $ | 153.0 | 53 | % | ||||||||
| Power Cases | $ | 60.2 | 18 | % | $ | 43.3 | 15 | % | ||||||||
| Power Management | $ | 60.7 | 18 | % | $ | 42.5 | 15 | % | ||||||||
| Audio | $ | 21.5 | 6 | % | $ | 19.0 | 7 | % | ||||||||
| Keyboards | $ | 19.4 | 6 | % | $ | 25.5 | 9 | % | ||||||||
| Other | $ | 2.8 | 0 | % | $ | 3.6 | 1 | % | ||||||||
Sales by Region/Channel
| Nine Months Ended | ||||||||||||
| Q3 2017 | Q3 2016 | % Growth | ||||||||||
| Domestic | $ | 292.6 | $ | 253.9 | 15 | % | ||||||
| International | $ | 50.0 | $ | 33.0 | 51 | % | ||||||
Sales by Channel
| Nine Months Ended | ||||||||||||
| Q3 2017 | Q3 2016 | % Growth | ||||||||||
| Retail | $ | 303.9 | $ | 252.0 | 21 | % | ||||||
| Online | $ | 27.6 | $ | 22.7 | 21 | % | ||||||
| Franchise & Kiosks | $ | 11.1 | $ | 12.2 | (9 | %) | ||||||
| 3 |
2017 Year-to-Date Results Discussion
(All comparisons are 2017 consolidated versus 2016 consolidated, unless otherwise noted)
Net sales

Net sales increased 19% to $342.6 million, compared to $286.9 million due primarily to (1) increased sales of screen protection for new device releases during the current year, (2) higher sales of power management and power case products, and (3) the launch of the mophie wireless charging pad.
It should be noted that the first nine months 2016 sales include only seven months of mophie sales as the acquisition occurred on March 3, 2016. Prior to the acquisition in 2016, mophie recorded sales of $17.3 million, which if added to the first half 2016 sales total of $286.9 million, the Company would still have realized an increase in sales over 2016 of $38.4 million or 13%.
Gross profit/margin
Gross profit increased to $112.8 million or 33%, compared to $97.7 million or 34%. The decrease in the gross profit margin percentage was primarily attributable to (1) a full nine months of mophie operations in 2017, compared to only seven months of mophie operations in 2016, which are at lower gross profit margins than the corporate average, and (2) lower gross profit margin on curved glass for the Samsung Galaxy S8, compared to historical gross margins on non-curved glass products. These items were partially offset by amortization expense from the acquisition-related fair value inventory write-up in 2016, which did not recur in 2017.
Operating expense/margin
Operating expense decreased to $98.0 million compared to $115.5 million. The decline in operating expense coupled with the increase in sales resulted in an improvement in overall leverage to 29% of sales compared to 40% last year. The decrease in operating expenses was primarily attributable to (1) a $24.3 million impairment charge in 2016 that did not recur in 2017, (2) synergies realized from cost reduction initiatives, (3) a reduction in transaction-related costs, (4) a reduction in advertising and marketing spend, and (5) an overall reduction in amortization expense. These decreases were partially offset by the following increases in operating expense: (1) the inclusion of nine months of mophie-related expenses for 2017 compared with seven months in 2016 and (2) the impairment of an intangible asset in 2017 related to an invalidated patent totaling $2.0 million.
| 4 |
Net income (loss)
Net income was $7.0 million compared to net loss of $(11.4) million. Earnings per share was $0.25 (on 28.3 million shares) compared to loss per share of $(0.41) (on 28.0 million shares)
Adjusted EBITDA
Consolidated Adjusted EBITDA was $37.2 million compared to $33.5 million.
Balance Sheet Highlights (as of September 30, 2017)
| (In millions, excluding DSOs and Inventory turns.) | September 30, 2017 | December 31, 2016 | September 30, 2016 | |||||||||
| Cash and Cash Equivalents | $ | 11.4 | $ | 11.6 | $ | 9.0 | ||||||
| Account Receivables | $ | 96.8 | $ | 83.8 | $ | 83.1 | ||||||
| Inventory | $ | 72.0 | $ | 72.8 | $ | 66.2 | ||||||
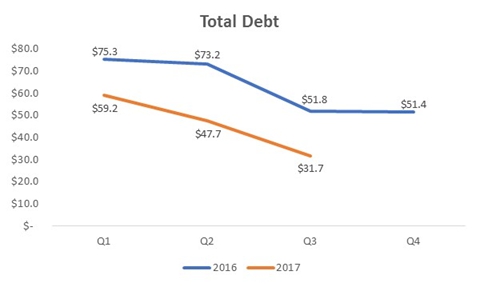
| Total Debt | $ | 31.7 | $ | 51.4 | $ | 51.8 | ||||||
| Line of Credit | $ | 16.2 | $ | 31.3 | $ | 30.2 | ||||||
| Term Loan | $ | 15.5 | $ | 20.1 | $ | 21.6 | ||||||
| DSOs | 66 | 67 | 61 | |||||||||
| Inventory Turns* | 6.8 | x | 5.8 | x | 6.5 | x | ||||||
| * | Inventory turns defined as trailing 12-month sales divided by period-end inventory. The September 30, 2017 calculation of inventory turns excludes $5.1 million of Apple optimized charge pad inventory that was briefly in inventory at quarter-end. If the $5.1 million were included in the calculation, the inventory turns would be 6.4. |
Total Debt
The Company has effectively managed its outstanding debt balance, which was reduced from $75.3 million in March 2016 to the quarter-end balance of $31.7 million.
Market Share Information
Screen Protection
The Company continues to see strong and consistent growth in cellphone screen protection market share. From the first quarter of 2014 to the third quarter of 2017, InvisibleShield cellphone screen protection quarterly dollar market share has increased from 29% to 55%1.
1 Source: The NPD Group, U.S. Retail Tracking Service, Cell Phone Device Protection, January 2014 through September 2017.
| 5 |

Battery Cases & Power Management
Since November 2016, mophie branded battery cases and portable power packs have experienced significant growth in dollar market share due to a combination of (1) new and innovative product launches and (2) an unconstrained mophie supply chain. Monthly battery case dollar market share increased from 40% to 62%2 from November 2016 to September 2017.

Monthly portable power dollar market share increased from 20% to 31%3 from November 2016 to September 2017.
2 Source: The NPD Group, U.S. Retail Tracking Service, Charging Case, November 2016 through September 2017.
3 Source: The NPD Group, U.S. Retail Tracking Service, Mobile Power, Charger Type: Portable Power Packs, November 2016 through September 2017.
| 6 |

2017 Business Outlook
The Company increased annual guidance for 2017 as follows:
| · | Net sales of $500 - $520 million |
| · | Gross profit margin as a percentage of net sales in a range of low to mid 30’s |
| · | Adjusted EBITDA of $75 - $78 million |
| · | Annual effective tax rate of approximately 35% |

* Represents the midpoint of guidance of $500 to $520 million
Non-GAAP Financial Disclosure
ZAGG regularly discloses Adjusted EBITDA, a non-GAAP metric, in its financial releases. Readers should refer to the non-GAAP financial disclosures at the end of this document for information on the limitations of non-GAAP financial measures. An explanation of ZAGG's use of this non-GAAP financial measure and the reconciliation between GAAP and non-GAAP measures required by SEC Regulation G is included in ZAGG's press release today, which can be found at investors.ZAGG.com.
| 7 |
Readers are cautioned that Adjusted EBITDA (earnings before interest, taxes, depreciation, amortization, stock-based compensation expense, other income (expense), mophie transaction costs, mophie fair value inventory write-up related to acquisition, mophie restructuring charges, mophie employee retention bonus, and impairment of intangible asset) is not a financial measure under US generally accepted accounting principles (GAAP). In addition, this financial information should not be construed as an alternative to any other measure of performance determined in accordance with GAAP, or as an indicator of operating performance, liquidity or cash flows generated by operating, investing and financing activities, as there may be significant factors or trends that it fails to address. We present Adjusted EBITDA because we believe that it is helpful to some investors as a measure of performance. We caution readers that non-GAAP financial information, by its nature, departs from traditional accounting conventions. Accordingly, its use can make it difficult to compare current results with results from other reporting periods and with the financial results of other companies.
Safe Harbor Statement
In addition to the historical information contained in this press release, this release contains (and oral communications made by ZAGG may contain) statements that relate to future events and expectations and, as such, constitute forward-looking statements within the meaning of the Private Securities Litigation Reform Act of 1995. Any statements that express, or involve discussions as to, expectations, beliefs, plans, objectives, outlook, assumptions, or future events or performance, often, but not always, through the use of words or phrases such as "anticipates," "believes," "estimates," "expects," "intends," "plans," "predicts," "projects," "targets," or similar expressions, are not statements of historical facts and may be forward-looking. Readers are cautioned that such statements are subject to a multitude of risks and uncertainties that could cause future circumstances, events, or results to differ materially from those projected in the forward-looking statements.
In addition to any assumptions and other factors and matters referred to specifically in connection with such forward-looking statements, factors that could cause actual results or outcomes to differ materially from those contained in forward-looking statements include the following: (a) the ability to design, produce, and distribute the creative product solutions required to retain existing customers and to attract new customers; (b) building and maintaining marketing and distribution functions sufficient to gain meaningful international market share for ZAGG's products; (c) the ability to respond quickly with appropriate products after the adoption and introduction of new mobile devices by major manufacturers like Apple, Samsung, and Google; (d) changes or delays in announced launch schedules for (or recalls or withdrawals of) new mobile devices by major manufacturers like Apple, Samsung, and Google; (e) the ability to successfully integrate new operations or acquisitions, specifically including mophie inc., (f) the impact of inconsistent quality or reliability of new product offerings; (g) the impact of lower profit margins in certain new and existing product categories, including certain mophie products; (h) the impacts of changes in economic conditions, including on customer demand; (i) managing inventory in light of constantly shifting consumer demand; (j) the failure of information systems or technology solutions or the failure to secure information system data, failure to comply with privacy laws, security breaches, or the effect on the company from cyber-attacks, terrorist incidents, or the threat of terrorist incidents; and (k) adoption of or changes in accounting policies, principles, or estimates. Any forward-looking statement speaks only as of the date on which such statement is made. New factors emerge from time to time and it is not possible for management to predict all such factors, nor can it assess the impact of any such factor on the business or the extent to which any factor, or combination of factors, may cause results to differ materially from those contained in any forward-looking statement. Readers should also review the risks and uncertainties listed in ZAGG's most recent Annual Report on Form 10-K and other reports the company files with the U.S. Securities and Exchange Commission, including (but not limited to) Item 1A - "Risk Factors" in the Form 10-K and Management's Discussion and Analysis of Financial Condition and Results of Operations and the risks described therein from time to time. ZAGG disclaims any obligation to update publicly any forward-looking information, whether in response to new information, future events, or otherwise, except as required by applicable law.
8