Attached files
| file | filename |
|---|---|
| EX-32.2 - CERTIFICATION - Aly Energy Services, Inc. | alye_ex322.htm |
| EX-32.1 - CERTIFICATION - Aly Energy Services, Inc. | alye_ex321.htm |
| EX-31.2 - CERTIFICATION - Aly Energy Services, Inc. | alye_ex312.htm |
| EX-31.1 - CERTIFICATION - Aly Energy Services, Inc. | alye_ex311.htm |
UNITED STATES
SECURITIES AND EXCHANGE COMMISSION
WASHINGTON, D. C. 20549
Form 10-Q
x Quarterly Report Pursuant to Section 13 or 15 (d) of the Securities Exchange Act of 1934
For the Period Ended June 30, 2016
or
¨ Transition Report Pursuant to Section 13 or 15 (d) of the Securities Exchange Act of 1934
For the Transition Period From _____________to _____________
Commission File Number 33-92894
| ALY ENERGY SERVICES, INC. |
| (Exact name of registrant as specified in its charter) |
| Delaware |
| 75-2440201 |
| (State or other jurisdiction of |
| (I.R.S. Employer Identification No.) |
| incorporation or organization) |
|
|
|
|
|
|
| 3 Riverway, Suite 920 |
|
|
| Houston, TX |
| 77056 |
| (Address of Principal Executive Offices) |
| (Zip Code) |
(713)-333-4000
(Registrant’s Telephone Number, including area code.)
Securities registered pursuant to Section 12(b) of the Act:
| Title of Each Class | Names of Each Exchange on which Registered | |
| Common Stock, $0.001 par value per share | None |
Securities registered pursuant to Section 12(g) of the Act: None
Indicate by check mark whether the registrant (1) has filed all reports required to be filed by Section 13 or 15(d) of the Securities Exchange Act of 1934 during the preceding 12 months (or for such shorter period that the registrant was required to file such reports), and (2) has been subject to such filing requirements for the past 90 days. Yes ¨ No x
Indicate by check mark whether the registrant has submitted electronically and posted on its corporate Web site, if any, every Interactive Data File required to be submitted and posted pursuant to Rule 405 of Regulation S-T (§ 232.405 of this chapter) during the preceding 12 months (or for such shorter period that the registrant was required to submit and post such files). Yes ¨ No x
Indicate by check mark if disclosure of delinquent filers pursuant to Item 405 of Regulation S-K (§ 229.405 of this chapter) is not contained herein, and will not be contained, to the best of registrant’s knowledge, in definitive proxy or information statements incorporated by reference in Part III of this Form 10-K or any amendment to this Form 10-K. ¨
Indicate by check mark whether the registrant is a large accelerated filer, an accelerated filer, a non-accelerated filer, smaller reporting company or an emerging growth company. See the definitions of “large accelerated filer,” “accelerated filer,” “smaller reporting company,” and “emerging growth company” in Rule 12b-2 of the Exchange Act.
| Large accelerated filer | ¨ | Accelerated filer | ¨ |
| Non-accelerated filer | ¨ | Smaller reporting company | x |
| Emerging growth company | ¨ |
If an emerging growth company, indicate by check mark if the registrant has elected not to use the extended transition period for complying with any new or revised financial accounting standards provided pursuant to Section 13(a) of the Exchange Act. ¨
Indicate by check mark whether the registrant is a shell company (as defined in Rule 12b-2 of the Exchange Act). Yes ¨ No x
At September 30, 2017, the registrant had 13,818,795 shares of common stock, $0.001 par value, outstanding.
Documents Incorporated by Reference: None
(A Delaware Corporation)
INDEX
|
| Page |
| ||
|
| ||||
|
| 3 |
| ||
| Unaudited Pro Forma Consolidated Balance Sheet as of December 31, 2016 |
| 3 |
| |
| Management’s Discussion and Analysis of Financial Condition and Results of Operations |
| 29 |
| |
|
| 39 |
| ||
|
| 40 | |||
|
| ||||
|
| 42 | |||
|
|
| 43 | ||
| 2 |
PART I – FINANCIAL INFORMATION
|
|
| |||
|
|
|
|
| |
| Index |
| Page |
| |
|
|
|
|
| |
| Unaudited Pro Forma Consolidated Balance Sheet as of December 31, 2016 |
|
| 24 |
|
|
|
|
|
|
|
|
|
| 26 |
| |
| 3 |
| Table of Contents |
| CONDENSED CONSOLIDATED BALANCE SHEETS | ||||||
| (in thousands, except share and per share amounts) |
|
|
| June 30, 2016 |
|
| December 31, 2015 |
| ||
|
|
| (unaudited) |
|
|
|
| ||
| ASSETS |
|
|
|
|
|
| ||
| Current assets |
|
|
|
|
|
| ||
| Cash and cash equivalents |
| $ | 493 |
|
| $ | 514 |
|
| Restricted cash |
|
| 30 |
|
|
| - |
|
| Receivables, net |
|
| 2,118 |
|
|
| 4,409 |
|
| Prepaid expenses and other current assets |
|
| 421 |
|
|
| 957 |
|
| Assets associated with discontinued operations |
|
| 1,632 |
|
|
| 3,428 |
|
| Total current assets |
|
| 4,694 |
|
|
| 9,308 |
|
|
|
|
|
|
|
|
|
|
|
| Property and equipment, net |
|
| 49,216 |
|
|
| 51,789 |
|
| Intangible assets, net |
|
| 6,110 |
|
|
| 7,409 |
|
| Other assets |
|
| 12 |
|
|
| 21 |
|
| Total assets |
| $ | 60,032 |
|
| $ | 68,527 |
|
|
|
|
|
|
|
|
|
|
|
| LIABILITIES AND STOCKHOLDERS' EQUITY |
|
|
|
|
|
|
|
|
| Current liabilities |
|
|
|
|
|
|
|
|
| Accounts payable and accrued expenses |
| $ | 3,065 |
|
| $ | 3,331 |
|
| Current portion of long-term debt |
|
| 22,039 |
|
|
| 20,353 |
|
| Current portion of contingent payment liability |
|
| 976 |
|
|
| 652 |
|
| Liabilities associated with discontinued operations |
|
| 803 |
|
|
| 1,211 |
|
| Total current liabilities |
|
| 26,883 |
|
|
| 25,547 |
|
|
|
|
|
|
|
|
|
|
|
| Long-term debt, net |
|
| 1,365 |
|
|
| 3,185 |
|
| Contingent payment liability, net |
|
| - |
|
|
| 530 |
|
| Deferred tax liabilities |
|
| 5,391 |
|
|
| 7,941 |
|
| Other long-term liabilities |
|
| 31 |
|
|
| 31 |
|
| Total liabilities |
|
| 33,670 |
|
|
| 37,234 |
|
|
|
|
|
|
|
|
|
|
|
| Commitments and contingencies |
|
|
|
|
|
|
|
|
|
|
|
|
|
|
|
|
|
|
| Aly Operating redeemable preferred stock |
|
| 4,784 |
|
|
| 4,647 |
|
| Aly Centrifuge redeemable preferred stock |
|
| 9,915 |
|
|
| 9,755 |
|
|
|
|
| 14,699 |
|
|
| 14,402 |
|
| Stockholders' equity |
|
|
|
|
|
|
|
|
| Preferred stock of $0.001 par value |
|
| - |
|
|
| - |
|
| Authorized - 10,000,000, none issued and outstanding as of June 30, 2016 |
|
|
|
|
|
|
|
|
| Authorized - 25,000,000, none issued and outstanding as of December 31, 2015 |
|
|
|
|
|
|
|
|
| Common stock of $0.001 par value |
|
| 7 |
|
|
| 7 |
|
| Authorized - 25,000,000; issued - 6,707,039; outstanding - 6,706,814 as of June 30, 2016 |
|
|
|
|
|
|
|
|
| Authorized - 100,000,000; issued - 6,707,039; outstanding - 6,706,814 as of December 31, 2015 |
|
|
|
|
|
|
|
|
| Additional paid-in-capital |
|
| 28,612 |
|
|
| 28,909 |
|
| Accumulated deficit |
|
| (16,954 | ) |
|
| (12,023 | ) |
| Treasury stock, 225 shares at cost |
|
| (2 | ) |
|
| (2 | ) |
| Total stockholders' equity |
|
| 11,663 |
|
|
| 16,891 |
|
|
|
|
|
|
|
|
|
|
|
| Total liabilities and stockholders' equity |
| $ | 60,032 |
|
| $ | 68,527 |
|
| 4 |
| Table of Contents |
| CONDENSED CONSOLIDATED STATEMENTS OF OPERATIONS | |||||||||||
| (in thousands, except share and per share amounts) |
|
|
| For the Three Months Ended June 30, |
|
| For the Six Months Ended June 30, |
| ||||||||||
|
|
| 2016 |
|
| 2015 |
|
| 2016 |
|
| 2015 |
| ||||
|
|
| (unaudited) |
|
| (unaudited) |
| ||||||||||
|
|
|
|
|
|
|
|
|
|
|
|
|
| ||||
| Revenue |
| $ | 2,669 |
|
| $ | 6,222 |
|
| $ | 6,777 |
|
| $ | 13,284 |
|
|
|
|
|
|
|
|
|
|
|
|
|
|
|
|
|
|
|
| Expenses: |
|
|
|
|
|
|
|
|
|
|
|
|
|
|
|
|
| Operating expenses |
|
| 2,308 |
|
|
| 3,882 |
|
|
| 5,349 |
|
|
| 8,494 |
|
| Depreciation and amortization |
|
| 1,393 |
|
|
| 1,516 |
|
|
| 2,834 |
|
|
| 2,974 |
|
| Selling, general and administrative expenses |
|
| 1,300 |
|
|
| 2,056 |
|
|
| 2,686 |
|
|
| 3,976 |
|
| Reduction in value of assets |
|
| 543 |
|
|
| - |
|
|
| 843 |
|
|
| - |
|
| Total expenses |
|
| 5,544 |
|
|
| 7,454 |
|
|
| 11,712 |
|
|
| 15,444 |
|
|
|
|
|
|
|
|
|
|
|
|
|
|
|
|
|
|
|
| Loss from continuing operations |
|
| (2,875 | ) |
|
| (1,232 | ) |
|
| (4,935 | ) |
|
| (2,160 | ) |
|
|
|
|
|
|
|
|
|
|
|
|
|
|
|
|
|
|
| Interest expense, net |
|
| 560 |
|
|
| 455 |
|
|
| 1,148 |
|
|
| 945 |
|
| Loss from continuing operations before income taxes |
|
| (3,435 | ) |
|
| (1,687 | ) |
|
| (6,083 | ) |
|
| (3,105 | ) |
|
|
|
|
|
|
|
|
|
|
|
|
|
|
|
|
|
|
| Income tax benefit |
|
| (1,636 | ) |
|
| (769 | ) |
|
| (2,534 | ) |
|
| (1,333 | ) |
| Net loss from continuing operations |
|
| (1,799 | ) |
|
| (918 | ) |
|
| (3,549 | ) |
|
| (1,772 | ) |
|
|
|
|
|
|
|
|
|
|
|
|
|
|
|
|
|
|
| Loss from discontinued operations, net of income taxes |
|
| 1,257 |
|
|
| 654 |
|
|
| 1,382 |
|
|
| 1,239 |
|
| Net loss |
|
| (3,056 | ) |
|
| (1,572 | ) |
|
| (4,931 | ) |
|
| (3,011 | ) |
|
|
|
|
|
|
|
|
|
|
|
|
|
|
|
|
|
|
| Preferred stock dividends |
|
| 181 |
|
|
| 178 |
|
|
| 359 |
|
|
| 353 |
|
| Accretion of preferred stock, net |
|
| (33 | ) |
|
| (32 | ) |
|
| (62 | ) |
|
| (65 | ) |
| Net loss available to common stockholders |
| $ | (3,204 | ) |
| $ | (1,718 | ) |
| $ | (5,228 | ) |
| $ | (3,299 | ) |
|
|
|
|
|
|
|
|
|
|
|
|
|
|
|
|
|
|
| Basic and diluted earnings per share information: |
|
|
|
|
|
|
|
|
|
|
|
|
|
|
|
|
| Net loss from continuing operations available to common stockholders |
| $ | (0.29 | ) |
| $ | (0.18 | ) |
| $ | (0.57 | ) |
| $ | (0.36 | ) |
| Loss from discontinued operations, net of income taxes |
|
| (0.19 | ) |
|
| (0.12 | ) |
|
| (0.21 | ) |
|
| (0.22 | ) |
| Net loss available to common stockholders |
| $ | (0.48 | ) |
| $ | (0.30 | ) |
| $ | (0.78 | ) |
| $ | (0.58 | ) |
|
|
|
|
|
|
|
|
|
|
|
|
|
|
|
|
|
|
| Weighted-average shares - basic and diluted |
|
| 6,706,814 |
|
|
| 5,654,580 |
|
|
| 6,706,814 |
|
|
| 5,644,678 |
|
| 5 |
| Table of Contents |
| CONDENSED CONSOLIDATED STATEMENTS OF CASH FLOWS | ||||||||
| (in thousands) |
|
|
| For the Six Months Ended June 30, |
| |||||
|
|
| 2016 |
|
| 2015 |
| ||
|
|
| (unaudited) |
| |||||
|
|
|
|
|
|
|
| ||
| Cash flows from operating activities: |
|
|
|
|
|
| ||
| Net loss |
| $ | (4,931 | ) |
| $ | (3,011 | ) |
| Less: Loss from discontinued operations, net of income taxes |
|
| 1,382 |
|
|
| 1,239 |
|
| Net loss from continuing operations |
|
| (3,549 | ) |
|
| (1,772 | ) |
|
|
|
|
|
|
|
|
|
|
| Adjustments to reconcile net loss to net cash provided by operating activities: |
|
|
|
|
|
|
|
|
| Depreciation and amortization |
|
| 2,834 |
|
|
| 2,974 |
|
| Amortization of deferred loan costs |
|
| 173 |
|
|
| 234 |
|
| Reduction in value of assets |
|
| 843 |
|
|
| - |
|
| Stock-based compensation |
|
| - |
|
|
| 100 |
|
| Bad debt expense |
|
| 34 |
|
|
| 141 |
|
| Fair value adjustments to contingent payment liability |
|
| (206 | ) |
|
| (311 | ) |
| Deferred taxes |
|
| (2,550 | ) |
|
| (1,376 | ) |
| Changes in operating assets and liabilities: |
|
|
|
|
|
|
|
|
| Receivables |
|
| 2,257 |
|
|
| 4,525 |
|
| Prepaid expenses and other assets |
|
| 545 |
|
|
| 365 |
|
| Accounts payable, accrued expenses and other liabilities |
|
| (266 | ) |
|
| (2,869 | ) |
| Net cash provided by continuing operations |
|
| 115 |
|
|
| 2,011 |
|
| Net cash provided by (used in) discontinued operations |
|
| (18 | ) |
|
| 1,363 |
|
| Net cash provided by operating activities |
|
| 97 |
|
|
| 3,374 |
|
|
|
|
|
|
|
|
|
|
|
| Cash flows from investing activities: |
|
|
|
|
|
|
|
|
| Purchases of property and equipment |
|
| (264 | ) |
|
| (1,149 | ) |
| Proceeds from disposal of property and equipment |
|
| 459 |
|
|
| 30 |
|
| Net cash provided by (used in) continuing operations |
|
| 195 |
|
|
| (1,119 | ) |
| Net cash provided by (used in) discontinued operations |
|
| 39 |
|
|
| (28 | ) |
| Net cash provided by (used in) investing activities |
|
| 234 |
|
|
| (1,147 | ) |
|
|
|
|
|
|
|
|
|
|
| Cash flows from financing activities: |
|
|
|
|
|
|
|
|
| Proceeds from issuance of common stock, net |
|
| - |
|
|
| 550 |
|
| Repayment of long-term debt |
|
| (307 | ) |
|
| (3,553 | ) |
| Payment of contingent payment liability |
|
| - |
|
|
| (862 | ) |
| Payment of deferred loan costs |
|
| - |
|
|
| (32 | ) |
| Net cash used in continuing operations |
|
| (307 | ) |
|
| (3,897 | ) |
| Net cash used in discontinued operations |
|
| (5 | ) |
|
| (4 | ) |
| Net cash used in financing activities |
|
| (312 | ) |
|
| (3,901 | ) |
|
|
|
|
|
|
|
|
|
|
| Net increase (decrease) in cash, cash equivalents, and restricted cash |
|
| 19 |
|
|
| (1,674 | ) |
| Cash, cash equivalents, and restricted cash, beginning of period |
|
| 497 |
|
|
| 2,050 |
|
| Cash, cash equivalents, and restricted cash, end of period |
| $ | 516 |
|
| $ | 376 |
|
| 6 |
| Table of Contents |
NOTE 1 — NATURE OF OPERATIONS AND BASIS OF PRESENTATION
Nature of Operations
Aly Energy Services, Inc., together with its subsidiaries (“Aly Energy” or the “Company”), provides oilfield services, including equipment rental and solids control services to exploration and production companies. The Company operates in select oil and natural gas basins of the contiguous United States. Throughout this report, we refer to Aly Energy and its subsidiaries as “we”, “our” or “us”. References to financial results and operations of the Company in these notes to the condensed consolidated financial statements are limited to continuing operations unless otherwise specified.
On October 26, 2012, we acquired all of the stock of Austin Chalk Petroleum Services Corp. (“Austin Chalk”). Austin Chalk provides surface rental equipment as well as roustabout services which include the rig-up and rig-down of equipment and the hauling of equipment to and from the customer's location.
On April 15, 2014, we acquired the equity interests of United Centrifuge, LLC (“United”) as well as certain assets used in United’s business that were owned by related parties of United (collectively the “United Acquisition”). In connection with the United Acquisition, United merged with and into Aly Centrifuge Inc. (“Aly Centrifuge”), a wholly-owned subsidiary of Aly Energy. United operates within the solids control and fluids management sectors of the oilfield services and rental equipment industry, offering its customers the option of renting centrifuges and auxiliary solids control equipment without personnel or the option of paying for a full-service solids control package which includes operators on-site 24 hours a day.
Discontinued Operations
On July 1, 2014, we acquired all of the issued and outstanding stock of Evolution Guidance Systems Inc. (“Evolution”), an operator of Measurement-While-Drilling (“MWD”) downhole tools. From July 2014 through October 2016, Evolution provided directional drilling and MWD services to a variety of exploration and production companies. On October 26, 2016, we abandoned these operations as a part of a restructuring transaction. The abandonment of these operations meets the criteria established for recognition as discontinued operations under generally accepted accounting principles in the United States of America (“U.S. GAAP”). Therefore, the financial results of our directional drilling and MWD services are presented as discontinued operations in the Company’s condensed consolidated financial statements. Assets and liabilities related to the discontinued operations are included in the line item “Assets associated with discontinued operations” and “Liabilities associated with discontinued operations”, respectively, on the condensed consolidated balance sheets for all periods presented. The results of the discontinued operations are included in the line item “Loss from discontinued operations, net of income taxes” on the condensed consolidated statements of operations for all periods presented. Cash flows from discontinued operations appear in the line items “Net cash provided by (used in) by discontinued operations” on the condensed consolidated statements of cash flows. See “Note 2 – Recent Developments and Subsequent Events” for more information.
Basis of Presentation
Aly Energy has three wholly-owned subsidiaries, Aly Operating Inc. (“Aly Operating”), of which Austin Chalk is a wholly-owned subsidiary, Aly Centrifuge and Evolution. We operate as one business segment which services customers within the United States.
The condensed consolidated financial statements have been prepared in conformity with U.S. GAAP and include the accounts of Aly Energy and each of its subsidiaries in the condensed consolidated balance sheets as of June 30, 2016 and December 31, 2015 and the related condensed consolidated statements of operations and cash flows for each of the periods presented. All significant intercompany transactions and account balances have been eliminated upon consolidation.
Interim Financial Information
The condensed consolidated balance sheet as of December 31, 2015 has been derived from our audited financial statements and the unaudited condensed consolidated financial statements of the Company are prepared in conformity with U.S. GAAP for interim financial reporting. Certain information and footnote disclosures normally included in annual financial statements prepared in accordance with GAAP have been condensed or omitted pursuant to the rules and regulations of the Securities and Exchange Commission (“SEC”). Therefore, these condensed consolidated financial statements should be read along with the annual audited consolidated financial statements and notes thereto included in the Company's Annual Report on Form 10-K for the year ended December 31, 2015. In management’s opinion, all adjustments necessary for a fair statement are reflected in the interim periods presented. Interim results for the three and six months ended June 30, 2016 are not indicative of results that were realized for the full year ending December 31, 2016. For more detail, please see the annual audited consolidated financial statements and notes thereto included in the Company's Annual Report on Form 10-K for the year ended December 31, 2016 filed with the SEC on September 5, 2017.
| 7 |
| Table of Contents |
Use of Estimates
The preparation of condensed consolidated financial statements in conformity with U.S. GAAP requires management to make certain estimates and assumptions. These estimates and assumptions affect the reported amounts of assets and liabilities, the disclosure of contingent assets and liabilities at the balance sheet date, and the amounts of revenue and expenses recognized during the reporting period. Areas where critical accounting estimates are made by management include:
|
| · | Allowance for doubtful accounts, |
|
| · | Depreciation and amortization of property and equipment and intangible and other assets, |
|
| · | Impairment of property and equipment, intangible and other assets, and goodwill, |
|
| · | Litigation settlement accrual, |
|
| · | Contingent payment liability, and |
|
| · | Income taxes. |
The Company analyzes its estimates based on historical experience and various other indicative assumptions that it believes to be reasonable under the circumstances. Under different assumptions or conditions, the actual results could differ, possibly materially from those previously estimated. Many of the conditions impacting these assumptions are outside of the Company’s control.
Earnings per Share
Basic earnings per share is computed by dividing income available to common stockholders by the weighted average number of shares of common stock outstanding during the period. Diluted earnings per share is computed in the same manner as basic earnings per share except that the denominator is increased to include the number of additional shares of common stock that could have been outstanding assuming the exercise of outstanding stock options and restricted stock or other convertible instruments, as appropriate.
During the three and six months ended June 30, 2016 and 2015, the Company incurred losses from continuing operations; therefore, the impact of any incremental shares would be anti-dilutive.
Reclassifications
Certain reclassifications have been made to prior period consolidated financial statements to conform to the current period presentations. These reclassifications had no effect on our consolidated financial position, results of operations or cash flows.
Subsequent Events
We conducted our subsequent events review through the date these consolidated financial statements were filed with the SEC. (See “Note 2 – Recent Developments and Subsequent Events” and “Note 5 – Long-term Debt”.)
NOTE 2 — RECENT DEVELOPMENTS AND SUBSEQUENT EVENTS
Operational Restructuring
Our activity is tied directly to the rig count and, even though we instituted significant cost cutting measures beginning in 2015, we were unable to cut costs enough to match the decline in our business. As a result, as of December 31, 2015, we were in default of our credit agreement with Wells Fargo Bank, National Association (“Wells Fargo”).
Throughout 2015, in an effort to mitigate the significant declines in pricing and utilization of our equipment, we committed to a reorganization initiative to strengthen our sales and marketing efforts, consolidate support functions, and operate more efficiently. The reorganization effort included, but was not limited to, training our salesforce to enable the cross-selling of our product lines in certain geographical markets, sharing a common support services infrastructure across all reporting units, reducing headcount and wage rates, and rebranding and launching a new web site to increase awareness of our service lines. We recognized some benefit from these measures in late 2015 resulting in increased gross margins and lower selling, general and administrative expenses when compared to the first half of 2015.
| 8 |
| Table of Contents |
During the year ended December 31, 2016, we entered into a series of forbearance agreements with our lender. Under the forbearance agreements, among other provisions, the lenders agreed to forbear from exercising their remedies under the credit agreement. These forbearance agreements permitted us to operate within the parameters of our normal course of business despite the continuing default under the credit agreement. Without these forbearance agreements, our outstanding debt would have been immediately due and payable. Throughout 2016, we remained in default and we did not have sufficient liquidity to repay all of the outstanding debt to the lender at any point during the year ($20.1 million as of December 31, 2015). As such, we may have been forced to file for protection under Chapter 11 of the U.S. Bankruptcy Code.
In early 2016, we were hopeful that a successful operational restructuring would facilitate negotiations to modify the terms of our existing credit facility with Wells Fargo. Our operational restructuring in 2016 consisted of severe cost cuts which were incremental to the year-over-year cost cuts already achieved in 2015 when compared to 2014. In 2016, significant cost savings were primarily generated by:
|
| · | reductions of our employee base, both field employees and sales and administrative employees, to a headcount of approximately 50 as of December 31, 2016 from approximately 125 as of December 31, 2015, |
|
| · | reduction in employer contributions to employee benefits, |
|
| · | closures of certain operating yards and administrative facilities, |
|
| · | strategic decision to cease operations in the northeast which resulted in the reduction of costs related to operating in an incremental market, |
|
| · | modifications to insurance policies, including general liability and workers’ compensation policies, resulting in a $0.5 million or 15.5% reduction in the cost of insurance to $0.6 million for the year ended December 31, 2016 from $1.1 million for the year ended December 31, 2015, |
|
| · | minimization of repair and maintenance activities, resulting in a $0.4 million or 50.0% reduction of repair and maintenance expenses to $0.4 million for the year ended December 31, 2016 from $0.8 million for the year ended December 31, 2015, and |
|
| · | elimination of investments in equipment, unless required to service an existing customer, resulting in a reduction of capital expenditures to $0.4 million for the year ended December 31, 2016 from $2.5 million for the year ended December 31, 2015. |
We also achieved significant cost savings from the decrease in third party costs, such as sub-rental equipment and trucking, and other variable costs which declined with the decrease in activity.
In order to further support our working capital needs, we identified and sold idle and underutilized assets. During 2016, we realized aggregate proceeds from sales of such assets of approximately $0.8 million of which $0.5 million and $0.3 million was used to fund working capital needs and pay down debt, respectively (see “Note 3 – Reduction in Value of Assets and Other Charges”).
Capital Restructuring
Despite our successful operational restructuring efforts, particularly during the first half of 2016, the decline in our activity levels and the declines in customer pricing outpaced the impact of our cost reductions and it became evident that a capital restructuring would also be necessary to continue operations and position our business for an industry turnaround.
In the second quarter of 2016, certain of the Company’s principal stockholders (“Shareholder Group”) began negotiations with Wells Fargo with the objective of consummating a recapitalization transaction (the “Recapitalization”) whereby our obligations under the credit agreement and the outstanding capital leases in favor of Wells Fargo’s equipment finance affiliate and certain other obligations of Aly Energy (collectively the “Aly Senior Obligations”) would be restructured. In August 2016, the Shareholder Group was introduced to a third party, Tiger Finance, LLC (“Tiger”), to provide bridge financing and to extend forbearance until such date as sufficient capital could be raised to complete the Recapitalization.
In September 2016, the Shareholder Group formed Permian Pelican, LLC (“Pelican”) with the objective of raising capital and executing the steps necessary to complete the restructuring, inclusive of successfully effecting the exchange of the Aly Operating redeemable preferred stock, Aly Centrifuge redeemable preferred stock, Aly Centrifuge subordinated debt and liability for a contingent payment into approximately 10% of our common stock on a fully diluted basis.
Effective January 31, 2017, the Recapitalization was completed through the execution and delivery of a Securities Exchange Agreement and a Second Amended and Restated Credit Agreement, and, as a result, the new credit facility, now with Pelican, consisted of a term loan of $5.1 million and a revolving facility of up to $1.0 million as of January 31, 2017. Availability under the revolving credit facility is determined by a borrowing base calculated as 80% of eligible receivables (receivables less than 90 days old).
| 9 |
| Table of Contents |
Subsequent to the Recapitalization, we entered into several further amendments to capitalize on improved market conditions and increased activity in our business:
|
| · | Amendment No. 1, effective March 1, 2017, provided for a delayed draw term loan to be added to the credit facility for the purpose of financing capital expenditures. The agreement permitted us to draw on the delayed draw term loan from time-to-time up until the maturity date of the facility in order to fund up to 80% of the cost of capital expenditures subject to a $0.5 million limit on aggregate borrowings. |
|
| · | Amendment No. 2, effective May 23, 2017, increased the maximum revolving credit amount from $1.0 million to $1.8 million and extended the final maturity date of the facility to December 31, 2019. In consideration of the increase in the revolving credit facility and the extension of the final maturity date, we agreed to issue to Pelican, the lender, as an amendment fee, 1,200 shares of our Series A convertible preferred stock. |
|
| · | Amendment No. 3, effective June 15, 2017, modified maximum potential borrowings under each of the revolving credit facility and the delayed draw term loan without changing the aggregate available borrowings under the credit facility. The amendment reduced the maximum revolving credit amount from $1.8 million to $1.0 million and increased the maximum delayed draw loan borrowings from $0.5 million to $1.3 million and the amendment also increased permitted draws on the delayed draw loan from 80% of the cost of capital expenditures being funded to 90% of the cost of capital expenditures being funded. |
|
|
|
|
To the extent there is free cash flow as defined in the credit agreement, principal payments of 50% of such free cash flow are due annually. The maturity date of all remaining outstanding balances under the credit facility is December 31, 2019.
The obligations under the credit facility are guaranteed by all of our subsidiaries and secured by substantially all of our assets. The credit agreement contains customary events of default and covenants including restrictions on our ability to incur additional indebtedness, pay dividends or make other distributions, grant liens and sell assets. The credit facility does not include any financial covenants. We are in full compliance with the credit facility as of June 30, 2017.
As of June 30, 2017, there were outstanding borrowings of $5.0 million, $0.8 million, and $0.3 million on the term loan, revolving credit facility, and delayed draw term loan, respectively. As of June 30, 2017, we have the availability to borrow an incremental $0.2 million under the revolving credit facility and, if we have capital expenditures which are eligible to be financed, an incremental $1.0 million under the delayed draw term loan to finance 90% of such expenditures.
Recapitalization Summary
The Recapitalization consisted of three restructuring events which took place in the period beginning October 26, 2016 and ending on January 31, 2017. Below is a description of each event:
| The first restructuring event occurred on October 26, 2016 when Tiger acquired the Aly Senior Obligations from Wells Fargo and its equipment affiliate. Simultaneously, Tiger entered into an assignment agreement with Pelican whereby it agreed to sell the Aly Senior Obligations to Pelican on the conditions that (i) Pelican provide $0.5 million of unsecured working capital financing to the Company pending the closing and (ii) the Company transfer to Tiger (in consideration of Tiger’s reduction of the Aly Senior Obligations in the amount of $2.0 million) certain excess equipment and vehicles which the Company was not utilizing and considered unnecessary for its continuing operations.
As a result of the above, we transferred property and equipment with an estimated fair value of $2.6 million, inclusive of $0.4 million of assets associated with discontinued operations, to Tiger and recognized a corresponding reduction in the Aly Senior Obligations of $2.0 million and debt modification fee of $0.6 million. Property and equipment transferred had an aggregate net book value of $18.6 million resulting in an impairment charge of $16.0 million, inclusive of a $0.4 million impairment associated with discontinued operations. As part of this transaction and upon satisfaction of certain conditions, Tiger extended the forbearance period to December 9, 2016.
The second restructuring event occurred on December 12, 2016 when Pelican acquired the Aly Senior Obligations from Tiger. As the new holder of the Aly Senior Obligations, Pelican further extended the forbearance period for the obligations to January 31, 2017, provided the Company was successful in completing the third and final restructuring event on or before such date. |
| 10 |
| Table of Contents |
| Effective January 31, 2017, the final restructuring event occurred and the Recapitalization was completed which resulted in the following: | |
|
|
|
| · | an exchange of certain of the Company’s outstanding obligations (namely, Aly Operating redeemable preferred stock, Aly Centrifuge redeemable preferred stock, Aly Centrifuge subordinated debt and its contingent payment liability) for approximately 10% of our common stock, or 7,111,981 common shares, on a fully diluted basis; |
| · | an exchange of certain amendments to the Aly Senior Obligations (namely, a $16.1 million principal reduction, removal of restrictive covenants and extended maturity of payment obligations) for shares of our Series A convertible preferred stock which represents approximately 80% of our common stock, or 53,628,842 common shares, on a fully diluted basis (liquidation preference of $16.1 million or $1,000 per share); and |
| · | the formation of a new credit agreement with Pelican (consisting of a $5.1 million term loan and $1.0 million revolving credit facility) with an extended maturity date of December 31, 2018. |
The Recapitalization had a significant impact to our capital structure and to our consolidated financial statements and there was a significant dilutive effect to those shareholders who held common stock immediately before the transaction was completed. The Recapitalization has been accounted for in accordance with ASC 470, including (i) the exchange of debt and equity securities accounted for as a troubled debt restructuring and (ii) the issuance of preferred shares in exchange for the extinguishment of debt and other liabilities and for the issuance of a new credit facility.
Troubled Debt Restructuring
Except for the Pelican exchange, each exchange was accounted for as a troubled debt restructuring (“TDR”) since an equity interest in the Company was issued to fully satisfy each debt. A gain on TDR is recognized for the excess of the carrying amount of the debt over the fair value of each equity interest granted. The impact of the Recapitalization includes a “gain on the extinguishment of debt and other liabilities” from the debtors of Aly Centrifuge subordinated debt and the contingent payment liability and a “gain on the extinguishment of redeemable preferred stock” from the holders of Aly Operating redeemable preferred stock and Aly Centrifuge redeemable preferred stock. The share price of common stock as of January 31, 2017 of $0.12 per share was used as the basis of fair value for each equity interested granted.
The impact of the TDR is as follows:
| Extinguishment of Debt and Other Liabilities. The exchange of subordinated debt and contingent payment liability for common stock resulted in a gain of $2.4 million, or $0.36 per share, on the condensed consolidated statement of operations for the three months ended March 31, 2017 and was recorded as an “Issuance of common stock in exchange for the extinguishment of debt and other liabilities” on the condensed consolidated statement of changes in stockholders’ equity (deficit) for the three months ended March 31, 2017. The table below summarizes stock issued and the resulting gain for each extinguishment: |
| ||||||
|
|
| ||||||
| Gain on the Extinguishment of Debt and Other Liabilities | |||||||
|
|
|
|
| ||||
|
|
| Common |
|
| Gain Included in | ||
|
|
| Stock |
|
| Other Expense | ||
| Debt and Other Liabilities Extinguished |
| Issued |
|
| (Income) | ||
|
|
|
|
|
|
|
| |
| Subordinated debt and accrued interest of $1.5 million |
|
|
|
|
| ||
| and $0.3 million, respectively |
|
| 1,200,000 |
|
| $1.6 million | |
|
|
|
|
|
|
|
|
|
| Contingent payment liability of $0.8 million |
|
| 457,494 |
|
| $0.8 million | |
| Extinguishment of Redeemable Preferred Stock. Represents the exchange of Aly Operating redeemable preferred stock and Aly Centrifuge redeemable preferred stock for common stock resulting in a gain of $14.4 million, or $2.14 per share, and recorded as an “Issuance of common stock in exchange for the extinguishment of redeemable preferred stock” on the condensed consolidated statement of changes in stockholders’ equity (deficit) for the three months ended March 31, 2017. The table below summarizes stock issued and the resulting gain for each extinguishment: | |||||||
|
| |||||||
| Gain on the Extinguishment of Redeemable Preferred Stock | |||||||
|
|
|
|
|
|
| ||
|
|
| Common |
|
| Gain Included in |
| |
|
| Stock |
|
| Additional |
| ||
| Redeemable Preferred Stock and Other Obligations |
| Issued |
|
| Paid-in-Capital |
| |
|
|
|
|
|
|
|
| |
| Aly Centifuge preferred and accrued dividends of $8.9 |
|
|
|
|
| ||
| million and $1.2 million, respectively |
|
| 3,039,516 |
|
| $9.8 million | |
|
|
|
|
|
|
|
|
|
| Aly Operating preferred and accrued dividends of $4.0 |
|
|
|
|
|
| |
| million and $0.9 million, respectively |
|
| 2,414,971 |
|
| $4.6 million | |
On January 31, 2017, we issued 7,111,981 shares of our common stock to the former holders of Aly Operating redeemable preferred stock, Aly Centrifuge redeemable preferred stock, Aly Centrifuge subordinated debt, and liability for contingent payment in exchange for the above mentioned extinguishments in connection with our TDR.
Credit Facility Restructuring
Given the nature of the related party relationship between the Company and Pelican, the extinguishment of our Aly Senior Obligations was accounted for as a capital transaction whereby we issued Series A convertible preferred stock in exchange for the extinguishment of our Aly Senior Obligations and the issuance of a new credit facility which resulted in a gain on the extinguishment of debt and other liabilities calculated as the amount above the estimated fair value of the equity interest granted. The share price of common stock as of January 31, 2017 of $0.12 per share was used as the basis of fair value for the equity interested granted.
The impact of the exchange and extinguishment of our Aly Senior Obligations is as follows:
| Old Credit Facility. The partial extinguishment and exchange of our Aly Senior Obligations ($16.1 million principal reduction) for shares of our Series A convertible preferred stock resulted in a gain of $9.7 million which is recorded as an “Issuance of preferred shares in exchange for the extinguishment of debt and other liabilities - Pelican” on the condensed consolidated statement of changes in stockholders’ equity (deficit) for the three months ended March 31, 2017. The components of the Aly Senior Obligations are as follows (in thousands): | ||||
|
| ||||
| Aly Senior Obligations as of January 31, 2017 | ||||
|
|
|
|
| |
| Debt and Other Liabilities Extinguished |
| Amount |
| |
| Credit facility |
| $ | 17,772 |
|
| Accrued fees and interest on credit facility |
|
| 1,414 |
|
| Capital lease obligations |
|
| 1,930 |
|
| Accrued interest on capital lease obligations |
|
| 26 |
|
| Line of credit - Pelican |
|
| 500 |
|
| Total |
| $ | 21,642 |
|
|
|
|
|
|
|
| New Credit Facility. Our new credit agreement with Pelican consists of a $5.1 million term loan and $0.5 million outstanding under a revolving credit facility (which was subsequently amended to $5.0 million and $0.8 million, respectively, as of June 30, 2017 in addition to $0.3 million outstanding under a delayed draw term loan with Pelican) completing the full extinguishment of our old credit facility. | ||||
On January 31, 2017, we issued 16,092 shares of our Series A convertible preferred stock to Pelican in exchange for the above mentioned $16.1 million reduction of the Aly Senior Obligations.
| 12 |
| Table of Contents |
Controlling Shareholder – Pelican
As mentioned above, Pelican purchased our Aly Senior Obligations from Tiger for $5.1 million as a part of the Recapitalization. Effective January 31, 2017, the Recapitalization was completed and resulted in the following:
|
| · | Pelican’s contribution of approximately $16.1 million of the Aly Senior Obligations into shares of Series A convertible preferred stock that represents approximately 80% of our common stock, or 53,628,842 common shares, on a fully diluted basis. The preferred shares carried a liquidation preference of $16.1 million upon issuance. |
|
| · | Amendment of the Company’s credit agreement acquired by Pelican into a new credit agreement (consisting of a $5.1 million term loan and $1.0 million revolving credit arrangement) with an extended maturity date of December 31, 2018. |
On January 31, 2017 upon completion of the Recapitalization, Pelican had the power to vote the substantial majority of the Company’s outstanding common stock. Currently six of our board members and all four of our executive officers hold an ownership interest in Pelican.
On May 23, 2017, in consideration of the increase in the revolving credit facility and the extension of the final maturity date, the Company agreed to issue Pelican an amendment fee of 1,200 shares of our Series A convertible preferred stock.
Other Related Party Transactions
Tim Pirie, who was appointed to our board of directors on March 3, 2015, was one of the sellers of United to us in April 2014. Part of the acquisition price was payable in contingent consideration of which $0.9 million was paid in 2015. Of that amount, approximately $0.1 million was attributable to Mr. Pirie. We did not make any contingent payments during 2016. As of December 31, 2016, we estimated the fair value of future contingent payments to be $0.8 million of which approximately $0.2 million would be attributable to Mr. Pirie. On January 31, 2017, in connection with the Recapitalization, the aggregate contingent payment liability was converted into 457,494 shares of the Company’s common stock of which Mr. Pirie controls all of the voting rights to 326,834 shares.
As part of the acquisition price of United, the sellers also received Aly Centrifuge redeemable preferred stock. On January 31, 2017, the outstanding Aly Centrifuge redeemable preferred stock and accrued PIK dividends were converted into 3,039,517 shares of the Company’s common stock of which Mr. Pirie controls all of the voting rights to 593,815 shares.
Professional Fees - Recapitalization
During 2016, we recorded $0.2 million of expenses for professionals engaged by our former lender, Wells Fargo, whom the Company was required to pay under the terms of our credit facility. On December 12, 2016, these fees were assumed by Pelican and, on January 31, 2017, included within the Aly Senior Obligations refinanced in connection with the Recapitalization.
Discontinued Operations
On October 26, 2016, we abandoned the operations of Evolution, our directional drilling and MWD business, as a part of the Recapitalization. The abandonment of these operations meets the criteria established for recognition as discontinued operations under generally accepted accounting principles in U.S. GAAP.
| 13 |
| Table of Contents |
The following table summarizes the components of loss from discontinued operations, net of income taxes included in the condensed consolidated statements of operations (in thousands):
|
|
| For the Three Months Ended June 30, |
|
| For the Six Months Ended June 30, |
| ||||||||||
|
|
| 2016 |
|
| 2015 |
|
| 2016 |
|
| 2015 |
| ||||
|
|
| (unaudited) |
|
| (unaudited) |
| ||||||||||
|
|
|
|
|
|
|
|
|
|
|
|
|
| ||||
| Revenue |
| $ | 72 |
|
| $ | 926 |
|
| $ | 252 |
|
| $ | 2,860 |
|
|
|
|
|
|
|
|
|
|
|
|
|
|
|
|
|
|
|
| Expenses: |
|
|
|
|
|
|
|
|
|
|
|
|
|
|
|
|
| Operating expenses |
|
| 26 |
|
|
| 895 |
|
|
| 128 |
|
|
| 2,740 |
|
| Depreciation and amortization |
|
| 172 |
|
|
| 196 |
|
|
| 344 |
|
|
| 391 |
|
| Selling, general and administrative expenses |
|
| 65 |
|
|
| 537 |
|
|
| 159 |
|
|
| 1,049 |
|
| Reduction in value of assets |
|
| 1,255 |
|
|
| - |
|
|
| 1,255 |
|
|
| - |
|
| Total expenses |
|
| 1,518 |
|
|
| 1,628 |
|
|
| 1,886 |
|
|
| 4,180 |
|
|
|
|
|
|
|
|
|
|
|
|
|
|
|
|
|
|
|
| Loss from discontinued operations |
|
| (1,446 | ) |
|
| (702 | ) |
|
| (1,634 | ) |
|
| (1,320 | ) |
|
|
|
|
|
|
|
|
|
|
|
|
|
|
|
|
|
|
| Interest expense, net |
|
| 1 |
|
|
| - |
|
|
| 1 |
|
|
| 1 |
|
| Loss from discontinued operations before income taxes |
|
| (1,447 | ) |
|
| (702 | ) |
|
| (1,635 | ) |
|
| (1,321 | ) |
|
|
|
|
|
|
|
|
|
|
|
|
|
|
|
|
|
|
| Income tax benefit |
|
| (190 | ) |
|
| (48 | ) |
|
| (253 | ) |
|
| (82 | ) |
| Loss from discontinued operations, net of income taxes |
| $ | (1,257 | ) |
| $ | (654 | ) |
| $ | (1,382 | ) |
| $ | (1,239 | ) |
In connection with the Recapitalization and the abandonment of the Evolution assets, we recorded an[AHH2] impairment of property and equipment totaling $1.3 million during the three months ended June 30, 2016 included in the line item “Reduction in value of assets” in the above table. The value remaining for property and equipment, intangibles and goodwill associated with these discontinued operations was reduced to zero on October 26, 2016 upon the execution of the transaction with Tiger.
The following summarizes the assets and liabilities associated with discontinued operations as of June 30, 2016 and December 31, 2015 (in thousands):
|
|
| June 30, 2016 |
|
| December 31, 2015 |
| ||
|
|
| (unaudited) |
|
|
|
| ||
| Current assets |
| $ | 64 |
|
| $ | 222 |
|
| Property and equipment, net |
|
| 508 |
|
|
| 1,933 |
|
| Intangible assets, net |
|
| 793 |
|
|
| 1,004 |
|
| Goodwill |
|
| 264 |
|
|
| 264 |
|
| Other assets |
|
| 3 |
|
|
| 5 |
|
| Total assets |
|
| 1,632 |
|
|
| 3,428 |
|
|
|
|
|
|
|
|
|
|
|
| Current liabilities |
|
| 277 |
|
|
| 436 |
|
| Deferred tax liabilities |
|
| 512 |
|
|
| 754 |
|
| Other liabilities |
|
| 14 |
|
|
| 21 |
|
| Total liabilities |
|
| 803 |
|
|
| 1,211 |
|
|
|
|
|
|
|
|
|
|
|
| Net assets |
| $ | 829 |
|
| $ | 2,217 |
|
By December 31, 2016, the abandonment of these operations and sell-off of the remaining assets was completed with approximately $0.2 million of remaining liabilities assumed by the continuing operations of the Company.
2017 Stock Option Plan
Effective April 4, 2017, the 2017 Stock Option Plan (the “2017 Plan”) was approved by the board of directors. On April 4, we granted approximately 16.9 million common shares under the 2017 Plan which was the maximum amount authorized. The option contract term is 10 years and the exercise price is $0.10. The options vested and became exercisable immediately upon grant. The Company is in the process of determining the value of these options.
NOTE 3 — REDUCTION IN VALUE OF ASSETS AND OTHER CHARGES
During the three months and six months ended June 30, 2016, the Company incurred a reduction in value of assets of $0.5 million and $0.8 million, respectively. The Company did not incur any reduction in value of assets charges during the three and six months ended June 30, 2015.
The components of reduction in value of assets are as follows (in thousands):
|
|
| For the Three Months Ended June 30, |
|
| For the Six Months Ended June 30, |
| ||||||||||
|
|
| 2016 |
|
| 2015 |
|
| 2016 |
|
| 2015 |
| ||||
|
|
| (Unaudited) |
|
| (Unaudited) |
| ||||||||||
| Reduction in value of property and equipment - disposals |
| $ | - |
|
| $ | - |
|
| $ | 300 |
|
| $ | - |
|
| Reduction in value of intangibles |
|
| 543 |
|
|
| - |
|
|
| 543 |
|
|
| - |
|
| Total reduction in value of assets |
| $ | 543 |
|
| $ | - |
|
| $ | 843 |
|
| $ | - |
|
Reduction in Value of Property and Equipment – Disposals
During the six months ended June 30, 2016, the Company recorded a loss on the disposal of property and equipment of $0.3 million when the Company sold idle and underutilized equipment and vehicles with a net book value of $0.8 million for cash proceeds of approximately $0.5 million. Due to the depressed market for oilfield services, these assets were sold for proceeds significantly less than the net book value resulting in higher losses than normal. These assets were sold within the basket of permitted asset sales, as defined in our credit facility, and the Company used the proceeds to fund working capital needs created by the significant deterioration in the industry throughout 2015.
Reduction in Value of Intangibles
During the three months ended June 30, 2016, the Company recorded a $0.5 million reduction in an intangible associated with a non-compete which management determined was non-enforceable. As of June 30, 2016, this intangible was recorded with no value on the condensed consolidated balance sheet. As of December 31, 2015, the non-compete was recorded at $0.7 million on the consolidated balance sheet.
Professional Fees – Recapitalization
During the three and six months ended June 30, 2016, in connection with forbearance agreements and other negotiations with its former lender, Wells Fargo, and in connection with the Recapitalization, the Company recorded an aggregate of approximately $10,000 and $0.1 million in charges, primarily for professional fees, which are included in selling, general and administrative expenses on the condensed consolidated statements of operations.
Severance Expense – Operational Restructuring
During the three months ended June 30, 2016 and 2015, the Company recorded $0.5 million and approximately $95,000 in charges relating to severance due to the significant downturn in the industry. In 2016, we ceased making cash severance payments due to our limited liquidity and we do not know when or if we will be able to satisfy the remaining outstanding severance claims. As such, there was an accrued severance liability balance of $0.5 million as of June 30, 2016 which is included in accounts payable and accrued expenses on the condensed consolidated balance sheet. As of December 31, 2015, an accrued severance liability of $0.1 is included in accrued expenses on the consolidated balance sheet.
| 15 |
| Table of Contents |
NOTE 4 — LONG-LIVED ASSETS
Property and Equipment
Major classifications of property and equipment are as follows (in thousands):
|
|
| June 30, 2016 |
|
| December 31, 2015 |
| ||
|
|
| (unaudited) |
|
|
| |||
|
|
|
|
|
|
|
| ||
| Machinery and equipment |
| $ | 53,798 |
|
| $ | 53,677 |
|
| Vehicles, trucks and trailers |
|
| 4,582 |
|
|
| 5,699 |
|
| Office furniture, fixtures and equipment |
|
| 544 |
|
|
| 544 |
|
| Leasehold improvements |
|
| 213 |
|
|
| 213 |
|
| Buildings |
|
| 212 |
|
|
| 212 |
|
|
|
|
| 59,349 |
|
|
| 60,345 |
|
|
|
|
|
|
|
|
|
|
|
| Less: Accumulated depreciation and amortization |
|
| (10,149 | ) |
|
| (8,758 | ) |
|
|
|
| 49,200 |
|
|
| 51,587 |
|
|
|
|
|
|
|
|
|
|
|
| Assets not yet placed in service |
|
| 16 |
|
|
| 202 |
|
| Property and equipment, net |
| $ | 49,216 |
|
| $ | 51,789 |
|
See “Note 3 – Reduction in Value of Assets and Other Charges” for further discussion on asset disposals during the three and six months ended June 30, 2016 and 2015.
Depreciation and amortization expense related to property and equipment for the three months ended June 30, 2016 and 2015 was $1.0 million and $1.1 million, respectively. Depreciation and amortization expense related to property and equipment for the six months ended June 30, 2016 and 2015 was $2.1 million and $2.2 million, respectively.
Intangible Assets
Intangible assets consist of the following (in thousands):
|
|
| Customer Relationships |
|
| Tradename |
|
| Non-Compete |
|
| Supply Agreements |
|
| Total |
| |||||
|
|
|
|
|
|
|
|
|
|
|
|
|
|
|
|
| |||||
| As of June 30, 2016 (unaudited): |
|
|
|
|
|
|
|
|
|
|
|
|
|
|
| |||||
| Cost |
| $ | 5,322 |
|
| $ | 2,174 |
|
| $ | 492 |
|
| $ | 1,686 |
|
| $ | 9,674 |
|
| Less: Accumulated amortization |
|
| (1,633 | ) |
|
| (639 | ) |
|
| (361 | ) |
|
| (931 | ) |
|
| (3,564 | ) |
| Net book value |
| $ | 3,689 |
|
| $ | 1,535 |
|
| $ | 131 |
|
| $ | 755 |
|
| $ | 6,110 |
|
|
|
|
|
|
|
|
|
|
|
|
|
|
|
|
|
|
|
|
|
|
|
| As of December 31, 2015: |
|
|
|
|
|
|
|
|
|
|
|
|
|
|
|
|
|
|
|
|
| Cost |
| $ | 5,322 |
|
| $ | 2,174 |
|
| $ | 1,651 |
|
| $ | 1,686 |
|
| $ | 10,833 |
|
| Less: Accumulated amortization |
|
| (1,367 | ) |
|
| (531 | ) |
|
| (806 | ) |
|
| (720 | ) |
|
| (3,424 | ) |
| Net book value |
| $ | 3,955 |
|
| $ | 1,643 |
|
| $ | 845 |
|
| $ | 966 |
|
| $ | 7,409 |
|
Amortization expense in each of the three-month periods ended June 30, 2016 and 2015 was approximately $0.4 million. Amortization expense in each of the six-month periods ended June 30, 2016 and 2015 was approximately $0.8 million.
See further discussion of reduction in value of intangibles during the three and six months ended June 30, 2016 and 2015 in “Note 3 – Reduction in Value of Assets and Other Charges” and “Note 2 –Recent Developments and Subsequent Events” within the Discontinued Operations heading.
| 16 |
| Table of Contents |
NOTE 5 — LONG-TERM DEBT
Credit Facility: Term Loan, Delayed Draw Term Loan, and Revolving Credit Facility
Our primary credit facility with Wells Fargo consisted of a term loan, a delayed draw term loan, and a revolving credit facility (“Credit Facility”, as amended). Obligations under the Credit Facility were as follows:
|
| · | Term loan – In 2014, our original principal balance on the term loan was $25.0 million; this loan required principal payments each quarter of $1.3 million. |
|
| · | Delayed draw term loan – In 2014, our original availability under the delayed draw term loan was $5.0 million; the full availability of the loan was reached in May 2015 and beginning in June 2015 the principal balance of $5.0 million required scheduled principal payments each quarter of $0.3 million. |
|
| · | Revolving credit facility – In 2014, our original availability under the revolving credit facility was $5.0 million; however, after subsequent amendments, our availability was reduced to $1.0 million as of December 31, 2015 and then to zero as of December 31, 2016. There were no outstanding borrowings under the revolving credit facility as of June 30, 2016 and December 31, 2015. |
Borrowings under the Credit Facility were subject to interest at the annual base rate at the greater of:
|
| (i) | the Wells Fargo’s Prime Rate, plus a margin of 1.75%, |
|
| (ii) | the Federal Funds Rate plus 0.5%, plus a margin of 1.75% or |
|
| (iii) | the one-month LIBOR rate on such day plus 1.00%, plus a margin of 1.75%. |
Beginning in July 2016, our rate increased to the default rate of 7.25% in connection with the subsequent amendments and forbearance agreements.
The obligations under the Credit Facility were guaranteed by all of our subsidiaries and secured by substantially all of our assets. The credit agreement contained customary events of default and covenants including restrictions on our ability to incur additional indebtedness, make capital expenditures, pay dividends or make other distributions, grant liens and sell assets.
Effective September 30, 2015, we entered into an amendment to the Credit Facility ("Amendment"). In connection with the execution of the Amendment, we used the proceeds of $3.4 million from a private offering to make the regularly scheduled principal payment of $1.5 million due on September 30, 2015 and to make a prepayment of $1.9 million on the term loan.
The Amendment modified multiple components of the Credit Facility including, but not limited to, the terms listed below. The Amendment:
|
| (i) | waived our covenant default as of June 30, 2015; |
|
| (ii) | deferred all further principal payments on outstanding borrowings under the Credit Facility until March 31, 2017; |
|
| (iii) | revised certain financial covenants to facilitate our compliance with such covenants during the downturn in the oilfield services industry; and, |
|
| (iv) | reduced the size of the revolving credit facility to $1.0 million. |
Due to the significant downturn in the oilfield services industry throughout 2015, as of December 31, 2015, we were not in compliance with certain financial covenants set forth in our Credit Facility due to our poor financial results.
On March 31, 2016, we completed the execution and delivery of a forbearance agreement and amendment to the Credit Facility. Among other provisions, the lenders agreed to forbear from exercising their remedies under the Credit Facility until the earlier of July 10, 2016 or the date on which forbearance was terminated due to specified events, including (i) the occurrence of other defaults under the Credit Facility, (ii) our failure to hire an independent financial advisor prior to April 10, 2016 or (iii) our failure to present a detailed plan for asset sales or equity capital acceptable to the lenders yielding net cash proceeds to us of at least $2.5 million by May 25, 2016. We hired an independent financial advisor and such advisor commenced the engagement prior to the deadline of April 10, 2016. In conjunction with agreeing to forbear from exercising their remedies under the Credit Facility, the lenders reduced the revolving credit portion of the Credit Facility to zero thereby eliminating our ability to borrow additional funds under the Credit Facility.
| 17 |
| Table of Contents |
On May 13, 2016, we further amended the Credit Facility and the forbearance agreement related to such facility to increase our basket of permitted asset sales to $0.6 million in any calendar year provided that any proceeds from permitted asset sales be deposited in a blocked deposit account with Wells Fargo. We also acknowledged that we were unable to comply with certain financial covenants as of March 31, 2016.
On August 5, 2016, we entered into a new agreement with Wells Fargo, the Limited Forbearance Agreement, in which Wells Fargo agreed to forbear from exercising their remedies under the credit agreement until August 31, 2016, conditioned upon the following, among other items: (i) hiring a Chief Restructuring Officer (“CRO”) on terms acceptable to the lender; (ii) having the CRO provide an initial cash forecast budget prior to August 10, 2016 and weekly updates thereafter; (iii) not incurring a variance of more than 10% from the cash flow budgets; and, (iv) paying accrued interest monthly effective July 21, 2016 at the default rate specified in the Credit Facility. As mandated, effective August 5, 2016, our board selected Chris Quinn to serve as CRO of the Company. On October 5, 2016, Wells Fargo extended the forbearance period until October 19, 2016.
On October 26, 2016, in connection with the Recapitalization, the Aly Senior Obligations, which included the Credit Facility and the outstanding equipment financing and capital leases in favor of Wells Fargo and Well Fargo Equipment Finance, respectively, were acquired by Tiger. Simultaneously, we entered into the Third Limited Forbearance Agreement which extended the forbearance period to December 9, 2016 and reduced the Aly Senior Obligations in the amount of $2.0 million, conditioned upon the following, among other items: (i) Tiger entering into an assignment agreement with Pelican; (ii) Pelican providing $500,000 of unsecured working capital financing to the Company pending the closing; and, (iii) the Company transferring to Tiger certain excess equipment and vehicles which the Company was not utilizing and did not consider as necessary for its operations. The Company recorded a debt modification fee of $0.6 million in connection with the execution of the Third Limited Forbearance Agreement.
Effective December 12, 2016, the Aly Senior Obligations were acquired by Pelican. See further discussion in “Note 2 – Recent Developments and Subsequent Events”.
Subordinated Note Payable
On August 15, 2014, we completed a bulk equipment purchase for total consideration of $10.3 million of which $2.0 million was in the form of a subordinated note payable (“Subordinated Note Payable”).
On March 18, 2015, the outstanding Subordinated Note Payable was amended to extend the final maturity date to June 30, 2017 and to increase the interest rate to 10% per annum. Subsequent to an aggregate principal and interest payment of approximately $0.6 million on March 31, 2015, additional payments of interest and principal were not required until June 30, 2017. The Subordinated Note Payable was generally subordinated in right of payment to our indebtedness to its lenders.
In connection with the Recapitalization, the Subordinated Note Payable was converted into 1,200,000 common shares of the Company. This conversion was accounted for as a trouble debt restructuring, see further details in “Note 2 – Recent Developments and Subsequent Events”. As of January 31, 2017, there were no further obligations due under the Subordinated Note Payable.
Equipment Financing and Capital Leases
We finance the purchase of certain vehicles and equipment using long-term equipment loans and using non-cancelable capital leases. Repayment occurs over the term of the loan or lease, typically three to five years, in equal monthly installments which include principal and interest.
Effective June 30, 2016, the Company entered into an amendment for each capital lease outstanding with Wells Fargo Equipment Finance, aggregating $1.9 million, whereby the maturity date was extended by six months and principal payments suspended for a period of six months.
Effective October 26, 2016, our equipment financing and capital leases with Wells Fargo Equipment Finance were included in the Aly Senior Obligations which were acquired by Tiger, then subsequently acquired on December 12, 2016 by Pelican. See further discussion in “Note 2 – Recent Developments and Subsequent Events”.
In January 2017, in order to reduce our debt service obligations, we returned certain underutilized and idle vehicles under capital leases with a net book value of $0.1 million to the lessor in exchange for the release of all outstanding obligations, aggregating to approximately $0.1 million, resulting in a reduction in value of assets of approximately $38,000.
As of January 31, 2017, we had one remaining capital lease with a balance of approximately $9,000 which was assumed by the continuing operations of the Company in connection with our discontinued operations effective December 31, 2016.
| 18 |
| Table of Contents |
Deferred Loan Costs
Costs incurred to obtain financing are capitalized and amortized on a straight-line basis over the term of the loan, which approximates the effective interest method. The amortization of these costs is classified within interest expense on the accompanying condensed consolidated statements of operations and was approximately $0.1 million in each of the three-month periods ended June 30, 2016 and 2015 and approximately $0.2 million in each of the six-month periods ended June 30, 2016 and 2015.
During the fourth quarter of 2016, in connection with various amendments to our credit facility and in connection with the Recapitalization, we incurred an aggregate charge of $0.1 million, classified within interest expense, to write-off all remaining unamortized deferred loan costs. There were no new deferred loan costs recorded in connection with the Recapitalization.
As a result of the adoption of Accounting Standards Update ("ASU") 2015-03, “Simplifying the Presentation of Debt Issuance Costs” on January 1, 2016, the Company reclassified debt issuance costs of $0.2 million and retrospectively reclassified debt issuance costs of $0.4 million as a reduction in the carrying amount of the related Credit Facility as of June 30, 2016 and December 31, 2015, respectively.
Deferred loan costs and accumulated amortization were $1.0 million and $0.8 million, respectively, as of June 30, 2016. Deferred loan costs and accumulated amortization were $1.0 million and $0.6 million, respectively, as of December 31, 2015.
Long-term debt consists of the following (in thousands):
|
|
| June 30, 2016 |
|
| December 31, 2015 |
| ||||||||||
|
|
| Current |
|
| Long-Term |
|
| Current |
|
| Long-Term |
| ||||
|
|
| (Unaudited) |
|
|
|
|
|
|
| |||||||
| Credit facility |
|
|
|
|
|
|
|
|
|
|
|
| ||||
| Term loan |
| $ | 15,573 |
|
| $ | - |
|
| $ | 15,573 |
|
| $ | - |
|
| Delayed draw term loan |
|
| 4,500 |
|
|
| - |
|
|
| 4,500 |
|
|
| - |
|
| Subordinated note payable |
|
| 1,500 |
|
|
| - |
|
|
| - |
|
|
| 1,500 |
|
| Equipment financing and capital leases |
|
| 696 |
|
|
| 1,365 |
|
|
| 683 |
|
|
| 1,685 |
|
|
|
|
| 22,269 |
|
|
| 1,365 |
|
|
| 20,756 |
|
|
| 3,185 |
|
| Less: Deferred loan costs, net |
|
| (230 | ) |
|
| - |
|
|
| (403 | ) |
|
| - |
|
| Total |
| $ | 22,039 |
|
| $ | 1,365 |
|
| $ | 20,353 |
|
| $ | 3,185 |
|
As of June 30, 2016 and December 31, 2015, we had approximately $2.1 million and $2.4 million outstanding under equipment financing and capital leases, respectively. The gross amount of equipment held under capital leases and accumulated amortization of that same equipment was approximately $3.5 million and $1.0 million, respectively, as of December 31, 2015. There were no additions or disposals of equipment held under capital lease during the six months ended June 30, 2015.
NOTE 6 — REDEEMABLE PREFERRED STOCK
Two of our subsidiaries have redeemable preferred stock outstanding as of June 30, 2016. Aly Operating issued redeemable preferred stock in connection with the acquisition of Austin Chalk (“Aly Operating Redeemable Preferred Stock”) and Aly Centrifuge issued redeemable preferred stock in connection with the United Acquisition (“Aly Centrifuge Redeemable Preferred Stock”).
On January 31, 2017, in connection with the Recapitalization, the Aly Operating Redeemable Preferred Stock, the Aly Centrifuge Redeemable Preferred Stock and all accrued dividends on such stock were converted into 5,454,488 shares of common stock.
Aly Operating Redeemable Preferred Stock
As part of the acquisition of Austin Chalk, Aly Operating agreed to issue up to 4 million shares of Aly Operating Redeemable Preferred Stock, with a par value of $0.01, to the seller, with a fair value and liquidation value of $3.8 million and $4.0 million, respectively. The preferred stock was valued as of the date of acquisition by discounting the sum of (i) the liquidation value at issuance and (ii) the future cumulative accrued dividends as of the date of optional redemption for a lack of marketability.
The Aly Operating Redeemable Preferred Stock was entitled to a cumulative paid-in-kind dividend of 5% per year on its liquidation preference, compounded quarterly. Aly Operating was not required to pay cash dividends.
| 19 |
| Table of Contents |
The following table describes the changes in Aly Operating Redeemable Preferred Stock for the six months ended June 30, 2016 (in thousands, except for shares):
|
|
| Carrying Value of Aly Operating Redeemable Preferred Stock |
|
| Number of Outstanding Aly Operating Redeemable Preferred Shares |
|
| Liquidation Value of Aly Operating Redeemable Preferred Stock |
| |||
|
|
|
|
|
| (unaudited) |
|
|
|
| |||
| January 1, 2016 |
| $ | 4,647 |
|
|
| 4,000,000 |
|
| $ | 4,685 |
|
| Accrued dividends |
|
| 118 |
|
|
| - |
|
|
| 118 |
|
| Accretion |
|
| 19 |
|
|
| - |
|
|
| - |
|
| June 30, 2016 |
| $ | 4,784 |
|
|
| 4,000,000 |
|
| $ | 4,803 |
|
The Aly Operating Redeemable Preferred Stock is classified outside of permanent equity in our consolidated balance sheet because the settlement provisions provided the holder the option to require Aly Operating to redeem the Aly Operating Redeemable Preferred Stock at the liquidation price plus any accrued dividends upon a liquidity event, as defined in the agreement, or upon an initial public offering, as defined in the agreement.
On January 31, 2017, the Aly Operating Redeemable Preferred Stock and all accrued dividends were converted into 2,414,971 shares of common stock in connection with the Recapitalization. This conversion was accounted for as a trouble debt restructuring, see further details in “Note 2 – Recent Developments and Subsequent Events”.
Aly Centrifuge Redeemable Preferred Stock
On April 15, 2014, as part of the United Acquisition, Aly Centrifuge issued 5,000 shares of Aly Centrifuge Redeemable Preferred Stock, with a par value of $0.01, to the sellers in the transaction, with a fair value and liquidation value of $5.1 million and $5.0 million, respectively. The preferred stock was valued as of the date of acquisition by discounting the sum of (i) the value of the preferred stock without a conversion option using the option pricing method and (ii) the value of the conversion option using the Black-Scholes option pricing model for a lack of marketability. In 2015, Aly Centrifuge asserted an indemnification claim of 124 shares against shares that were subject to an eighteen-month holdback for general indemnification purposes pursuant to the purchase agreement.
On August 15, 2014, in connection with a bulk equipment purchase, Aly Centrifuge issued an additional 4,000 shares of Aly Centrifuge Redeemable Preferred Stock, with a par value of $0.01, to the sellers in the transaction, with a fair value and liquidation value of $4.3 million and $4.0 million, respectively. The preferred stock was valued as of the date of the equipment purchase by discounting the sum of (i) the value of the preferred stock without a conversion option using the option pricing method and (ii) the value of the conversion option using the Black-Scholes option pricing model for a lack of marketability.
The Aly Centrifuge Redeemable Preferred Stock was entitled to a cumulative paid-in-kind dividend of 5% per year on its liquidation preference, compounded quarterly. Aly Centrifuge was not required to pay cash dividends.
The following table describes the changes in the Aly Centrifuge Redeemable Preferred Stock for the six months ended June 30, 2016 (in thousands, except for shares):
|
|
| Carrying Value of Aly Centrifuge Redeemable Preferred Stock |
|
| Number of Outstanding Aly Centrifuge Redeemable Preferred Shares |
|
| Liquidation Value of Aly Centrifuge Redeemable Preferred Stock |
| |||
|
|
|
|
|
| (unaudited) |
|
|
|
| |||
| January 1, 2016 |
| $ | 9,755 |
|
|
| 8,876 |
|
| $ | 9,590 |
|
| Accrued dividends |
|
| 241 |
|
|
| - |
|
|
| 241 |
|
| Amortization |
|
| (81 | ) |
|
| - |
|
|
| - |
|
| June 30, 2016 |
| $ | 9,915 |
|
|
| 8,876 |
|
| $ | 9,831 |
|
The Aly Centrifuge Redeemable Preferred Stock is classified outside of permanent equity in our consolidated balance sheet because the settlement provisions provided the holder the option to require Aly Centrifuge to redeem the Aly Centrifuge Redeemable Preferred Stock at the liquidation price plus any accrued dividends.
| 20 |
| Table of Contents |
Aly Centrifuge Redeemable Preferred Stock also included a conversion feature; specifically, the right to exchange into shares of our common stock on any date, from time-to-time, at the option of the holder, into the number of shares equal to the quotient of (i) the sum of (A) the liquidation preference plus (B) an amount per share equal to accrued but unpaid dividends not previously added to the liquidation preference on such share of preferred stock, divided by (ii) 1,000, and (iii) multiplied by the exchange rate in effect at such time (“Conversion Feature”). The exchange rate in effect as of December 31, 2016 was 71.4285 or $14.00 per share of our common stock.
On January 31, 2017, the Aly Centrifuge Redeemable Preferred Stock and all accrued dividends were converted into 3,039,517 shares of common stock in connection with the Recapitalization; however, the shares were not converted according to the terms of the Conversion Feature but instead the conversion rate was negotiated independently as a part of the Recapitalization. This conversion was accounted for as a trouble debt restructuring, see further details in “Note 2 – Recent Developments and Subsequent Events”.
NOTE 7 — STOCK-BASED COMPENSATION
Stock-Based Payments
We issued 15,625 shares of our stock during the three months ended June 30, 2015 as part of compensation to one of our former employees in accordance with his employment agreement. In connection with this issuance, we recognized stock-based compensation expense of $0.1 million for the three and six months ended June 30, 2015.
Stock Options
As of June 30, 2016 and 2015, we had a stock-based compensation plan available to grant incentive stock options, non-qualified stock options and restricted stock to employees and non-employee members of the board of directors.
The Omnibus Incentive Plan (the “Plan”) was approved by the board of directors on May 2, 2013. On May 2, 2013, we granted 338,474 common shares under the Plan, which was the maximum number authorized. On June 5, 2015, a majority of our stockholders approved an amendment to our Plan to increase the maximum authorized shares to 750,000 common shares.
The option contract term is 10 years and the exercise price is $4.00. The options vest and are exercisable if a “Liquidity Event” occurs and certain conditions are met. A Liquidity Event is defined as an IPO or a change of control, as defined in the plan. Pursuant to the plan, an IPO is defined as an underwritten public offering of shares. If the first Liquidity Event is an IPO, then the options vest and are exercisable immediately if the IPO is effected at a price of $8.00 per share or greater. If the IPO is effected at a price less than $8.00 per share, but the stock price post-IPO reaches $8.00 per share during the six-month period immediately following the IPO, then the options vest and are exercisable. If the IPO is effected at a price less than $8.00 per share and the share price does not reach $8.00 per share prior to the sixth month anniversary of the IPO, the options do not vest and expire. If the first Liquidity Event to occur is a change of control, then the options vest if the change of control takes place at a price of at least $8.00 per share. If such change in control occurs at a price less than $8.00 per share, the options do not vest and expire.
The fair value of each option award granted under the Plan is estimated on the date of grant using the Monte Carlo simulation method. The same Monte Carlo simulation method is used to determine the derived service period of five years. In addition, expected volatilities have been based on comparable public company data, with consideration given to our limited historical data. We make estimates with respect to employee termination and forfeiture rates of the options within the valuation model. The risk-free rate is based on the approximate U.S. Treasury yield rate in effect at the time of grant. For options granted prior to the Share Exchange, the calculation of our stock price involved the use of different valuation techniques, including a combination of an income and/or market approach. Determination of the fair value was a matter of judgment and often involved the use of significant estimates and assumptions.
As of June 30, 2016 and December 31, 2015, options to purchase 330,111 common shares under the Plan were outstanding and there was $0.5 million of total unrecognized compensation cost related to non-vested stock option awards. Such amount will be recognized in the future upon occurrence of a Liquidity Event that results in a vesting of the options. No options were granted during the three months ended June 30, 2016 and 2015 or the six months ended June 30, 2016 and 2015. No forfeitures during the three and six months ended June 30, 2016 and 2015.
| 21 |
| Table of Contents |
NOTE 8 — SUPPLEMENTAL CASH FLOW INFORMATION
Supplemental cash flows and non-cash investing and financing activities are as follows (in thousands):
|
|
| For the Six Months Ended June 30, |
| |||||
|
|
| 2016 |
|
| 2015 |
| ||
|
|
| (Unaudited) |
| |||||
| Supplemental disclosure of cash flow information: |
|
|
|
|
|
| ||
| Cash paid for interest |
| $ | 585 |
|
| $ | 766 |
|
| Cash paid for income taxes, net |
|
| 5 |
|
|
| 200 |
|
|
|
|
|
|
|
|
|
|
|
| Non-cash investing and financing activities: |
|
|
|
|
|
|
|
|
| Purchase of equipment through a capital lease obligation |
| $ | - |
|
| $ | 1,068 |
|
| Accretion of preferred stock liquidation preference, net |
|
| 62 |
|
|
| 65 |
|
| Paid-in-kind dividends on preferred stock |
|
| 359 |
|
|
| 353 |
|
| Common shares issued for transaction cost of equity raise |
|
| - |
|
|
| 618 |
|
| Liability for transaction cost of equity raise |
|
| - |
|
|
| 26 |
|
NOTE 9 — NEW ACCOUNTING STANDARDS
Accounting Standards Recently Adopted
In November 2016, the FASB issued ASU No. 2016-18 Statement of Cash Flows (Topic 230), Restricted Cash. This standard provides guidance on the presentation of restricted cash and restricted cash equivalents in the statement of cash flows. Restricted cash and restricted cash equivalents should be included with cash and cash equivalents when reconciling the beginning-of-period and end-of-period amounts shown on the statements of cash flows. The amendments of this ASU should be applied using a retrospective transition method and are effective for reporting periods beginning after December 15, 2017, with early adoption permitted. Other than the revised statement of cash flows presentation of restricted cash, the adoption of ASU 2016-18 did not have an impact on our consolidated financial statements.
In November 2015, the FASB issued ASU 2015-17, Income Taxes: Balance Sheet Classification of Deferred Taxes, which eliminates the existing requirement for organizations to present deferred tax assets and liabilities as current and noncurrent in a classified balance sheet and now requires that all deferred tax assets and liabilities be classified as noncurrent. The ASU is effective for annual periods beginning after December 15, 2016, with early application permitted. We elected to early adopt the provisions of this ASU and classified our deferred tax balances as a non-current liability as of December 31, 2016 and 2015. The adoption has no effect on net income or cash flows.
In September 2015, the FASB issued ASU 2015-16, Business Combinations: Simplifying the Accounting for Measurement-Period Adjustments, which requires that an acquirer recognize adjustments to provisional amounts that are identified during the measurement period in the reporting period in which the adjustment amounts are determined. The amendments in the ASU require that the acquirer record, in the same period’s financial statements, the effect on earnings of changes in depreciation, amortization, or other income effects, if any, as a result of the change to the provisional amounts, calculated as if the accounting had been completed at the acquisition date. The amendments are effective for annual reporting periods beginning after December 15, 2015. The adoption of ASU 2015-16 did not have an impact on our financial condition or results of operations.
In August 2015, the FASB issued ASU 2015-15, Interest - Imputation of Interest: Presentation and Subsequent Measurement of Debt Issuance Costs Associated with Line-of-Credit Arrangements, which adds comments from the Securities and Exchange Commission (SEC) addressing ASU 2015-03, as discussed above, and debt issuance costs related to line-of-credit arrangements. The SEC commented it would not object to an entity deferring and presenting debt issuance costs as an asset and subsequently amortizing the deferred debt issuance costs ratably over the term of the line-of-credit arrangement, regardless of whether there are any outstanding borrowings on the line-of-credit arrangement. We adopted ASU 2015-15 in connection with our adoption of ASU 2015-03 effective January 1, 2016. The adoption of ASU 2015-15 did not have an impact on our financial condition or results of operations.
| 22 |
| Table of Contents |
In April 2015, the FASB issued ASU 2015-03, Interest - Imputation of Interest (Subtopic 835-30): Simplifying the Presentation of Debt Issuance Costs. The amendments in the ASU change the balance sheet presentation requirements for debt issuance costs by requiring them to be presented as a direct reduction to the carrying amount of the related debt liability. The amendments are effective for financial statements issued for fiscal years beginning after December 15, 2015, and interim periods within those fiscal years. Early adoption is permitted. Transitioning to the new guidance requires retrospective application. We implemented the required change to the presentation of our debt issuance costs in the first quarter of fiscal year 2016, as expected such change did not have a material impact to our consolidated financial statements.
In November 2014, the FASB issued ASU 2014-16, Determining Whether the Host Contract in a Hybrid Financial Instrument Issued in the Form of a Share Is More Akin to Debt or to Equity, which clarifies how to evaluate the economic characteristics and risks of a host contract in a hybrid financial instrument that is issued in the form of a share. Specifically, the ASU requires that an entity consider all relevant terms and features in evaluating the nature of the host contract and clarifies that the nature of the host contract depends upon the economic characteristics and the risks of the entire hybrid financial instrument. An entity should assess the substance of the relevant terms and features, including the relative strength of the debt-like or equity-like terms and features given the facts and circumstances, when considering how to weight those terms and features. The adoption of ASU 2014-16 did not have an impact on our financial condition or results of operations.
In August 2014, the FASB issued ASU 2014-15, Presentation of Financial Statements – Going Concern (Subtopic 205-40): Disclosure of Uncertainties about an Entity’s Ability to Continue as a Going Concern, which defines management’s responsibility to evaluate whether there is substantial doubt about the company’s ability to continue as a going concern and provides guidance on the related footnote disclosure. Management should evaluate whether there are conditions or events that raise substantial doubt about the company’s ability to continue as a going concern within one year after the date the annual or interim financial statements are issued. We adopted these provisions in the first quarter of 2016 and will provide such disclosures as required if there are conditions and events that raise substantial doubt about our ability to continue as a going concern, as expected such change did not have a material impact to our consolidated financial statements.
In June 2014, the FASB issued Accounting Standards Update No. 2014-12, Compensation — Stock Compensation (Topic 718), Accounting for Share-Based Payments When the Terms of an Award Provide That a Performance Target Could Be Achieved after the Requisite Service Period (a consensus of the FASB Emerging Issues Task Force). The guidance applies to all reporting entities that grant their employees share-based payments in which the terms of the award provide that a performance target that affects vesting could be achieved after the requisite service period. The amendments require that a performance target that affects vesting and that could be achieved after the requisite service period is treated as a performance condition. For all entities, the amendments in this Update are effective for annual periods and interim periods within those annual periods beginning after December 15, 2015. Earlier adoption is permitted. The effective date is the same for both public business entities and all other entities. The adoption of ASU 2014-12 did not have an impact on our financial condition or results of operations.
Accounting Standards Not Yet Adopted
In August 2016, the FASB issued ASU 2016-15, “Statement of Cash Flows (Topic 230), Classification of Certain Cash Receipts and Cash Payments (a consensus of the FASB Emerging Issues Task Force) (ASU 2016-15)”, that clarifies how entities should classify certain cash receipts and cash payments on the statement of cash flows. The guidance also clarifies how the predominance principle should be applied when cash receipts and cash payments have aspects of more than one class of cash flows. The guidance will be effective for annual periods beginning after December 15, 2017 and interim periods within those annual periods. Early adoption is permitted. The Company is evaluating the effect of ASU 2016-15 on its consolidated financial statements.
In March 2016, the FASB Issued ASU 2016-09, Compensation—Stock Compensation (Topic 718): Improvements to Employee Share-Based Payment Accounting. The updated guidance changes how companies account for certain aspects of share-based payment awards to employees, including the accounting for income taxes, forfeitures, and statutory tax withholding requirements, as well as classification in the statement of cash flows. The Company will adopt the accounting guidance as of January 1, 2017. The adoption of this ASU will not have a material impact on the Company’s consolidated financial statements.
In February 2016, the FASB issued ASU 2016-02, Leases (Topic 842), which will replace the existing lease guidance. The standard is intended to provide enhanced transparency and comparability by requiring lessees to record right-of-use assets and corresponding lease liabilities on the balance sheet. Additional disclosure requirements include qualitative disclosures along with specific quantitative disclosures with the objective of enabling users of financial statements to assess the amount, timing, and uncertainty of cash flows arising from leases. ASU 2016-02 is effective for the Company for annual reporting periods beginning after December 15, 2018, including interim periods within those fiscal years, with early adoption permitted. The new standard is required to be applied with a modified retrospective approach to each prior reporting period presented. We are currently evaluating the standard to determine the impact of its adoption on the consolidated financial statements.
ASU 2014-09. In May 2014, the FASB issued ASU 2014-09, Revenue from Contracts with Customers (Topic 606). The objective of this ASU is to establish the principles to report useful information to users of financial statements about the nature, amount, timing, and uncertainty of revenue from contracts with customers. The core principle is to recognize revenue to depict the transfer of promised goods or services to customers in an amount that reflects the consideration to which the entity expects to be entitled in exchange for those goods or services. ASU 2014-09 must be adopted using either a full retrospective method or a modified retrospective method. During a July 2015 meeting, the FASB affirmed a proposal to defer the effective date of the new revenue standard for all entities by one year. As a result, ASU 2014-09 is effective for the Company for interim and annual reporting periods beginning after December 15, 2017 with early adoption permitted for interim and annual reporting periods beginning after December 15, 2016. We are currently evaluating the standard to determine the impact of its adoption on the consolidated financial statements, however, management believes that the impact to the financial statements will not be material.
| 23 |
| Table of Contents |
UNAUDITED PRO FORMA CONSOLIDATED BALANCE SHEET
The following unaudited pro forma consolidated balance sheet gives effect to the capital restructuring of Aly Energy Services, Inc. (“the Company”), in a transaction accounted for as both a troubled debt restructuring and extinguishment of debt and other liabilities held as of December 31, 2016 (“Recapitalization”). The Company’s capital structure was significantly impacted as a result of the Recapitalization which was completed on January 31, 2017.
The unaudited consolidated pro forma balance sheet presented herein is based on the historical consolidated balance sheet of the Company after giving effect to the Recapitalization and the assumptions and adjustments described in the accompanying notes to this unaudited pro forma financial statement.
The unaudited consolidated pro forma balance sheet was prepared in accordance with the regulations of the Securities Exchange Commission. The pro forma adjustments reflecting the Recapitalization are based upon troubled debt restructuring (“TDR”) and debt extinguishment accounting in accordance with GAAP and upon the assumptions set forth in the accompanying notes to this unaudited pro forma financial statement.
The historical consolidated balance sheet has been adjusted to give pro forma effect to events that are (i) directly attributable to the Recapitalization and (ii) factually supportable. The pro forma adjustments are based on management's estimates of the fair value of equity exchanged and have been prepared to illustrate the estimated effect of the Recapitalization and certain other adjustments.
The Company’s balance sheet as of December 31, 2016 was derived from its audited financial statements included in the Company’s 10-K, as filed with the Securities and Exchange Commission on September 5, 2017.
The unaudited consolidated pro forma balance sheet does not give effect to the potential impact of current financial conditions, regulatory matters, operating efficiencies or other savings or expenses that may be associated with the Recapitalization. The unaudited consolidated pro forma balance sheet has been prepared for illustrative purposes only and is not necessarily indicative of the financial position in future periods or the financial position that would have been realized had the Company completed the Recapitalization during the specified period. The unaudited pro forma consolidated balance sheet, including the notes thereto, should be read in conjunction with the Company’s historical audited financial statements included in the Company’s 10-K, as filed with the Securities and Exchange Commission on September 5, 2017, and its historical consolidated condensed financial statements included in the Company’s 10Q for the three months ended March 31, 2017, as filed with the Securities and Exchange Commission on September 5, 2017.
| 24 |
| Table of Contents |
UNAUDITED PRO FORMA CONSOLIDATED BALANCE SHEET
AS OF DECEMBER 31, 2016
(in thousands, except share and per share data)
|
|
|
|
| RecapitalizationAdjustments |
|
|
|
| ||||||||||||
|
|
|
|
|
|
|
|
|
|
| Credit |
|
|
|
|
|
| ||||
|
|
| As of |
|
| TDR |
|
|
| Facility |
|
|
|
| |||||||
|
|
| December 31, |
|
| Pro Forma |
|
|
| Pro Forma |
|
|
|
| |||||||
| ASSETS |
| 2016 |
|
| Adjustments (i) |
|
| Notes |
| Adjustments (ii) |
|
| Notes |
| Pro Forma |
| ||||
| Current assets |
|
|
|
|
|
|
|
|
|
|
|
|
|
|
|
| ||||
| Cash and cash equivalents |
| $ | 681 |
|
| $ | - |
|
|
|
| $ | - |
|
|
|
| $ | 681 |
|
| Restricted cash |
|
| 30 |
|
|
|
|
|
|
|
|
|
|
|
|
|
|
| 30 |
|
| Receivables, net |
|
| 1,448 |
|
|
|
|
|
|
|
|
|
|
|
|
|
|
| 1,448 |
|
| Prepaid expenses and other current assets |
|
| 496 |
|
|
| (31 | ) |
| (b) |
|
|
|
|
|
|
|
| 465 |
|
| Total current assets |
|
| 2,655 |
|
|
| (31 | ) |
|
|
|
| - |
|
|
|
|
| 2,624 |
|
|
|
|
|
|
|
|
|
|
|
|
|
|
|
|
|
|
|
|
|
|
|
| Property and equipment, net |
|
| 28,226 |
|
|
|
|
|
|
|
|
|
|
|
|
|
|
| 28,226 |
|
| Intangible assets, net |
|
| 4,931 |
|
|
|
|
|
|
|
|
|
|
|
|
|
|
| 4,931 |
|
| Other assets |
|
| 14 |
|
|
|
|
|
|
|
|
|
|
|
|
|
|
| 14 |
|
|
|
|
|
|
|
|
|
|
|
|
|
|
|
|
|
|
|
|
|
|
|
| Total Assets |
| $ | 35,826 |
|
| $ | (31 | ) |
|
|
| $ | - |
|
|
|
| $ | 35,795 |
|
|
|
|
|
|
|
|
|
|
|
|
|
|
|
|
|
|
|
|
|
|
|
| LIABILITIES AND STOCKHOLDERS' EQUITY (DEFICIT) |
|
|
|
|
|
|
|
|
|
|
|
|
|
|
|
|
|
|
|
|
| Current liabilities |
|
|
|
|
|
|
|
|
|
|
|
|
|
|
|
|
|
|
|
|
| Accounts payable |
| $ | 912 |
|
| $ | - |
|
|
|
| $ | - |
|
|
|
| $ | 912 |
|
| Accrued expenses |
|
| 1,163 |
|
|
| (263 | ) |
| (a) |
|
|
|
|
|
|
|
| 900 |
|
| Accrued interest and other - Pelican |
|
| 1,277 |
|
|
|
|
|
|
|
|
| (1,277 | ) |
| (c) |
|
| - |
|
| Current portion of long-term debt |
|
| 1,593 |
|
|
| (1,500 | ) |
| (a) |
|
|
|
|
| (c) |
|
| 93 |
|
| Current portion of long-term debt - Pelican |
|
| 18,880 |
|
|
|
|
|
|
|
|
| (18,880 | ) |
| (c) (d) |
|
| - |
|
| Current portion of contingent payment liability |
|
| 810 |
|
|
| (810 | ) |
| (a) |
|
|
|
|
|
|
|
| - |
|
| Total current liabilities |
|
| 24,635 |
|
|
| (2,573 | ) |
|
|
|
| (20,157 | ) |
|
|
|
| 1,905 |
|
|
|
|
|
|
|
|
|
|
|
|
|
|
|
|
|
|
|
|
|
|
|
| Long-term debt, net |
|
| 10 |
|
|
|
|
|
|
|
|
|
|
|
|
|
|
| 10 |
|
| Long-term debt, net - Pelican |
|
| 1,315 |
|
|
|
|
|
|
|
|
| 4,235 |
|
| (c) (d) |
|
| 5,550 |
|
| Other long-term liabilities |
|
| 708 |
|
|
|
|
|
|
|
|
|
|
|
|
|
|
| 708 |
|
| Total liabilities |
|
| 26,668 |
|
|
| (2,573 | ) |
|
|
|
| (15,922 | ) |
|
|
|
| 8,173 |
|
|
|
|
|
|
|
|
|
|
|
|
|
|
|
|
|
|
|
|
|
|
|
| Aly Operating redeemable preferred stock |
|
| 4,924 |
|
|
| (4,924 | ) |
| (b) |
|
|
|
|
|
|
|
| - |
|
| Aly Centrifuge redeemable preferred stock |
|
| 10,080 |
|
|
| (10,080 | ) |
| (b) |
|
|
|
|
|
|
|
| - |
|
|
|
|
| 15,004 |
|
|
| (15,004 | ) |
|
|
|
| - |
|
|
|
|
| - |
|
| Stockholders' equity (deficit) |
|
|
|
|
|
|
|
|
|
|
|
|
|
|
|
|
|
|
|
|
| Preferred stock |
|
| - |
|
|
|
|
|
|
|
|
| 6,435 |
|
| (c) |
|
| 6,435 |
|
| Common stock of $0.001 par value |
|
| 7 |
|
|
| 7 |
|
| (a)(b) |
|
|
|
|
|
|
|
| 14 |
|
| Additional paid-in-capital |
|
| 28,307 |
|
|
| 15,164 |
|
| (a)(b) |
|
| 9,487 |
|
| (c) |
|
| 52,958 |
|
| Accumulated deficit |
|
| (34,158 | ) |
|
| 2,375 |
|
| (a)(b) |
|
|
|
|
|
|
|
| (31,783 | ) |
| Treasury stock, 225 shares at cost |
|
| (2 | ) |
|
|
|
|
|
|
|
|
|
|
|
|
|
| (2 | ) |
| Total stockholders' equity (deficit) |
|
| (5,846 | ) |
|
| 17,546 |
|
|
|
|
| 15,922 |
|
|
|
|
| 27,622 |
|
|
|
|
|
|
|
|
|
|
|
|
|
|
|
|
|
|
|
|
|
|
|
| Total liabilities and stockholders' equity (deficit) |
| $ | 35,826 |
|
| $ | (31 | ) |
|
|
| $ | - |
|
|
|
| $ | 35,795 |
|
| 25 |
| Table of Contents |
NOTES TO UNAUDITED PRO FORMA CONSOLIDATED BALANCE SHEET
1. Description of Transaction
During the second quarter of 2016, certain of the Company’s principal stockholders (“Shareholder Group”) began negotiations with Wells Fargo with the objective of consummating a recapitalization transaction (the “Recapitalization”) whereby our obligations under the credit agreement and the outstanding capital leases in favor of Wells Fargo’s equipment finance affiliate and certain other obligations of Aly Energy (collectively the “Aly Senior Obligations”) would be restructured. In August 2016, the Shareholder Group was introduced to a third party, Tiger Finance, LLC (“Tiger”), to provide bridge financing and to extend forbearance until such date as sufficient capital could be raised to complete the Recapitalization.
In September 2016, the Shareholder Group formed Permian Pelican, LLC (“Pelican”) with the objective of raising capital and executing the steps necessary to complete the restructuring, inclusive of successfully effecting the exchange of the Aly Operating redeemable preferred stock, Aly Centrifuge redeemable preferred stock, Aly Centrifuge subordinated debt and liability for a contingent payment into approximately 10% of our common stock on a fully diluted basis.
The Recapitalization consisted of three restructuring events which took place in the period beginning October 26, 2016 and ending on January 31, 2017. The first two restructuring events occurred before December 31, 2016 and any impact is presented in the Company’s historical consolidated financial statements. Below is a description of each event:
| The first restructuring event occurred on October 26, 2016 when Tiger acquired the Aly Senior Obligations from Wells Fargo and its equipment affiliate. Simultaneously, Tiger entered into an assignment agreement with Pelican whereby it agreed to sell the Aly Senior Obligations to Pelican on the conditions that (i) Pelican provide $0.5 million of unsecured working capital financing to the Company pending the closing and (ii) the Company transfer to Tiger (in consideration of Tiger’s reduction of the Aly Senior Obligations in the amount of $2.0 million) certain excess equipment and vehicles which the Company was not utilizing and considered unnecessary for its continuing operations.
As a result of the above, we transferred property and equipment with an aggregate net book value of $19.9 million, inclusive of $1.7 million of assets associated with discontinued operations, to Tiger and recognized a corresponding reduction in the Aly Senior Obligations of $2.0 million, debt modification fee of $0.6 million and impairment charge of $17.3 million, inclusive of a $1.7 million impairment associated with discontinued operations. As part of this transaction and upon satisfaction of such conditions, Tiger extended the forbearance period to December 9, 2016.
The second restructuring event occurred on December 12, 2016 when Pelican acquired the Aly Senior Obligations from Tiger. As the new holder of the Aly Senior Obligations, Pelican further extended the forbearance period for the obligations to January 31, 2017, provided the Company was successful in completing the third and final restructuring event on or before such date.
Effective January 31, 2017, the final restructuring event occurred and the Recapitalization was completed which resulted in the following: | |
|
|
|
| · | an exchange of certain of the Company’s outstanding obligations (namely, Aly Operating redeemable preferred stock, Aly Centrifuge redeemable preferred stock, Aly Centrifuge subordinated debt and its contingent payment liability) for approximately 10% of our common stock, or 7,111,982 common shares, on a fully diluted basis; |
| · | an exchange of certain amendments to the Aly Senior Obligations (namely, a $16.1 million principal reduction, removal of restrictive covenants and extended maturity of payment obligations) for shares of our Series A Convertible Preferred Stock which represents approximately 80% of our common stock, or 53,628,842 common shares, on a fully diluted basis (liquidation preference of $16.1 million); and |
| · | the formation of a new credit agreement with Pelican (consisting of a $5.1 million term loan and $1.0 million revolving credit facility) with an extended maturity date of December 31, 2018. |
| 26 |
| Table of Contents |
NOTES TO UNAUDITED PRO FORMA CONSOLIDATED BALANCE SHEET
(Continued)
1. Description of Transaction (Continued)
Accordingly, the Recapitalization had a significant impact to our capital structure and to our consolidated financial statements; consequently, there was a dilutive effect to those shareholders who held common stock immediately before the transaction was completed. The unaudited consolidated pro forma balance sheet as of December 31, 2016 gives effect to the Recapitalization impact on the capital structure as if it occurred on December 31, 2016.
2. Pro Forma Adjustments
Adjustments have been recorded within the unaudited consolidated pro forma balance sheet to reflect the effects of the Recapitalization in accordance with ASC 470, including (i) the exchange of debt and equity securities accounted for as a troubled debt restructuring and (ii) the issuance of preferred shares in exchange for the extinguishment of long-term debt and other obligations and for the issuance of a new credit facility:
| Except for Pelican, each exchange was accounted for as a troubled debt restructuring (“TDR”) since an equity interest in the Company was issued to fully satisfy each debt. A gain on TDR is recognized for the excess of the carrying amount of the debt over the fair value of each equity interest granted. The impact of the Recapitalization occurring subsequent to December 31, 2016 includes a “gain on the extinguishment of debt and other liabilities” from the debtors of Aly Centrifuge subordinated debt and the contingent payment liability and a “gain on the extinguishment of preferred stock” from the holders of Aly Operating redeemable preferred stock and Aly Centrifuge redeemable preferred stock. The share price of common stock as of January 31, 2017 of $0.12 per share was used as the basis of fair value for each equity interested granted. | |
|
|
|
| The TDR pro forma adjustments in column (i) and in the below table are as follows: |
|
| (a) | Represents the exchange of subordinated debt and contingent payment liability for common stock resulting in a gain of $2.4 million, or $0.36 per share, on the consolidated statement of operations and recorded as an “Issuance of common stock in exchange for the extinguishment of debt and other liabilities” on the consolidated statement of changes in stockholders’ equity (deficit). |
| Gain on the Extinguishment of Debt and Other Liabilities (a) | |||||||
|
|
|
|
|
|
| ||
|
|
| Common Stock |
|
| Gain | ||
| Debt and Other Obligations Extinguished |
| Issued |
|
| Recognized | ||
|
|
|
|
|
|
| ||
| Subordinated Debt and accrued interest of $1.5 million |
|
|
|
|
| ||
| and $0.3 million, respectively |
|
| 1,200,000 |
|
| $1.6 million | |
|
|
|
|
|
|
|
| |
| Contingent payment liability of $0.8 million |
|
| 457,494 |
|
| $0.8 million | |
|
| (b) | Represents the exchange of Aly Operating redeemable preferred stock and Aly Centrifuge redeemable preferred stock for common stock resulting in a gain of $14.4 million, or $2.14 per share, and recorded as an “Issuance of common stock in exchange for the extinguishment of preferred stock” on the consolidated statement of changes in stockholders’ equity (deficit). |
| Gain on the Extinguishment of Redeemable Preferred Stock (b) |
| ||||||
|
|
|
|
|
|
|
| |
|
|
| Common Stock |
|
| Gain |
| |
| Redeemable Preferred Stock and Other Obligations |
| Issued |
|
| Recognized |
| |
|
|
|
|
|
|
| ||
| Aly Centifuge preferred and accrued dividends of $8.9 |
|
|
|
|
| ||
| million and $1.2 million, respectively |
|
| 3,039,517 |
|
| $9.8 million | |
|
|
|
|
|
|
|
| |
| Aly Operating preferred and accrued dividends of $4.0 |
|
|
|
|
|
| |
| million and $0.9 million, respectively |
|
| 2,414,971 |
|
| $4.6 million | |
| 27 |
| Table of Contents |
NOTES TO UNAUDITED PRO FORMA CONSOLIDATED BALANCE SHEET
(Continued)
2. Pro Forma Adjustments (Continued)
| Given the nature of the related party relationship between the Company and Pelican, the extinguishment of our old credit facility was accounted for as a capital transaction whereby we issued Series A Convertible Preferred Stock in exchange for the extinguishment of long-term debt and the issuance of a new credit facility; which resulted in a gain on the extinguishment of long-term debt calculated as the amount above the estimated fair value of the equity interest granted. The share price of common stock as of January 31, 2017 of $0.12 per share was used as the basis of fair value for the equity interested granted. | |
|
|
|
| The credit facility pro forma adjustments in column (ii) and in the below table are as follows: |
|
| (c) | Represents the partial extinguishment and exchange of our Aly Senior Obligations ($16.1 million principal reduction) for shares of our Series A Convertible Preferred Stock resulting in a gain of $9.5 million recorded as an “Issuance of preferred shares in exchange for the extinguishment of debt and other liabilities - Pelican” on the consolidated statement of changes in stockholders’ equity (deficit). The components of Aly Senior Obligations are as follows (in thousands): |
| Aly Senior Obligations as of December 31, 2016 (c) | ||||
|
|
|
| ||
| Debt and Other Obligations Extinguished |
| Amount |
| |
|
|
|
|
| |
| Credit facility |
| $ | 17,772 |
|
| Accrued fees and interest on credit facility |
|
| 1,254 |
|
| Capital lease obligations |
|
| 1,930 |
|
| Accrued interest on capital lease obligations |
|
| 19 |
|
| Pelican working capital line of credit |
|
| 498 |
|
|
|
|
|
|
|
| Total |
| $ | 21,473 |
|
|
| (d) | Represents the recording of our new credit agreement with Pelican consisting of a $5.1 million term loan and $0.5 million outstanding under a revolving credit facility (which was $5.0 million and $0.8 million, respectively, as of June 30, 2017 in addition to $0.3 million outstanding under a delayed draw term loan with Pelican) upon the full extinguishment of our old credit facility. |
| 28 |
| Table of Contents |
Item 2. Management’s Discussion and Analysis of Financial Condition and Results of Operations
The following discussion and analysis of our financial condition and results of operations is intended to assist you in understanding our business and results of operations together with our present financial condition. Unless otherwise noted, all discussion and analysis relates to continuing operations. This section should be read in conjunction with the condensed consolidated financial statements and the related notes thereto included elsewhere in “Item 1. Condensed Consolidated Financial Statements” in this Form 10-Q.
Cautionary Note Regarding Forward-Looking Statements
This Current Report on Form 10-Q (this “Report”) contains certain statements and information that may constitute "forward-looking statements" within the meaning of Section 27A of the Securities Act of 1933, as amended (the "Securities Act"), and Section 21E of the Securities Exchange Act of 1934, as amended (the "Exchange Act"). The words "anticipate," "believe," "ensure," "expect," "if," "intend," "plan," "estimate," "project," "forecasts," "predict," "outlook," "aim," "will," "could," "should," "potential," "would," "may," "probable," "likely," and similar expressions that convey the uncertainty of future events or outcomes, and the negative thereof, are intended to identify forward-looking statements. Forward-looking statements, which are not generally historical in nature, include those that express a belief, expectation or intention regarding our future activities, plans and goals and our current expectations with respect to, among other things:
|
| · | projected operating or financial results, including any accretion/dilution to earnings and cash flow; |
|
| · | any plans to obtain financing to fund future operations; |
|
| · | prospects for services and expected activity in potential and existing areas of operations; |
|
| · | the effects of competition in areas of operations; |
|
| · | the outlook of oil and gas prices; |
|
| · | the current economic conditions and expected trends in the industry we serve; |
|
| · | the amount, nature and timing of capital expenditures and availability of capital resources; |
|
| · | future financial condition or results of operations and future revenue and expenses; and |
|
| · | business strategy and other plans and objectives for future operations. |
Forward-looking statements are not assurances of future performance and actual results could differ materially from our historical experience and our present expectations or projections. These forward-looking statements are based on management's current expectations and beliefs, forecasts for our existing operations, experience, expectations and perception of historical trends, current conditions, anticipated future developments and their effect on us, and other factors believed to be appropriate. Although management believes the expectations and assumptions reflected in these forward-looking statements are reasonable as and when made, no assurance can be given that these assumptions are accurate or that any of these expectations will be achieved (in full or at all). Our forward-looking statements involve significant risks, contingencies and uncertainties, most of which are difficult to predict and many of which are beyond our control. Known material factors that could cause actual results to differ materially from those in the forward-looking statements include, but are not limited to, the following:
|
| · | conditions in the oil and natural gas industry, especially oil and natural gas prices and capital expenditures by oil and natural gas companies; |
|
| · | volatility in oil and natural gas prices; |
|
| · | fluctuations in the domestic land-based rig count; |
|
| · | changes in laws and regulations; |
|
| · | our ability to implement price increases or maintain pricing on our core services; |
|
| · | risks that we may not be able to reduce, and we may experience increases in, the costs of labor, fuel, equipment and supplies employed in our businesses; |
|
| · | industry capacity; |
|
| · | asset impairments or other charges; |
|
| · | the periodic low demand for our services and resulting operating losses and negative cash flows; |
|
| · | our highly competitive industry as well as operating risks, which are primarily self-insured, and the possibility that our insurance may not be adequate to cover all of our losses or liabilities; |
|
| · | significant costs and potential liabilities resulting from compliance with applicable laws, including those resulting from environmental, health and safety laws and regulations; |
|
| · | our historically high employee turnover rate and our ability to replace or add workers, including executive officers and skilled workers; |
|
| · | our ability to incur debt or long-term lease obligations; |
|
| · | our ability to implement technological developments and enhancements; |
|
| · | severe weather impacts on our business; |
| 29 |
| Table of Contents |
|
| · | our ability to successfully identify, make and integrate future acquisitions and our ability to finance such acquisitions; |
|
| · | our ability to finance future growth of our operations through investments in new equipment and service offerings; |
|
| · | our ability to achieve the benefits expected from disposition transactions; |
|
| · | the loss of one or more of our larger customers; |
|
| · | our ability to generate sufficient cash flow to meet future debt service obligations; |
|
| · | our inability to achieve our financial, capital expenditure and operational projections, including quarterly and annual projections of revenue and/or operating income, and our inaccurate assessment of future activity levels, customer demand, and pricing stability which may not materialize (whether for Aly Energy Services, Inc. as a whole or for geographic regions and/or certain business operations individually); |
|
| · | business opportunities (or lack thereof) that may be presented to our company and may be pursued; |
|
| · | our ability to respond to changing or declining market conditions, including our ability to reduce the costs of labor, fuel, equipment and supplies employed and used in our businesses; |
|
| · | our ability to maintain sufficient liquidity; |
|
| · | adverse impact of litigation; and |
|
| · | other factors affecting our business described in “Item 1A. Risk Factors” in our Annual Report on Form 10-K for the year ended December 31, 2016 and in the other reports we file with the Securities and Exchange Commission. |
Should one or more of the factors, risks or uncertainties described above materialize (or the other consequences of such a development worsen), or should underlying assumptions prove incorrect, actual results and plans could differ materially from those expressed in any forward-looking statements. You are cautioned not to place undue reliance on these statements, which speak only as of the date of this Report.
History of Our Business
On July 17, 2012, Munawar “Micki” Hidayatallah founded Aly Energy with the strategic objective of creating an oilfield services company that serves exploration and production companies from well planning to plug and abandonment. We have grown our business both through organic growth resulting from investment in existing operations and through the strategic acquisition of certain businesses operating in our industry.
To date, we have acquired three businesses:
|
| · | Austin Chalk Petroleum Services Corp. (“Austin Chalk”) - In October 2012, we acquired Austin Chalk a provider of high performance, explosion-resistant rental equipment used primarily in land-based horizontal drilling. Austin Chalk currently offers a robust inventory of surface rental equipment as well as roustabout services, including the rig-up and rig-down of equipment and the hauling of equipment to and from the customer's location; |
|
| · | United Centrifuge LLC and the leased fixed assets associated with that business (collectively “United”) - United, acquired in April 2014, operates within the solids control sector of the oilfield services industry, offering its customers the option of renting centrifuges and auxiliary solids control equipment without personnel or the option of paying for a full-service solids control package which includes operators on-site 24 hours a day. United owns centrifuges which are differentiated from the competition due to the ability to remove the rotating assembly from a centrifuge within 45 minutes while on the rig site thereby minimizing customer down time; and |
|
| · | Evolution Guidance Systems Inc. (“Evolution”) - In July 2014, we acquired Evolution which specialized as an operator of Measurement-While-Drilling (“MWD”) downhole tools. Effective October 26, 2016, we abandoned these operations as a part of a restructuring event (see “Note 2 – Recent Developments and Subsequent Events” in the notes to our consolidated financial statements for further detail). |
Subsequent to the acquisition of each of these businesses, we have made significant investments to expand their operations and capitalize on organic growth opportunities in existing and expansion markets. We consistently seek opportunities to bundle product offerings and to cross sell services across markets and product lines, which we believe improves client retention and increases the utilization of our equipment.
Overview of Our Business
We are a provider of solids control systems and surface rental equipment. Our equipment and services are primarily designed for and used in land-based horizontal drilling. Our equipment includes centrifuges and auxiliary solids control equipment, mud circulating tanks (400 and 500 barrel capacity) and auxiliary surface rental equipment, portable mud mixing plants and containment systems. In conjunction with the rental of some of our solids control packages, we provide personnel at the customer’s well site to operate our equipment. We also provide personnel to rig-up/rig-down and haul our equipment to and from the customer's location. We operate primarily in Texas (West Texas and South Texas), Oklahoma, New Mexico, and Louisiana. Our primary operating yards, shop and repair facilities, and division management are located in Giddings, Texas, San Angelo, Texas, and Houston, Texas.
We derive the majority of our revenue from day rates or hourly rates charged for the rental of our equipment and for the services provided by our personnel. The price we charge for our services depends on both the level of activity within the geographic area in which we operate and also the competitive environment.
Our operating costs do not fluctuate in direct proportion to changes in revenue. Our operating expenses consist of both fixed and variable costs. Although most variable costs are highly correlated with revenue and activity, certain variable costs, such as sub-rental equipment expenses and third-party trucking expenses, can be reduced as a percentage of revenue by our investment in new rental and transportation equipment.
Industry Trends
We operate in the commodity-driven, cyclical oil and gas industry. From 2011 through mid-2014, the industry operated in an environment where crude oil prices were relatively stable and, except for comparatively short intervals, generally traded at prices at or in excess of $100 per barrel. However, subsequent to the third quarter of 2014, crude oil prices declined significantly due to a variety of factors, including, but not limited to, continued growth in U.S. oil production, weakened outlooks for the global economy and continued strong international crude oil supply resulting in part from OPEC's unexpected decision to maintain oil production levels. As a result of the weaker crude oil price environment, many crude oil development prospects became less economical for exploration and production operators, leading to a dramatic reduction in U.S. land-based rig count and weaker demand for oilfield services, such as the services we provide.
The decline in both oil prices and the U.S. land-based rig count continued during the first half of 2016. Barring a few brief rallies, the price of oil bottomed out in February 2016 at less than $30 per barrel and the U.S. land-based rig count reached its low of less than 400 rigs in July 2016. After reaching its low point, the price of oil then increased steadily for several months and has hovered between $45 per barrel and $50 per barrel since June 2016. With the price of oil fairly constant for the past twelve months at a level which is economical for exploration and production operators, the U.S. land-based rig count has increased steadily and, in July 2017, the count had increased to over 900 rigs, an increase of greater than 100% compared to its low of less than 400 rigs in July 2016.
The favorable impact of the recent increase in the U.S. land-based rig count on demand for our services has been magnified by an increase in the proportion of rigs drilling directional and horizontal wells. As illustrated in the graph below, the proportion of rigs drilling directional and horizontal wells as a percentage of total U.S. land-based rigs has increased from approximately 80% in the first quarter of 2014 to 92% in the second quarter of 2017. Rigs drilling directional and horizontal wells typically utilize oil-based or other sophisticated mud systems which creates demand for Aly’s specialized mud circulating tanks, pumps, containment systems, solids control and associated equipment.
| 31 |
| Table of Contents |
Our financial performance is significantly affected by the price of oil and the U.S. land-based rig count, specifically the count of rigs drilling directional and horizontal wells. The graph below illustrates the trends in these key drivers from 2014 through mid-2017:
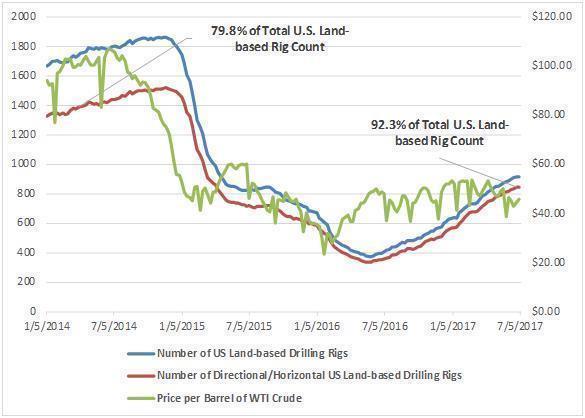
Source: Baker Hughes (Rig Counts) and Bloomberg (Price Per Barrel of WTI Crude)
How We Evaluate Our Operations
We disclose and discuss EBITDA as a non-GAAP financial measure in our public releases, including quarterly earnings releases, investor conference calls and other filings with the Securities and Exchange Commission.
We define EBITDA as earnings (net income) before interest, income taxes, depreciation and amortization. Our measure of EBITDA may not be comparable to similarly titled measures presented by other companies, which may limit its usefulness as a comparative measure.
We also make certain adjustments to EBITDA for (i) non-cash charges, such as reduction in value of assets, bad debt expense, share-based compensation expense, and changes in fair value of our liability for contingent payments and (ii) certain expenses, such as severance, legal settlements, and professional fees and other expenses related to transactions outside the ordinary course of business, to derive a normalized EBITDA run-rate ("Adjusted EBITDA"), which we believe is a useful measure of operating results and the underlying cash generating capability of our business.
| 32 |
| Table of Contents |
The following table provides the detailed components of EBITDA and Adjusted EBITDA as we define that term for the three and six months ended June 30, 2016 and 2015, respectively (in thousands):
|
|
| For the Three Months Ended June 30, |
|
| For the Six Months Ended June 30, |
| ||||||||||
|
|
| 2016 |
|
| 2015 |
|
| 2016 |
|
| 2015 |
| ||||
|
|
| (unaudited) |
|
| (unaudited) |
| ||||||||||
|
|
|
|
|
|
|
|
|
|
|
|
|
| ||||
| Components of EBITDA: |
|
|
|
|
|
|
|
|
|
|
|
| ||||
| Net loss |
| $ | (3,056 | ) |
| $ | (1,572 | ) |
| $ | (4,931 | ) |
| $ | (3,011 | ) |
| Less: Loss from discontinued operations, net of income taxes |
|
| 1,257 |
|
|
| 654 |
|
|
| 1,382 |
|
|
| 1,239 |
|
| Net loss from continuing operations |
|
| (1,799 | ) |
|
| (918 | ) |
|
| (3,549 | ) |
|
| (1,772 | ) |
|
|
|
|
|
|
|
|
|
|
|
|
|
|
|
|
|
|
| Non-GAAP adjustments: |
|
|
|
|
|
|
|
|
|
|
|
|
|
|
|
|
| Depreciation and amortization |
|
| 1,393 |
|
|
| 1,516 |
|
|
| 2,834 |
|
|
| 2,974 |
|
| Interest expense, net |
|
| 560 |
|
|
| 455 |
|
|
| 1,148 |
|
|
| 945 |
|
| Income tax benefit |
|
| (1,636 | ) |
|
| (769 | ) |
|
| (2,534 | ) |
|
| (1,333 | ) |
| EBITDA |
|
| (1,482 | ) |
|
| 284 |
|
|
| (2,101 | ) |
|
| 814 |
|
|
|
|
|
|
|
|
|
|
|
|
|
|
|
|
|
|
|
| Adjustments to EBITDA: |
|
|
|
|
|
|
|
|
|
|
|
|
|
|
|
|
| Reduction in value of assets |
|
| 543 |
|
|
| - |
|
|
| 843 |
|
|
| - |
|
| Expenses in connection with lender negotiations and Recapitalization |
|
| 96 |
|
|
| - |
|
|
| 106 |
|
|
| - |
|
| Employee-related reorganization expenses, including severance |
|
| 456 |
|
|
| 131 |
|
|
| 456 |
|
|
| 155 |
|
| Bad debt expense |
|
| 13 |
|
|
| 126 |
|
|
| 34 |
|
|
| 141 |
|
| Settlements and other losses |
|
| 10 |
|
|
| 53 |
|
|
| 63 |
|
|
| 107 |
|
| Fair value adjustments to contingent payment liability |
|
| (227 | ) |
|
| 29 |
|
|
| (206 | ) |
|
| (311 | ) |
| Stock-based compensation |
|
| - |
|
|
| 100 |
|
|
| - |
|
|
| 100 |
|
| Transaction costs |
|
| - |
|
|
| - |
|
|
| - |
|
|
| - |
|
| Adjusted EBITDA |
| $ | (591 | ) |
| $ | 723 |
|
| $ | (805 | ) |
| $ | 1,006 |
|
Because EBITDA and Adjusted EBITDA are not measures of financial performance calculated in accordance with GAAP, these metrics should not be considered in isolation or as a substitute for operating income, net income or loss, cash flows provided by operating, investing and financing activities, or other income or cash flow statement data prepared in accordance with GAAP.
EBITDA and Adjusted EBITDA are widely used by investors and other users of our financial statements as supplemental financial measures that, when viewed with our GAAP results and the accompanying reconciliation, we believe provide additional information that is useful to gain an understanding of our ability to service debt, pay income taxes and fund growth and maintenance capital expenditures. We also believe the disclosure of EBITDA and Adjusted EBITDA helps investors meaningfully evaluate and compare our cash flow generating capacity from quarter-to-quarter and year-to-year.
EBITDA and Adjusted EBITDA are also financial metrics used by management as (i) supplemental internal measures for planning and forecasting and for evaluating actual results against such expectations; (ii) significant criteria for incentive compensation paid to our executive officers and management; (iii) reference points to compare to the EBITDA and Adjusted EBITDA of other companies when evaluating potential acquisitions; and, (iv) assessments of our ability to service existing fixed charges and incur additional indebtedness.
Set forth below are the material limitations associated with using EBITDA and Adjusted EBITDA as non-GAAP financial measures compared to cash flows provided by and used in operating, investing and financing activities:
|
| · | EBITDA and Adjusted EBITDA do not reflect growth and maintenance capital expenditures, |
|
| · | EBITDA and Adjusted EBITDA do not reflect the interest, principal payments and other financing-related charges necessary to service the debt that we have incurred to finance acquisitions and invest in our fixed asset base, |
|
| · | EBITDA and Adjusted EBITDA do not reflect the payment of income taxes, and |
|
| · | EBITDA and Adjusted EBITDA do not reflect changes in our net working capital position. |
Management compensates for the above-described limitations in using EBITDA and Adjusted EBITDA as non-GAAP financial measures by only using EBITDA and Adjusted EBITDA to supplement our GAAP results.
Business Outlook
Our core businesses depend on our customers’ willingness to make expenditures to produce, develop and explore for oil and natural gas. Industry conditions are influenced by numerous factors, such as oil and natural gas prices, the supply of and demand for oil and natural gas, domestic and worldwide economic conditions, political instability in oil producing countries and available supply of and demand for the services we provide. Oil and natural gas prices began a rapid and substantial decline in the fourth quarter of 2014. Depressed commodity price conditions persisted and worsened during 2015 and that trend continued into 2016. As a result, the rig count and demand for our products and services declined substantially, and the prices we are able to charge our customers for our products and services have also declined substantially. While we have reshaped our organizational and cost structure to mitigate the negative impact of these declines and to improve our ability to react to future declines, we continued to experience negative operating results and cash flows from operations throughout 2016. Beginning in 2017, we began to see a significant growth in demand and we have experienced a corresponding increase in revenues and operating results.
Oil prices have improved off the low point of 2016 with the November 2016 decision by OPEC to curtail the cartel’s oil production, the Baker Hughes U.S. land drilling rig count has increased significantly from its low point in mid-2016, and our revenue has improved substantially during the first six months of 2017. We believe that stability in oil prices at an attractive price to our customers coupled with the increases in drilling activity during the first half of 2017 will result in further increases in demand for our services and will provide us opportunities to increase the price of our products and services, particularly in 2018. However, with increased demand for oilfield services broadly, the demand for qualified employees and the demand for the sub-rental equipment we require to increase our activity will increase and we may experience increases in costs which we cannot completely offset with price increases to our customers. As of June 30, 2017, based on our expectations of improved activity levels and pricing throughout the remainder of 2017 and 2018, we believe that we will be able to service our debt obligations and ongoing operations through operating cash flow and, if necessary, availability under our credit facility.
Operational Restructuring
Our activity is tied directly to the rig count and, even though we instituted significant cost cutting measures beginning in 2015, we were unable to cut costs enough to match the decline in our business. As a result, as of December 31, 2015, we were in default of our credit agreement with Wells Fargo Bank, National Association (“Wells Fargo”).
Throughout 2015, in an effort to mitigate the significant declines in pricing and utilization of our equipment, we committed to a reorganization initiative to strengthen our sales and marketing efforts, consolidate support functions, and operate more efficiently. The reorganization effort included, but was not limited to, training our salesforce to enable the cross-selling of our product lines in certain geographical markets, sharing a common support services infrastructure across all reporting units, reducing headcount and wage rates, and rebranding and launching a new web site to increase awareness of our service lines. We recognized some benefit from these measures in late 2015 resulting in increased gross margins and lower selling, general and administrative expenses when compared to the first half of 2015.
During the year ended December 31, 2016, we entered into a series of forbearance agreements with our lender. Under the forbearance agreements, among other provisions, the lenders agreed to forbear from exercising their remedies under the credit agreement. These forbearance agreements permitted us to operate within the parameters of our normal course of business despite the continuing default under the credit agreement. Without these forbearance agreements, our outstanding debt would have been immediately due and payable. Throughout 2016, we remained in default and we did not have sufficient liquidity to repay all of the outstanding debt to the lender at any point during the year ($20.1 million as of December 31, 2015). As such, we may have been forced to file for protection under Chapter 11 of the U.S. Bankruptcy Code.
In early 2016, we were hopeful that a successful operational restructuring would facilitate negotiations to modify the terms of our existing credit facility with Wells Fargo. Our operational restructuring in 2016 consisted of severe cost cuts which were incremental to the year-over-year cost cuts already achieved in 2015 when compared to 2014. In 2016, significant cost savings were primarily generated by:
|
| · | reductions of our employee base, both field employees and sales and administrative employees, to a headcount of approximately 50 as of December 31, 2016 from approximately 125 as of December 31, 2015, |
|
| · | reduction in employer contributions to employee benefits, |
|
| · | closures of certain operating yards and administrative facilities, |
|
| · | strategic decision to cease operations in the northeast which resulted in the reduction of costs related to operating in an incremental market, |
|
| · | modifications to insurance policies, including general liability and workers’ compensation policies, resulting in a $0.5 million or 15.5% reduction in the cost of insurance to $0.6 million for the year ended December 31, 2016 from $1.1 million for the year ended December 31, 2015, |
|
| · | minimization of repair and maintenance activities, resulting in a $0.4 million or 50.0% reduction of repair and maintenance expenses to $0.4 million for the year ended December 31, 2016 from $0.8 million for the year ended December 31, 2015, and |
|
| · | elimination of investments in equipment, unless required to service an existing customer, resulting in a reduction of capital expenditures to $0.4 million for the year ended December 31, 2016 from $2.5 million for the year ended December 31, 2015. |
| 34 |
| Table of Contents |
We also achieved significant cost savings from the decrease in third party costs, such as sub-rental equipment and trucking, and other variable costs which declined with the decrease in activity.
In order to further support our working capital needs, we identified and sold idle and underutilized assets. During 2016, we realized aggregate proceeds from sales of approximately $0.8 million of which $0.5 million and $0.3 million was used to fund working capital needs and pay down debt, respectively (see “Note 4 – Reduction in Value of Assets and Other Charges” in the notes to our consolidated financial statements for further details).
Capital Restructuring
Despite our successful operational restructuring efforts, particularly during the first half of 2016, the decline in our activity levels and the declines in customer pricing outpaced the impact of our cost reductions and it became evident that a capital restructuring would also be necessary to continue operations and position our business for an industry turnaround.
In the second quarter of 2016, certain of the Company’s principal stockholders (“Shareholder Group”) began negotiations with Wells Fargo with the objective of consummating a recapitalization transaction (the “Recapitalization”) whereby our obligations under the credit agreement and the outstanding capital leases in favor of Wells Fargo’s equipment finance affiliate and certain other obligations of Aly Energy (collectively the “Aly Senior Obligations”) would be restructured. In August 2016, the Shareholder Group approached a third party, Tiger Finance, LLC (“Tiger”), to provide bridge financing and to extend forbearance until such date as sufficient capital could be raised to complete the Recapitalization.
In September 2016, the Shareholder Group formed Permian Pelican, LLC (“Pelican”) with the objective of raising capital and executing the steps necessary to complete the restructuring, inclusive of successfully effecting the exchange of the Aly Operating redeemable preferred stock, Aly Centrifuge redeemable preferred stock, Aly Centrifuge subordinated debt and liability for a contingent payment into approximately 10% of our common stock on a fully diluted basis.
Effective January 31, 2017, the Recapitalization was completed through the execution and delivery of a Securities Exchange Agreement and a Second Amended and Restated Credit Agreement. As a result of the Recapitalization, the Company became a “Controlled Company” as defined under the listing standards of the principal national securities exchanges; however, since the Shareholder Group’s proportionate interest did not change significantly, a change in control did not occur and the transaction was accounted for at historical cost.
As a result of the Recapitalization, the credit facility, now with Pelican, consisted of a term loan of $5.1 million and a revolving facility of up to $1.0 million as of January 31, 2017. Availability under the revolving credit facility is determined by a borrowing base calculated as 80% of eligible receivables (receivables less than 90 days old).
Subsequent to the Recapitalization, we entered into several further amendments to capitalize on improved market conditions and increased activity in our business:
|
| · | Amendment No. 1, effective March 1, 2017, provided for a delayed draw term loan to be added to the credit facility for the purpose of financing capital expenditures. The agreement permitted us to draw on the delayed draw term loan from time-to-time up until the maturity date of the facility in order to fund up to 80% of the cost of capital expenditures subject to a $0.5 million limit on aggregate borrowings. |
|
| · | Amendment No. 2, effective May 23, 2017, increased the maximum revolving credit amount from $1.0 million to $1.8 million and extended the final maturity date of the facility to December 31, 2019. In consideration of the increase in the revolving credit facility and the extension of the final maturity date, we agreed to issue to Pelican, the lender, as an amendment fee, 1,200 shares of our Series A convertible preferred stock. |
|
| · | Amendment No. 3, effective June 15, 2017, modified maximum potential borrowings under each of the revolving credit facility and the delayed draw term loan without changing the aggregate available borrowings under the credit facility. The amendment reduced the maximum revolving credit amount from $1.8 million to $1.0 million and increased the maximum delayed draw loan borrowings from $0.5 million to $1.3 million and the amendment also increased permitted draws on the delayed draw loan from 80% of the cost of capital expenditures being funded to 90% of the cost of capital expenditures being funded. |
| 35 |
| Table of Contents |
To the extent there is free cash flow as defined in the credit agreement, principal payments of 50% of such free cash flow are due annually. The maturity date of all remaining outstanding balances under the credit facility is December 31, 2019.
The obligations under the credit facility are guaranteed by all our subsidiaries and secured by substantially all our assets. The credit agreement contains customary events of default and covenants including restrictions on our ability to incur additional indebtedness, make capital expenditures, pay dividends or make other distributions, grant liens and sell assets. The credit facility does not include any financial covenants. We are in full compliance with the credit facility as of June 30, 2017.
As of June 30, 2017, there were outstanding borrowings of $5.0 million, $0.8 million, and $0.3 million on the term loan, revolving credit facility, and delayed draw term loan, respectively. As of June 30, 2017, we have the availability to borrow an incremental $0.2 million under the revolving credit facility and, if we have capital expenditures which are eligible to be financed, an incremental $1.0 million under the delayed draw term loan to finance 90% of such expenditures.
For a discussion of the accounting treatment for the Recapitalization, see “Note 2 – Recent Developments and Subsequent Events” in the notes to our consolidated financial statements included elsewhere in this document.
Results of Operations
Results for the Three Months Ended June 30, 2016 Compared to the Three Months Ended June 30, 2015
The following table summarizes the change in our results of operations for the three months ended June 30, 2016 when compared to the three months ended June 30, 2015 (in thousands):
|
|
| For the Three Months Ended June 30, |
|
| Variance |
| ||||||||||||||||||
|
|
| 2016 |
|
| % of Revenue |
|
| 2015 |
|
| % of Revenue |
|
| $ |
|
| % |
| ||||||
|
|
| (unaudited) |
|
|
|
| (unaudited) |
|
|
|
|
|
|
|
|
| ||||||||
|
|
|
|
|
|
|
|
|
|
|
|
|
|
|
|
|
|
|
| ||||||
| Revenue |
| $ | 2,669 |
|
|
| 100.0 | % |
| $ | 6,222 |
|
|
| 100.0 | % |
| $ | (3,553 | ) |
|
| -57.1% |
|
|
|
|
|
|
|
|
|
|
|
|
|
|
|
|
|
|
|
|
|
|
|
|
|
|
|
| Expenses: |
|
|
|
|
|
|
|
|
|
|
|
|
|
|
|
|
|
|
|
|
|
|
|
|
| Operating expenses |
|
| 2,308 |
|
|
| 86.5 | % |
|
| 3,882 |
|
|
| 62.4 | % |
|
| (1,574 | ) |
|
| -40.5% |
|
| Depreciation and amortization |
|
| 1,393 |
|
|
| 52.2 | % |
|
| 1,516 |
|
|
| 24.4 | % |
|
| (123 | ) |
|
| -8.1% |
|
| Selling, general and administrative expenses |
|
| 1,300 |
|
|
| 48.7 | % |
|
| 2,056 |
|
|
| 33.0 | % |
|
| (756 | ) |
|
| -36.8% |
|
| Reduction in value of assets |
|
| 543 |
|
|
| 20.3 | % |
|
| - |
|
|
| 0.0 | % |
|
| 543 |
|
| NM |
| |
| Total expenses |
|
| 5,544 |
|
|
| 207.7 | % |
|
| 7,454 |
|
|
| 119.8 | % |
|
| (1,910 | ) |
|
| -25.6% |
|
|
|
|
|
|
|
|
|
|
|
|
|
|
|
|
|
|
|
|
|
|
|
|
|
|
|
| Loss from continuing operations |
|
| (2,875 | ) |
| NM |
|
|
| (1,232 | ) |
| NM |
|
|
| (1,643 | ) |
| NM |
| |||
|
|
|
|
|
|
|
|
|
|
|
|
|
|
|
|
|
|
|
|
|
|
|
|
|
|
| Interest expense, net |
|
| 560 |
|
|
| 21.0 | % |
|
| 455 |
|
|
| 7.3 | % |
|
| 105 |
|
|
| 23.1 | % |
| Loss from continuing operations before income taxes |
|
| (3,435 | ) |
| NM |
|
|
| (1,687 | ) |
| NM |
|
|
| (1,748 | ) |
| NM |
| |||
|
|
|
|
|
|
|
|
|
|
|
|
|
|
|
|
|
|
|
|
|
|
|
|
|
|
| Income tax benefit |
|
| (1,636 | ) |
| NM |
|
|
| (769 | ) |
| NM |
|
|
| (867 | ) |
| NM |
| |||
| Net loss from continuing operations |
|
| (1,799 | ) |
| NM |
|
|
| (918 | ) |
| NM |
|
|
| (881 | ) |
| NM |
| |||
|
|
|
|
|
|
|
|
|
|
|
|
|
|
|
|
|
|
|
|
|
|
|
|
|
|
| Loss from discontinued operations, net of income taxes |
|
| 1,257 |
|
|
| 47.1 | % |
|
| 654 |
|
|
| 10.5 | % |
|
| 603 |
|
|
| 92.2 | % |
| Net loss |
| $ | (3,056 | ) |
| NM |
|
| $ | (1,572 | ) |
| NM |
|
| $ | (1,484 | ) |
| NM |
| |||
Revenue. Our revenue for the three months ended June 30, 2016 was $2.7 million, a decrease of 57.1%, compared to $6.2 million for the three months ended June 30, 2015. Our activity is directly tied to drilling activity and the U.S. land-based rig count dropped to less than 400 rigs in June 2016 from more than 900 rigs in April 2015. This decrease in drilling activity resulted in intense competition in the oilfield services sector, which, in turn, required us to reduce pricing significantly in order to retain existing customers and attract new customers. Pricing for our primary surface rental products and solids control products decreased more than 15% and 35%, respectively, when comparing the three months ended June 30, 2016 to the three months ended June 30, 2015. In addition, demand for our services, particularly our solids control services, declined throughout 2015 and through the first half of 2016 resulting in reduced utilization of equipment and further contributing to our decline in revenue.
Operating Expenses. Our operating expenses for the three months ended June 30, 2016 decreased to $2.3 million, or 86.5% of revenue, from $3.9 million, or 62.4% of revenue, for the three months ended June 30, 2015. The decrease of $1.6 million from the three months ended June 30, 2015 is primarily due to the decline in activity described above, specifically the resulting decline in payroll and other variable expenses. During 2016, payroll decreased due to both a decline in headcount and decreases in average wage rates. The increase in the percentage of operating expenses to revenue between the years is primarily due to the significant decline in pricing and the inability to reduce our costs to mirror the timing and magnitude of the reduction in customer pricing (see further discussion of cost cuts in “Operational Restructuring” section above).
| 36 |
| Table of Contents |
Depreciation and Amortization. Depreciation and amortization expense decreased 8.1% to $1.4 million for the three months ended June 30, 2016 compared to $1.5 million for the three months ended June 30, 2015. The decrease is due primarily to the disposition of underutilized assets during the second half of 2015 and the first half of 2016.
Selling, General and Administrative Expenses. Selling, general and administrative expenses decreased to $1.3 million, or 48.7% of revenue, for the three months ended June 30, 2016 compared to $2.1 million, or 33.1% of revenue, for the three months ended June 30, 2015. Selling, general and administrative expenses consist primarily of overhead costs which we generally consider to be fixed. The period-over-period decline of $0.8 million, or 36.9%, reflects the cost cutting initiatives started in 2015 which continued in 2016. These initiatives, implemented in response to the massive downturn in the industry, included headcount and wage rate decreases, the reduction of executive management salaries and elimination of bonuses, and significant reductions in travel, entertainment and office expense. Selling, general and administrative expenses also include expenses that are either non-recurring or non-cash in nature with an aggregate value of $0.9 million and $0.4 million during the three months ended June 30, 2016 and 2015, respectively (see further discussion in “How We Evaluate Our Operations” section above).
Reduction in Value of Assets. During the three months ended June 30, 2016, we recorded a $0.5 million reduction in an intangible associated with a non-compete which management determined was non-enforceable. There were no reduction in value of assets charges during the three months ended June 30, 2015.
Interest Expense, net. Interest expense and amortization of deferred loan costs was $0.6 million for the three months ended June 30, 2016 compared to $0.5 million for the three months ended June 30, 2015. The $0.1 million increase is due primarily to the accrual of a quarterly ticking fee effective with the debt modification in September 2015 and an increased interest rate on our primary credit facility partially offset by interest being charged on a reduced outstanding debt balance.
Income Taxes. Income taxes decreased to a benefit of $1.6 million, or an effective tax rate of 47.6%, for the three months ended June 30, 2016 from a benefit of $0.8 million, or an effective tax rate of 45.6%, for the three months ended June 30, 2015. The effective tax rate remained relatively unchanged when comparing the three months ended June 30, 2016 to the three months ended June 30, 2015.
Discontinued Operations. Discontinued operations include Evolution which specialized as an operator of MWD downhole tools. Losses from discontinued operations, net of income taxes, were $1.3 million during the three months ended June 30, 2016, as compared to $0.7 million during the three months ended June 30, 2015. The loss from operations, prior to charges related to a reduction in value of assets, declined to $0.2 million from $0.7 million when comparing the three months ended June 30, 2016 to the three months ended June 30, 2015. This period-over-period decline was offset by a $1.3 million impairment of property and equipment during the three months ended June 30, 2016 in connection with the Recapitalization and the abandonment of the Evolution assets.
Results for the Six Months Ended June 30, 2016 Compared to the Six Months Ended June 30, 2015
The following table summarizes the change in our results of operations for the six months ended June 30, 2016 when compared to the six months ended June 30, 2015 (in thousands):
|
|
| For the Six Months Ended June 30, |
|
| Variance |
| ||||||||||||||||||
|
|
| 2016 |
|
| % of Revenue |
|
| 2015 |
|
| % of Revenue |
|
| $ |
|
| % |
| ||||||
|
|
| (unaudited) |
|
|
|
| (unaudited) |
|
|
|
|
|
|
|
|
| ||||||||
|
|
|
|
|
|
|
|
|
|
|
|
|
|
|
|
|
|
|
| ||||||
| Revenue |
| $ | 6,777 |
|
|
| 100.0 | % |
| $ | 13,284 |
|
|
| 100.0 | % |
| $ | (6,507 | ) |
|
| -49.0% |
|
|
|
|
|
|
|
|
|
|
|
|
|
|
|
|
|
|
|
|
|
|
|
|
|
|
|
| Expenses: |
|
|
|
|
|
|
|
|
|
|
|
|
|
|
|
|
|
|
|
|
|
|
|
|
| Operating expenses |
|
| 5,349 |
|
|
| 78.9 | % |
|
| 8,494 |
|
|
| 63.9 | % |
|
| (3,145 | ) |
|
| -37.0% |
|
| Depreciation and amortization |
|
| 2,834 |
|
|
| 41.8 | % |
|
| 2,974 |
|
|
| 22.4 | % |
|
| (140 | ) |
|
| -4.7% |
|
| Selling, general and administrative expenses |
|
| 2,686 |
|
|
| 39.6 | % |
|
| 3,976 |
|
|
| 29.9 | % |
|
| (1,290 | ) |
|
| -32.4% |
|
| Reduction in value of assets |
|
| 843 |
|
|
| 12.4 | % |
|
| - |
|
|
| 0.0 | % |
|
| 843 |
|
| NM |
| |
| Total expenses |
|
| 11,712 |
|
|
| 172.8 | % |
|
| 15,444 |
|
|
| 116.3 | % |
|
| (3,732 | ) |
|
| -24.2% |
|
|
|
|
|
|
|
|
|
|
|
|
|
|
|
|
|
|
|
|
|
|
|
|
|
|
|
| Loss from continuing operations |
|
| (4,935 | ) |
| NM |
|
|
| (2,160 | ) |
| NM |
|
|
| (2,775 | ) |
| NM |
| |||
|
|
|
|
|
|
|
|
|
|
|
|
|
|
|
|
|
|
|
|
|
|
|
|
|
|
| Interest expense, net |
|
| 1,148 |
|
|
| 16.9 | % |
|
| 945 |
|
|
| 7.1 | % |
|
| 203 |
|
|
| 21.5 | % |
| Loss from continuing operations before income taxes |
|
| (6,083 | ) |
| NM |
|
|
| (3,105 | ) |
| NM |
|
|
| (2,978 | ) |
| NM |
| |||
|
|
|
|
|
|
|
|
|
|
|
|
|
|
|
|
|
|
|
|
|
|
|
|
|
|
| Income tax benefit |
|
| (2,534 | ) |
| NM |
|
|
| (1,333 | ) |
| NM |
|
|
| (1,201 | ) |
| NM |
| |||
| Loss from continuing operations |
|
| (3,549 | ) |
| NM |
|
|
| (1,772 | ) |
| NM |
|
|
| (1,777 | ) |
| NM |
| |||
|
|
|
|
|
|
|
|
|
|
|
|
|
|
|
|
|
|
|
|
|
|
|
|
|
|
| Loss from discontinued operations, net of income taxes |
|
| 1,382 |
|
|
| 20.4 | % |
|
| 1,239 |
|
|
| 9.3 | % |
|
| 143 |
|
|
| 11.5 | % |
| Net loss |
| $ | (4,931 | ) |
| NM |
|
| $ | (3,011 | ) |
| NM |
|
| $ | (1,920 | ) |
| NM |
| |||
Revenue. Our revenue for the six months ended June 30, 2016 was $6.8 million, a decrease of 49.0%, compared to $13.3 million for the six months ended June 30, 2015. Utilization of our equipment and services is directly tied to U.S. land-based drilling activity which decreased significantly from January 2015, when the U.S. land-based drilling rig count was over 1500 rigs, to June 2016, when the U.S. land-based drilling rig count was less than 400 rigs. The decrease in drilling activity resulted in significant decreases in demand for and utilization of our equipment and services, particularly our solids control equipment and services. In addition, the decline in the number of rigs available to service caused competition to intensify in the oilfield services sector which, in turn, forced us to reduce pricing to retain existing customers and attract new customers. Pricing for our primary rental products and services decreased approximately 20% to 25% when comparing the six months ended June 30, 2016 to the six months ended June 30, 2015, further contributing to the period-over-period declines in revenue.
Operating Expenses. Our operating expenses for the six months ended June 30, 2016 decreased to $5.3 million, or 78.9% of revenue, from $8.5 million, or 63.9% of revenue, for the six months ended June 30, 2015. The decrease of $3.1 million from the six months ended June 30, 2015 is primarily due to the decline in activity described above, specifically the resulting decline in payroll and other variable expenses. During 2016, payroll decreased due to both a decline in headcount and decreases in average wage rates. The increase in the percentage of operating expenses to revenue between the years is primarily due to the significant decline in pricing and the inability to reduce our costs to mirror the timing and magnitude of the reduction in customer pricing (see further discussion of cost cuts in “Operational Restructuring” section above).
Depreciation and Amortization. Depreciation and amortization expense decreased 4.7% to $2.8 million for the six months ended June 30, 2016 compared to $3.0 million for the six months ended June 30, 2015. The decrease is due primarily to the disposition of underutilized assets during the second half of 2015 and the first half of 2016.
Selling, General and Administrative Expenses. Selling, general and administrative expenses decreased to $2.7 million, or 39.6% of revenue, for the six months ended June 30, 2016 compared to $4.0 million, or 29.9% of revenue, for the six months ended June 30, 2015. Selling, general and administrative expenses consist primarily of overhead costs which we generally consider to be fixed. The period-over-period decline of $1.3 million, or 32.4%, reflects the cost cutting initiatives started in 2015 which continued in 2016. These initiatives, implemented in response to the massive downturn in the industry, included headcount and wage rate decreases, the reduction of executive management salaries and elimination of bonuses, and significant reductions in travel, entertainment and office expense. Selling, general and administrative expenses also include expenses that are either non-recurring or non-cash in nature with an aggregate value of $1.3 million and $0.2 million during the six months ended June 30, 2016 and 2015, respectively (see further discussion in “How We Evaluate Our Operations” section above).
Reduction in Value of Assets. During the six months ended June 30, 2016, we recorded a reduction in value of assets of $0.8 million, comprised of a $0.5 million reduction in an intangible associated with a non-compete which management determined was non-enforceable and a $0.3 million loss on the disposal of underutilized assets. We did not recognize any reduction in value of assets during the six months ended June 30, 2015.
Interest Expense, net. Interest expense and amortization of deferred loan costs was $1.1 million for the six months ended June 30, 2016 compared to $0.9 million for the six months ended June 30, 2015. The $0.2 million increase is due primarily to the accrual of the quarterly ticking fee effective with the debt modification in September 2015.
Income Taxes. Income taxes increased to a benefit of $2.5 million, or an effective tax rate of 41.6%, for the six months ended June 30, 2016 from a benefit of $1.3 million, or an effective tax rate of 42.9%, for the six months ended June 30, 2015. The effective tax rate remained relatively unchanged when comparing the six months ended June 30, 2016 to the six months ended June 30, 2015.
Discontinued Operations. Discontinued operations include Evolution which specialized as an operator of MWD downhole tools. Losses from discontinued operations, net of income taxes, were $1.4 million during the six months ended June 30, 2016, as compared to $1.2 million during the six months ended June 30, 2015. The loss from operations, prior to charges related to a reduction in value of assets, declined to $0.4 million from $1.3 million when comparing the six months ended June 30, 2016 to the six months ended June 30, 2015. This period-over-period decline was offset by a $1.3 million impairment of property and equipment during the six months ended June 30, 2016 in connection with the Recapitalization and the abandonment of the Evolution assets.
| 38 |
| Table of Contents |
Liquidity and Capital Resources
Net Cash Provided by Operating Activities. Cash flow provided by operating activities was approximately $0.1 million for the six months ended June 30, 2016 as compared to cash provided by operations of $3.4 million for the six months ended June 30, 2015. The decrease in 2016 was due primarily to an increase in the net loss from continuing operations, resulting from the downturn in the industry, and a decrease in cash provided by discontinued operations as most of our directional drilling and MWD customers had ceased using our services by mid-2016.
Liquidity. As a result of the industry downturn, many customers have experienced a significant reduction in their liquidity and have faced challenges accessing the capital markets. Several energy service and equipment companies have declared bankruptcy, or have had to exchange equity for the forgiveness of debt, while others have been forced to sell assets in an effort to preserve liquidity. We faced similar challenges requiring us to undergo a capital restructuring. For a discussion of the Recapitalization and its restructuring of our credit facility, see “Note 2 – Recent Developments and Subsequent Events” in the notes to our consolidated financial statements included elsewhere in this document.
While as of June 30, 2016, our liquidity was limited solely to cash and cash equivalents of $0.5 million, the Recapitalization increased our liquidity. The table below reflects our liquidity as of June 30, 2017 (in thousands):
| Cash and cash equivalents |
| $ | 573 |
|
| Revolving facility availability (1) , (3) |
|
| 250 |
|
| Delayed draw term loan availability (2) , (3) |
|
| 975 |
|
|
|
|
|
|
|
| Total liquidity |
| $ | 1,798 |
|
| ______________ |
| (1) Based on eligible receivables as of June 30, 2017. |
| (2) Available to finance 90% of purchase price for capital expenditures. |
| (3) With Permian Pelican LLC, our controlling shareholder. |
Capital Expenditures. Capital expenditures are the main component of our investing activities. Cash capital expenditures for the six months ended June 30, 2016 decreased to $0.3 million from $1.1 million for the six months ended June 30, 2015 due to a significant decrease in expansionary capital expenditures and the minimization of maintenance capital expenditures. In 2017, our cash flows for capital expenditures are limited to maintenance capital expenditures and acquiring assets to replace equipment which we sub-rent to meet customer demand when our owned equipment is fully utilized. Although we do not budget acquisitions in the normal course of business, we regularly engage in discussions related to potential acquisitions of companies which provide oilfield services.
Credit Facility. As of June 30, 2017, we have availability to borrow an incremental $1.2 million under our credit facility with Pelican and, effective January 31, 2017 through the maturity date of December 31, 2019, principal payments on our credit facility are based solely on excess free cash flows, significantly reducing our overall debt service requirements. For a discussion of the Recapitalization and its restructuring of our credit facility, see “Note 2 – Recent Developments and Subsequent Events” in the notes to our consolidated financial statements included elsewhere in this document.
We have experienced significant growth during the beginning of 2017 and we believe that our cash flow from operations combined with access to capital through our lender and controlling shareholder, Pelican, will be sufficient to fund our working capital needs, contractual obligations and maintenance capital expenditures for the next twelve months.
Item 3. Quantitative and Qualitative Disclosures About Market Risk
As a smaller reporting company, we are not required to provide the information required by this Item.
| 39 |
| Table of Contents |
Item 4. Controls and Procedures
Evaluation of Disclosure Controls and Procedures
Our management, under supervision and with the participation of the Company’s Principal Executive Officer and Principal Financial Officer, evaluated the effectiveness of our disclosure controls and procedures, as defined under Exchange Act Rule 13a-15(e). Based upon this evaluation, the Principal Executive Officer and Principal Financial Officer concluded that, as of December 31, 2016, because of the material weaknesses in our internal control over financial reporting (“ICFR”) described below, our disclosure controls and procedures were not effective.
Disclosure controls and procedures are controls and other procedures that are designed to ensure that required information to be disclosed in our reports filed or submitted under the Securities Exchange Act is recorded, processed, summarized and reported within the time periods specified in the Securities and Exchange Commission’s rules and forms. Disclosure controls and procedures include, without limitation, controls and procedures designed to ensure that required information to be disclosed in our reports filed under the Exchange Act is accumulated and communicated to our management, including our principal executive officer and our principal financial officer, as appropriate, to allow timely decisions regarding required disclosure.
Management’s Report on Internal Control over Financial Reporting
Our management is responsible for establishing and maintaining adequate internal control over financial reporting, as defined under Exchange Act Rules 13a-15(f) and 14d-14(f). Our internal control over financial reporting is designed to provide reasonable assurance regarding the reliability of financial reporting and the preparation of financial statements for external purposes in accordance with generally accepted accounting principles.
All internal control systems, no matter how well designed, have inherent limitations and may not prevent or detect misstatements. Therefore, even those systems determined to be effective can only provide reasonable assurance with respect to financial reporting reliability and financial statement preparation and presentation. In addition, projections of any evaluation of effectiveness to future periods are subject to risk that controls become inadequate because of changes in conditions and that the degree of compliance with the policies or procedures may deteriorate.
Management assessed the effectiveness of our internal control over financial reporting as of December 31, 2016. In making the assessment, management used the criteria issued by the Committee of Sponsoring Organizations of the Treadway Commission (COSO) in Internal Control-Integrated Framework 2013. Based on its assessment, management concluded that, as of December 31, 2016, our internal control over financial reporting was not effective and that material weaknesses in ICFR existed as more fully described below.
As defined by Auditing Standard No. 5, “An Audit of Internal Control Over Financial Reporting that is Integrated with an Audit of Financial Statements” established by the Public Company Accounting Oversight Board (“PCAOB”), a material weakness is a deficiency or combination of deficiencies that results in more than a remote likelihood that a material misstatement of annual or interim financial statements will not be prevented or detected. In connection with the assessment described above, management identified the following control deficiencies that represent material weaknesses as of December 31, 2016:
|
| 1) | Lack of an independent audit committee or audit committee financial expert. These factors may be counter to corporate governance practices as defined by the various stock exchanges and may lead to less supervision over management; |
|
|
|
|
|
| 2) | Insufficient written policies and procedures, and personnel, for accounting and financial reporting with respect to the requirements and application of US GAAP and SEC disclosure requirements, specifically to address technical accounting around complex transactions; |
|
|
|
|
|
| 3) | Control over information technology applications and the processing of transactions, specifically segregation of duties and elevated access privileges; and |
|
|
|
|
|
| 4) | Controls were not designed and in place to ensure that all disclosures required were originally addressed in our financial statements or other required reports filed or submitted under the Securities Exchange Act. |
| 40 |
| Table of Contents |
Management's Remediation Initiatives
As of December 31, 2016, management assessed the effectiveness of our internal control over financial reporting. Based on that evaluation, it was concluded that during the period covered by this report, the internal controls and procedures were not effective due to deficiencies that existed in the design or operation of our internal controls over financial reporting. However, management believes these weaknesses did not have an effect on our financial results. During the course of our evaluation, we did not discover any fraud involving management or any other personnel who play a significant role in our disclosure controls and procedures or internal controls over financial reporting.
Due to a lack of financial and personnel resources, we are not able to, and do not intend to, immediately take any action to remediate these material weaknesses. We will not be able to do so until, if ever, we acquire sufficient financing and staff to do so. We will implement further controls as circumstances, cash flows, and working capital permits. Notwithstanding the assessment that our ICFR was not effective and that there were material weaknesses as identified in this report, we believe that our financial statements contained in our Quarterly Report on Form 10-Q for the period ended June 30, 2016, fairly presents our financial position, results of operations, and cash flows for the periods covered, as identified, in all material respects.
Management believes that the material weaknesses set forth above were the result of the scale of our operations and intrinsic to our small size.
Changes in Internal Control over Financial Reporting
During the period covered by this report, there were no changes (including corrective actions with regard to significant deficiencies or material weaknesses) in our internal controls over financial reporting that occurred that have materially affected, or are reasonably likely to materially affect, our internal control over financial reporting.
| 41 |
| Table of Contents |
| Exhibit Number |
| Exhibit Description |
|
|
|
|
|
| ||
|
| ||
|
| ||
|
|
| 101.INS ** | XBRL Instance Document | |
| 101.SCH ** | XBRL Taxonomy Extension Schema Document | |
| 101.CAL ** | XBRL Taxonomy Extension Calculation Linkbase Document | |
| 101.DEF ** | XBRL Taxonomy Extension Definition Linkbase Document | |
| 101.LAB ** | XBRL Taxonomy Extension Label Linkbase Document | |
| 101.PRE ** | XBRL Taxonomy Extension Presentation Linkbase Document |
_____________
** XBRL (Extensible Business Reporting Language) information is furnished and not filed or a part of a registration statement or prospectus for purposes of Sections 11 or 12 of the Securities Act of 1933, as amended, is deemed not filed for purposes of Section 18 of the Securities Exchange Act of 1934, as amended, and otherwise is not subject to liability under these sections.
| 42 |
| Table of Contents |
Pursuant to the requirements of the Securities Exchange Act of 1934, the registrant has duly caused this report to be signed on its behalf by the undersigned thereunto duly authorized.
| ALY ENERGY SERVICES, INC. | |||
| October 27, 2017 | By: | /s/ Shauvik Kundagrami | |
|
|
| Date Shauvik Kundagrami Vice-Chairman and Chief Executive Officer (Principal Executive Officer) | |
| 43 |