Attached files
| file | filename |
|---|---|
| EX-99.1 - EXHIBIT 99.1 - FIRST BANCSHARES INC /MS/ | tv477655_ex99-1.htm |
| 8-K - FORM 8-K - FIRST BANCSHARES INC /MS/ | tv477655_8k.htm |
Exhibit 99.2

Growing in the Gulf South Nasdaq: FBMS October 24, 2017

ABOUT THE FIRST BANCSHARES, INC.: The First Bancshares, Inc. (“FBMS” or the “Company”), headquartered in Hattiesburg, Mississippi, is the parent company of The First, A National Banking Association. Founded in 1996, The First has operations in Mississippi, Louisiana, Alabama and Florida. The Company’s stock is traded on NASDAQ Global Market under the symbol FBMS. Contact: Chandra Kidd, Corporate Secretary. NO OFFER OR SOLICITATION This communication does not constitute an offer to sell, a solicitation of an offer to sell, the solicitation or an offer to buy any securities or a solicitation of any vote or approval. There will be no sale of securities in any jurisdiction in which such an offer, solicitation or sale would be unlawful prior to registration or qualification under the securities laws of any such jurisdiction. No offer of securities shall be made except by means of a prospectus meeting the requirement of Section 10 of the Securities Act of 1933, as amended. ADDITIONAL INFORMATION ABOUT THE OFFERING FBMS has filed a shelf registration statement on Form S - 3 (including a prospectus) with the SEC on September 15, 2017 which was declared effective on September 25, 2017. Before you invest in the offering to which this communication relates, you should read the prospectus in that registration statement and the preliminary prospectus supplement related to the offering and the other documents FBMS has filed and will file with the SEC for more complete information about FBMS and this offering. These documents are available at no charge by visiting the SEC’s website at http://www.sec.gov . Copies of the preliminary prospectus supplement and the accompanying prospectus related to the offering may be obtained from the Company, the underwriters or any dealer participating in the offering by contacting: Keefe, Bruyette & Woods, A Stifel Company , Equity Capital Markets, 787 Seventh Avenue, 4th Floor, New York, NY 10019, by e - mail USCapitalMarkets@kbw.com , by fax at 212 - 581 - 1592, or by calling toll - free (800) 966 - 1559 . 2 Safe Harbor NON - GAAP FINANCIAL MEASURES FBMS reports its results in accordance with United States generally accepted accounting principles (“GAAP”). However, management believes that certain non - GAAP performance measures used in managing the business may provide meaningful information about underlying trends in its business. Non - GAAP financial measures should be viewed in addition to, and not as an alternative for, FBMS’ reported results prepared in accordance with GAAP. Please see Reconciliation of Non - GAAP Measures at the end of this presentation for a reconciliation to the nearest GAAP financial measure. ADDITIONAL INFORMATION ABOUT THE MERGER AND WHERE TO FIND IT In connection with the proposed merger of FBMS and Southwest Banc Shares, Inc. (“Southwest”), FBMS will file with the Securities and Exchange Commission (the “SEC”) a registration statement on Form S - 4 that will include a proxy statement of Southwest and a prospectus of FBMS, as well as other relevant documents concerning the proposed transaction. WE URGE INVESTORS AND SECURITY HOLDERS TO READ THE REGISTRATION STATEMENT ON FORM S - 4, THE PROXY STATEMENT/PROSPECTUS INCLUDED WITHIN THE REGISTRATION STATEMENT ON FORM S - 4 AND ANY OTHER RELEVANT DOCUMENTS TO BE FILED WITH THE SEC IN CONNECTION WITH THE PROPOSED MERGER BECAUSE THEY WILL CONTAIN IMPORTANT INFORMATION ABOUT FBMS, SOUTHWEST AND THE PROPOSED MERGER. Investors and security holders will be able to obtain free copies of the registration statement on Form S - 4 and the related joint proxy statement/prospectus, when filed, as well as other documents filed with the SEC by FBMS through the web site maintained by the SEC at www.sec.gov. Documents filed with the SEC by FBMS will also be available free of charge by directing a written request to The First Bancshares, Inc., 6480 U.S. Highway 98 West, Hattiesburg, Mississippi 39402 Attn: Chandra Kidd, Corporate Secretary. FBMS ’ telephone number is (601) 268 - 8998. PARTICIPANTS IN THE TRANSACTION FBMS, Southwest and certain of their respective directors and executive officers may be deemed to be participants in the solicitation of proxies from the shareholders of Southwest in connection with the proposed transaction. Certain information regarding the interests of these participants and a description of their direct and indirect interests, by security holdings or otherwise, will be included in the proxy statement/prospectus regarding the proposed transaction when it becomes available. Additional information about FBMS and its directors and officers may be found in the definitive proxy statement of FBMS relating to its 2017 Annual Meeting of Stockholders filed with the SEC on April 12, 2017. The definitive proxy statement can be obtained free of charge from the sources described above.

3 This presentation contains “forward - looking statements” as defined in the Private Securities Litigation Reform Act of 1995, and is intended to be protected by the safe harbor provided by the same. These statements are subject to numerous risks and uncertainties. These risks and uncertainties include, but are not limited to, the following: competitive pressures among fina nci al institutions increasing significantly; economic conditions, either nationally or locally, in areas in which FBMS conducts operations being less favorable than expected; legislation or regulatory changes which adversely affect the ability of the consolidated company to conduct business combinations or new operations; and risks related to the proposed acquisition of Southwest Banc Shares, Inc., including the risk that the proposed transaction does not close when expected or at all because required regulatory or other approvals and other conditions to closing are not received or satisfied on a timely basis or at all , the terms of the proposed transaction may need to be modified to satisfy such approvals or conditions, and the risk that anticipated benefits from the proposed transaction are not realized in the time frame anticipated or at all as a result of ch ang es in general economic and market conditions. For additional information concerning factors that could cause actual conditions, events or results to materially differ from those described in the forward - looking statements, please refer to the factors set f orth under the headings “Risk Factors” and “Management’s Discussion and Analysis of Financial Condition and Results of Operations” in FBMS ’ Annual Report on Form 10 - K for the year ended December 31, 2016, which is available online at www.sec.gov. No assurances can be given that any of the events anticipated by the forward - looking statements will occur, or if any of them do so, what impact they will have on the results of operations or financial condition of FBMS or Southwest. FBMS disclaims any obligation to update any factors or to announce publicly the result of revisions to any forward - looking statements included herein to reflect future events or developments, except to the extent required by law. Forward Looking Statement

4 Table of Contents Section Offering Summary Franchise Overview Financial Results Acquisition Announcement Appendix I: Acquisition Related Supplemental Slides Appendix II: Historical Financials Appendix III: Non - GAAP Reconciliation 1 2 3 4 5 6 7
Offering Summary

Offering Summary 6 The First Bancshares, Inc. (“FBMS” or “Company”) Issuer Exchange / Ticker Offering Type Security Base Deal Value Overallotment Lock Up Use of Proceeds Bookrunner Lead Manager Nasdaq / FBMS Follow - On Offering Common Stock $45 million (100% Primary) 15% 90 days for all officers and directors Fund the cash portion of the Southwest purchase price Fund other potential future acquisitions General corporate purposes, including the repayment of debt and to support organic growth Keefe, Bruyette & Woods, Inc. FIG Partners, LLC

Franchise Overview

Overview of The First Bancshares, Inc. 8 □ Attractive demographic footprint, operating in premier markets across Mississippi, Louisiana, Florida, and Alabama □ Experienced , performance - driven Management team with local market knowledge □ Successful acquirer, having closed six transactions since 2011 □ Strong loan and deposit growth, each with an annualized CAGR exceeding 15%, since 2009 □ Core funded franchise with 96% core deposits and a cost of deposits of 0.36% □ Ranked in the Top 10 by deposit market share in 87% of our counties / parishes of operation by aggregate deposits □ Consistent improvement in profitability metrics with a ROAA of 0.51%, 0.79% and 1.06% in 2012, 2016 and Q3 2017 respectively □ Well capitalized regulatory capital ratios, with all capital ratios exceeding Basel III fully phased - in capital requirements Data as of or for the three months ended 9/30/17

□ The First Bancshares, Inc. (Nasdaq: FBMS) is a $1.8 billion asset bank holding company headquartered in Hattiesburg, Mississippi ▪ Founded in August 1996 ▪ Operates one subsidiary bank, The First, A National Banking Association ▪ Offers general commercial and retail banking services for small to medium - sized businesses, professional concerns, and individuals ▪ 421 full - time employees □ 6 th Largest banking institution headquartered in the state of Mississippi □ Balance Sheet (9/30/17) ▪ Assets: $1.8 billion ▪ Gross Loans: $1.2 billion ▪ Deposits: $1.5 billion ▪ Tangible Common Equity: $141.7 million □ Profitability (for the quarter e nded 9/30/17) ▪ Net Income: $4.7 million ▪ ROAA: 1.06% ▪ ROATCE: 13.6% (1) ▪ Efficiency Ratio: 62.9% □ Asset Quality ▪ Manageable amount of non performing assets ▪ NPAs / Loans and of 1.21% ▪ Concentration levels regulatory guidelines 9 Company Overview 9 Source: SNL Financial Data as of or for the three months ended 9/30 of each respective year (1) Non - GAAP measure. See reconciliation to closest GAAP measure in Appendix III Franchise Footprint FBMS Branch FBMS LPO FLORIDA MISSISSIPPI ALABAMA LOUISIANA Mobile Hattiesburg Tallahassee Pensacola Gulfport New Orleans Jackson Montgomery Huntsville Tuscaloosa Birmingham Shreveport Baton Rouge Oxford 10 55 59 2 0 4 9

10 M. Ray "Hoppy" Cole, Jr. Dee Dee Lowery President, CEO Executive VP, CFO 30 years experience 26 years experience Ion Mixon Eric Waldron Executive VP, Risk Manager President, Northern Region 17 years experience 21 years experience Chris Ryals Carol Daniel Executive VP, COO Executive VP, Credit Administrator 22 years experience 34 years experience Hayden Mitchell Dave Bush Executive VP, Chief Retail Banking Officer Executive VP, Private Banking Manager 40 years experience 37 years experience Ray Wesson Wade Neth President, Southern Region President, Alabama Region 24 years experience 30 years experience Overview of Our Leadership Team □ Executive leadership team has been with the Company for an average of 9 years □ Same team responsible for devising and executing the plan to double the size of the company

Evolution of Our Franchise… 11 December 31, 2009 FBMS Branch (9) September 30, 2017 FBMS Branch (45) FBMS LPO (4) Total Assets ($mm) $478 $503 $500 $540 $571 $647 $698 $830 $940 $181 $181 $370 $447 $447 $447 $848 $681 $721 $941 $1,094 $1,145 $1,277 $1,788 $0 $500 $1,000 $1,500 $2,000 2009 2010 2011 2012 2013 2014 2015 2016 Q3 '17 Acquired Organic Source: SNL Financial Data as of 12/31 of each year, respectively; Q3 ‘17 data as of 9/30/17
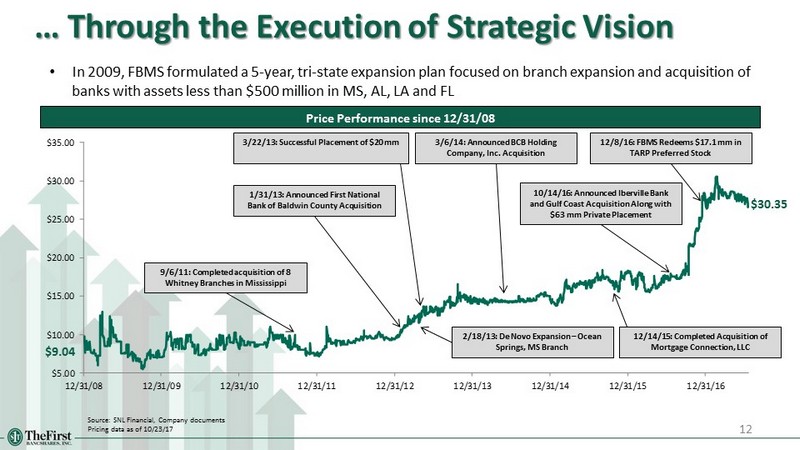
… Through the Execution of Strategic Vision 12 Source: SNL Financial, Company documents Pricing data as of 10/23/17 $5.00 $10.00 $15.00 $20.00 $25.00 $30.00 $35.00 12/31/08 12/31/09 12/31/10 12/31/11 12/31/12 12/31/13 12/31/14 12/31/15 12/31/16 Price Performance since 12/31/08 • In 2009, FBMS formulated a 5 - year, tri - state expansion plan focused on branch expansion and acquisition of banks with assets less than $500 million in MS, AL, LA and FL 10/14/16: Announced Iberville Bank and Gulf Coast Acquisition Along with $63 mm Private Placement 3/22/13: Successful Placement of $20 mm 1/31/13: Announced First National Bank of Baldwin County Acquisition 2/18/13: De Novo Expansion – Ocean Springs, MS Branch 3/6/14: Announced BCB Holding Company, Inc. Acquisition 12/8/16: FBMS Redeems $17.1 mm in TARP Preferred Stock 9/6/11: Completed acquisition of 8 Whitney Branches in Mississippi 12/14/15: Completed Acquisition of Mortgage Connection, LLC $9.04 $30.35

Improving Diversification of Our Balance Sheet by State 13 2009 Deposits by State 2015 Deposits by State 2017 Deposits by State Mississippi 100% Mississippi 73% Alabama 23% Louisiana 4% Alabama 17% Louisiana 19% Florida 7 % Mississippi 57% Source: SNL Financial and Company 2009, 2015, and 2017 data as of 6/30 of each year respectively 2009 Loans by State 2015 Loans by State 2017 Loans by State Mississippi 68% Alabama 23% Louisiana 9% Mississippi 100% Alabama 18% Louisiana 22% Florida 5% Mississippi 55%

Market Demographics 14 ‘ 18 – ‘ 23 Projected Population Growth (%) ‘ 18 – ‘ 23 Projected Median HHI Growth (%) 2023 Projected Median HHI ($) Source: SNL Financial Deposit data as of 6/30/17 Demographic data deposit weighted by county 3.1% 1.7% 6.7% 2.8% 0.8% 4.6% 3.8% 0.0% 2.0% 4.0% 6.0% 8.0% FBMS Alabama Florida Louisiana Mississippi Southeast US 5.8% 5.2% 7.8% 5.5% 5.6% 6.5% 7.3% 0.0% 2.0% 4.0% 6.0% 8.0% FBMS Alabama Florida Louisiana Mississippi Southeast US $52,441 $48,225 $53,508 $49,765 $44,328 $54,678 $61,642 $15,000 $25,000 $35,000 $45,000 $55,000 $65,000 FBMS Alabama Florida Louisiana Mississippi Southeast US

15 Continuously Evaluating Potential Acquisitions Hattiesburg Mobile Baton Rouge Birmingham Tallahassee Atlanta Huntsville Chattanooga Columbus Montgomery Jacksonville Knoxville Nashville Jackson Metairie New Orleans Memphis Little Rock Shreveport Savannah Banks: $200 mm - $500 mm Banks: $500 mm - $1.0 bn Banks: $1.0 bn - $2.0 bn Source: SNL Financial Data as of 6/30/17 Excludes merger targets Opportunities by State Opportunities by Asset Size • Includes all banks and thrifts headquartered in Alabama, Louisiana, Mississippi and select Florida markets with total assets between $200 million and $2.0 billion # of Assets State Banks ($mm) Branches Alabama 53 $25,052 457 Florida 10 4,244 62 Louisiana 60 34,763 687 Mississippi 36 17,294 385 Total: 159 $81,353 1,591 36 8 36 25 13 2 15 7 4 9 4 53 10 60 36 0 20 40 60 80 AL FL LA MS Number of Opportunities $200 mm - $500 mm $500 mm - $1.0 bn $1.0 bn - $2.0 bn

Financial Results

$2.2 $2.5 $3.6 $4.2 $6.3 $8.5 $9.7 $2.5 $3.4 $2.6 $4.0 $2.6 $4.7 $0.0 $3.0 $6.0 $9.0 $12.0 $0.51* $0.47* $0.47* $0.37* $0.46* Source : SNL Financial Yearly data for the twelve months ended 12/31 of each year, respectively; quarterly data for the three months ended each respective quarter * Operating net earnings per share – includes 3.6 million in new shares associated with the 2016 capital raise and excludes merger - related charges (1) (1) Non - GAAP measure. See reconciliation to closest GAAP measure in Appendix III 17 Historical Performance Over Time Seventh Year of Record Earnings EPS Net Income ($mm) $0.74 $0.82 $1.16 $0.96 $1.19 $1.55 $1.57 $0.51* 2010 2012 2013 2014 2015 2016 2011 Q1 Q3 2017 2016 2016 Q2 2017 2016 2017 $0.44*

$16.3 $19.1 $22.2 $28.4 $33.4 $37.0 $40.3 $9.7 $14.2 $9.9 $14.8 $10.1 $14.9 $0.0 $12.5 $25.0 $37.5 $50.0 Net Interest Income Over Time 18 3.74% 3.99% 3.59% 3.44% 3.70% 3.72% 3.71% 3.85% 3.81% Net Interest Income ($mm) NIM (1) 3.70% 3.68% Source : SNL Financial Yearly data for the twelve months ended 12/31 of each year, respectively; quarterly data for the three months ended each respective quarter (1) Fully taxable - equivalent “FTE” Q1 Q3 2016 2016 2017 2017 2010 2012 2013 2014 2015 2016 2011 3.84% 3.68% Q2 2016 2017

19 Profitability Performance Core ROAA (%) (1) Net Interest Margin (%) Core Efficiency Ratio (%) (1) Core ROATCE (%) (1) Source: SNL Financial Data for the twelve months ended 12/31 each respective year , Q1 ’17 , Q2 ’17, Q3 ‘17 data for the three months ended, respectively (1) Non - GAAP measure. See reconciliation to closest GAAP measure in Appendix III 0.78% 0.84% 0.79% 0.92% 1.07% 2015 2016 Q1 '17 Q2 '17 Q3 '17 13.5% 11.7% 10.0% 12.3% 13.7% 2015 2016 Q1 '17 Q2 '17 Q3 '17 71.1% 69.3% 70.0% 65.6% 62.7% 2015 2016 Q1 '17 Q2 '17 Q3 '17 3.72% 3.71% 3.85% 3.84% 3.81% 2015 2016 Q1 '17 Q2 '17 Q3 '17
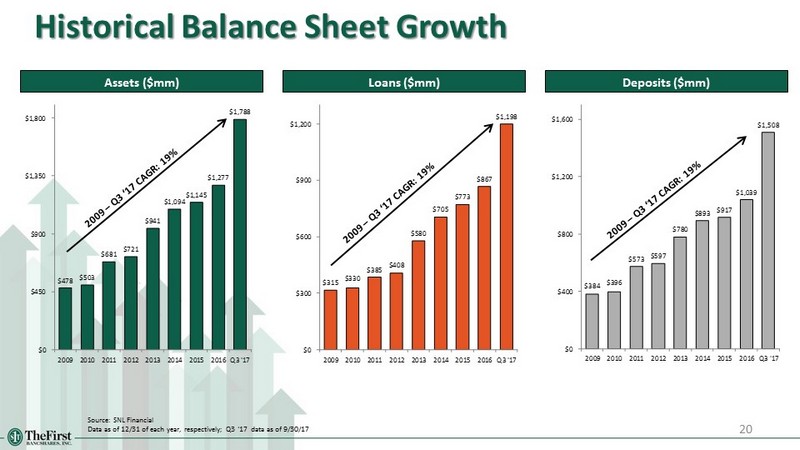
Historical Balance Sheet Growth 20 Assets ($mm) Source: SNL Financial Data as of 12/31 of each year, respectively; Q3 ‘17 data as of 9 /30/17 $478 $503 $681 $721 $941 $1,094 $1,145 $1,277 $1,788 $0 $450 $900 $1,350 $1,800 2009 2010 2011 2012 2013 2014 2015 2016 Q3 '17 Loans ($mm) Deposits ($mm) $315 $330 $385 $408 $580 $705 $773 $867 $1,198 $0 $300 $600 $900 $1,200 2009 2010 2011 2012 2013 2014 2015 2016 Q3 '17 $384 $396 $573 $597 $780 $893 $917 $1,039 $1,508 $0 $400 $800 $1,200 $1,600 2009 2010 2011 2012 2013 2014 2015 2016 Q3 '17

Capital & Liquidity Position TCE / TA (%) (1) Leverage Ratio (%) Total Risk Based Capital (%) Loans / Deposits (%) Source: SNL Financial Data as of 12/31 of each year, respectively; Q3 ‘17 data as of 9/30/17 (1) Non - GAAP measure. See reconciliation to closest GAAP measure in Appendix III 21 5.9% 6.0% 6.2% 11.0% 8.0% 2013 2014 2015 2016 Q3 '17 13.4% 12.3% 11.9% 15.5% 11.3% 2013 2014 2015 2016 Q2 '17 9.0% 8.4% 8.7% 11.9% 8.4% 2013 2014 2015 2016 Q2 '17 74.3% 78.9% 84.3% 83.4% 79.5% 2013 2014 2015 2016 Q3 '17

22 Loan Portfolio C&D 14% 1 - 4 Family 27% Multifamily 3% Owner - Occupied CRE 21% Non Owner - Occupied CRE 16% C&I 13% Consumer & Other 3% Farmland 2% Q3 ‘17 Loan Composition Yield on Total Loans: 4.86% Dollars in Thousands Source : SNL Financial Data as of 12/31 of each year, respectively; Q3 ‘17 data as of 9/30/17 Note: Pie chart percentages may not total to 100% due to rounding Historical Loan Composition 2013 1 – 4 Family Owner - Occupied CRE C&I Farmland Non Owner Occupied CRE C&D Multifamily Consumer & Other 2014 2015 2016 11% 33% 3% 22% 12% 14% 4% 1% 12% 31% 4% 22% 11% 15% 4% 1% 13% 29% 4% 20% 12% 16% 4% 2% 12% 27% 3% 21% 14% 15% 5% 3% Loan Portfolio Amount C&D $171,609 1-4 Family 324,485 Multifamily 34,212 Owner-Occupied CRE 258,426 Non Owner-Occupied CRE 197,684 C&I 161,877 Consumer & Other 31,290 Farmland 23,199 Gross Loans & Leases $1,202,782

Focus on Credit Quality NPAs / Loans + OREO (%) Annualized NCOs / Average Loans (%) Allowance for Loan Losses / Loans (%) NPAs Over Time ($) Source: SNL Financial Data as of or for the twelve months ended each respective year; Q1, Q2, Q3 ‘17 data as of or for the three months ended, respectively $3.2 $6.1 $7.4 $3.3 $5.0 $4.0 $4.9 $1.6 $2.9 $2.8 $2.8 $5.2 $4.9 $4.7 $4.5 $4.7 $3.1 $6.0 $7.6 $8.1 $7.9 $9.2 $13.6 $13.2 $12.0 $17.7 $17.0 $17.5 2013 2014 2015 2016 Q1 '17 Q2 '17 Q3 '17 Nonaccruals ($mm) TDRs ($mm) OREO ($mm) 0.00% 0.25% 0.50% 0.75% 1.00% 1.25% 2013 2014 2015 2016 Q1 '17 Q2 '17 Q3 '17 Reserve / Total Loans Reserve / Non-Acquired Loans 1.9% 2.0% 1.8% 1.4% 1.6% 1.5% 1.5% 2013 2014 2015 2016 Q1 '17 Q2 '17 Q3 '17 0.01% 0.17% (0.03%) (0.02%) (0.09%) (0.00%) (0.01%) 2013 2014 2015 2016 Q1 '17 Q2 '17 Q3 '17 23
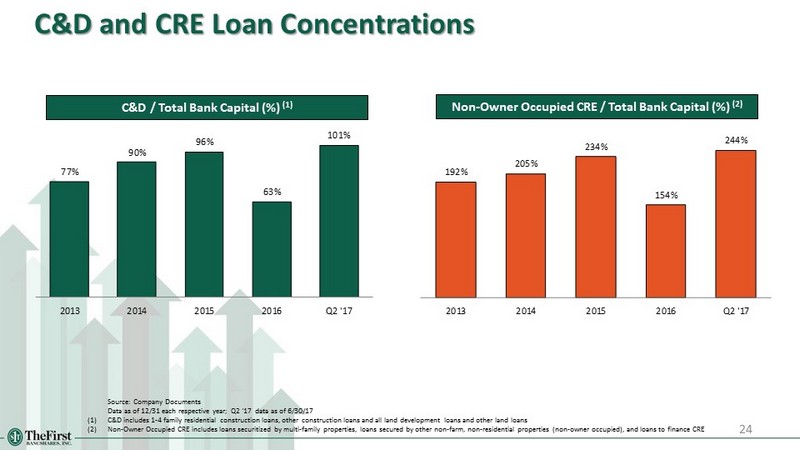
C&D and CRE Loan Concentrations C&D / Total Bank Capital (%) (1) Non - Owner Occupied CRE / Total Bank Capital (%) (2) Source : Company Documents Data as of 12/31 each respective year; Q2 ‘17 data as of 6/30/17 (1) C&D includes 1 - 4 family residential construction loans, other construction loans and all land development loans and other land l oans (2) Non - Owner Occupied CRE includes loans securitized by multi - family properties, loans secured by other non - farm, non - residential p roperties (non - owner occupied), and loans to finance CRE 77% 90% 96% 63% 101% 2013 2014 2015 2016 Q2 '17 192% 205% 234% 154% 244% 2013 2014 2015 2016 Q2 '17 24

25 Deposit Composition Demand Deposits 20% NOW Accounts 42% Money Market & Savings 19% Retail Time Deposits 14% Jumbo Time Deposits 4% Cost of Total Deposits: 0.36% Source: SNL Financial Dollars in Thousands Note: Jumbo time deposits defined as greater than $250,000 Note: Pie chart percentages may not total 100% due to rounding Data as of or for the twelve months ended 12/31 of each respective year, respectively; Q1, Q2, and Q3 ‘17 data as of or for the thre e m onths ended Deposit Portfolio $657 $766 $806 $894 $1,509 $1,492 $1,450 2013 2014 2015 2016 Q1 '17 Q2 '17 Q3 '17 Core Deposit Growth ($000) Cost of Deposits (%) 0.31% 0.27% 0.27% 0.34% 0.34% 0.36% 2013 2014 2015 2016 Q2 '17 Q3 '17 Cost of Funds: 0.35% 0.32% 0.31% 0.39% 0.41% 0.44% Deposit Composition Amount Demand Deposits $308,050 NOW Accounts 639,802 Money Market & Savings 292,592 Retail Time Deposits 209,714 Jumbo Time Deposits 57,833 Total Deposits $1,507,991

26 Asset Liability Management The First Bancshares is Asset Sensitive Change in Interest Rates % Change From Base Policy Limit % Change From Base Policy Limit Up 400 bps 17.9% -20.0% 31.8% -40.0% Up 300 bps 13.6% -15.0% 26.2% -30.0% Up 200 bps 9.1% -10.0% 19.2% -20.0% Up 100 bps 4.6% -5.0% 10.7% -10.0% Down 100 bps -6.4% -5.0% -13.6% -10.0% Down 200 bps -9.0% -10.0% -13.1% -20.0% Net Interest Income Economic Value of Equity FBMS Interest Rate Sensivity September 30, 2017 □ The Company maintains an asset sensitive balance sheet that would benefit from an increase in interest rates □ Changes to net interest income and economic value of equity are well within policy limits in all up rate shock scenarios

Acquisition Announcement

28 Transaction Rationale □ Enhances our Alabama Gulf Coast presences □ Positions FBMS as the largest community bank by deposit market share along the Alabama Coast (1) □ Acquisition of 100+ year old bank with quality core customer base with 95% core deposits □ 2+ times more small to mid sized business banking opportunities along Alabama Gulf Coast (2) □ Franchise overlap provides potential for considerable cost savings opportunities and enhanced operating efficiencies Strategic Rationale Financially Attractive □ Immediately accretive to EPS, with minimal initial tangible book value dilution, earned back inside of 2 years (3) □ Improved capital position and reduced C&D / CRE loan concentration ratios, inclusive of this capital raise □ Internal rate of return exceeds cost of capital □ Stronger pro forma profitability levels □ Expansion of funding platform and excess liquidity provides future loan growth opportunities Risk Mitigants □ Established franchise with deep local connections to the community □ In - market transaction □ Leverages management experience and infrastructure in Mobile & Daphne - Fairhope - Foley markets □ Experienced Southeast acquirer – completed 6 acquisitions since 2011 □ Thorough due diligence process completed with over 40% of the total loan portfolio reviewed Source: SNL Financial; financial data as of 6/30/17 (1) Includes the MSAs of Mobile, AL and Daphne - Fairhope - Foley, AL; community bank defined as institutions with assets less than $10 billion (2) As compared to the Mississippi Gulf Coast; small to mid - sized businesses defined as businesses with annual revenues between $5 - $25 million (3) Based upon our current stock price and inclusive of the capital raise amount allocated to the M&A transaction

First Bancshares, Inc. (Nasdaq: FBMS) / Southwest Banc Shares , Inc. (“Southwest”) Overview of Transaction Terms 29 Acquirer / Target Fixed Aggregate Deal Value (1) Fixed Cash Deal Value Fixed Stock Deal Value Implied FBMS Shares Issued to Target (2) Implied Exchange Ratio (2) Price / Tangible Book Value (3) Price / LTM Net Income (4) $60.0 million $24.0 million $36.0 million 1,182,266 16.5677 166% 23.1x Southwest Management Key personnel executed employment agreements (1) The purchase price may be adjusted downward to the extent, among other things, Southwest's consolidated net book value at clo sin g (as adjusted) falls below $32.0 million (2) The exchange ratio will be based on FBMS' ten - day average closing price as of five business day prior to closing ranging between a ceiling of $ 36.54 and a floor of $ 24.36; current implied exchange ratio based upon FBMS stock price of $ 30.45 per share (3) Based upon Southwest's tangible common equity of $36.1 million as of 6/30/17 ; Non - GAAP measure. See reconciliation to closest GAAP measure in Appendix III (4) Based upon Southwest's last twelve months pre - tax net income of $3.995 million; assumes 35% corporate tax rate to derive adjusted net income, given Southwest is currently a S - Corporation (5) Excludes impact of capital offering; based upon FBMS common shares outstanding of 9,153,407 and Southwest common shares outst and ing of 71,317 (6) Pro forma ownership shown at the current Implied Exchange Ratio; FBMS pro forma ownership to range between 86.2% to 90.3%, based upon the final exchange ratio Pro Forma Ownership (5) (6) FBMS: 88.6% / Southwest: 11.4% Required Approvals Customary regulatory approvals and Southwest shareholder approval Expected Closing First quarter 2018

30 Overview of Southwest Banc Shares, Inc. □ Holding Company for First Community Bank □ Headquartered in Mobile, Alabama □ Founded in 1909; family owned since inception □ Four branches in the Mobile, AL MSA and three in the Daphne - Fairhope - Foley, AL MSA, and two in Washington county □ 91 full time employees □ S - corporation which passes corporate income through to their shareholders for federal tax purposes Branch Locations Key Franchise Facts Financial Highlights Source: SNL Financial Data as of or for the three months ended 6/30/17 (1) Tax affected at 35% to account for S - Corporation status Balance Sheet Trends Southwest Balance Sheet ($mm) Assets $398 Loans 279 Deposits 352 Common Equity 36 Loans / Deposits 79.1 % % Core Deposits 94.7 Profitability ROAA (1) 0.70 % Net Interest Margin 3.73 Efficiency Ratio 69.6 Asset Quality NPAs / Assets 1.63 % Reserves / Loans 1.18 Loan Concentration C&D / CRE Loan Concentration 75 / 196 % $317 $311 $321 $343 $377 $398 $200 $213 $231 $246 $277 $279 $272 $264 $269 $290 $328 $352 2012 2013 2014 2015 2016 Q2 '17 Loans Deposits Assets Annualized CAGRs Loans: 7.7% Deposits: 5.9% Assets: 5.2%

31 Strengthening Our Presence… Combined Deposit Market Share (1) Alabama Gulf Coast Footprint Source: SNL Financial Data as of 6/30/17 (1) Deposit market share data includes Mobile, AL MSA and Daphne - Fairhope - Foley, AL MSA FBMS Southwest Deposits Market Rank Institution ($mm) Share Branches 1 Regions Financial Corp. $3,251 28.3% 36 2 PNC Financial Services Group Inc. 1,392 12.1 24 3 BBVA Compass Bancshares Inc. 1,337 11.6 17 4 Wells Fargo & Co. 1,047 9.1 19 5 Hancock Holding Co. 894 7.8 9 Pro Forma 500 4.3 18 6 Trustmark Corp. 438 3.8 10 7 Home BancShares Inc. 407 3.5 6 8 BB&T Corp. 367 3.2 9 9 IBERIABANK Corp. 343 3.0 3 10 First Bancshares Inc. 268 2.3 10 11 ServisFirst Bancshares Inc. 237 2.1 2 12 Southwest Banc Shares Inc. 231 2.0 8 13 United Bancorp. of Alabama Inc. 182 1.6 9 14 Community Bancshares of Mississippi Inc. 168 1.5 4 15 BancorpSouth Inc. 165 1.4 5 16 National Commerce Corp. 139 1.2 2 17 Synovus Financial Corp. 115 1.0 3 18 Bryant Bank 97 0.8 3 19 Citizens' Capital Corp. 97 0.8 3 20 Bancorp of Lucedale Inc. 81 0.7 5

32 …in Highly Desirable Markets FBMS Counties of Operation (3) Source: SNL Financial; http://mobilechamber.com; http://asdd.com/; http://airbusaslabama.com; http://www.southalabama.edu Data as of 6/30/17, deposit data as of 6/30/17 (1) Small to mid - sized businesses defined as businesses with annual revenues between $5 - $25 million (2) Includes businesses based in either Mobile, AL or Baldwin, AL counties (3) Ranked by aggregate sales Healthcare 22% Wholesale Trade 15% Retail Trade 11% Construction 10% Finance and Insurance 7% Professional, Scientific, & Technical Services 6% Educational Services 6% Manufacturing 5% Information 4% Real Estate 3% Waste Management 3% Transportation 2% Other Services 2% Other 4% Alabama Gulf Coast: Diverse Small to Mid - Sized Businesses (1)(2) Aggregate # of Sales Market County Businesses (1) ($mm) Rank (1) Alabama Counties of Operation Mobile 1,938 $18,804 2 Baldwin 808 7,323 4 Total 2,746 $26,127 Florida Counties of Operation Escambia 1,234 $12,266 3 Santa Rosa 315 3,060 9 Total 1,549 $15,326 Louisiana Parishes of Operation Ascension 369 $3,564 8 Assumption 52 414 19 East Baton Rouge 2,285 21,611 1 Iberville 108 1,043 14 Livingston 237 2,217 11 Washington 126 994 15 West Baton Rouge 128 1,317 13 Total 3,305 $31,160 Mississippi Counties of Operation Coastal Counties Hancock 91 $780 17 Harrison 689 6,696 5 Jackson 415 3,794 6 Total 1,195 $11,270 Non-Coastal Counties Lamar 163 $1,442 12 Jones 245 2,267 10 Forrest 374 3,681 7 Stone 45 455 18 Pearl River 109 982 16 Total 936 $8,827 Total - All MS 2,131 $20,097 □ Growing economy & population driven by healthcare, manufacturing, and service sectors □ Regional center for medical care, research and education □ Airbus selected Mobile for its assembly site and will be making material investments in the area □ Diverse manufacturing base driven by paper, steel, maritime, chemical and aerospace sectors □ Port of Mobile has the 12 th highest domestic tonnage □ Since 2006, Mobile’s economic development efforts have garnered $8.5 billion in capital investment and more than 17,400 jobs □ University of Southern Alabama has an enrollment of 16,000+ students □ Mobile county school system is the largest in state and one of the largest employers Demographics Comparison 3.06% 3.10% 1.00% 2.00% 3.00% 4.00% 5.00% FBMS Combined Mobile & Baldwin Counties 5.8% 7.4% 2.0% 4.0% 6.0% 8.0% 10.0% FBMS Combined Mobile & Baldwin Counties $52,441 $54,333 $48,000 $50,000 $52,000 $54,000 $56,000 FBMS Combined Mobile & Baldwin Counties Projected Population Growth (%) Projected Household Income Growth (%) Projected 2023 Household Income ($)

33 Extensive Due Diligence Conducted 33 □ Close coordination with Southwest’s Management team in all aspects of strategy and operations □ Risk management analysis done by FBMS’ senior management, including CEO, CFO, COO, Credit Risk Manager, Credit Administrator, Chief Retail Banking Officer, and local market Presidents □ Comprehensive credit review of Southwest’s loan portfolio utilizing both internal and external resources ▪ All performing loans with exposure greater than $1,000,000 ▪ Internally classified loans (Substandard or worse) with exposure greater than or equal to $300,000 ▪ All loans more than 29 days past due with exposure greater than $100,000 ▪ In total, 40% of the total loan portfolio and 55% of the Commercial Real Estate loan portfolio by loan balance was reviewed □ All OREO properties individually evaluated for impairment □ Thorough balance sheet and liquidity analysis

□ Estimated noninterest expense savings of 40% ▪ 50% realized during 2018 and 100% achieved in 2019 and thereafter Transaction Assumptions 34 Cost Savings Transaction Expenses Loan Mark Other Marks CDI Revenue Synergies □ Estimated one - time transaction expenses of $4.3 million (after - tax) □ Gross loan mark of $5.6 million (1.9% of gross loans) □ $0.3 million mark on OREO (50%) □ Core deposit intangibles of 1.25% of transaction accounts; amortized straight - line over 10 years □ None modeled; but opportunities identified

35 Key Transaction Impacts to FBMS (1) 2019 EPS Impact IRR Initial Tangible Book Value Impact Tangible Book Value Earnback Period TCE / TA Leverage Ratio Common Equity Tier 1 Ratio Tier 1 Ratio Total Risk - Based Ratio C&D / Total Capital CRE / Total Capital Capital Ratios Loan Concentration (2) - - Low Single - Digit Accretion Exceeds Internal Thresholds Slight Accretion None 7.8% -- 8.4% 9.2% 10.0% 11.4% 10.7% 11.9% 11.3% 12.4% 101% 90% 244% 218% Scenarios: Scenarios: Standalone Standalone $45mm Capital $30mm Capital Estimated Pro Forma Financial Metrics Mid Single - Digit Accretion Exceeds Internal Thresholds Slight Dilution < 2 years -- 8.6% 10.5% 11.1% 11.6% 96% 233% $30mm Capital $45mm Capital Standalone data as of 6/30/17 (1) Estimated financial impact is presented solely for illustrative purposes. Includes assets acquired from Southwest with corres pon ding purchase accounting marks, deal related expenses and net proceeds from capital raise (2) Bank level total capital - - - - - - Pro Forma (1)

Mississippi 44% Lousiana 18% Alabama 34% Florida 4% 36 Overview of Our Combined Company Combined Company Footprint Pro Forma Highlights Pro Forma Deposits by State Pro Forma Loans by State Source: SNL Financial Data as of or for the three months ended 6/30/17 Note: pro forma financial highlights excludes purchase accounting adjustments Assets $2.2bn Loans 1.5bn Deposits 1.9bn Loans / Deposits 79% Mississippi 47% Lousiana 15% Alabama 33% Florida 5% FBMS Southwest LOUISIANA MISSISSIPPI ALABAMA FLORIDA Montgomery Mobile Hattiesburg Baton Rouge Jackson Tuscaloosa Birmingham Shreveport Tallahassee Gulfport Huntsville New Orleans Pensacola Oxford 10 55 59 2 0 4 9

37 Summary 37 □ Ideal combination of strategic and financial attractiveness to all parties - We believe this will create long - term value for both FBMS and Southwest shareholders □ Creates a valuable Gulf Coast bank □ Experienced management team and dedicated board of directors who act as shareholders □ Combined company offers enhanced growth and profitability outlook □ Lower risk, given in - market acquisition and significant due diligence □ Positions company well for future

APPENDIX I: ACQUISITION RELATED SUPPLEMENTAL SLIDES

C&D 14% 1 - 4 Family 26% Multifamily 3% Owner - Occupied CRE 22% Non Owner - Occupied CRE 16% C&I 13% Consumer & Other 4% Farmland 2% 39 Pro Forma Loan Composition Southwest FBMS Pro Forma (1) C&D 14% 1 - 4 Family 27% Multifamily 3% Owner - Occupied CRE 22% Non Owner - Occupied CRE 16% C&I 13% Consumer & Other 3% Farmland 2% C&D 11% 1 - 4 Family 24% Multifamily 4% Owner - Occupied CRE 24% Non Owner - Occupied CRE 14% C&I 14% Consumer & Other 9% Farmland <1% Yield on Total Loans : 4.86% Yield on Total Loans : 5.00% Source: SNL Financial Dollars in thousands Data as of 9/30/17 Note: Pie charts may not total to 100% due to rounding (1) Excludes purchase accounting adjustments Loan Portfolio Amount C&D $171,609 1-4 Family 324,485 Multifamily 34,212 Owner-Occupied CRE 258,426 Non Owner-Occupied CRE 197,684 C&I 161,877 Consumer & Other 31,290 Farmland 23,199 Gross Loans & Leases $1,202,782 Loan Portfolio Amount C&D $31,173 1-4 Family 67,911 Multifamily 11,618 Owner-Occupied CRE 66,255 Non Owner-Occupied CRE 38,374 C&I 38,994 Consumer & Other 23,658 Farmland 708 Gross Loans & Leases $278,691 Loan Portfolio Amount C&D $202,782 1-4 Family $392,396 Multifamily $45,830 Owner-Occupied CRE $324,681 Non Owner-Occupied CRE $236,058 C&I $200,871 Consumer & Other $54,948 Farmland $23,907 Gross Loans & Leases $1,481,473

40 Pro Forma Deposit Composition Southwest FBMS Pro Forma (1) Demand Deposits 20% NOW Accounts 42% Money Market & Savings 19% Retail Time Deposits 14% Jumbo Time Deposits 4% Demand Deposits 20% NOW Accounts 17% Money Market & Savings 35% Retail Time Deposits 23% Jumbo Time Deposits 5% Demand Deposits 20% NOW Accounts 38% Money Market & Savings 22% Retail Time Deposits 16% Jumbo Time Deposits 4% Cost of Total Deposits: 0.36% Cost of Total Deposits: 0.48% Source: SNL Financial Dollars in thousands FBMS data as of or for the three months ended 9/30/17, Southwest data bank level as of or for the three months ended 6/30/17 Note: Pie charts may not total to 100% due to rounding (1) Excludes purchase accounting adjustments Deposit Composition Amount Demand Deposits $308,050 NOW Accounts 639,802 Money Market & Savings 292,592 Retail Time Deposits 209,714 Jumbo Time Deposits 57,833 Total Deposits $1,507,991 Deposit Composition Amount Demand Deposits $69,269 NOW Accounts 60,713 Money Market & Savings 122,913 Retail Time Deposits 80,873 Jumbo Time Deposits 18,593 Total Deposits $352,361 Deposit Composition Amount Demand Deposits $377,319 NOW Accounts 700,515 Money Market & Savings 415,505 Retail Time Deposits 290,587 Jumbo Time Deposits 76,426 Total Deposits $1,860,352

3.25 miles 4.40 miles 2.60 miles 2.25 miles 1.00miles 41 Branch Overlap Mobile, AL and Daphne - Fairhope - Foley, AL MSAs Source: SNL Financial Distance shown for Southwest branches within five miles of a FBMS branch FBMS Southwest

42 Pro Forma Deposit Market Share Mobile, AL MSA Daphne - Fairhope - Foley, AL MSA Deposits Market Rank Institution ($mm) Share Branches 1 Regions Financial Corp. $2,340 32.36% 25 2 PNC Financial Services Group Inc. 1,001 13.84 14 3 BBVA Compass Bancshares Inc. 889 12.29 12 4 Hancock Holding Co. 685 9.47 7 5 Wells Fargo & Co. 614 8.49 12 6 Trustmark Corp. 341 4.71 6 7 IBERIABANK Corp. 275 3.81 2 Pro Forma 237 3.27 9 8 ServisFirst Bancshares Inc. 237 3.27 2 9 Southwest Banc Shares Inc. 176 2.43 5 10 BB&T Corp. 116 1.61 4 11 BancorpSouth Inc. 91 1.25 2 12 Community Bancshares of Mississippi Inc. 88 1.21 2 13 Bancorp of Lucedale Inc. 81 1.12 5 14 Synovus Financial Corp. 62 0.86 2 15 First Bancshares Inc. 61 0.84 4 16 CNB Bancorp Inc. 48 0.67 2 17 Bank of the Ozarks 48 0.66 2 18 State Capital Corp. 29 0.40 1 19 Oakworth Capital Inc. 23 0.31 1 20 Merchants Trust Inc. 21 0.29 2 Deposits Market Rank Institution ($mm) Share Branches 1 Regions Financial Corp. $910 21.38% 11 2 BBVA Compass Bancshares Inc. 448 10.52 5 3 Wells Fargo & Co. 433 10.17 7 4 Home BancShares Inc. 407 9.55 6 5 PNC Financial Services Group Inc. 390 9.17 10 Pro Forma 263 6.17 9 6 BB&T Corp. 251 5.89 5 7 Hancock Holding Co. 209 4.90 2 8 First Bancshares Inc. 207 4.87 6 9 United Bancorp. of Alabama Inc. 182 4.27 9 10 National Commerce Corp. 139 3.27 2 11 Trustmark Corp. 97 2.29 4 12 Bryant Bank 97 2.28 3 13 Citizens' Capital Corp. 97 2.27 3 14 Community Bancshares of Mississippi Inc. 80 1.88 2 15 BancorpSouth Inc. 75 1.75 3 16 IBERIABANK Corp. 68 1.59 1 17 Southwest Banc Shares Inc. 55 1.30 3 18 Synovus Financial Corp. 52 1.23 1 19 Merchants & Marine Bancorp Inc. 31 0.73 2 20 SmartFinancial Inc. 20 0.48 1 Source: SNL Financial Data as of 6/30/17

APPENDIX II: HISTORICAL FINANCIALS

44 Historical Financials Highlights Source : SNL Financial Yearly data as of or for the twelve months ended 12/31 each respective year, Q2 ’17 and Q3 ’17 data for the three months ende d 6/30/17 and 9/30/2017, respectively Note: Southwest data bank level (1) Non - GAAP measure. See reconciliation to closest GAAP measure in Appendix III First Bancshares, Inc. Southwest Banc Shares, Inc. Three months Three months For the Year Ended, ended, For the Year Ended, ended, 2015 2016 Q2 '17 Q3 '17 2015 2016 Q2 '17 Balance Sheet Data: Total Assets $1,145,131 $1,277,367 $1,789,622 $1,772,402 $343,161 $376,529 $398,437 Total Gross Loans 776,489 872,934 1,193,843 $1,202,781 246,034 278,332 278,691 Deposits 916,695 1,039,191 1,550,799 $1,507,991 289,993 327,980 352,361 Tangible Common Equity 70,422 139,019 137,264 $141,655 35,426 34,880 38,433 Income Statement Data: Interest Income $40,202 $44,604 $16,464 $16,708 $14,261 $14,850 $3,970 Interest Expense 3,207 4,315 1,629 1,773 1,567 1,739 466 Net Interest Income 36,995 40,289 14,835 14,935 12,694 13,111 3,504 Provision for Loan Losses 410 625 248 90 396 303 128 Net Interest Income After Provision 36,585 39,664 14,587 14,845 12,298 12,808 3,376 Noninterest Income 7,589 11,247 3,757 3,658 2,713 3,006 843 Noninterest Expense 32,161 36,861 15,070 11,888 11,865 12,083 3,122 Income Before Income Taxes 12,012 14,049 3,274 6,615 3,264 3,936 1,099 Income Tax Expense 3,213 3,930 908 1,901 106 172 49 Consolidated Net income (loss) 8,799 10,119 2,366 4,714 3,158 3,764 1,050 Noncontrolling Interest in net (income) loss of subsidiary -- -- -- -- -- -- -- Net Income Attributable to Common Shareholders 8,456 9,666 2,366 4,714 3,158 3,764 1,050 Selected Operating Ratios: Core ROAA (1) 0.78 % 0.84 % 0.92 % 1.07 % 0.94 % 1.04 % 1.07 % Core ROAE (1) 8.92 8.41 10.31 11.54 9.11 10.17 11.17 Core ROATCE (1) 13.46 11.65 12.27 13.65 9.11 10.17 11.17 Net Interest Margin 3.72 3.71 3.84 3.81 3.99 3.84 3.73 Core Efficiency Ratio (1) 71.1 69.3 65.6 62.7 74.9 72.7 69.6 Per Share Data: Diluted Earnings $1.55 $1.57 $0.26 $0.51 -- -- -- Book Value 16.05 17.19 17.80 18.24 -- -- -- Tangible Book Value 13.10 15.46 15.00 15.48 -- -- -- Asset Quality: Nonperforming Assets / Total Assets 1.19 % 0.98 % 0.74 % 0.81 % 2.72 2.21 % 1.79 % Reserves / Gross Loans 0.87 0.86 0.68 0.68 1.20 1.11 1.18 Reserves / Nonperforming loans 66.6 120.4 94.9 67.0 31.8 37.2 46.1 NPAs / Loans + OREO 1.75 1.43 1.45 1.50 3.77 2.98 2.50 Net Charge Offs (Recoveries) / Average Loans (0.03) (0.02) (0.00) 0.0 0.13 0.07 (0.01) Texas Ratio 17.7 8.7 12.6 -- 21.1 18.8 16.3 Capital Ratios: Tang Common Equity / Tang Assets (1) 6.24 % 11.02 % 7.78 % 8.04 % 10.44 % 9.53 % 9.65 % Leverage Ratio 8.66 11.91 8.43 -- 10.39 10.08 9.70 Common Equity Tier 1 Capital Ratio 8.10 13.81 9.99 -- 14.18 13.07 13.42 Tier 1 Capital Ratio 11.09 14.73 10.70 -- 14.18 13.07 13.42 Total Capital Ratio 11.86 15.46 11.29 -- 15.36 14.16 14.57

Appendix III: Non - GAAP Reconciliation

46 Core Efficiency Ratio Source: SNL Financial and Company Documents FBMS Core Efficiency Ratio Year ended Three months ended, December 31, December 31, March 31, June 30, September 30, (Dollars in thousands) 2015 2016 2017 2017 2017 Operating Expense Total noninterest expense $32,161 $36,862 $16,095 $15,070 $11,888 Pretax non-operating expense 0 (697) (3,598) (2,682) (47) Operating Expense $32,161 $36,165 $12,497 $12,388 $11,841 Operating Revenue Net interest income (TE) $37,949 $41,252 $14,470 $15,140 $15,232 Total non-interest income 7,589 11,247 3,391 3,757 3,658 Pretax non-operating items (319) (307) 0 0 0 Operating Revenue $45,219 $52,192 $17,861 $18,897 $18,890 Core Efficiency Ratio 71.1% 69.3% 70.0% 65.6% 62.7%

47 Tangible Common Equity to Tangible Assets Ratio Source: SNL Financial and Company Documents FBMS Tangible Common Equity to Tangible Assets Year ended, Three months ended, December 31, December 31, December 31, December 31, June 30, September 30, (Dollars in thousands) 2013 2014 2015 2016 2017 2017 Tangible Assets Total assets $940,890 $1,093,768 $1,145,131 $1,277,367 $1,789,622 $1,787,976 Less: Goodwill 10,621 12,276 13,776 13,776 20,241 20,443 Less: Core deposit intangibles 2,677 2,514 2,115 1,732 5,374 4,882 Tangible Assets $927,592 $1,078,978 $1,129,240 $1,261,859 $1,764,007 $1,762,651 Tangible Common Equity Total shareholders' equity $85,108 $96,216 $103,436 $154,527 $162,879 $166,980 Less: Total preferred equity 17,103 17,123 17,123 0 0 0 Total Common equity 68,005 79,093 86,313 154,527 162,879 166,980 Less: Goodwill 10,621 12,276 13,776 13,776 20,241 20,443 Less: Core deposit intangibles 2,677 2,514 2,115 1,732 5,374 4,882 Tangible Common Equity $54,707 $64,303 $70,422 $139,019 $137,264 $141,655 Common Shares Outstanding 5,096,447 5,316,176 5,376,665 8,991,397 9,152,657 9,153,407 Tangible Book Value per Share $10.73 $12.10 $13.10 $15.46 $15.00 $15.48 Tangible Common Equity / Tangible Assets 5.9% 6.0% 6.2% 11.0% 7.8% 8.0%

48 Core Return on Average Assets Ratio Source: SNL Financial and Company Documents FBMS Core Return on Average Assets Year ended, Three months ended, December 31, December 31, March 31, June 30, September 30, (Dollars in thousands) 2015 2016 2017 2017 2017 Net Income Before Extraordinary Items $8,799 $10,119 $1,122 $2,366 $4,714 Non-Core Items: Add: Non-recurring Items 0 239 2,261 1,647 29 Core Net Income $8,799 $10,358 $3,383 $4,013 $4,743 Average Assets $1,122,192 $1,228,959 $1,713,438 $1,751,092 $1,772,402 Core Return on Average Assets 0.78% 0.84% 0.79% 0.92% 1.07%

49 Core Return on Average Tangible Common Equity Ratio Source: SNL Financial and Company Documents FBMS Core Return on Average Tangible Common Equity Year ended, Three months ended, December 31, December 31, March 31, June 30, September 30, (Dollars in thousands) 2015 2016 2017 2017 2017 Net Income Before Extraordinary Items $8,799 $10,119 $1,122 $2,366 $4,714 Non-Core Items: Less: Non-recurring Items 0 239 2,261 1,647 29 Core Net Income $8,799 $10,358 $3,383 $4,013 $4,743 Average Tangible Common Equity $65,381 $88,848 $134,809 $130,789 $139,013 Return on Average Tangible Common Equity 13.5% 11.4% 3.3% 7.2% 13.6% Core Return on Average Tangible Common Equity 13.5% 11.7% 10.0% 12.3% 13.7%

50 Operating Earnings per Share Source: SNL Financial and Company Documents FBMS Operating Earnings Per Share Three months ended, March 31, June 30, September 30, March 31, June 30, September 30, 2016 2016 2016 2017 2017 2017 Diluted Earnings Per Share $0.46 $0.47 $0.45 $0.12 $0.26 $0.51 Effect of acquisition charges, after-tax (0.03) 0.00 0.03 0.25 0.18 0.00 Operating Earnings Per Share $0.43 $0.47 $0.48 $0.37 $0.44 $0.51

51 Southwest Tangible Common Equity Three months ended, June 30, (Dollars in thousands) 2017 Tangible Common Equity Total shareholders' equity $36,120 Less: Total preferred equity 0 Total Common equity 36,120 Less: Goodwill 0 Less: Core deposit intangibles 0 Tangible Common Equity $36,120 Southwest Tangible Common Equity Source: SNL Financial