Attached files
| file | filename |
|---|---|
| 8-K - CLEARWATER PAPER CORPORATION 8-K - Clearwater Paper Corp | a51701782.htm |
| EX-99.1 - EXHIBIT 99.1 - Clearwater Paper Corp | a51701782ex99_1.htm |
Exhibit 99.2
CLEARWATER PAPER CORPORATIONTHIRD QUARTER 2017SUPPLEMENTAL INFORMATION 10/19/17 LINDA MASSMANPRESIDENT, CHIEF EXECUTIVE OFFICER AND DIRECTORJOHN HERTZSENIOR VICE PRESIDENT FINANCE AND CHIEF FINANCIAL OFFICER
FORWARD-LOOKING STATEMENTS This presentation of supplemental information contains, in addition to historical information, certain forward-looking statements within the meaning of the Private Securities Litigation Reform Act of 1995, including statements regarding outlook for Q4; the costs, timing and benefits associated with strategic capital investments and operational improvements; financial models; estimated Q4 net earnings, EBITDA, and adjusted EBITDA; and estimated Q4 2017 operating income, adjusted operating income, adjusted net earnings, net earnings per diluted common share, adjusted net earnings per diluted common share, net sales and adjusted operating margin, product volumes shipped, product pricing and sales mix, cost and timing of major maintenance and repairs, pulp costs, energy costs, and productivity gains. These forward-looking statements are based on management’s current expectations, estimates, assumptions and projections that are subject to change. Our actual results of operations may differ materially from those expressed or implied by the forward-looking statements contained in this presentation. Important factors that could cause or contribute to such differences include the risks and uncertainties described from time to time in the company's public filings with the Securities and Exchange Commission, as well as the following: our ability to execute on our growth and expansion strategies; manufacturing or operating disruptions, including IT system and IT system implementation failures, equipment malfunction and damage to our manufacturing facilities; competitive pricing pressures for our products, including as a result of increased capacity as additional manufacturing facilities are operated by our competitors;the loss of or changes in prices in regards to a significant customer; changes in the U.S. and international economies and in general economic conditions in the regions and industries in which we operate; our ability to realize the expected benefits of our Manchester Industries acquisition;changes in customer product preferences and competitors' product offerings;changes in transportation costs and disruptions in transportation services; changes in the cost and availability of wood fiber and wood pulp; changes in costs for and availability of packaging supplies, chemicals, energy and maintenance and repairs; cyber-security risks;reliance on a limited number of third-party suppliers for raw materials; labor disruptions; unanticipated construction delays involving our planned new tissue manufacturing operations in Shelby, NC; environmental liabilities or expenditures; cyclical industry conditions; changes in expenses and required contributions associated with our pension plans; our inability to service our debt obligations;restrictions on our business from debt covenants and terms; andchanges in laws, regulations or industry standards affecting our business.Forward-looking statements contained in this presentation present management’s views only as of the date of this presentation. We undertake no obligation to publicly update forward-looking statements, whether as a result of new information, future events or otherwise. 2
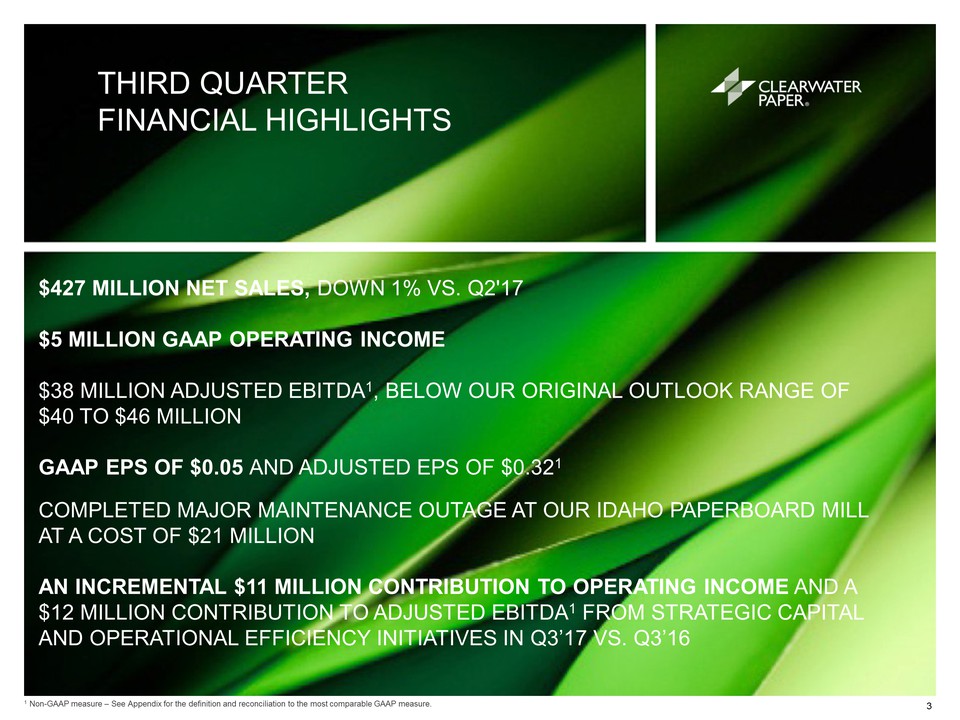
THIRD QUARTERFINANCIAL HIGHLIGHTS $427 MILLION NET SALES, DOWN 1% VS. Q2'17 $5 MILLION GAAP OPERATING INCOME$38 MILLION ADJUSTED EBITDA1, BELOW OUR ORIGINAL OUTLOOK RANGE OF $40 TO $46 MILLION GAAP EPS OF $0.05 AND ADJUSTED EPS OF $0.321COMPLETED MAJOR MAINTENANCE OUTAGE AT OUR IDAHO PAPERBOARD MILL AT A COST OF $21 MILLIONAN INCREMENTAL $11 MILLION CONTRIBUTION TO OPERATING INCOME AND A $12 MILLION CONTRIBUTION TO ADJUSTED EBITDA1 FROM STRATEGIC CAPITAL AND OPERATIONAL EFFICIENCY INITIATIVES IN Q3’17 VS. Q3’16 1 Non-GAAP measure – See Appendix for the definition and reconciliation to the most comparable GAAP measure. 3
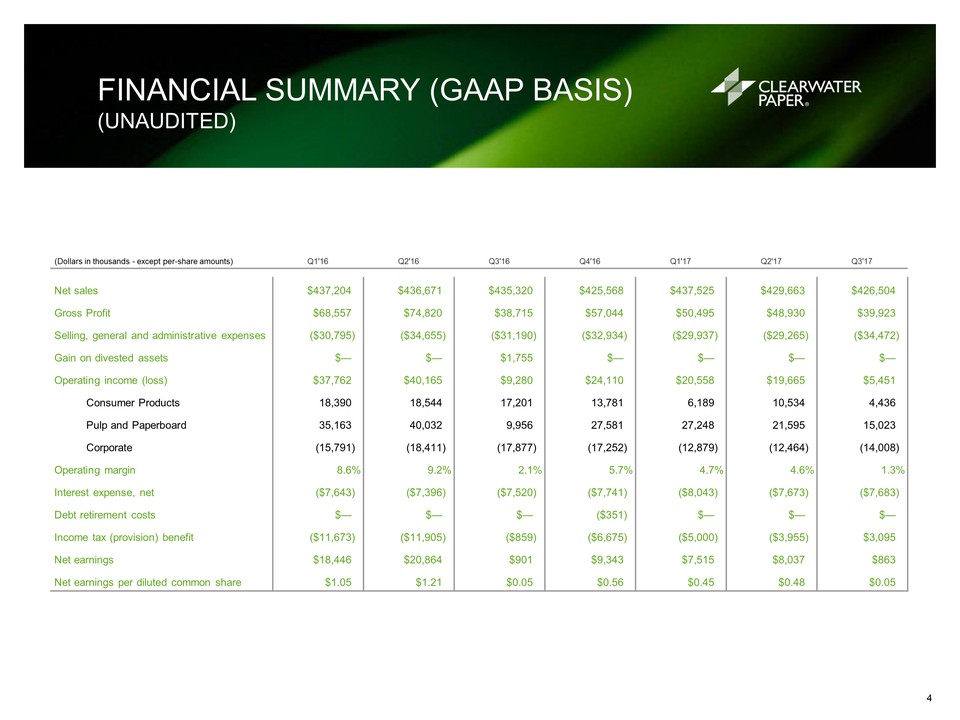
FINANCIAL SUMMARY (GAAP BASIS)(UNAUDITED) (Dollars in thousands - except per-share amounts) Q1'16 Q2'16 Q3'16 Q4'16 Q1'17 Q2'17 Q3'17 Net sales $437,204 $436,671 $435,320 $425,568 $437,525 $429,663 $426,504 Gross Profit $68,557 $74,820 $38,715 $57,044 $50,495 $48,930 $39,923 Selling, general and administrative expenses ($30,795 ) ($34,655 ) ($31,190 ) ($32,934 ) ($29,937 ) ($29,265 ) ($34,472 ) Gain on divested assets $— $— $1,755 $— $— $— $— Operating income (loss) $37,762 $40,165 $9,280 $24,110 $20,558 $19,665 $5,451 Consumer Products 18,390 18,544 17,201 13,781 6,189 10,534 4,436 Pulp and Paperboard 35,163 40,032 9,956 27,581 27,248 21,595 15,023 Corporate (15,791 ) (18,411 ) (17,877 ) (17,252 ) (12,879 ) (12,464 ) (14,008 ) Operating margin 8.6 % 9.2 % 2.1 % 5.7 % 4.7 % 4.6 % 1.3 % Interest expense, net ($7,643 ) ($7,396 ) ($7,520 ) ($7,741 ) ($8,043 ) ($7,673 ) ($7,683 ) Debt retirement costs $— $— $— ($351 ) $— $— $— Income tax (provision) benefit ($11,673 ) ($11,905 ) ($859 ) ($6,675 ) ($5,000 ) ($3,955 ) $3,095 Net earnings $18,446 $20,864 $901 $9,343 $7,515 $8,037 $863 Net earnings per diluted common share $1.05 $1.21 $0.05 $0.56 $0.45 $0.48 $0.05 4
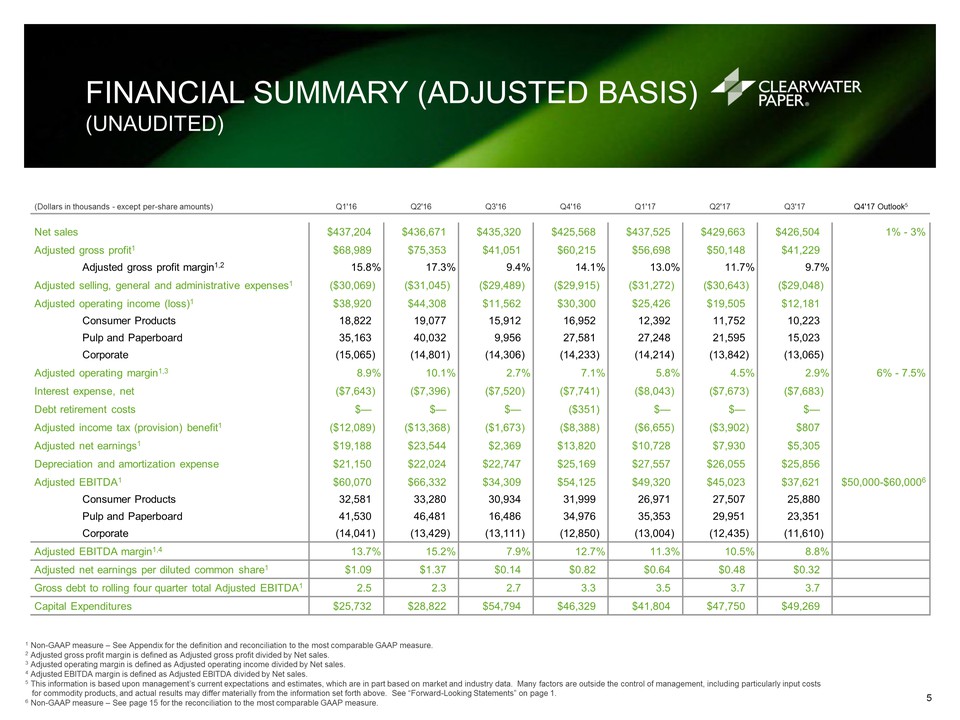
FINANCIAL SUMMARY (ADJUSTED BASIS)(UNAUDITED) 1 Non-GAAP measure – See Appendix for the definition and reconciliation to the most comparable GAAP measure.2 Adjusted gross profit margin is defined as Adjusted gross profit divided by Net sales.3 Adjusted operating margin is defined as Adjusted operating income divided by Net sales.4 Adjusted EBITDA margin is defined as Adjusted EBITDA divided by Net sales.5 This information is based upon management’s current expectations and estimates, which are in part based on market and industry data. Many factors are outside the control of management, including particularly input costs for commodity products, and actual results may differ materially from the information set forth above. See “Forward-Looking Statements” on page 1.6 Non-GAAP measure – See page 15 for the reconciliation to the most comparable GAAP measure... (Dollars in thousands - except per-share amounts) Q1'16 Q2'16 Q3'16 Q4'16 Q1'17 Q2'17 Q3'17 Q4'17 Outlook5 Net sales $437,204 $436,671 $435,320 $425,568 $437,525 $429,663 $426,504 1% - 3% Adjusted gross profit1 $68,989 $75,353 $41,051 $60,215 $56,698 $50,148 $41,229 Adjusted gross profit margin1,2 15.8 % 17.3 % 9.4 % 14.1 % 13.0 % 11.7 % 9.7 % Adjusted selling, general and administrative expenses1 ($30,069 ) ($31,045 ) ($29,489 ) ($29,915 ) ($31,272 ) ($30,643 ) ($29,048 ) Adjusted operating income (loss)1 $38,920 $44,308 $11,562 $30,300 $25,426 $19,505 $12,181 Consumer Products 18,822 19,077 15,912 16,952 12,392 11,752 10,223 Pulp and Paperboard 35,163 40,032 9,956 27,581 27,248 21,595 15,023 Corporate (15,065 ) (14,801 ) (14,306 ) (14,233 ) (14,214 ) (13,842 ) (13,065 ) Adjusted operating margin1,3 8.9 % 10.1 % 2.7 % 7.1 % 5.8 % 4.5 % 2.9 % 6% - 7.5% Interest expense, net ($7,643 ) ($7,396 ) ($7,520 ) ($7,741 ) ($8,043 ) ($7,673 ) ($7,683 ) Debt retirement costs $— $— $— ($351 ) $— $— $— Adjusted income tax (provision) benefit1 ($12,089 ) ($13,368 ) ($1,673 ) ($8,388 ) ($6,655 ) ($3,902 ) $807 Adjusted net earnings1 $19,188 $23,544 $2,369 $13,820 $10,728 $7,930 $5,305 Depreciation and amortization expense $21,150 $22,024 $22,747 $25,169 $27,557 $26,055 $25,856 Adjusted EBITDA1 $60,070 $66,332 $34,309 $54,125 $49,320 $45,023 $37,621 $50,000-$60,0006 Consumer Products 32,581 33,280 30,934 31,999 26,971 27,507 25,880 Pulp and Paperboard 41,530 46,481 16,486 34,976 35,353 29,951 23,351 Corporate (14,041 ) (13,429 ) (13,111 ) (12,850 ) (13,004 ) (12,435 ) (11,610 ) Adjusted EBITDA margin1,4 13.7 % 15.2 % 7.9 % 12.7 % 11.3 % 10.5 % 8.8 % Adjusted net earnings per diluted common share1 $1.09 $1.37 $0.14 $0.82 $0.64 $0.48 $0.32 Gross debt to rolling four quarter total Adjusted EBITDA1 2.5 2.3 2.7 3.3 3.5 3.7 3.7 Capital Expenditures $25,732 $28,822 $54,794 $46,329 $41,804 $47,750 $49,269 5
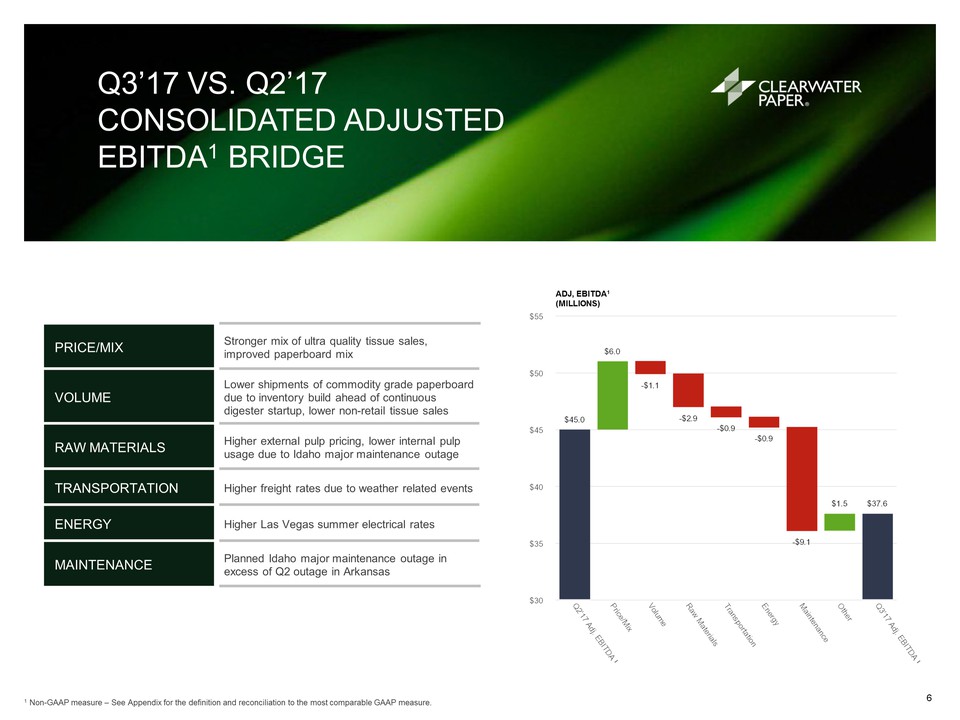
Q3’17 VS. Q2’17CONSOLIDATED ADJUSTED EBITDA1 BRIDGE 1 Non-GAAP measure – See Appendix for the definition and reconciliation to the most comparable GAAP measure. PRICE/MIX Stronger mix of ultra quality tissue sales, improved paperboard mix VOLUME Lower shipments of commodity grade paperboard due to inventory build ahead of continuous digester startup, lower non-retail tissue sales RAW MATERIALS Higher external pulp pricing, lower internal pulp usage due to Idaho major maintenance outage TRANSPORTATION Higher freight rates due to weather related events ENERGY Higher Las Vegas summer electrical rates MAINTENANCE Planned Idaho major maintenance outage in excess of Q2 outage in Arkansas ADJ, EBITDA1(MILLIONS) 1 1 6
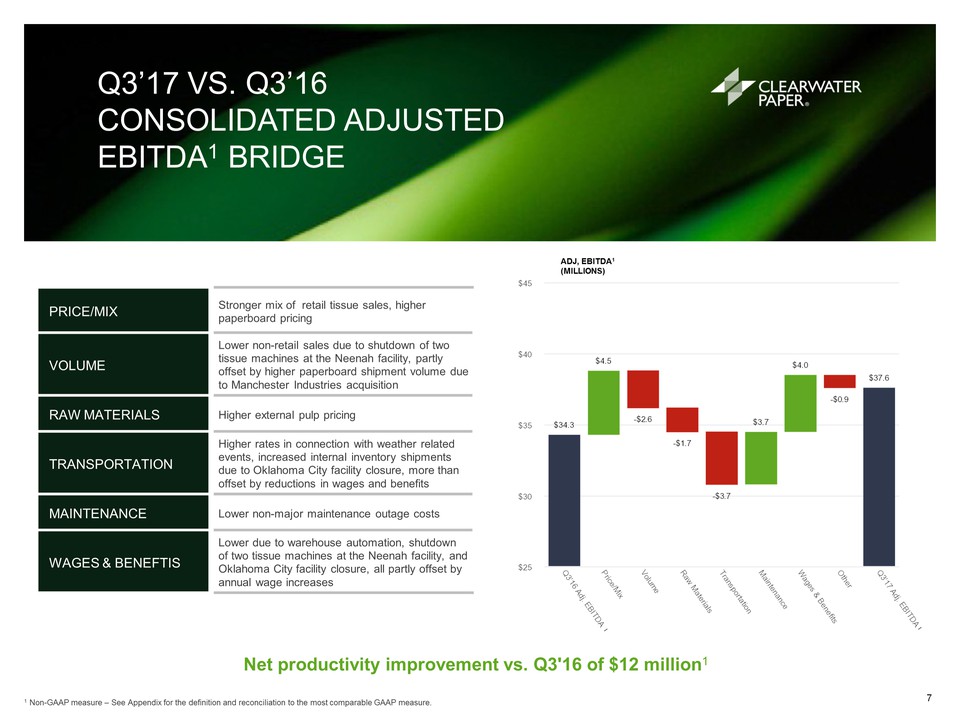
Q3’17 VS. Q3’16CONSOLIDATED ADJUSTED EBITDA1 BRIDGE 1 Non-GAAP measure – See Appendix for the definition and reconciliation to the most comparable GAAP measure. PRICE/MIX Stronger mix of retail tissue sales, higher paperboard pricing VOLUME Lower non-retail sales due to shutdown of two tissue machines at the Neenah facility, partly offset by higher paperboard shipment volume due to Manchester Industries acquisition RAW MATERIALS Higher external pulp pricing TRANSPORTATION Higher rates in connection with weather related events, increased internal inventory shipments due to Oklahoma City facility closure, more than offset by reductions in wages and benefits MAINTENANCE Lower non-major maintenance outage costs WAGES & BENEFTIS Lower due to warehouse automation, shutdown of two tissue machines at the Neenah facility, and Oklahoma City facility closure, all partly offset by annual wage increases ADJ, EBITDA1(MILLIONS) 1 1 Net productivity improvement vs. Q3'16 of $12 million1 7
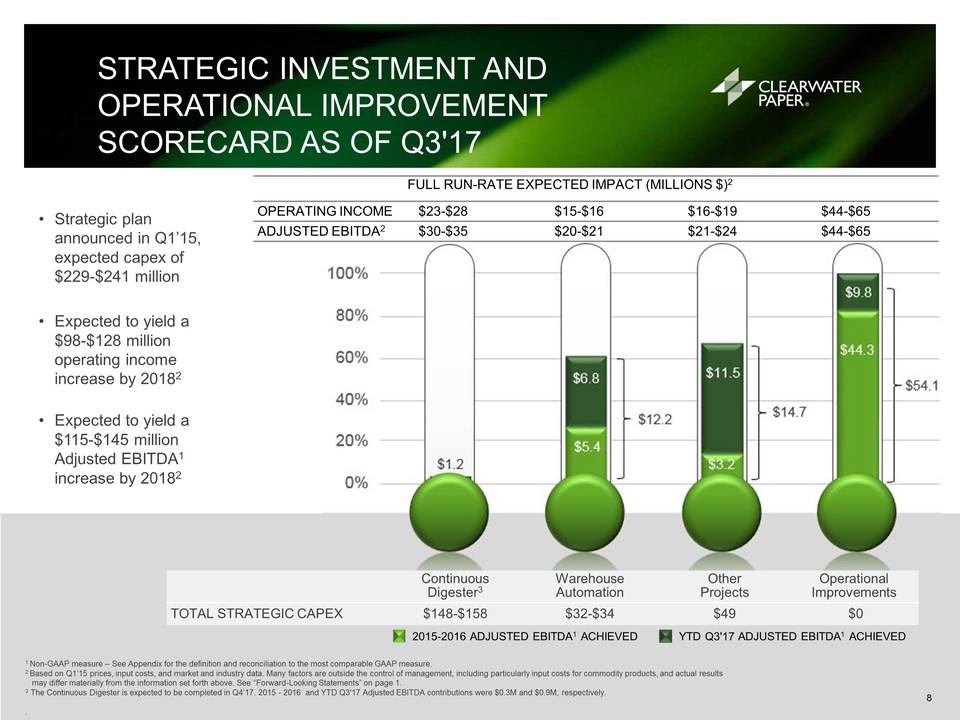
1 Non-GAAP measure – See Appendix for the definition and reconciliation to the most comparable GAAP measure.2 Based on Q1’15 prices, input costs, and market and industry data. Many factors are outside the control of management, including particularly input costs for commodity products, and actual results may differ materially from the information set forth above. See “Forward-Looking Statements” on page 1.3 The Continuous Digester is expected to be completed in Q4’17. 2015 - 2016 and YTD Q3'17 Adjusted EBITDA contributions were $0.3M and $0.9M, respectively.. STRATEGIC INVESTMENT AND OPERATIONAL IMPROVEMENT SCORECARD AS OF Q3'17 Strategic plan announced in Q1’15, expected capex of $229-$241 million Expected to yield a $98-$128 million operating income increase by 20182 Expected to yield a $115-$145 million Adjusted EBITDA1 increase by 20182 Continuous Digester3 Warehouse Automation Other Projects Operational Improvements TOTAL STRATEGIC CAPEX $148-$158 $32-$34 $49 $0 FULL RUN-RATE EXPECTED IMPACT (MILLIONS $)2 OPERATING INCOME $23-$28 $15-$16 $16-$19 $44-$65 ADJUSTED EBITDA2 $30-$35 $20-$21 $21-$24 $44-$65 2015-2016 ADJUSTED EBITDA1 ACHIEVED YTD Q3'17 ADJUSTED EBITDA1 ACHIEVED 8
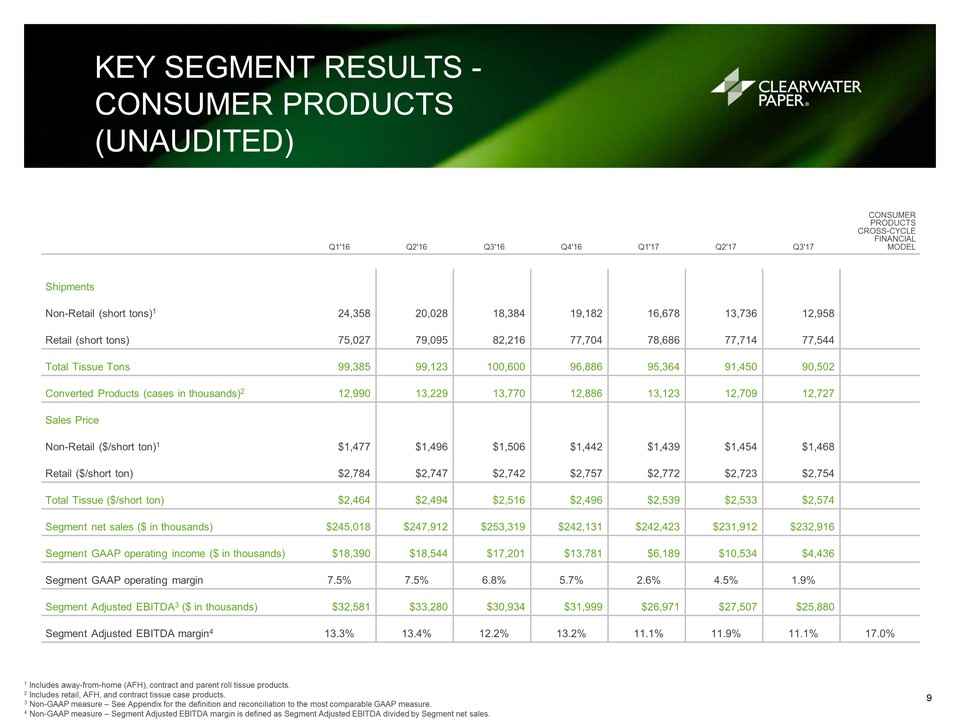
1 Includes away-from-home (AFH), contract and parent roll tissue products. 2 Includes retail, AFH, and contract tissue case products. 3 Non-GAAP measure – See Appendix for the definition and reconciliation to the most comparable GAAP measure. 4 Non-GAAP measure – Segment Adjusted EBITDA margin is defined as Segment Adjusted EBITDA divided by Segment net sales. KEY SEGMENT RESULTS -CONSUMER PRODUCTS(UNAUDITED) Q1'16 Q2'16 Q3'16 Q4'16 Q1'17 Q2'17 Q3'17 CONSUMER PRODUCTS CROSS-CYCLE FINANCIAL MODEL Shipments Non-Retail (short tons)1 24,358 20,028 18,384 19,182 16,678 13,736 12,958 Retail (short tons) 75,027 79,095 82,216 77,704 78,686 77,714 77,544 Total Tissue Tons 99,385 99,123 100,600 96,886 95,364 91,450 90,502 Converted Products (cases in thousands)2 12,990 13,229 13,770 12,886 13,123 12,709 12,727 Sales Price Non-Retail ($/short ton)1 $1,477 $1,496 $1,506 $1,442 $1,439 $1,454 $1,468 Retail ($/short ton) $2,784 $2,747 $2,742 $2,757 $2,772 $2,723 $2,754 Total Tissue ($/short ton) $2,464 $2,494 $2,516 $2,496 $2,539 $2,533 $2,574 Segment net sales ($ in thousands) $245,018 $247,912 $253,319 $242,131 $242,423 $231,912 $232,916 Segment GAAP operating income ($ in thousands) $18,390 $18,544 $17,201 $13,781 $6,189 $10,534 $4,436 Segment GAAP operating margin 7.5% 7.5% 6.8% 5.7% 2.6% 4.5% 1.9% Segment Adjusted EBITDA3 ($ in thousands) $32,581 $33,280 $30,934 $31,999 $26,971 $27,507 $25,880 Segment Adjusted EBITDA margin4 13.3% 13.4% 12.2% 13.2% 11.1% 11.9% 11.1% 17.0% 9
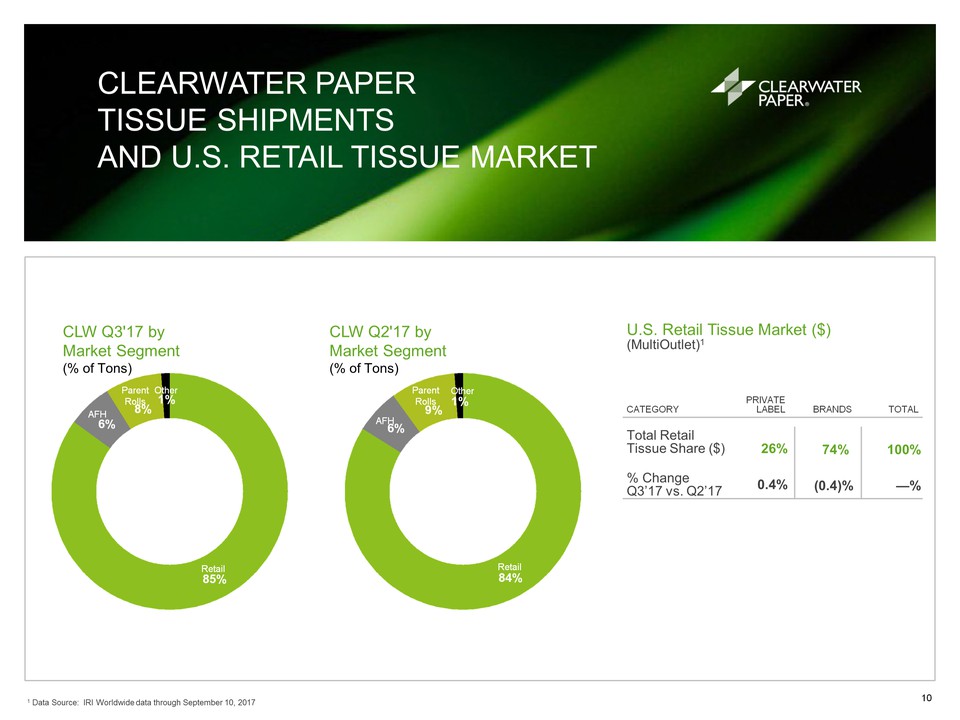
CLEARWATER PAPERTISSUE SHIPMENTSAND U.S. RETAIL TISSUE MARKET U.S. Retail Tissue Market ($) (MultiOutlet)1 CATEGORY PRIVATELABEL BRANDS TOTAL Total RetailTissue Share ($) 26 % 74 % 100 % % ChangeQ3’17 vs. Q2’17 0.4 % (0.4 )% — % 1 Data Source: IRI Worldwide data through September 10, 2017 CLW Q3'17 by Market Segment(% of Tons) CLW Q2'17 by Market Segment(% of Tons) Other Other Parent Rolls Parent Rolls AFH AFH Retail Retail 10
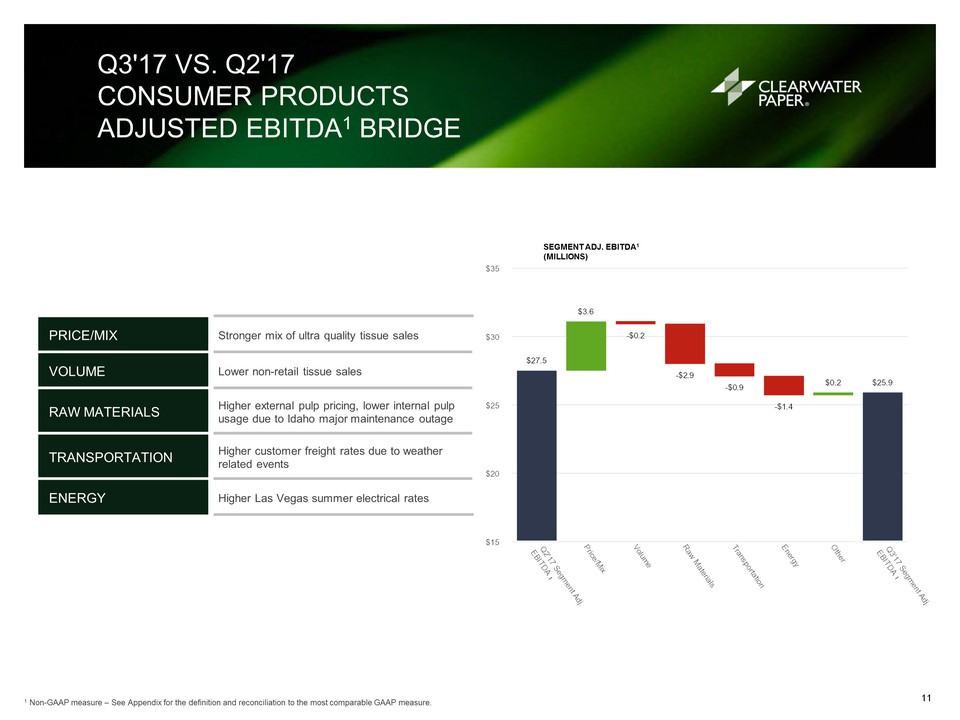
PRICE/MIX Stronger mix of ultra quality tissue sales VOLUME Lower non-retail tissue sales RAW MATERIALS Higher external pulp pricing, lower internal pulp usage due to Idaho major maintenance outage TRANSPORTATION Higher customer freight rates due to weather related events ENERGY Higher Las Vegas summer electrical rates Q3'17 VS. Q2'17CONSUMER PRODUCTS ADJUSTED EBITDA1 BRIDGE 1 Non-GAAP measure – See Appendix for the definition and reconciliation to the most comparable GAAP measure. SEGMENT ADJ. EBITDA1(MILLIONS) 1 1 11
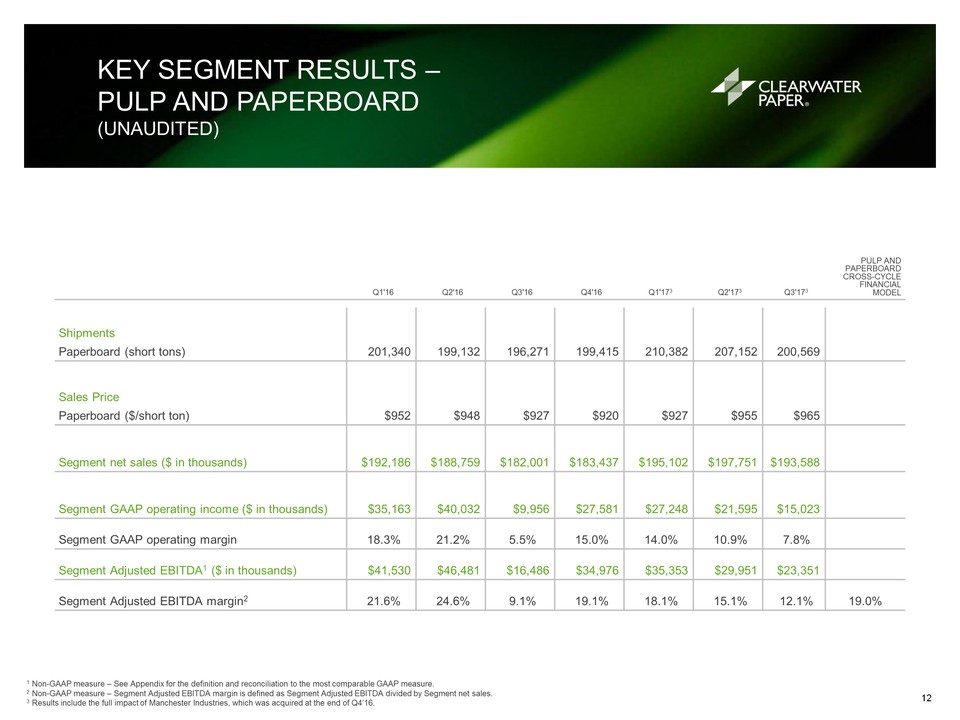
KEY SEGMENT RESULTS – PULP AND PAPERBOARD(UNAUDITED) 1 Non-GAAP measure – See Appendix for the definition and reconciliation to the most comparable GAAP measure.2 Non-GAAP measure – Segment Adjusted EBITDA margin is defined as Segment Adjusted EBITDA divided by Segment net sales.3 Results include the full impact of Manchester Industries, which was acquired at the end of Q4’16. Q1'16 Q2'16 Q3'16 Q4'16 Q1'173 Q2'173 Q3'173 PULP ANDPAPERBOARDCROSS-CYCLEFINANCIAL MODEL Shipments Paperboard (short tons) 201,340 199,132 196,271 199,415 210,382 207,152 200,569 Sales Price Paperboard ($/short ton) $952 $948 $927 $920 $927 $955 $965 Segment net sales ($ in thousands) $192,186 $188,759 $182,001 $183,437 $195,102 $197,751 $193,588 Segment GAAP operating income ($ in thousands) $35,163 $40,032 $9,956 $27,581 $27,248 $21,595 $15,023 Segment GAAP operating margin 18.3% 21.2% 5.5% 15.0% 14.0% 10.9% 7.8% Segment Adjusted EBITDA1 ($ in thousands) $41,530 $46,481 $16,486 $34,976 $35,353 $29,951 $23,351 Segment Adjusted EBITDA margin2 21.6% 24.6% 9.1% 19.1% 18.1% 15.1% 12.1% 19.0% 12
CLEARWATER PAPERPAPERBOARD SHIPMENTS ANDU.S. PAPERBOARD MARKET U.S. Paperboard Production3 CATEGORY CLEARWATER PAPER OTHER Total Domestic SBS1 Market Share 14 % 86 % Folding 19 % 81 % Food Service2 14 % 86 % Liquid Packaging 5 % 95 % 1 Solid Bleached Sulfate.2 Food Service includes cup, plate, dish and tray products.3 Data Source: American Forest and Paper Association Solid Bleached Domestic Production – September YTD 2017. CLW Q3'17 by Market Segment(% of Tons) CLW Q2'17 by Market Segment(% of Tons) Folding Folding Liquid Pkg Liquid Pkg Food Service Food Service 13
PRICE/MIX Improved mix of paperboard sales VOLUME Lower shipments of commodity grade paperboard due to inventory build ahead of continuous digester startup ENERGY Lower natural gas prices MAINTENANCE Planned Idaho major maintenance outage in excess of Q2 outage in Arkansas Q3’17 vs. Q2'17 PULP AND PAPERBOARD ADJUSTED EBITDA1 BRIDGE 1 Non-GAAP measure – See Appendix for the definition and reconciliation to the most comparable GAAP measure. SEGMENT ADJ. EBITDA1(MILLIONS) 1 1 14
CLEARWATER PAPER CROSS-CYCLE FINANCIAL MODEL 1 Non-GAAP measure – See Appendix for the definition and reconciliation to the most comparable GAAP measure. (Dollars in thousands) Q1'16 Q2'16 Q3'16 Q4'16 Q1'17 Q2'17 Q3'17 CLEARWATER PAPER CROSS-CYCLE FINANCIAL MODEL Net sales 100 % 100 % 100 % 100 % 100 % 100 % 100 % 100 % Adjusted gross profit margin1 15.8 % 17.3 % 9.4 % 14.1 % 13.0 % 11.7 % 9.7 % 17.0 % Adjusted SG&A expenses1 as % of net sales (6.9 %) (7.1 %) (6.8 %) (7.0 %) (7.1 %) (7.1 %) (6.8 %) (6.0 %) Adjusted operating margin1 8.9 % 10.1 % 2.7 % 7.1 % 5.8 % 4.5 % 2.9 % 11.0 % Adjusted net earnings1 as % of net sales 4.4 % 5.4 % 0.5 % 3.2 % 2.5 % 1.8 % 1.2 % 5.0 % Adjusted EBITDA margin1 13.7 % 15.2 % 7.9 % 12.7 % 11.3 % 10.5 % 8.8 % 15.0 % 15
Q4’17 OUTLOOK1RECONCILIATION OF NON-GAAP FINANCIAL MEASURES (UNAUDITED) 1 This information is based upon management’s current expectations and estimates, which are in part based on market and industry data. Many factors are outside the control of management, including particularly input costs for commodity products, and actual results may differ materially from the information set forth above. See “Forward-Looking Statements” on page 1.2 EBITDA is a non-GAAP measure that management uses as a supplemental performance measure. The most directly comparable GAAP measure is net earnings (loss). EBITDA is net earnings adjusted for net interest expense (including debt retirement costs), income taxes, and depreciation and amortization. It should not be considered as an alternative to net earnings computed under GAAP.3 Adjusted EBITDA excludes the impact of the items listed that we do not believe are indicative of our core operating performance. OUTLOOK THREE MONTHS ENDINGDECEMBER 31, 2017 RANGE OF ESTIMATE (Dollars in thousands) FROM TO Earnings before interest, income taxes, and depreciation & amortization (EBITDA)2: GAAP net earnings $8,500 $14,000 Interest expense, net 7,300 8,200 Income tax provision 4,400 7,200 Depreciation and amortization expense 24,900 25,700 EBITDA2 $45,100 $55,100 Directors' equity-based compensation expense 300 300 Costs associated with Long Island facility closure 200 200 Costs associated with Oklahoma City facility closure 3,500 3,500 Reorganization related expenses 900 900 Adjusted EBITDA3 $50,000 $60,000 16
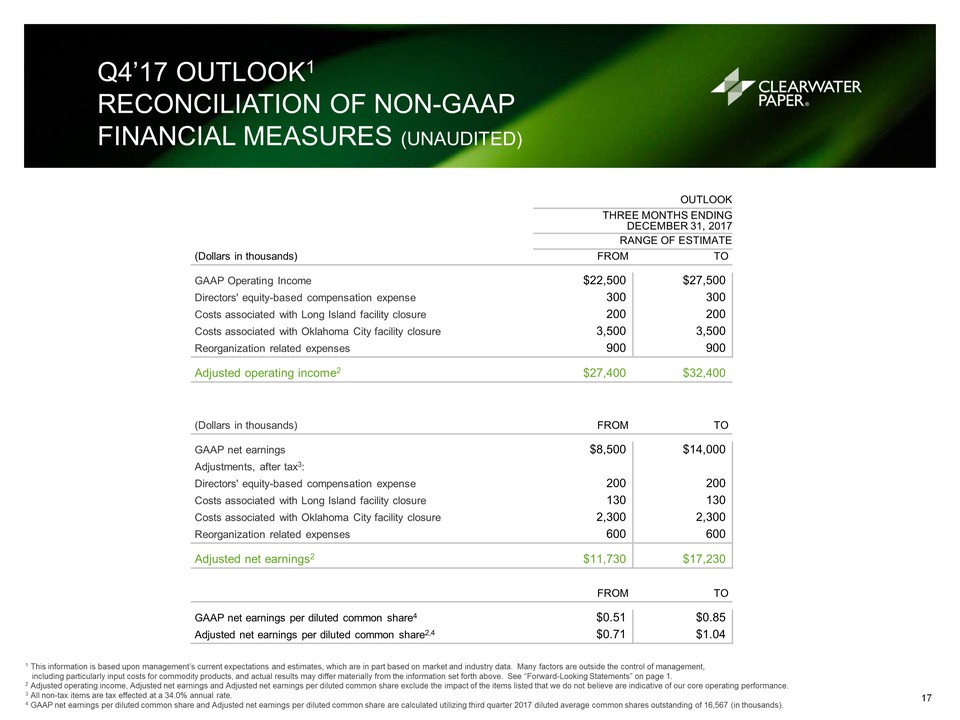
Q4’17 OUTLOOK1RECONCILIATION OF NON-GAAPFINANCIAL MEASURES (UNAUDITED) 1 This information is based upon management’s current expectations and estimates, which are in part based on market and industry data. Many factors are outside the control of management, including particularly input costs for commodity products, and actual results may differ materially from the information set forth above. See “Forward-Looking Statements” on page 1.2 Adjusted operating income, Adjusted net earnings and Adjusted net earnings per diluted common share exclude the impact of the items listed that we do not believe are indicative of our core operating performance.3 All non-tax items are tax effected at a 34.0% annual rate.4 GAAP net earnings per diluted common share and Adjusted net earnings per diluted common share are calculated utilizing third quarter 2017 diluted average common shares outstanding of 16,567 (in thousands). OUTLOOK THREE MONTHS ENDINGDECEMBER 31, 2017 RANGE OF ESTIMATE (Dollars in thousands) FROM TO GAAP Operating Income $22,500 $27,500 Directors' equity-based compensation expense 300 300 Costs associated with Long Island facility closure 200 200 Costs associated with Oklahoma City facility closure 3,500 3,500 Reorganization related expenses 900 900 Adjusted operating income2 $27,400 $32,400 (Dollars in thousands) FROM TO GAAP net earnings $8,500 $14,000 Adjustments, after tax3: Directors' equity-based compensation expense 200 200 Costs associated with Long Island facility closure 130 130 Costs associated with Oklahoma City facility closure 2,300 2,300 Reorganization related expenses 600 600 Adjusted net earnings2 $11,730 $17,230 FROM TO GAAP net earnings per diluted common share4 $0.51 $0.85 Adjusted net earnings per diluted common share2,4 $0.71 $1.04 17
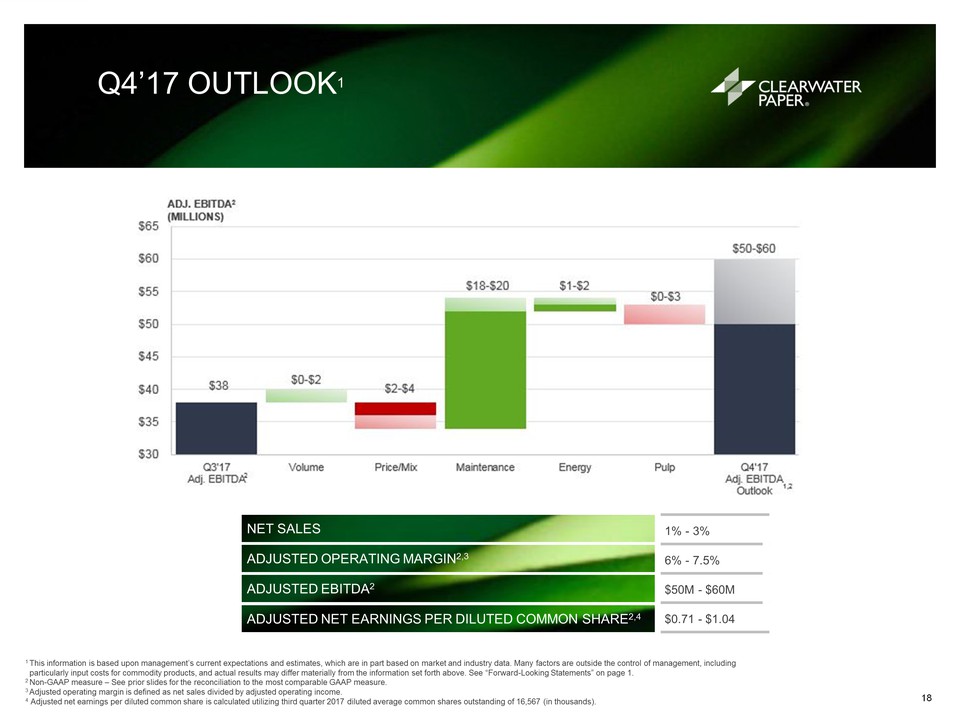
Q4’17 OUTLOOK1 1% - 3% 6% - 7.5% $50M - $60M $0.71 - $1.04 NET SALES ADJUSTED OPERATING MARGIN2,3 ADJUSTED EBITDA2 ADJUSTED NET EARNINGS PER DILUTED COMMON SHARE2,4 1 This information is based upon management’s current expectations and estimates, which are in part based on market and industry data. Many factors are outside the control of management, including particularly input costs for commodity products, and actual results may differ materially from the information set forth above. See “Forward-Looking Statements” on page 1.2 Non-GAAP measure – See prior slides for the reconciliation to the most comparable GAAP measure.3 Adjusted operating margin is defined as net sales divided by adjusted operating income.4 Adjusted net earnings per diluted common share is calculated utilizing third quarter 2017 diluted average common shares outstanding of 16,567 (in thousands). 18
APPENDIX 19
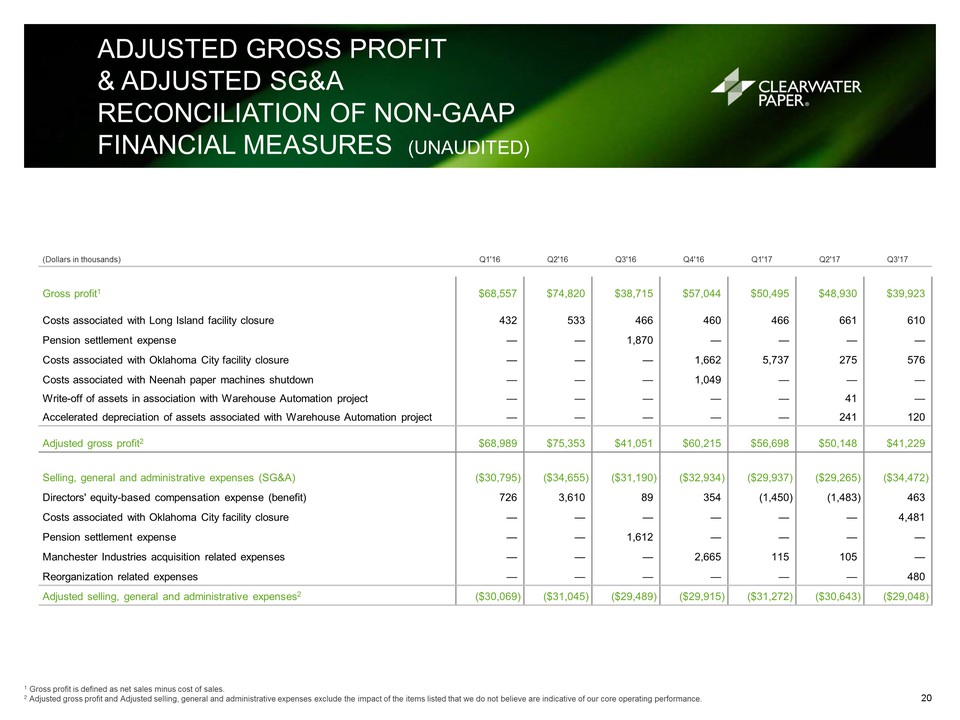
ADJUSTED GROSS PROFIT& ADJUSTED SG&ARECONCILIATION OF NON-GAAPFINANCIAL MEASURES (UNAUDITED) 1 Gross profit is defined as net sales minus cost of sales.2 Adjusted gross profit and Adjusted selling, general and administrative expenses exclude the impact of the items listed that we do not believe are indicative of our core operating performance. (Dollars in thousands) Q1'16 Q2'16 Q3'16 Q4'16 Q1'17 Q2'17 Q3'17 Gross profit1 $68,557 $74,820 $38,715 $57,044 $50,495 $48,930 $39,923 Costs associated with Long Island facility closure 432 533 466 460 466 661 610 Pension settlement expense — — 1,870 — — — — Costs associated with Oklahoma City facility closure — — — 1,662 5,737 275 576 Costs associated with Neenah paper machines shutdown — — — 1,049 — — — Write-off of assets in association with Warehouse Automation project — — — — — 41 — Accelerated depreciation of assets associated with Warehouse Automation project — — — — — 241 120 Adjusted gross profit2 $68,989 $75,353 $41,051 $60,215 $56,698 $50,148 $41,229 Selling, general and administrative expenses (SG&A) ($30,795 ) ($34,655 ) ($31,190 ) ($32,934 ) ($29,937 ) ($29,265 ) ($34,472 ) Directors' equity-based compensation expense (benefit) 726 3,610 89 354 (1,450 ) (1,483 ) 463 Costs associated with Oklahoma City facility closure — — — — — — 4,481 Pension settlement expense — — 1,612 — — — — Manchester Industries acquisition related expenses — — — 2,665 115 105 — Reorganization related expenses — — — — — — 480 Adjusted selling, general and administrative expenses2 ($30,069 ) ($31,045 ) ($29,489 ) ($29,915 ) ($31,272 ) ($30,643 ) ($29,048 ) 20
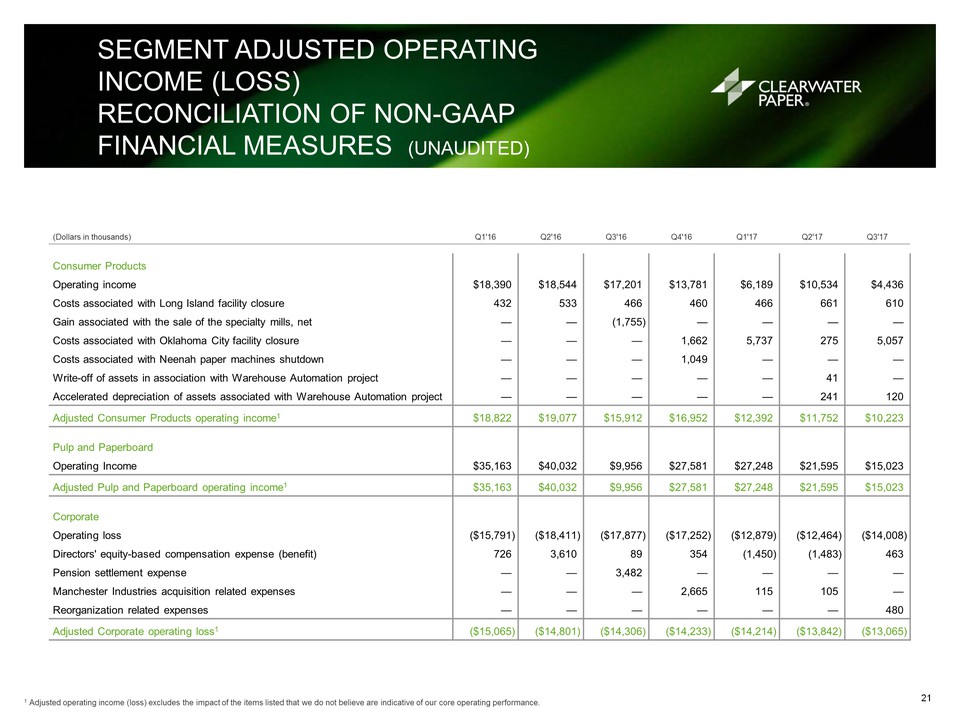
SEGMENT ADJUSTED OPERATING INCOME (LOSS)RECONCILIATION OF NON-GAAP FINANCIAL MEASURES (UNAUDITED) 1 Adjusted operating income (loss) excludes the impact of the items listed that we do not believe are indicative of our core operating performance. (Dollars in thousands) Q1'16 Q2'16 Q3'16 Q4'16 Q1'17 Q2'17 Q3'17 Consumer Products Operating income $18,390 $18,544 $17,201 $13,781 $6,189 $10,534 $4,436 Costs associated with Long Island facility closure 432 533 466 460 466 661 610 Gain associated with the sale of the specialty mills, net — — (1,755 ) — — — — Costs associated with Oklahoma City facility closure — — — 1,662 5,737 275 5,057 Costs associated with Neenah paper machines shutdown — — — 1,049 — — — Write-off of assets in association with Warehouse Automation project — — — — — 41 — Accelerated depreciation of assets associated with Warehouse Automation project — — — — — 241 120 Adjusted Consumer Products operating income1 $18,822 $19,077 $15,912 $16,952 $12,392 $11,752 $10,223 Pulp and Paperboard Operating Income $35,163 $40,032 $9,956 $27,581 $27,248 $21,595 $15,023 Adjusted Pulp and Paperboard operating income1 $35,163 $40,032 $9,956 $27,581 $27,248 $21,595 $15,023 Corporate Operating loss ($15,791 ) ($18,411 ) ($17,877 ) ($17,252 ) ($12,879 ) ($12,464 ) ($14,008 ) Directors' equity-based compensation expense (benefit) 726 3,610 89 354 (1,450 ) (1,483 ) 463 Pension settlement expense — — 3,482 — — — — Manchester Industries acquisition related expenses — — — 2,665 115 105 — Reorganization related expenses — — — — — — 480 Adjusted Corporate operating loss1 ($15,065 ) ($14,801 ) ($14,306 ) ($14,233 ) ($14,214 ) ($13,842 ) ($13,065 ) 21
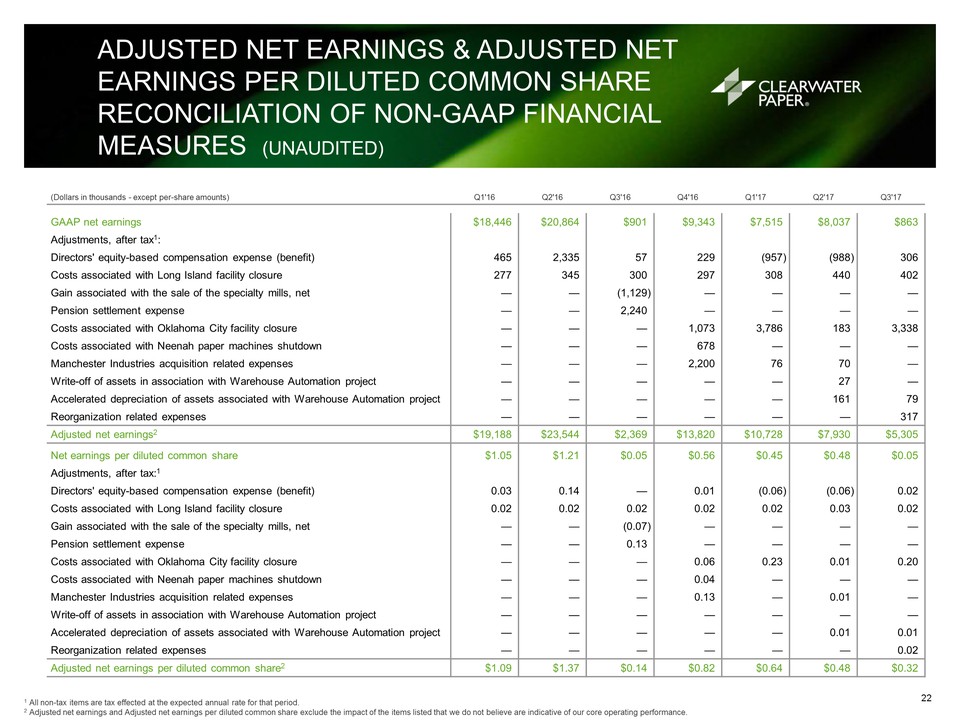
ADJUSTED NET EARNINGS & ADJUSTED NET EARNINGS PER DILUTED COMMON SHARE RECONCILIATION OF NON-GAAP FINANCIAL MEASURES (UNAUDITED) 1 All non-tax items are tax effected at the expected annual rate for that period.2 Adjusted net earnings and Adjusted net earnings per diluted common share exclude the impact of the items listed that we do not believe are indicative of our core operating performance. (Dollars in thousands - except per-share amounts) Q1'16 Q2'16 Q3'16 Q4'16 Q1'17 Q2'17 Q3'17 GAAP net earnings $18,446 $20,864 $901 $9,343 $7,515 $8,037 $863 Adjustments, after tax1: Directors' equity-based compensation expense (benefit) 465 2,335 57 229 (957 ) (988 ) 306 Costs associated with Long Island facility closure 277 345 300 297 308 440 402 Gain associated with the sale of the specialty mills, net — — (1,129 ) — — — — Pension settlement expense — — 2,240 — — — — Costs associated with Oklahoma City facility closure — — — 1,073 3,786 183 3,338 Costs associated with Neenah paper machines shutdown — — — 678 — — — Manchester Industries acquisition related expenses — — — 2,200 76 70 — Write-off of assets in association with Warehouse Automation project — — — — — 27 — Accelerated depreciation of assets associated with Warehouse Automation project — — — — — 161 79 Reorganization related expenses — — — — — — 317 Adjusted net earnings2 $19,188 $23,544 $2,369 $13,820 $10,728 $7,930 $5,305 Net earnings per diluted common share $1.05 $1.21 $0.05 $0.56 $0.45 $0.48 $0.05 Adjustments, after tax:1 Directors' equity-based compensation expense (benefit) 0.03 0.14 — 0.01 (0.06 ) (0.06 ) 0.02 Costs associated with Long Island facility closure 0.02 0.02 0.02 0.02 0.02 0.03 0.02 Gain associated with the sale of the specialty mills, net — — (0.07 ) — — — — Pension settlement expense — — 0.13 — — — — Costs associated with Oklahoma City facility closure — — — 0.06 0.23 0.01 0.20 Costs associated with Neenah paper machines shutdown — — — 0.04 — — — Manchester Industries acquisition related expenses — — — 0.13 — 0.01 — Write-off of assets in association with Warehouse Automation project — — — — — — — Accelerated depreciation of assets associated with Warehouse Automation project — — — — — 0.01 0.01 Reorganization related expenses — — — — — — 0.02 Adjusted net earnings per diluted common share2 $1.09 $1.37 $0.14 $0.82 $0.64 $0.48 $0.32 22
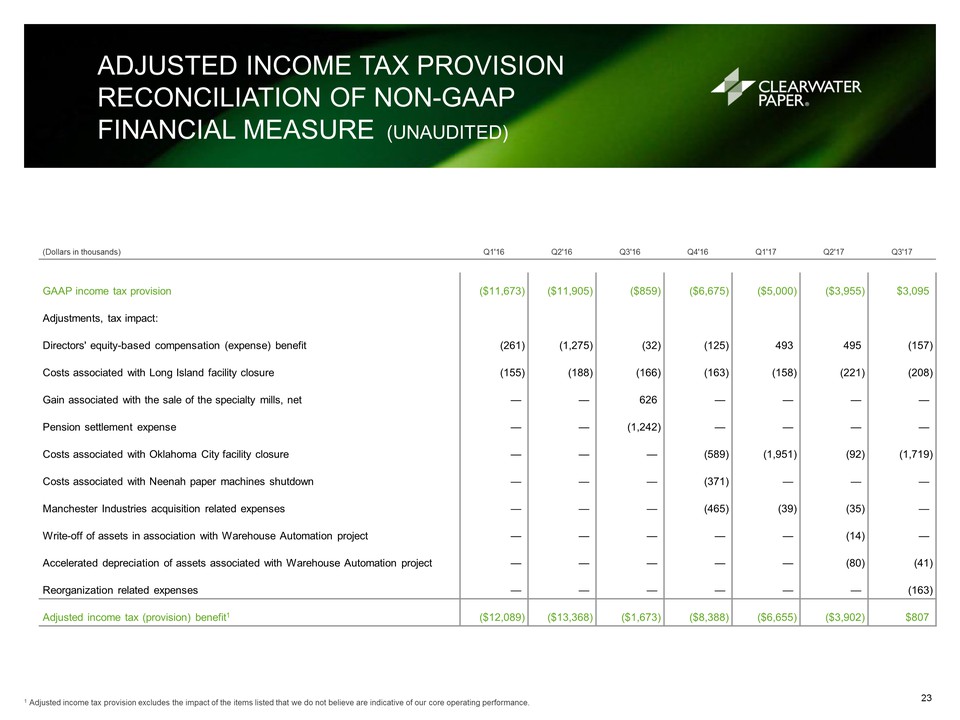
ADJUSTED INCOME TAX PROVISION RECONCILIATION OF NON-GAAP FINANCIAL MEASURE (UNAUDITED) 1 Adjusted income tax provision excludes the impact of the items listed that we do not believe are indicative of our core operating performance. (Dollars in thousands) Q1'16 Q2'16 Q3'16 Q4'16 Q1'17 Q2'17 Q3'17 GAAP income tax provision ($11,673 ) ($11,905 ) ($859 ) ($6,675 ) ($5,000 ) ($3,955 ) $3,095 Adjustments, tax impact: Directors' equity-based compensation (expense) benefit (261 ) (1,275 ) (32 ) (125 ) 493 495 (157 ) Costs associated with Long Island facility closure (155 ) (188 ) (166 ) (163 ) (158 ) (221 ) (208 ) Gain associated with the sale of the specialty mills, net — — 626 — — — — Pension settlement expense — — (1,242 ) — — — — Costs associated with Oklahoma City facility closure — — — (589 ) (1,951 ) (92 ) (1,719 ) Costs associated with Neenah paper machines shutdown — — — (371 ) — — — Manchester Industries acquisition related expenses — — — (465 ) (39 ) (35 ) — Write-off of assets in association with Warehouse Automation project — — — — — (14 ) — Accelerated depreciation of assets associated with Warehouse Automation project — — — — — (80 ) (41 ) Reorganization related expenses — — — — — — (163 ) Adjusted income tax (provision) benefit1 ($12,089 ) ($13,368 ) ($1,673 ) ($8,388 ) ($6,655 ) ($3,902 ) $807 23
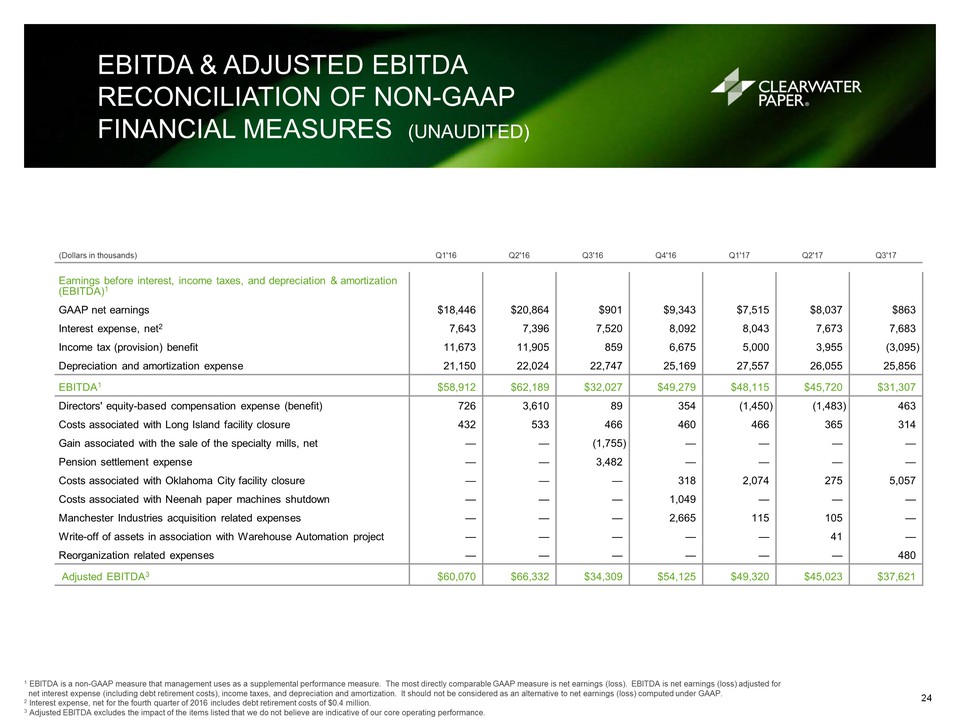
EBITDA & ADJUSTED EBITDA RECONCILIATION OF NON-GAAP FINANCIAL MEASURES (UNAUDITED) 1 EBITDA is a non-GAAP measure that management uses as a supplemental performance measure. The most directly comparable GAAP measure is net earnings (loss). EBITDA is net earnings (loss) adjusted for net interest expense (including debt retirement costs), income taxes, and depreciation and amortization. It should not be considered as an alternative to net earnings (loss) computed under GAAP.2 Interest expense, net for the fourth quarter of 2016 includes debt retirement costs of $0.4 million.3 Adjusted EBITDA excludes the impact of the items listed that we do not believe are indicative of our core operating performance. (Dollars in thousands) Q1'16 Q2'16 Q3'16 Q4'16 Q1'17 Q2'17 Q3'17 Earnings before interest, income taxes, and depreciation & amortization (EBITDA)1 GAAP net earnings $18,446 $20,864 $901 $9,343 $7,515 $8,037 $863 Interest expense, net2 7,643 7,396 7,520 8,092 8,043 7,673 7,683 Income tax (provision) benefit 11,673 11,905 859 6,675 5,000 3,955 (3,095 ) Depreciation and amortization expense 21,150 22,024 22,747 25,169 27,557 26,055 25,856 EBITDA1 $58,912 $62,189 $32,027 $49,279 $48,115 $45,720 $31,307 Directors' equity-based compensation expense (benefit) 726 3,610 89 354 (1,450 ) (1,483 ) 463 Costs associated with Long Island facility closure 432 533 466 460 466 365 314 Gain associated with the sale of the specialty mills, net — — (1,755 ) — — — — Pension settlement expense — — 3,482 — — — — Costs associated with Oklahoma City facility closure — — — 318 2,074 275 5,057 Costs associated with Neenah paper machines shutdown — — — 1,049 — — — Manchester Industries acquisition related expenses — — — 2,665 115 105 — Write-off of assets in association with Warehouse Automation project — — — — — 41 — Reorganization related expenses — — — — — — 480 Adjusted EBITDA3 $60,070 $66,332 $34,309 $54,125 $49,320 $45,023 $37,621 24
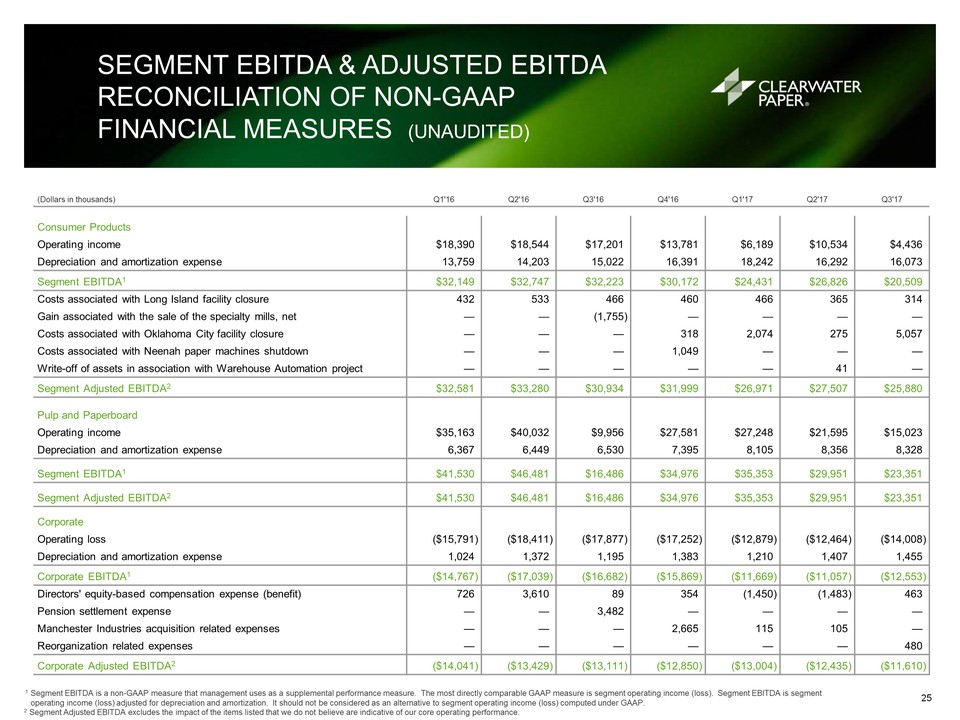
SEGMENT EBITDA & ADJUSTED EBITDA RECONCILIATION OF NON-GAAPFINANCIAL MEASURES (UNAUDITED) 1 Segment EBITDA is a non-GAAP measure that management uses as a supplemental performance measure. The most directly comparable GAAP measure is segment operating income (loss). Segment EBITDA is segment operating income (loss) adjusted for depreciation and amortization. It should not be considered as an alternative to segment operating income (loss) computed under GAAP. 2 Segment Adjusted EBITDA excludes the impact of the items listed that we do not believe are indicative of our core operating performance. (Dollars in thousands) Q1'16 Q2'16 Q3'16 Q4'16 Q1'17 Q2'17 Q3'17 Consumer Products Operating income $18,390 $18,544 $17,201 $13,781 $6,189 $10,534 $4,436 Depreciation and amortization expense 13,759 14,203 15,022 16,391 18,242 16,292 16,073 Segment EBITDA1 $32,149 $32,747 $32,223 $30,172 $24,431 $26,826 $20,509 Costs associated with Long Island facility closure 432 533 466 460 466 365 314 Gain associated with the sale of the specialty mills, net — — (1,755 ) — — — — Costs associated with Oklahoma City facility closure — — — 318 2,074 275 5,057 Costs associated with Neenah paper machines shutdown — — — 1,049 — — — Write-off of assets in association with Warehouse Automation project — — — — — 41 — Segment Adjusted EBITDA2 $32,581 $33,280 $30,934 $31,999 $26,971 $27,507 $25,880 Pulp and Paperboard Operating income $35,163 $40,032 $9,956 $27,581 $27,248 $21,595 $15,023 Depreciation and amortization expense 6,367 6,449 6,530 7,395 8,105 8,356 8,328 Segment EBITDA1 $41,530 $46,481 $16,486 $34,976 $35,353 $29,951 $23,351 Segment Adjusted EBITDA2 $41,530 $46,481 $16,486 $34,976 $35,353 $29,951 $23,351 Corporate Operating loss ($15,791 ) ($18,411 ) ($17,877 ) ($17,252 ) ($12,879 ) ($12,464 ) ($14,008 ) Depreciation and amortization expense 1,024 1,372 1,195 1,383 1,210 1,407 1,455 Corporate EBITDA1 ($14,767 ) ($17,039 ) ($16,682 ) ($15,869 ) ($11,669 ) ($11,057 ) ($12,553 ) Directors' equity-based compensation expense (benefit) 726 3,610 89 354 (1,450 ) (1,483 ) 463 Pension settlement expense — — 3,482 — — — — Manchester Industries acquisition related expenses — — — 2,665 115 105 — Reorganization related expenses — — — — — — 480 Corporate Adjusted EBITDA2 ($14,041 ) ($13,429 ) ($13,111 ) ($12,850 ) ($13,004 ) ($12,435 ) ($11,610 ) 25
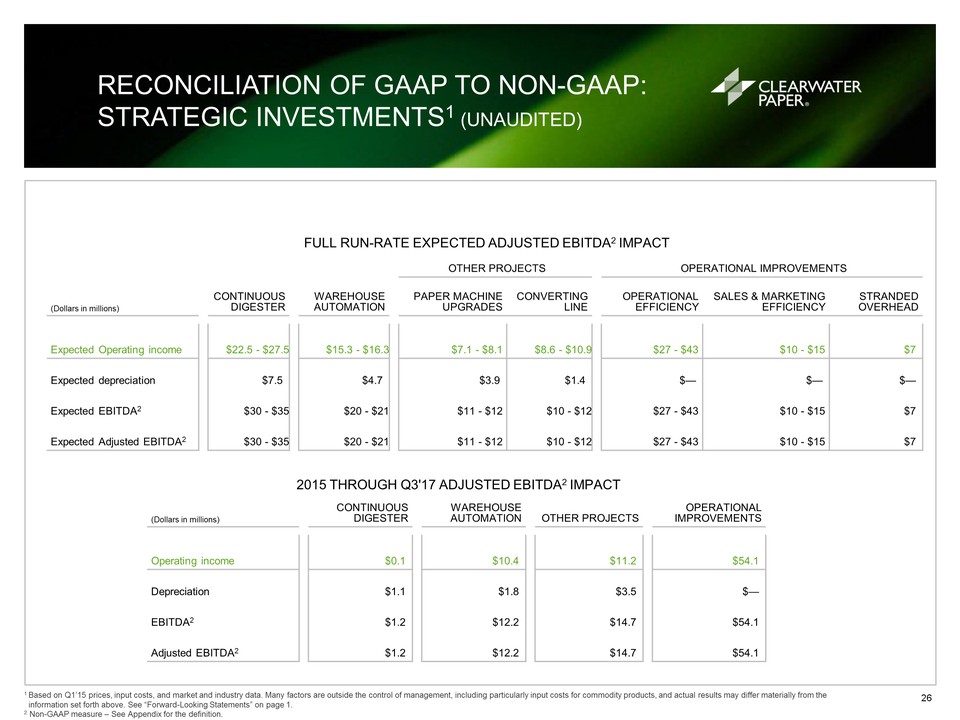
RECONCILIATION OF GAAP TO NON-GAAP: STRATEGIC INVESTMENTS1 (UNAUDITED) 1 Based on Q1’15 prices, input costs, and market and industry data. Many factors are outside the control of management, including particularly input costs for commodity products, and actual results may differ materially from the information set forth above. See “Forward-Looking Statements” on page 1.2 Non-GAAP measure – See Appendix for the definition. FULL RUN-RATE EXPECTED ADJUSTED EBITDA2 IMPACT OTHER PROJECTS OPERATIONAL IMPROVEMENTS (Dollars in millions) CONTINUOUSDIGESTER WAREHOUSEAUTOMATION PAPER MACHINEUPGRADES CONVERTINGLINE OPERATIONALEFFICIENCY SALES & MARKETINGEFFICIENCY STRANDEDOVERHEAD Expected Operating income $22.5 - $27.5 $15.3 - $16.3 $7.1 - $8.1 $8.6 - $10.9 $27 - $43 $10 - $15 $7 Expected depreciation $7.5 $4.7 $3.9 $1.4 $— $— $— Expected EBITDA2 $30 - $35 $20 - $21 $11 - $12 $10 - $12 $27 - $43 $10 - $15 $7 Expected Adjusted EBITDA2 $30 - $35 $20 - $21 $11 - $12 $10 - $12 $27 - $43 $10 - $15 $7 2015 THROUGH Q3'17 ADJUSTED EBITDA2 IMPACT (Dollars in millions) CONTINUOUSDIGESTER WAREHOUSEAUTOMATION OTHER PROJECTS OPERATIONALIMPROVEMENTS Operating income $0.1 $10.4 $11.2 $54.1 Depreciation $1.1 $1.8 $3.5 $— EBITDA2 $1.2 $12.2 $14.7 $54.1 Adjusted EBITDA2 $1.2 $12.2 $14.7 $54.1 26
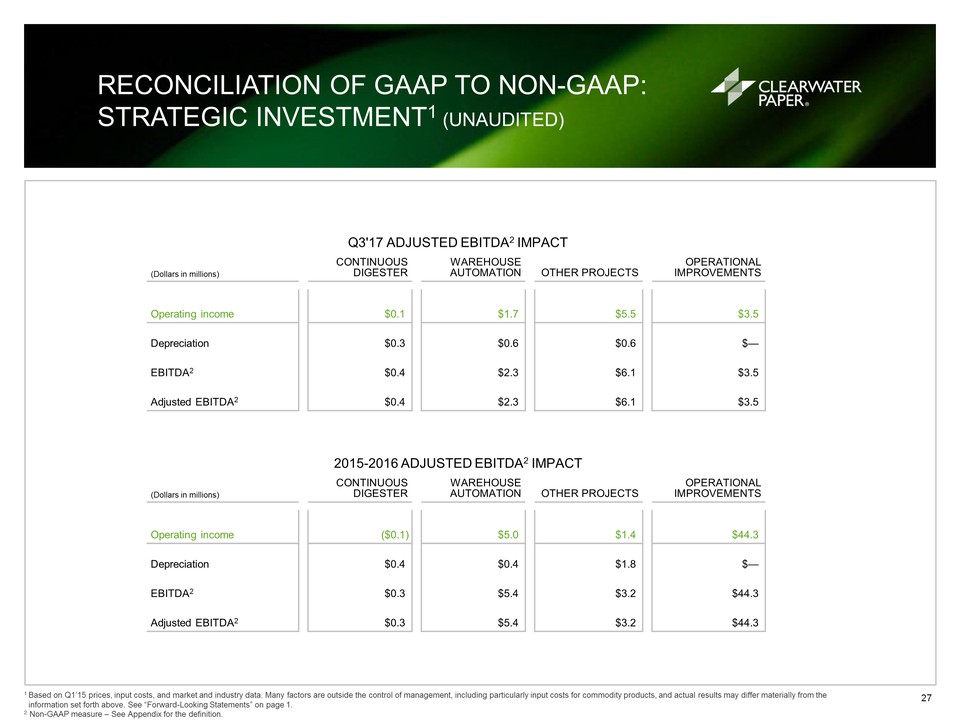
RECONCILIATION OF GAAP TO NON-GAAP: STRATEGIC INVESTMENT1 (UNAUDITED) 1 Based on Q1’15 prices, input costs, and market and industry data. Many factors are outside the control of management, including particularly input costs for commodity products, and actual results may differ materially from the information set forth above. See “Forward-Looking Statements” on page 1.2 Non-GAAP measure – See Appendix for the definition. Q3'17 ADJUSTED EBITDA2 IMPACT (Dollars in millions) CONTINUOUSDIGESTER WAREHOUSEAUTOMATION OTHER PROJECTS OPERATIONALIMPROVEMENTS Operating income $0.1 $1.7 $5.5 $3.5 Depreciation $0.3 $0.6 $0.6 $— EBITDA2 $0.4 $2.3 $6.1 $3.5 Adjusted EBITDA2 $0.4 $2.3 $6.1 $3.5 2015-2016 ADJUSTED EBITDA2 IMPACT (Dollars in millions) CONTINUOUSDIGESTER WAREHOUSEAUTOMATION OTHER PROJECTS OPERATIONALIMPROVEMENTS Operating income ($0.1 ) $5.0 $1.4 $44.3 Depreciation $0.4 $0.4 $1.8 $— EBITDA2 $0.3 $5.4 $3.2 $44.3 Adjusted EBITDA2 $0.3 $5.4 $3.2 $44.3 27

FOR MORE INFORMATION:WWW.CLEARWATERPAPER.COM 28