Attached files
| file | filename |
|---|---|
| 8-K - FORM 8-K - CENTERPOINT ENERGY INC | d396428d8k.htm |
Wolfe Research Utilities and Power Leaders Conference September 27, 2017 Company reiterates full-year 2017 guidance of $1.25 - $1.33 Company continues to target upper end of 4-6% year-over-year earnings growth range for 2018 Exhibit 99.1
Cautionary Statement This presentation and the oral statements made in connection herewith contain statements concerning our expectations, beliefs, plans, objectives, goals, strategies, future operations, events, financial position, earnings, growth, costs, prospects, capital investments or performance or underlying assumptions (including future regulatory filings and recovery, liquidity, capital resources, balance sheet, cash flow, capital investments and management, financing costs, and rate base or customer growth) and other statements that are not historical facts. These statements are “forward-looking statements” within the meaning of the Private Securities Litigation Reform Act of 1995. You should not place undue reliance on forward-looking statements. Actual results may differ materially from those expressed or implied by these statements. You can generally identify our forward-looking statements by the words “anticipate,” “believe,” “continue,” “could,” “estimate,” “expect,” “forecast,” “goal,” “intend,” “may,” “objective,” “plan,” “potential,” “predict,” “projection,” “should,” “target,” “will,” or other similar words. The absence of these words, however, does not mean that the statements are not forward-looking. Examples of forward-looking statements in this presentation (including, but not limited to, the information presented on slides 10-13 and the Company’s reiteration of guidance as stated on the cover of this presentation) include statements about our financial projections related to Hurricane Harvey and our Energy Services business (including growth and operating income), growth, guidance, including earnings and dividend growth, future financing plans and expectation for capital resources and expenditures, interest expense, effective tax rate and rate base, among other statements. We have based our forward-looking statements on our management’s beliefs and assumptions based on information available to our management at the time the statements are made. We caution you that assumptions, beliefs, expectations, intentions, and projections about future events may and often do vary materially from actual results. Therefore, we cannot assure you that actual results will not differ materially from those expressed or implied by our forward-looking statements. Some of the factors that could cause actual results to differ from those expressed or implied by our forward-looking statements include but are not limited to the timing and impact of future regulatory, legislative and IRS decisions, financial market conditions, future market conditions, economic and employment conditions, customer growth, Enable Midstream Partners, LP’s performance and ability to pay distributions, and other factors described in CenterPoint Energy, Inc.’s Form 10-K for the period ended December 31, 2016 and Forms 10-Q for the periods ended March 31, 2017 and June 30, 2017 under “Risk Factors” and “Management’s Discussion and Analysis of Financial Condition and Results of Operations—Certain Factors Affecting Future Earnings” and in other filings with the Securities and Exchange Commission (“SEC”) by CenterPoint Energy, which can be found at www.centerpointenergy.com on the Investor Relations page or on the SEC’s website at www.sec.gov. This presentation contains time sensitive information that is accurate as of September 27, 2017, including the Company’s reiteration of full-year 2017 earnings guidance. Some of the information in this presentation is unaudited and may be subject to change. We undertake no obligation to update the information presented herein except as required by law. Investors and others should note that we may announce material information using SEC filings, press releases, public conference calls, webcasts and the Investor Relations page of our website. In the future, we will continue to use these channels to distribute material information about the Company and to communicate important information about the Company, key personnel, corporate initiatives, regulatory updates and other matters. Information that we post on our website could be deemed material; therefore, we encourage investors, the media, our customers, business partners and others interested in our Company to review the information we post on our website. Use of Non-GAAP Financial Measures In addition to presenting its financial results in accordance with generally accepted accounting principles (“GAAP”), including presentation of net income and diluted earnings per share, CenterPoint Energy also provides guidance based on adjusted net income and adjusted diluted earnings per share, which are non-GAAP financial measures. Generally, a non-GAAP financial measure is a numerical measure of a company’s historical or future financial performance that excludes or includes amounts that are not normally excluded or included in the most directly comparable GAAP financial measure. CenterPoint Energy’s adjusted net income and adjusted diluted earnings per share calculation excludes from net income and diluted earnings per share, respectively, the impact of ZENS and related securities and mark-to-market gains or losses resulting from the Company’s Energy Services business. CenterPoint Energy is unable to present a quantitative reconciliation of forward-looking adjusted net income and adjusted diluted earnings per share because changes in the value of ZENS and related securities and mark-to-market gains or losses resulting from the Company’s Energy Services business are not estimable. Management evaluates the Company’s financial performance in part based on adjusted net income and adjusted diluted earnings per share. We believe that presenting these non-GAAP financial measures enhances an investor’s understanding of CenterPoint Energy’s overall financial performance by providing them with an additional meaningful and relevant comparison of current and anticipated future results across periods. The adjustments made in these non-GAAP financial measures exclude items that Management believes do not most accurately reflect the Company’s fundamental business performance. CenterPoint Energy’s adjusted net income and adjusted diluted earnings per share non-GAAP financial measures should be considered as a supplement to, and not as a substitute for, or superior to, net income and diluted earnings per share, which respectively are the most directly comparable GAAP financial measures. These non-GAAP financial measures also may be different than non-GAAP financial measures used by other companies.
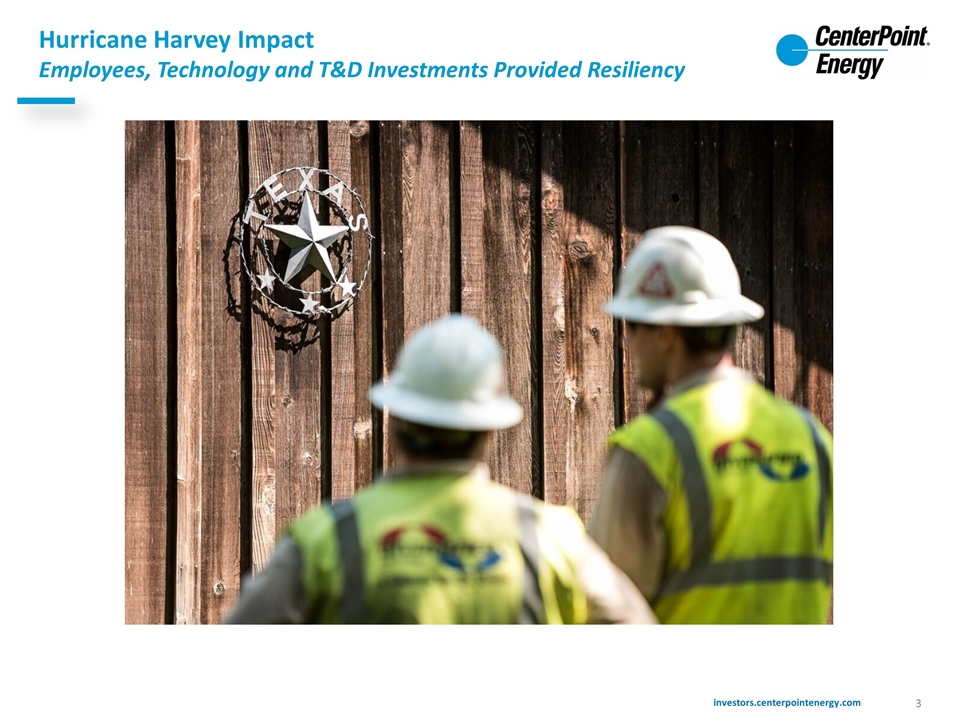
Hurricane Harvey Impact Employees, Technology and T&D Investments Provided Resiliency
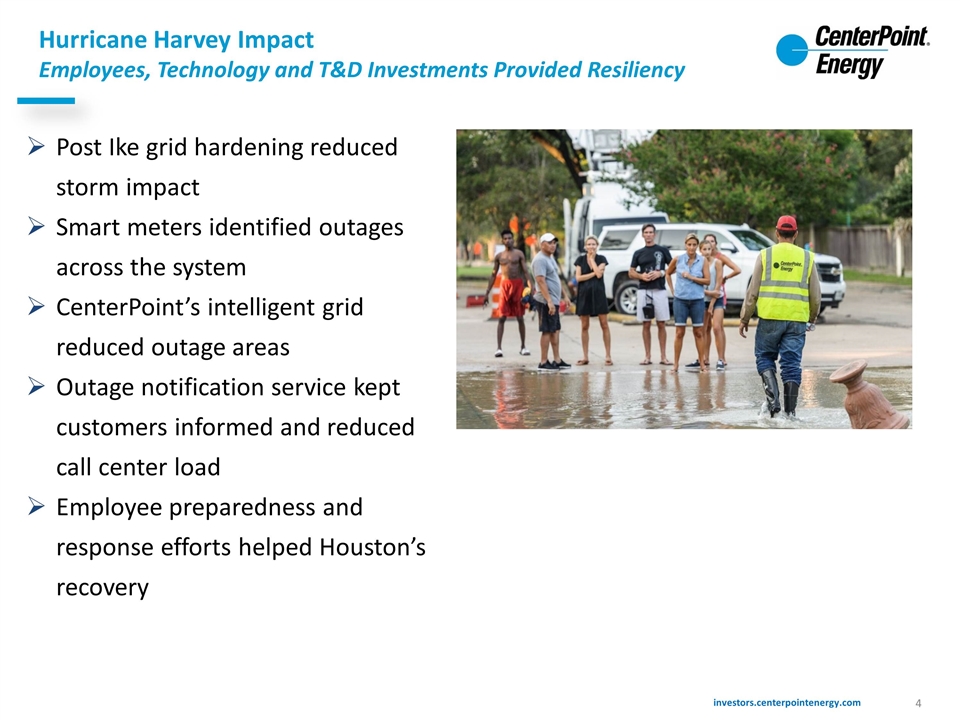
Hurricane Harvey Impact Employees, Technology and T&D Investments Provided Resiliency Post Ike grid hardening reduced storm impact Smart meters identified outages across the system CenterPoint’s intelligent grid reduced outage areas Outage notification service kept customers informed and reduced call center load Employee preparedness and response efforts helped Houston’s recovery
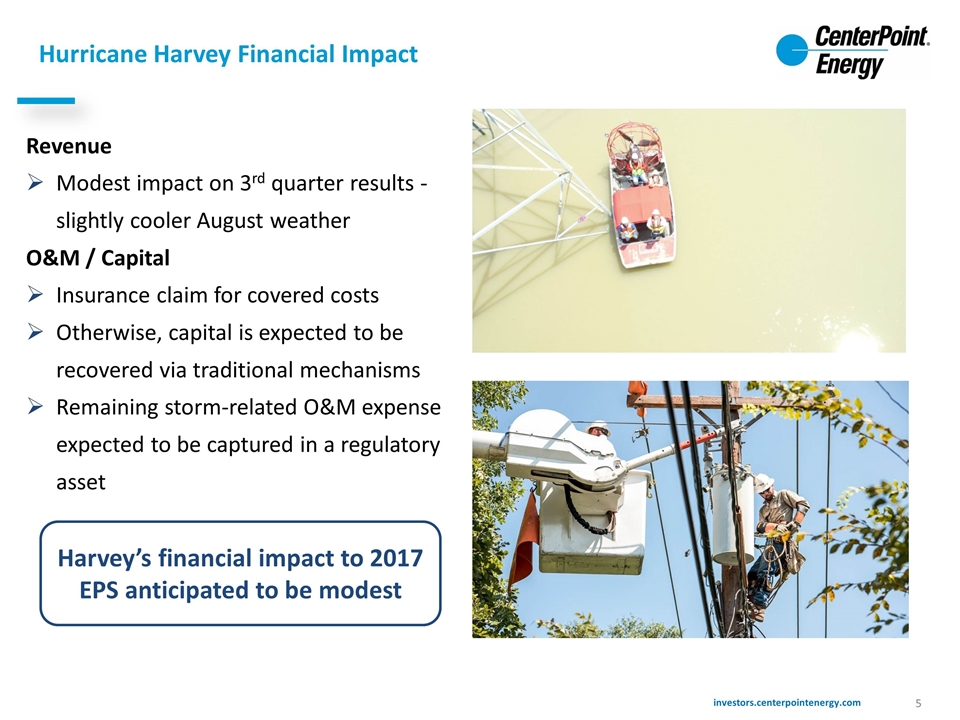
Hurricane Harvey Financial Impact Harvey’s financial impact to 2017 EPS anticipated to be modest Revenue Modest impact on 3rd quarter results - slightly cooler August weather O&M / Capital Insurance claim for covered costs Otherwise, capital is expected to be recovered via traditional mechanisms Remaining storm-related O&M expense expected to be captured in a regulatory asset
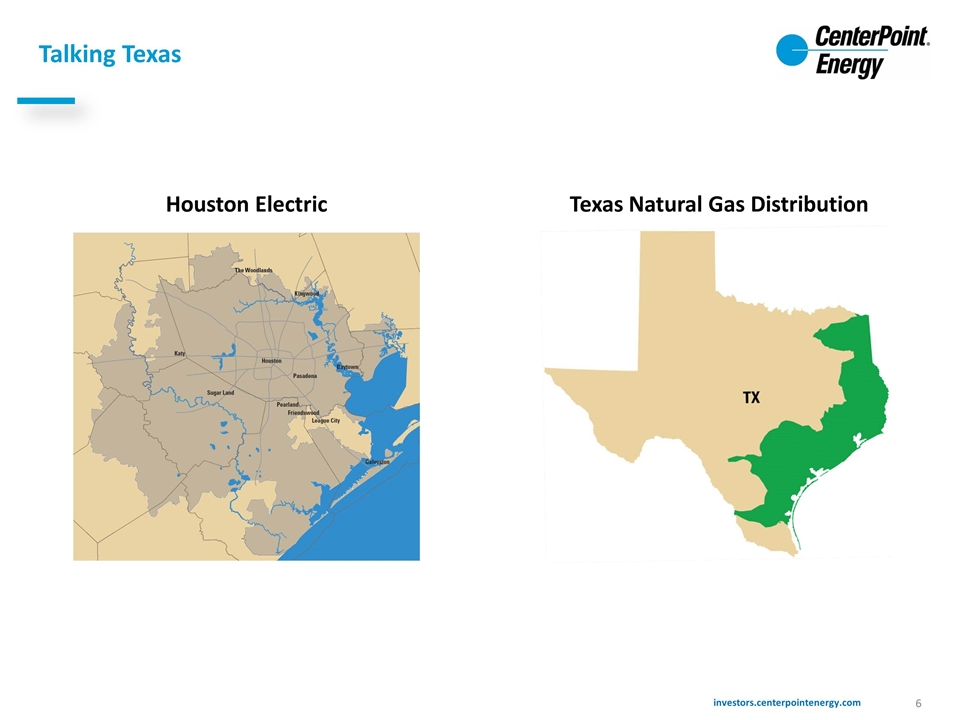
Talking Texas Houston Electric Texas Natural Gas Distribution
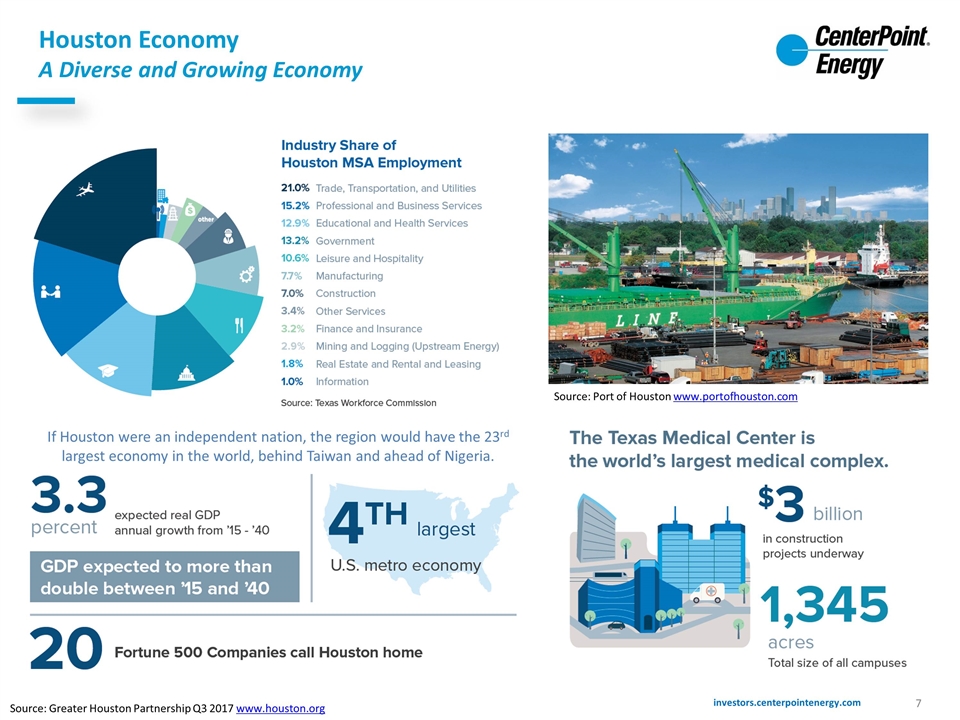
Houston Economy A Diverse and Growing Economy Source: Greater Houston Partnership Q3 2017 www.houston.org Source: Port of Houston www.portofhouston.com If Houston were an independent nation, the region would have the 23rd largest economy in the world, behind Taiwan and ahead of Nigeria.
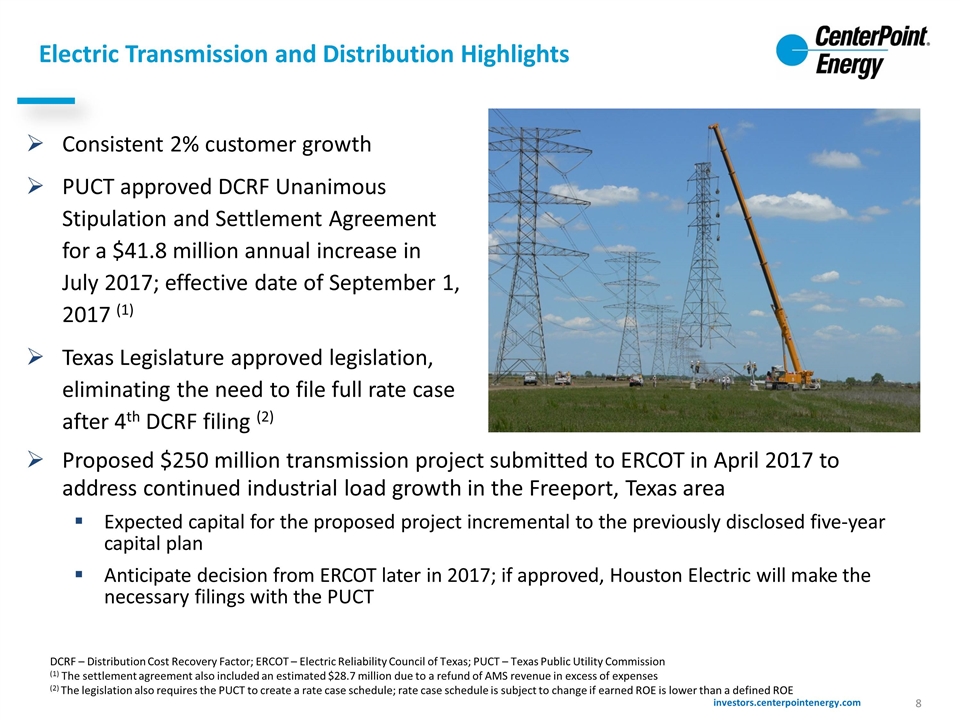
Electric Transmission and Distribution Highlights Consistent 2% customer growth PUCT approved DCRF Unanimous Stipulation and Settlement Agreement for a $41.8 million annual increase in July 2017; effective date of September 1, 2017 (1) Texas Legislature approved legislation, eliminating the need to file full rate case after 4th DCRF filing (2) DCRF – Distribution Cost Recovery Factor; ERCOT – Electric Reliability Council of Texas; PUCT – Texas Public Utility Commission (1) The settlement agreement also included an estimated $28.7 million due to a refund of AMS revenue in excess of expenses (2) The legislation also requires the PUCT to create a rate case schedule; rate case schedule is subject to change if earned ROE is lower than a defined ROE Proposed $250 million transmission project submitted to ERCOT in April 2017 to address continued industrial load growth in the Freeport, Texas area Expected capital for the proposed project incremental to the previously disclosed five-year capital plan Anticipate decision from ERCOT later in 2017; if approved, Houston Electric will make the necessary filings with the PUCT
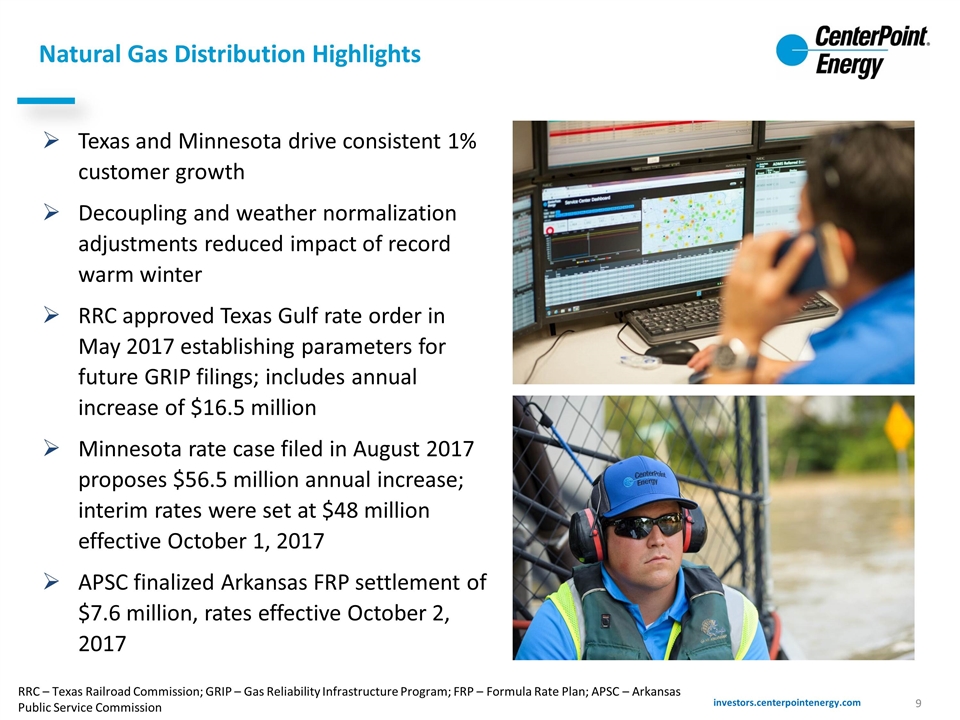
Natural Gas Distribution Highlights Texas and Minnesota drive consistent 1% customer growth Decoupling and weather normalization adjustments reduced impact of record warm winter RRC approved Texas Gulf rate order in May 2017 establishing parameters for future GRIP filings; includes annual increase of $16.5 million Minnesota rate case filed in August 2017 proposes $56.5 million annual increase; interim rates were set at $48 million effective October 1, 2017 APSC finalized Arkansas FRP settlement of $7.6 million, rates effective October 2, 2017 RRC – Texas Railroad Commission; GRIP – Gas Reliability Infrastructure Program; FRP – Formula Rate Plan; APSC – Arkansas Public Service Commission
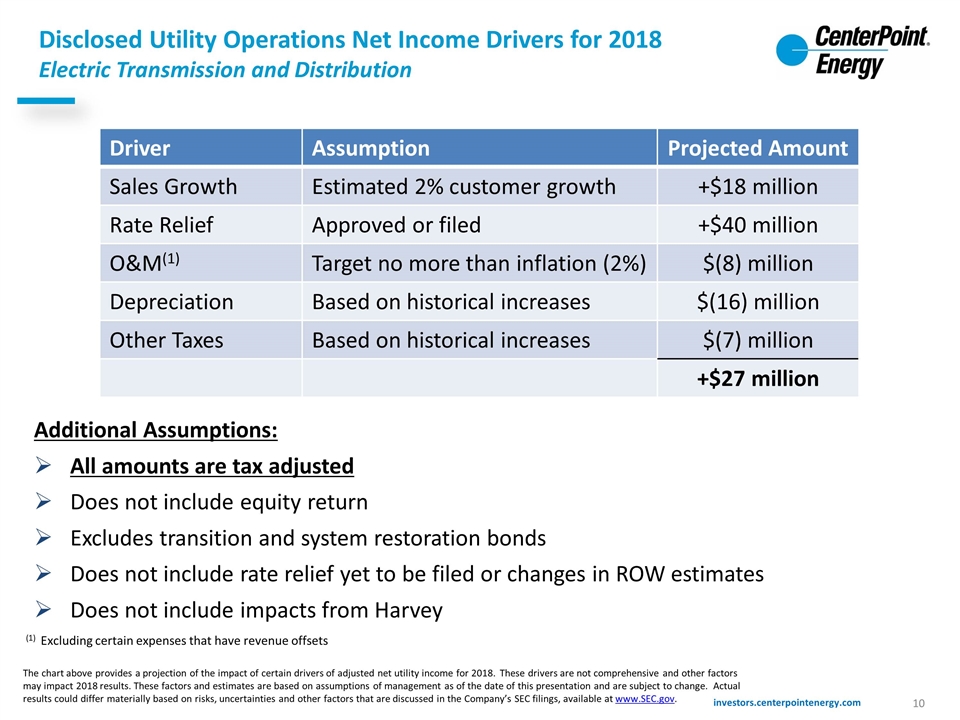
Disclosed Utility Operations Net Income Drivers for 2018 Electric Transmission and Distribution Additional Assumptions: All amounts are tax adjusted Does not include equity return Excludes transition and system restoration bonds Does not include rate relief yet to be filed or changes in ROW estimates Does not include impacts from Harvey Driver Assumption Projected Amount Sales Growth Estimated 2% customer growth +$18 million Rate Relief Approved or filed +$40 million O&M(1) Target no more than inflation (2%) $(8) million Depreciation Based on historical increases $(16) million Other Taxes Based on historical increases $(7) million +$27 million The chart above provides a projection of the impact of certain drivers of adjusted net utility income for 2018. These drivers are not comprehensive and other factors may impact 2018 results. These factors and estimates are based on assumptions of management as of the date of this presentation and are subject to change. Actual results could differ materially based on risks, uncertainties and other factors that are discussed in the Company’s SEC filings, available at www.SEC.gov. (1) Excluding certain expenses that have revenue offsets
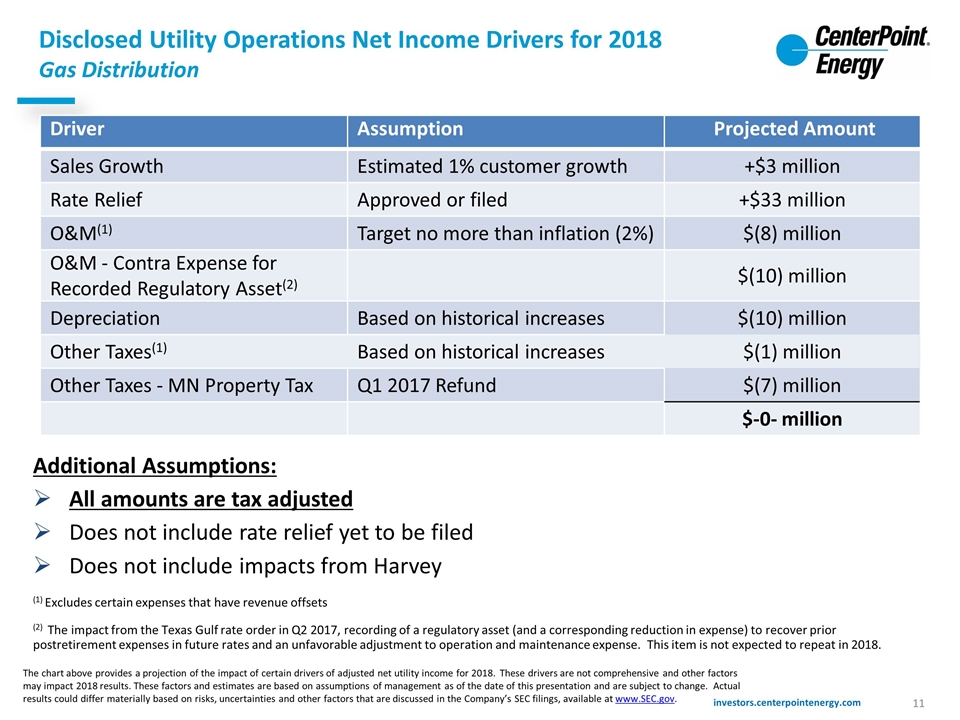
Disclosed Utility Operations Net Income Drivers for 2018 Gas Distribution Additional Assumptions: All amounts are tax adjusted Does not include rate relief yet to be filed Does not include impacts from Harvey (1) Excludes certain expenses that have revenue offsets (2) The impact from the Texas Gulf rate order in Q2 2017, recording of a regulatory asset (and a corresponding reduction in expense) to recover prior postretirement expenses in future rates and an unfavorable adjustment to operation and maintenance expense. This item is not expected to repeat in 2018. Driver Assumption Projected Amount Sales Growth Estimated 1% customer growth +$3 million Rate Relief Approved or filed +$33 million O&M(1) Target no more than inflation (2%) $(8) million O&M - Contra Expense for Recorded Regulatory Asset(2) $(10) million Depreciation Based on historical increases $(10) million Other Taxes(1) Based on historical increases $(1) million Other Taxes - MN Property Tax Q1 2017 Refund $(7) million $-0- million The chart above provides a projection of the impact of certain drivers of adjusted net utility income for 2018. These drivers are not comprehensive and other factors may impact 2018 results. These factors and estimates are based on assumptions of management as of the date of this presentation and are subject to change. Actual results could differ materially based on risks, uncertainties and other factors that are discussed in the Company’s SEC filings, available at www.SEC.gov.
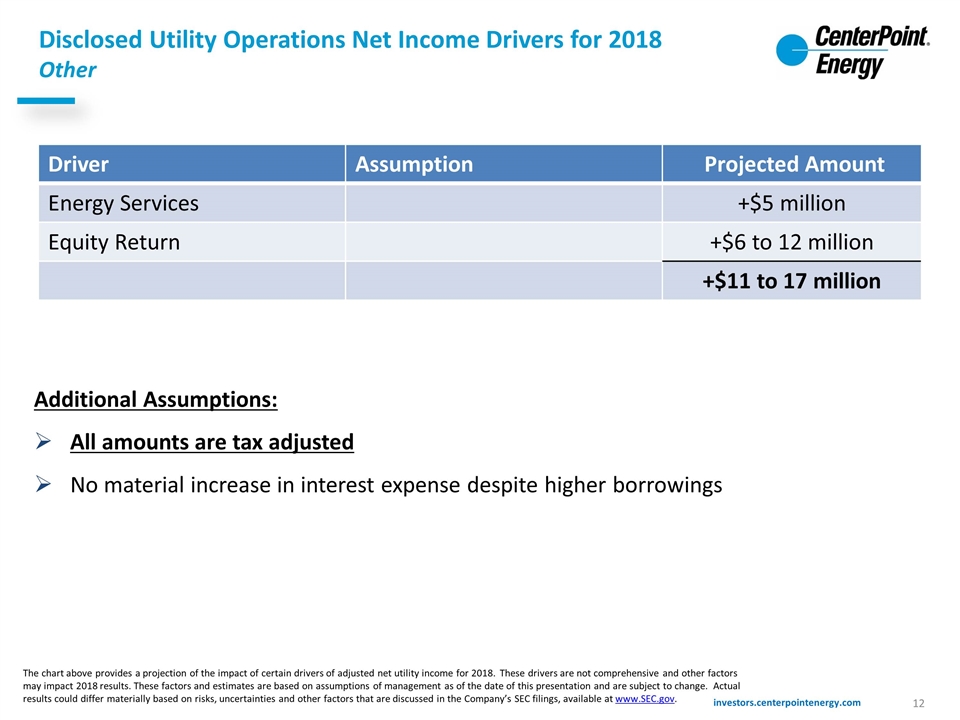
Disclosed Utility Operations Net Income Drivers for 2018 Other Additional Assumptions: All amounts are tax adjusted No material increase in interest expense despite higher borrowings Driver Assumption Projected Amount Energy Services +$5 million Equity Return +$6 to 12 million +$11 to 17 million The chart above provides a projection of the impact of certain drivers of adjusted net utility income for 2018. These drivers are not comprehensive and other factors may impact 2018 results. These factors and estimates are based on assumptions of management as of the date of this presentation and are subject to change. Actual results could differ materially based on risks, uncertainties and other factors that are discussed in the Company’s SEC filings, available at www.SEC.gov.
CenterPoint Energy’s Value Proposition Strong fundamentals Attractive service territory with solid customer growth Low commodity prices and the competitive retail electric market help keep customer bills low Combined 2016 – 2021 rate base compound annual growth rate of 5.6%(1) Recovery mechanisms at electric and natural gas utilities reduce regulatory lag Expanded Energy Services business expected to provide earnings growth Strong operating cash flow, balance sheet, and credit metrics are expected to deliver growth and long term value Current dividend yield of 3.6%(2) with recent history of increasing dividends 4% per year (1) Based upon rate base projections provided on February 28, 2017 (2) As of market close on September 25, 2017
