Attached files
UNITED STATES SECURITIES AND EXCHANGE COMMISSION
Washington, D.C. 20549
______________________
Form 10-K
(Mark One) | |
þ | ANNUAL REPORT PURSUANT TO SECTION 13 OR 15(d) OF THE SECURITIES EXCHANGE ACT OF 1934 |
FOR THE FISCAL YEAR ENDED DECEMBER 31, 2017 | |
OR | |
o | TRANSITION REPORT PURSUANT TO SECTION 13 OR 15(d) OF THE SECURITIES EXCHANGE ACT OF 1934 |
FOR THE TRANSITION PERIOD FROM TO | |
Commission File Number 1-31447
______________________
CenterPoint Energy, Inc.
(Exact name of registrant as specified in its charter)
Texas | 74-0694415 |
(State or other jurisdiction of incorporation or organization) | (I.R.S. Employer Identification No.) |
1111 Louisiana Houston, Texas 77002 (Address and zip code of principal executive offices) | (713) 207-1111 (Registrant’s telephone number, including area code) |
Securities registered pursuant to Section 12(b) of the Act:
Title of each class | Name of each exchange on which registered |
Common Stock, $0.01 par value | New York Stock Exchange Chicago Stock Exchange |
Securities registered pursuant to Section 12(g) of the Act:
None
Indicate by check mark if the registrant is a well-known seasoned issuer, as defined in Rule 405 of the Securities Act. Yes þ No o
Indicate by check mark if the registrant is not required to file reports pursuant to Section 13 or Section 15(d) of the Act. Yes o No þ
Indicate by check mark whether the registrant: (1) has filed all reports required to be filed by Section 13 or 15(d) of the Securities Exchange Act of 1934 during the preceding 12 months (or for such shorter period that the registrant was required to file such reports), and (2) has been subject to such filing requirements for the past 90 days. Yes þ No o
Indicate by check mark whether the registrant has submitted electronically and posted on its corporate Web site, if any, every Interactive Data File required to be submitted and posted pursuant to Rule 405 of Regulation S-T (§ 232.405 of this chapter) during the preceding 12 months (or for such shorter period that the registrant was required to submit and post such files). Yes þ No o
Indicate by check mark if disclosure of delinquent filers pursuant to Item 405 of Regulation S-K is not contained herein and will not be contained, to the best of the registrant’s knowledge, in definitive proxy or information statements incorporated by reference in Part III of this Form 10-K or any amendment to this Form 10-K. þ
Indicate by check mark whether the registrant is a large accelerated filer, an accelerated filer, a non-accelerated filer, or a smaller reporting company. See definitions of “large accelerated filer”, “accelerated filer” and “smaller reporting company” in Rule 12b-2 of the Exchange Act. (Check one):
Large accelerated filer þ | Accelerated filer o | Non-accelerated filer o | Smaller reporting company o | Emerging growth company o |
(Do not check if a smaller reporting company) | ||||
If an emerging growth company, indicate by check mark if the registrant has elected not to use the extended transition period for complying with any new or revised financial accounting standards provided pursuant to Section 13(a) of the Exchange Act. o
Indicate by check mark whether the registrant is a shell company (as defined in Rule 12b-2 of the Exchange Act). Yes o No þ
The aggregate market value of the voting stock held by non-affiliates of CenterPoint Energy, Inc. (CenterPoint Energy) was $11,722,467,012 as of June 30, 2017, using the definition of beneficial ownership contained in Rule 13d-3 promulgated pursuant to the Securities Exchange Act of 1934 and excluding shares held by directors and executive officers. As of February 9, 2018, CenterPoint Energy had 431,048,125 shares of Common Stock outstanding. Excluded from the number of shares of Common Stock outstanding are 166 shares held by CenterPoint Energy as treasury stock.
DOCUMENTS INCORPORATED BY REFERENCE
Portions of the definitive proxy statement relating to the 2018 Annual Meeting of Shareholders of CenterPoint Energy, which will be filed with the Securities and Exchange Commission within 120 days of December 31, 2017, are incorporated by reference in Item 10, Item 11, Item 12, Item 13 and Item 14 of Part III of this Form 10-K.
TABLE OF CONTENTS
PART I | ||||
Page | ||||
Item 1. | Business | |||
Item 1A. | Risk Factors | |||
Item 1B. | Unresolved Staff Comments | |||
Item 2. | Properties | |||
Item 3. | Legal Proceedings | |||
Item 4. | Mine Safety Disclosures | |||
PART II | ||||
Item 5. | Market for Registrants’ Common Equity, Related Stockholder Matters and Issuer Purchases of Equity Securities | |||
Item 6. | Selected Financial Data | |||
Item 7. | Management’s Discussion and Analysis of Financial Condition and Results of Operations | |||
Item 7A. | Quantitative and Qualitative Disclosures About Market Risk | |||
Item 8. | Financial Statements and Supplementary Data | |||
Item 9. | Changes in and Disagreements with Accountants on Accounting and Financial Disclosure | |||
Item 9A. | Controls and Procedures | |||
Item 9B. | Other Information | |||
PART III | ||||
Item 10. | Directors, Executive Officers and Corporate Governance | |||
Item 11. | Executive Compensation | |||
Item 12. | Security Ownership of Certain Beneficial Owners and Management and Related Stockholder Matters | |||
Item 13. | Certain Relationships and Related Transactions, and Director Independence | |||
Item 14. | Principal Accounting Fees and Services | |||
PART IV | ||||
Item 15. | Exhibits and Financial Statement Schedules | |||
Item 16. | Form 10-K Summary | |||
i
GLOSSARY | ||
ADFIT | Accumulated deferred federal income taxes | |
ADMS | Advanced Distribution Management System | |
AEM | Atmos Energy Marketing, LLC, previously a wholly-owned subsidiary of Atmos Energy Holdings, Inc., a wholly-owned subsidiary of Atmos Energy Corporation | |
AFUDC | Allowance for funds used during construction | |
AMAs | Asset Management Agreements | |
AMS | Advanced Metering System | |
AOL | AOL Inc. | |
APSC | Arkansas Public Service Commission | |
ArcLight | ArcLight Capital Partners, LLC | |
ARO | Asset retirement obligation | |
ASC | Accounting Standards Codification | |
ASU | Accounting Standards Update | |
AT&T | AT&T Inc. | |
AT&T Common | AT&T common stock | |
Bcf | Billion cubic feet | |
Btu | British thermal units | |
BDA | Billing Determinant Adjustment, which is a revenue stabilization mechanism used to adjust revenues impacted by declines in natural gas consumption which occurred after the most recent rate case | |
Bond Companies | Wholly-owned, bankruptcy remote entities formed solely for the purpose of purchasing and owning transition or system restoration property through the issuance of Securitization Bonds | |
Brazos Valley Connection | A portion of the Houston region transmission project between Houston Electric’s Zenith substation and the Gibbons Creek substation owned by the Texas Municipal Power Agency | |
CEA | Commodities Exchange Act of 1936 | |
CEIP | CenterPoint Energy Intrastate Pipelines, LLC | |
CenterPoint Energy | CenterPoint Energy, Inc., and its subsidiaries | |
CERC Corp. | CenterPoint Energy Resources Corp. | |
CERC | CERC Corp., together with its subsidiaries | |
CERCLA | Comprehensive Environmental Response, Compensation and Liability Act of 1980, as amended | |
CES | CenterPoint Energy Services, Inc., a wholly-owned subsidiary of CERC Corp. | |
CFTC | Commodity Futures Trading Commission | |
Charter Common | Charter Communications, Inc. common stock | |
Charter merger | Merger of Charter Communications, Inc. and Time Warner Cable Inc. | |
CIP | Conservation Improvement Program | |
COLI | Corporate-owned life insurance | |
Continuum | The retail energy services business of Continuum Retail Energy Services, LLC, including its wholly-owned subsidiary Lakeshore Energy Services, LLC and the natural gas wholesale assets of Continuum Energy Services, LLC | |
DCRF | Distribution Cost Recovery Factor | |
Dodd-Frank Act | Dodd-Frank Wall Street Reform and Consumer Protection Act of 2010 | |
DOE | U.S. Department of Energy | |
DOT | U.S. Department of Transportation | |
Dth | Dekatherms | |
EBITDA | Earnings before interest, taxes, depreciation and amortization | |
EDIT | Excess deferred income taxes | |
ii
GLOSSARY (cont.) | ||
EECR | Energy Efficiency Cost Recovery | |
EECRF | Energy Efficiency Cost Recovery Factor | |
EGT | Enable Gas Transmission, LLC | |
EIA | U.S. Energy Information Administration | |
Enable | Enable Midstream Partners, LP | |
EPA | Environmental Protection Agency | |
EPAct of 2005 | Energy Policy Act of 2005 | |
ERCOT | Electric Reliability Council of Texas | |
ERCOT ISO | ERCOT Independent System Operator | |
ERISA | Employee Retirement Income Security Act of 1974 | |
ERO | Electric Reliability Organization | |
FASB | Financial Accounting Standards Board | |
FERC | Federal Energy Regulatory Commission | |
Fitch | Fitch, Inc. | |
FRP | Formula Rate Plan | |
Gas Daily | Platts gas daily indices | |
GenOn | GenOn Energy, Inc. | |
GHG | Greenhouse gases | |
GRIP | Gas Reliability Infrastructure Program | |
GWh | Gigawatt-hours | |
Houston Electric | CenterPoint Energy Houston Electric, LLC and its subsidiaries | |
HVAC | Heating, ventilation and air conditioning | |
IBEW | International Brotherhood of Electrical Workers | |
ICA | Interstate Commerce Act of 1887 | |
IG | Intelligent Grid | |
IRS | Internal Revenue Service | |
kV | Kilovolt | |
LIBOR | London Interbank Offered Rate | |
LNG | Liquefied natural gas | |
LPSC | Louisiana Public Service Commission | |
LTIPs | Long-term incentive plans | |
Meredith | Meredith Corporation | |
MGPs | Manufactured gas plants | |
MLP | Master Limited Partnership | |
MMBtu | One million British thermal units | |
MMcf | Million cubic feet | |
Moody’s | Moody’s Investors Service, Inc. | |
MPSC | Mississippi Public Service Commission | |
MPUC | Minnesota Public Utilities Commission | |
MRT | Enable-Mississippi River Transmission, LLC | |
NAV | Net asset value | |
NECA | National Electrical Contractors Association | |
NERC | North American Electric Reliability Corporation | |
NESHAPS | National Emission Standards for Hazardous Air Pollutants | |
NGA | Natural Gas Act of 1938 | |
NGD | Natural gas distribution business | |
NGLs | Natural gas liquids | |
NGPA | Natural Gas Policy Act of 1978 | |
iii
GLOSSARY (cont.) | ||
NGPSA | Natural Gas Pipeline Safety Act of 1968 | |
NRG | NRG Energy, Inc. | |
NYMEX | New York Mercantile Exchange | |
NYSE | New York Stock Exchange | |
OCC | Oklahoma Corporation Commission | |
OGE | OGE Energy Corp. | |
PBRC | Performance Based Rate Change | |
PHMSA | Pipeline and Hazardous Materials Safety Administration | |
PRPs | Potentially responsible parties | |
PUCT | Public Utility Commission of Texas | |
Railroad Commission | Railroad Commission of Texas | |
RCRA | Resource Conservation and Recovery Act of 1976 | |
Reliant Energy | Reliant Energy, Incorporated | |
REP | Retail electric provider | |
RICE MACT | Reciprocating Internal Combustion Engines Maximum Achievable Control Technology | |
ROE | Return on equity | |
RRA | Rate Regulation Adjustment | |
RRI | Reliant Resources, Inc. | |
RSP | Rate Stabilization Plan | |
SEC | Securities and Exchange Commission | |
SESH | Southeast Supply Header, LLC | |
Securitization Bonds | Transition and system restoration bonds | |
Series A Preferred Units | Enable’s 10% Series A Fixed-to-Floating Non-Cumulative Redeemable Perpetual Preferred Units, representing limited partner interests in Enable | |
S&P | Standard & Poor’s Ratings Services, a division of The McGraw-Hill Companies | |
TBD | To be determined | |
TCEH Corp. | Formerly Texas Competitive Electric Holdings Company LLC, predecessor to Vistra Energy Corp. whose major subsidiaries include Luminant and TXU Energy | |
TCJA | Tax reform legislation informally called the Tax Cuts and Jobs Act of 2017 | |
TCOS | Transmission Cost of Service | |
TDU | Transmission and distribution utility | |
Time | Time Inc. | |
Time Common | Time common stock | |
Transition Agreements | Services Agreement, Employee Transition Agreement, Transitional Seconding Agreement and other agreements entered into in connection with the formation of Enable | |
Texas RE | Texas Reliability Entity | |
TW | Time Warner Inc. | |
TW Common | TW common stock | |
TWC | Time Warner Cable Inc. | |
TWC Common | TWC common stock | |
TW Securities | Charter Common, Time Common and TW Common | |
VaR | Value at Risk | |
iv
GLOSSARY (cont.) | ||
Verizon | Verizon Communications, Inc. | |
VIE | Variable interest entity | |
Vistra Energy Corp. | Texas-based energy company focused on the competitive energy and power generation markets | |
ZENS | 2.0% Zero-Premium Exchangeable Subordinated Notes due 2029 | |
2002 Act | Pipeline Safety Improvement Act of 2002 | |
2006 Act | Pipeline Inspection, Protection, Enforcement and Safety Act of 2006 | |
2011 Act | Pipeline Safety, Regulatory Certainty, and Job Creation Act of 2011 | |
2016 Act | Protecting our Infrastructure of Pipelines and Enhancing Safety Act of 2016 | |
v
CAUTIONARY STATEMENT REGARDING FORWARD-LOOKING INFORMATION
From time to time we make statements concerning our expectations, beliefs, plans, objectives, goals, strategies, future events or performance and underlying assumptions and other statements that are not historical facts. These statements are “forward-looking statements” within the meaning of the Private Securities Litigation Reform Act of 1995. Actual results may differ materially from those expressed or implied by these statements. You can generally identify our forward-looking statements by the words “anticipate,” “believe,” “continue,” “could,” “estimate,” “expect,” “forecast,” “goal,” “intend,” “may,” “objective,” “plan,” “potential,” “predict,” “projection,” “should,” “target,” “will” or other similar words.
We have based our forward-looking statements on our management’s beliefs and assumptions based on information reasonably available to our management at the time the statements are made. We caution you that assumptions, beliefs, expectations, intentions and projections about future events may and often do vary materially from actual results. Therefore, we cannot assure you that actual results will not differ materially from those expressed or implied by our forward-looking statements.
Some of the factors that could cause actual results to differ from those expressed or implied by our forward-looking statements are described under “Risk Factors” in Item 1A and “Management’s Discussion and Analysis of Financial Condition and Results of Operations — Certain Factors Affecting Future Earnings” and “ — Liquidity and Capital Resources — Other Matters — Other Factors That Could Affect Cash Requirements” in Item 7 of this report, which discussions are incorporated herein by reference.
You should not place undue reliance on forward-looking statements. Each forward-looking statement speaks only as of the date of the particular statement, and we undertake no obligation to update or revise any forward-looking statements.
vi
PART I
Item 1. | Business |
OUR BUSINESS
Overview
We are a public utility holding company. Our operating subsidiaries own and operate electric transmission and distribution and natural gas distribution facilities, supply natural gas to commercial and industrial customers and electric and natural gas utilities and own interests in Enable as described below. Our simplified corporate structure is shown below:
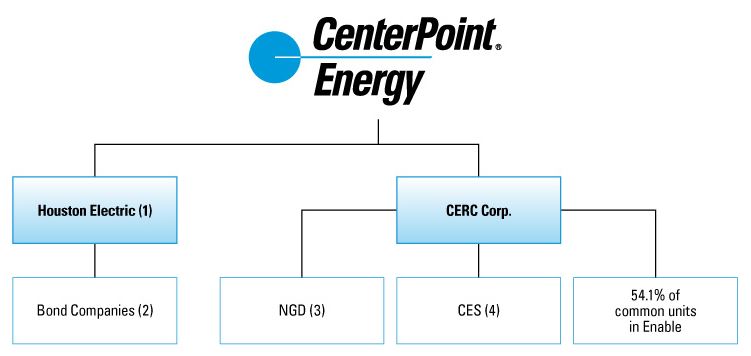
(1) | Houston Electric engages in the electric transmission and distribution business in the Texas Gulf Coast area that includes the city of Houston. |
(2) | Bond Companies are wholly-owned, bankruptcy remote entities formed solely for the purpose of purchasing and owning transition or system restoration property through the issuance of Securitization Bonds. |
(3) | NGD operates natural gas distribution systems in six states. |
(4) | CES obtains and offers competitive variable and fixed-price physical natural gas supplies and services primarily to commercial and industrial customers and electric and natural gas utilities in 33 states. |
(5) | Represents limited partner interests in Enable, which owns, operates and develops natural gas and crude oil infrastructure assets. For additional information regarding our interest in Enable, see Note 10 to our consolidated financial statements. |
1
Our reportable business segments are Electric Transmission & Distribution, Natural Gas Distribution, Energy Services, Midstream Investments and Other Operations. For a discussion of operating income by segment, see “Management’s Discussion and Analysis of Financial Condition and Results of Operations — Results of Operations by Business Segment” in Item 7 of Part II of this report. For additional information about the segments, see Note 18 to our consolidated financial statements. From time to time, we consider the acquisition or the disposition of assets or businesses.
Our principal executive offices are located at 1111 Louisiana, Houston, Texas 77002 (telephone number: 713-207-1111).
We make available free of charge on our internet website our annual report on Form 10-K, quarterly reports on Form 10-Q, current reports on Form 8-K and amendments to those reports filed or furnished pursuant to Section 13(a) or 15(d) of the Securities Exchange Act of 1934 as soon as reasonably practicable after we electronically file such reports with, or furnish them to, the SEC. Additionally, we make available free of charge on our Internet website:
• | our Code of Ethics for our Chief Executive Officer and Senior Financial Officers; |
• | our Ethics and Compliance Code; |
• | our Corporate Governance Guidelines; and |
• | the charters of the audit, compensation, finance and governance committees of our Board of Directors. |
Any shareholder who so requests may obtain a printed copy of any of these documents from us. Changes in or waivers of our Code of Ethics for our Chief Executive Officer and Senior Financial Officers and waivers of our Ethics and Compliance Code for directors or executive officers will be posted on our Internet website within five business days of such change or waiver and maintained for at least 12 months or timely reported on Item 5.05 of Form 8-K.
Our website address is www.centerpointenergy.com. Investors should also note that we announce material financial information in SEC filings, press releases and public conference calls. Based on guidance from the SEC, we may use the investor relations section of our website to communicate with our investors. It is possible that the financial and other information posted there could be deemed to be material information. Except to the extent explicitly stated herein, documents and information on our website are not incorporated by reference herein.
Electric Transmission & Distribution
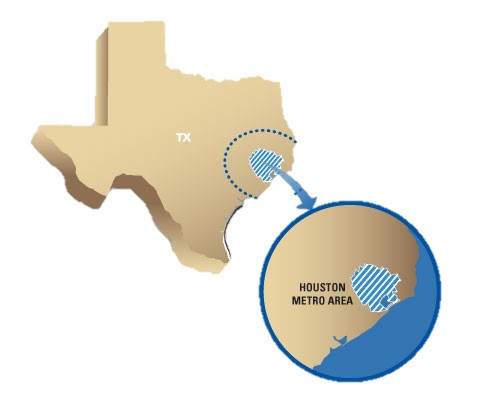
Houston Electric is a transmission and distribution electric utility that operates wholly within the state of Texas and is a member of ERCOT. ERCOT serves as the independent system operator and regional reliability coordinator for member electric power systems in most of Texas. The ERCOT market represents approximately 90% of the demand for power in Texas and is one of the nation’s largest power markets. The ERCOT market operates under the reliability standards developed by the NERC, approved by the FERC and monitored and enforced by the Texas RE. The PUCT has primary jurisdiction over the ERCOT market to ensure the adequacy and reliability of electricity supply across the state’s main interconnected power transmission grid. Neither
2
Houston Electric nor any other subsidiary of CenterPoint Energy makes direct retail or wholesale sales of electric energy or owns or operates any electric generating facilities. Houston Electric’s service territory is depicted below:
Electric Transmission
On behalf of REPs, Houston Electric delivers electricity from power plants to substations, from one substation to another and to retail electric customers taking power at or above 69 kV in locations throughout Houston Electric’s certificated service territory. Houston Electric constructs and maintains transmission facilities and provides transmission services under tariffs approved by the PUCT.
The ERCOT ISO is responsible for operating the bulk electric power supply system in the ERCOT market. Houston Electric’s transmission business, along with those of other owners of transmission facilities in Texas, supports the operation of the ERCOT ISO. Houston Electric participates with the ERCOT ISO and other ERCOT utilities to plan, design, obtain regulatory approval for and construct new transmission lines necessary to increase bulk power transfer capability and to remove existing constraints on the ERCOT transmission grid.
Electric Distribution
In ERCOT, end users purchase their electricity directly from certificated REPs. Houston Electric delivers electricity for REPs in its certificated service area by carrying lower-voltage power from the substation to the retail electric customer. Houston Electric’s distribution network receives electricity from the transmission grid through power distribution substations and delivers electricity to end users through distribution feeders. Houston Electric’s operations include construction and maintenance of distribution facilities, metering services, outage response services and call center operations. Houston Electric provides distribution services under tariffs approved by the PUCT. PUCT rules and market protocols govern the commercial operations of distribution companies and other market participants. Rates for these existing services are established pursuant to rate proceedings conducted before municipalities that have original jurisdiction and the PUCT.
Bond Companies
Houston Electric has special purpose subsidiaries consisting of the Bond Companies, which it consolidates. The consolidated special purpose subsidiaries are wholly-owned, bankruptcy remote entities that were formed solely for the purpose of purchasing and owning transition or system restoration property through the issuance of Securitization Bonds, and conducting activities incidental thereto. The Securitization Bonds are repaid through charges imposed on customers in Houston Electric’s service territory. For further discussion of the Securitization Bonds and the outstanding balances as of December 31, 2017 and 2016, see Note 13 to our consolidated financial statements.
Customers
Houston Electric serves nearly all of the Houston/Galveston metropolitan area. At December 31, 2017, Houston Electric’s customers consisted of approximately 68 REPs, which sell electricity to more than 2.4 million metered customers in Houston Electric’s certificated service area, and municipalities, electric cooperatives and other distribution companies located outside Houston Electric’s certificated service area. Each REP is licensed by, and must meet minimum creditworthiness criteria established
3
by, the PUCT. Houston Electric does not have long-term contracts with any of its customers. It operates using a continuous billing cycle, with meter readings being conducted and invoices being distributed to REPs each business day. For information regarding Houston Electric’s major customers, see Note 18 to our consolidated financial statements.
Utility Technology
Houston Electric’s Smart Grid is comprised of the AMS, IG, ADMS and private telecommunications network. Since 2009, Houston Electric has deployed fully operational advanced meters to virtually all of its 2.4 million metered customers, automated 31 substations, installed 872 IG Switching Devices on more than 200 circuits, built a wireless radio frequency mesh telecommunications network across Houston Electric’s 5,000-square mile footprint, and enabled real-time grid monitoring and control, which leverages information from smart meters and field sensors to manage system events through the ADMS. We believe that the Smart Grid is already improving electric distribution service reliability and restoration, enhancing the consumer experience, supporting the growth of renewable energy and helping the environment by reducing carbon emissions.
Competition
There are no other electric transmission and distribution utilities in Houston Electric’s service area. For another provider of transmission and distribution services to provide such services in Houston Electric’s territory, it would be required to obtain a certificate of convenience and necessity from the PUCT and, depending on the location of the facilities, may also be required to obtain franchises from one or more municipalities. We know of no other party intending to enter this business in Houston Electric’s service area at this time. Distributed generation (i.e., power generation located at or near the point of consumption) could result in a reduction of demand for Houston Electric’s distribution services but has not been a significant factor to date.
Seasonality
A significant portion of Houston Electric’s revenues is derived from rates that it collects from each REP based on the amount of electricity it delivers on behalf of that REP. Thus, Houston Electric’s revenues and results of operations are subject to seasonality, weather conditions and other changes in electricity usage, with revenues generally being higher during the warmer months.
Properties
All of Houston Electric’s properties are located in Texas. Its properties consist primarily of high-voltage electric transmission lines and poles, distribution lines, substations, service centers, service wires, telecommunications network and meters. Most of Houston Electric’s transmission and distribution lines have been constructed over lands of others pursuant to easements or along public highways and streets under franchise agreements and as permitted by law.
All real and tangible properties of Houston Electric, subject to certain exclusions, are currently subject to:
• | the lien of a Mortgage and Deed of Trust (the Mortgage) dated November 1, 1944, as supplemented; and |
• | the lien of a General Mortgage (the General Mortgage) dated October 10, 2002, as supplemented, which is junior to the lien of the Mortgage. |
For information related to debt outstanding under the Mortgage and General Mortgage, see Note 13 to our consolidated financial statements.
Electric Lines - Transmission. As of December 31, 2017, Houston Electric owned and operated the following electric transmission lines:
Circuit Miles | ||||||
Operating Voltage | Overhead Lines | Underground Lines | ||||
69 kV | 271 | 2 | ||||
138 kV | 2,198 | 24 | ||||
345 kV | 1,219 | — | ||||
3,688 | 26 | |||||
4
Electric Lines - Distribution. As of December 31, 2017, Houston Electric owned 28,883 pole miles of overhead distribution lines and 24,662 circuit miles of underground distribution lines.
Substations. As of December 31, 2017, Houston Electric owned 235 major substation sites having a total installed rated transformer capacity of 64,924 megavolt amperes.
Service Centers. As of December 31, 2017, Houston Electric operated 14 regional service centers located on a total of 292 acres of land. These service centers consist of office buildings, warehouses and repair facilities that are used in the business of transmitting and distributing electricity.
Franchises
Houston Electric holds non-exclusive franchises from certain incorporated municipalities in its service territory. In exchange for the payment of fees, these franchises give Houston Electric the right to use the streets and public rights-of-way of these municipalities to construct, operate and maintain its transmission and distribution system and to use that system to conduct its electric delivery business and for other purposes that the franchises permit. The terms of the franchises, with various expiration dates, typically range from 20 to 40 years.
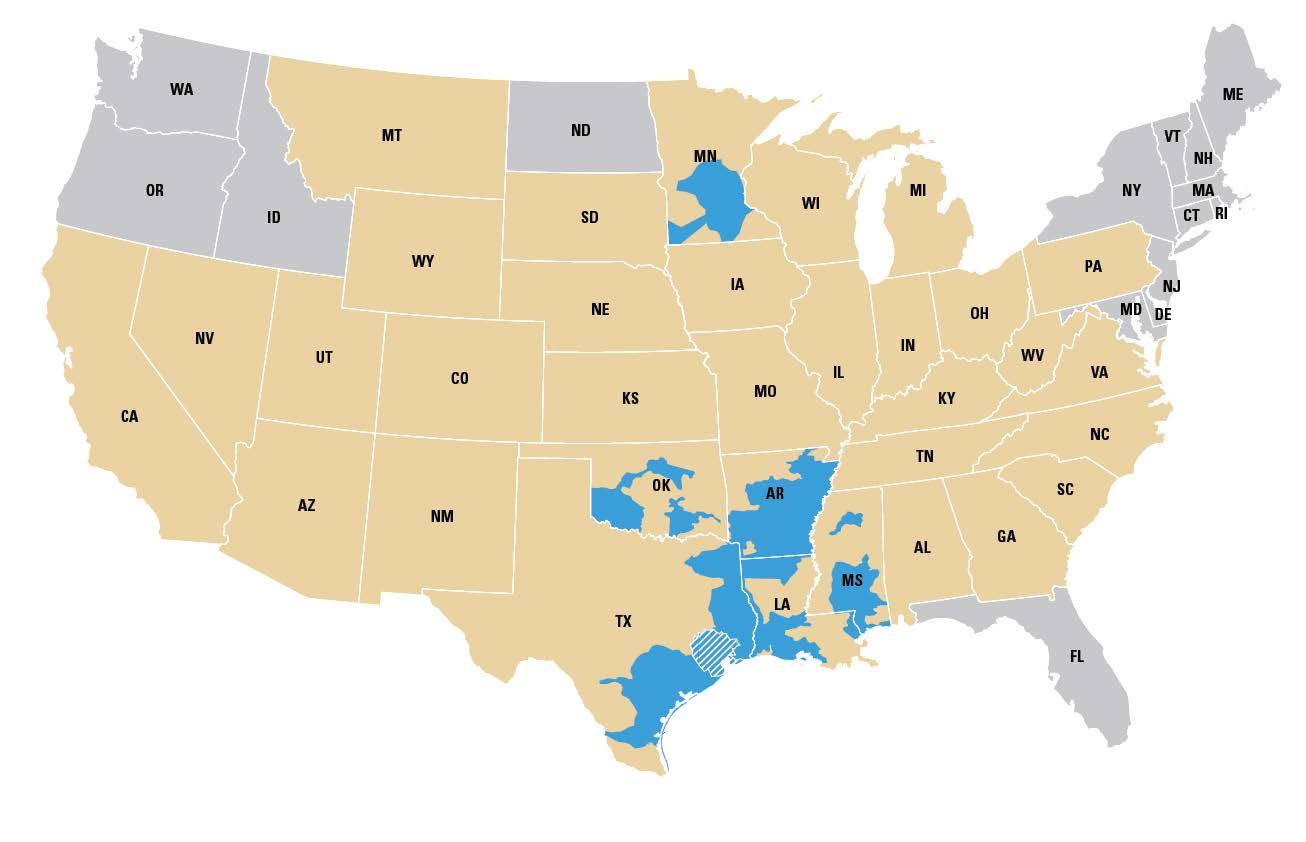
Natural Gas Distribution
CERC Corp.’s NGD engages in regulated intrastate natural gas sales to, and natural gas transportation and storage for, approximately 3.5 million residential, commercial, industrial and transportation customers in Arkansas, Louisiana, Minnesota, Mississippi, Oklahoma and Texas. The largest metropolitan areas served in each state by NGD are Houston, Texas; Minneapolis, Minnesota; Little Rock, Arkansas; Shreveport, Louisiana; Biloxi, Mississippi; and Lawton, Oklahoma. NGD also provides unregulated services in Minnesota consisting of residential appliance repair and maintenance services along with HVAC equipment sales. NGD’s service territory is depicted below:
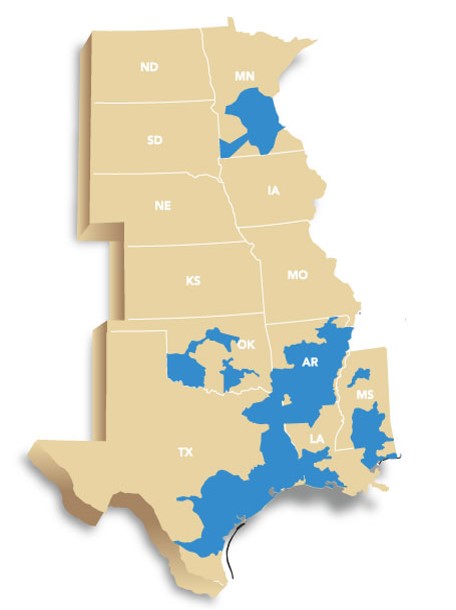

In 2017, approximately 37% of NGD’s total throughput was to residential customers and approximately 63% was to commercial and industrial and transportation customers. The table below reflects the number of NGD customers by state as of December 31, 2017:
Residential | Commercial/ Industrial | Total Customers | ||||||
Arkansas | 378,429 | 47,965 | 426,394 | |||||
Louisiana | 230,084 | 16,711 | 246,795 | |||||
Minnesota | 788,832 | 70,178 | 859,010 | |||||
Mississippi | 113,752 | 12,567 | 126,319 | |||||
Oklahoma | 89,074 | 10,758 | 99,832 | |||||
Texas | 1,612,969 | 98,472 | 1,711,441 | |||||
Total NGD | 3,213,140 | 256,651 | 3,469,791 | |||||
5
Seasonality
The demand for intrastate natural gas sales to residential customers and natural gas sales and transportation for commercial and industrial customers is seasonal. In 2017, approximately 66% of NGD’s total throughput occurred in the first and fourth quarters. These patterns reflect the higher demand for natural gas for heating purposes during the colder months.
Supply and Transportation. In 2017, NGD purchased virtually all of its natural gas supply pursuant to contracts with remaining terms varying from a few months to four years. Major suppliers in 2017 included the following:
Supplier | Percent of Supply Volumes | |
Tenaska Marketing Ventures | 18.0% | |
Macquarie Energy, LLC | 12.5% | |
BP Energy Company/BP Canada Energy Marketing | 12.1% | |
Kinder Morgan Tejas Pipeline/Kinder Morgan Texas Pipeline | 7.4% | |
CES | 5.4% | |
Mieco, Inc. | 5.0% | |
Spire Marketing, Inc. | 4.9% | |
United Energy Trading, LLC | 4.7% | |
Koch Energy Services, LLC | 4.0% | |
Cargill | 2.8% | |
Numerous other suppliers provided the remaining 23.2% of NGD’s natural gas supply requirements. NGD transports its natural gas supplies through various intrastate and interstate pipelines under contracts with remaining terms, including extensions, varying from one to fifteen years. NGD anticipates that these gas supply and transportation contracts will be renewed or replaced prior to their expiration.
NGD actively engages in commodity price stabilization pursuant to annual gas supply plans presented to and/or filed with each of its state regulatory authorities. These price stabilization activities include use of storage gas and contractually establishing structured prices (e.g., fixed price, costless collars and caps) with our physical gas suppliers. Its gas supply plans generally call for 50–75% of winter supplies to be stabilized in some fashion.
The regulations of the states in which NGD operates allow it to pass through changes in the cost of natural gas, including savings and costs of financial derivatives associated with the index-priced physical supply, to its customers under purchased gas adjustment provisions in its tariffs. Depending upon the jurisdiction, the purchased gas adjustment factors are updated periodically, ranging from monthly to semi-annually. The changes in the cost of gas billed to customers are subject to review by the applicable regulatory bodies.
NGD uses various third-party storage services or owned natural gas storage facilities to meet peak-day requirements and to manage the daily changes in demand due to changes in weather. NGD may also supplement contracted supplies and storage from time to time with stored LNG and propane-air plant production.
NGD owns and operates an underground natural gas storage facility with a capacity of 7.0 Bcf. It has a working capacity of 2.0 Bcf available for use during the heating season and a maximum daily withdrawal rate of 50 MMcf. It also owns eight propane-air plants with a total production rate of 180,000 Dth per day and on-site storage facilities for 12 million gallons of propane (1.0 Bcf natural gas equivalent). It owns a LNG plant facility with a 12 million-gallon LNG storage tank (1.0 Bcf natural gas equivalent) and a production rate of 72,000 Dth per day.
On an ongoing basis, NGD enters into contracts to provide sufficient supplies and pipeline capacity to meet its customer requirements. However, it is possible for limited service disruptions to occur from time to time due to weather conditions, transportation constraints and other events. As a result of these factors, supplies of natural gas may become unavailable from time to time, or prices may increase rapidly in response to temporary supply constraints or other factors.
NGD currently has AMAs associated with its utility distribution service in Arkansas, Louisiana, Mississippi, Oklahoma and Texas. The AMAs have varying terms, the longest of which expires in 2020. Generally, AMAs are contracts between NGD and an asset manager that are intended to transfer the working capital obligation and maximize the utilization of the assets. In these
6
agreements, NGD agrees to release transportation and storage capacity to other parties to manage natural gas storage, supply and delivery arrangements for NGD and to use the released capacity for other purposes when it is not needed for NGD. NGD is compensated by the asset manager through payments made over the life of the agreements based in part on the results of the asset optimization. NGD has an obligation to purchase its winter storage requirements that have been released to the asset manager under these AMAs. NGD has received approval from the state regulatory commissions in Arkansas, Louisiana, Mississippi and Oklahoma to retain a share of the AMA proceeds.
Assets
As of December 31, 2017, NGD owned approximately 75,000 linear miles of natural gas distribution mains, varying in size from one-half inch to 24 inches in diameter. Generally, in each of the cities, towns and rural areas served by NGD, it owns the underground gas mains and service lines, metering and regulating equipment located on customers’ premises and the district regulating equipment necessary for pressure maintenance. With a few exceptions, the measuring stations at which NGD receives gas are owned, operated and maintained by others, and its distribution facilities begin at the outlet of the measuring equipment. These facilities, including odorizing equipment, are usually located on land owned by suppliers.
Competition
NGD competes primarily with alternate energy sources such as electricity and other fuel sources. In some areas, intrastate pipelines, other gas distributors and marketers also compete directly for gas sales to end users. In addition, as a result of federal regulations affecting interstate pipelines, natural gas marketers operating on these pipelines may be able to bypass NGD’s facilities and market and sell and/or transport natural gas directly to commercial and industrial customers.
Energy Services
CERC offers competitive variable and fixed-priced physical natural gas supplies primarily to commercial and industrial customers and electric and natural gas utilities through CES and its subsidiary, CEIP. Energy Services’ service territory is depicted below:
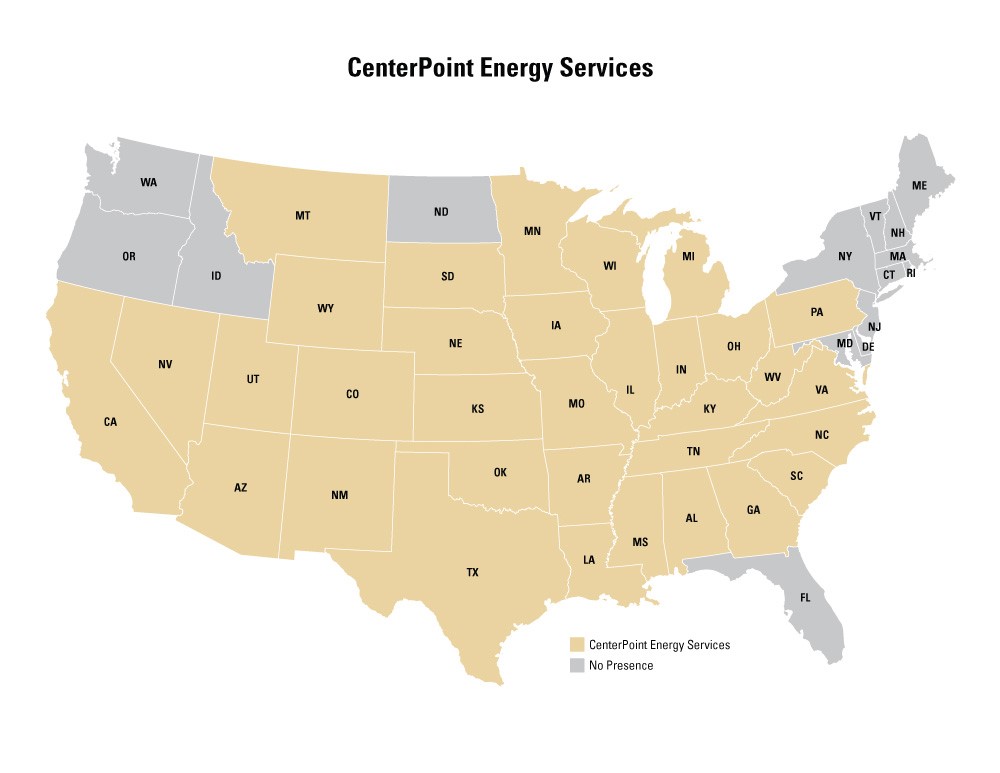
In 2017, CES marketed approximately 1,200 Bcf of natural gas, related energy services and transportation to approximately 31,000 customers (including approximately 21 Bcf to affiliates) in 33 states. CES customers vary in size from small commercial customers to large utility companies. Not included in the 2017 customer count are approximately 72,000 natural gas customers that are served under residential and small commercial choice programs invoiced by their host utility. These customers are not included in customer count so as not to distort the significant margin impact from the remaining customer base.
7
In January 2017, CES completed the acquisition of AEM, providing CES with a portfolio of industrial and large commercial customers complementary to CES’s existing customer base and strategically aligned storage and transportation assets. For further information related to this acquisition, see Note 4 to our consolidated financial statements.
CES offers a variety of natural gas management services to gas utilities, large industrial customers, electric generators, smaller commercial and industrial customers, municipalities, educational institutions, government facilities and hospitals. These services include load forecasting, supply acquisition, daily swing volume management, invoice consolidation, storage asset management, firm and interruptible transportation administration and forward price management. CES also offers a portfolio of physical delivery services designed to meet customers’ supply and price risk management needs. These customers are served directly, through interconnects with various interstate and intrastate pipeline companies, and portably, through our mobile energy solutions business.
In addition to offering natural gas management services, CES procures and optimizes transportation and storage assets. CES maintains a portfolio of natural gas supply contracts and firm transportation and storage agreements to meet the natural gas requirements of its customers. CES aggregates supply from various producing regions and offers contracts to buy natural gas with terms ranging from one month to over five years. In addition, CES actively participates in the spot natural gas markets in an effort to balance daily and monthly purchases and sales obligations. Natural gas supply and transportation capabilities are leveraged through contracts for ancillary services including physical storage and other balancing arrangements.
As described above, CES offers its customers a variety of load following services. In providing these services, CES uses its customers’ purchase commitments to forecast and arrange its own supply purchases, storage and transportation services to serve customers’ natural gas requirements. As a result of the variance between this forecast activity and the actual monthly activity, CES will either have too much supply or too little supply relative to its customers’ purchase commitments. These supply imbalances arise each month as customers’ natural gas requirements are scheduled and corresponding natural gas supplies are nominated by CES for delivery to those customers. CES’s processes and risk control environment are designed to measure and value imbalances on a real-time basis to ensure that CES’s exposure to commodity price risk is kept to a minimum. The value assigned to these imbalances is calculated daily and is known as the aggregate VaR.
Our risk control policy, which is overseen by our Risk Oversight Committee, defines authorized and prohibited trading instruments and trading limits. CES is a physical marketer of natural gas and uses a variety of tools, including pipeline and storage capacity, financial instruments and physical commodity purchase contracts, to support its sales. CES optimizes its use of these various tools to minimize its supply costs and does not engage in speculative commodity trading. The VaR limit within which CES currently operates, a $4 million maximum set by the Board of Directors, is consistent with CES’s operational objective of matching its aggregate sales obligations (including the swing associated with load following services) with its supply portfolio in a manner that minimizes its total cost of supply. In 2017, CES’s VaR averaged $0.7 million with a high of $1.8 million.
Assets
As of December 31, 2017, CEIP owned and operated over 200 miles of intrastate pipeline in Louisiana and Texas. In addition, CES leases transportation capacity on various interstate and intrastate pipelines and storage to service its shippers and end users.
Competition
CES competes with regional and national wholesale and retail gas marketers, including the marketing divisions of natural gas producers and utilities. In addition, CES competes with intrastate pipelines for customers and services in its market areas.
Midstream Investments
Our Midstream Investments business segment consists of CERC Corp.’s equity method investment in Enable. Enable is a publicly traded MLP, jointly controlled by CERC Corp. and OGE.
Enable. Enable was formed to own, operate and develop midstream energy infrastructure assets strategically located to serve its customers. Enable’s assets and operations are organized into two reportable segments: (i) gathering and processing and (ii) transportation and storage. Enable’s gathering and processing segment primarily provides natural gas and crude oil gathering and natural gas processing services to its producer customers. Enable’s transportation and storage segment provides interstate and intrastate natural gas pipeline transportation and storage services primarily to its producer, power plant, local distribution company and industrial end-user customers.
Enable’s Gathering and Processing segment. Enable owns and operates substantial natural gas and crude oil gathering and natural gas processing assets in five states. Enable’s gathering and processing operations consist primarily of natural gas gathering
8
and processing assets serving the Anadarko, Arkoma and Ark-La-Tex Basins and crude oil gathering assets serving the Williston Basin. Enable provides a variety of services to the active producers in its operating areas, including gathering, compressing, treating, and processing natural gas, fractionating NGLs, and gathering crude oil and produced water. Enable serves shale and other unconventional plays in the basins in which it operates.
Enable’s gathering and processing systems compete with gatherers and processors of all types and sizes, including those affiliated with various producers, other major pipeline companies and various independent midstream entities. In the process of selling NGLs, Enable competes against other natural gas processors extracting and selling NGLs. Enable’s primary competitors are other midstream companies who are active in the regions where it operates. Competition to gather crude oil and produced water is primarily a function of rates, terms of service, system reliability and construction cycle time. The rates and terms of service of Enable’s crude oil gathering, but not its produced water gathering, are FERC regulated. Enable’s Williston Basin gathering systems compete with other gatherers, including those affiliated with producers and other midstream companies.
Enable’s Transportation and Storage segment. Enable owns and operates interstate and intrastate transportation and storage systems across nine states. Enable’s transportation and storage systems consist primarily of its interstate systems, its intrastate system and its investment in SESH. Enable’s transportation and storage assets transport natural gas from areas of production and interconnected pipelines to power plants, local distribution companies and industrial end users as well as interconnected pipelines for delivery to additional markets. Enable’s transportation and storage assets also provide facilities where natural gas can be stored by customers.
Enable’s interstate pipelines compete with a variety of other interstate and intrastate pipelines across its operating areas. Enable’s intrastate pipeline competes with a variety of interstate and intrastate pipelines in providing transportation and storage services, including several pipelines with which it interconnects. Enable’s management views the principal elements of competition among pipelines as rates and terms, flexibility and reliability of service.
For information related to CERC Corp.’s equity method investment in Enable, see Notes 2(c), 10 and 19 to our consolidated financial statements.
Other Operations
Our Other Operations business segment includes office buildings and other real estate used in our business operations and other corporate operations that support all of our business operations.
REGULATION
We are subject to regulation by various federal, state and local governmental agencies, including the regulations described below.
Federal Energy Regulatory Commission
The FERC has jurisdiction under the NGA and the NGPA, as amended, to regulate the transportation of natural gas in interstate commerce and natural gas sales for resale in interstate commerce that are not first sales. The FERC regulates, among other things, the construction of pipeline and related facilities used in the transportation and storage of natural gas in interstate commerce, including the extension, expansion or abandonment of these facilities. The FERC has authority to prohibit market manipulation in connection with FERC-regulated transactions and to impose significant civil and criminal penalties for statutory violations and violations of the FERC’s rules or orders. Our Energy Services business segment markets natural gas in interstate commerce pursuant to blanket authority granted by the FERC.
Houston Electric is not a “public utility” under the Federal Power Act and, therefore, is not generally regulated by the FERC, although certain of its transactions are subject to limited FERC jurisdiction. The FERC has certain responsibilities with respect to ensuring the reliability of electric transmission service, including transmission facilities owned by Houston Electric and other utilities within ERCOT. The FERC has designated the NERC as the ERO to promulgate standards, under FERC oversight, for all owners, operators and users of the bulk power system (Electric Entities). The ERO and the FERC have authority to (a) impose fines and other sanctions on Electric Entities that fail to comply with approved standards and (b) audit compliance with approved standards. The FERC has approved the delegation by the NERC of authority for reliability in ERCOT to the Texas RE. Houston Electric does not anticipate that the reliability standards proposed by the NERC and approved by the FERC will have a material adverse impact on its operations. To the extent that Houston Electric is required to make additional expenditures to comply with these standards, it is anticipated that Houston Electric will seek to recover those costs through the transmission charges that are imposed on all distribution service providers within ERCOT for electric transmission provided.
9
As a public utility holding company, under the Public Utility Holding Company Act of 2005, we and our consolidated subsidiaries are subject to reporting and accounting requirements and are required to maintain certain books and records and make them available for review by the FERC and state regulatory authorities in certain circumstances.
State and Local Regulation – Electric Transmission & Distribution
Houston Electric conducts its operations pursuant to a certificate of convenience and necessity issued by the PUCT that covers its present service area and facilities. The PUCT and certain municipalities have the authority to set the rates and terms of service provided by Houston Electric under cost-of-service rate regulation. Houston Electric holds non-exclusive franchises from certain incorporated municipalities in its service territory. In exchange for payment of fees, these franchises give Houston Electric the right to use the streets and public rights-of-way of these municipalities to construct, operate and maintain its transmission and distribution system and to use that system to conduct its electric delivery business and for other purposes that the franchises permit. The terms of the franchises, with various expiration dates, typically range from 20 to 40 years.
Houston Electric’s distribution rates charged to REPs for residential customers are primarily based on amounts of energy delivered, whereas distribution rates for a majority of commercial and industrial customers are primarily based on peak demand. All REPs in Houston Electric’s service area pay the same rates and other charges for transmission and distribution services. This regulated delivery charge includes the transmission and distribution rate (which includes municipal franchise fees), a distribution recovery mechanism for recovery of incremental distribution-invested capital above that which is already reflected in the base distribution rate, a nuclear decommissioning charge associated with decommissioning the South Texas nuclear generating facility, an EECR charge, and charges associated with securitization of regulatory assets, stranded costs and restoration costs relating to Hurricane Ike. Transmission rates charged to distribution companies are based on amounts of energy transmitted under “postage stamp” rates that do not vary with the distance the energy is being transmitted. All distribution companies in ERCOT pay Houston Electric the same rates and other charges for transmission services.
For a discussion of certain of Houston Electric’s ongoing regulatory proceedings, see “Management’s Discussion and Analysis of Financial Condition and Results of Operations — Liquidity and Capital Resources — Regulatory Matters” in Item 7 of Part II of this report, which discussion is incorporated herein by reference.
State and Local Regulation – Natural Gas Distribution
In almost all communities in which NGD provides natural gas distribution services, it operates under franchises, certificates or licenses obtained from state and local authorities. The original terms of the franchises, with various expiration dates, typically range from 10 to 30 years, although franchises in Arkansas are perpetual. NGD expects to be able to renew expiring franchises. In most cases, franchises to provide natural gas utility services are not exclusive.
Substantially all of NGD is subject to cost-of-service rate regulation by the relevant state public utility commissions and, in Texas, by the Railroad Commission and those municipalities served by NGD that have retained original jurisdiction. In certain of its jurisdictions, NGD has in effect annual rate adjustment mechanisms that provide for changes in rates dependent upon certain changes in invested capital, earned returns on equity or actual margins realized.
For a discussion of certain of NGD’s ongoing regulatory proceedings, see “Management’s Discussion and Analysis of Financial Condition and Results of Operations — Liquidity and Capital Resources — Regulatory Matters” in Item 7 of Part II of this report, which discussion is incorporated herein by reference.
Department of Transportation
In December 2006, Congress enacted the 2006 Act, which reauthorized the programs adopted under the 2002 Act. These programs included several requirements related to ensuring pipeline safety, and a requirement to assess the integrity of pipeline transmission facilities in areas of high population concentration.
Pursuant to the 2006 Act, PHMSA, an agency of the DOT, issued regulations, effective February 12, 2010, requiring operators of gas distribution pipelines to develop and implement integrity management programs similar to those required for gas transmission pipelines, but tailored to reflect the differences in distribution pipelines. Operators of natural gas distribution systems were required to write and implement their integrity management programs by August 2, 2011. Our natural gas distribution systems met this deadline.
10
Pursuant to the 2002 Act and the 2006 Act, PHMSA has adopted a number of rules concerning, among other things, distinguishing between gathering lines and transmission facilities, requiring certain design and construction features in new and replaced lines to reduce corrosion and requiring pipeline operators to amend existing written operations and maintenance procedures and operator qualification programs. PHMSA also updated its reporting requirements for natural gas pipelines effective January 1, 2011.
In December 2011, Congress passed the 2011 Act. This act increased the maximum civil penalties for pipeline safety administrative enforcement actions; required the DOT to study and report on the expansion of integrity management requirements and the sufficiency of existing gathering line regulations to ensure safety; required pipeline operators to verify their records on maximum allowable operating pressure; and imposed new emergency response and incident notification requirements. In 2016, the 2016 Act reauthorized PHMSA’s pipeline safety programs through 2019 and provided limited new authority, including the ability to issue emergency orders, to set inspection requirements for certain underwater pipelines and to promulgate minimum safety standards for natural gas storage facilities, as well as to provide increased transparency into the status of as-yet-incomplete PHMSA actions required by the 2011 Act.
We anticipate that compliance with PHMSA’s regulations, performance of the remediation activities by CERC’s natural gas distribution companies and intrastate pipelines and verification of records on maximum allowable operating pressure will continue to require increases in both capital expenditures and operating costs. The level of expenditures will depend upon several factors, including age, location and operating pressures of the facilities. In particular, the cost of compliance with the DOT’s integrity management rules will depend on integrity testing and the repairs found to be necessary by such testing. Changes to the amount of pipe subject to integrity management, whether by expansion of the definition of the type of areas subject to integrity management procedures or of the applicability of such procedures outside of those defined areas, may also affect the costs we incur. Implementation of the 2011 and 2016 Acts by PHMSA may result in other regulations or the reinterpretation of existing regulations that could impact our compliance costs. In addition, we may be subject to the DOT’s enforcement actions and penalties if we fail to comply with pipeline regulations.
Midstream Investments – Rate and Other Regulation
Federal, state, and local regulation may affect certain aspects of Enable’s business.
Interstate Natural Gas Pipeline Regulation
Enable’s interstate pipeline systems—EGT, MRT and SESH—are subject to regulation by the FERC and are considered “natural gas companies” under the NGA. Under the NGA, the rates for service on Enable’s interstate facilities must be just and reasonable and not unduly discriminatory. Rate and tariff changes for these facilities can only be implemented upon approval by the FERC. Enable’s interstate pipelines business operations may be affected by changes in the demand for natural gas, the available supply and relative price of natural gas in the Mid-continent and Gulf Coast natural gas supply regions and general economic conditions.
Market Behavior Rules; Posting and Reporting Requirements
The EPAct of 2005 amended the NGA to add an anti-manipulation provision that makes it unlawful for any entity to engage in prohibited behavior as prescribed in FERC rules, which were subsequently issued in FERC Order No. 670. The EPAct of 2005 also amends the NGA and the NGPA to give the FERC authority to impose civil penalties for violations of these statutes and FERC’s regulations, rules, and orders, of up to $1.2 million per day per violation, subject to periodic adjustment to account for inflation. Should Enable fail to comply with all applicable FERC-administered statutes, rules, regulations and orders, it could be subject to substantial penalties and fines. In addition, the CFTC is directed under the CEA to prevent price manipulations for the commodity and futures markets, including the energy futures markets. Pursuant to the Dodd-Frank Act and other authority, the CFTC has adopted anti-market manipulation regulations that prohibit fraud and price manipulation in the commodity and futures markets. The CFTC also has statutory authority to seek civil penalties of up to the greater of $1.1 million or triple the monetary gain to the violator for violations of the anti-market manipulation sections of the CEA. These maximum penalty levels are also subject to periodic adjustment to account for inflation.
Intrastate Natural Gas Pipeline and Storage Regulation
Intrastate natural gas transportation is largely regulated by the state in which the transportation takes place. However, an intrastate natural gas pipeline system may transport natural gas in interstate commerce provided that the rates, terms, and conditions of such transportation service comply with Section 311 of the NGPA and Part 284 of the FERC’s regulations. Rates for service pursuant to Section 311 of the NGPA are generally subject to review and approval by the FERC at least once every five years.
11
Failure to observe the service limitations applicable to transportation services provided under Section 311, failure to comply with the rates approved by the FERC for Section 311 service, or failure to comply with the terms and conditions of service established in the pipeline’s FERC-approved Statement of Operating Conditions could result in the assertion of federal NGA jurisdiction by the FERC and/or the imposition of administrative, civil and criminal penalties, as described under “—Interstate Natural Gas Pipeline Regulation” above.
Natural Gas Gathering and Processing Regulation
Section 1(b) of the NGA exempts natural gas gathering facilities from the jurisdiction of the FERC. Although the FERC has not made formal determinations with respect to all of the facilities Enable considers to be gathering facilities, Enable believes that its natural gas pipelines meet the traditional tests that the FERC has used to determine that a pipeline is a gathering pipeline and is therefore not subject to FERC jurisdiction. The distinction, however, has been the subject of substantial litigation, and the FERC determines whether facilities are gathering facilities on a case-by-case basis, so the classification and regulation of Enable’s gathering facilities is subject to change based on future determinations.
States may regulate gathering pipelines. State regulation generally includes various safety, environmental and, in some circumstances, anti-discrimination requirements, and in some instances complaint-based rate regulation. Enable’s gathering operations may be subject to ratable take and common purchaser statutes in the states in which they operate.
Enable’s gathering operations could be adversely affected should they be subject in the future to the application of state or federal regulation of rates and services. Enable’s gathering operations could also be subject to additional safety and operational regulations relating to the design, construction, testing, operation, replacement and maintenance of gathering facilities. We cannot predict what effect, if any, such changes might have on Enable’s operations, but the industry could be required to incur additional capital expenditures and increased costs depending on future legislative and regulatory changes.
Crude Oil Gathering Regulation
Enable provides interstate transportation on its crude oil gathering system in North Dakota pursuant to a public tariff in accordance with FERC regulatory requirements. Crude oil gathering pipelines that provide interstate transportation service may be regulated as a common carrier by the FERC under the ICA, the Energy Policy Act of 1992, and the rules and regulations promulgated under those laws. The ICA and FERC regulations require that rates for interstate service pipelines that transport crude oil and refined petroleum products (collectively referred to as “petroleum pipelines”) and certain other liquids, be just and reasonable and non-discriminatory or not conferring any undue preference upon any shipper. FERC regulations also require interstate common carrier petroleum pipelines to file with the FERC and publicly post tariffs stating their interstate transportation rates and terms and conditions of service.
Safety and Health Regulation
Certain of Enable’s facilities are subject to pipeline safety regulations. PHMSA regulates safety requirements in the design, construction, operation and maintenance of jurisdictional natural gas and hazardous liquid pipeline facilities. All natural gas transmission facilities, such as Enable’s interstate natural gas pipelines, are subject to PHMSA’s regulations, but natural gas gathering pipelines are subject only to the extent they are classified as regulated gathering pipelines. In addition, several NGL pipeline facilities and crude oil pipeline facilities are regulated as hazardous liquids pipelines.
Pursuant to various federal statutes, including the NGPSA, the DOT, through PHMSA, regulates pipeline safety and integrity. NGL and crude oil pipelines are subject to regulation by PHMSA under the Hazardous Liquid Pipeline Safety Act which requires PHMSA to develop, prescribe, and enforce minimum federal safety standards for the transportation of hazardous liquids by pipeline, and comparable state statutes with respect to design, installation, testing, construction, operation, replacement and management of pipeline facilities. Should Enable fail to comply with DOT or comparable state regulations, it could be subject to penalties and fines. If future DOT pipeline regulations were to require that Enable expand its integrity management program to currently unregulated pipelines, costs associated with compliance may have a material effect on its operations.
ENVIRONMENTAL MATTERS
Our operations and the operations of Enable are subject to stringent and complex laws and regulations pertaining to the environment. As an owner or operator of natural gas pipelines, distribution systems and storage, electric transmission and distribution systems, and the facilities that support these systems, we must comply with these laws and regulations at the federal, state and local levels. These laws and regulations can restrict or impact our business activities in many ways, including, but not limited to:
12
• | restricting the way we can handle or dispose of wastes; |
• | limiting or prohibiting construction activities in sensitive areas such as wetlands, coastal regions or areas inhabited by endangered species; |
• | requiring remedial action to mitigate environmental conditions caused by our operations or attributable to former operations; |
• | enjoining the operations of facilities with permits issued pursuant to such environmental laws and regulations; and |
• | impacting the demand for our services by directly or indirectly affecting the use or price of natural gas. |
To comply with these requirements, we may need to spend substantial amounts and devote other resources from time to time to, among other activities:
• | construct or acquire new facilities and equipment; |
• | acquire permits for facility operations; |
• | modify, upgrade or replace existing and proposed equipment; and |
• | clean or decommission waste management areas, fuel storage facilities and other locations. |
Failure to comply with these laws and regulations may trigger a variety of administrative, civil and criminal enforcement measures, including the assessment of monetary penalties, the imposition of remedial actions and the issuance of orders enjoining future operations. Certain environmental statutes impose strict, joint and several liability for costs required to assess, clean up and restore sites where hazardous substances have been stored, disposed or released. Moreover, it is not uncommon for neighboring landowners and other third parties to file claims for personal injury and/or property damage allegedly caused by the release of hazardous substances or other waste products into the environment.
The recent trend in environmental regulation has been to place more restrictions and limitations on activities that may impact the environment. There can be no assurance as to the amount or timing of future expenditures for environmental compliance or remediation, and actual future expenditures may be different from the amounts we currently anticipate. We try to anticipate future regulatory requirements that might be imposed and plan accordingly to maintain compliance with changing environmental laws and regulations and to ensure the costs of such compliance are reasonable.
Based on current regulatory requirements and interpretations, we do not believe that compliance with federal, state or local environmental laws and regulations will have a material adverse effect on our business, financial position, results of operations or cash flows. In addition, we believe that our current environmental remediation activities will not materially interrupt or diminish our operational ability. We cannot assure you that future events, such as changes in existing laws, the promulgation of new laws, or the development or discovery of new facts or conditions will not cause us to incur significant costs. The following is a discussion of material current environmental and safety issues, laws and regulations that relate to our operations. We believe that we are in substantial compliance with these environmental laws and regulations.
Global Climate Change
There is increasing attention being paid in the United States and worldwide to the issue of climate change. As a result, from time to time, regulatory agencies have considered the modification of existing laws or regulations or the adoption of new laws or regulations addressing the emissions of GHG on the state, federal, or international level. Some of the proposals would require industrial sources to meet stringent new standards that would require substantial reductions in GHG emissions. CERC’s revenues, operating costs and capital requirements could be adversely affected as a result of any regulatory action that would require installation of new control technologies or a modification of its operations or would have the effect of reducing the consumption of natural gas. Our electric transmission and distribution business, in contrast to some electric utilities, does not generate electricity and thus is not directly exposed to the risk of high capital costs and regulatory uncertainties that face electric utilities that burn fossil fuels to generate electricity. Nevertheless, Houston Electric’s revenues could be adversely affected to the extent any resulting regulatory action has the effect of reducing consumption of electricity by ultimate consumers within its service territory. Likewise, incentives to conserve energy or to use energy sources other than natural gas could result in a decrease in demand for our services. Conversely, regulatory actions that effectively promote the consumption of natural gas because of its lower emissions
13
characteristics would be expected to beneficially affect CERC and its natural gas-related businesses. At this point in time, however, it would be speculative to try to quantify the magnitude of the impacts from possible new regulatory actions related to GHG emissions, either positive or negative, on our businesses.
To the extent climate changes may occur and such climate changes result in warmer temperatures in our service territories, financial results from our and Enable’s businesses could be adversely impacted. For example, CERC’s NGD could be adversely affected through lower natural gas sales and Enable’s natural gas gathering, processing and transportation and crude oil gathering businesses could experience lower revenues. On the other hand, warmer temperatures in our electric service territory may increase our revenues from transmission and distribution through increased demand for electricity for cooling. Another possible result of climate change is more frequent and more severe weather events, such as hurricanes or tornadoes. Since many of our facilities are located along or near the Gulf Coast, increased or more severe hurricanes or tornadoes could increase our costs to repair damaged facilities and restore service to our customers. When we cannot deliver electricity or natural gas to customers, or our customers cannot receive our services, our financial results can be impacted by lost revenues, and we generally must seek approval from regulators to recover restoration costs. To the extent we are unable to recover those costs, or if higher rates resulting from our recovery of such costs result in reduced demand for our services, our future financial results may be adversely impacted.
Air Emissions
Our operations are subject to the federal Clean Air Act and comparable state laws and regulations. These laws and regulations regulate emissions of air pollutants from various industrial sources, including processing plants and compressor stations, and also impose various monitoring and reporting requirements. Such laws and regulations may require pre-approval for the construction or modification of certain projects or facilities expected to produce air emissions or result in the increase of existing air emissions. We may be required to obtain and strictly comply with air permits containing various emissions and operational limitations, or utilize specific emission control technologies to limit emissions. Failure to comply with these requirements could result in monetary penalties, injunctions, conditions or restrictions on operations, and potentially criminal enforcement actions. We may be required to incur certain capital expenditures in the future for air pollution control equipment in connection with obtaining and maintaining operating permits and approvals for air emissions.
The EPA has established new air emission control requirements for natural gas and NGLs production, processing and transportation activities. Under the NESHAPS, the EPA established the RICE MACT rule. Compressors and back up electrical generators used by our Natural Gas Distribution business segment, and back up electrical generators used by our Electric Transmission & Distribution business segment, are substantially compliant with these laws and regulations.
Water Discharges
Our operations are subject to the Federal Water Pollution Control Act of 1972, as amended, also known as the Clean Water Act, and analogous state laws and regulations. These laws and regulations impose detailed requirements and strict controls regarding the discharge of pollutants into waters of the United States. The unpermitted discharge of pollutants, including discharges resulting from a spill or leak incident, is prohibited. The Clean Water Act and regulations implemented thereunder also prohibit discharges of dredged and fill material into wetlands and other waters of the United States unless authorized by an appropriately issued permit. Any unpermitted release of petroleum or other pollutants from our pipelines or facilities could result in fines or penalties as well as significant remedial obligations.
Under the Obama administration, the EPA promulgated a set of rules that included a comprehensive regulatory overhaul of defining “waters of the United States” for the purposes of determining federal jurisdiction. These regulations have the potential to affect many aspects of our water-related regulatory compliance obligations. However, the new rules were challenged in court, and the U.S. Supreme Court has recently held that any challenge to the rules must be brought in the U.S. district courts rather than directly before the U.S. courts of appeals. As a result, the new definition of the “waters of the United States” is likely to be disputed in litigation for years to come. Additionally, the Trump administration has signaled its intent to repeal and replace the Obama-era rules. Thus, the fate and content of the new regulations is currently uncertain, and it is not clear when, and even if, they will be enacted. The potential impact of any new “waters of the United States” regulations on our business, liabilities, compliance obligations or profits and revenues is uncertain at this time.
Hazardous Waste
Our operations generate wastes, including some hazardous wastes, that are subject to the federal RCRA, and comparable state laws, which impose detailed requirements for the handling, storage, treatment, transport and disposal of hazardous and solid waste. RCRA currently exempts many natural gas gathering and field processing wastes from classification as hazardous waste. Specifically, RCRA excludes from the definition of hazardous waste waters produced and other wastes associated with the
14
exploration, development or production of crude oil and natural gas. However, these oil and gas exploration and production wastes are still regulated under state law and the less stringent non-hazardous waste requirements of RCRA. Moreover, ordinary industrial wastes such as paint wastes, waste solvents, laboratory wastes and waste compressor oils may be regulated as hazardous waste. The transportation of natural gas in pipelines may also generate some hazardous wastes that would be subject to RCRA or comparable state law requirements.
Liability for Remediation
CERCLA, also known as “Superfund,” and comparable state laws impose liability, without regard to fault or the legality of the original conduct, on certain classes of persons responsible for the release of “hazardous substances” into the environment. Classes of PRPs include the current and past owners or operators of sites where a hazardous substance was released and companies that disposed or arranged for the disposal of hazardous substances at offsite locations such as landfills. Although petroleum, as well as natural gas, is expressly excluded from CERCLA’s definition of a “hazardous substance,” in the course of our ordinary operations we do, from time to time, generate wastes that may fall within the definition of a “hazardous substance.” CERCLA authorizes the EPA and, in some cases, third parties to take action in response to threats to the public health or the environment and to recover the costs they incur from the responsible classes of persons. Under CERCLA, we could potentially be subject to joint and several liability for the costs of cleaning up and restoring sites where hazardous substances have been released, for damages to natural resources, and for associated response and assessment costs, including for the costs of certain health studies.
Liability for Preexisting Conditions
For information about preexisting environmental matters, please see Note 15(d).
EMPLOYEES
As of December 31, 2017, we had 7,977 full-time employees. The following table sets forth the number of our employees by business segment as of December 31, 2017:
Business Segment | Number | Number Represented by Collective Bargaining Groups | ||||
Electric Transmission & Distribution | 2,816 | 1,452 | ||||
Natural Gas Distribution | 3,316 | 1,200 | ||||
Energy Services | 297 | — | ||||
Other Operations | 1,548 | 127 | ||||
Total | 7,977 | 2,779 | ||||
For information about the status of collective bargaining agreements, see Note 7(f) to our consolidated financial statements.
EXECUTIVE OFFICERS
(as of February 9, 2018)
Name | Age | Title | ||
Milton Carroll | 67 | Executive Chairman | ||
Scott M. Prochazka | 51 | President and Chief Executive Officer and Director | ||
William D. Rogers | 57 | Executive Vice President and Chief Financial Officer | ||
Tracy B. Bridge | 59 | Executive Vice President and President, Electric Division | ||
Scott E. Doyle | 46 | Senior Vice President, Natural Gas Distribution | ||
Joseph J. Vortherms | 57 | Senior Vice President, Energy Services | ||
Dana C. O’Brien | 50 | Senior Vice President and General Counsel | ||
Sue B. Ortenstone | 61 | Senior Vice President and Chief Human Resources Officer | ||
Milton Carroll has served on the Board of Directors of CenterPoint Energy or its predecessors since 1992. He has served as Executive Chairman of CenterPoint Energy since June 2013 and as Chairman from September 2002 until May 2013. Mr. Carroll has served as a director of Halliburton Company since 2006 and Western Gas Holdings, LLC, the general partner of Western Gas Partners, LP, since 2008. He has served as a director of Health Care Service Corporation since 1998 and as its chairman since
15
2002. He previously served as a director of LyondellBasell Industries N.V. from July 2010 to July 2016 as well as LRE GP, LLC, the general partner of LRR Energy, L.P., from November 2011 to January 2014.
Scott M. Prochazka has served as a Director and President and Chief Executive Officer (CEO) of CenterPoint Energy since January 1, 2014. He previously served as Executive Vice President and Chief Operating Officer from July 2012 to December 2013; as Senior Vice President and Division President, Electric Operations from May 2011 through July 2012; as Division Senior Vice President, Electric Operations of Houston Electric from February 2009 to May 2011; as Division Senior Vice President, Regional Operations of CERC from February 2008 to February 2009; and as Division Vice President, Customer Service Operations, from October 2006 to February 2008. He currently serves on the Boards of Directors of Enable GP, LLC, the general partner of Enable Midstream Partners, LP, Gridwise Alliance as its Chairman, Edison Electric Institute, Electric Power Research Institute, American Gas Association, Greater Houston Partnership, United Way of Houston, Junior Achievement of South Texas and the Kinder Institute Advisory Board.
William D. Rogers has served as Executive Vice President and Chief Financial Officer of CenterPoint Energy since March 2015. He previously served as Executive Vice President, Finance and Accounting from February 2015 to March 2015. Prior to joining CenterPoint Energy, Mr. Rogers was Vice President and Treasurer of American Water Works Company, Inc., the largest publicly traded U.S. water and wastewater utility company, from October 2010 to January 2015. Mr. Rogers was also the Chief Financial Officer of NV Energy, Inc., an investor-owned utility headquartered in Las Vegas serving approximately 1.5 million electric and gas customers in Nevada and with annual revenues of approximately $3 billion, from February 2007 to February 2010. He has previously served as NV Energy’s vice president of finance, risk and tax, as well as corporate treasurer. Before joining NV Energy in June 2005, Mr. Rogers was a managing director in capital markets at Merrill Lynch and prior to that in a similar role at JPMorgan Chase in New York. He currently serves on the Boards of Directors of Enable GP, LLC, the general partner of Enable Midstream Partners, LP, the West Point Association of Graduates and Sheltering Arms of New York.
Tracy B. Bridge has served as Executive Vice President and President, Electric Division since February 2014. He previously served as Senior Vice President and Division President, Electric Operations from September 2012 to February 2014; as Senior Vice President and Division President, Gas Distribution Operations from May 2011 to September 2012; as Division Senior Vice President - Support Operations from February 2008 to May 2011; and as Division Vice President Regional Operations of CERC from January 2007 to February 2008. Mr. Bridge has more than 35 years of utility experience. He currently serves as President of the Executive Committee of the Board of Directors of Rebuilding Together Houston.
Scott E. Doyle has served as Senior Vice President, Natural Gas Distribution since March 2017. With more than 20 years of utility experience, he previously served as Senior Vice President, Regulatory and Public Affairs from February 2014 to March 2017; as Division Vice President, Rates and Regulatory from April 2012 to February 2014; and as Division Vice President, Regional Operations from March 2010 to April 2012. Mr. Doyle currently serves on the board of Goodwill Industries of Houston, and he previously served on the boards of the Texas Gas Association and the Association of Electric Companies of Texas.
Joseph J. Vortherms has served as Senior Vice President, Energy Services since March 2017. He previously served as Vice President, Energy Services from November 2015 to March 2017; as Vice President, Regional Operations in Minnesota from October 2014 to November 2015; as Division Vice President, Regional Operations from April 2012 to October 2014; and as Director, Home Service Plus from January 2007 to April 2012. Mr. Vortherms currently serves on the Southern Gas Association Executive Council as well as the American Gas Association Scenario Planning Council. He previously served on the boards of the Minnesota Region American Red Cross and the Minnesota Business Partnership.
Dana C. O’Brien has served as Senior Vice President and General Counsel of CenterPoint Energy since May 2014. Additionally, she served as Corporate Secretary of the Company until October 2017. Before joining CenterPoint Energy, Ms. O’Brien was Chief Legal Officer and Chief Compliance Officer and a member of the executive board at CEVA Logistics, a Dutch-based logistics company, from August 2007 to April 2014. She previously served as the general counsel at EGL, Inc. from October 2005 to July 2007 and Quanta Services, Inc. from January 2001 to October 2005. Ms. O’Brien serves as a trustee for the Association of Women Attorneys Foundation, as a member of the Board of Directors of Ronald McDonald House Houston and as a member of the Board of Directors of Child Advocates, Inc.
Sue B. Ortenstone has served as Senior Vice President and Chief Human Resources Officer of CenterPoint Energy since February 2014. Prior to joining CenterPoint Energy, Ms. Ortenstone was Senior Vice President and Chief Administrative Officer at Copano Energy from July 2012 to May 2013. Before joining Copano, she spent more than 30 years at El Paso Corporation and served most recently as Senior Vice President and then Executive Vice President and Chief Administrative Officer from November 2003 to May 2012. Ms. Ortenstone serves on the Industrial Advisory Board in the College of Engineering at the University of Wisconsin, and until October 2017, she served on the Advisory Board for Civil, Environmental and Geologic Engineering as well. Ms. Ortenstone also serves on the Board of Trustees for Northwest Assistance Ministries of Houston.
16
Item 1A. | Risk Factors |
We are a holding company that conducts all of our business operations through subsidiaries, primarily Houston Electric and CERC. We also own interests in Enable. The following, along with any additional legal proceedings identified or incorporated by reference in Item 3 of this report, summarizes the principal risk factors associated with our holding company, the businesses conducted by our subsidiaries and our interests in Enable. However, additional risks and uncertainties either not presently known or not currently believed by management to be material may also adversely affect our businesses.
Risk Factors Associated with Our Consolidated Financial Condition
We are a holding company with no operations or operating assets of our own. As a result, we depend on distributions from our subsidiaries and from Enable to meet our payment obligations and to pay dividends on our common stock, and provisions of applicable law or contractual restrictions could limit the amount of those distributions.
We derive all of our operating income from, and hold all of our assets through, our subsidiaries, including our interests in Enable. As a result, we depend on distributions from our subsidiaries and Enable to meet our payment obligations and to pay dividends on our common stock. In general, our subsidiaries are separate and distinct legal entities and have no obligation to provide us with funds for our payment obligations, whether by dividends, distributions, loans or otherwise. In addition, provisions of applicable law, such as those limiting the legal sources of dividends, limit our subsidiaries’ and Enable’s ability to make payments or other distributions to us, and our subsidiaries or Enable could agree to contractual restrictions on their ability to make distributions. For a discussion of risks that may impact the amount of cash distributions we receive with respect to our interests in Enable, please read “ — Additional Risk Factors Affecting Our Interests in Enable Midstream Partners, LP — Our cash flows will be adversely impacted if we receive less cash distributions from Enable than we currently expect” and “ — Other Risk Factors Affecting Our Businesses or Our Interests in Enable Midstream Partners, LP — Our or Enable’s potential business strategies and strategic initiatives, including merger and acquisition activities and the disposition of assets or businesses, may not be completed or perform as expected.”
Our right to receive any assets of any subsidiary, and therefore the right of our creditors to participate in those assets, will be effectively subordinated to the claims of that subsidiary’s creditors, including trade creditors. In addition, even if we were a creditor of any subsidiary, our rights as a creditor would be subordinated to any security interest in the assets of that subsidiary and any indebtedness of the subsidiary senior to that held by us.
If we are unable to arrange future financings on acceptable terms, our ability to refinance existing indebtedness could be limited.
Our businesses are capital intensive. We depend (i) on long-term debt to finance a portion of our capital expenditures and refinance our existing debt, (ii) on short-term borrowings through our revolving credit facilities and commercial paper programs and (iii) on distributions from our interests in Enable to satisfy liquidity needs to the extent not satisfied by cash flow from our business operations; we may also depend on the net proceeds from a potential sale of common units we own in Enable. As of December 31, 2017, we had $8.8 billion of outstanding indebtedness on a consolidated basis, which includes $1.9 billion of non-recourse Securitization Bonds. As of December 31, 2017, approximately $50 million principal amount of this debt is required to be paid through 2020. This amount excludes principal repayments of approximately $1.1 billion on Securitization Bonds, for which dedicated revenue streams exist. Our future financing activities may be significantly affected by, among other things:
• | general economic and capital market conditions; |
• | credit availability from financial institutions and other lenders; |
• | volatility or fluctuations in distributions from Enable’s units or volatility in Enable’s unit price; |
• | investor confidence in us and the markets in which we operate; |
• | maintenance of acceptable credit ratings; |
• | market expectations regarding our future earnings and cash flows; |
• | our ability to access capital markets on reasonable terms; |
17
• | our exposure to GenOn (formerly known as RRI Energy, Inc., Reliant Energy and RRI), a wholly-owned subsidiary of NRG and currently the subject of bankruptcy proceedings, in connection with certain indemnification obligations; |
• | incremental collateral that may be required due to regulation of derivatives; and |
• | provisions of relevant tax and securities laws. |
As of December 31, 2017, Houston Electric had approximately $2.9 billion aggregate principal amount of general mortgage bonds outstanding under the General Mortgage, including approximately $118 million held in trust to secure pollution control bonds for which we are obligated. Additionally, as of December 31, 2017, Houston Electric had approximately $102 million aggregate principal amount of first mortgage bonds outstanding under the Mortgage. Houston Electric may issue additional general mortgage bonds on the basis of retired bonds, 70% of property additions or cash deposited with the trustee. Approximately $4.2 billion of additional first mortgage bonds and general mortgage bonds in the aggregate could be issued on the basis of retired bonds and 70% of property additions as of December 31, 2017. However, Houston Electric has contractually agreed that it will not issue additional first mortgage bonds, subject to certain exceptions.
Our current credit ratings are discussed in “Management’s Discussion and Analysis of Financial Condition and Results of Operations - Liquidity and Capital Resources — Other Matters — Impact on Liquidity of a Downgrade in Credit Ratings” in Item 7 of Part II of this report. These credit ratings may not remain in effect for any given period of time and one or more of these ratings may be lowered or withdrawn entirely by a rating agency. We note that these credit ratings are not recommendations to buy, sell or hold our securities. Each rating should be evaluated independently of any other rating. Any future reduction or withdrawal of one or more of our credit ratings could have a material adverse impact on our ability to access capital on acceptable terms.
An impairment of goodwill, long-lived assets, including intangible assets, and equity and cost method investments could reduce our earnings.
Goodwill is recorded when the purchase price of a business exceeds the fair market value of the tangible and separately measurable intangible net assets. Accounting principles generally accepted in the United States of America require us to test goodwill for impairment on an annual basis or when events or circumstances occur indicating that goodwill might be impaired. Long-lived assets, including intangible assets with finite useful lives, are reviewed for impairment whenever events or changes in circumstances indicate that the carrying amount may not be recoverable.
For investments we account for under the equity or cost method, the impairment test considers whether the fair value of such investment as a whole, not the underlying net assets, has declined and whether that decline is other than temporary. For example, if Enable’s unit price, distributions or earnings were to decline, and that decline is deemed to be other than temporary, we could determine that we are unable to recover the carrying value of our equity investment in Enable. Considerable judgment is used in determining if an impairment loss is other than temporary and the amount of any impairment. A sustained low Enable common unit price could result in our recording impairment charges in the future.
Should our annual impairment test or another periodic impairment test, as described above, indicate the fair value of our assets is less than the carrying value, we would be required to take a non-cash charge to earnings with a correlative effect on equity and balance sheet leverage as measured by debt to total capitalization. A non-cash impairment charge could materially adversely impact our results of operations and financial condition.
Increased utilization due to changing demographics, poor investment performance of the pension plan and other factors adversely affecting the calculation of pension liabilities could unfavorably impact our results of operations, liquidity and financial position.
We maintain a qualified defined benefit pension plan covering substantially all employees. Our costs of providing this plan are dependent upon a number of factors including the investment returns on plan assets, the level of interest rates used to calculate the funded status of the plan, our contributions to the plan and government regulations with respect to funding requirements and the calculation of plan liabilities. Funding requirements may increase and we may be required to make unplanned contributions in the event of a decline in the market value of plan assets, a decline in the interest rates used to calculate the present value of future plan obligations or government regulations that increase minimum funding requirements or the pension liability. In addition to affecting our funding requirements, each of these factors could adversely affect our results of operations, liquidity and financial position.
18
The costs of providing health care benefits to our employees and retirees may increase substantially and adversely affect our results of operations and financial condition.
We provide health care benefits to eligible employees and retirees through self-insured plans. In recent years, the costs of providing these benefits have risen due to increasing health care costs and increased levels of large individual health care claims and overall health care claims, and we anticipate that such costs will continue to rise. Further, the effects of health care reform or any future legislative changes could also materially affect our health care benefit programs and costs. Any potential changes and resulting cost impacts, which are likely to be passed on to us, cannot be determined with certainty at this time. Our costs of providing these benefits could also increase materially in the future should there be a material reduction in the amount of the recovery of these costs through our rates or should significant delays develop in the timing of the recovery of such costs, which could adversely affect our results of operations and liquidity.
The use of derivative contracts in the normal course of business by us, our subsidiaries or Enable could result in financial losses that could negatively impact our results of operations and those of our subsidiaries or Enable.
We and our subsidiaries use derivative instruments, such as swaps, options, futures and forwards, to manage our commodity, weather and financial market risks. Enable may also use such instruments from time to time to manage its commodity and financial market risks. We, including our subsidiaries, or Enable could recognize financial losses as a result of volatility in the market values or ineffectiveness of these contracts or should a counterparty fail to perform. Additionally, in the absence of actively quoted market prices and pricing information from external sources, the valuation of these financial instruments can involve management’s judgment or use of estimates. As a result, changes in the underlying assumptions or use of alternative valuation methods could affect the reported fair value of these contracts.
If we redeem the ZENS prior to their maturity in 2029, our ultimate tax liability and redemption payments would result in significant cash payments, which would adversely impact our cash flows. Similarly, a significant amount of exchanges of ZENS by ZENS holders could adversely impact our cash flows.
We have approximately $828 million principal amount of ZENS outstanding as of December 31, 2017. We own shares of TW Securities equal to approximately 100% of the reference shares used to calculate our obligation to the holders of the ZENS. We may redeem all of the ZENS at any time at a redemption amount per ZENS equal to the higher of the contingent principal amount per ZENS ($505 million in the aggregate, or $35.54 per ZENS, as of December 31, 2017) or the sum of the current market value of the reference shares attributable to one ZENS at the time of redemption. In the event we redeem the ZENS, in addition to the redemption amount, we would be required to pay deferred taxes related to the ZENS. Our ultimate tax liability related to the ZENS continues to increase by the amount of the tax benefit realized each year. If the ZENS had been redeemed on December 31, 2017, deferred taxes of approximately $521 million would have been payable by us in 2017, based on 2017 tax rates in effect. In addition, if all the shares of TW Securities had been sold on December 31, 2017 in order to fund the aggregate redemption amount, capital gains taxes of approximately $297 million would have been payable by us in 2017, based on 2017 tax rates in effect. Similarly, a significant amount of exchanges of ZENS by ZENS holders could adversely impact our cash flows. This could happen if our creditworthiness were to drop or the market for the ZENS were to become illiquid, or for some other reason. While funds for the payment of cash upon exchange of ZENS could be obtained from the sale of the shares of TW Securities that we own or from other sources, ZENS exchanges result in a cash outflow because tax deferrals related to the ZENS and TW Securities shares would typically cease when ZENS are exchanged and TW Securities shares are sold.
Risk Factors Affecting Our Electric Transmission & Distribution Business
Rate regulation of Houston Electric’s business may delay or deny Houston Electric’s ability to earn an expected return and fully recover its costs.
Houston Electric’s rates are regulated by certain municipalities and the PUCT based on an analysis of its invested capital, its expenses and other factors in a test year in comprehensive base rate proceedings (i.e., general rate cases) subject to periodic review and adjustment. Each of these rate proceedings is subject to third-party intervention and appeal, and the timing of a general base rate proceeding may be out of Houston Electric’s control. The rates that Houston Electric is allowed to charge may not match its costs at any given time, which is referred to as “regulatory lag.”
Though several interim rate adjustment mechanisms have been implemented to reduce the effects of regulatory lag, these adjustment mechanisms are subject to the applicable regulatory body’s approval and are subject to limitations that may reduce Houston Electric’s ability to adjust rates. For example, the DCRF mechanism adjusts an electric utility’s rates for increases in net distribution-invested capital (e.g., distribution plant and intangible plant and communication equipment) since its last comprehensive base rate proceeding, but Houston Electric may only make a DCRF filing once per calendar year. The TCOS
19
mechanism allows a transmission service provider to update its wholesale transmission rates to reflect changes in transmission-related invested capital, but is only available twice per calendar year.
Houston Electric can make no assurance that filings for such mechanisms will result in favorable adjustments to rates. Notwithstanding the application of the rate mechanisms discussed above, the regulatory process by which rates are determined is subject to change as a result of the legislative process or rulemaking, as the case may be, and may not always be available or result in rates that will produce recovery of Houston Electric’s costs or enable Houston Electric to earn an expected return. In addition, changes to the interim adjustment mechanisms could result in an increase in regulatory lag or otherwise impact Houston Electric’s ability to recover its costs in a timely manner. To the extent the regulatory process does not allow Houston Electric to make a full and timely recovery of appropriate costs, its results of operations, financial condition and cash flows could be adversely affected.
Disruptions at power generation facilities owned by third parties could interrupt Houston Electric’s sales of transmission and distribution services.
Houston Electric transmits and distributes to customers of REPs electric power that the REPs obtain from power generation facilities owned by third parties. Houston Electric does not own or operate any power generation facilities. If power generation is disrupted or if power generation capacity is inadequate, Houston Electric’s sales of transmission and distribution services may be diminished or interrupted, and its results of operations, financial condition and cash flows could be adversely affected.
Houston Electric’s revenues and results of operations are seasonal.
A significant portion of Houston Electric’s revenues is derived from rates that it collects from each REP based on the amount of electricity it delivers on behalf of such REP. Thus, Houston Electric’s revenues and results of operations are subject to seasonality, weather conditions and other changes in electricity usage, with revenues generally being higher during the warmer months. Unusually mild weather in the warmer months could diminish our results of operations and harm our financial condition. Conversely, extreme warm weather conditions could increase our results of operations in a manner that would not likely be annually recurring.
Houston Electric could be subject to higher costs and fines or other sanctions as a result of mandatory reliability standards.
The FERC has jurisdiction with respect to ensuring the reliability of electric transmission service, including transmission facilities owned by Houston Electric and other utilities within ERCOT. The FERC has designated the NERC as the ERO to promulgate standards, under FERC oversight, for all owners, operators and users of the bulk power system. The FERC has approved the delegation by the NERC of authority for reliability in ERCOT to the Texas RE, a Texas non-profit corporation. Compliance with the mandatory reliability standards may subject Houston Electric to higher operating costs and may result in increased capital expenditures. In addition, if Houston Electric were to be found to be in noncompliance with applicable mandatory reliability standards, it could be subject to sanctions, including substantial monetary penalties.
A substantial portion of Houston Electric’s receivables is concentrated in a small number of REPs, and any delay or default in such payments could adversely affect Houston Electric’s cash flows, financial condition and results of operations.
Houston Electric’s receivables from the distribution of electricity are collected from REPs that supply the electricity Houston Electric distributes to their customers. As of December 31, 2017, Houston Electric did business with approximately 68 REPs. Adverse economic conditions, structural problems in the market served by ERCOT or financial difficulties of one or more REPs could impair the ability of these REPs to pay for Houston Electric’s services or could cause them to delay such payments. Houston Electric depends on these REPs to remit payments on a timely basis. Applicable regulatory provisions require that customers be shifted to another REP or a provider of last resort if a REP cannot make timely payments. Applicable PUCT regulations significantly limit the extent to which Houston Electric can apply normal commercial terms or otherwise seek credit protection from firms desiring to provide retail electric service in its service territory, and Houston Electric thus remains at risk for payments related to services provided prior to the shift to another REP or the provider of last resort. A significant portion of Houston Electric’s billed receivables from REPs are from affiliates of NRG and Vistra Energy Corp., formerly known as TCEH Corp. Houston Electric’s aggregate billed receivables balance from REPs as of December 31, 2017 was $215 million Approximately 34% and 12% of this amount was owed by affiliates of NRG and Vistra Energy Corp., respectively. Any delay or default in payment by REPs could adversely affect Houston Electric’s cash flows, financial condition and results of operations. If a REP were unable to meet its obligations, it could consider, among various options, restructuring under the bankruptcy laws, in which event such REP might seek to avoid honoring its obligations, and claims might be made by creditors involving payments Houston Electric had received from such REP.
20
The AMS deployed throughout Houston Electric’s service territory may experience unexpected problems with respect to the timely receipt of accurate metering data.
Houston Electric has deployed an AMS throughout its service territory, which integrates equipment and computer software from various vendors to eliminate the need for physical meter readings to be taken at consumers’ premises, such as monthly readings for billing purposes and special readings associated with a customer’s change in REPs or the connection or disconnection of electric service. Unanticipated difficulties could be encountered during the operation of the AMS, including failures or inadequacy of equipment or software, difficulties in integrating the various components of the AMS, changes in technology, cyber-security issues and factors outside the control of Houston Electric, which could result in delayed or inaccurate metering data that might lead to delays or inaccuracies in the calculation and imposition of delivery or other charges, which could have a material adverse effect on Houston Electric’s results of operations, financial condition and cash flows.
Risk Factors Affecting Our Natural Gas Distribution and Energy Services Businesses
Rate regulation of CERC’s business may delay or deny CERC’s ability to earn an expected return and fully recover its costs.
CERC’s rates for NGD are regulated by certain municipalities (in Texas only) and state commissions based on an analysis of NGD’s invested capital, expenses and other factors in a test year (often either fully or partially historic) in comprehensive base rate proceedings, subject to periodic review and adjustment. Each of these proceedings is subject to third-party intervention and appeal, and the timing of a general base rate proceeding may be out of CERC’s control. Thus, the rates that CERC is allowed to charge may not match its costs at any given time, resulting in what is referred to as “regulatory lag.”
Though several interim rate adjustment mechanisms have been approved by jurisdictional regulatory authorities and implemented by NGD to reduce the effects of regulatory lag, such adjustment mechanisms are subject to the applicable regulatory body’s approval and are subject to certain limitations that may reduce NGD’s ability to adjust its rates.
Arkansas allows public utilities to elect to have their rates regulated pursuant to a FRP, providing for a utility’s base rates to be adjusted once a year. In each of Louisiana, Mississippi and Oklahoma, NGD makes annual filings utilizing various formula rate mechanisms that adjust rates based on a comparison of authorized return to actual return to achieve the allowed return rates in those jurisdictions. Additionally, in Minnesota, the MPUC implemented a full revenue decoupling pilot program, which separates approved revenues from the amount of natural gas used by its customers. The effectiveness of these filings and programs depends on the approval of the applicable state regulatory body.
In Texas, NGD’s Houston, South Texas, Beaumont/East Texas and Texas Coast divisions each submit annual GRIP filings to recover the incremental capital investments made in the preceding year. NGD must file a general rate case no later than five years after the initial GRIP implementation date.
NGD can make no assurance that filings for such mechanisms will result in favorable adjustments to rates. Notwithstanding the application of the rate mechanisms discussed above, the regulatory process by which rates are determined is subject to change as a result of the legislative process or rulemaking, as the case may be, and may not always be available or result in rates that will produce recovery of NGD’s costs or enable NGD to earn an expected return. In addition, changes to the interim adjustment mechanisms could result in an increase in regulatory lag or otherwise impact NGD’s ability to recover its costs in a timely manner. Additionally, inherent in the regulatory process is some level of risk that jurisdictional regulatory authorities may initiate investigations of the prudence of operating expenses incurred or capital investments made by NGD and deny the full recovery of NGD’s cost of service or the full recovery of incurred natural gas costs in rates. To the extent the regulatory process does not allow NGD to make a full and timely recovery of appropriate costs, its results of operations, financial condition and cash flows could be adversely affected.
Access to natural gas supplies and pipeline transmission and storage capacity are essential components of reliable service for CERC’s customers.
CERC depends on third-party service providers to maintain an adequate supply of natural gas and for available storage and intrastate and interstate pipeline capacity to satisfy NGD’s customers’ needs, all of which are critical to system reliability. CERC purchases substantially all of NGD’s natural gas supply from intrastate and interstate pipelines. If CERC is unable to secure an independent natural gas supply of its own or through its affiliates or if third-party service providers fail to timely deliver natural gas to meet NGD’s requirements, the resulting decrease in CERC’s natural gas supply in its service territories could have a material adverse effect on its results of operations, cash flows and financial condition. Additionally, a significant disruption, whether through reduced intrastate and interstate pipeline transmission or storage capacity or other events affecting natural gas supply, including, but not limited to, operational failures, hurricanes, tornadoes, floods, acts of terrorism or cyber-attacks or changes in legislative
21
or regulatory requirements, could also adversely affect CERC’s business. Further, to the extent that CERC’s natural gas requirements cannot be met through access to or continued use of existing natural gas infrastructure or if additional infrastructure, including onshore and offshore exploration and production facilities, gathering and processing systems and pipeline and storage capacity is not constructed at a rate that satisfies demand, then CERC’s NGD growth could be negatively affected.
CERC’s NGD and Energy Services business, including transportation and storage, whether through the use of AMAs or other arrangements, are subject to fluctuations in notional natural gas prices as well as geographic and seasonal natural gas price differentials, which could affect the ability of CERC’s suppliers and customers to meet their obligations or otherwise adversely affect CERC’s liquidity, results of operations and financial condition.
CERC is subject to risk associated with changes in the notional price of natural gas as well as geographic and seasonal natural gas price differentials that impact our business, including transportation and storage, whether through the use of AMAs or other arrangements. Increases in natural gas prices might affect CERC’s ability to collect balances due from its customers and, for NGD, could create the potential for uncollectible accounts expense to exceed the recoverable levels built into CERC’s tariff rates. In addition, a sustained period of high natural gas prices could (i) decrease demand for natural gas in the areas in which CERC operates, thereby resulting in decreased sales and revenues and (ii) increase the risk that CERC’s suppliers or customers fail or are unable to meet their obligations. An increase in natural gas prices would also increase CERC’s working capital requirements by increasing the investment that must be made to maintain natural gas inventory levels. Additionally, a decrease in natural gas prices could increase the amount of collateral that CERC must provide under its hedging arrangements. AMAs may be subject to regulatory approval, and such agreements may not be renewed or may be renewed with less favorable terms.
A decline in CERC’s credit rating could result in CERC having to provide collateral under its shipping or hedging arrangements or to purchase natural gas, which consequently would increase its cash requirements and adversely affect its financial condition.
If CERC’s credit rating were to decline, it might be required to post cash collateral under its shipping or hedging arrangements or to purchase natural gas. If a credit rating downgrade and the resultant cash collateral requirement were to occur at a time when CERC was experiencing significant working capital requirements or otherwise lacked liquidity, CERC’s results of operations, financial condition and cash flows could be adversely affected.
CERC’s revenues and results of operations are seasonal.
A substantial portion of CERC’s revenues is derived from natural gas sales. Thus, CERC’s revenues and results of operations are subject to seasonality, weather conditions and other changes in natural gas usage, with revenues being higher during the winter months. Unusually mild weather in the winter months could diminish our results of operations and harm our financial condition. Conversely, extreme cold weather conditions could increase our results of operations in a manner that would not likely be annually recurring.
The states in which CERC provides regulated local natural gas distribution may, either through legislation or rules, adopt restrictions regarding organization, financing and affiliate transactions that could have significant adverse impacts on CERC’s ability to operate.
From time to time, proposals have been put forth in some of the states in which CERC does business to give state regulatory authorities increased jurisdiction and scrutiny over organization, capital structure, intracompany relationships and lines of business that could be pursued by registered holding companies and their affiliates that operate in those states. Some of these frameworks attempt to regulate financing activities, acquisitions and divestitures, and arrangements between the utilities and their affiliates, and to restrict the level of non-utility business that can be conducted within the holding company structure. Additionally, they may impose record-keeping, record access, employee training and reporting requirements related to affiliate transactions and reporting in the event of certain downgrading of the utility’s credit rating.
These regulatory frameworks could have adverse effects on CERC’s ability to conduct its utility operations, to finance its business and to provide cost-effective utility service. In addition, if more than one state adopts restrictions on similar activities, it may be difficult for CERC and us to comply with competing regulatory requirements.
CERC’s businesses must compete with alternate energy sources, which could result in CERC marketing less natural gas and have an adverse impact on CERC’s results of operations, financial condition and cash flows.
CERC competes primarily with alternate energy sources such as electricity and other fuel sources. In some areas, intrastate pipelines, other natural gas distributors and marketers also compete directly with CERC for natural gas sales to end users. In
22
addition, as a result of federal regulatory changes affecting interstate pipelines, natural gas marketers operating on these pipelines may be able to bypass CERC’s facilities and market, sell and/or transport natural gas directly to commercial and industrial customers. Any reduction in the amount of natural gas marketed, sold or transported by CERC as a result of competition may have an adverse impact on CERC’s results of operations, financial condition and cash flows.
Risk Factors Affecting Our Interests in Enable Midstream Partners, LP
We hold a substantial limited partner interest in Enable (54.1% of the outstanding common units representing limited partner interests in Enable as of December 31, 2017), as well as 50% of the management rights in Enable’s general partner and a 40% interest in the incentive distribution rights held by Enable’s general partner. As of December 31, 2017, we owned an aggregate of 14,520,000 Series A Preferred Units representing limited partner interests in Enable. Accordingly, our future earnings, results of operations, cash flows and financial condition will be affected by the performance of Enable, the amount of cash distributions we receive from Enable and the value of our interests in Enable. Factors that may have a material impact on Enable’s performance and cash distributions, and, hence, the value of our interests in Enable, include the risk factors outlined below, as well as the risks described elsewhere under “Risk Factors” that are applicable to Enable.
Our cash flows will be adversely impacted if we receive less cash distributions from Enable than we currently expect.
Both CERC Corp. and OGE hold their limited partner interests in Enable in the form of common units. We also hold Series A Preferred Units in Enable. For its Series A Preferred Units, Enable is expected to pay $0.625 per Series A Preferred Unit, or $2.50 per Series A Preferred Unit on an annualized basis. However, distributions on each Series A Preferred Unit are not mandatory and are non-cumulative in the event distributions are not declared on the Series A Preferred Units. Enable is expected to pay a minimum quarterly distribution of $0.2875 per unit, or $1.15 per unit on an annualized basis, on its outstanding common units to the extent it has sufficient cash from operations after establishment of cash reserves and payment of fees and expenses, including payments to its general partner and its affiliates (referred to as “available cash”). Enable may not have sufficient available cash each quarter to enable it (i) to pay distributions on the Series A Preferred Units or (ii) maintain or increase the distributions on its common units. Additionally, distributions on the Series A Preferred Units reduce the amount of available cash Enable has to pay distributions on its common units. The amount of cash Enable can distribute on its common units and Series A Preferred Units will principally depend upon the amount of cash it generates from its operations, which will fluctuate from quarter to quarter based on, among other things:
• | the fees and gross margins it realizes with respect to the volume of natural gas, NGLs and crude oil that it handles; |
• | the prices of, levels of production of, and demand for natural gas, NGLs and crude oil; |
• | the volume of natural gas, NGLs and crude oil it gathers, compresses, treats, dehydrates, processes, fractionates, transports and stores; |
• | the relationship among prices for natural gas, NGLs and crude oil; |
• | cash calls and settlements of hedging positions; |
• | margin requirements on open price risk management assets and liabilities; |
• | the level of competition from other companies offering midstream services; |
• | adverse effects of governmental and environmental regulation; |
• | the level of its operation and maintenance expenses and general and administrative costs; and |
• | prevailing economic conditions. |
In addition, the actual amount of cash Enable will have available for distribution will depend on other factors, including:
• | the level and timing of its capital expenditures; |
• | the cost of acquisitions; |
• | its debt service requirements and other liabilities; |
23
• | fluctuations in its working capital needs; |
• | its ability to borrow funds and access capital markets; |
• | restrictions contained in its debt agreements; |
• | the amount of cash reserves established by its general partner; |
• | distributions paid on its Series A Preferred Units; |
• | any impact on cash levels should any sale of our investment in Enable occur; and |
• | other business risks affecting its cash levels. |
The amount of cash Enable has available for distribution to us on its common units and Series A Preferred Units depends primarily on its cash flow rather than on its profitability, which may prevent Enable from making distributions, even during periods in which Enable records net income.
The amount of cash Enable has available for distribution on its common units and Series A Preferred Units, depends primarily upon its cash flows and not solely on profitability, which will be affected by non-cash items. As a result, Enable may make cash distributions during periods when it records losses for financial accounting purposes and may not make cash distributions during periods when it records net earnings for financial accounting purposes.
Enable’s Series A Preferred Units are required to be redeemed in certain circumstances if they are not eligible for trading on the NYSE, and Enable may not have sufficient funds to redeem its Series A Preferred Units if required to do so.
As a holder of Enable’s Series A Preferred Units, we may request that Enable list those units for trading on the NYSE. If Enable is unable to list the Series A Preferred Units in certain circumstances, it will be required to redeem the Series A Preferred Units. There can be no assurance that Enable would have sufficient financial resources available to satisfy its obligation to redeem the Series A Preferred Units. In addition, mandatory redemption of the Series A Preferred Units could have a material adverse effect on Enable’s business, financial position, results of operations and ability to make quarterly cash distributions to its unitholders.
We are not able to exercise control over Enable, which entails certain risks.
Enable is controlled jointly by CERC Corp. and OGE, who each own 50% of the management rights in the general partner of Enable. The board of directors of Enable’s general partner is composed of an equal number of directors appointed by OGE and by us, the president and chief executive officer of Enable’s general partner and three directors who are independent as defined under the independence standards established by the NYSE. Accordingly, we are not able to exercise control over Enable.
Although we jointly control Enable with OGE, we may have conflicts of interest with Enable that could subject us to claims that we have breached our fiduciary duty to Enable and its unitholders.
CERC Corp. and OGE each own 50% of the management rights in Enable’s general partner, as well as limited partner interests in Enable, and interests in the incentive distribution rights held by Enable’s general partner. We also hold Series A Preferred Units in Enable. Conflicts of interest may arise between us and Enable and its unitholders. Our joint control of the general partner of Enable may increase the possibility of claims of breach of fiduciary or contractual duties including claims of conflicts of interest related to Enable. In resolving these conflicts, we may favor our own interests and the interests of our affiliates over the interests of Enable and its unitholders as long as the resolution does not conflict with Enable’s partnership agreement. These circumstances could subject us to claims that, in favoring our own interests and those of our affiliates, we breached a fiduciary or contractual duty to Enable or its unitholders.
Enable’s contracts are subject to renewal risks.
As contracts with its existing suppliers and customers expire, Enable negotiates extensions or renewals of those contracts or enter into new contracts with other suppliers and customers. Enable may be unable to extend or renew existing contracts or enter into new contracts on favorable commercial terms, if at all. Depending on prevailing market conditions at the time of an extension or renewal, gathering and processing customers with fee based contracts may desire to enter into contracts under different fee arrangements and gathering and processing customers with contracts that contain minimum volume commitments may desire to
24
enter into contracts without minimum volume commitments. Likewise, Enable’s transportation and storage customers may choose not to extend or renew expiring contracts based on the economics of the related areas of production. To the extent Enable is unable to renew or replace its expiring contracts on terms that are favorable, if at all, or successfully manage its overall contract mix over time, its financial position, results of operations and ability to make cash distributions could be adversely affected.
Enable depends on a small number of customers for a significant portion of its gathering and processing revenues and its transportation and storage revenues. The loss of, or reduction in volumes from, these customers could result in a decline in sales of its gathering and processing or transportation and storage services and adversely affect its financial position, results of operations and ability to make cash distributions.
For the year ended December 31, 2017, 57% of Enable’s gathered natural gas volumes were attributable to the affiliates of Continental, Vine, GeoSouthern, XTO Energy and Tapstone Energy and 51% of its transportation and storage service revenues were attributable to our affiliates or affiliates of Spire, American Electric Power Company, OGE and Continental. The loss of all or even a portion of the gathering and processing or transportation and storage services for any of these customers, the failure to extend or replace these contracts or the extension or replacement of these contracts on less favorable terms, as a result of competition or otherwise, could adversely affect Enable’s financial position, results of operations and ability to make cash distributions.
Enable’s businesses are dependent, in part, on the drilling and production decisions of others.
Enable’s businesses are dependent on the drilling and production of natural gas and crude oil. Enable has no control over the level of drilling activity in its areas of operation, or the amount of natural gas, NGL or crude oil reserves associated with wells connected to its systems. In addition, as the rate at which production from wells currently connected to its systems naturally declines over time, Enable’s gross margin associated with those wells will also decline. To maintain or increase throughput levels on its gathering and transportation systems and the asset utilization rates at its natural gas processing plants, Enable’s customers must continually obtain new natural gas, NGL and crude oil supplies. The primary factors affecting Enable’s ability to obtain new supplies of natural gas, NGLs and crude oil and attract new customers to its assets are the level of successful drilling activity near its systems, its ability to compete for volumes from successful new wells and its ability to expand its capacity as needed. If Enable is not able to obtain new supplies of natural gas, NGLs and crude oil to replace the natural decline in volumes from existing wells, throughput on its gathering, processing, transportation and storage facilities would decline, which could adversely affect its financial position, results of operations and ability to make cash distributions. Enable has no control over producers or their drilling and production decisions, which are affected by, among other things:
• | the availability and cost of capital; |
• | prevailing and projected commodity prices, including the prices of natural gas, NGLs and crude oil; |
• | demand for natural gas, NGLs and crude oil; |
• | levels of reserves; |
• | geological considerations; |
• | environmental or other governmental regulations, including the availability of drilling permits and the regulation of hydraulic fracturing; and |
• | the availability of drilling rigs and other costs of production and equipment. |
Fluctuations in energy prices can also greatly affect the development of new natural gas, NGL and crude oil reserves. Drilling and production activity generally decreases as commodity prices decrease. In general terms, the prices of natural gas, NGLs, crude oil and other hydrocarbon products fluctuate in response to changes in supply and demand, market uncertainty and a variety of additional factors that are beyond Enable’s control. Because of these and other factors, even if new reserves are known to exist in areas served by Enable’s assets, producers may choose not to develop those reserves. Declines in natural gas, NGL or crude oil prices can have a negative impact on exploration, development and production activity and, if sustained, could lead to decreases in such activity. Sustained low natural gas, NGL or crude oil prices could also lead producers to shut in production from their existing wells. Sustained reductions in exploration or production activity in Enable’s areas of operation could lead to further reductions in the utilization of its systems, which could adversely affect Enable’s financial position, results of operations and ability to make cash distributions.
25
In addition, it may be more difficult to maintain or increase the current volumes on Enable’s gathering systems and in its processing plants, as several of the formations in the unconventional resource plays in which it operates generally have higher initial production rates and steeper production decline curves than wells in more conventional basins. Should Enable determine that the economics of its gathering assets do not justify the capital expenditures needed to grow or maintain volumes associated therewith, Enable may reduce such capital expenditures, which could cause revenues associated with these assets to decline over time.
Enable’s industry is highly competitive, and increased competitive pressure could adversely affect its financial position, results of operations and ability to make cash distributions.
Enable competes with similar enterprises in its respective areas of operation. The principal elements of competition are rates, terms of service and flexibility and reliability of service. Enable’s competitors include large energy companies that have greater financial resources and access to supplies of natural gas, NGLs and crude oil than Enable. Some of these competitors may expand or construct gathering, processing, transportation and storage systems that would create additional competition for the services Enable provides to its customers. Excess pipeline capacity in the regions served by Enable’s interstate pipelines could also increase competition and adversely impact Enable’s ability to renew or enter into new contracts with respect to its available capacity when existing contracts expire. In addition, Enable’s customers that are significant producers of natural gas or crude oil may develop their own gathering, processing, transportation and storage systems in lieu of using Enable’s systems. Enable’s ability to renew or replace existing contracts with its customers at rates sufficient to maintain current revenues and cash flows could be adversely affected by the activities of its competitors and customers. Further, natural gas utilized as a fuel competes with other forms of energy available to end users, including electricity, coal and liquid fuels. Increased demand for such forms of energy at the expense of natural gas could lead to a reduction in demand for natural gas gathering, processing, transportation and storage services. All of these competitive pressures could adversely affect Enable’s financial position, results of operations and ability to make cash distributions.
Enable may not be able to recover the costs of its substantial planned investment in capital improvements and additions, and the actual cost of such improvements and additions may be significantly higher than it anticipates.
Enable’s business plan calls for investment in capital improvements and additions. In Enable’s Form 10-K for the year ended December 31, 2017, Enable stated that it expects that its expansion capital could range from approximately $450 million to $600 million and its maintenance capital could range from approximately $95 million to $125 million for the year ending December 31, 2018.
The construction of additions or modifications to Enable’s existing systems, and the construction of new midstream assets, involves numerous regulatory, environmental, political and legal uncertainties, many of which are beyond Enable’s control and may require the expenditure of significant amounts of capital, which may exceed its estimates. These projects may not be completed at the planned cost, on schedule or at all. The construction of new pipeline, gathering, treating, processing, compression or other facilities is subject to construction cost overruns due to labor costs, costs and availability of equipment and materials such as steel, labor shortages or weather or other delays, inflation or other factors, which could be material. In addition, the construction of these facilities is typically subject to the receipt of approvals and permits from various regulatory agencies. Those agencies may not approve the projects in a timely manner, if at all, or may impose restrictions or conditions on the projects that could potentially prevent a project from proceeding, lengthen its expected completion schedule and/or increase its anticipated cost. Moreover, Enable’s revenues and cash flows may not increase immediately upon the expenditure of funds on a particular project. For instance, if Enable expands an existing pipeline or constructs a new pipeline, the construction may occur over an extended period of time, and Enable may not receive any material increases in revenues or cash flows until the project is completed. In addition, Enable may construct facilities to capture anticipated future growth in production in a region in which such growth does not materialize. As a result, the new facilities may not be able to achieve Enable’s expected investment return, which could adversely affect its financial position, results of operations and ability to make cash distributions.
In connection with Enable’s capital investments, Enable may estimate, or engage a third party to estimate, potential reserves in areas to be developed prior to constructing facilities in those areas. To the extent Enable relies on estimates of future production in deciding to construct additions to its systems, those estimates may prove to be inaccurate either in volume or timing due to numerous uncertainties inherent in estimating future production. To the extent estimates of the volume of new production are inaccurate, new facilities may not be able to attract sufficient throughput to achieve expected investment return, which could adversely affect Enable’s financial position, results of operations and ability to make cash distributions. To the extent estimates in the timing of new production are inaccurate, new facilities may be constructed in advance of the actual need for capacity or may not be constructed in time to accommodate volume flows, which could adversely affect Enable’s financial position, results of operations and ability to make cash distributions. In addition, the construction of additions to existing gathering and transportation assets may require new rights-of-way prior to construction. Those rights-of-way to connect new natural gas supplies to existing
26
gathering lines may be unavailable and Enable may not be able to capitalize on attractive expansion opportunities. Additionally, it may become more expensive to obtain new rights-of-way or to renew existing rights-of-way. If the cost of renewing or obtaining new rights-of-way increases, Enable’s financial position, results of operations and ability to make cash distributions could be adversely affected.
Natural gas, NGL and crude oil prices are volatile, and changes in these prices could adversely affect Enable’s financial position, results of operations and ability to make cash distributions.
Enable’s financial position, results of operations and ability to make cash distributions could be negatively affected by adverse changes in the prices of natural gas, NGLs and crude oil depending on factors that are beyond Enable’s control. These factors include demand for these commodities, which fluctuates with changes in market and economic conditions and other factors, including the impact of seasonality and weather, general economic conditions, the level of domestic and offshore natural gas production and consumption, the availability of imported natural gas, LNG, NGLs and crude oil, actions taken by foreign natural gas and oil producing nations, the availability of local, intrastate and interstate transportation systems, the availability and marketing of competitive fuels, the impact of energy conservation efforts, technological advances affecting energy consumption and the extent of governmental regulation and taxation.
Enable’s natural gas processing arrangements expose it to commodity price fluctuations. In 2017, 7%, 35% and 58% of Enable’s processing plant inlet volumes consisted of keep-whole arrangements, percent-of-proceeds or percent-of-liquids and fee-based, respectively. If the price at which Enable sells natural gas or NGLs is less than the cost at which Enable purchases natural gas or NGLs under these arrangements, then Enable’s financial position, results of operations and ability to make cash distributions could be adversely affected.
At any given time, Enable’s overall portfolio of processing contracts may reflect a net short position in natural gas (meaning that Enable is a net buyer of natural gas) and a net long position in NGLs (meaning that Enable is a net seller of NGLs). As a result, Enable’s financial position, results of operations and ability to make cash distributions could be adversely affected to the extent the price of NGLs decreases in relation to the price of natural gas.
Enable is exposed to credit risks of its customers, and any material nonpayment or nonperformance by its customers could adversely affect its financial position, results of operations and ability to make cash distributions.
Some of Enable’s customers may experience financial problems that could have a significant effect on their creditworthiness. Severe financial problems encountered by its customers could limit Enable’s ability to collect amounts owed to it, or to enforce performance of obligations under contractual arrangements. In addition, many of Enable’s customers finance their activities through cash flow from operations, the incurrence of debt or the issuance of equity. The combination of reduction of cash flow resulting from declines in commodity prices, a reduction in borrowing bases under reserve-based credit facility and the lack of availability of debt or equity financing may result in a significant reduction of its customers’ liquidity and limit their ability to make payment or perform on their obligations to Enable. Furthermore, some of Enable’s customers may be highly leveraged and subject to their own operating and regulatory risks, which increases the risk that they may default on their obligations to Enable. Financial problems experienced by Enable’s customers could result in the impairment of its assets, reduction of its operating cash flows and may also reduce or curtail their future use of its products and services, which could reduce Enable’s revenues.
Enable provides certain transportation and storage services under fixed-price “negotiated rate” contracts that are not subject to adjustment, even if its cost to perform such services exceeds the revenues received from such contracts, and, as a result, Enable’s costs could exceed its revenues received under such contracts.
Enable has been authorized by the FERC to provide transportation and storage services at its facilities at negotiated rates. As of December 31, 2017, approximately 44% of Enable’s aggregate contracted firm transportation capacity on EGT and MRT and 44% of its aggregate contracted firm storage capacity on EGT and MRT, was subscribed under such “negotiated rate” contracts. These contracts generally do not include provisions allowing for adjustment for increased costs due to inflation, pipeline safety activities or other factors that are not tied to an applicable tracking mechanism authorized by the FERC. Successful recovery of any shortfall of revenue, representing the difference between “recourse rates” (if higher) and negotiated rates, is not assured under current FERC policies. If Enable’s costs increase and it is not able to recover any shortfall of revenue associated with its negotiated rate contracts, the cash flow realized by Enable’s systems could decrease and, therefore, the cash Enable has available for distribution could also decrease.
27
If third-party pipelines and other facilities interconnected to Enable’s gathering, processing or transportation facilities become partially or fully unavailable for any reason, Enable’s financial position, results of operations and ability to make cash distributions could be adversely affected.
Enable depends upon third-party pipelines to deliver natural gas to, and take natural gas from, its natural gas transportation systems and upon third-party pipelines to take crude oil from its crude oil gathering systems. Enable also depends on third-party facilities to transport and fractionate NGLs that are delivered to the third party at the tailgates of Enable’s processing plants. Fractionation is the separation of the heterogeneous mixture of extracted NGLs into individual components for end-use sale. For example, an outage or disruption on certain pipelines or fractionators operated by a third party could result in the shutdown of certain of Enable’s processing plants and gathering systems, and a prolonged outage or disruption could ultimately result in a reduction in the volume of natural gas Enable gathers and NGLs it is able to produce. Additionally, Enable depends on third parties to provide electricity for compression at many of its facilities. Since Enable does not own or operate any of these third-party pipelines or other facilities, their continuing operation is not within its control. If any of these third-party pipelines or other facilities become partially or fully unavailable for any reason, Enable’s financial position, results of operations and ability to make cash distributions could be adversely affected.
Enable does not own all of the land on which its pipelines and facilities are located, which could disrupt its operations.
Enable does not own all of the land on which its pipelines and facilities have been constructed, and it is therefore subject to the possibility of more onerous terms and/or increased costs to retain necessary land use if it does not have valid rights-of-way or if such rights-of-way lapse or terminate. Enable may obtain the rights to construct and operate its pipelines for a specific period of time on lands owned by governmental agencies, American Indian tribes, or other third parties, including on American Indian allotments, title to which is held in trust by the United States. A loss of these rights, through Enable’s inability to renew right-of-way contracts or otherwise, could cause it to cease operations temporarily or permanently on the affected land, increase costs related to the construction and continuing operations elsewhere and adversely affect its financial position, results of operations and ability to make cash distributions.
Enable conducts a portion of its operations through joint ventures, which subject it to additional risks that could adversely affect the success of these operations and Enable’s financial position, results of operations and ability to make cash distributions.
Enable conducts a portion of its operations through joint ventures with third parties, including Spectra Energy Partners, LP, DCP Midstream, LP, Trans Louisiana Gas Pipeline, Inc. and Pablo Gathering LLC. Enable may also enter into other joint venture arrangements in the future. These third parties may have obligations that are important to the success of the joint venture, such as the obligation to pay their share of capital and other costs of the joint venture. The performance of these third-party obligations, including the ability of the third parties to satisfy their obligations under these arrangements, is outside Enable’s control. If these parties do not satisfy their obligations under these arrangements, Enable’s business may be adversely affected.
Enable’s joint venture arrangements may involve risks not otherwise present when operating assets directly, including, for example:
• | Enable’s joint venture partners may share certain approval rights over major decisions; |
• | Enable’s joint venture partners may not pay their share of the joint venture’s obligations, leaving Enable liable for their shares of joint venture liabilities; |
• | Enable may be unable to control the amount of cash it will receive from the joint venture; |
• | Enable may incur liabilities as a result of an action taken by its joint venture partners; |
• | Enable may be required to devote significant management time to the requirements of and matters relating to the joint ventures; |
• | Enable’s insurance policies may not fully cover loss or damage incurred by both Enable and its joint venture partners in certain circumstances; |
• | Enable’s joint venture partners may be in a position to take actions contrary to its instructions or requests or contrary to its policies or objectives; and |
• | disputes between Enable and its joint venture partners may result in delays, litigation or operational impasses. |
28
The risks described above or the failure to continue Enable’s joint ventures or to resolve disagreements with its joint venture partners could adversely affect its ability to transact the business that is the subject of such joint venture, which would in turn adversely affect Enable’s financial position, results of operations and ability to make cash distributions. The agreements under which Enable formed certain joint ventures may subject it to various risks, limit the actions it may take with respect to the assets subject to the joint venture and require Enable to grant rights to its joint venture partners that could limit its ability to benefit fully from future positive developments. Some joint ventures require Enable to make significant capital expenditures. If Enable does not timely meet its financial commitments or otherwise does not comply with its joint venture agreements, its rights to participate, exercise operator rights or otherwise influence or benefit from the joint venture may be adversely affected. Certain of Enable’s joint venture partners may have substantially greater financial resources than Enable has and Enable may not be able to secure the funding necessary to participate in operations its joint venture partners propose, thereby reducing its ability to benefit from the joint venture.
Under certain circumstances, Spectra Energy Partners, LP could have the right to purchase Enable’s ownership interest in SESH at fair market value.
Enable owns a 50% ownership interest in SESH. The remaining 50% ownership interest is held by Spectra Energy Partners, LP. We own 54.1% of Enable’s common units, 100% of its Series A Preferred Units and a 40% economic interest in Enable’s general partner. Pursuant to the terms of the limited liability company agreement of SESH, as amended, if, at any time, we have a right to receive less than 50% of Enable’s distributions through our interests in Enable and its general partner, or do not have the ability to exercise certain control rights, Spectra Energy Partners, LP could have the right to purchase Enable’s interest in SESH at fair market value, subject to certain exceptions.
Enable’s ability to grow is dependent on its ability to access external financing sources.
Enable expects that it will distribute all of its “available cash” to its unitholders. As a result, Enable is expected to rely primarily upon external financing sources, including commercial bank borrowings and the issuance of debt and equity securities, to fund acquisitions and expansion capital expenditures. As a result, to the extent Enable is unable to finance growth externally, Enable’s cash distribution policy will significantly impair its ability to grow. In addition, because Enable is expected to distribute all of its available cash, its growth may not be as fast as businesses that reinvest their available cash to expand ongoing operations.
To the extent Enable issues additional units in connection with any acquisitions or expansion capital expenditures, the payment of distributions on those additional units may increase the risk that Enable will be unable to maintain or increase its per unit distribution level, which in turn may impact the available cash that it has to distribute on each unit. There are no limitations in Enable’s partnership agreement on its ability to issue additional units, including units ranking senior to the common units. The incurrence of additional commercial borrowings or other debt by Enable to finance its growth strategy would result in increased interest expense, which in turn may negatively impact the available cash that Enable has to distribute to its unitholders.
Enable depends on access to the capital markets to fund its expansion capital expenditures. Historically, unit prices of midstream master limited partnerships have experienced periods of volatility. In addition, because Enable’s common units are yield-based securities, rising market interest rates could impact the relative attractiveness of its common units to investors. As a result of capital market volatility, Enable may be unable to issue equity or debt on satisfactory terms, or at all, which may limit its ability to expand its operations or make future acquisitions.
Enable’s debt levels may limit its flexibility in obtaining additional financing and in pursuing other business opportunities.
As of December 31, 2017, Enable had approximately $2.6 billion of long-term debt outstanding, excluding the premiums on their senior notes, $405 million outstanding under its commercial paper program and $450 million outstanding under its unsecured term loan agreement dated July 31, 2015. Enable has a $1.75 billion revolving credit facility for working capital, capital expenditures and other partnership purposes, including acquisitions, of which $1.3 billion was available as of February 1, 2018. Enable has the ability to incur additional debt, subject to limitations in its credit facilities. The levels of Enable’s debt could have important consequences, including the following:
• | the ability to obtain additional financing, if necessary, for working capital, capital expenditures, acquisitions or other purposes may be impaired or the financing may not be available on favorable terms, if at all; |
• | a portion of cash flows will be required to make interest payments on the debt, reducing the funds that would otherwise be available for operations, future business opportunities and distributions; |
29
• | Enable’s debt level will make it more vulnerable to competitive pressures or a downturn in its business or the economy generally; and |
• | Enable’s debt level may limit its flexibility in responding to changing business and economic conditions. |
Enable’s ability to service its debt will depend upon, among other things, its future financial and operating performance, which will be affected by prevailing economic conditions, commodity prices and financial, business, regulatory and other factors, some of which are beyond Enable’s control. If operating results are not sufficient to service current or future indebtedness, Enable may be forced to take actions such as reducing distributions, reducing or delaying business activities, acquisitions, investments or capital expenditures, selling assets, restructuring or refinancing debt, or seeking additional equity capital. These actions may not be effected on satisfactory terms, or at all.
Enable’s credit facilities contain operating and financial restrictions, including covenants and restrictions that may be affected by events beyond Enable’s control, which could adversely affect its financial condition, results of operations and ability to make distributions.
Enable’s credit facilities contain customary covenants that, among other things, limit its ability to:
• | permit its subsidiaries to incur or guarantee additional debt; |
• | incur or permit to exist certain liens on assets; |
• | dispose of assets; |
• | merge or consolidate with another company or engage in a change of control; |
• | enter into transactions with affiliates on non-arm’s length terms; and |
• | change the nature of its business. |
Enable’s credit facilities also require it to maintain certain financial ratios. Enable’s ability to meet those financial ratios can be affected by events beyond its control, and we cannot assure you that it will meet those ratios. In addition, Enable’s credit facilities contain events of default customary for agreements of this nature.
Enable’s ability to comply with the covenants and restrictions contained in its credit facilities may be affected by events beyond its control, including prevailing economic, financial and industry conditions. If market or other economic conditions deteriorate, Enable’s ability to comply with these covenants may be impaired. If Enable violates any of the restrictions, covenants, ratios or tests in its credit facilities, a significant portion of its indebtedness may become immediately due and payable. In addition, Enable’s lenders’ commitments to make further loans to it under the revolving credit facility may be suspended or terminated. Enable might not have, or be able to obtain, sufficient funds to make these accelerated payments.
Enable may be unable to obtain or renew permits necessary for its operations, which could inhibit its ability to do business.
Performance of Enable’s operations requires that Enable obtain and maintain a number of federal and state permits, licenses and approvals with terms and conditions containing a significant number of prescriptive limits and performance standards in order to operate. All of these permits, licenses, approval limits and standards require a significant amount of monitoring, record keeping and reporting in order to demonstrate compliance with the underlying permit, license, approval limit or standard. Noncompliance or incomplete documentation of Enable’s compliance status may result in the imposition of fines, penalties and injunctive relief. A decision by a government agency to deny or delay the issuance of a new or existing material permit or other approval, or to revoke or substantially modify an existing permit or other approval, could adversely affect Enable’s ability to initiate or continue operations at the affected location or facility and on its financial condition, results of operations and ability to make cash distributions.
Additionally, in order to obtain permits and renewals of permits and other approvals in the future, Enable may be required to prepare and present data to governmental authorities pertaining to the potential adverse impact that any proposed pipeline or processing-related activities may have on the environment, individually or in the aggregate, including on public and Indian lands. Certain approval procedures may require preparation of archaeological surveys, endangered species studies and other studies to assess the environmental impact of new sites or the expansion of existing sites. Compliance with these regulatory requirements is expensive and significantly lengthens the time required to prepare applications and to receive authorizations.
30
Costs of compliance with existing environmental laws and regulations are significant, and the cost of compliance with future environmental laws and regulations may adversely affect Enable’s financial position, results of operations and ability to make cash distributions.
Enable is subject to extensive federal, state and local environmental statutes, rules and regulations relating to air quality, water quality, waste management, wildlife conservation, natural resources and health and safety that could, among other things, delay or increase its costs of construction, restrict or limit the output of certain facilities and/or require additional pollution control equipment and otherwise increase costs. For instance, in May 2016, the EPA issued final New Source Performance Standards governing methane emissions imposing more stringent controls on methane and volatile organic compounds emissions at new and modified oil and natural gas production, processing, storage, and transmission facilities. These rules have required changes to Enable’s operations, including the installation of new equipment to control emissions. Additionally, several states are pursuing similar measures to regulate emissions of methane from new and existing sources. There are significant capital, operating and other costs associated with compliance with these environmental statutes, rules and regulations. Future federal and state regulations relating to Enable’s gathering and processing, transmission, and storage operations remain a possibility and could result in increased compliance costs on its operations. Furthermore, if new or more stringent federal, state or local legal restrictions are adopted in areas where its oil and natural gas exploration and production customers operate, they could incur potentially significant added costs to comply with such requirements, experience delays or curtailment in the pursuit of exploration, development, or production activities, and perhaps even be precluded from drilling wells, some or all of which could adversely affect demand for Enable’s services to those customers.
There is inherent risk of the incurrence of environmental costs and liabilities in Enable’s operations due to its handling of natural gas, NGLs, crude oil and produced water, as well as air emissions related to its operations and historical industry operations and waste disposal practices. These matters are subject to stringent and complex federal, state and local laws and regulations governing environmental protection, including the discharge of materials into the environment and the protection of plants, wildlife, and natural and cultural resources. These laws and regulations can restrict or impact Enable’s business activities in many ways, such as restricting the way it can handle or dispose of wastes or requiring remedial action to mitigate pollution conditions that may be caused by its operations or that are attributable to former operators. Joint and several strict liability may be incurred, without regard to fault, under certain of these environmental laws and regulations in connection with discharges or releases of wastes on, under or from Enable’s properties and facilities, many of which have been used for midstream activities for a number of years, oftentimes by third parties not under its control. Private parties, including the owners of the properties through which Enable’s gathering and transportation systems pass and facilities where its wastes are taken for reclamation or disposal, may also have the right to pursue legal actions to enforce compliance, as well as to seek damages for non-compliance, with environmental laws and regulations or for personal injury or property damage. For example, an accidental release from one of Enable’s pipelines could subject it to substantial liabilities arising from environmental cleanup and restoration costs, claims made by neighboring landowners and other third parties for personal injury and property damage and fines or penalties for related violations of environmental laws or regulations. Enable may be unable to recover these costs from insurance. Moreover, the possibility exists that stricter laws, regulations or enforcement policies could significantly increase compliance costs and the cost of any remediation that may become necessary. Further, stricter requirements could negatively impact Enable’s customers’ production and operations, resulting in less demand for its services.
Increased regulation of hydraulic fracturing and waste water injection wells could result in reductions or delays in natural gas production by Enable’s customers, which could adversely affect its financial position, results of operations and ability to make cash distributions.
Hydraulic fracturing is common practice that is used by many of Enable’s customers to stimulate production of natural gas and crude oil from dense subsurface rock formations. The hydraulic fracturing process involves the injection of water, sand, and chemicals under pressure into targeted subsurface formations to fracture the surrounding rock and stimulate production. Hydraulic fracturing typically is regulated by state oil and natural gas commissions. In addition, certain federal agencies have proposed additional laws and regulations to more closely regulate the hydraulic fracturing process. In past sessions, Congress has considered, but not passed, legislation to provide for federal regulation of hydraulic fracturing under the Safe Drinking Water Act and to require disclosure of the chemicals used in the hydraulic fracturing process. The EPA has issued the Safe Water Drinking Act permitting guidance for hydraulic fracturing operations involving the use of diesel fuel in fracturing fluids in those states where the EPA is the permitting authority.
Some states have adopted, and other states have considered adopting, legal requirements that could impose more stringent permitting, public disclosure or well construction requirements on hydraulic fracturing activities. Local government also may seek to adopt ordinances within their jurisdictions regulating the time, place and manner of drilling activities in general or hydraulic fracturing activities in particular, in some cases banning hydraulic fracturing entirely. If new or more stringent federal, state or local legal restrictions relating to the hydraulic fracturing process are adopted in areas where Enable’s oil and natural gas exploration
31
and production customers operate, they could incur potentially significant added costs to comply with such requirements, experience delays or curtailment in the pursuit of exploration, development, or production activities, and perhaps even be precluded from drilling wells, some or all of which activities could adversely affect demand for Enable’s services to those customers.
State and federal regulatory agencies recently have focused on a possible connection between the operation of injection wells used for oil and gas waste disposal and seismic activity. Similar concerns have been raised that hydraulic fracturing may also contribute to seismic activity. When caused by human activity, such events are called induced seismicity. In March 2016, the United States Geological Survey identified six states with the most significant hazards from induced seismicity, including Oklahoma, Kansas, Texas, Colorado, New Mexico, and Arkansas. In March 2017, the United States Geological Survey produced an updated seismic hazard survey that forecasted lower earthquake rates in regions of induced activity, but still showed significantly elevated hazards in the central and eastern United States. In light of these concerns, some state regulatory agencies have modified their regulations or issued orders to address induced seismicity. For example, the OCC has implemented volume reduction plans, and at times required shut-ins, for disposal wells injecting wastewater from oil and gas operations into the Arbuckle formation. In December 2016, the OCC also released well completion seismicity guidelines for operators in the South Central Oklahoma Oil Province and the Sooner Trend Anadarko Basin Canadian and Kingfisher Counties that call for hydraulic fracturing operations to be suspended following earthquakes of certain magnitudes in the vicinity. Certain environmental and other groups have also suggested that additional federal, state and local laws and regulations may be needed to more closely regulate the hydraulic fracturing process. Enable cannot predict whether additional federal, state or local laws or regulations applicable to hydraulic fracturing will be enacted in the future and, if so, what actions any such laws or regulations would require or prohibit. Increased regulation and attention given to induced seismicity could lead to greater opposition to, and litigation concerning, oil and gas activities utilizing hydraulic fracturing or injection wells for waste disposal. Additional legislation or regulation could also lead to operational delays or increased operating costs for Enable’s customers, which in turn could reduce the demand for Enable’s services.
Other governmental agencies, including the DOE, have evaluated or are evaluating various other aspects of hydraulic fracturing. These ongoing or proposed studies, depending on their degree of pursuit and any meaningful results obtained, could spur initiatives to further regulate hydraulic fracturing under the Safe Drinking Water Act or other regulatory mechanisms.
Enable’s operations are subject to extensive regulation by federal, state and local regulatory authorities. Changes or additional regulatory measures adopted by such authorities could adversely affect Enable’s financial position, results of operations and ability to make cash distributions.
The rates charged by several of Enable’s pipeline systems, including for interstate gas transportation service provided by its intrastate pipelines, are regulated by the FERC. Enable’s pipeline operations that are not regulated by the FERC may be subject to state and local regulation applicable to intrastate natural gas transportation services and crude oil gathering services. The relevant states in which Enable operates include North Dakota, Oklahoma, Arkansas, Louisiana, Texas, Missouri, Kansas, Mississippi, Tennessee and Illinois.
The FERC and state regulatory agencies also regulate other terms and conditions of the services Enable may offer. If one of these regulatory agencies, on its own initiative or due to challenges by third parties, were to lower its tariff rates or deny any rate increase or other material changes to the types, or terms and conditions, of service Enable might propose or offer, the profitability of Enable’s pipeline businesses could suffer. If Enable were permitted to raise its tariff rates for a particular pipeline, there might be significant delay between the time the tariff rate increase is approved and the time that the rate increase actually goes into effect, which could also limit its profitability. Furthermore, competition from other pipeline systems may prevent Enable from raising its tariff rates even if regulatory agencies permit it to do so. The regulatory agencies that regulate Enable’s systems periodically implement new rules, regulations and terms and conditions of services subject to their jurisdiction. New initiatives or orders may adversely affect the rates charged for Enable’s services or otherwise adversely affect its financial position, results of operations and cash flows and ability to make cash distributions. Further, should Enable fail to comply with all applicable FERC-administered statutes, rules, regulations and orders, it could be subject to substantial penalties and fines.
A change in the jurisdictional characterization of some of Enable’s assets by federal, state or local regulatory agencies or a change in policy by those agencies may result in increased regulation of its assets, which may cause its revenues to decline and operating expenses to increase.
Enable’s natural gas gathering and intrastate transportation operations are generally exempt from the jurisdiction of the FERC under the NGA, but FERC regulation may indirectly impact these businesses and the markets for products derived from these businesses. The FERC’s policies and practices across the range of its oil and natural gas regulatory activities, including, for example, its policies on interstate open access transportation, ratemaking, capacity release, and market center promotion may indirectly affect intrastate markets. In recent years, the FERC has pursued pro-competitive policies in its regulation of interstate oil and
32
natural gas pipelines. However, we cannot assure you that the FERC will continue to pursue this approach as it considers matters such as pipeline rates and rules and policies that may indirectly affect the intrastate natural gas transportation business. Although the FERC has not made a formal determination with respect to all of Enable’s facilities it considers to be gathering facilities, Enable believes that its natural gas gathering pipelines meet the traditional tests that the FERC has used to determine that a pipeline is a gathering pipeline and are therefore not subject to FERC jurisdiction. The distinction between FERC-regulated transmission services and federally unregulated gathering services, however, has been the subject of substantial litigation, and the FERC determines whether facilities are gathering facilities on a case-by-case basis, so the classification and regulation of Enable’s gathering facilities is subject to change based on future determinations by the FERC, the courts or Congress. If the FERC were to consider the status of an individual facility and determine that the facility and/or services provided by it are not exempt from FERC regulation under the NGA and that the facility provides interstate service, the rates for, and terms and conditions of, services provided by such facility would be subject to regulation by the FERC under the NGA or the NGPA. Such regulation could decrease revenue, increase operating costs, and, depending upon the facility in question, could adversely affect Enable’s financial condition, results of operations and ability to make cash distributions. In addition, if any of Enable’s facilities were found to have provided services or otherwise operated in violation of the NGA or the NGPA, this could result in the imposition of substantial civil penalties, as well as a requirement to disgorge revenues collected for such services in excess of the maximum rates established by the FERC.
Natural gas gathering may receive greater regulatory scrutiny at the state level; therefore, Enable’s natural gas gathering operations could be adversely affected should they become subject to the application of state regulation of rates and services. Enable’s gathering operations could also be subject to safety and operational regulations relating to the design, construction, testing, operation, replacement and maintenance of gathering facilities. We cannot predict what effect, if any, such changes might have on Enable’s operations, but Enable could be required to incur additional capital expenditures and increased costs depending on future legislative and regulatory changes.
Other Risk Factors Affecting Our Businesses or Our Interests in Enable Midstream Partners, LP
We are subject to operational and financial risks and liabilities arising from environmental laws and regulations.
Our operations and the operations of Enable are subject to stringent and complex laws and regulations pertaining to the environment. As an owner or operator of natural gas pipelines, distribution systems and storage, electric transmission and distribution systems, and the facilities that support these systems, we must comply with these laws and regulations at the federal, state and local levels. These laws and regulations can restrict or impact our business activities in many ways, such as:
• | restricting the way we can handle or dispose of wastes; |
• | limiting or prohibiting construction activities in sensitive areas such as wetlands, coastal regions, or areas inhabited by endangered species; |
• | requiring remedial action to mitigate environmental conditions caused by our operations, or attributable to former operations; |
• | enjoining the operations of facilities with permits issued pursuant to such environmental laws and regulations; and |
• | impacting the demand for our services by directly or indirectly affecting the use or price of natural gas. |
To comply with these requirements, we may need to spend substantial amounts and devote other resources from time to time to:
• | construct or acquire new facilities and equipment; |
• | acquire permits for facility operations; |
• | modify or replace existing and proposed equipment; and |
• | clean or decommission waste management areas, fuel storage facilities and other locations. |
Failure to comply with these laws and regulations may trigger a variety of administrative, civil and criminal enforcement measures, including the assessment of monetary penalties, the imposition of remedial actions, and the issuance of orders enjoining future operations. Certain environmental statutes impose strict joint and several liability for costs required to clean and restore sites where hazardous substances have been stored, disposed or released. Moreover, it is not uncommon for neighboring landowners
33
and other third parties to file claims for personal injury and property damage allegedly caused by the release of hazardous substances or other waste products into the environment.
The recent trend in environmental regulation has been to place more restrictions and limitations on activities that may impact the environment, and thus there can be no assurance as to the amount or timing of future expenditures for environmental compliance or remediation, and actual future expenditures may be greater than the amounts we currently anticipate.
Our insurance coverage may not be sufficient. Insufficient insurance coverage and increased insurance costs could adversely impact our results of operations, financial condition and cash flows.
We currently have general liability and property insurance in place to cover certain of our facilities in amounts that we consider appropriate. Such policies are subject to certain limits and deductibles and do not include business interruption coverage. Insurance coverage may not be available in the future at current costs or on commercially reasonable terms, and the insurance proceeds received for any loss of, or any damage to, any of our facilities may not be sufficient to restore the loss or damage without negative impact on our results of operations, financial condition and cash flows.
In common with other companies in its line of business that serve coastal regions, Houston Electric does not have insurance covering its transmission and distribution system, other than substations, because Houston Electric believes it to be cost prohibitive and believes insurance capacity to be limited. In the future, Houston Electric may not be able to recover the costs incurred in restoring its transmission and distribution properties following hurricanes or other disasters through issuance of storm restoration bonds or a change in its regulated rates or otherwise, or any such recovery may not be timely granted. Therefore, Houston Electric may not be able to restore any loss of, or damage to, any of its transmission and distribution properties without negative impact on its results of operations, financial condition and cash flows.
Our operations and Enable’s operations are subject to all of the risks and hazards inherent in the gathering, processing, transportation and storage of natural gas and crude oil, including:
• | damage to pipelines and plants, related equipment and surrounding properties caused by hurricanes, tornadoes, floods, fires, earthquakes and other natural disasters, acts of terrorism and actions by third parties; |
• | inadvertent damage from construction, vehicles, farm and utility equipment; |
• | leaks of natural gas, NGLs, crude oil and other hydrocarbons or losses of natural gas, NGLs and crude oil as a result of the malfunction of equipment or facilities; |
• | ruptures, fires and explosions; and |
• | other hazards that could also result in personal injury and loss of life, pollution and suspension of operations. |
These risks could result in substantial losses due to personal injury and/or loss of life, severe damage to and destruction of property, plant and equipment and pollution or other environmental damage. These risks may also result in curtailment or suspension of our or Enable’s operations. A natural disaster or other hazard affecting the areas in which we or Enable operate could have a material adverse effect on our or Enable’s operations.
Enable is not fully insured against all risks inherent in its business. Enable currently has general liability and property insurance in place to cover certain of its facilities in amounts that Enable considers appropriate. Such policies are subject to certain limits and deductibles. Enable does not have business interruption insurance coverage for all of its operations. Insurance coverage may not be available in the future at current costs or on commercially reasonable terms, and the insurance proceeds received for any loss of, or any damage to, any of Enable’s facilities may not be sufficient to restore the loss or damage without negative impact on its results of operations and its ability to make cash distributions.
We, Houston Electric and CERC could incur liabilities associated with businesses and assets that we have transferred to others.
Under some circumstances, we, Houston Electric and CERC could incur liabilities associated with assets and businesses we, Houston Electric and CERC no longer own. These assets and businesses were previously owned by Reliant Energy, a predecessor of Houston Electric, directly or through subsidiaries and include:
34
• | merchant energy, energy trading and REP businesses transferred to RRI or its subsidiaries in connection with the organization and capitalization of RRI prior to its initial public offering in 2001 and now owned by affiliates of NRG; and |
• | Texas electric generating facilities transferred to a subsidiary of Texas Genco in 2002, later sold to a third party and now owned by an affiliate of NRG. |
In connection with the organization and capitalization of RRI (now GenOn) and Texas Genco (now an affiliate of NRG), those companies and/or their subsidiaries assumed liabilities associated with various assets and businesses transferred to them and agreed to certain indemnity agreements of CenterPoint Energy entities. Such indemnities have applied in cases such as the litigation arising out of sales of natural gas in California and other markets (the last remaining case involving us is now on appeal, following the district court’s summary judgment in favor of CES, a subsidiary of CERC Corp.) and various asbestos and other environmental matters that arise from time to time. In June 2017, GenOn and various affiliates filed for protection under Chapter 11 of the U.S. Bankruptcy Code. In December 2017, GenOn received court approval of a restructuring plan and is expected to emerge from Chapter 11 in mid-2018. We, CERC and CES submitted proofs of claim in the bankruptcy proceedings to protect our indemnity rights. If any of the indemnifying entities were unable to meet their indemnity obligations or satisfy a liability that has been assumed in the gas market manipulation litigation, we, Houston Electric or CERC could incur liability and be responsible for satisfying the liability.
In connection with our sale of Texas Genco, the separation agreement was amended to provide that Texas Genco would no longer be liable for, and we would assume and agree to indemnify Texas Genco against, liabilities that Texas Genco originally assumed in connection with its organization to the extent, and only to the extent, that such liabilities are covered by certain insurance policies held by us, and in certain of the asbestos lawsuits we have agreed to continue to defend such claims to the extent they are covered by insurance maintained by us, subject to reimbursement of the costs of such defense by an NRG affiliate.
Cyber-attacks, physical security breaches, acts of terrorism or other disruptions could adversely impact our or Enable’s reputation, results of operations, financial condition and/or cash flows.
We and Enable are subject to cyber and physical security risks related to adversaries attacking information technology systems, network infrastructure, technology and facilities used to conduct almost all of our and Enable’s business which includes (i) managing operations and other business processes and (ii) protecting sensitive information maintained in the normal course of business. For example, the operation of our electric transmission and distribution system is dependent on not only physical interconnection of our facilities but also on communications among the various components of our system. This reliance on information and communication between and among those components has increased since deployment of smart meters and the intelligent grid. Similarly, our and Enable’s business operations are interconnected with external networks and facilities. The distribution of natural gas to our customers requires communications with Enable’s pipeline facilities and third-party systems. The gathering, processing and transportation of natural gas from Enable’s gathering, processing and pipeline facilities and crude oil gathering pipeline systems also rely on communications among its facilities and with third-party systems that may be delivering natural gas or crude oil into or receiving natural gas or crude oil and other products from Enable’s facilities. Disruption of those communications, whether caused by physical disruption such as storms or other natural disasters, by failure of equipment or technology or by manmade events, such as cyber-attacks or acts of terrorism, may disrupt our or Enable’s ability to conduct operations and control assets.
Cyber-attacks and unauthorized access could also result in the loss, or unauthorized use, of confidential, proprietary or critical infrastructure data or security breaches of other information technology systems that could disrupt operations and critical business functions, adversely affect reputation, increase costs and subject us or Enable to possible legal claims and liability. Further, third parties, including vendors, suppliers and contractors, who perform certain services for us or administer and maintain our sensitive information, could also be targets of cyber-attacks and unauthorized access. Neither we nor Enable is fully insured against all cyber-security risks, any of which could adversely affect our reputation and could have a material adverse effect on either our or Enable’s results of operations, financial condition and/or cash flows.
In addition, our and Enable’s critical energy infrastructure may be targets of terrorist activities that could disrupt our respective business operations. In January 2017, the DOE’s Quadrennial Energy Review reported that cyber threats to the electricity system are increasing in sophistication, magnitude and frequency. Any such disruptions could result in significant costs to repair damaged facilities and implement increased security measures, which could have a material adverse effect on either our or Enable’s results of operations, financial condition and/or cash flows.
35
Failure to maintain the security of personally identifiable information could adversely affect us.
In connection with our business we collect and retain personally identifiable information (e.g., information of our customers, shareholders, suppliers and employees), and there is an expectation that we will adequately protect that information. The U.S. regulatory environment surrounding information security and privacy is increasingly demanding. A significant theft, loss or fraudulent use of the personally identifiable information we maintain, or of our data, by cyber-crime or otherwise could adversely impact our reputation and could result in significant costs, fines and litigation.
Our results of operations, financial condition and cash flows may be adversely affected if we are unable to successfully operate our facilities or perform certain corporate functions.
Our performance depends on the successful operation of our facilities. Operating these facilities involves many risks, including:
• | operator error or failure of equipment or processes, including failure to follow appropriate safety protocols; |
• | the handling of hazardous equipment or materials that could result in serious personal injury, loss of life and environmental and property damage; |
• | operating limitations that may be imposed by environmental or other regulatory requirements; |
• | labor disputes; |
• | information technology or financial system failures, including those due to the implementation and integration of new technology, that impair our information technology infrastructure, reporting systems or disrupt normal business operations; |
• | information technology failure that affects our ability to access customer information or causes us to lose confidential or proprietary data that materially and adversely affects our reputation or exposes us to legal claims; and |
• | catastrophic events such as fires, earthquakes, explosions, leaks, floods, droughts, hurricanes, terrorism, pandemic health events or other similar occurrences, which may require participation in mutual assistance efforts by us or other utilities to assist in power restoration efforts. |
Such events may result in a decrease or elimination of revenue from our facilities, an increase in the cost of operating our facilities or delays in cash collections, any of which could have a material adverse effect on our results of operations, financial condition and/or cash flows.
Our success depends upon our ability to attract, effectively transition, motivate and retain key employees and identify and develop talent to succeed senior management.
We depend on our senior executive officers and other key personnel. Our success depends on our ability to attract, effectively transition and retain key personnel. The inability to recruit and retain or effectively transition key personnel or the unexpected loss of key personnel may adversely affect our operations. In addition, because of the reliance on our management team, our future success depends in part on our ability to identify and develop talent to succeed senior management. The retention of key personnel and appropriate senior management succession planning will continue to be critically important to the successful implementation of our strategies.
Failure to attract and retain an appropriately qualified workforce could adversely impact our results of operations.
Our business is dependent on our ability to recruit, retain, and motivate employees. Certain circumstances, such as an aging workforce without appropriate replacements, a mismatch of existing skillsets to future needs, or the unavailability of contract resources may lead to operating challenges such as a lack of resources, loss of knowledge or a lengthy time period associated with skill development. Our costs, including costs to replace employees, productivity costs and safety costs, may rise. Failure to hire and adequately train replacement employees, including the transfer of significant internal historical knowledge and expertise to the new employees, or the future availability and cost of contract labor may adversely affect the ability to manage and operate our business. If we are unable to successfully attract and retain an appropriately qualified workforce, our results of operations could be negatively affected.
36
Climate change legislation and regulatory initiatives could result in increased operating costs and reduced demand for our or Enable’s services.
Regulatory agencies have from time to time considered adopting legislation, including modification of existing laws and regulations, to reduce GHGs, and there continues to be a wide-ranging policy and regulatory debate, both nationally and internationally, regarding the potential impact of GHGs and possible means for their regulation. Efforts have been made and continue to be made in the international community toward the adoption of international treaties or protocols that would address global climate change issues.
Following a finding by the EPA that certain GHGs represent an endangerment to human health, the EPA adopted two sets of rules regulating GHG emissions under the Clean Air Act, one that requires a reduction in emissions of GHGs from motor vehicles and another that regulates emissions of GHGs from certain large stationary sources. The EPA has also expanded its existing GHG emissions reporting requirements. These permitting and reporting requirements could lead to further regulation of GHGs by the EPA. As a distributor and transporter of natural gas, or a consumer of natural gas in its pipeline and gathering businesses, CERC’s or Enable’s revenues, operating costs and capital requirements, as applicable, could be adversely affected as a result of any regulatory action that would require installation of new control technologies or a modification of its operations or would have the effect of reducing the consumption of natural gas. Our electric transmission and distribution business, in contrast to some electric utilities, does not generate electricity and thus is not directly exposed to the risk of high capital costs and regulatory uncertainties that face electric utilities that burn fossil fuels to generate electricity. Nevertheless, Houston Electric’s revenues could be adversely affected to the extent any resulting regulatory action has the effect of reducing consumption of electricity by ultimate consumers within its service territory. Likewise, incentives to conserve energy or use energy sources other than natural gas could result in a decrease in demand for our services.
Climate changes could adversely impact financial results from our and Enable’s businesses and result in more frequent and more severe weather events which could adversely affect the results of operations of our businesses.
If climate changes occur that result in warmer temperatures in our service territories, financial results from our and Enable’s businesses could be adversely impacted. For example, CERC’s NGD could be adversely affected through lower natural gas sales and Enable’s natural gas gathering, processing and transportation and crude oil gathering businesses could experience lower revenues. Another possible result of climate change is more frequent and more severe weather events, such as hurricanes or tornadoes. Since many of our facilities are located along or near the Gulf Coast, increased or more severe hurricanes or tornadoes could increase our costs to repair damaged facilities and restore service to our customers. When we cannot deliver electricity or natural gas to customers or our customers cannot receive our services, our financial results can be impacted by lost revenues, and we generally must seek approval from regulators to recover restoration costs. To the extent we are unable to recover those costs, or if higher rates resulting from our recovery of such costs result in reduced demand for our services, our future financial results may be adversely impacted.
We are uncertain how state commissions and local municipalities may require us to respond to the effects of the recent comprehensive tax reform legislation, and these regulatory requirements may adversely affect our results of operations, financial condition and cash flows.
On December 22, 2017, President Trump signed into law comprehensive tax reform legislation informally called the Tax Cuts and Jobs Act, or TCJA, which resulted in significant changes to federal tax laws effective January 1, 2018, including, but not limited to, a reduction in the corporate income tax rate.
For Houston Electric and NGD, federal income tax expense is included in the rates approved by state commissions and local municipalities and charged by those utilities to consumers. When Houston Electric and NGD have general rate cases and other periodic rate adjustments, we expect the lower corporate tax expense resulting from the TCJA (which includes determining the treatment of EDIT), along with other increases and decreases in our revenue requirements, to be incorporated into Houston Electric’s and NGD’s future rates. Nevertheless, regulators may require us to respond to the TCJA in other ways, including through faster recoveries of reductions in federal income tax expense, accounting orders to reflect a liability to return to customers in future rate proceedings, accelerated returns to consumers of previously collected deferred federal income taxes, increased funding of infrastructure upgrades, or offsets of future rate increases. The effect on us of any potential return of tax savings resulting from the TCJA to consumers may differ depending on how each regulatory body requires us to return such savings.
On January 25, 2018, the PUCT issued an accounting order in Project No. 47945 directing electric utilities, including Houston Electric, to record as a regulatory liability (1) the difference between revenues collected under existing rates and revenues that would have been collected had the existing rates been set using the recently approved federal income tax rates and (2) the balance of EDIT that now exists because of the reduction in federal income tax rates. On February 13, 2018, Houston Electric and other
37
likely parties to a future rate case announced a settlement that requires Houston Electric to make (i) a TCOS filing by February 20, 2018 to reflect the change in the federal income tax rate for Houston Electric’s transmission rate base through July 31, 2017 and account for certain EDIT (and such filing was timely submitted), (ii) a DCRF filing in April 2018 to reflect the change in the federal income tax rate for Houston Electric’s distribution rate base through December 31, 2017 and (iii) a full rate case filing by April 30, 2019. The settlement was presented to the PUCT during its open meeting on February 15, 2018. In response to the settlement, the PUCT did not proceed with a prior proposal to require Houston Electric to file a rate case in the summer of 2018. The PUCT also amended its prior accounting order to remove the requirement that utilities include carrying costs in the new regulatory liability.
We can provide no assurances on how any regulatory body will ultimately require us to act. As such, we are currently unable to determine the impact of these potential regulatory actions in response to the enactment of the TCJA, which may adversely affect our results of operations, financial condition and cash flows.
In addition, the TCJA also includes a variety of other changes, such as a limitation on the tax deductibility of interest expense and acceleration of business asset expensing, among others. Several provisions of the TCJA are not generally applicable to the public utility industry, including the limitation on the tax deductibility of interest expense and the acceleration of business asset expensing. We continue to assess the impact that the TCJA may have on our future results of operations, financial condition and cash flows, which impact may adversely affect our future results of operations, financial condition and cash flows.
CERC and Enable may incur significant costs and liabilities resulting from pipeline integrity and other similar programs and related repairs.
Certain of CERC’s and Enable’s pipeline operations are subject to pipeline safety laws and regulations. The DOT’s PHMSA has adopted regulations requiring pipeline operators to develop integrity management programs, including more frequent inspections and other measures, for transportation pipelines located in “high consequence areas,” which are those areas where a leak or rupture could do the most harm. The regulations require pipeline operators, including CERC and Enable, to, among other things:
• | perform ongoing assessments of pipeline integrity; |
• | develop a baseline plan to prioritize the assessment of a covered pipeline segment; |
• | identify and characterize applicable threats that could impact a high consequence area; |
• | improve data collection, integration, and analysis; |
• | develop processes for performance management, record keeping, management of change and communication; |
• | repair and remediate pipelines as necessary; and |
• | implement preventive and mitigating action. |
Failure to comply with PHMSA or comparable state pipeline safety regulations could result in a number of consequences that may have an adverse effect on CERC’s and Enable’s operations. Both CERC and Enable incur significant costs associated with their compliance with existing PHMSA and comparable state regulations, which may not be recoverable in rates.
Changes to pipeline safety laws and regulations that result in more stringent or costly safety standards could have a significant adverse effect on CERC and Enable. For example, in January 2017, PHMSA announced the issuance of the Pipeline Safety: Safety of Hazardous Liquids Pipelines final rule. The final rule extends regulatory reporting requirements to additional liquid gathering lines, requires additional event-driven and periodic inspections, requires use of leak detection systems on additional hazardous liquid pipelines, modifies repair criteria, and requires certain pipelines to eventually accommodate inline inspection tools. It is unclear when or if this rule will go into effect as, on January 20, 2017, the Trump Administration requested that all regulations that had been sent to the Office of the Federal Register, but not yet published, be immediately withdrawn for further review, which is currently in progress. These proposals, if finalized, would impose additional costs on CERC and Enable.
In March 2016, PHMSA issued a notice of proposed rulemaking detailing proposed revisions to the safety standards applicable to natural gas transmission and gathering pipelines. The proposed rules include significant modifications which, if adopted, will result in significant operational and integrity management changes. These include requiring reconfirmation of the Maximum Allowable Operating Pressures in pipelines without reliable records, creating new material verification procedures, adding a new
38
moderate consequence area, and tightening repair criteria for pipelines in both high and moderate consequence areas. Other modifications include adding record-keeping and data collection obligations, and new requirements for monitoring gas quality and managing corrosion. The proposed rules also would expand the scope of gas gathering lines subject to PHMSA regulation, including imposing minimum safety standards on certain larger, currently exempt, gathering lines, while subjecting all gathering-line operators to recordkeeping and annual reporting requirements from which they are currently exempt. Other proposed changes, such as the modification to the definition of a transmission line, some record-keeping requirements, and some material verification obligations also may impact distribution pipelines although PHMSA states that such far-reaching applicability is not its intent. This rule is also currently under evaluation, and PHMSA is expected to issue a final rule in the third quarter of 2018 at the earliest. Because the impact of these proposed rules remains uncertain, we are still monitoring and evaluating the effect of these proposed requirements on operations.
On December 14, 2016, PHMSA announced an interim final rule to impose industry-developed recommendations as enforceable safety standards for downhole (underground) equipment, including wells, wellbore tubing, and casing, at both interstate and intrastate underground natural gas storage facilities. States may also impose more stringent standards on intrastate storage facilities. Both CERC and Enable own and operate underground storage facilities that will be subject to this rule’s provisions, which include procedures and practices for operations, maintenance, threat identification, monitoring, assessment, site security, emergency response and preparedness, training and recordkeeping. Although not yet finalized, the interim rule went into effect on January 18, 2017, with a compliance deadline of January 18, 2018. PHMSA determined, however, that it will not issue enforcement citations to any operators for violations of those provisions of the interim final rule that had previously been non-mandatory provisions of American Petroleum Institute Recommended Practices 1170 and 1171 until one year after PHMSA issues a final rule, which has not yet been issued. This matter remains ongoing and subject to future PHMSA determinations. CERC and Enable will continue to monitor developments and assess the potential impact of any modifications to this rule.
Proposed rulemakings such as those discussed above could expand the scope of natural gas and hazardous liquids integrity management programs and other pipeline safety regulations to include additional requirements or previously exempt pipelines. CERC and Enable have not estimated the cost of complying with any proposed changes to the regulations administered by PHMSA or state pipeline safety regulators.
Aging infrastructure may lead to increased costs and disruptions in operations that could negatively impact our financial results.
We have risks associated with aging infrastructure assets. The age of certain of our assets may result in a need for replacement, or higher level of maintenance costs as a result of our risk based federal and state compliant integrity management programs. Failure to achieve timely recovery of these expenses could adversely impact revenues and could result in increased capital expenditures or expenses.
The operation of our facilities depends on good labor relations with our employees.
Several of our businesses have entered into and have in place collective bargaining agreements with different labor unions. There are seven separate bargaining units in CenterPoint Energy, each with a unique collective bargaining agreement. In 2017, CERC entered into renegotiated collective bargaining agreements with United Steelworkers Local 227 and United Steelworkers Local 13-1, which are scheduled to expire in June and July of 2022, respectively. The collective bargaining agreements with Gas Workers Union Local 340, IBEW Local 66 and Local 949 are each scheduled to expire in 2020, and the collective bargaining agreements with Professional Employees International Union Local 12 are scheduled to expire in 2021. Any failure to reach an agreement on new labor contracts or to negotiate these labor contracts might result in strikes, boycotts or other labor disruptions. These potential labor disruptions could have a material adverse effect on our businesses, results of operations and/or cash flows. Labor disruptions, strikes or significant negotiated wage and benefit increases, whether due to union activities, employee turnover or otherwise, could have a material adverse effect on our businesses, results of operations and/or cash flows.
Our businesses will continue to have to adapt to technological change and may not be successful or may have to incur significant expenditures to adapt to technological change.
We operate in businesses that require sophisticated data collection, processing systems, software and other technology. Some of the technologies supporting the industries we serve are changing rapidly and increasing in complexity. New technologies will emerge or grow that may be superior to, or may not be compatible with, some of our existing technologies, and may require us to make significant expenditures so that we can continue to provide cost-effective and reliable methods of energy delivery. Among such technological advances are distributed generation resources (e.g., private solar), energy storage devices and more energy-efficient buildings and products designed to reduce consumption. As these technologies become a more cost-competitive option
39
over time, whether through cost effectiveness or government incentives and subsidies, certain customers may choose to meet their own energy needs and subsequently decrease usage of our systems and services.
Our future success will depend, in part, on our ability to anticipate and adapt to these technological changes in a cost-effective manner and to offer, on a timely basis, reliable services that meet customer demands and evolving industry standards. If we fail to adapt successfully to any technological change or obsolescence, fail to obtain access to important technologies or incur significant expenditures in adapting to technological change, or if implemented technology does not operate as anticipated, our businesses, operating results, financial condition and cash flows could be materially and adversely affected.
Our or Enable’s potential business strategies and strategic initiatives, including merger and acquisition activities and the disposition of assets or businesses, may not be completed or perform as expected.
From time to time, we and Enable have made and may continue to make acquisitions or divestitures of businesses and assets, form joint ventures or undertake restructurings. However, suitable acquisition candidates or potential buyers may not continue to be available on terms and conditions we or Enable, as the case may be, find acceptable, or the expected benefits of completed acquisitions may not be realized fully or at all, or may not be realized in the anticipated timeframe. If we or Enable are unable to make acquisitions or if those acquisitions do not perform as anticipated, our and Enable’s future growth may be adversely affected.
Any completed or future acquisitions involve substantial risks, including the following:
• | acquired businesses or assets may not produce revenues, earnings or cash flow at anticipated levels; |
• | acquired businesses or assets could have environmental, permitting or other problems for which contractual protections prove inadequate; |
• | we or Enable may assume liabilities that were not disclosed to us, that exceed our estimates, or for which our rights to indemnification from the seller are limited; |
• | we or Enable may be unable to integrate acquired businesses successfully and realize anticipated economic, operational and other benefits in a timely manner, which could result in substantial costs and delays or other operational, technical or financial problems; and |
• | acquisitions, or the pursuit of acquisitions, could disrupt ongoing businesses, distract management, divert resources and make it difficult to maintain current business standards, controls and procedures. |
In February 2016, we announced that we were evaluating strategic alternatives for our investment in Enable, including a sale or spin-off qualifying under Section 355 of the U.S. Internal Revenue Code. We have determined that we will no longer pursue a spin option at this time. More recently, we announced that late-stage discussions with a third party regarding a transaction involving our investment in Enable had terminated because an agreement on mutually acceptable terms could not be reached. We may reduce our ownership in Enable over time through sales in the public equity markets, or otherwise, of the common units we hold, subject to market conditions. Although a transaction for all our interests in Enable is not viable at this time, we may pursue such a transaction if it is viable in the future. Our ability to execute any sale of common units is subject to a number of uncertainties, including the timing, pricing and terms of any such sale. Any sales of our common units could have an adverse impact on the price of Enable common units or on any trading market for Enable common units. Further, our sales of Enable common units may have an adverse impact on Enable’s ability to issue equity on satisfactory terms, or at all, which may limit its ability to expand operations or make future acquisitions. Any reduction in our interest in Enable would result in decreased distributions from Enable, which may reduce our operating income and adversely impact our ability to meet our payment obligations and pay dividends on our common stock. For a further discussion, please read “— Risk Factors Affecting Our Interests in Enable Midstream Partners, LP — Enable’s ability to grow is dependent on its ability to access external financing sources.”
There can be no assurances that we will engage in any specific action or that any sale transaction or any sale of common units in the public equity markets or otherwise will be completed, and we do not intend to disclose further developments unless and until our board of directors approves a specific action or as otherwise required by applicable law or NYSE regulations. Any sale transaction or sale of common units in the public equity markets or otherwise may involve significant costs and expenses, including, in connection with any public offering, a significant underwriting discount. We may not realize any or all of the anticipated strategic, financial, operational or other benefits from any completed sale or reduction in our investment in Enable.
40
We are involved in numerous legal proceedings, the outcome of which are uncertain, and resolutions adverse to us could negatively affect our financial results.
We are subject to numerous legal proceedings, the most significant of which are summarized in Note 15 of our consolidated financial statements. Litigation is subject to many uncertainties, and we cannot predict the outcome of all matters with assurance. Final resolution of these matters may require additional expenditures over an extended period of time that may be in excess of established insurance or reserves and may have a material adverse effect on our financial results.
We are exposed to risks related to reduction in energy consumption due to factors including unfavorable economic conditions in our service territories, energy efficiency initiatives and use of alternative technologies.
Our businesses are affected by reduction in energy consumption due to factors including economic climate in our service territories, energy efficiency initiatives and use of alternative technologies, which could impact our ability to grow our customer base and our rate of growth. Declines in demand for electricity as a result of economic downturns in our regulated electric service territory will reduce overall sales and lessen cash flows, especially as industrial customers reduce production and, therefore, consumption of electricity. Although Houston Electric is subject to regulated allowable rates of return and recovery of certain costs under periodic adjustment clauses, overall declines in electricity sold as a result of economic downturn or recession could reduce revenues and cash flows, thereby diminishing results of operations. Additionally, prolonged economic downturns that negatively impact our results of operations and cash flows could result in future material impairment charges to write-down the carrying value of certain assets, including goodwill, to their respective fair values.
For example, our electric business is largely concentrated in Houston, Texas, where a higher percentage of employment is tied to the energy sector relative to other regions of the country. During 2015 and 2016, the rate of growth in employment in Houston declined in connection with the significant decline in energy and commodity prices over that period. Relatively low commodity prices compared to pre-2015 levels continued in 2017, and we expect such relatively low prices to continue or slightly improve in 2018. In the event economic conditions further decline, the rate of growth in Houston and the other areas in which we operate may also deteriorate. Increases in customer defaults or delays in payment due to liquidity constraints could negatively impact our cash flows and financial condition.
Growth in customer accounts and growth of customer usage each directly influence demand for electricity and the need for additional delivery facilities. Customer growth and customer usage are affected by a number of factors outside our control, such as mandated energy efficiency measures, demand-side management goals, distributed generation resources and economic and demographic conditions, such as population changes, job and income growth, housing starts, new business formation and the overall level of economic activity.
Certain regulatory and legislative bodies have introduced or are considering requirements and/or incentives to reduce energy consumption by certain dates. Additionally, technological advances driven by federal laws mandating new levels of energy efficiency in end-use electric devices or other improvements in or applications of technology could lead to declines in per capita energy consumption.
Some or all of these factors, could result in a lack of growth or decline in customer demand for electricity or number of customers, and may result in our failure to fully realize anticipated benefits from significant capital investments and expenditures which could have a material adverse effect on their financial position, results of operations and cash flows.
Furthermore, we currently have energy efficiency riders in place to recover the cost of energy efficiency programs. Should we be required to invest in conservation measures that result in reduced sales from effective conservation, regulatory lag in adjusting rates for the impact of these measures could have a negative financial impact.
If we fail to maintain an effective system of internal controls, our ability to accurately report our financial condition, results of operations or cash flows or prevent fraud may be adversely affected. As a result, investors could lose confidence in our financial reporting, which could impact our businesses and the trading price of our securities.
Effective internal controls are necessary for us to provide reliable financial reports, effectively prevent fraud and operate successfully as a public company. If our efforts to maintain an effective system of internal controls are not successful, we are unable to maintain adequate controls over our financial reporting and processes in the future or we are unable to comply with our obligations under Section 404 of the Sarbanes-Oxley Act of 2002, our operating results could be harmed or we may fail to meet our reporting obligations. Ineffective internal controls also could cause investors to lose confidence in our reported financial information, which would likely have a negative effect on the trading price of our securities.
41
Our businesses may be adversely affected by the intentional misconduct of our employees.
We are committed to living our core values of safety, integrity, accountability, initiative and respect and complying with all applicable laws and regulations. Despite that commitment and our efforts to prevent misconduct, it is possible for employees to engage in intentional misconduct, fail to uphold our core values, and violate laws and regulations for individual gain through contract or procurement fraud, misappropriation, bribery or corruption, fraudulent related-party transactions and serious breaches of our Ethics and Compliance Code and Standards of Conduct/Business Ethics policy, among other policies. If such intentional misconduct by employees should occur, it could result in substantial liability, higher costs, increased regulatory scrutiny and negative public perceptions, any of which could have a material adverse effect on our results of operations, financial condition and cash flows.
Item 1B. | Unresolved Staff Comments |
None.
Item 2. | Properties |
Character of Ownership
We lease or own our principal properties in fee, including our corporate office space and various real property. Most of our electric lines and natural gas mains are located, pursuant to easements and other rights, on public roads or on land owned by others.
Electric Transmission & Distribution
For information regarding the properties of our Electric Transmission & Distribution business segment, please read “Business — Our Business — Electric Transmission & Distribution — Properties” in Item 1 of this report, which information is incorporated herein by reference.
Natural Gas Distribution
For information regarding the properties of our Natural Gas Distribution business segment, please read “Business — Our Business — Natural Gas Distribution — Assets” in Item 1 of this report, which information is incorporated herein by reference.
Energy Services
For information regarding the properties of our Energy Services business segment, please read “Business — Our Business — Energy Services — Assets” in Item 1 of this report, which information is incorporated herein by reference.
Midstream Investments
For information regarding the properties of our Midstream Investments business segment, please read “Business — Our Business — Midstream Investments” in Item 1 of this report, which information is incorporated herein by reference.
Other Operations
For information regarding the properties of our Other Operations business segment, please read “Business — Our Business — Other Operations” in Item 1 of this report, which information is incorporated herein by reference.
Item 3. | Legal Proceedings |
For a discussion of material legal and regulatory proceedings affecting us, please read “Business — Regulation” and “Business — Environmental Matters” in Item 1 of this report, “Management’s Discussion and Analysis of Financial Condition and Results of Operations — Liquidity and Capital Resources — Regulatory Matters” in Item 7 of this report and Note 15(d) to our consolidated financial statements, which information is incorporated herein by reference.
Item 4. | Mine Safety Disclosures |
Not applicable.
42
PART II
Item 5. | Market for Registrant’s Common Equity, Related Stockholder Matters and Issuer Purchases of Equity Securities |
As of February 9, 2018, our common stock was held by approximately 30,493 shareholders of record. Our common stock is listed on the NYSE and Chicago Stock Exchange and is traded under the symbol “CNP.”
The following table sets forth the high and low closing prices of the common stock of CenterPoint Energy on the NYSE composite tape during the periods indicated, as reported by Bloomberg, and the cash dividends declared in these periods.
Market Price | Dividend Declared | ||||||||||
High | Low | Per Share | |||||||||
2017 | |||||||||||
First Quarter | $ | 0.2675 | |||||||||
January 3 | $ | 24.59 | |||||||||
March 15 | $ | 28.09 | |||||||||
Second Quarter | $ | 0.2675 | |||||||||
May 17 | $ | 27.17 | |||||||||
June 1 | $ | 28.93 | |||||||||
Third Quarter | $ | 0.2675 | |||||||||
July 11 | $ | 27.16 | |||||||||
September 11 | $ | 30.45 | |||||||||
Fourth Quarter (1) | $ | 0.5450 | |||||||||
November 30 | $ | 30.01 | |||||||||
December 21 | $ | 27.77 | |||||||||
2016 | |||||||||||
First Quarter | $ | 0.2575 | |||||||||
January 20 | $ | 16.90 | |||||||||
March 29 | $ | 21.25 | |||||||||
Second Quarter | $ | 0.2575 | |||||||||
April 5 | $ | 20.51 | |||||||||
June 29 | $ | 24.00 | |||||||||
Third Quarter | $ | 0.2575 | |||||||||
July 22 | $ | 24.69 | |||||||||
August 16 | $ | 22.13 | |||||||||
Fourth Quarter | $ | 0.2575 | |||||||||
October 11 | $ | 21.84 | |||||||||
December 22 | $ | 24.84 | |||||||||
(1) | On October 25, 2017, our Board of Directors declared a regular quarterly cash dividend of $0.2675 per share of common stock payable on December 8, 2017, to shareholders of record as of the close of business on November 16, 2017. On December 13, 2017, our Board of Directors declared a regular quarterly cash dividend of $0.2775 per share, payable on March 8, 2018 to shareholders of record at the close of business on February 15, 2018. |
The closing market price of our common stock on December 31, 2017 was $28.36 per share.
The amount of future cash dividends will be subject to determination based upon our results of operations and financial condition, our future business prospects, any applicable contractual restrictions and other factors that our Board of Directors considers relevant and will be declared at the discretion of the Board of Directors.
43
Repurchases of Equity Securities
During the quarter ended December 31, 2017, none of our equity securities registered pursuant to Section 12 of the Securities Exchange Act of 1934 were purchased by or on behalf of us or any of our “affiliated purchasers,” as defined in Rule 10b-18(a)(3) under the Securities Exchange Act of 1934.
Item 6. Selected Financial Data
The following table presents selected financial data with respect to our consolidated financial condition and consolidated results of operations and should be read in conjunction with our consolidated financial statements and the related notes in Item 8 of this report.
Year Ended December 31, | |||||||||||||||||||
2017 | 2016 | 2015 | 2014 | 2013 | |||||||||||||||
(in millions, except per share amounts) | |||||||||||||||||||
Revenues | $ | 9,614 | $ | 7,528 | $ | 7,386 | $ | 9,226 | $ | 8,106 | |||||||||
Equity in earnings (losses) of unconsolidated affiliates | 265 | 208 | (1,663 | ) | (2) | 308 | 188 | ||||||||||||
Net income (loss) | 1,792 | (1) | 432 | (692 | ) | 611 | 311 | ||||||||||||
Basic earnings (loss) per common share | 4.16 | 1.00 | (1.61 | ) | 1.42 | 0.73 | |||||||||||||
Diluted earnings (loss) per common share | 4.13 | 1.00 | (1.61 | ) | 1.42 | $ | 0.72 | ||||||||||||
Cash dividends paid per common share | $ | 1.07 | $ | 1.03 | $ | 0.99 | $ | 0.95 | $ | 0.83 | |||||||||
Dividend payout ratio | 26 | % | 103 | % | n/a | 67 | % | 114 | % | ||||||||||
Return on average common equity | 44 | % | 12 | % | (17 | )% | 14 | % | 7 | % | |||||||||
Ratio of earnings to fixed charges | 3.70 | 2.74 | 2.67 | 2.79 | 2.42 | ||||||||||||||
At year-end: | |||||||||||||||||||
Book value per common share | $ | 10.88 | $ | 8.04 | $ | 8.05 | $ | 10.58 | $ | 10.09 | |||||||||
Market price per common share | 28.36 | 24.64 | 18.36 | 23.43 | 23.18 | ||||||||||||||
Market price as a percent of book value | 261 | % | 306 | % | 228 | % | 221 | % | 230 | % | |||||||||
Percentage of common units owned representing limited partner interests in Enable | 54.1 | % | 54.1 | % | 55.4 | % | 55.4 | % | 58.3 | % | |||||||||
Total assets (4) | $ | 22,736 | $ | 21,829 | $ | 21,290 | $ | 23,150 | $ | 21,816 | |||||||||
Short-term borrowings | 39 | 35 | 40 | 53 | 43 | ||||||||||||||
Securitization Bonds, including current maturities (3) | 1,868 | 2,278 | 2,667 | 3,037 | 3,388 | ||||||||||||||
Other long-term debt, including current maturities (3) | 6,933 | 6,279 | 6,063 | 5,717 | 4,873 | ||||||||||||||
Capitalization: | |||||||||||||||||||
Common stock equity | 35 | % | 29 | % | 28 | % | 34 | % | 34 | % | |||||||||
Long-term debt, including current maturities | 65 | % | 71 | % | 72 | % | 66 | % | 66 | % | |||||||||
Capitalization, excluding Securitization Bonds: | |||||||||||||||||||
Common stock equity | 40 | % | 36 | % | 36 | % | 44 | % | 47 | % | |||||||||
Long-term debt, excluding Securitization Bonds, and including current maturities | 60 | % | 64 | % | 64 | % | 56 | % | 53 | % | |||||||||
Capital expenditures | $ | 1,494 | $ | 1,406 | $ | 1,575 | $ | 1,402 | $ | 1,272 | |||||||||
(1) | Net income for the year ended December 31, 2017 includes a reduction in income taxes of $1,113 million due to tax reform. See Note 14 to our consolidated financial statements for further discussion of the impacts of tax reform implementation. |
(2) | This amount includes $1,846 million of non-cash impairment charges related to Enable. |
(3) | Amounts for 2013 to 2015 have been restated to reflect adoption of ASU 2015-03. |
44
Item 7. | Management’s Discussion and Analysis of Financial Condition and Results of Operations |
The following discussion and analysis should be read in combination with our consolidated financial statements included in Item 8 herein.
OVERVIEW
Background
We are a public utility holding company. Our operating subsidiaries own and operate electric transmission and distribution and natural gas distribution facilities, supply natural gas to commercial and industrial customers and electric and natural gas utilities and own interests in Enable as described below. Our indirect, wholly-owned subsidiaries include:
• | Houston Electric, which engages in the electric transmission and distribution business in the Texas Gulf Coast area that includes the city of Houston; |
• | CERC Corp., which owns and operates natural gas distribution systems in six states; and |
• | CES, which obtains and offers competitive variable and fixed-price physical natural gas supplies and services primarily to commercial and industrial customers and electric and natural gas utilities in 33 states. |
As of December 31, 2017, we also owned an aggregate of 14,520,000 Series A Preferred Units in Enable, which owns, operates and develops natural gas and crude oil infrastructure assets, and CERC Corp. owned approximately 54.1% of the common units representing limited partner interests in Enable.
Business Segments
In this Management’s Discussion and Analysis, we discuss our results from continuing operations on a consolidated basis and individually for each of our business segments. We also discuss our liquidity, capital resources and critical accounting policies. We are first and foremost an energy delivery company and it is our intention to remain focused on these segments of the energy business. The results of our business operations are significantly impacted by weather, customer growth, economic conditions, cost management, competition, rate proceedings before regulatory agencies and other actions of the various regulatory agencies to whose jurisdiction we are subject. Our electric transmission and distribution services are subject to rate regulation and are reported in the Electric Transmission & Distribution business segment, as are impacts of generation-related stranded costs and other true-up balances recoverable by the regulated electric utility. For further information about our Electric Transmission & Distribution business segment, see “Business — Our Business — Electric Transmission & Distribution” in Item 1 of Part I of this report. Our natural gas distribution services are also subject to rate regulation and are reported in the Natural Gas Distribution business segment. For further information about our Natural Gas Distribution business segment, see “Business — Our Business — Natural Gas Distribution” in Item 1 of Part I of this report. Our Energy Services business segment includes non-rate regulated natural gas sales to, and transportation and storage services, for commercial and industrial customers. For further information about our Energy Services business segment, see “Business — Our Business — Energy Services” in Item 1 of Part I of this report. The results of our Midstream Investments business segment are dependent upon the results of Enable, which are driven primarily by the volume of natural gas, NGLs and crude oil that Enable gathers, processes and transports across its systems and other factors as discussed below under “— Factors Influencing Our Midstream Investments Segment.” Our Other Operations business segment includes office buildings and other real estate used in our business operations and other corporate operations which support all of our business operations.
EXECUTIVE SUMMARY
Factors Influencing Our Businesses and Industry Trends
We expect our and Enable’s businesses to continue to be affected by the key factors and trends discussed below. Our expectations are based on assumptions made by us and information currently available to us. To the extent our underlying assumptions about, or interpretations of, available information prove to be incorrect, our actual results may vary materially from our expected results.
We are an energy delivery company. The majority of our revenues are generated from the sale of natural gas and the transmission and delivery of electricity by our subsidiaries. We do not own or operate electric generating facilities or make retail sales to end-use electric customers. To assess our financial performance, our management primarily monitors operating income and cash flows from our business segments. Within these broader financial measures, we monitor margins, operation and maintenance expense,
45
interest expense, capital spending and working capital requirements. In addition to these financial measures, we also monitor a number of variables that management considers important to the operation of our business segments, including the number of customers, throughput, use per customer, commodity prices and heating and cooling degree days. We also monitor system reliability, safety factors and customer satisfaction to gauge our performance.
To the extent adverse economic conditions affect our suppliers and customers, results from our energy delivery businesses may suffer. For example, our electric business is largely concentrated in Houston, Texas, where a higher percentage of employment is tied to the energy sector relative to other regions of the country. Although Houston, Texas has a diverse economy, employment in the energy industry remains important. During 2015 and 2016, the rate of growth in employment in Houston declined in connection with the significant decline in energy and commodity prices over that period. Relatively low commodity prices compared to pre-2015 levels continued in 2017, and we expect such relatively low prices to continue or slightly improve in 2018.
Also, adverse economic conditions, coupled with concerns for protecting the environment and increased availability of alternate energy sources, may cause consumers to use less energy or avoid expansions of their facilities, resulting in less demand for our services. To the extent population growth is affected by lower energy prices and there is financial pressure on some of our customers who operate within the energy industry, there may be an impact on the growth rate of our customer base and overall demand. Due to a slowdown in multi-family residential construction, meter growth in 2017 has declined. We saw year-over-year residential meter growth decline from 2.3% in 2016 to 1.6% in 2017. As the recent stability in the energy sector gains momentum in 2018, we anticipate this growth will continue at roughly 2%, in line with long-term trends.
Performance of our Electric Transmission & Distribution and Natural Gas Distribution business segments is significantly influenced by the number of customers and energy usage per customer. Weather conditions can have a significant impact on energy usage, and we compare our results on a weather-adjusted basis.
Overall, in 2017 the Houston area experienced a number of record-breaking high and low temperatures, primarily in January-April and in October-November, resulting in a year that was warmer by a tenth of a degree than the previous warmest year, 2012. In terms of heating degree days, Texas recorded its warmest year and for most other jurisdictions the second warmest year since 1970. In 2017, our Houston service area experienced above normal warmth with record rainfall during Hurricane Harvey. In 2016, our Houston service area experienced above normal warmth with episodes of flooding. In 2015, our Houston service area experienced some of the mildest temperatures on record during November and December. Every state in which we distribute natural gas had a warmer than normal winter in 2017, 2016 and 2015.
Historically, both the TDU and NGD have utilized weather hedges to help reduce the impact of mild weather on their financial results. The TDU entered into a weather hedge for the 2015-2016, 2016-2017 and 2017-2018 winter heating seasons. However, although NGD did not enter into a weather hedge for the winter of 2015-2016 or 2016-2017, it has entered into a hedge for the 2017-2018 winter season in Texas where no weather normalization mechanisms exist. In our non-Texas jurisdictions, weather normalization mechanisms or decoupling in the Minnesota division help to mitigate the impact of abnormal weather on our financial results. Long-term national trends indicate customers have reduced their energy consumption, which could adversely affect our results. However, due to more affordable energy prices and continued economic improvement in the areas we serve, the trend toward lower usage has slowed.
In Minnesota and Arkansas, there are rate adjustment mechanisms to counter the impact of declining usage from energy efficiency improvements. In addition, in many of our service areas, particularly in the Houston area and Minnesota, we have benefited from growth in the number of customers, which could mitigate the effects of reduced consumption. We anticipate that this trend will continue as the regions’ economies continue to grow. The profitability of our businesses is influenced significantly by the regulatory treatment we receive from the various state and local regulators who set our electric and gas distribution rates.
Our Energy Services business segment contracts with customers for transportation, storage and sales of natural gas on an unregulated basis. Its operations serve customers throughout the United States. The segment benefits from favorable price differentials, either on a geographic or seasonal basis. While this business utilizes financial derivatives to mitigate the effects of price movements, it does not enter into risk management contracts for speculative purposes and monitors VaR daily to avoid significant financial exposures to realized income. At the end of 2017, a weather-driven spike in natural gas prices caused the accrual of unusually high unrealized mark-to-market income, expected to be substantially reversed in the first quarter of 2018 as natural gas prices normalize.
In January 2017, CES acquired AEM, which included approximately 1,000 customers and 362 Bcf of natural gas sales. The customer base included more industrial customers, which was complementary to our existing commercial-heavy customer base. This acquisition helped drive the overall operating income increase for Energy Services in 2017 as compared to 2016. For more information regarding this acquisition, see Note 4 to our consolidated financial statements.
46
The nature of our businesses requires significant amounts of capital investment, and we rely on internally generated cash, borrowings under our credit facilities, proceeds from commercial paper and issuances of debt and equity in the capital markets to satisfy these capital needs. We strive to maintain investment grade ratings for our securities to access the capital markets on terms we consider reasonable. A reduction in our ratings generally would increase our borrowing costs for new issuances of debt, as well as borrowing costs under our existing revolving credit facilities, and may prevent us from accessing the commercial paper markets. Disruptions in the financial markets can also affect the availability of new capital on terms we consider attractive. In those circumstances, companies like us may not be able to obtain certain types of external financing or may be required to accept terms less favorable than they would otherwise accept. For that reason, we seek to maintain adequate liquidity for our businesses through existing credit facilities and prudent refinancing of existing debt.
The regulation of natural gas pipelines and related facilities by federal and state regulatory agencies affects our business. In accordance with natural gas pipeline safety and integrity regulations, we are making, and will continue to make, significant capital investments in our service territories, which are necessary to help operate and maintain a safe, reliable and growing natural gas system. Our compliance expenses may also increase as a result of preventative measures required under these regulations. Consequently, new rates in the areas we serve are necessary to recover these increasing costs.
We expect to contribute a minimum of approximately $67 million to our pension plans in 2018. Consistent with the regulatory treatment of such costs, we defer the amount of pension expense that differs from the level of pension expense included in our base rates for our Electric Transmission & Distribution business segment and Natural Gas Distribution business segment in Texas.
Factors Influencing Our Midstream Investments Segment
The results of our Midstream Investments segment are dependent upon the results of Enable, which are driven primarily by the volume of natural gas, NGLs and crude oil that Enable gathers, processes and transports across its systems. These volumes depend significantly on the level of production from natural gas wells connected to Enable’s systems across a number of U.S. mid-continent markets. Aggregate production volumes are affected by the overall amount of oil and gas drilling and completion activities. Production must be maintained or increased by new drilling or other activity, because the production rate of oil and gas wells declines over time.
Enable expects its business to continue to be impacted by the trends affecting the midstream industry, discussed below. Enable’s outlook is based on its management’s assumptions regarding the impact of these trends that it has developed by interpreting the information currently available to them. If Enable management’s assumptions or interpretation of available information prove to be incorrect, Enable’s future financial condition and results of operations may differ materially from its expectations.
Enable’s business is impacted by commodity prices, which have declined and otherwise experienced significant volatility in recent years. Commodity prices impact the drilling and production of natural gas and crude oil in the areas served by Enable’s systems, and the volumes on Enable’s systems are negatively impacted if producers decrease drilling and production in those areas served. Both Enable’s gathering and processing segment and its transportation and storage segment can be impacted by drilling and production. Enable’s gathering and processing segment primarily serves producers, and many producers utilize the services provided by its transportation and storage segment. A decrease in volumes will decrease cash flows from Enable’s systems. In addition, Enable’s processing arrangements expose it to commodity price fluctuations. Enable has attempted to mitigate the impact of commodity prices on its business by entering into hedges, focusing on contracting fee-based business and converting existing commodity-based contracts to fee-based contracts.
Enable’s long-term view is that natural gas and crude oil production in the U.S. will increase. Over the past several years, there has been a fundamental shift in U.S. natural gas and crude oil production towards tight gas formations and shale plays. Advancements in technology have allowed producers to efficiently extract natural gas and crude oil from these formations and plays. As a result, the proven reserves of natural gas and crude oil in the U.S. have significantly increased.
Natural gas continues to be a critical component of energy demand in the U.S. Over the long term, Enable’s management believes that the prospects for continued natural gas demand are favorable and will be driven by population and economic growth, as well as the continued displacement of coal-fired power plants by natural gas-fired power plants due to the price of natural gas and stricter government environmental regulations on the mining and burning of coal. Enable’s management believes that increasing consumption of natural gas over the long term in these sectors will continue to drive demand for Enable’s natural gas gathering, processing, transportation and storage services.
Enable may access the capital markets to fund its expansion capital expenditures. Historically, unit prices of midstream master limited partnerships have experienced periods of volatility. In addition, because Enable’s common units are yield-based securities,
47
rising market interest rates could impact the relative attractiveness of Enable’s common units to investors. Further, fluctuations in energy and commodity prices can create volatility in Enable’s common unit prices, which could impact investor appetite for its common units. Volatility in energy and commodity prices, as well as other macro-economic factors could impact the relative attractiveness of Enable’s debt securities to investors. As a result of capital market volatility, Enable may be unable to issue equity securities or debt on satisfactory terms, or at all, which may limit its ability to expand its operations or make future acquisitions.
The regulation of gathering and transmission pipelines, storage and related facilities by FERC and other federal and state regulatory agencies, including the DOT, has a significant impact on Enable’s business. For example, the DOT’s PHMSA has established pipeline integrity management programs that require more frequent inspections of pipeline facilities and other preventative measures, which may increase Enable’s compliance costs and increase the time it takes to obtain required permits. Additionally, increased regulation of oil and natural gas producers, including regulation associated with hydraulic fracturing, could reduce regional supply of oil and natural gas and therefore throughput on Enable’s gathering systems.
Enable relies on certain key natural gas producer customers for a significant portion of its natural gas and NGLs supply. For the year ended December 31, 2017, Enable’s top ten natural gas producer customers accounted for approximately 70% of its gathered volumes. These customers include affiliates of Continental, Vine, GeoSouthern, XTO Energy, Tapstone Energy, Apache, BP Energy Company, Chesapeake, Covey Park and Four Point Energy. Further, Enable relies on certain key utilities and producers for a significant portion of its transportation and storage demand. For the year ended December 31, 2017, Enable’s top transportation and storage customers by revenue were our affiliates and affiliates of Spire, American Electric Power Company, OGE, Continental, XTO Energy, Chesapeake, Midcontinent Express Pipeline, Entergy and Shell.
Enable is exposed to certain credit risks relating to its ongoing business operations. Credit risk includes the risk that counterparties that owe Enable money or commodities will breach their obligations. If the counterparties to these arrangements fail to perform, Enable may be forced to enter into alternative arrangements. In that event, Enable’s financial results could be adversely affected, and Enable could incur losses. Enable examines the creditworthiness of third-party customers to whom it extends credit and manages its exposure to credit risk through credit analysis, credit approval, credit limits and monitoring procedures, and for certain transactions, Enable may request letters of credit, prepayments or guarantees or seek to renegotiate its contract to reduce credit exposure.
Significant Events
Tax Reform. On December 22, 2017, President Trump signed into law comprehensive tax reform legislation informally called The Tax Cuts and Jobs Acts, or TCJA, which resulted in significant changes to federal tax laws effective January 1, 2018. For the impacts of the tax reform legislation, see Note 14 to our consolidated financial statements.
Hurricane Harvey. Houston Electric’s electric delivery system and CERC Corp.’s NGD suffered damage as a result of Hurricane Harvey, which struck the Texas coast on Friday, August 25, 2017. For further information regarding the impact of Hurricane Harvey, see Note 6 to our consolidated financial statements.
Brazos Valley Connection Project. Houston Electric began construction on the Brazos Valley Connection in February 2017. For further details, see “—Liquidity and Capital Resources —Regulatory Matters —Brazos Valley Connection Project” below.
Bailey-Jones Creek Project. In April 2017, Houston Electric submitted a proposal to ERCOT for an approximately $250 million transmission project in the greater Freeport, Texas area. For further details, see “—Liquidity and Capital Resources —Regulatory Matters — Bailey-Jones Creek Project” below.
Regulatory Proceedings. For details related to our pending and completed regulatory proceedings during 2017, see “—Liquidity and Capital Resources —Regulatory Matters” below.
Debt Transactions. In 2017, we and CERC Corp. retired or redeemed a combined $800 million aggregate principal amount of senior notes. Additionally, we issued $500 million aggregate principal amount of unsecured senior notes, CERC Corp. issued $300 million aggregate principal amount of unsecured senior notes and Houston Electric issued $300 million aggregate principal amount of general mortgage bonds. For further information about our 2017 debt transactions, see Note 13 to our consolidated financial statements.
Credit Facilities. In June 2017, CenterPoint Energy, Houston Electric and CERC Corp. each entered into amendments to their respective revolving credit facilities to (a) extend the termination date and terminate the swingline loan subfacility under each facility, and (b) for the CenterPoint Energy and CERC Corp. facilities, increase the aggregate commitments under such facilities. For further information about our 2017 credit facility amendments, see Note 13 to our consolidated financial statements.
48
AEM Acquisition. In January 2017, CES acquired AEM. For more information regarding this acquisition, see Note 4 to our consolidated financial statements.
CERTAIN FACTORS AFFECTING FUTURE EARNINGS
Our past earnings and results of operations are not necessarily indicative of our future earnings and results of operations. The magnitude of our and Enable’s future earnings and results of our and Enable’s operations will depend on or be affected by numerous factors including:
• | the performance of Enable, the amount of cash distributions we receive from Enable, Enable’s ability to redeem the Series A Preferred Units in certain circumstances and the value of our interest in Enable, and factors that may have a material impact on such performance, cash distributions and value, including factors such as: |
◦ | competitive conditions in the midstream industry, and actions taken by Enable’s customers and competitors, including the extent and timing of the entry of additional competition in the markets served by Enable; |
◦ | the timing and extent of changes in the supply of natural gas and associated commodity prices, particularly prices of natural gas and NGLs, the competitive effects of the available pipeline capacity in the regions served by Enable, and the effects of geographic and seasonal commodity price differentials, including the effects of these circumstances on re-contracting available capacity on Enable’s interstate pipelines; |
◦ | the demand for crude oil, natural gas, NGLs and transportation and storage services; |
◦ | environmental and other governmental regulations, including the availability of drilling permits and the regulation of hydraulic fracturing; |
◦ | recording of non-cash goodwill, long-lived asset or other than temporary impairment charges by or related to Enable; |
◦ | changes in tax status; |
◦ | access to debt and equity capital; and |
◦ | the availability and prices of raw materials and services for current and future construction projects; |
• | industrial, commercial and residential growth in our service territories and changes in market demand, including the effects of energy efficiency measures and demographic patterns; |
• | timely and appropriate rate actions that allow recovery of costs and a reasonable return on investment; |
• | future economic conditions in regional and national markets and their effect on sales, prices and costs; |
• | weather variations and other natural phenomena, including the impact of severe weather events on operations and capital; |
• | state and federal legislative and regulatory actions or developments affecting various aspects of our businesses (including the businesses of Enable), including, among others, energy deregulation or re-regulation, pipeline integrity and safety and changes in regulation and legislation pertaining to trade, health care, finance and actions regarding the rates charged by our regulated businesses; |
• | tax reform and legislation, including the effects of the TCJA and uncertainties involving state commissions’ and local municipalities’ regulatory requirements and determinations regarding the treatment of EDIT and our rates; |
• | our ability to mitigate weather impacts through normalization or rate mechanisms, and the effectiveness of such mechanisms; |
• | the timing and extent of changes in commodity prices, particularly natural gas, and the effects of geographic and seasonal commodity price differentials; |
• | problems with regulatory approval, construction, implementation of necessary technology or other issues with respect to major capital projects that result in delays or in cost overruns that cannot be recouped in rates; |
• | local, state and federal legislative and regulatory actions or developments relating to the environment, including those related to global climate change; |
• | the impact of unplanned facility outages; |
• | any direct or indirect effects on our or Enable’s facilities, operations and financial condition resulting from terrorism, cyber-attacks, data security breaches or other attempts to disrupt our businesses or the businesses of third parties, or other |
49
catastrophic events such as fires, earthquakes, explosions, leaks, floods, droughts, hurricanes, pandemic health events or other occurrences;
• | our ability to invest planned capital and the timely recovery of our investment in capital; |
• | our ability to control operation and maintenance costs; |
• | actions by credit rating agencies; |
• | the sufficiency of our insurance coverage, including availability, cost, coverage and terms; |
• | the investment performance of our pension and postretirement benefit plans; |
• | commercial bank and financial market conditions, our access to capital, the cost of such capital, and the results of our financing and refinancing efforts, including availability of funds in the debt capital markets; |
• | changes in interest rates and their impact on our costs of borrowing and the valuation of our pension benefit obligation; |
• | changes in rates of inflation; |
• | inability of various counterparties to meet their obligations to us; |
• | non-payment for our services due to financial distress of our customers; |
• | the extent and effectiveness of our risk management and hedging activities, including, but not limited to our financial and weather hedges; |
• | timely and appropriate regulatory actions allowing securitization for any future hurricanes or natural disasters or other recovery of costs, including costs associated with Hurricane Harvey; |
• | our or Enable’s potential business strategies and strategic initiatives, including restructurings, joint ventures and acquisitions or dispositions of assets or businesses (including a reduction of our interests in Enable, if any; whether through our decision to sell all or a portion of the Enable common units we own in the public equity markets or otherwise, subject to certain limitations), which we cannot assure you will be completed or will have the anticipated benefits to us or Enable; |
• | acquisition and merger activities involving us or our competitors; |
• | our or Enable’s ability to recruit, effectively transition and retain management and key employees and maintain good labor relations; |
• | the ability of GenOn (formerly known as RRI Energy, Inc., Reliant Energy and RRI), a wholly-owned subsidiary of NRG, and its subsidiaries, currently the subject of bankruptcy proceedings, to satisfy their obligations to us, including indemnity obligations; |
• | the outcome of litigation; |
• | the ability of REPs, including REP affiliates of NRG and Vistra Energy Corp., formerly known as TCEH Corp., to satisfy their obligations to us and our subsidiaries; |
• | changes in technology, particularly with respect to efficient battery storage or the emergence or growth of new, developing or alternative sources of generation; |
• | the timing and outcome of any audits, disputes and other proceedings related to taxes; |
• | the effective tax rates; |
• | the effect of changes in and application of accounting standards and pronouncements; and |
• | other factors we discuss under “Risk Factors” in Item 1A of this report and in other reports we file from time to time with the SEC. |
50
CONSOLIDATED RESULTS OF OPERATIONS
Year Ended December 31, | |||||||||||
2017 | 2016 | 2015 | |||||||||
(in millions, except per share amounts) | |||||||||||
Revenues | $ | 9,614 | $ | 7,528 | $ | 7,386 | |||||
Expenses | 8,542 | 6,569 | 6,453 | ||||||||
Operating Income | 1,072 | 959 | 933 | ||||||||
Gain (Loss) on Marketable Securities | 7 | 326 | (93 | ) | |||||||
Gain (Loss) on Indexed Debt Securities | 49 | (413 | ) | 74 | |||||||
Interest and Other Finance Charges | (313 | ) | (338 | ) | (352 | ) | |||||
Interest on Securitization Bonds | (77 | ) | (91 | ) | (105 | ) | |||||
Equity in Earnings (Losses) of Unconsolidated Affiliates | 265 | 208 | (1,633 | ) | |||||||
Other Income, net | 60 | 35 | 46 | ||||||||
Income (Loss) Before Income Taxes | 1,063 | 686 | (1,130 | ) | |||||||
Income Tax Expense (Benefit) | (729 | ) | 254 | (438 | ) | ||||||
Net Income (Loss) | $ | 1,792 | $ | 432 | $ | (692 | ) | ||||
Basic Earnings (Loss) Per Share | $ | 4.16 | $ | 1.00 | $ | (1.61 | ) | ||||
Diluted Earnings (Loss) Per Share | $ | 4.13 | $ | 1.00 | $ | (1.61 | ) | ||||
2017 Compared to 2016
Net Income. We reported net income of $1,792 million ($4.13 per diluted share) for 2017 compared to net income of $432 million ($1.00 per diluted share) for 2016.
The increase in net income of $1,360 million was primarily due to the following key factors:
• | a $983 million decrease in income tax expense, resulting from a reduction in income tax expense of $1,113 million due to tax reform, discussed further in Note 14 to our consolidated financial statements, offset by a $130 million increase in income tax expense primarily due to higher net income year over year; |
• | a $462 million increase in gains on indexed debt securities related to the ZENS, resulting from increased gains of $345 million in the underlying value of the indexed debt securities and a loss of $117 million from the Charter merger in 2016; |
• | a $113 million increase in operating income discussed below by segment; |
• | a $57 million increase in equity earnings from our investment in Enable, discussed further in Note 10 to our consolidated financial statements; |
• | a $25 million decrease in interest expense due to lower weighted average interest rates on outstanding debt; |
• | a $17 million decrease in losses on early debt redemption; |
• | a $14 million increase in cash distributions on Series A Preferred Units included in Other Income, net shown above; and |
• | a $14 million decrease in interest expense related to lower outstanding balances of our Securitization Bonds. |
These increases were partially offset by:
• a $319 million decrease in gains on marketable securities; and
•a $6 million decrease in miscellaneous other non-operating income included in Other Income, net shown above.
51
Income Tax Expense. We reported an effective tax rate of (69%) and 37% for the years ended December 31, 2017 and 2016, respectively. The effective tax rate of (69%) is primarily due to the remeasurement of our ADFIT liability as a result of the enactment of the TCJA on December 22, 2017, which reduced the U.S. corporate income tax rate from 35% to 21%. See Note 14 to our consolidated financial statements for a more in depth discussion of the 2017 impacts of the TCJA.
2016 Compared to 2015
Net Income. We reported net income of $432 million ($1.00 per diluted share) for 2016 compared to a net loss of $692 million ($(1.61) per diluted share) for the same period in 2015.
The increase in net income of $1,124 million was due to the following key factors:
• | a $1,841 million increase in equity earnings from our investment in Enable, as 2015 results included impairment charges of $1,846 million, discussed further in Note 10 to our consolidated financial statements; |
• | a $419 million increase in the gain on our marketable securities; |
• | a $26 million increase in operating income discussed below by segment; |
• | a $22 million increase in cash distributions on Series A Preferred Units included in Other Income, net shown above; |
• | a $14 million decrease in interest expense due to lower weighted average interest rates on outstanding debt; and |
• | a $14 million decrease in interest expense related to lower outstanding balances of our Securitization Bonds. |
These increases were partially offset by:
• | a $692 million increase in income tax expense due to higher income before tax; |
• | a $487 million increase in the loss on indexed debt securities related to the ZENS resulting from a loss of $117 million from the Charter merger in 2016 compared to a loss of $7 million from Verizon’s acquisition of AOL in 2015 and increased losses of $377 million in the underlying value of the indexed debt securities; |
• | a $22 million loss on early redemption of our $300 million 6.5% senior notes otherwise due 2018 included in Other Income, net shown above; |
• | a $6 million decrease in interest income due primarily to Enable’s repayment of $363 million note payable to us included in Other Income, net shown above; and |
• | a $5 million decrease in miscellaneous other non-operating income include in Other Income, net shown above. |
Income Tax Expense. We reported an effective tax rate of 37% and 39% for the years ended December 31, 2016 and 2015, respectively. The effective tax rate of 39% is primarily due to lower earnings from the impairment of our investment in Enable. The impairment loss reduced the deferred tax liability on our investment in Enable.
52
RESULTS OF OPERATIONS BY BUSINESS SEGMENT
The following table presents operating income for each of our business segments for 2017, 2016 and 2015. Included in revenues are intersegment sales. We account for intersegment sales as if the sales were to third parties at current market prices.
Operating Income by Business Segment
Year Ended December 31, | |||||||||||
2017 | 2016 | 2015 | |||||||||
(in millions) | |||||||||||
Electric Transmission & Distribution | $ | 610 | $ | 628 | $ | 607 | |||||
Natural Gas Distribution | 328 | 303 | 273 | ||||||||
Energy Services | 125 | 20 | 42 | ||||||||
Other Operations | 9 | 8 | 11 | ||||||||
Total Consolidated Operating Income | $ | 1,072 | $ | 959 | $ | 933 | |||||
Electric Transmission & Distribution
The following tables provide summary data of our Electric Transmission & Distribution business segment for 2017, 2016 and 2015:
Year Ended December 31, | |||||||||||
2017 | 2016 | 2015 | |||||||||
Revenues: | (in millions, except throughput and customer data) | ||||||||||
TDU | $ | 2,588 | $ | 2,507 | $ | 2,364 | |||||
Bond Companies | 409 | 553 | 481 | ||||||||
Total revenues | 2,997 | 3,060 | 2,845 | ||||||||
Expenses: | |||||||||||
Operation and maintenance, excluding Bond Companies | 1,423 | 1,355 | 1,300 | ||||||||
Depreciation and amortization, excluding Bond Companies | 395 | 384 | 340 | ||||||||
Taxes other than income taxes | 235 | 231 | 222 | ||||||||
Bond Companies | 334 | 462 | 376 | ||||||||
Total expenses | 2,387 | 2,432 | 2,238 | ||||||||
Operating Income | $ | 610 | $ | 628 | $ | 607 | |||||
Operating Income: | |||||||||||
TDU | $ | 535 | $ | 537 | $ | 502 | |||||
Bond Companies (1) | 75 | 91 | 105 | ||||||||
Total segment operating income | $ | 610 | $ | 628 | $ | 607 | |||||
Throughput (in GWh): | |||||||||||
Residential | 29,703 | 29,586 | 28,995 | ||||||||
Total | 88,636 | 86,829 | 84,191 | ||||||||
Number of metered customers at end of period: | |||||||||||
Residential | 2,164,073 | 2,129,773 | 2,079,899 | ||||||||
Total | 2,444,299 | 2,403,340 | 2,348,517 | ||||||||
(1) | Represents the amount necessary to pay interest on the Securitization Bonds. |
2017 Compared to 2016. Our Electric Transmission & Distribution business segment reported operating income of $610 million for 2017, consisting of $535 million from the TDU and $75 million related to the Bond Companies. For 2016, operating income totaled $628 million, consisting of $537 million from the TDU and $91 million related to the Bond Companies.
53
TDU operating income decreased $2 million primarily due to the following key factors:
• | lower equity return of $22 million, primarily related to the annual true-up of transition charges correcting for over-collections that occurred during the preceding 12 months; |
• | higher depreciation, primarily because of ongoing additions to plant in service, and other taxes of $20 million; |
• | higher operation and maintenance expenses of $19 million, primarily due to higher labor and benefits costs of $10 million and corporate support services expenses of $8 million; |
• | lower usage of $15 million; and |
•lower miscellaneous revenues, including right-of-way, of $10 million.
These decreases to operating income were partially offset by the following:
• | rate increases of $47 million related to distribution capital investments; |
•customer growth of $32 million from the addition of almost 41,000 customers; and
• | higher transmission-related revenues of $61 million, partially offset by transmission costs billed by transmission providers of $56 million. |
2016 Compared to 2015. Our Electric Transmission & Distribution business segment reported operating income of $628 million for 2016, consisting of $537 million from the TDU and $91 million related to the Bond Companies. For 2015, operating income totaled $607 million, consisting of $502 million from the TDU and $105 million related to the Bond Companies.
TDU operating income increased $35 million due to the following key factors:
•customer growth of $31 million from the addition of over 54,000 customers;
• | higher transmission-related revenues of $82 million, partially offset by transmission costs billed by transmission providers of $55 million; |
• | higher equity return of $17 million, primarily due to the annual true-up of transition charges correcting for under-collections that occurred during the preceding 12 months; and |
•rate increases of $13 million related to distribution capital investments.
These increases to operating income were partially offset by the following:
• | higher depreciation, primarily because of ongoing additions to plant in service, and other taxes of $45 million; |
•higher operation and maintenance expenses of $3 million; and
•lower right-of-way revenues of $3 million.
54
Natural Gas Distribution
The following table provides summary data of our Natural Gas Distribution business segment for 2017, 2016 and 2015:
Year Ended December 31, | |||||||||||
2017 | 2016 | 2015 | |||||||||
(in millions, except throughput and customer data) | |||||||||||
Revenues | $ | 2,639 | $ | 2,409 | $ | 2,632 | |||||
Expenses: | |||||||||||
Natural gas | 1,164 | 1,008 | 1,297 | ||||||||
Operation and maintenance | 742 | 714 | 697 | ||||||||
Depreciation and amortization | 260 | 242 | 222 | ||||||||
Taxes other than income taxes | 145 | 142 | 143 | ||||||||
Total expenses | 2,311 | 2,106 | 2,359 | ||||||||
Operating Income | $ | 328 | $ | 303 | $ | 273 | |||||
Throughput (in Bcf): | |||||||||||
Residential | 151 | 152 | 171 | ||||||||
Commercial and industrial | 261 | 259 | 262 | ||||||||
Total Throughput | 412 | 411 | 433 | ||||||||
Number of customers at end of period: | |||||||||||
Residential | 3,213,140 | 3,183,538 | 3,149,845 | ||||||||
Commercial and industrial | 256,651 | 255,806 | 253,921 | ||||||||
Total | 3,469,791 | 3,439,344 | 3,403,766 | ||||||||
2017 Compared to 2016. Our Natural Gas Distribution business segment reported operating income of $328 million for 2017 compared to $303 million for 2016.
Operating income increased $25 million primarily as a result of the following key factors:
• | rate increases of $38 million, primarily from Texas rate filings of $14 million, Arkansas rate case and formula rate plan filings of $9 million, Minnesota interim rates of $7 million and Mississippi RRA of $4 million; |
• | higher other revenues of $8 million, primarily driven by transportation revenues; |
• | customer growth of $7 million from the addition of over 30,000 new customers; |
• | labor and benefits were favorable by $5 million, resulting primarily from the recording of a regulatory asset (and a corresponding reduction in expense) to recover $16 million of prior postretirement expenses in future rates established in the Texas Gulf rate order; and |
• | an increase of $7 million from weather normalization adjustments, partially offset by $4 million of milder weather effects. |
These increases were partially offset by:
• | higher operation and maintenance expenses of $20 million, primarily due to increased bad debt expenses of $7 million, increased contract services of $7 million, increased insurance costs of $3 million and increased corporate support services expenses of $2 million; and |
• | increased depreciation and amortization expense, primarily due to ongoing additions to plant-in-service, and other taxes of $16 million. |
Increased operation and maintenance expense related to energy efficiency programs of $13 million and decreased other taxes expense related to gross receipt taxes of $5 million were offset by a corresponding increase or decrease in the related revenues.
55
2016 Compared to 2015. Our Natural Gas Distribution business segment reported operating income of $303 million for 2016 compared to $273 million for 2015.
Operating income increased $30 million primarily as a result of the following key factors:
• | rate increases of $55 million, primarily from the 2015 Minnesota rate case, including the decoupling rider, and the Texas GRIP filing; |
• | lower bad debt expense of $12 million resulting from lower customer bills due to warmer than normal weather as well as credit and collections process improvements that have reduced write-offs; |
• | an increase of $26 million from weather normalization adjustments, including weather-related decoupling and hedging activities, partially offset by $19 million of milder weather effects; and |
• | customer growth of $5 million from the addition of over 35,000 new customers. |
These increases were partially offset by:
• | increased depreciation and amortization of $20 million, primarily due to ongoing additions to plant in service; |
• | higher labor and benefits expenses of $11 million, primarily driven by increased pension costs; |
• | higher contract services expenses of $10 million, primarily for increased pipeline integrity, leak surveying and repair activities; and |
• | increased operation and maintenance expenses of $8 million related to higher support services costs and other miscellaneous expenses. |
Increased operation and maintenance expense related to energy efficiency programs of $1 million and decreased other taxes expense related to gross receipt taxes of $3 million were offset by a corresponding increase or decrease in the related revenues.
Energy Services
The following table provides summary data of our Energy Services business segment for 2017, 2016 and 2015:
Year Ended December 31, | |||||||||||
2017 | 2016 | 2015 | |||||||||
(in millions, except throughput and customer data) | |||||||||||
Revenues | $ | 4,049 | $ | 2,099 | $ | 1,957 | |||||
Expenses: | |||||||||||
Natural gas | 3,816 | 2,011 | 1,867 | ||||||||
Operation and maintenance | 87 | 59 | 42 | ||||||||
Depreciation and amortization | 19 | 7 | 5 | ||||||||
Taxes other than income taxes | 2 | 2 | 1 | ||||||||
Total expenses | 3,924 | 2,079 | 1,915 | ||||||||
Operating Income | $ | 125 | $ | 20 | $ | 42 | |||||
Timing impacts related to mark-to-market gain (loss) (1) | $ | 79 | $ | (21 | ) | $ | 4 | ||||
Throughput (in Bcf) | 1,200 | 777 | 618 | ||||||||
Number of customers at end of period (2) | 31,000 | 30,000 | 18,000 | ||||||||
(1) | Includes the change in unrealized mark-to-market value and the impact from derivative assets and liabilities acquired through the purchase of Continuum and AEM. |
56
(2) | These numbers do not include approximately 72,000 and 60,100 natural gas customers as of December 31, 2017 and 2016, respectively, that are under residential and small customer choice programs invoiced by their host utility. |
2017 Compared to 2016. Our Energy Services business segment reported operating income of $125 million for 2017 compared to $20 million for 2016. The increase in operating income of $105 million was primarily due to a $100 million increase from mark-to-market accounting for derivatives associated with certain natural gas purchases and sales used to lock in economic margins. A weather-driven spike in natural gas prices at the end of 2017 caused the accrual of an unusually high mark-to-market asset, expected to be substantially reversed in the first quarter of 2018 as natural gas prices normalize. Operating income in 2017 also included approximately $5 million of expenses related to the acquisition and integration of AEM. The remaining increase in operating income was primarily due to increased throughput related to the acquisition of AEM in 2017.
2016 Compared to 2015. Our Energy Services business segment reported operating income of $20 million for 2016 compared to $42 million for 2015. The decrease in operating income of $22 million was due to a $25 million decrease from mark-to-market accounting for derivatives associated with certain natural gas purchases and sales used to lock in economic margins. Partially offsetting this decrease was an increase in operating income for 2016 as compared to 2015 attributable to increased throughput and number of customers due to the Continuum acquisition. Operating income in 2016 also included $3 million of operation and maintenance expenses and $3 million of amortization expenses specifically related to the acquisition and integration of Continuum.
Midstream Investments
The following table summarizes the equity earnings (losses) of our Midstream Investments business segment for 2017, 2016 and 2015:
Year Ended December 31, | |||||||||||
2017 | 2016 | 2015 (1) | |||||||||
(in millions) | |||||||||||
Enable | $ | 265 | $ | 208 | $ | (1,633 | ) | ||||
(1) | These amounts include impairment charges totaling $1,846 million composed of the impairment of our investment in Enable of $1,225 million and our share, $621 million, of impairment charges Enable recorded for goodwill and long-lived assets for the year ended December 31, 2015. This impairment is offset by $213 million of earnings for the year ended December 31, 2015. |
Other Operations
The following table provides summary data for our Other Operations business segment for 2017, 2016 and 2015:
Year Ended December 31, | |||||||||||
2017 | 2016 | 2015 | |||||||||
(in millions) | |||||||||||
Revenues | $ | 14 | $ | 15 | $ | 14 | |||||
Expenses | 5 | 7 | 3 | ||||||||
Operating Income | $ | 9 | $ | 8 | $ | 11 | |||||
2017 Compared to 2016. Our Other Operations business segment reported operating income of $9 million for 2017 compared to $8 million for 2016. The increase in operating income of $1 million is primarily related to decreased depreciation and amortization, partially offset by increased operating expenses.
2016 Compared to 2015. Our Other Operations business segment reported operating income of $8 million for 2016 compared to $11 million for 2015. The decrease in operating income of $3 million is primarily related to increased depreciation and amortization.
57
LIQUIDITY AND CAPITAL RESOURCES
Historical Cash Flows
The net cash provided by (used in) operating, investing and financing activities for 2017, 2016 and 2015 is as follows:
Year Ended December 31, | |||||||||||
2017 | 2016 | 2015 | |||||||||
(in millions) | |||||||||||
Cash provided by (used in): | |||||||||||
Operating activities | $ | 1,421 | $ | 1,931 | $ | 1,870 | |||||
Investing activities | (1,257 | ) | (1,046 | ) | (1,387 | ) | |||||
Financing activities | (245 | ) | (808 | ) | (517 | ) | |||||
Cash Provided by Operating Activities
Net cash provided by operating activities decreased $510 million in 2017 compared to 2016 primarily due to decreased cash from working capital ($549 million) and other non-current items ($6 million), partially offset by higher net income after adjusting for non-cash and non-operating items ($45 million). The changes in working capital items in 2017 primarily related to decreased cash provided by margin deposits, net; non-trading derivatives, net; taxes receivable; net accounts receivable/payable; net regulatory assets and liabilities; inventory; and fuel cost under recovery; partially offset by net current assets and liabilities; and other assets and liabilities.
Net cash provided by operating activities increased $61 million in 2016 compared to 2015 primarily due to higher net income after adjusting for non-cash and non-operating items ($40 million) and increased cash from other non-current items ($32 million), partially offset by changes in working capital ($11 million). The changes in working capital items in 2016 primarily related to decreased cash provided by net regulatory assets and liabilities; fuel cost under recovery; and net accounts receivable/payable; partially offset by increased cash provided by taxes receivable; margin deposits, net; non-trading derivatives, net; and net current assets and liabilities.
Cash Used in Investing Activities
Net cash used in investing activities increased $211 million in 2017 compared to 2016 primarily due to decreased cash received for the repayment of notes receivable from Enable ($363 million), decreased proceeds from the sale of marketable securities associated with the Charter merger ($178 million), increased cash used for acquisitions ($30 million) and increased capital expenditures ($12 million), which were partially offset by decreased cash used for the purchase of Series A Preferred Units ($363 million) and increased restricted cash ($10 million). In 2017, we acquired AEM for $132 million in cash and, in 2016, we acquired Continuum for $102 million in cash.
Net cash used in investing activities decreased $341 million in 2016 compared to 2015 primarily due to increased cash received for the repayment of notes receivable from Enable ($363 million), increased return of capital from Enable ($149 million), proceeds from the sale of marketable securities associated with the Charter merger ($146 million) and decreased capital expenditures ($170 million), which were partially offset by cash used for the purchase of Series A Preferred Units ($363 million), cash used for the Continuum acquisition ($102 million) and increased restricted cash ($17 million).
Cash Used in Financing Activities
Net cash used in financing activities decreased $563 million in 2017 compared to 2016 primarily due to increased proceeds from issuances of long-term debt ($496 million), decreased distributions to ZENS holders ($178 million), decreased losses on reacquired debt ($17 million), increased short-term borrowings ($9 million) and decreased payments of long-term debt ($7 million), partially offset by decreased proceeds from commercial paper ($120 million), increased payments of common stock dividends ($18 million) and increased debt issuance costs ($4 million).
Net cash used in financing activities increased $291 million in 2016 compared to 2015 primarily due to increased payments of long-term debt ($574 million), increased distributions to ZENS holders ($146 million), loss on reacquired debt ($22 million), increased payments of common stock dividends ($17 million) and debt issuance costs ($9 million), which were partially offset by increased proceeds from long-term debt ($400 million), increased proceeds from commercial paper ($66 million) and increased short-term borrowings ($8 million).
58
Future Sources and Uses of Cash
Our liquidity and capital requirements are affected primarily by our results of operations, capital expenditures, debt service requirements, tax payments, working capital needs and various regulatory actions. Our principal anticipated cash requirements for 2018 include the following:
• | capital expenditures of approximately $1.7 billion; |
• | scheduled principal payments on Securitization Bonds of $434 million; |
• | contributions of a minimum of $60 million to our qualified pension plan; |
• | maturing collateralized pollution control bonds of $50 million; and |
• | dividend payments on our common stock and interest payments on debt. |
We expect that anticipated 2018 cash needs will be met with borrowings under our credit facilities, proceeds from commercial paper, proceeds from the issuance of long-term debt, anticipated cash flows from operations and distributions from Enable. In addition, should we choose to sell Enable common units in 2018 (reducing the amount of future distributions we receive from Enable), any net proceeds we receive from such sale could provide a source for our 2018 cash needs. Discretionary financing or refinancing may result in the issuance of equity or debt securities in the capital markets or the arrangement of additional credit facilities. Issuances of equity or debt in the capital markets, funds raised in the commercial paper markets, additional credit facilities and any sales of our Enable common units may not, however, be available to us on acceptable terms.
The following table sets forth our actual capital expenditures for 2017 and estimates of our capital expenditures for currently planned projects for 2018 through 2022:
2017 | 2018 | 2019 | 2020 | 2021 | 2022 | ||||||||||||||||||
(in millions) | |||||||||||||||||||||||
Electric Transmission & Distribution | $ | 924 | $ | 949 | $ | 958 | $ | 1,004 | $ | 959 | $ | 900 | |||||||||||
Natural Gas Distribution | 523 | 635 | 612 | 637 | 664 | 687 | |||||||||||||||||
Energy Services | 11 | 20 | 15 | 15 | 15 | 15 | |||||||||||||||||
Other Operations | 36 | 60 | 38 | 33 | 32 | 32 | |||||||||||||||||
Total | $ | 1,494 | $ | 1,664 | $ | 1,623 | $ | 1,689 | $ | 1,670 | $ | 1,634 | |||||||||||
Our capital expenditures are expected to be used for investment in infrastructure for our electric transmission and distribution operations and our natural gas distribution operations. These capital expenditures are anticipated to maintain reliability and safety, increase resiliency and expand our systems through value-added projects.
The following table sets forth estimates of our contractual obligations, including payments due by period:
Contractual Obligations | Total | 2018 | 2019-2020 | 2021-2022 | 2023 and thereafter | |||||||||||||||
(in millions) | ||||||||||||||||||||
Securitization Bonds | $ | 1,868 | $ | 434 | $ | 689 | $ | 430 | $ | 315 | ||||||||||
Other long-term debt (1) | 7,316 | 50 | — | 3,549 | 3,717 | |||||||||||||||
Interest payments — Securitization Bonds (2) | 191 | 65 | 76 | 38 | 12 | |||||||||||||||
Interest payments — other long-term debt (2) | 3,756 | 277 | 548 | 459 | 2,472 | |||||||||||||||
Short-term borrowings | 39 | 39 | — | — | — | |||||||||||||||
Operating leases (3) | 26 | 5 | 9 | 7 | 5 | |||||||||||||||
Benefit obligations (4) | — | — | — | — | — | |||||||||||||||
Non-trading derivative liabilities | 24 | 20 | 4 | — | — | |||||||||||||||
Commodity and other commitments (5) | 1,286 | 500 | 550 | 128 | 108 | |||||||||||||||
Total contractual cash obligations (6) | $ | 14,506 | $ | 1,390 | $ | 1,876 | $ | 4,611 | $ | 6,629 | ||||||||||
59
(1) | ZENS obligations are included in the 2023 and thereafter column at their contingent principal amount as of December 31, 2017 of $505 million. These obligations are exchangeable for cash at any time at the option of the holders for 95% of the current value of the reference shares attributable to each ZENS ($960 million as of December 31, 2017), as discussed in Note 11 to our consolidated financial statements. |
(2) | We calculated estimated interest payments for long-term debt as follows: for fixed-rate debt and term debt, we calculated interest based on the applicable rates and payment dates; for variable-rate debt and/or non-term debt, we used interest rates in place as of December 31, 2017. We typically expect to settle such interest payments with cash flows from operations and short-term borrowings. |
(3) | For a discussion of operating leases, please read Note 15(c) to our consolidated financial statements. |
(4) | In 2018, we expect to contribute a minimum of approximately $60 million to our qualified pension plan. We expect to contribute approximately $7 million and $16 million, respectively, to our non-qualified pension and postretirement benefits plans in 2018. |
(5) | For a discussion of commodity and other commitments, please read Note 15(a) to our consolidated financial statements. |
(6) | This table does not include estimated future payments for expected future AROs. These payments are primarily estimated to be incurred after 2022. We record a separate liability for the fair value of AROs, which totaled $281 million as of December 31, 2017. See Note 3(c) to our consolidated financial statements. |
Off-Balance Sheet Arrangements
Other than operating leases, we have no off-balance sheet arrangements.
Regulatory Matters
Brazos Valley Connection Project
Construction began on the Brazos Valley Connection in February 2017, and Houston Electric expects to complete construction in the first quarter of 2018 and energize the Brazos Valley Connection in the early second quarter of 2018, ahead of the original June 1, 2018 energization date. Houston Electric anticipates that the final capital costs of the project will be approximately $285 million, which is within the estimated range of approximately $270-$310 million in the PUCT’s original order.
Bailey-Jones Creek Project
In April 2017, Houston Electric submitted a proposal to ERCOT requesting its endorsement of Houston Electric’s approximately $250 million transmission project in the greater Freeport, Texas area, which includes enhancements to two existing substations and the construction of a new 345 kV double-circuit transmission line. On December 12, 2017, Houston Electric received approval from ERCOT, and anticipates that the PUCT will provide a decision in 2019 regarding the design and route of the project.
Rate Change Applications
Houston Electric and CERC are routinely involved in rate change applications before state regulatory authorities. Those applications include general rate cases, where the entire cost of service of the utility is assessed and reset. In addition, Houston Electric is periodically involved in proceedings to adjust its capital tracking mechanisms (TCOS and DCRF) and annually files to adjust its EECRF. CERC is periodically involved in proceedings to adjust its capital tracking mechanisms in Texas (GRIP), its cost of service adjustments in Arkansas, Louisiana, Mississippi and Oklahoma (FRP, RSP, RRA and PBRC), its decoupling mechanism in Minnesota, and its energy efficiency cost trackers in Arkansas, Minnesota, Mississippi and Oklahoma (EECR, CIP, EECR and EECR). The table below reflects significant applications pending or completed during 2017 and to date in 2018.
60
Mechanism | Annual Increase (1) (in millions) | Filing Date | Effective Date | Approval Date | Additional Information | |||||
Houston Electric (PUCT) | ||||||||||
AMS | N/A | June 2017 | September 2017 | December 2017 | Final reconciliation of AMS surcharge for a $29.2 million refund of AMS revenue in excess of expenses, for which a reserve has been recorded. Refunds began in September 2017 and will continue through August 2018. | |||||
EECRF (2) | $11.0 | June 2017 | March 2018 | November 2017 | Annual reconciliation filing for program year 2016 and includes performance bonus of $11 million. | |||||
DCRF | 41.8 | April 2017 | September 2017 | July 2017 | Based on an increase in eligible distribution-invested capital for 2016 of $479 million. Unanimous Stipulation and Settlement Agreement was filed in June 2017 for $86.8 million (a $41.8 million annual increase). The settlement agreement also included the AMS refund referenced above. | |||||
TCOS | 7.8 | December 2016 | February 2017 | February 2017 | Based on an incremental increase in total rate base of $109.6 million. | |||||
TCOS | 39.3 | September 2017 | November 2017 | November 2017 | Based on an incremental increase in total rate base of $263.4 million. | |||||
TCOS | N/A | February 2018 | TBD | TBD | Revise TCOS application approved in November 2017 by a reduction of $41.6 million to recognize change in tax rates, amortize certain EDIT balances and adjust rate base by EDIT attributable to new plant since the last rate case, all of which are related to the TCJA. | |||||
South Texas and Beaumont/East Texas (Railroad Commission) | ||||||||||
GRIP | 7.6 | March 2017 | July 2017 | June 2017 | Based on net change in invested capital of $46.5 million. | |||||
Rate Case (South Texas only) | 0.5 | November 2017 | TBD | TBD | Reflects a proposed 10.3% ROE on a 55% equity ratio for South Texas jurisdiction. | |||||
Houston and Texas Coast (Railroad Commission) | ||||||||||
Rate Case | 16.5 | November 2016 | May 2017 | May 2017 | The Railroad Commission approved a unanimous settlement agreement establishing parameters for future GRIP filings, including a 9.6% ROE on a 55.15% equity ratio. | |||||
Texarkana, Texas Service Area (Multiple City Jurisdictions) | ||||||||||
Rate Case | 1.1 | July 2017 | September 2017 | August 2017 | Approved rates are consistent with Arkansas rates approved in 2016. | |||||
Arkansas (APSC) | ||||||||||
EECR (2) | 0.5 | May 2017 | January 2018 | September 2017 | Recovers $11.0 million, including an incentive of $0.5 million based on 2016 program performance. | |||||
FRP | 7.6 | April 2017 | October 2017 | September 2017 | Based on ROE of 9.5% as approved in the last rate case. Unanimous Settlement Agreement was filed in July 2017 for $7.6 million and was subsequently approved. | |||||
BDA | 3.9 | March 2017 | June 2017 | June 2017 | For the evaluation period between January 2016 and August 2016. Amounts are recorded during the evaluation period. | |||||
BDA | 16.5 | December 2017 | February 2018 | January 2018 | For the evaluation period between October 2016 and September 2017. Amounts are recorded during the evaluation period. | |||||
Minnesota (MPUC) | ||||||||||
Rate Case | 56.5 | August 2017 | TBD | TBD | Reflects a proposed 10.0% ROE on a 52.18% equity ratio. Includes a proposal to extend decoupling beyond current expiration date of June 2018. Interim rates reflecting an annual increase of $47.8 million were effective October 1, 2017. | |||||
CIP (2) | 13.8 | May 2017 | August 2017 | August 2017 | Annual reconciliation filing for program year 2016 and includes performance bonus of $13.8 million. | |||||
Decoupling | 20.4 | September 2017 | September 2017 | February 2018 | Reflects revenue under recovery for the period July 1, 2016 through June 30, 2017 and $3.0 million related to the under recovery of prior period adjustment factor. $9.2 million and $11.2 million was recognized in 2016 and 2017, respectively. | |||||
Mississippi (MPSC) | ||||||||||
RRA | 2.3 | May 2017 | July 2017 | July 2017 | Authorized ROE of 9.59% and a capital structure of 50% debt and 50% equity. | |||||
Louisiana (LPSC) | ||||||||||
RSP | 1.0 | September 2016 | December 2016 | April 2017 | Authorized ROE of 9.95% and a capital structure of 48% debt and 52% equity. | |||||
RSP | 3.0 | September 2017 | December 2017 | January 2018 | Authorized ROE of 9.95% and a capital structure of 48% debt and 52% equity. | |||||
Oklahoma (OCC) | ||||||||||
EECR (2) | 0.4 | March 2017 | November 2017 | October 2017 | Recovers $2.6 million, including an incentive of $0.4 million based on 2016 program performance. | |||||
PBRC | 2.2 | March 2017 | November 2017 | October 2017 | Based on ROE of 10%. | |||||
61
(1) | Represents proposed increases when effective date and/or approval date is not yet determined. Approved rates could differ materially from proposed rates. |
(2) | Amounts are recorded when approved. |
Tax Reform
For Houston Electric and CERC’s NGD, federal income tax expense is included in the rates approved by state commissions and local municipalities and charged by those utilities to consumers. When Houston Electric and NGD have general rate cases and other periodic rate adjustments, we expect the lower corporate tax expense resulting from the TCJA (which includes determining the treatment of EDIT), along with other increases and decreases in our revenue requirements, to be incorporated into Houston Electric’s and NGD’s future rates. Nevertheless, regulators may require us to respond to the TCJA in other ways, including through faster recoveries of reductions in federal income tax expense, accounting orders to reflect a liability to return to customers in future rate proceedings, accelerated returns to consumers of previously collected deferred federal income taxes, increased funding of infrastructure upgrades, or offsets of future rate increases. The effect on us of any potential return of tax savings resulting from the TCJA to consumers may differ depending on how each regulatory body requires us to return such savings.
On January 25, 2018, the PUCT issued an accounting order in Project No. 47945 directing electric utilities, including Houston Electric, to record as a regulatory liability (1) the difference between revenues collected under existing rates and revenues that would have been collected had the existing rates been set using the recently approved federal income tax rates and (2) the balance of EDIT that now exists because of the reduction in federal income tax rates. On February 13, 2018, Houston Electric and other likely parties to a future rate case announced a settlement that requires Houston Electric to make (i) a TCOS filing by February 20, 2018 to reflect the change in the federal income tax rate for Houston Electric’s transmission rate base through July 31, 2017 and account for certain EDIT (and such filing was timely submitted), (ii) a DCRF filing in April 2018 to reflect the change in the federal income tax rate for Houston Electric’s distribution rate base through December 31, 2017 and (iii) a full rate case filing by April 30, 2019. The settlement was presented to the PUCT during its open meeting on February 15, 2018. In response to the settlement, the PUCT did not proceed with a prior proposal to require Houston Electric to file a rate case in the summer of 2018. The PUCT also amended its prior accounting order to remove the requirement that utilities include carrying costs in the new regulatory liability.
PHMSA Matters
On December 19, 2016, PHMSA published in the Federal Register an interim final rule to impose industry-developed recommendations as enforceable safety standards for downhole (underground) equipment, including wells, wellbore tubing, and casing, at both interstate and intrastate underground natural gas storage facilities. Both CERC and Enable own and operate underground storage facilities that are subject to this rule’s provisions, which include procedures and practices for operations, maintenance, threat identification, monitoring, assessment, site security, emergency response and preparedness, training and recordkeeping. Although not yet finalized, the interim rule went into effect on January 18, 2017, with an announced compliance deadline of January 18, 2018. PHMSA determined, however, that it will not issue enforcement citations to any operators for violations of provisions of the interim final rule that had previously been non-mandatory provisions of American Petroleum Institute Recommended Practices 1170 and 1171 until one year after PHMSA issues a final rule, which has not yet been issued. This matter remains ongoing and subject to future PHMSA determinations. CERC and Enable will continue to monitor developments and assess the potential impact of any modifications to this rule.
Other Matters
Credit Facilities
Our revolving credit facilities may be drawn on by the companies from time to time to provide funds used for general corporate purposes, including to backstop the companies’ commercial paper programs. The facilities may also be utilized to obtain letters of credit. For further details related to our revolving credit facilities and the 2017 amendments, please see Note 13 to our consolidated financial statements.
62
As of February 9, 2018, we had the following facilities:
Company | Size of Facility | Amount Utilized as of February 9, 2018 (1) | Termination Date | |||||||
(in millions) | ||||||||||
CenterPoint Energy | $ | 1,700 | $ | 877 | (2) | March 3, 2022 | ||||
Houston Electric | 300 | 4 | (3) | March 3, 2022 | ||||||
CERC Corp. | 900 | 899 | (4) | March 3, 2022 | ||||||
(1) | Based on the consolidated debt to capitalization covenant in our revolving credit facility and the revolving credit facility of each of Houston Electric and CERC Corp., we would have been permitted to utilize the full capacity of such revolving credit facilities, which aggregated $2.9 billion as of December 31, 2017. |
(2) | Represents outstanding commercial paper of $871 million and outstanding letters of credit of $6 million. |
(3) | Represents outstanding letters of credit. |
(4) | Represents outstanding commercial paper of $898 million and outstanding letters of credit of $1 million. |
Borrowings under each of the three revolving credit facilities are subject to customary terms and conditions. However, there is no requirement that the borrower make representations prior to borrowings as to the absence of material adverse changes or litigation that could be expected to have a material adverse effect. Borrowings under each of the revolving credit facilities are subject to acceleration upon the occurrence of events of default that we consider customary. The revolving credit facilities also provide for customary fees, including commitment fees, administrative agent fees, fees in respect of letters of credit and other fees. In each of the three revolving credit facilities, the spread to LIBOR and the commitment fees fluctuate based on the borrower’s credit rating. The borrowers are currently in compliance with the various business and financial covenants in the three revolving credit facilities.
Long-term Debt
In 2017, we and CERC Corp. retired or redeemed a combined $800 million aggregate principal amount of unsecured senior notes. Additionally, we issued $500 million aggregate principal amount of unsecured senior notes, CERC Corp. issued $300 million aggregate principal amount of unsecured senior notes and Houston Electric issued $300 million aggregate principal amount of general mortgage bonds. For further information about our 2017 debt transactions, see Note 13 to our consolidated financial statements.
Securities Registered with the SEC
On January 31, 2017, CenterPoint Energy, Houston Electric and CERC Corp. filed a joint shelf registration statement with the SEC registering indeterminate principal amounts of Houston Electric’s general mortgage bonds, CERC Corp.’s senior debt securities and CenterPoint Energy’s senior debt securities and junior subordinated debt securities and an indeterminate number of CenterPoint Energy’s shares of common stock, shares of preferred stock, as well as stock purchase contracts and equity units. The joint shelf registration statement will expire on January 31, 2020.
Temporary Investments
As of February 9, 2018, we had no temporary investments.
Money Pool
We have a money pool through which the holding company and participating subsidiaries can borrow or invest on a short-term basis. Funding needs are aggregated and external borrowing or investing is based on the net cash position. The net funding requirements of the money pool are expected to be met with borrowings under our revolving credit facility or the sale of our commercial paper.
63
Impact on Liquidity of a Downgrade in Credit Ratings
The interest on borrowings under our credit facilities is based on our credit rating. On December 4, 2017, S&P revised its rating outlooks on senior debt of CenterPoint Energy, Houston Electric and CERC Corp. to stable from positive and affirmed its ratings. On September 24, 2017, Fitch upgraded Houston Electric’s senior secured debt rating to A+ and maintained its rating outlook of stable. In addition, Fitch revised its rating outlooks on senior debt of CenterPoint Energy and CERC Corp. to positive from stable and affirmed its ratings.
As of February 9, 2018, Moody’s, S&P and Fitch had assigned the following credit ratings to senior debt of CenterPoint Energy and certain subsidiaries:
Moody’s | S&P | Fitch | ||||||||||
Company/Instrument | Rating | Outlook (1) | Rating | Outlook (2) | Rating | Outlook (3) | ||||||
CenterPoint Energy Senior Unsecured Debt | Baa1 | Stable | BBB+ | Stable | BBB | Positive | ||||||
Houston Electric Senior Secured Debt | A1 | Stable | A | Stable | A+ | Stable | ||||||
CERC Corp. Senior Unsecured Debt | Baa2 | Stable | A- | Stable | BBB | Positive | ||||||
(1) | A Moody’s rating outlook is an opinion regarding the likely direction of an issuer’s rating over the medium term. |
(2) | An S&P rating outlook assesses the potential direction of a long-term credit rating over the intermediate to longer term. |
(3) | A Fitch rating outlook indicates the direction a rating is likely to move over a one- to two-year period. |
We cannot assure that the ratings set forth above will remain in effect for any given period of time or that one or more of these ratings will not be lowered or withdrawn entirely by a rating agency. We note that these credit ratings are included for informational purposes and are not recommendations to buy, sell or hold our securities and may be revised or withdrawn at any time by the rating agency. Each rating should be evaluated independently of any other rating. Any future reduction or withdrawal of one or more of our credit ratings could have a material adverse impact on our ability to obtain short- and long-term financing, the cost of such financings and the execution of our commercial strategies.
A decline in credit ratings could increase borrowing costs under our revolving credit facilities. If our credit ratings or those of Houston Electric or CERC Corp. had been downgraded one notch by each of the three principal credit rating agencies from the ratings that existed at December 31, 2017, the impact on the borrowing costs under the three revolving credit facilities would have been immaterial. A decline in credit ratings would also increase the interest rate on long-term debt to be issued in the capital markets and could negatively impact our ability to complete capital market transactions and to access the commercial paper market. Additionally, a decline in credit ratings could increase cash collateral requirements and reduce earnings of our Natural Gas Distribution and Energy Services business segments.
CES, a wholly-owned subsidiary of CERC Corp. operating in our Energy Services business segment, provides natural gas sales and services primarily to commercial and industrial customers and electric and natural gas utilities throughout the United States. To economically hedge its exposure to natural gas prices, CES uses derivatives with provisions standard for the industry, including those pertaining to credit thresholds. Typically, the credit threshold negotiated with each counterparty defines the amount of unsecured credit that such counterparty will extend to CES. To the extent that the credit exposure that a counterparty has to CES at a particular time does not exceed that credit threshold, CES is not obligated to provide collateral. Mark-to-market exposure in excess of the credit threshold is routinely collateralized by CES. Similarly, mark-to-market exposure offsetting and exceeding the credit threshold may cause the counterparty to provide collateral to CES. As of December 31, 2017, the amount posted by CES as collateral aggregated approximately $41 million. Should the credit ratings of CERC Corp. (as the credit support provider for CES) fall below certain levels, CES would be required to provide additional collateral up to the amount of its previously unsecured credit limit. We estimate that as of December 31, 2017, unsecured credit limits extended to CES by counterparties aggregated $348 million, and $2 million of such amount was utilized.
Pipeline tariffs and contracts typically provide that if the credit ratings of a shipper or the shipper’s guarantor drop below a threshold level, which is generally investment grade ratings from both Moody’s and S&P, cash or other collateral may be demanded from the shipper in an amount equal to the sum of three months’ charges for pipeline services plus the unrecouped cost of any lateral built for such shipper. If the credit ratings of CERC Corp. decline below the applicable threshold levels, CERC Corp. might need to provide cash or other collateral of as much as $196 million as of December 31, 2017. The amount of collateral will depend on seasonal variations in transportation levels.
64
ZENS and Securities Related to ZENS
If our creditworthiness were to drop such that ZENS holders thought our liquidity was adversely affected or the market for the ZENS were to become illiquid, some ZENS holders might decide to exchange their ZENS for cash. Funds for the payment of cash upon exchange could be obtained from the sale of the shares of TW Securities that we own or from other sources. We own shares of TW Securities equal to approximately 100% of the reference shares used to calculate our obligation to the holders of the ZENS. ZENS exchanges result in a cash outflow because tax deferrals related to the ZENS and TW Securities shares would typically cease when ZENS are exchanged or otherwise retired and TW Securities shares are sold. The ultimate tax liability related to the ZENS continues to increase by the amount of the tax benefit realized each year, and there could be a significant cash outflow when the taxes are paid as a result of the retirement of the ZENS. If all ZENS had been exchanged for cash on December 31, 2017, deferred taxes of approximately $521 million would have been payable in 2017, based on 2017 tax rates in effect. If all the TW Securities had been sold on December 31, 2017, capital gains taxes of approximately $297 million would have been payable in 2017.
For additional information about ZENS, see Note 11 to our consolidated financial statements.
Cross Defaults
Under our revolving credit facility, a payment default on, or a non-payment default that permits acceleration of, any indebtedness for borrowed money and certain other specified types of obligations (including guarantees) exceeding $125 million by us or any of our significant subsidiaries will cause a default. A default by CenterPoint Energy would not trigger a default under our subsidiaries’ debt instruments or revolving credit facilities.
Possible Acquisitions, Divestitures and Joint Ventures
From time to time, we consider the acquisition or the disposition of assets or businesses or possible joint ventures, strategic initiatives or other joint ownership arrangements with respect to assets or businesses. Any determination to take action in this regard will be based on market conditions and opportunities existing at the time, and accordingly, the timing, size or success of any efforts and the associated potential capital commitments are unpredictable. We may seek to fund all or part of any such efforts with proceeds from debt and/or equity issuances. Debt or equity financing may not, however, be available to us at that time due to a variety of events, including, among others, maintenance of our credit ratings, industry conditions, general economic conditions, market conditions and market perceptions.
In February 2016, we announced that we were evaluating strategic alternatives for our investment in Enable, including a sale or spin-off qualifying under Section 355 of the U.S. Internal Revenue Code. We have determined that we will no longer pursue a spin option at this time. More recently, we announced that late-stage discussions with a third party regarding a transaction involving our investment in Enable had terminated because an agreement on mutually acceptable terms could not be reached. We may reduce our ownership in Enable over time through sales in the public equity markets, or otherwise, of the common units we hold, subject to market conditions. Although a transaction for all our interests in Enable is not viable at this time, we may pursue such a transaction if it is viable in the future. There can be no assurances that we will engage in any specific action or that any sale transaction or any sale of common units in the public equity markets or otherwise will be completed, and we do not intend to disclose further developments unless and until our Board of Directors approves a specific action or as otherwise required by applicable law or NYSE regulations. Any sale transaction or sale of common units in the public equity markets or otherwise may involve significant costs and expenses, including, in connection with any public offering, a significant underwriting discount. We may not realize any or all of the anticipated strategic, financial, operational or other benefits from any completed sale or reduction in our investment in Enable.
Enable Midstream Partners
We receive quarterly cash distributions from Enable on its common units and Series A Preferred Units we own. A reduction in the cash distributions we receive from Enable could significantly impact our liquidity. For additional information about cash distributions from Enable, see Notes 10 and 19 to our consolidated financial statements.
Hedging of Interest Expense for Future Debt Issuances
During 2016, 2017 and 2018, we entered into forward interest rate agreements to hedge, in part, volatility in the U.S. treasury rates by reducing variability in cash flows related to interest payments. For further information, see Note 8(a) to our consolidated financial statements.
65
Weather Hedge
We have historically entered into partial weather hedges for certain NGD jurisdictions and Houston Electric’s service territory to mitigate the impact of fluctuations from normal weather. We remain exposed to some weather risk as a result of the partial hedges. For more information about our weather hedges, see Note 8(a) to our consolidated financial statements.
Collection of Receivables from REPs
Houston Electric’s receivables from the distribution of electricity are collected from REPs that supply the electricity Houston Electric distributes to their customers. Adverse economic conditions, structural problems in the market served by ERCOT or financial difficulties of one or more REPs could impair the ability of these REPs to pay for Houston Electric’s services or could cause them to delay such payments. Houston Electric depends on these REPs to remit payments on a timely basis, and any delay or default in payment by REPs could adversely affect Houston Electric’s cash flows. In the event of a REP’s default, Houston Electric’s tariff provides a number of remedies, including the option for Houston Electric to request that the PUCT suspend or revoke the certification of the REP. Applicable regulatory provisions require that customers be shifted to another REP or a provider of last resort if a REP cannot make timely payments. However, Houston Electric remains at risk for payments related to services provided prior to the shift to the replacement REP or the provider of last resort. If a REP were unable to meet its obligations, it could consider, among various options, restructuring under the bankruptcy laws, in which event such REP might seek to avoid honoring its obligations, and claims might be made against Houston Electric involving payments it had received from such REP. If a REP were to file for bankruptcy, Houston Electric may not be successful in recovering accrued receivables owed by such REP that are unpaid as of the date the REP filed for bankruptcy. However, PUCT regulations authorize utilities, such as Houston Electric, to defer bad debts resulting from defaults by REPs for recovery in future rate cases, subject to a review of reasonableness and necessity.
Other Factors that Could Affect Cash Requirements
In addition to the above factors, our liquidity and capital resources could be affected by:
• | cash collateral requirements that could exist in connection with certain contracts, including our weather hedging arrangements, and gas purchases, gas price and gas storage activities of our Natural Gas Distribution and Energy Services business segments; |
• | acceleration of payment dates on certain gas supply contracts, under certain circumstances, as a result of increased gas prices and concentration of natural gas suppliers; |
• | increased costs related to the acquisition of natural gas; |
• | increases in interest expense in connection with debt refinancings and borrowings under credit facilities; |
• | various legislative or regulatory actions; |
• | incremental collateral, if any, that may be required due to regulation of derivatives; |
• | the ability of GenOn and its subsidiaries, currently the subject of bankruptcy proceedings, to satisfy their obligations in respect of GenOn’s indemnity obligations to us and our subsidiaries; |
• | the ability of REPs, including REP affiliates of NRG and Vistra Energy Corp., formerly known as TCEH Corp., to satisfy their obligations to us and our subsidiaries; |
• | slower customer payments and increased write-offs of receivables due to higher gas prices or changing economic conditions; |
• | the outcome of litigation brought by or against us; |
• | contributions to pension and postretirement benefit plans; |
66
• | restoration costs and revenue losses resulting from future natural disasters such as hurricanes and the timing of recovery of such restoration costs; and |
• | various other risks identified in “Risk Factors” in Item 1A of Part I of this report. |
Certain Contractual Limits on Our Ability to Issue Securities and Borrow Money
Houston Electric has contractually agreed that it will not issue additional first mortgage bonds, subject to certain exceptions. For information about the total debt to capitalization financial covenants in our revolving credit facilities see Note 13 to our consolidated financial statements.
CRITICAL ACCOUNTING POLICIES
A critical accounting policy is one that is both important to the presentation of our financial condition and results of operations and requires management to make difficult, subjective or complex accounting estimates. An accounting estimate is an approximation made by management of a financial statement element, item or account in the financial statements. Accounting estimates in our historical consolidated financial statements measure the effects of past business transactions or events, or the present status of an asset or liability. The accounting estimates described below require us to make assumptions about matters that are highly uncertain at the time the estimate is made. Additionally, different estimates that we could have used or changes in an accounting estimate that are reasonably likely to occur could have a material impact on the presentation of our financial condition, results of operations or cash flows. The circumstances that make these judgments difficult, subjective and/or complex have to do with the need to make estimates about the effect of matters that are inherently uncertain. Estimates and assumptions about future events and their effects cannot be predicted with certainty. We base our estimates on historical experience and on various other assumptions that we believe to be reasonable under the circumstances, the results of which form the basis for making judgments. These estimates may change as new events occur, as more experience is acquired, as additional information is obtained and as our operating environment changes. Our significant accounting policies are discussed in Note 2 to our consolidated financial statements. We believe the following accounting policies involve the application of critical accounting estimates. Accordingly, these accounting estimates have been reviewed and discussed with the Audit Committee of the Board of Directors.
Accounting for Rate Regulation
Accounting guidance for regulated operations provides that rate-regulated entities account for and report assets and liabilities consistent with the recovery of those incurred costs in rates if the rates established are designed to recover the costs of providing the regulated service and if the competitive environment makes it probable that such rates can be charged and collected. Our Electric Transmission & Distribution business segment and our Natural Gas Distribution business segment apply this accounting guidance. Certain expenses and revenues subject to utility regulation or rate determination normally reflected in income are deferred on the balance sheet as regulatory assets or liabilities and are recognized in income as the related amounts are included in service rates and recovered from or refunded to customers. Regulatory assets and liabilities are recorded when it is probable that these items will be recovered or reflected in future rates. Determining probability requires significant judgment on the part of management and includes, but is not limited to, consideration of testimony presented in regulatory hearings, proposed regulatory decisions, final regulatory orders and the strength or status of applications for rehearing or state court appeals. If events were to occur that would make the recovery of these assets and liabilities no longer probable, we would be required to write off or write down these regulatory assets and liabilities. For further detail on our regulatory assets and liabilities, see Note 6 to our consolidated financial statements.
Impairment of Long-Lived Assets, Including Identifiable Intangibles, Goodwill and Equity Method Investments
We review the carrying value of our long-lived assets, including identifiable intangibles, goodwill and equity method investments whenever events or changes in circumstances indicate that such carrying values may not be recoverable, and at least annually for goodwill as required by accounting guidance for goodwill and other intangible assets. Unforeseen events and changes in market conditions could have a material effect on the value of long-lived assets, including intangibles, goodwill and equity method investments due to changes in estimates of future cash flows, interest rate and regulatory matters and could result in an impairment charge. A loss in value of an equity method investment is recognized when the decline is deemed to be other than temporary. We recorded no goodwill impairments during 2017, 2016 and 2015. We did not record material impairments to long-lived assets, including intangibles, during 2017, 2016 and 2015. We recorded impairments totaling $1,225 million to our equity method investment during 2015 and no impairment during 2017 and 2016. See Notes 9 and 10 to our consolidated financial statements for further discussion of the impairments recorded to our equity method investment in 2015.
67
We performed our annual goodwill impairment test in the third quarter of 2017 and determined, based on the results of the first step, using the income approach, no impairment charge was required for any reporting unit. Our reporting units approximate our reportable segments.
Fair value is the amount at which the asset could be bought or sold in a current transaction between willing parties and may be estimated using a number of techniques, including quoted market prices or valuations by third parties, present value techniques based on estimates of cash flows, or multiples of earnings or revenue performance measures. The fair value of the asset could be different using different estimates and assumptions in these valuation techniques.
The determination of fair value requires significant assumptions by management which are subjective and forward-looking in nature. To assist in making these assumptions, we utilized a third-party valuation specialist in both determining and testing key assumptions used in the valuation of each of our reporting units. We based our assumptions on projected financial information that we believe is reasonable; however, actual results may differ materially from those projections. These projected cash flows factor in planned growth initiatives, and for our Natural Gas Distribution reporting unit, the regulatory environment. The fair values of our Natural Gas Distribution and Energy Services reporting units significantly exceeded the carrying values.
Although there was not a goodwill asset impairment in our 2017 annual test, an interim impairment test could be triggered by the following: actual earnings results that are materially lower than expected, significant adverse changes in the operating environment, an increase in the discount rate, changes in other key assumptions which require judgment and are forward looking in nature, or if our market capitalization falls below book value for an extended period of time. No impairment triggers were identified subsequent to our 2017 annual test.
During the year ended December 31, 2015, we determined that an other than temporary decrease in the value of our investment in Enable had occurred. The impairment analysis compared the estimated fair value of our investment in Enable to its carrying value. The fair value of the investment was determined using multiple valuation methodologies under both the market and income approaches.
Key assumptions in the market approach include recent market transactions of comparable companies and EBITDA to total enterprise multiples for comparable companies. Due to volatility of the quoted price of Enable’s common units, a volume weighted average price was used under the market approach to best approximate fair value at the measurement date. Key assumptions in the income approach include Enable’s forecasted cash distributions, projected cash flows of incentive distribution rights, forecasted growth rate of Enable’s cash distributions beyond 2020, and the discount rate used to determine the present value of the estimated future cash flows. A weighing of the different approaches was utilized to determine the estimated fair value of our investment in Enable.
As a result of the analysis, we recorded other than temporary impairments on our equity method investment in Enable of $1,225 million during the year ended December 31, 2015. We based our assumptions on projected financial information that we believe is reasonable; however, actual results may differ materially from those projections. It is reasonably possible that the estimate of the impairment of our equity method investment in Enable will change in the near term due to the following: actual Enable cash distribution is materially lower than expected, significant adverse changes in Enable’s operating environment, increase in the discount rate, and changes in other key assumptions which require judgment and are forward-looking in nature.
Unbilled Energy Revenues
Revenues related to electricity delivery and natural gas sales and services are generally recognized upon delivery to customers. However, the determination of deliveries to individual customers is based on the reading of their meters, which is performed on a systematic basis throughout the month either electronically through AMS meter communications or manual readings. At the end of each month, deliveries to non-AMS customers since the date of the last meter reading are estimated and the corresponding unbilled revenue is estimated. Information regarding deliveries to AMS customers after the last billing is obtained from actual AMS meter usage data. Unbilled electricity delivery revenue is estimated each month based on actual AMS meter data, daily supply volumes and applicable rates. Unbilled natural gas sales are estimated based on estimated purchased gas volumes, estimated lost and unaccounted for gas and tariffed rates in effect. As additional information becomes available, or actual amounts are determinable, the recorded estimates are revised. Consequently, operating results can be affected by revisions to prior accounting estimates.
Pension and Other Retirement Plans
We sponsor pension and other retirement plans in various forms covering all employees who meet eligibility requirements. We use several statistical and other factors that attempt to anticipate future events in calculating the expense and liability related
68
to our plans. These factors include assumptions about the discount rate, expected return on plan assets and rate of future compensation increases as estimated by management, within certain guidelines. In addition, our actuarial consultants use subjective factors such as withdrawal and mortality rates. The actuarial assumptions used may differ materially from actual results due to changing market and economic conditions, higher or lower withdrawal rates or longer or shorter life spans of participants. These differences may result in a significant impact to the amount of pension expense recorded. Please read “— Other Significant Matters — Pension Plans” for further discussion.
NEW ACCOUNTING PRONOUNCEMENTS
See Note 2(p) to our consolidated financial statements, incorporated herein by reference, for a discussion of new accounting pronouncements that affect us.
OTHER SIGNIFICANT MATTERS
Pension Plans. As discussed in Note 7(b) to our consolidated financial statements, we maintain a non-contributory qualified defined benefit pension plan covering substantially all employees. Employer contributions for the qualified plan are based on actuarial computations that establish the minimum contribution required under ERISA and the maximum deductible contribution for income tax purposes.
Under the terms of our pension plan, we reserve the right to change, modify or terminate the plan. Our funding policy is to review amounts annually and contribute an amount at least equal to the minimum contribution required under ERISA.
The minimum funding requirements for the qualified pension plan were $39 million, $-0- and $-0- for 2017, 2016 and 2015, respectively. We made contributions of $39 million, $-0- million and $35 million in 2017, 2016 and 2015 for the respective years. We expect to contribute a minimum of approximately $60 million to the qualified pension plan in 2018.
Additionally, we maintain an unfunded non-qualified benefit restoration plan that allows participants to receive the benefits to which they would have been entitled under our non-contributory qualified pension plan except for the federally mandated limits on qualified plan benefits or on the level of compensation on which qualified plan benefits may be calculated. Employer contributions for the non-qualified benefit restoration plan represent benefit payments made to participants and totaled $9 million, $9 million and $31 million in 2017, 2016 and 2015, respectively. We expect to make contributions aggregating approximately $7 million in 2018.
Changes in pension obligations and assets may not be immediately recognized as pension expense in the income statement, but generally are recognized in future years over the remaining average service period of plan participants. As such, significant portions of pension expense recorded in any period may not reflect the actual level of benefit payments provided to plan participants.
As the sponsor of a plan, we are required to (a) recognize on our balance sheet as an asset a plan’s over-funded status or as a liability such plan’s under-funded status, (b) measure a plan’s assets and obligations as of the end of our fiscal year and (c) recognize changes in the funded status of our plans in the year that changes occur through adjustments to other comprehensive income and regulatory assets.
The projected benefit obligation for all defined benefit pension plans was $2,225 million and $2,197 million as of December 31, 2017 and 2016, respectively.
As of December 31, 2017, the projected benefit obligation exceeded the market value of plan assets of our pension plans by $424 million. Changes in interest rates or the market values of the securities held by the plan during 2018 could materially, positively or negatively, change our funded status and affect the level of pension expense and required contributions.
Pension cost was $95 million, $102 million and $90 million for 2017, 2016 and 2015, respectively, of which $71 million, $67 million and $59 million impacted pre-tax earnings, respectively. Included in the 2015 pension costs was a $10 million settlement charge as discussed below.
A one-time, non-cash settlement charge is required when lump sum distributions or other settlements of plan benefit obligations during the year exceed the service cost and interest cost components of net periodic cost for the year. Due to the amount of lump sum payment distributions from the non-qualified pension plan during the year ended December 31, 2015, CenterPoint Energy recognized a non-cash settlement charge of $10 million. This charge is an acceleration of costs that would otherwise be recognized in future periods.
69
The calculation of pension expense and related liabilities requires the use of assumptions. Changes in these assumptions can result in different expense and liability amounts, and future actual experience can differ from the assumptions. Two of the most critical assumptions are the expected long-term rate of return on plan assets and the assumed discount rate.
As of December 31, 2017, our qualified pension plan had an expected long-term rate of return on plan assets of 6.00%, which is unchanged from the rate assumed as of December 31, 2016. The expected rate of return assumption was developed using the targeted asset allocation of our plans and the expected return for each asset class. We regularly review our actual asset allocation and periodically rebalance plan assets to reduce volatility and better match plan assets and liabilities.
As of December 31, 2017, the projected benefit obligation was calculated assuming a discount rate of 3.65%, which is 0.50% lower than the 4.15% discount rate assumed as of December 31, 2016. The discount rate was determined by reviewing yields on high-quality bonds that receive one of the two highest ratings given by a recognized rating agency and the expected duration of pension obligations specific to the characteristics of our plan.
Our actuarially determined pension and other postemployment expense for 2017 and 2016 that is greater or less than the amounts being recovered through rates in certain jurisdictions is deferred as a regulatory asset or liability, respectively. Pension cost for 2018, including the benefit restoration plan, is estimated to be $61 million, of which we expect approximately $58 million to impact pre-tax earnings after effecting such deferrals and capitalization, based on an expected return on plan assets of 6.00% and a discount rate of 3.65% as of December 31, 2017. If the expected return assumption were lowered by 0.50% from 6.00% to 5.50%, 2018 pension cost would increase by approximately $9 million.
As of December 31, 2017, the pension plan projected benefit obligation, including the unfunded benefit restoration plan, exceeded plan assets by $424 million. If the discount rate were lowered by 0.50% from 3.65% to 3.15%, the assumption change would increase our projected benefit obligation by approximately $124 million and decrease our 2018 pension expense by approximately $2 million. The expected reduction in pension expense due to the decrease in discount rate is a result of the expected correlation between the reduced interest rate and appreciation of fixed income assets in pension plans with significantly more fixed income instruments than equity instruments. In addition, the assumption change would impact our Consolidated Balance Sheet by increasing the regulatory asset recorded as of December 31, 2017 by $107 million and would result in a charge to comprehensive income in 2017 of $13 million, net of tax.
Future changes in plan asset returns, assumed discount rates and various other factors related to the pension plans will impact our future pension expense and liabilities. We cannot predict with certainty what these factors will be in the future.
Item 7A. Quantitative and Qualitative Disclosures About Market Risk
Impact of Changes in Interest Rates, Equity Prices and Energy Commodity Prices
We are exposed to various market risks. These risks arise from transactions entered into in the normal course of business and are inherent in our consolidated financial statements. Most of the revenues and income from our business activities are affected by market risks. Categories of market risk include exposure to commodity prices through non-trading activities, interest rates and equity prices. A description of each market risk is set forth below:
• | Interest rate risk primarily results from exposures to changes in the level of borrowings and changes in interest rates. |
• | Equity price risk results from exposures to changes in prices of individual equity securities. |
• | Commodity price risk results from exposures to changes in spot prices, forward prices and price volatilities of commodities, such as natural gas, NGLs and other energy commodities. |
Management has established comprehensive risk management policies to monitor and manage these market risks.
Interest Rate Risk
As of December 31, 2017, we had outstanding long-term debt, lease obligations and obligations under our ZENS that subject us to the risk of loss associated with movements in market interest rates.
Our floating rate obligations aggregated $1.8 billion and $1.4 billion as of December 31, 2017 and 2016, respectively. If the floating interest rates were to increase by 10% from December 31, 2017 rates, our combined interest expense would increase by $3 million annually.
70
As of December 31, 2017 and 2016, we had outstanding fixed-rate debt (excluding indexed debt securities) aggregating $7 billion and $7.1 billion, respectively, in principal amount and having a fair value of $7.5 billion and $7.5 billion, respectively. Because these instruments are fixed-rate, they do not expose us to the risk of loss in earnings due to changes in market interest rates (see Note 13 to our consolidated financial statements). However, the fair value of these instruments would increase by approximately $218 million if interest rates were to decline by 10% from their levels as of December 31, 2017. In general, such an increase in fair value would impact earnings and cash flows only if we were to reacquire all or a portion of these instruments in the open market prior to their maturity.
As discussed in Note 11 to our consolidated financial statements, the ZENS obligation is bifurcated into a debt component and a derivative component. The debt component of $122 million at December 31, 2017 was a fixed-rate obligation and, therefore, did not expose us to the risk of loss in earnings due to changes in market interest rates. However, the fair value of the debt component would increase by approximately $19 million if interest rates were to decline by 10% from levels at December 31, 2017. Changes in the fair value of the derivative component, a $668 million recorded liability at December 31, 2017, are recorded in our Statements of Consolidated Income and, therefore, we are exposed to changes in the fair value of the derivative component as a result of changes in the underlying risk-free interest rate. If the risk-free interest rate were to increase by 10% from December 31, 2017 levels, the fair value of the derivative component liability would increase by approximately $6 million, which would be recorded as an unrealized loss in our Statements of Consolidated Income.
Equity Market Value Risk
We are exposed to equity market value risk through our ownership of 7.1 million shares of TW Common, 0.9 million shares of Time Common and 0.9 million shares of Charter Common, which we hold to facilitate our ability to meet our obligations under the ZENS. See Note 11 to our consolidated financial statements for a discussion of our ZENS obligation. Changes in the fair value of the TW Securities held by CenterPoint Energy are expected to substantially offset changes in the fair value of the derivative component of the ZENS. A decrease of 10% from the December 31, 2017 aggregate market value of these shares would result in a net loss of approximately $2 million, which would be recorded as an unrealized loss in our Statements of Consolidated Income.
Commodity Price Risk From Non-Trading Activities
We manage these risk exposures through the implementation of our risk management policies and framework. We manage our commodity price risk exposures through the use of derivative financial instruments and derivative commodity instrument contracts. During the normal course of business, we review our hedging strategies and determine the hedging approach we deem appropriate based upon the circumstances of each situation.
Derivative instruments such as futures, forward contracts, swaps and options derive their value from underlying assets, indices, reference rates or a combination of these factors. These derivative instruments include negotiated contracts, which are referred to as over-the-counter derivatives, and instruments that are listed and traded on an exchange.
Derivative transactions are entered into in our non-trading operations to manage and hedge certain exposures, such as exposure to changes in natural gas prices. We believe that the associated market risk of these instruments can best be understood relative to the underlying assets or risk being hedged.
We use derivative instruments as economic hedges to offset the commodity price exposure inherent in our businesses. The commodity risk created by these instruments, including the offsetting impact on the market value of natural gas inventory, is described below. We measure this commodity risk using a sensitivity analysis. For purposes of this analysis, we estimate commodity price risk by applying a $0.50 change in the forward NYMEX price to our net open fixed price position (including forward fixed price physical contracts, natural gas inventory and fixed price financial contracts) at the end of each period. As of December 31, 2017, the recorded fair value of our non-trading energy derivatives was a net asset of $111 million (before collateral), all of which is related to our Energy Services business segment. A $0.50 change in the forward NYMEX price would have had a combined impact of $5 million on our non-trading energy derivatives net asset and the market value of natural gas inventory.
Commodity price risk is not limited to changes in forward NYMEX prices. Variation of commodity pricing between the different indices used to mark to market portions of our natural gas inventory (Gas Daily) and the related fair value hedge (NYMEX) can result in volatility to our net income. Over time, any gains or losses on the sale of storage gas inventory would be offset by gains or losses on the fair value hedges.
71
Item 8. Financial Statements and Supplementary Data
REPORT OF INDEPENDENT REGISTERED PUBLIC ACCOUNTING FIRM
To the Board of Directors and Shareholders of
CenterPoint Energy, Inc.
Houston, Texas
Opinion on the Financial Statements
We have audited the accompanying consolidated balance sheets of CenterPoint Energy, Inc. and subsidiaries (the "Company") as of December 31, 2017 and 2016, the related statements of consolidated income, comprehensive income, shareholders' equity, and cash flows, for each of the three years in the period ended December 31, 2017, and the related notes (collectively referred to as the "financial statements"). In our opinion, the financial statements present fairly, in all material respects, the financial position of the Company as of December 31, 2017 and 2016, and the results of its operations and its cash flows for each of the three years in the period ended December 31, 2017, in conformity with accounting principles generally accepted in the United States of America.
We have also audited, in accordance with the standards of the Public Company Accounting Oversight Board (United States) (PCAOB), the Company's internal control over financial reporting as of December 31, 2017, based on criteria established in Internal Control - Integrated Framework (2013) issued by the Committee of Sponsoring Organizations of the Treadway Commission and our report dated February 22, 2018, expressed an unqualified opinion on the Company's internal control over financial reporting.
Basis for Opinion
These financial statements are the responsibility of the Company's management. Our responsibility is to express an opinion on the Company's financial statements based on our audits. We are a public accounting firm registered with the PCAOB and are required to be independent with respect to the Company in accordance with the U.S. federal securities laws and the applicable rules and regulations of the Securities and Exchange Commission and the PCAOB.
We conducted our audits in accordance with the standards of the PCAOB. Those standards require that we plan and perform the audit to obtain reasonable assurance about whether the financial statements are free of material misstatement, whether due to error or fraud. Our audits included performing procedures to assess the risks of material misstatement of the financial statements, whether due to error or fraud, and performing procedures that respond to those risks. Such procedures included examining, on a test basis, evidence regarding the amounts and disclosures in the financial statements. Our audits also included evaluating the accounting principles used and significant estimates made by management, as well as evaluating the overall presentation of the financial statements. We believe that our audits provide a reasonable basis for our opinion.
/s/ DELOITTE & TOUCHE LLP
Houston, Texas
February 22, 2018
We have served as the Company's auditor since 1932.
72
CENTERPOINT ENERGY, INC. AND SUBSIDIARIES
STATEMENTS OF CONSOLIDATED INCOME
Year Ended December 31, | |||||||||||
2017 | 2016 | 2015 | |||||||||
(in millions, except per share amounts) | |||||||||||
Revenues: | |||||||||||
Utility revenues | $ | 5,603 | $ | 5,440 | $ | 5,448 | |||||
Non-utility revenues | 4,011 | 2,088 | 1,938 | ||||||||
Total | 9,614 | 7,528 | 7,386 | ||||||||
Expenses: | |||||||||||
Utility natural gas | 1,109 | 983 | 1,264 | ||||||||
Non-utility natural gas | 3,785 | 1,983 | 1,838 | ||||||||
Operation and maintenance | 2,221 | 2,093 | 2,007 | ||||||||
Depreciation and amortization | 1,036 | 1,126 | 970 | ||||||||
Taxes other than income taxes | 391 | 384 | 374 | ||||||||
Total | 8,542 | 6,569 | 6,453 | ||||||||
Operating Income | 1,072 | 959 | 933 | ||||||||
Other Income (Expense): | |||||||||||
Gain (loss) on marketable securities | 7 | 326 | (93 | ) | |||||||
Gain (loss) on indexed debt securities | 49 | (413 | ) | 74 | |||||||
Interest and other finance charges | (313 | ) | (338 | ) | (352 | ) | |||||
Interest on Securitization Bonds | (77 | ) | (91 | ) | (105 | ) | |||||
Equity in earnings (losses) of unconsolidated affiliates | 265 | 208 | (1,633 | ) | |||||||
Other, net | 60 | 35 | 46 | ||||||||
Total | (9 | ) | (273 | ) | (2,063 | ) | |||||
Income (Loss) Before Income Taxes | 1,063 | 686 | (1,130 | ) | |||||||
Income tax expense (benefit) | (729 | ) | 254 | (438 | ) | ||||||
Net Income (Loss) | $ | 1,792 | $ | 432 | $ | (692 | ) | ||||
Basic Earnings (Loss) Per Share | $ | 4.16 | $ | 1.00 | $ | (1.61 | ) | ||||
Diluted Earnings (Loss) Per Share | $ | 4.13 | $ | 1.00 | $ | (1.61 | ) | ||||
Weighted Average Shares Outstanding, Basic | 431 | 431 | 430 | ||||||||
Weighted Average Shares Outstanding, Diluted | 434 | 434 | 430 | ||||||||
See Notes to Consolidated Financial Statements
73
CENTERPOINT ENERGY, INC. AND SUBSIDIARIES
STATEMENTS OF CONSOLIDATED COMPREHENSIVE INCOME
Year Ended December 31, | |||||||||||
2017 | 2016 | 2015 | |||||||||
(in millions) | |||||||||||
Net income (loss) | $ | 1,792 | $ | 432 | $ | (692 | ) | ||||
Other comprehensive income (loss): | |||||||||||
Adjustment to pension and other postretirement plans (net of tax of $6, $4 and $12, respectively) | 6 | (7 | ) | 20 | |||||||
Net deferred gain (loss) from cash flow hedges (net of tax of $2, $-0-, and $-0-, respectively) | (3 | ) | 1 | — | |||||||
Reclassification of deferred loss from cash flow hedges realized in net income (net of tax of $-0-, $1, and $-0-, respectively) | — | 1 | — | ||||||||
Other comprehensive income (loss) | 3 | (5 | ) | 20 | |||||||
Comprehensive income (loss) | $ | 1,795 | $ | 427 | $ | (672 | ) | ||||
See Notes to Consolidated Financial Statements
74
CENTERPOINT ENERGY, INC. AND SUBSIDIARIES
CONSOLIDATED BALANCE SHEETS
December 31, 2017 | December 31, 2016 | ||||||
(in millions) | |||||||
ASSETS | |||||||
Current Assets: | |||||||
Cash and cash equivalents ($230 and $340 related to VIEs, respectively) | $ | 260 | $ | 341 | |||
Investment in marketable securities | 960 | 953 | |||||
Accounts receivable ($73 and $52 related to VIEs, respectively), less bad debt reserve of $19 and $15, respectively | 1,000 | 740 | |||||
Accrued unbilled revenues | 427 | 335 | |||||
Natural gas inventory | 222 | 131 | |||||
Materials and supplies | 175 | 181 | |||||
Non-trading derivative assets | 110 | 51 | |||||
Taxes receivable | — | 30 | |||||
Prepaid expense and other current assets ($35 and $40 related to VIEs, respectively) | 241 | 161 | |||||
Total current assets | 3,395 | 2,923 | |||||
Property, Plant and Equipment, net | 13,057 | 12,307 | |||||
Other Assets: | |||||||
Goodwill | 867 | 862 | |||||
Regulatory assets ($1,590 and $1,919 related to VIEs, respectively) | 2,347 | 2,677 | |||||
Non-trading derivative assets | 44 | 19 | |||||
Investment in unconsolidated affiliates | 2,472 | 2,505 | |||||
Preferred units - unconsolidated affiliate | 363 | 363 | |||||
Other | 191 | 173 | |||||
Total other assets | 6,284 | 6,599 | |||||
Total Assets | $ | 22,736 | $ | 21,829 | |||
See Notes to Consolidated Financial Statements
75
CENTERPOINT ENERGY, INC. AND SUBSIDIARIES
CONSOLIDATED BALANCE SHEETS, cont.
December 31, 2017 | December 31, 2016 | ||||||
(in millions, except par value and shares) | |||||||
LIABILITIES AND SHAREHOLDERS’ EQUITY | |||||||
Current Liabilities: | |||||||
Short-term borrowings | $ | 39 | $ | 35 | |||
Current portion of VIE Securitization Bonds long-term debt | 434 | 411 | |||||
Indexed debt | 122 | 114 | |||||
Current portion of other long-term debt | 50 | 500 | |||||
Indexed debt securities derivative | 668 | 717 | |||||
Accounts payable | 963 | 657 | |||||
Taxes accrued | 181 | 172 | |||||
Interest accrued | 104 | 108 | |||||
Dividends accrued | 120 | — | |||||
Non-trading derivative liabilities | 20 | 41 | |||||
Other | 368 | 325 | |||||
Total current liabilities | 3,069 | 3,080 | |||||
Other Liabilities: | |||||||
Deferred income taxes, net | 3,174 | 5,263 | |||||
Non-trading derivative liabilities | 4 | 5 | |||||
Benefit obligations | 785 | 913 | |||||
Regulatory liabilities | 2,464 | 1,298 | |||||
Other | 357 | 278 | |||||
Total other liabilities | 6,784 | 7,757 | |||||
Long-term Debt: | |||||||
VIE Securitization Bonds, net | 1,434 | 1,867 | |||||
Other long-term debt, net | 6,761 | 5,665 | |||||
Total long-term debt, net | 8,195 | 7,532 | |||||
Commitments and Contingencies (Note 15) | |||||||
Shareholders’ Equity: | |||||||
Cumulative preferred stock, $0.01 par value, 20,000,000 shares authorized, none issued or outstanding | — | — | |||||
Common stock, $0.01 par value, 1,000,000,000 shares authorized, 431,044,845 shares and 430,682,504 shares outstanding, respectively | 4 | 4 | |||||
Additional paid-in capital | 4,209 | 4,195 | |||||
Retained earnings (accumulated deficit) | 543 | (668 | ) | ||||
Accumulated other comprehensive loss | (68 | ) | (71 | ) | |||
Total shareholders’ equity | 4,688 | 3,460 | |||||
Total Liabilities and Shareholders’ Equity | $ | 22,736 | $ | 21,829 | |||
See Notes to Consolidated Financial Statements
76
CENTERPOINT ENERGY, INC. AND SUBSIDIARIES
STATEMENTS OF CONSOLIDATED CASH FLOWS
Year Ended December 31, | |||||||||||
2017 | 2016 | 2015 | |||||||||
(in millions) | |||||||||||
Cash Flows from Operating Activities: | |||||||||||
Net income (loss) | $ | 1,792 | $ | 432 | $ | (692 | ) | ||||
Adjustments to reconcile net income (loss) to net cash provided by operating activities: | |||||||||||
Depreciation and amortization | 1,036 | 1,126 | 970 | ||||||||
Amortization of deferred financing costs | 24 | 26 | 27 | ||||||||
Deferred income taxes | (770 | ) | 213 | (413 | ) | ||||||
Unrealized loss (gain) on marketable securities | (7 | ) | (326 | ) | 93 | ||||||
Loss (gain) on indexed debt securities | (49 | ) | 413 | (74 | ) | ||||||
Write-down of natural gas inventory | — | 1 | 4 | ||||||||
Equity in (earnings) losses of unconsolidated affiliates, net of distributions | (265 | ) | (208 | ) | 1,779 | ||||||
Pension contributions | (48 | ) | (9 | ) | (66 | ) | |||||
Changes in other assets and liabilities, excluding acquisitions: | |||||||||||
Accounts receivable and unbilled revenues, net | (216 | ) | (117 | ) | 345 | ||||||
Inventory | (7 | ) | 34 | 28 | |||||||
Taxes receivable | 30 | 142 | 18 | ||||||||
Accounts payable | 136 | 133 | (224 | ) | |||||||
Fuel cost recovery | (85 | ) | (72 | ) | 43 | ||||||
Non-trading derivatives, net | (84 | ) | 30 | (7 | ) | ||||||
Margin deposits, net | (55 | ) | 101 | (4 | ) | ||||||
Interest and taxes accrued | 5 | 5 | (10 | ) | |||||||
Net regulatory assets and liabilities | (107 | ) | (60 | ) | 63 | ||||||
Other current assets | 1 | (17 | ) | 10 | |||||||
Other current liabilities | 34 | 22 | (50 | ) | |||||||
Other assets | (4 | ) | (16 | ) | (5 | ) | |||||
Other liabilities | 36 | 30 | 8 | ||||||||
Other, net | 24 | 48 | 27 | ||||||||
Net cash provided by operating activities | 1,421 | 1,931 | 1,870 | ||||||||
Cash Flows from Investing Activities: | |||||||||||
Capital expenditures | (1,426 | ) | (1,414 | ) | (1,584 | ) | |||||
Acquisitions, net of cash acquired | (132 | ) | (102 | ) | — | ||||||
Decrease in notes receivable - unconsolidated affiliate | — | 363 | — | ||||||||
Investment in preferred units - unconsolidated affiliate | — | (363 | ) | — | |||||||
Distributions from unconsolidated affiliates in excess of cumulative earnings | 297 | 297 | 148 | ||||||||
Decrease (increase) in restricted cash of Bond companies | 5 | (5 | ) | 12 | |||||||
Proceeds from sale of marketable securities | — | 178 | 32 | ||||||||
Other, net | (1 | ) | — | 5 | |||||||
Net cash used in investing activities | (1,257 | ) | (1,046 | ) | (1,387 | ) | |||||
Cash Flows from Financing Activities: | |||||||||||
Increase (decrease) in short-term borrowings, net | 4 | (5 | ) | (13 | ) | ||||||
Proceeds from commercial paper, net | 349 | 469 | 403 | ||||||||
Proceeds from long-term debt, net | 1,096 | 600 | 200 | ||||||||
Payments of long-term debt | (1,211 | ) | (1,218 | ) | (644 | ) | |||||
Loss on reacquired debt | (5 | ) | (22 | ) | — | ||||||
Debt issuance costs | (13 | ) | (9 | ) | — | ||||||
Payment of dividends on common stock | (461 | ) | (443 | ) | (426 | ) | |||||
Distribution to ZENS holders | — | (178 | ) | (32 | ) | ||||||
Other, net | (4 | ) | (2 | ) | (5 | ) | |||||
Net cash used in financing activities | (245 | ) | (808 | ) | (517 | ) | |||||
Net Increase (Decrease) in Cash and Cash Equivalents | (81 | ) | 77 | (34 | ) | ||||||
Cash and Cash Equivalents at Beginning of Year | 341 | 264 | 298 | ||||||||
Cash and Cash Equivalents at End of Year | $ | 260 | $ | 341 | $ | 264 | |||||
See Notes to Consolidated Financial Statements
77
CENTERPOINT ENERGY, INC. AND SUBSIDIARIES
STATEMENTS OF CONSOLIDATED CASH FLOWS, cont.
Year Ended December 31, | |||||||||||
2017 | 2016 | 2015 | |||||||||
(in millions) | |||||||||||
Supplemental Disclosure of Cash Flow Information: | |||||||||||
Cash Payments: | |||||||||||
Interest, net of capitalized interest | $ | 378 | $ | 406 | $ | 426 | |||||
Income taxes (refunds), net | 15 | (104 | ) | (45 | ) | ||||||
Non-cash transactions: | |||||||||||
Accounts payable related to capital expenditures | 144 | 87 | 95 | ||||||||
See Notes to Consolidated Financial Statements
78
CENTERPOINT ENERGY, INC. AND SUBSIDIARIES
STATEMENTS OF CONSOLIDATED SHAREHOLDERS’ EQUITY
2017 | 2016 | 2015 | ||||||||||||||||||
Shares | Amount | Shares | Amount | Shares | Amount | |||||||||||||||
(in millions of dollars and shares, except per share amounts) | ||||||||||||||||||||
Preference Stock, none outstanding | — | $ | — | — | $ | — | — | $ | — | |||||||||||
Cumulative Preferred Stock, $0.01 par value; authorized 20,000,000 shares, none outstanding | — | — | — | — | — | — | ||||||||||||||
Common Stock, $0.01 par value; authorized 1,000,000,000 shares | ||||||||||||||||||||
Balance, beginning of year | 431 | 4 | 430 | 4 | 430 | 4 | ||||||||||||||
Issuances related to benefit and investment plans | — | — | 1 | — | — | — | ||||||||||||||
Balance, end of year | 431 | 4 | 431 | 4 | 430 | 4 | ||||||||||||||
Additional Paid-in-Capital | ||||||||||||||||||||
Balance, beginning of year | 4,195 | 4,180 | 4,169 | |||||||||||||||||
Issuances related to benefit and investment plans | 14 | 15 | 11 | |||||||||||||||||
Balance, end of year | 4,209 | 4,195 | 4,180 | |||||||||||||||||
Retained Earnings (Accumulated Deficit) | ||||||||||||||||||||
Balance, beginning of year | (668 | ) | (657 | ) | 461 | |||||||||||||||
Net income (loss) | 1,792 | 432 | (692 | ) | ||||||||||||||||
Common stock dividends declared ($1.3475, $1.03 and $0.99 per share, respectively) | (581 | ) | (443 | ) | (426 | ) | ||||||||||||||
Balance, end of year | 543 | (668 | ) | (657 | ) | |||||||||||||||
Accumulated Other Comprehensive Loss | ||||||||||||||||||||
Balance, end of year: | ||||||||||||||||||||
Adjustment to pension and postretirement plans | (66 | ) | (72 | ) | (65 | ) | ||||||||||||||
Net deferred gain (loss) from cash flow hedges | (2 | ) | 1 | (1 | ) | |||||||||||||||
Total accumulated other comprehensive loss, end of year | (68 | ) | (71 | ) | (66 | ) | ||||||||||||||
Total Shareholders’ Equity | $ | 4,688 | $ | 3,460 | $ | 3,461 | ||||||||||||||
See Notes to Consolidated Financial Statements
79
CENTERPOINT ENERGY, INC. AND SUBSIDIARIES
NOTES TO CONSOLIDATED FINANCIAL STATEMENTS
(1) Background
CenterPoint Energy, Inc. is a public utility holding company. CenterPoint Energy’s operating subsidiaries own and operate electric transmission and distribution and natural gas distribution facilities, supply natural gas to commercial and industrial customers and electric and natural gas utilities and own interests in Enable as described below. CenterPoint Energy’s indirect, wholly-owned subsidiaries include:
• | Houston Electric, which engages in the electric transmission and distribution business in the Texas Gulf Coast area that includes the city of Houston; |
• | CERC Corp., which owns and operates natural gas distribution systems in six states; and |
• | CES, which obtains and offers competitive variable and fixed-price physical natural gas supplies and services primarily to commercial and industrial customers and electric and natural gas utilities in 33 states. |
As of December 31, 2017, CenterPoint Energy also owned an aggregate of 14,520,000 Series A Preferred Units in Enable, which owns, operates and develops natural gas and crude oil infrastructure assets, and CERC Corp. owned approximately 54.1% of the common units representing limited partner interests in Enable.
For a description of CenterPoint Energy’s reportable business segments, see Note 18.
(2) Summary of Significant Accounting Policies
(a) | Use of Estimates |
The preparation of financial statements in conformity with generally accepted accounting principles requires management to make estimates and assumptions that affect the reported amounts of assets and liabilities, disclosure of contingent assets and liabilities at the date of the financial statements, and the reported amounts of revenues and expenses during the reporting period. Actual results could differ from those estimates.
(b) | Principles of Consolidation |
The accounts of CenterPoint Energy and its wholly-owned and majority owned subsidiaries are included in the consolidated financial statements. All intercompany transactions and balances are eliminated in consolidation.
As of December 31, 2017, CenterPoint Energy had VIEs consisting of the Bond Companies, which it consolidates. The consolidated VIEs are wholly-owned, bankruptcy remote special purpose entities that were formed solely for the purpose of securitizing transition and system restoration related property. Creditors of CenterPoint Energy have no recourse to any assets or revenues of the Bond Companies. The bonds issued by these VIEs are payable only from and secured by transition and system restoration property and the bondholders have no recourse to the general credit of CenterPoint Energy.
(c) | Equity and Cost Method Investments |
CenterPoint Energy generally uses the equity method of accounting for investments in entities in which CenterPoint Energy has an ownership interest between 20% and 50% and exercises significant influence. CenterPoint Energy also uses the equity method for investments in which it has ownership percentages greater than 50%, when it exercises significant influence, does not have control and is not considered the primary beneficiary, if applicable.
In 2013, CenterPoint Energy, OGE and affiliates of ArcLight, formed Enable as a private limited partnership. CenterPoint Energy has the ability to significantly influence the operating and financial policies of, but not solely control, Enable and, accordingly, recorded an equity method investment. The net assets contributed were deemed to be in-substance real estate and were therefore recorded at historical cost.
80
Under the equity method, CenterPoint Energy adjusts its investment in Enable each period for contributions made, distributions received, CenterPoint Energy’s share of Enable’s comprehensive income and amortization of basis differences, as appropriate. CenterPoint Energy evaluates its equity method investments for impairment when events or changes in circumstances indicate there is a loss in value of the investment that is other than a temporary decline.
CenterPoint Energy’s investment in Enable is considered to be a VIE because the power to direct the activities that most significantly impact Enable’s economic performance does not reside with the holders of equity investment at risk. However, CenterPoint Energy is not considered the primary beneficiary of Enable since it does not have the power to direct the activities of Enable that are considered most significant to the economic performance of Enable.
CenterPoint Energy considers distributions received from equity method investments which do not exceed cumulative equity in earnings subsequent to the date of investment to be a return on investment and classifies these distributions as operating activities in the Statements of Consolidated Cash Flows. CenterPoint Energy considers distributions received from equity method investments in excess of cumulative equity in earnings subsequent to the date of investment to be a return of investment and classifies these distributions as investing activities in the Statements of Consolidated Cash Flows.
Other investments, excluding marketable securities, are carried at cost.
(d) | Revenues |
CenterPoint Energy records revenue for electricity delivery and natural gas sales and services under the accrual method and these revenues are recognized upon delivery to customers. Electricity deliveries not billed by month-end are accrued based on actual AMS data, daily supply volumes and applicable rates. Natural gas sales not billed by month-end are accrued based upon estimated purchased gas volumes, estimated lost and unaccounted for gas and currently effective tariff rates.
(e) Long-lived Assets and Intangibles
CenterPoint Energy records property, plant and equipment at historical cost. CenterPoint Energy expenses repair and maintenance costs as incurred.
CenterPoint Energy periodically evaluates long-lived assets, including property, plant and equipment, and specifically identifiable intangibles, when events or changes in circumstances indicate that the carrying value of these assets may not be recoverable. The determination of whether an impairment has occurred is based on an estimate of undiscounted cash flows attributable to the assets compared to the carrying value of the assets.
(f) Regulatory Assets and Liabilities
CenterPoint Energy applies the guidance for accounting for regulated operations to the Electric Transmission & Distribution business segment and the Natural Gas Distribution business segment. CenterPoint Energy’s rate-regulated subsidiaries may collect revenues subject to refund pending final determination in rate proceedings. In connection with such revenues, estimated rate refund liabilities are recorded which reflect management’s current judgment of the ultimate outcomes of the proceedings.
CenterPoint Energy’s rate-regulated businesses recognize removal costs as a component of depreciation expense in accordance with regulatory treatment. In addition, a portion of the amount of removal costs that relate to AROs has been reclassified from a regulatory liability to an asset retirement liability in accordance with accounting guidance for AROs.
For further detail on CenterPoint Energy’s regulatory assets and liabilities, please see Note 6.
(g) Depreciation and Amortization Expense
Depreciation and amortization is computed using the straight-line method based on economic lives or regulatory-mandated recovery periods. Amortization expense includes amortization of certain regulatory assets and other intangibles.
(h) Capitalization of Interest and AFUDC
Interest and AFUDC are capitalized as a component of projects under construction and are amortized over the assets’ estimated useful lives once the assets are placed in service. AFUDC represents the composite interest cost of borrowed funds and a reasonable return on the equity funds used for construction for subsidiaries that apply the guidance for accounting for regulated operations. Although AFUDC increases both utility plant and earnings, it is realized in cash when the assets are included in rates.
81
CenterPoint Energy recorded the following:
Year Ended December 31, | ||||||||||||
2017 | 2016 | 2015 | ||||||||||
(in millions) | ||||||||||||
Capitalized interest and AFUDC included in Interest and other finance charges | $ | 9 | $ | 8 | $ | 10 | ||||||
AFUDC equity included in Other Income | 11 | 7 | 12 | |||||||||
(i) Income Taxes
CenterPoint Energy uses the asset and liability method of accounting for deferred income taxes. Deferred income tax assets and liabilities are recognized for the future tax consequences attributable to differences between the financial statement carrying amounts of existing assets and liabilities and their respective tax bases. A valuation allowance is established against deferred tax assets for which management believes realization is not considered to be more likely than not. CenterPoint Energy recognizes interest and penalties as a component of income tax expense. CenterPoint Energy reports the income tax provision associated with its interest in Enable in Income tax expense (benefit) in its Statements of Consolidated Income.
To the extent certain EDIT of CenterPoint Energy’s rate-regulated subsidiaries may be recoverable or payable through future rates, regulatory assets and liabilities have been recorded, respectively.
On December 22, 2017, President Trump signed into law comprehensive tax reform legislation informally called the Tax Cuts and Jobs Acts, or TCJA, which resulted in significant changes to federal tax laws effective January 1, 2018. See Note 14 for further discussion of the impacts of tax reform implementation.
(j) Accounts Receivable and Allowance for Doubtful Accounts
Accounts receivable are recorded at the invoiced amount and do not bear interest. It is the policy of management to review the outstanding accounts receivable monthly, as well as the bad debt write-offs experienced in the past, and establish an allowance for doubtful accounts. Account balances are charged off against the allowance when management determines it is probable the receivable will not be recovered. The provision for doubtful accounts in CenterPoint Energy’s Statements of Consolidated Income for 2017, 2016 and 2015 was $14 million, $7 million and $19 million, respectively.
(k) Inventory
Inventory consists principally of materials and supplies and natural gas. Materials and supplies are valued at the lower of average cost or market. Materials and supplies are recorded to inventory when purchased and subsequently charged to expense or capitalized to plant when installed. Natural gas inventories of CenterPoint Energy’s Energy Services business segment are valued at the lower of average cost or market. Natural gas inventories of CenterPoint Energy’s Natural Gas Distribution business segment are primarily valued at weighted average cost. During 2017, 2016 and 2015, CenterPoint Energy recorded write-downs of natural gas inventory to the lower of average cost or market which are disclosed on the Statements of Consolidated Cash Flows.
(l) Derivative Instruments
CenterPoint Energy is exposed to various market risks. These risks arise from transactions entered into in the normal course of business. CenterPoint Energy utilizes derivative instruments such as physical forward contracts, swaps and options to mitigate the impact of changes in commodity prices, weather and interest rates on its operating results and cash flows. Such derivatives are recognized in CenterPoint Energy’s Consolidated Balance Sheets at their fair value unless CenterPoint Energy elects the normal purchase and sales exemption for qualified physical transactions. A derivative may be designated as a normal purchase or normal sale if the intent is to physically receive or deliver the product for use or sale in the normal course of business.
CenterPoint Energy has a Risk Oversight Committee composed of corporate and business segment officers that oversees commodity price, weather and credit risk activities, including CenterPoint Energy’s marketing, risk management services and hedging activities. The committee’s duties are to establish CenterPoint Energy’s commodity risk policies, allocate board-approved commercial risk limits, approve the use of new products and commodities, monitor positions and ensure compliance with CenterPoint Energy’s risk management policies and procedures and limits established by CenterPoint Energy’s Board of Directors.
82
CenterPoint Energy’s policies prohibit the use of leveraged financial instruments. A leveraged financial instrument, for this purpose, is a transaction involving a derivative whose financial impact will be based on an amount other than the notional amount or volume of the instrument.
(m) Investments in Other Debt and Equity Securities
CenterPoint Energy reports securities classified as trading at estimated fair value in its Consolidated Balance Sheets, and any unrealized holding gains and losses are recorded as Other Income (Expense) in its Statements of Consolidated Income.
(n) Environmental Costs
CenterPoint Energy expenses or capitalizes environmental expenditures, as appropriate, depending on their future economic benefit. CenterPoint Energy expenses amounts that relate to an existing condition caused by past operations that do not have future economic benefit. CenterPoint Energy records undiscounted liabilities related to these future costs when environmental assessments and/or remediation activities are probable and the costs can be reasonably estimated.
(o) Cash and Cash Equivalents and Restricted Cash
For purposes of reporting cash flows, CenterPoint Energy considers cash equivalents to be short-term, highly-liquid investments with maturities of three months or less from the date of purchase. Cash and cash equivalents held by the Bond Companies (VIEs) solely to support servicing the Securitization Bonds as of December 31, 2017 and 2016 are reflected on the Consolidated Balance Sheets.
In connection with the issuance of Securitization Bonds, CenterPoint Energy was required to establish restricted cash accounts to collateralize the bonds that were issued in these financing transactions. These restricted cash accounts are not available for withdrawal until the maturity of the bonds and are not included in cash and cash equivalents. Restricted cash accounts as of December 31, 2017 and 2016 are reported below.
December 31, | ||||||||
2017 | 2016 | |||||||
(in millions) | ||||||||
Restricted cash included in Prepaid expenses and other current assets | $ | 35 | $ | 40 | ||||
Restricted cash included in Other assets | 1 | — | ||||||
Total restricted cash | $ | 36 | $ | 40 | ||||
(p) New Accounting Pronouncements
Recently Adopted
In March 2016, the FASB issued ASU No. 2016-09, Compensation-Stock Compensation (Topic 718): Improvements to Employee Share-Based Payment Accounting (ASU 2016-09). The new guidance simplifies several aspects of the accounting for share-based payment transactions, including the income tax consequences, classification of awards as either equity or liabilities, and classification on the statement of cash flows. CenterPoint Energy adopted this standard as of January 1, 2017. The adoption did not have a material impact on CenterPoint Energy’s financial position or results of operations. However, CenterPoint Energy’s statement of cash flows reflects a decrease in financing activity and a corresponding increase in operating activity of $4 million, $3 million and $5 million as of December 31, 2017, 2016 and 2015, respectively, due to the retrospective application of the requirement that cash paid to a tax authority when shares are withheld to satisfy statutory income tax withholding obligations should be presented as a financing rather than as an operating activity.
Issued, Not Yet Effective
In January 2016, the FASB issued ASU No. 2016-01, Financial Instruments-Overall (Subtopic 825-10): Recognition and Measurement of Financial Assets and Financial Liabilities (ASU 2016-01). ASU 2016-01 requires equity investments that do not result in consolidation and are not accounted for under the equity method to be measured at fair value and to recognize any changes in fair value in net income unless the investments qualify for the new practicability exception. It does not change the guidance for classifying and measuring investments in debt securities and loans. ASU 2016-01 also changes certain disclosure requirements and other aspects related to recognition and measurement of financial assets and financial liabilities. ASU 2016-01 is effective for fiscal years, and interim periods within those years, beginning after December 15, 2017. As of the first reporting period in which
83
the guidance is adopted, a cumulative-effect adjustment to beginning retained earnings will be made, with two features that will be adopted prospectively. This standard will not have a material impact on CenterPoint Energy’s financial position, results of operations, cash flows and disclosures upon adoption on January 1, 2018.
In 2016, the FASB issued ASU No. 2016-02, Leases (Topic 842) (ASU 2016-02) and related amendments. ASU 2016-02 provides a comprehensive new lease model that requires lessees to recognize assets and liabilities for most leases and would change certain aspects of lessor accounting. ASU 2016-02 is effective for fiscal years, and interim periods within those fiscal years, beginning after December 15, 2018, with early adoption permitted. CenterPoint Energy expects to adopt this standard on January 1, 2019 and is evaluating available transitional practical expedients. A modified retrospective adoption approach is required. CenterPoint Energy is in the process of reviewing contracts to identify leases as defined in ASU 2016-02 and expects to recognize on the statements of financial position right-of-use assets and lease liabilities for the majority of its leases that are currently classified as operating leases. CenterPoint Energy is continuing to assess the impact that this standard will have on its financial position, results of operations, cash flows and disclosures.
In 2016 and 2017, the FASB issued ASUs which amended ASU No. 2014-09, Revenue from Contracts with Customers (Topic 606). ASU 2014-09, as amended, provides a comprehensive new revenue recognition model that requires revenue to be recognized in a manner that depicts the transfer of goods or services to a customer at an amount that reflects the consideration expected to be received in exchange for those goods or services. Early adoption is permitted, and entities have the option of using either a full retrospective or a modified retrospective adoption approach. While these ASUs will expand disclosures, CenterPoint Energy has not identified any significant changes as the result of these new standards. A substantial amount of CenterPoint Energy’s revenues are tariff and derivative based, which will not be significantly impacted by these ASUs. ASU 2014-09 eliminates industry specific guidance, including ASC 360-20, and as a result our investment in Enable will no longer be considered in-substance real estate. Gains or losses on subsequent sales or dilution events in our investment in Enable will be recognized in earnings. CenterPoint Energy adopted these ASUs on January 1, 2018 using the modified retrospective adoption approach.
In August 2016, the FASB issued ASU No. 2016-15, Statement of Cash Flows (Topic 230): Classification of Certain Cash Receipts and Cash Payments (ASU 2016-15). ASU 2016-15 provides clarifying guidance on the classification of certain cash receipts and payments in the statement of cash flows and eliminates the variation in practice related to such classifications. ASU 2016-15 is effective for fiscal years, and interim periods within those fiscal years, beginning after December 15, 2017, with early adoption permitted. CenterPoint Energy adopted this standard on January 1, 2018. A retrospective adoption approach is required. CenterPoint Energy does not believe this standard will have a material impact on its financial position, results of operations, and disclosures. Due to the requirement that cash proceeds from COLI policies be classified as cash inflows from investing activity, there will be an increase in investing activity and a corresponding decrease in operating activity on the statement of cash flows when COLI proceeds are received.
In November 2016, the FASB issued ASU No. 2016-18, Statement of Cash Flows (Topic 230): Restricted Cash (ASU 2016-18). ASU 2016-18 requires that a statement of cash flows explain the change during the period in the total of cash, cash equivalents, restricted cash and restricted cash equivalents. As a result, the statement of cash flows will no longer present transfers between cash and cash equivalents and restricted cash and restricted cash equivalents. When cash, cash equivalents, restricted cash and restricted cash equivalents are presented in more than one line item on the balance sheet, the new guidance requires a reconciliation of the totals in the statement of cash flows to the related captions in the balance sheet. ASU 2016-18 is effective for fiscal years, and interim periods within those fiscal years, beginning after December 15, 2017, with early adoption permitted. A retrospective adoption approach is required. This standard will not have an impact on CenterPoint Energy’s financial position, results of operations, and disclosures, but it will have an impact on the presentation of the statement of cash flows upon adoption on January 1, 2018.
In January 2017, the FASB issued ASU No. 2017-01, Business Combinations (Topic 805): Clarifying the Definition of a Business (ASU 2017-01). ASU 2017-01 revises the definition of a business. If substantially all of the fair value of the gross assets acquired is concentrated in a single identifiable asset or a group of similar identifiable assets, then under ASU 2017-01, the asset or group of assets is not a business. The guidance also requires a business to include at least one substantive process and narrows the definition of outputs to be more closely aligned with how outputs are described in ASC 606. ASU 2017-01 is effective for fiscal years, and interim periods within those fiscal years, beginning after December 15, 2017, with early adoption permitted in certain circumstances. A prospective adoption approach is required. ASU 2017-01 could have a potential impact on CenterPoint Energy’s accounting for future acquisitions upon adoption on January 1, 2018.
In January 2017, the FASB issued ASU No. 2017-04, Intangibles-Goodwill and Other (Topic 350): Simplifying the Test for Goodwill Impairment (ASU 2017-04). ASU 2017-04 eliminates Step 2 of the goodwill impairment test, which requires a hypothetical purchase price allocation. A goodwill impairment will now be the amount by which a reporting unit’s carrying value exceeds its fair value, not to exceed the carrying amount of goodwill. ASU 2017-04 is effective for fiscal years, and interim periods
84
within those fiscal years, beginning after December 15, 2019, with early adoption permitted. CenterPoint Energy will adopt ASU 2017-04 on January 1, 2018. A prospective adoption approach is required. ASU 2017-04 will have an impact on CenterPoint Energy’s future calculation of goodwill impairments if an impairment is identified.
In February 2017, the FASB issued ASU No. 2017-05, Other Income-Gains and Losses from the Derecognition of Nonfinancial Assets (Subtopic 610-20): Clarifying the Scope of Asset Derecognition Guidance and Accounting for Partial Sales of Nonfinancial Assets (ASU 2017-05). ASU 2017-05 clarifies when and how to apply ASC 610-20 Gains and Losses from the Derecognition of Nonfinancial Assets, which was issued as part of ASU 2014-09 Revenue from Contracts with Customers (Topic 606). ASU 2017-05 is effective for fiscal years, and interim periods within those fiscal years, beginning after December 15, 2017, with early adoption permitted. Companies can elect a retrospective or modified retrospective approach to adoption. This standard will not have a material impact on CenterPoint Energy’s financial position, results of operations, cash flows and disclosures upon adoption on January 1, 2018.
In March 2017, the FASB issued ASU No. 2017-07, Compensation-Retirement Benefits (Topic 715): Improving the Presentation of Net Periodic Pension Cost and Net Periodic Postretirement Benefit Cost (ASU 2017-07). ASU 2017-07 requires an employer to report the service cost component of the net periodic pension cost and postretirement benefit cost in the same line item(s) as other employee compensation costs arising from services rendered during the period; all other components will be presented separately from the line item(s) that includes the service cost and outside of any subtotal of operating income. In addition, only the service cost component will be eligible for capitalization in assets. ASU 2017-07 is effective for fiscal years, and interim periods within those fiscal years, beginning after December 15, 2017, with early adoption permitted. ASU 2017-07 should be applied retrospectively for the presentation of the service cost component and the other components and prospectively for the capitalization of the service cost component. The adoption of this guidance is expected to result in an increase to operating income and a decrease to other income. Prospectively, other components previously capitalized in assets will be recorded as regulatory assets in CenterPoint Energy’s rate-regulated businesses. This standard will not have a material impact on CenterPoint Energy’s financial position, results of operations, cash flows and disclosures upon adoption on January 1, 2018.
In May 2017, the FASB issued ASU No. 2017-09, Compensation-Stock Compensation (Topic 718): Scope of Modification Accounting (ASU 2017-09). ASU 2017-09 clarifies when changes to the terms or conditions of a share-based payment award must be accounted for as a modification. Entities will apply the modification accounting guidance if the value, vesting conditions or classification of the award changes. ASU 2017-09 is effective for fiscal years, and interim periods within those fiscal years, beginning after December 15, 2017, with early adoption permitted. ASU 2017-09 should be applied prospectively for awards modified on or after the adoption date. This standard, upon adoption on January 1, 2018, will have an impact on CenterPoint Energy’s accounting for future changes to share-based payment awards.
In August 2017, the FASB issued ASU No. 2017-12, Derivatives and Hedging (Topic 815): Targeted Improvements to Accounting for Hedging Activities (ASU 2017-12). ASU 2017-12 expands an entity’s ability to hedge nonfinancial and financial risk components and reduce complexity in fair value hedges of interest rate risk. The guidance eliminates the requirement to separately measure and report hedge ineffectiveness, eases certain documentation and assessment requirements, and updates the presentation and disclosure requirements. ASU 2017-12 is effective for fiscal years, and interim periods within those fiscal years, beginning after December 15, 2018, with early adoption permitted. A cumulative-effect adjustment to eliminate the separate measurement of ineffectiveness upon adoption is required for existing cash flow and net investment hedges. Presentation and disclosure guidance should be applied prospectively. CenterPoint Energy is currently assessing the impact that this standard will have on its financial position, results of operations, cash flows and disclosures.
Management believes that other recently issued standards, which are not yet effective, will not have a material impact on CenterPoint Energy’s consolidated financial position, results of operations or cash flows upon adoption.
85
(3) Property, Plant and Equipment
(a) Property, Plant and Equipment
Property, plant and equipment includes the following:
Weighted Average Useful Lives | December 31, | ||||||||
(in years) | 2017 | 2016 | |||||||
(in millions) | |||||||||
Electric Transmission & Distribution | 32 | $ | 11,496 | $ | 10,840 | ||||
Natural Gas Distribution | 28 | 6,735 | 6,219 | ||||||
Energy Services | 27 | 102 | 83 | ||||||
Other property | 26 | 698 | 689 | ||||||
Total | 19,031 | 17,831 | |||||||
Accumulated depreciation and amortization: | |||||||||
Electric Transmission & Distribution | 3,633 | 3,443 | |||||||
Natural Gas Distribution | 1,968 | 1,722 | |||||||
Energy Services | 35 | 29 | |||||||
Other property | 338 | 330 | |||||||
Total accumulated depreciation and amortization | 5,974 | 5,524 | |||||||
Property, plant and equipment, net | $ | 13,057 | $ | 12,307 | |||||
(b) Depreciation and Amortization
The following table presents depreciation and amortization expense for 2017, 2016 and 2015.
2017 | 2016 | 2015 | |||||||||
(in millions) | |||||||||||
Depreciation expense | $ | 619 | $ | 607 | $ | 557 | |||||
Amortization expense | 417 | 519 | 413 | ||||||||
Total depreciation and amortization expense | $ | 1,036 | $ | 1,126 | $ | 970 | |||||
(c) AROs
A reconciliation of the changes in the ARO liability is as follows:
December 31, | |||||||
2017 | 2016 | ||||||
(in millions) | |||||||
Beginning balance | $ | 205 | $ | 195 | |||
Accretion expense | 8 | 10 | |||||
Revisions in estimates of cash flows | 68 | — | |||||
Ending balance | $ | 281 | $ | 205 | |||
CenterPoint Energy recorded AROs associated with the removal of asbestos and asbestos-containing material in its buildings, including substation building structures. CenterPoint Energy also recorded AROs relating to gas pipelines abandoned in place, treated wood poles for electric distribution, distribution transformers containing PCB (also known as Polychlorinated Biphenyl), and underground fuel storage tanks. The estimates of future liabilities were developed using historical information, and where available, quoted prices from outside contractors.
The increase of $68 million in the ARO from the revision in estimates in 2017 is primarily attributable to a decrease in the long-term discounts rates used in the ARO calculation for CERC.
86
(4) Acquisition
On January 3, 2017, CES, an indirect, wholly-owned subsidiary of CenterPoint Energy, completed its acquisition of AEM. After working capital adjustments, the final purchase price was $147 million and was allocated to identifiable assets acquired and liabilities assumed based on their estimated fair values on the acquisition date.
The following table summarizes the final purchase price allocation and the fair value amounts recognized for the assets acquired and liabilities assumed related to the acquisition:
(in millions) | ||||
Total purchase price consideration | $ | 147 | ||
Cash | $ | 15 | ||
Receivables | 140 | |||
Natural gas inventory | 78 | |||
Derivative assets | 35 | |||
Prepaid expenses and other current assets | 5 | |||
Property and equipment | 8 | |||
Identifiable intangibles | 25 | |||
Total assets acquired | 306 | |||
Accounts payable | 113 | |||
Derivative liabilities | 43 | |||
Other current liabilities | 7 | |||
Other liabilities | 1 | |||
Total liabilities assumed | 164 | |||
Identifiable net assets acquired | 142 | |||
Goodwill | 5 | |||
Net assets acquired | $ | 147 | ||
The goodwill of $5 million resulting from the acquisition reflects the excess of the purchase price over the fair value of the net identifiable assets acquired. The goodwill recorded as part of the acquisition primarily reflects the value of the complementary operational and geographic footprints, scale and expanded capabilities provided by the acquisition.
Identifiable intangible assets were recorded at estimated fair value as determined by management based on available information, which included a valuation prepared by an independent third party. The significant assumptions used in arriving at the estimated identifiable intangible asset values included management’s estimates of future cash flows, the discount rate which is based on the weighted average cost of capital for comparable publicly traded guideline companies and projected customer attrition rates. The useful lives for the identifiable intangible assets were determined using methods that approximate the pattern of economic benefit provided by the utilization of the assets.
The estimated fair value of the identifiable intangible assets and related useful lives as included in the final purchase price allocation include:
Estimate Fair Value | Estimate Useful Life | |||||
(in millions) | (in years) | |||||
Customer relationships | $ | 25 | 15 | |||
Amortization expense related to the above identifiable intangible assets was $2 million for the year ended December 31, 2017.
Revenues of approximately $1.3 billion and operating income of approximately $74 million attributable to the AEM acquisition are reported in the Energy Services business segment and included in CenterPoint Energy’s Statements of Consolidated Income for the year ended December 31, 2017.
87
The following unaudited pro forma financial information reflects the consolidated results of operations of CenterPoint Energy, assuming the AEM acquisition had taken place on January 1, 2016. Adjustments to pro forma net income include intercompany sales, amortization of intangible assets, depreciation of fixed assets, interest expense associated with debt financing to fund the acquisition, and related income tax effects. The pro forma information does not include the mark-to-market impact of financial instruments designated as cash flow hedges of anticipated purchases and sales at index prices. The effective portion of these hedges is excluded from earnings and reported as changes in Other comprehensive income. Additionally, the pro forma information does not include the mark-to-market impact of physical forward transactions that were previously accounted for as normal purchase and sale transactions.
The unaudited pro forma financial information has been presented for illustrative purposes only and is not necessarily indicative of the consolidated results of operations that would have been achieved had the acquisition taken place on the dates indicated or the future consolidated results of operations of the combined company.
Year Ended December 31, | ||||||||
2017 | 2016 | |||||||
(in millions) | ||||||||
Operating Revenue | $ | 9,614 | $ | 8,541 | ||||
Net Income (1) | 1,792 | 442 | ||||||
(1) | Net income for the year ended December 31, 2017 includes a reduction in income taxes of $1,113 million due to tax reform. See Note 14 for further discussion of the impacts of tax reform implementation. |
(5) Goodwill and Other Intangibles
Goodwill by reportable business segment as of December 31, 2016 and changes in the carrying amount of goodwill as of December 31, 2017 are as follows:
December 31, 2016 | AEM Acquisition (1) | December 31, 2017 | ||||||||||
(in millions) | ||||||||||||
Natural Gas Distribution | $ | 746 | $ | — | $ | 746 | ||||||
Energy Services | 105 | (2) | 5 | 110 | (2) | |||||||
Other Operations | 11 | — | 11 | |||||||||
Total | $ | 862 | $ | 5 | $ | 867 | ||||||
(1) See Note 4.
(2) Amount presented is net of the accumulated goodwill impairment charge of $252 million.
CenterPoint Energy performs goodwill impairment tests at least annually and evaluates goodwill when events or changes in circumstances indicate that its carrying value may not be recoverable. The impairment evaluation for goodwill is performed by using a two-step process. In the first step, the fair value of each reporting unit is compared with the carrying amount of the reporting unit, including goodwill. The estimated fair value of the reporting unit is generally determined on the basis of discounted cash flows. If the estimated fair value of the reporting unit is less than the carrying amount of the reporting unit, then a second step must be completed to determine the amount of the goodwill impairment that should be recorded. In the second step, the implied fair value of the reporting unit’s goodwill is determined by allocating the reporting unit’s fair value to all of its assets and liabilities other than goodwill (including any unrecognized intangible assets) in a manner similar to a purchase price allocation. The resulting implied fair value of the goodwill that results from the application of this second step is then compared to the carrying amount of the goodwill and an impairment charge is recorded for the difference.
CenterPoint Energy performed its annual goodwill impairment test in the third quarter of each of 2017 and 2016 and determined, based on the results of the first step, that no goodwill impairment charge was required for any reporting unit, which approximate the reportable segments.
88
The tables below present information on CenterPoint Energy’s other intangible assets recorded in Other non-current assets on the Consolidated Balance Sheets.
December 31, 2017 | |||||||||||||
Useful Lives | Gross Carrying Amount | Accumulated Amortization | Net Balance | ||||||||||
(in years) | (in millions) | ||||||||||||
Customer relationships | 15 | $ | 86 | $ | (21 | ) | $ | 65 | |||||
Covenants not to compete | 4 | 4 | (2 | ) | 2 | ||||||||
Other | Various | 15 | (8 | ) | 7 | ||||||||
Total | $ | 105 | $ | (31 | ) | $ | 74 | ||||||
December 31, 2016 | |||||||||||||
Useful Lives | Gross Carrying Amount | Accumulated Amortization | Net Balance | ||||||||||
(in years) | (in millions) | ||||||||||||
Customer relationships | 15 | $ | 61 | $ | (16 | ) | $ | 45 | |||||
Covenants not to compete | 4 | 4 | (1 | ) | 3 | ||||||||
Other | Various | 2 | (1 | ) | 1 | ||||||||
Total | $ | 67 | $ | (18 | ) | $ | 49 | ||||||
Amortization expense of intangible assets was $13 million, $4 million and $2 million in the years ended December 31, 2017, 2016 and 2015, respectively. CenterPoint Energy estimates that amortization expense of intangible assets with finite lives will be $12 million, $11 million, $6 million, $6 million and $5 million in the years ending December 31, 2018, 2019, 2020, 2021 and 2022, respectively.
89
(6) Regulatory Accounting
The following is a list of regulatory assets and liabilities reflected on CenterPoint Energy’s Consolidated Balance Sheets as of December 31, 2017 and 2016:
December 31, | |||||||
2017 | 2016 | ||||||
(in millions) | |||||||
Current regulatory assets (1) | $ | 130 | $ | 70 | |||
Non-current regulatory assets: | |||||||
Securitized regulatory assets | 1,590 | 1,919 | |||||
Unrecognized equity return (2) | (287 | ) | (329 | ) | |||
Unamortized loss on reacquired debt | 75 | 84 | |||||
Pension and postretirement-related regulatory asset (3) | 646 | 809 | |||||
Hurricane Harvey restoration costs (4) | 64 | — | |||||
Excess deferred income taxes (5) | 48 | — | |||||
Other long-term regulatory assets (6) | 211 | 194 | |||||
Total non-current regulatory assets | 2,347 | 2,677 | |||||
Total regulatory assets | 2,477 | 2,747 | |||||
Current regulatory liabilities (7) | 24 | 18 | |||||
Non-current regulatory liabilities: | |||||||
Excess deferred income taxes (5) | 1,354 | — | |||||
Estimated removal costs | 878 | 1,010 | |||||
Other long-term regulatory liabilities | 232 | 288 | |||||
Total non-current regulatory liabilities | 2,464 | 1,298 | |||||
Total regulatory liabilities | 2,488 | 1,316 | |||||
Total regulatory assets and liabilities, net | $ | (11 | ) | $ | 1,431 | ||
(1) | Current regulatory assets are included in Prepaid expenses and other current assets in CenterPoint Energy’s Consolidated Balance Sheets. |
(2) | The unrecognized allowed equity return will be recognized as it is recovered in rates through 2024. During the years ended December 31, 2017, 2016 and 2015, Houston Electric recognized approximately $42 million, $64 million and $49 million, respectively, of the allowed equity return. The timing of CenterPoint Energy’s recognition of the allowed equity return will vary each period based on amounts actually collected during the period. The actual amounts recognized are adjusted at least annually to correct any over-collections or under-collections during the preceding 12 months. |
(3) | NGD’s actuarially determined pension and other postemployment expense in excess of the amount being recovered through rates is being deferred for rate making purposes. Deferred pension and other postemployment expenses of $7 million and $6 million as of December 31, 2017 and 2016, respectively, were not earning a return. |
(4) | CenterPoint Energy is not earning a return on its Hurricane Harvey restoration costs. |
(5) | The EDIT will be recovered or refunded to customers as required by tax and regulatory authorities. See Note 14 for additional information. |
(6) | Other long-term regulatory assets that are not earning a return were not material as of December 31, 2017 and 2016. |
(7) | Current regulatory liabilities are included in Other current liabilities in CenterPoint Energy’s Consolidated Balance Sheets. |
90
Hurricane Harvey. Houston Electric’s electric delivery system and CERC Corp.’s NGD suffered damage as a result of Hurricane Harvey, a major storm classified as a Category 4 hurricane on the Saffir-Simpson Hurricane Wind Scale, that first struck the Texas coast on Friday, August 25, 2017 and remained over the Houston area for the next several days. The unprecedented flooding from torrential amounts of rainfall accompanying the storm caused significant damage to or destruction of residences and businesses served by Houston Electric and NGD.
Houston Electric estimates that total costs to restore the electric delivery facilities damaged as a result of Hurricane Harvey will be approximately $120 million and estimates that the total restoration costs covered by insurance will be approximately $28 million. NGD estimates that total costs to restore natural gas distribution facilities damaged as a result of Hurricane Harvey will be approximately $25 million and estimates that the total restoration costs covered by insurance will be approximately $19 million. Houston Electric and NGD will defer the uninsured storm restoration costs as management believes it is probable that such costs will be recovered through traditional rate adjustment mechanisms for capital costs and through the next base rate proceeding for operation and maintenance expenses. As a result, storm restoration costs did not materially affect Houston Electric’s or CERC’s reported net income for 2017.
As of December 31, 2017, Houston Electric and NGD recorded the following:
Houston Electric | NGD | |||||||
(in millions) | ||||||||
Property, plant and equipment | $ | 42 | $ | 5 | ||||
Insurance proceeds received | (11 | ) | — | |||||
Insurance receivable | — | (5 | ) | |||||
Net property, plant and equipment | $ | 31 | $ | — | ||||
Operation and maintenance expense | $ | 75 | $ | 10 | ||||
Insurance proceeds received | (3 | ) | — | |||||
Insurance receivable | (14 | ) | (4 | ) | ||||
Net regulatory asset | $ | 58 | $ | 6 | ||||
(7) Stock-Based Incentive Compensation Plans and Employee Benefit Plans
(a) Stock-Based Incentive Compensation Plans
CenterPoint Energy has LTIPs that provide for the issuance of stock-based incentives, including stock options, performance awards, restricted stock unit awards and restricted and unrestricted stock awards to officers, employees and non-employee directors. Approximately 14 million shares of CenterPoint Energy common stock are authorized under these plans for awards.
Equity awards are granted to employees without cost to the participants. The performance awards granted in 2017, 2016 and 2015 are distributed based upon the achievement of certain objectives over a three-year performance cycle. The stock awards granted in 2017, 2016 and 2015 are service based. The stock awards generally vest at the end of a three-year period. Upon vesting, both the performance and stock awards are issued to the participants along with the value of dividend equivalents earned over the performance cycle or vesting period. CenterPoint Energy issues new shares to satisfy stock-based payments related to LTIPs.
CenterPoint Energy recorded LTIP compensation expense of $21 million, $19 million and $17 million for the years ended December 31, 2017, 2016 and 2015, respectively. This expense is included in Operation and Maintenance Expense in the Statements of Consolidated Income.
The total income tax benefit recognized related to LTIPs was $8 million, $7 million and $6 million for the years ended December 31, 2017, 2016 and 2015, respectively. No compensation cost related to LTIPs was capitalized as a part of inventory or fixed assets in 2017, 2016 or 2015. The actual tax benefit realized for tax deductions related to LTIPs totaled $6 million, $5 million and $6 million for 2017, 2016 and 2015, respectively.
Compensation costs for the performance and stock awards granted under LTIPs are measured using fair value and expected achievement levels on the grant date. For performance awards with operational goals, the achievement levels are revised as goals are evaluated. The fair value of awards granted to employees is based on the closing stock price of CenterPoint Energy’s common
91
stock on the grant date. The compensation expense is recorded on a straight-line basis over the vesting period. Forfeitures are estimated on the date of grant based on historical averages and estimates are updated periodically throughout the vesting period.
The following tables summarize CenterPoint Energy’s LTIP activity for 2017:
Performance Awards
Outstanding and Non-Vested Shares | ||||||||||||
Year Ended December 31, 2017 | ||||||||||||
Shares (Thousands) | Weighted-Average Grant Date Fair Value | Remaining Average Contractual Life (Years) | Aggregate Intrinsic Value (Millions) | |||||||||
Outstanding as of December 31, 2016 | 3,423 | $ | 20.90 | |||||||||
Granted | 1,263 | 26.64 | ||||||||||
Forfeited or canceled | (846 | ) | 23.38 | |||||||||
Vested and released to participants | (213 | ) | 23.68 | |||||||||
Outstanding as of December 31, 2017 | 3,627 | 22.15 | 1 | $ | 51 | |||||||
The outstanding and non-vested shares displayed in the table above assumes that shares are issued at the maximum performance level. The aggregate intrinsic value reflects the impact of current expectations of achievement and stock price.
Stock Awards
Outstanding and Non-Vested Shares | ||||||||||||
Year Ended December 31, 2017 | ||||||||||||
Shares (Thousands) | Weighted-Average Grant Date Fair Value | Remaining Average Contractual Life (Years) | Aggregate Intrinsic Value (Millions) | |||||||||
Outstanding as of December 31, 2016 | 920 | $ | 20.74 | |||||||||
Granted | 414 | 26.77 | ||||||||||
Forfeited or canceled | (47 | ) | 22.25 | |||||||||
Vested and released to participants | (307 | ) | 22.46 | |||||||||
Outstanding as of December 31, 2017 | 980 | 22.68 | 1.2 | $ | 28 | |||||||
The weighted-average grant-date fair values per unit of awards granted were as follows for 2017, 2016 and 2015:
Year Ended December 31, | |||||||||||
2017 | 2016 | 2015 | |||||||||
Performance awards | $ | 26.64 | $ | 18.98 | $ | 21.28 | |||||
Stock awards | 26.77 | 19.24 | 21.39 | ||||||||
Valuation Data
The total intrinsic value of awards received by participants was as follows for 2017, 2016 and 2015:
Year Ended December 31, | |||||||||||
2017 | 2016 | 2015 | |||||||||
(in millions) | |||||||||||
Performance awards | $ | 7 | $ | 7 | $ | 9 | |||||
Stock awards | 9 | 6 | 7 | ||||||||
The total grant date fair value of performance and stock awards which vested during the years ended December 31, 2017, 2016 and 2015 was $12 million, $13 million and $13 million, respectively. As of December 31, 2017, there was $24 million of total unrecognized compensation cost related to non-vested performance and stock awards which is expected to be recognized over a weighted-average period of 1.7 years.
92
(b) Pension and Postretirement Benefits
CenterPoint Energy maintains a non-contributory qualified defined benefit pension plan covering substantially all employees, with benefits determined using a cash balance formula. Under the cash balance formula, participants accumulate a retirement benefit based upon 5% of eligible earnings and accrued interest. Participants are 100% vested in their benefit after completing three years of service. In addition to the non-contributory qualified defined benefit pension plan, CenterPoint Energy maintains unfunded non-qualified benefit restoration plans which allow participants to receive the benefits to which they would have been entitled under CenterPoint Energy’s non-contributory qualified pension plan except for federally mandated limits on qualified plan benefits or on the level of compensation on which qualified plan benefits may be calculated.
CenterPoint Energy provides certain healthcare and life insurance benefits for retired employees on both a contributory and non-contributory basis. Employees hired before January 1, 2018 become eligible for these benefits if they have met certain age and service requirements at retirement, as defined in the plans. Employees hired on or after January 1, 2018 are not eligible for these benefits, except for those employees represented by IBEW. Benefit costs are accrued over the active service period of employees. Effective January 1, 2017, members of the IBEW Local Union 66 who retire on or after January 1, 2017, and their dependents, will receive any retiree medical and prescription drug benefits exclusively through the NECA/IBEW Family Medical Care Plan pursuant to the terms of the renegotiated collective bargaining agreement entered into in May 2016.
CenterPoint Energy’s net periodic cost includes the following components relating to pension, including the benefit restoration plan, and postretirement benefits:
Year Ended December 31, | |||||||||||||||||||||||
2017 | 2016 | 2015 | |||||||||||||||||||||
Pension Benefits | Post-retirement Benefits | Pension Benefits | Post-retirement Benefits | Pension Benefits | Post-retirement Benefits | ||||||||||||||||||
(in millions) | |||||||||||||||||||||||
Service cost | $ | 36 | $ | 2 | $ | 38 | $ | 2 | $ | 41 | $ | 2 | |||||||||||
Interest cost | 89 | 16 | 93 | 16 | 93 | 20 | |||||||||||||||||
Expected return on plan assets | (97 | ) | (5 | ) | (101 | ) | (6 | ) | (120 | ) | (7 | ) | |||||||||||
Amortization of prior service cost (credit) | 9 | (5 | ) | 9 | (3 | ) | 9 | (1 | ) | ||||||||||||||
Amortization of net loss | 58 | — | 63 | 1 | 57 | 5 | |||||||||||||||||
Curtailment (1) | — | — | — | (5 | ) | — | — | ||||||||||||||||
Settlement (2) | — | — | — | — | 10 | — | |||||||||||||||||
Net periodic cost | $ | 95 | $ | 8 | $ | 102 | $ | 5 | $ | 90 | $ | 19 | |||||||||||
(1) | A curtailment gain or loss is required when the expected future services of a significant number of current employees are reduced or eliminated for the accrual of benefits. During 2016, postretirement healthcare benefits were amended resulting in a net curtailment gain of $5 million. In May 2016, Houston Electric entered into a renegotiated collective bargaining agreement with the IBEW Local Union 66 that provides that for Houston Electric union employees covered under the agreement who retire on or after January 1, 2017, retiree medical and prescription drug coverage will be provided exclusively through the NECA/IBEW Family Medical Care Plan in exchange for the payment of monthly premiums as determined under the agreement. As a result, the accrued postretirement benefits related to such future Houston Electric union retirees were eliminated. Houston Electric recognized a curtailment gain of $3 million as an accelerated recognition of the prior service credit that would otherwise be recognized in future periods for the postretirement plan. CenterPoint Energy also recognized an additional curtailment gain of $2 million in October 2016 related to other amendments in the postretirement plan. As a result of these amendments, the 2016 postretirement expense was significantly lower than expenses reported for previous years. |
(2) | A one-time, non-cash settlement charge is required when lump sum distributions or other settlements of plan benefit obligations during a plan year exceed the service cost and interest cost components of net periodic cost for that year. Due to the amount of lump sum payment distributions from the non-qualified pension plan during the year ended December 31, 2015, CenterPoint Energy recognized a non-cash settlement charge of $10 million. This charge is an acceleration of costs that would otherwise be recognized in future periods. |
93
CenterPoint Energy used the following assumptions to determine net periodic cost relating to pension and postretirement benefits:
Year Ended December 31, | |||||||||||||||||
2017 | 2016 | 2015 | |||||||||||||||
Pension Benefits | Post-retirement Benefits | Pension Benefits | Post-retirement Benefits | Pension Benefits | Post-retirement Benefits | ||||||||||||
Discount rate | 4.15 | % | 4.15 | % | 4.40 | % | 4.35 | % | 4.05 | % | 3.90 | % | |||||
Expected return on plan assets | 6.00 | 4.50 | 6.25 | 4.80 | 6.50 | 5.20 | |||||||||||
Rate of increase in compensation levels | 4.50 | — | 4.15 | — | 4.00 | — | |||||||||||
In determining net periodic benefits cost, CenterPoint Energy uses fair value, as of the beginning of the year, as its basis for determining expected return on plan assets.
The following table summarizes changes in the benefit obligation, plan assets, the amounts recognized in consolidated balance sheets and the key assumptions of CenterPoint Energy’s pension, including benefit restoration, and postretirement plans. The measurement dates for plan assets and obligations were December 31, 2017 and 2016.
December 31, | |||||||||||||||
2017 | 2016 | ||||||||||||||
Pension Benefits | Post-retirement Benefits | Pension Benefits | Post-retirement Benefits | ||||||||||||
(in millions, except for actuarial assumptions) | |||||||||||||||
Change in Benefit Obligation | |||||||||||||||
Benefit obligation, beginning of year | $ | 2,197 | $ | 383 | $ | 2,193 | $ | 432 | |||||||
Service cost | 36 | 2 | 38 | 2 | |||||||||||
Interest cost | 89 | 16 | 93 | 16 | |||||||||||
Participant contributions | — | 7 | — | 10 | |||||||||||
Benefits paid | (168 | ) | (26 | ) | (181 | ) | (37 | ) | |||||||
Actuarial loss | 71 | 4 | 54 | 13 | |||||||||||
Medicare reimbursement | — | — | — | 3 | |||||||||||
Plan amendment (1) | — | — | — | (56 | ) | ||||||||||
Benefit obligation, end of year | 2,225 | 386 | 2,197 | 383 | |||||||||||
Change in Plan Assets | |||||||||||||||
Fair value of plan assets, beginning of year | 1,656 | 113 | 1,679 | 136 | |||||||||||
Employer contributions | 48 | 16 | 9 | 18 | |||||||||||
Participant contributions | — | 7 | — | 10 | |||||||||||
Benefits paid | (168 | ) | (26 | ) | (181 | ) | (37 | ) | |||||||
Plan amendment (2) | — | — | — | (20 | ) | ||||||||||
Actual investment return | 265 | 10 | 149 | 6 | |||||||||||
Fair value of plan assets, end of year | 1,801 | 120 | 1,656 | 113 | |||||||||||
Funded status, end of year | $ | (424 | ) | $ | (266 | ) | $ | (541 | ) | $ | (270 | ) | |||
Amounts Recognized in Balance Sheets | |||||||||||||||
Current liabilities-other | $ | (7 | ) | $ | (6 | ) | $ | (7 | ) | $ | (6 | ) | |||
Other liabilities-benefit obligations | (417 | ) | (260 | ) | (534 | ) | (264 | ) | |||||||
Net liability, end of year | $ | (424 | ) | $ | (266 | ) | $ | (541 | ) | $ | (270 | ) | |||
94
December 31, | |||||||||||||||
2017 | 2016 | ||||||||||||||
Pension Benefits | Post-retirement Benefits | Pension Benefits | Post-retirement Benefits | ||||||||||||
Actuarial Assumptions | |||||||||||||||
Discount rate | 3.65 | % | 3.60 | % | 4.15 | % | 4.15 | % | |||||||
Expected return on plan assets | 6.00 | 4.55 | 6.00 | 4.50 | |||||||||||
Rate of increase in compensation levels | 4.45 | — | 4.50 | — | |||||||||||
Medical cost trend rate assumed for the next year - Pre-65 | — | 6.15 | — | 5.75 | |||||||||||
Medical/prescription drug cost trend rate assumed for the next year - Post-65 | — | 23.85 | — | 10.65 | |||||||||||
Prescription drug cost trend rate assumed for the next year - Pre-65 | — | 9.85 | — | 10.75 | |||||||||||
Rate to which the cost trend rate is assumed to decline (the ultimate trend rate) | — | 4.50 | — | 4.50 | |||||||||||
Year that the cost trend rates reach the ultimate trend rate - Pre-65 | — | 2026 | — | 2024 | |||||||||||
Year that the cost trend rates reach the ultimate trend rate - Post-65 | — | 2024 | — | 2024 | |||||||||||
(1) | The postretirement benefits were amended during 2016 to change retiree medical coverage, effective January 1, 2017, as follows: (i) members of the IBEW Local Union 66 who retire on or after January 1, 2017, and their dependents, will receive any retiree medical and prescription drug coverage exclusively through the NECA/IBEW Family Medical Care Plan pursuant to the terms of the renegotiated collective bargaining agreement entered into in May 2016; and (ii) Medicare eligible post-65 retirees will receive coverage through a Medicare Advantage Program, an insured benefit, in lieu of the previous self-insured benefit. These changes resulted in a reduction in our postretirement plan liability of $56 million as of December 31, 2016. |
(2) | In May 2016, Houston Electric entered into a renegotiated collective bargaining agreement with the IBEW Local Union 66. The Houston Lighting & Power Company Union Retirees’ Medical and Dental Benefits Trust was amended to reflect the renegotiated collective bargaining agreement by establishing a segregated and restricted account under the trust for the retiree medical benefits of post-2016 union retirees who are now covered exclusively by the NECA/IBEW Family Medical Care Plan. $20 million was transferred to the account for post-2016 union retirees. |
The accumulated benefit obligation for all defined benefit pension plans was $2,164 million and $2,168 million as of December 31, 2017 and 2016, respectively.
The expected rate of return assumption was developed using the targeted asset allocation of CenterPoint Energy’s plans and the expected return for each asset class.
The discount rate assumption was determined by matching the projected cash flows of CenterPoint Energy’s plans against a hypothetical yield curve of high-quality corporate bonds represented by a series of annualized individual discount rates from one-half to 99 years.
For measurement purposes, medical and prescription drug costs are assumed to increase to 6.15% and 9.85%, respectively, for the pre-65 retirees, and the combined medical/prescription drug cost increase is assumed to be 23.85% for the post-65 retirees during 2018, after which these rates decrease until reaching the ultimate trend rate of 4.50% in 2026 and 2024 for the pre-65 and post-65 retirees, respectively.
95
CenterPoint Energy’s changes in accumulated comprehensive loss related to defined benefit, postretirement and other postemployment plans are as follows:
Year Ended December 31, | |||||||
2017 | 2016 | ||||||
(in millions) | |||||||
Beginning Balance | $ | (72 | ) | $ | (65 | ) | |
Other comprehensive income (loss) before reclassifications (1) | 4 | (19 | ) | ||||
Amounts reclassified from accumulated other comprehensive income: | |||||||
Prior service cost (2) | 1 | — | |||||
Actuarial losses (2) | 7 | 8 | |||||
Total reclassifications from accumulated other comprehensive income | 8 | 8 | |||||
Tax benefit (expense) | (6 | ) | 4 | ||||
Net current period other comprehensive income (loss) | 6 | (7 | ) | ||||
Ending Balance | $ | (66 | ) | $ | (72 | ) | |
(1) | Total other comprehensive income (loss) related to the remeasurement of pension, postretirement and other postemployment plans. |
(2) | These accumulated other comprehensive components are included in the computation of net periodic cost. |
Amounts recognized in accumulated other comprehensive loss consist of the following:
December 31, | |||||||||||||||
2017 | 2016 | ||||||||||||||
Pension Benefits | Postretirement Benefits | Pension Benefits | Postretirement Benefits | ||||||||||||
(in millions) | |||||||||||||||
Unrecognized actuarial loss (gain) | $ | 94 | $ | (8 | ) | $ | 100 | $ | 3 | ||||||
Unrecognized prior service cost | 1 | 6 | 2 | 6 | |||||||||||
Net amount recognized in accumulated other comprehensive loss (gain) | $ | 95 | $ | (2 | ) | $ | 102 | $ | 9 | ||||||
The changes in plan assets and benefit obligations recognized in other comprehensive income during 2017 are as follows:
Pension Benefits | Postretirement Benefits | ||||||
(in millions) | |||||||
Net loss (gain) | $ | 1 | $ | (10 | ) | ||
Amortization of net loss | (7 | ) | — | ||||
Amortization of prior service cost | (1 | ) | (1 | ) | |||
Total recognized in comprehensive income | $ | (7 | ) | $ | (11 | ) | |
The total expense recognized in net periodic costs and other comprehensive income was $88 million and $(3) million for pension and postretirement benefits, respectively, for the year ended December 31, 2017.
The amounts in accumulated other comprehensive loss expected to be recognized as components of net periodic benefit cost during 2018 are as follows:
Pension Benefits | Postretirement Benefits | ||||||
(in millions) | |||||||
Unrecognized actuarial loss | $ | 6 | $ | — | |||
Unrecognized prior service cost | 1 | 1 | |||||
Amounts in accumulated comprehensive loss to be recognized in net periodic cost in 2018 (1) | $ | 7 | $ | 1 | |||
96
(1) | Upon adoption of ASU 2017-07 on January 1, 2018, these amounts will be recognized as Other Income (Expense) in CenterPoint Energy’s Statements of Consolidated Income. |
The following table displays pension benefits related to CenterPoint Energy’s pension plans that have accumulated benefit obligations in excess of plan assets:
December 31, | |||||||||||||||
2017 | 2016 | ||||||||||||||
Pension Qualified | Pension Non-qualified | Pension Qualified | Pension Non-qualified | ||||||||||||
(in millions) | |||||||||||||||
Accumulated benefit obligation | $ | 2,090 | $ | 74 | $ | 2,097 | $ | 71 | |||||||
Projected benefit obligation | 2,151 | 74 | 2,126 | 71 | |||||||||||
Fair value of plan assets | 1,801 | — | 1,656 | — | |||||||||||
Assumed healthcare cost trend rates have a significant effect on the reported amounts for CenterPoint Energy’s postretirement benefit plans. A 1% change in the assumed healthcare cost trend rate would have the following effects:
1% Increase | 1% Decrease | ||||||
(in millions) | |||||||
Effect on postretirement benefit obligation | $ | 12 | $ | 11 | |||
Effect on total of service and interest cost | — | — | |||||
In managing the investments associated with the benefit plans, CenterPoint Energy’s objective is to achieve and maintain a fully funded plan. This objective is expected to be achieved through an investment strategy that manages liquidity requirements while maintaining a long-term horizon in making investment decisions and efficient and effective management of plan assets.
As part of the investment strategy discussed above, CenterPoint Energy maintained the following weighted average allocation targets for its benefit plans as of December 31, 2017:
Pension Benefits | Postretirement Benefits | ||
U.S. equity | 12 – 28% | 13 – 23% | |
International developed market equity | 7 – 17% | 3 – 13% | |
Emerging market equity | 3 – 13% | — | |
Fixed income | 54 – 66% | 69 – 79% | |
Cash | 0 – 2% | 0 – 2% | |
97
The following tables set forth by level, within the fair value hierarchy (see Note 9), CenterPoint Energy’s pension plan assets at fair value as of December 31, 2017 and 2016:
Fair Value Measurements as of December 31, 2017 | |||||||||||||||
Quoted Prices in Active Markets for Identical Assets (Level 1) | Significant Observable Inputs (Level 2) | Significant Unobservable Inputs (Level 3) (3) | Total | ||||||||||||
(in millions) | |||||||||||||||
Cash | $ | 18 | $ | — | $ | — | $ | 18 | |||||||
Corporate bonds: | |||||||||||||||
Investment grade or above | — | 432 | — | 432 | |||||||||||
Equity securities: | |||||||||||||||
U.S. companies | 76 | — | — | 76 | |||||||||||
Cash received as collateral from securities lending | 76 | — | — | 76 | |||||||||||
U.S. treasuries | 67 | — | — | 67 | |||||||||||
Mortgage backed securities | — | 8 | — | 8 | |||||||||||
Asset backed securities | — | 1 | — | 1 | |||||||||||
Municipal bonds | — | 47 | — | 47 | |||||||||||
Mutual funds (1) | 211 | — | — | 211 | |||||||||||
International government bonds | — | 17 | — | 17 | |||||||||||
Obligation to return cash received as collateral from securities lending | (76 | ) | — | — | (76 | ) | |||||||||
Total investments at fair value | $ | 372 | $ | 505 | $ | — | $ | 877 | |||||||
Investments measured by net asset value per share or its equivalent (2) | 924 | ||||||||||||||
Total Investments | $ | 1,801 | |||||||||||||
(1) | 57% of the amount invested in mutual funds was in international equities, 30% was in emerging market equities and 13% was in U.S. equities. |
(2) | This represents the common collective trust funds with 55% of the amount invested in fixed income securities, 6% in U.S. equities, 34% in international equities and 5% in emerging market equities. |
(3) | The changes in the fair value of the pension plan’s Level 3 investments for the year ended December 31, 2017 were not material. |
98
Fair Value Measurements as of December 31, 2016 | |||||||||||||||
Quoted Prices in Active Markets for Identical Assets (Level 1) | Significant Observable Inputs (Level 2) | Significant Unobservable Inputs (Level 3) (3) | Total | ||||||||||||
(in millions) | |||||||||||||||
Cash | $ | 14 | $ | — | $ | — | $ | 14 | |||||||
Corporate bonds: | |||||||||||||||
Investment grade or above | — | 401 | — | 401 | |||||||||||
Equity securities: | |||||||||||||||
U.S. companies | 73 | — | — | 73 | |||||||||||
Cash received as collateral from securities lending | 69 | — | — | 69 | |||||||||||
U.S. treasuries | 49 | — | — | 49 | |||||||||||
Mortgage backed securities | — | 3 | — | 3 | |||||||||||
Asset backed securities | — | 2 | — | 2 | |||||||||||
Municipal bonds | — | 52 | — | 52 | |||||||||||
Mutual funds (1) | 171 | — | — | 171 | |||||||||||
International government bonds | — | 16 | — | 16 | |||||||||||
Obligation to return cash received as collateral from securities lending | (69 | ) | — | — | (69 | ) | |||||||||
Total investments at fair value | $ | 307 | $ | 474 | $ | — | $ | 781 | |||||||
Investments measured by net asset value per share or its equivalent (2) | 875 | ||||||||||||||
Total Investments | $ | 1,656 | |||||||||||||
(1) | 57% of the amount invested in mutual funds was in international equities, 28% was in emerging market equities and 15% was in U.S. equities. |
(2) | This represents the common collective trust funds with 53% of the amount invested in fixed income securities, 12% in U.S. equities, 30% in international equities and 5% in emerging market equities. |
(3) | The changes in the fair value of the pension plan’s Level 3 investments for the year ended December 31, 2016 were not material. |
The pension plan utilized both exchange traded and over-the-counter financial instruments such as futures, interest rate options and swaps that were marked to market daily with the gains/losses settled in the cash accounts. The pension plan did not include any holdings of CenterPoint Energy common stock as of December 31, 2017 or 2016.
The following tables present by level, within the fair value hierarchy, CenterPoint Energy’s postretirement plan assets at fair value as of December 31, 2017 and 2016, by asset category:
Fair Value Measurements as of December 31, 2017 | |||||||||||||||
Quoted Prices in Active Markets for Identical Assets (Level 1) | Significant Observable Inputs (Level 2) | Significant Unobservable Inputs (Level 3) | Total | ||||||||||||
(in millions) | |||||||||||||||
Mutual funds (1) | $ | 120 | $ | — | $ | — | $ | 120 | |||||||
Total | $ | 120 | $ | — | $ | — | $ | 120 | |||||||
(1) | 74% of the amount invested in mutual funds was in fixed income securities, 18% was in U.S. equities and 8% was in international equities. |
99
Fair Value Measurements as of December 31, 2016 | |||||||||||||||
Quoted Prices in Active Markets for Identical Assets (Level 1) | Significant Observable Inputs (Level 2) | Significant Unobservable Inputs (Level 3) | Total | ||||||||||||
(in millions) | |||||||||||||||
Mutual funds (1) | $ | 113 | $ | — | $ | — | $ | 113 | |||||||
Total | $ | 113 | $ | — | $ | — | $ | 113 | |||||||
(1) | 74% of the amount invested in mutual funds was in fixed income securities, 18% was in U.S. equities and 8% was in international equities. |
CenterPoint Energy contributed $39 million, $9 million and $16 million to its qualified pension, non-qualified pension and postretirement benefits plans, respectively, in 2017. CenterPoint Energy expects to contribute a minimum of approximately $60 million, $7 million and $16 million to its qualified pension, non-qualified pension and postretirement benefits plans, respectively, in 2018.
The following benefit payments are expected to be paid by the pension and postretirement benefit plans:
Pension Benefits | Postretirement Benefit Payments | ||||||
(in millions) | |||||||
2018 | $ | 144 | $ | 19 | |||
2019 | 147 | 21 | |||||
2020 | 153 | 24 | |||||
2021 | 156 | 27 | |||||
2022 | 158 | 29 | |||||
2023-2027 | 774 | 145 | |||||
(c) Savings Plan
CenterPoint Energy has a tax-qualified employee savings plan that includes a cash or deferred arrangement under Section 401(k) of the Internal Revenue Code of 1986, as amended (the Code), and an employee stock ownership plan under Section 4975(e)(7) of the Code. Under the plan, participating employees may make pre-tax or Roth contributions up to 50%, and after tax contributions up to 16%, of their eligible compensation, not to exceed certain federally mandated limits. CenterPoint Energy matches 100% of the first 6% of each employee’s compensation contributed. The matching contributions are fully vested at all times.
Prior to January 1, 2016, participating employees could elect to invest all or a portion of their contributions to the plan in CenterPoint Energy, Inc. common stock, to have dividends reinvested in additional shares or to receive dividend payments in cash on any investment in CenterPoint Energy, Inc. common stock, and to transfer all or part of their investment in CenterPoint Energy, Inc. common stock to other investment options offered by the plan.
Effective January 1, 2016, the savings plan was amended to limit the percentage of future contributions that could be invested in CenterPoint Energy, Inc. common stock to 25% and to prohibit transfers of account balances where the transfer would result in more than 25% of a participant’s total account balance invested in CenterPoint Energy, Inc. common stock.
The savings plan has significant holdings of CenterPoint Energy, Inc. common stock. As of December 31, 2017, 12,806,085 shares of CenterPoint Energy, Inc. common stock were held by the savings plan, which represented approximately 16% of its investments. Given the concentration of the investments in CenterPoint Energy, Inc. common stock, the savings plan and its participants have market risk related to this investment.
CenterPoint Energy’s savings plan benefit expenses were $41 million, $38 million and $35 million in 2017, 2016 and 2015, respectively.
100
(d) Postemployment Benefits
CenterPoint Energy provides postemployment benefits for certain former or inactive employees, their beneficiaries and covered dependents, after employment but before retirement (primarily healthcare and life insurance benefits for participants in the long-term disability plan). CenterPoint Energy recorded postemployment expenses of $6 million, $5 million and $2 million in 2017, 2016 and 2015, respectively.
Included in Benefit Obligations in the accompanying Consolidated Balance Sheets as of December 31, 2017 and 2016 was $20 million and $22 million, respectively, relating to postemployment obligations.
(e) Other Non-Qualified Plans
CenterPoint Energy has non-qualified deferred compensation plans that provide benefits payable to directors, officers and certain key employees or their designated beneficiaries at specified future dates or upon termination, retirement or death. Benefit payments are made from the general assets of CenterPoint Energy. CenterPoint Energy recorded benefit expense relating to these plans of $3 million for each of the years in 2017, 2016 and 2015. Included in Benefit Obligations in the accompanying Consolidated Balance Sheets as of December 31, 2017 and 2016 was $45 million and $47 million, respectively, relating to deferred compensation plans.
Included in Benefit Obligations in CenterPoint Energy’s Consolidated Balance Sheets as of December 31, 2017 and 2016 was $39 million and $40 million, respectively, relating to split-dollar life insurance arrangements.
(f) Change in Control Agreements and Other Employee Matters
CenterPoint Energy has a change in control plan, which was effective January 1, 2015. The plan generally provides, to the extent applicable, in the case of a change in control of CenterPoint Energy and termination of employment, for severance benefits of up to three times annual base salary plus bonus, and other benefits. Our officers, including our Executive Chairman, are participants under the plan.
As of December 31, 2017, approximately 35% of CenterPoint Energy’s employees were covered by collective bargaining agreements. The collective bargaining agreement with the IBEW Local 66 and the two collective bargaining agreements with Professional Employees International Union Local 12, covering approximately 21% of CenterPoint Energy’s employees, will expire in May of 2020 and March and May of 2021, respectively. These three agreements were last negotiated in 2016.
The collective bargaining agreements with Gas Workers Union, Local 340 and the IBEW Local 949, covering approximately 8% of CenterPoint Energy’s employees, will expire in April and December of 2020, respectively. These two agreements were last negotiated in 2015.
The two collective bargaining agreements with the United Steelworkers Union, Locals 13-227 and 13-1, which cover approximately 5% of CenterPoint Energy’s employees, were successfully negotiated in 2017. The new agreements will expire in June and July of 2022 for the Local 13-227 and Local 13-1, respectively.
(8) Derivative Instruments
CenterPoint Energy is exposed to various market risks. These risks arise from transactions entered into in the normal course of business. CenterPoint Energy utilizes derivative instruments such as physical forward contracts, swaps and options to mitigate the impact of changes in commodity prices, weather and interest rates on its operating results and cash flows.
(a) Non-Trading Activities
Derivative Instruments. CenterPoint Energy enters into certain derivative instruments to mitigate the effects of commodity price movements. Certain financial instruments used to hedge portions of the natural gas inventory of the Energy Services business segment are designated as fair value hedges for accounting purposes. All other financial instruments do not qualify or are not designated as cash flow or fair value hedges.
Weather Hedges. CenterPoint Energy has weather normalization or other rate mechanisms that mitigate the impact of weather on NGD in Arkansas, Louisiana, Mississippi, Minnesota and Oklahoma. NGD and electric operations in Texas do not have such mechanisms, although fixed customer charges are historically higher in Texas for NGD compared to CenterPoint Energy’s other
101
jurisdictions. As a result, fluctuations from normal weather may have a positive or negative effect on NGD’s results in Texas and on Houston Electric’s results in its service territory.
CenterPoint Energy entered into heating-degree day swaps for certain NGD jurisdictions to mitigate the effect of fluctuations from normal weather on its results of operations and cash flows for the 2014-2015 winter heating season, which contained a bilateral dollar cap of $16 million. However, CenterPoint Energy did not enter into heating-degree day swaps for NGD jurisdictions for the 2015–2016 or 2016–2017 winter heating seasons. CenterPoint Energy entered into heating-degree day swaps for certain NGD Texas jurisdictions for the 2017–2018 winter heating season, which contained a bilateral dollar cap of $8 million. CenterPoint Energy entered into weather hedges for the Houston Electric service territory to mitigate the effect of fluctuations from normal weather on its results of operations and cash flows, which contained bilateral dollar caps of $7 million, $9 million and $9 million for the 2015–2016, 2016–2017 and 2017–2018 winter seasons, respectively. The swaps are based on 10-year normal weather. During the years ended December 31, 2017, 2016 and 2015, CenterPoint Energy recognized a loss of $1 million, gain of $1 million and a loss of $6 million, respectively, related to these swaps. Weather hedge gains and losses are included in revenues in the Statements of Consolidated Income.
Hedging of Interest Expense for Future Debt Issuances. In January 2017, Houston Electric entered into forward interest rate agreements with multiple counterparties, having an aggregate notional amount of $150 million. These agreements were executed to hedge, in part, volatility in the 10-year U.S. treasury rate by reducing Houston Electric’s exposure to variability in cash flows related to interest payments of Houston Electric’s $300 million issuance of fixed rate debt in January 2017. These forward interest rate agreements were designated as cash flow hedges. Accordingly, the effective portion of realized losses associated with the agreements, which totaled approximately $1 million, is a component of accumulated other comprehensive income in 2017 and will be amortized over the life of the bonds.
In 2017, CenterPoint Energy entered into forward interest rate agreements with multiple counterparties, having an aggregate notional amount of $350 million. These agreements were executed to hedge, in part, volatility in the 5-year U.S. treasury rate by reducing CenterPoint Energy’s exposure to variability in cash flows relating to interest payments of CenterPoint Energy’s $500 million issuance of fixed rate debt in August 2017. These forward interest rate agreements were designated as cash flow hedges. Accordingly, the effective portion of realized losses associated with the agreements, which totaled approximately $3 million, is a component of accumulated other comprehensive income in 2017 and will be amortized over the life of the fixed rate debt.
In August 2017, CERC Corp. entered into forward interest rate agreements with multiple counterparties, having an aggregate notional amount of $150 million. These agreements were executed to hedge, in part, volatility in the 30-year U.S. treasury rate by reducing CERC Corp.’s exposure to variability in cash flows related to interest payments of CERC Corp.’s $300 million issuance of fixed rate debt in August 2017. These forward interest rate agreements were designated as cash flow hedges. Accordingly, the effective portion of realized losses associated with the agreements, which totaled approximately $2 million, is a component of accumulated other comprehensive income in 2017 and will be amortized over the life of the fixed rate debt.
As of December 31, 2017, none of CenterPoint Energy, Houston Electric or CERC Corp. had any pre-issuance interest rate hedges in place.
In January and February 2018, Houston Electric entered into forward interest rate agreements with multiple counterparties, having an aggregate notional amount of $200 million. These agreements were executed to hedge, in part, volatility in the 30-year U.S. treasury rate by reducing Houston Electric’s exposure to variability in cash flows related to interest payments on a forecasted issuance of fixed rate debt in 2018. These forward interest rate agreements were designated as cash flow hedges. Accordingly, the effective portion of unrealized gains and losses associated with the forward interest rate agreements will be recorded as a component of accumulated other comprehensive income and the ineffective portion, if any, will be recorded in income.
102
(b) Derivative Fair Values and Income Statement Impacts
The following tables present information about CenterPoint Energy’s derivative instruments and hedging activities. The first four tables provide a balance sheet overview of CenterPoint Energy’s Derivative Assets and Liabilities as of December 31, 2017 and 2016, while the last table provides a breakdown of the related income statement impacts for the years ending December 31, 2017, 2016 and 2015.
Fair Value of Derivative Instruments | ||||||||||
December 31, 2017 | ||||||||||
Derivatives designated as fair value hedges: | Balance Sheet Location | Derivative Assets Fair Value | Derivative Liabilities Fair Value | |||||||
(in millions) | ||||||||||
Natural gas derivatives (1) (2) (3) | Current Liabilities: Non-trading derivative liabilities | $ | 13 | $ | 1 | |||||
Derivatives not designated as hedging instruments: | ||||||||||
Natural gas derivatives (1) (2) (3) | Current Assets: Non-trading derivative assets | 114 | 4 | |||||||
Natural gas derivatives (1) (2) (3) | Other Assets: Non-trading derivative assets | 44 | — | |||||||
Natural gas derivatives (1) (2) (3) | Current Liabilities: Non-trading derivative liabilities | 38 | 78 | |||||||
Natural gas derivatives (1) (2) (3) | Other Liabilities: Non-trading derivative liabilities | 9 | 24 | |||||||
Indexed debt securities derivative | Current Liabilities | — | 668 | |||||||
Total | $ | 218 | $ | 775 | ||||||
(1) | The fair value shown for natural gas contracts is comprised of derivative gross volumes totaling 1,795 Bcf or a net 224 Bcf long position. Certain natural gas contracts hedge basis risk only and lack a fixed price exposure. |
(2) | Natural gas contracts are presented on a net basis in the Consolidated Balance Sheets as they are subject to master netting arrangements. This netting applies to all undisputed amounts due or past due and causes derivative assets (liabilities) to be ultimately presented net in a liability (asset) account within the Consolidated Balance Sheets. The net of total non-trading natural gas derivative assets and liabilities was a $130 million asset as shown on CenterPoint Energy’s Consolidated Balance Sheets (and as detailed in the table below), and was comprised of the natural gas contracts derivative assets and liabilities separately shown above, impacted by collateral netting of $19 million. |
(3) | Derivative Assets and Derivative Liabilities include no material amounts related to physical forward transactions with Enable. |
Offsetting of Natural Gas Derivative Assets and Liabilities | ||||||||||||
December 31, 2017 | ||||||||||||
Gross Amounts Recognized (1) | Gross Amounts Offset in the Consolidated Balance Sheets | Net Amount Presented in the Consolidated Balance Sheets (2) | ||||||||||
(in millions) | ||||||||||||
Current Assets: Non-trading derivative assets | $ | 165 | $ | (55 | ) | $ | 110 | |||||
Other Assets: Non-trading derivative assets | 53 | (9 | ) | 44 | ||||||||
Current Liabilities: Non-trading derivative liabilities | (83 | ) | 63 | (20 | ) | |||||||
Other Liabilities: Non-trading derivative liabilities | (24 | ) | 20 | (4 | ) | |||||||
Total | $ | 111 | $ | 19 | $ | 130 | ||||||
(1) | Gross amounts recognized include some derivative assets and liabilities that are not subject to master netting arrangements. |
(2) | The derivative assets and liabilities on the Consolidated Balance Sheets exclude accounts receivable or accounts payable that, should they exist, could be used as offsets to these balances in the event of a default. |
103
Fair Value of Derivative Instruments | ||||||||||
December 31, 2016 | ||||||||||
Total derivatives not designated as hedging instruments | Balance Sheet Location | Derivative Assets Fair Value | Derivative Liabilities Fair Value | |||||||
(in millions) | ||||||||||
Natural gas derivatives (1) (2) (3) | Current Assets: Non-trading derivative assets | $ | 79 | $ | 14 | |||||
Natural gas derivatives (1) (2) (3) | Other Assets: Non-trading derivative assets | 24 | 5 | |||||||
Natural gas derivatives (1) (2) (3) | Current Liabilities: Non-trading derivative liabilities | 2 | 43 | |||||||
Natural gas derivatives (1) (2) (3) | Other Liabilities: Non-trading derivative liabilities | — | 5 | |||||||
Indexed debt securities derivative | Current Liabilities | — | 717 | |||||||
Total | $ | 105 | $ | 784 | ||||||
(1) | The fair value shown for natural gas contracts is comprised of derivative gross volumes totaling 1,035 Bcf or a net 59 Bcf long position. Certain natural gas contracts hedge basis risk only and lack a fixed price exposure. |
(2) | Natural gas contracts are presented on a net basis in the Consolidated Balance Sheets. Natural gas contracts are subject to master netting arrangements. This netting applies to all undisputed amounts due or past due and causes derivative assets (liabilities) to be ultimately presented net in a liability (asset) account within the Consolidated Balance Sheets. The net of total non-trading derivative assets and liabilities was a $24 million asset as shown on CenterPoint Energy’s Consolidated Balance Sheets (and as detailed in the table below), and was comprised of the natural gas contracts derivative assets and liabilities separately shown above, impacted by collateral netting of $14 million. |
(3) | Derivative Assets and Derivative Liabilities include no material amounts related to physical forward transactions with Enable. |
Offsetting of Natural Gas Derivative Assets and Liabilities | ||||||||||||
December 31, 2016 | ||||||||||||
Gross Amounts Recognized (1) | Gross Amounts Offset in the Consolidated Balance Sheets | Net Amount Presented in the Consolidated Balance Sheets (2) | ||||||||||
(in millions) | ||||||||||||
Current Assets: Non-trading derivative assets | $ | 81 | $ | (30 | ) | $ | 51 | |||||
Other Assets: Non-trading derivative assets | 24 | (5 | ) | 19 | ||||||||
Current Liabilities: Non-trading derivative liabilities | (57 | ) | 16 | (41 | ) | |||||||
Other Liabilities: Non-trading derivative liabilities | (10 | ) | 5 | (5 | ) | |||||||
Total | $ | 38 | $ | (14 | ) | $ | 24 | |||||
(1) | Gross amounts recognized include some derivative assets and liabilities that are not subject to master netting arrangements. |
(2) | The derivative assets and liabilities on the Consolidated Balance Sheets exclude accounts receivable or accounts payable that, should they exist, could be used as offsets to these balances in the event of a default. |
Realized and unrealized gains and losses on natural gas derivatives are recognized in the Statements of Consolidated Income as revenue for physical sales derivative contracts and as natural gas expense for financial natural gas derivatives and physical purchase natural gas derivatives. Realized and unrealized gains and losses on indexed debt securities are recorded as Other Income (Expense) in the Statements of Consolidated Income.
Hedge ineffectiveness is recorded as a component of natural gas expense and primarily results from differences in the location of the derivative instrument and the hedged item. Basis ineffectiveness arises from natural gas market price differences between the locations of the hedged inventory and the delivery location specified in the hedge instruments. The impact of natural gas derivatives designated as fair value hedges, the related hedged item, and natural gas derivatives not designated as hedging instruments are presented in the table below.
104
Income Statement Impact of Derivative Activity | ||||||||||||||
Year Ended December 31, | ||||||||||||||
Income Statement Location | 2017 | 2016 | 2015 | |||||||||||
Derivatives designated as fair value hedges: | (in millions) | |||||||||||||
Natural gas derivatives | Gains (Losses) in Expenses: Natural Gas | $ | (9 | ) | $ | — | $ | — | ||||||
Fair value adjustments for natural gas inventory designated as the hedged item | Gains (Losses) in Expenses: Natural Gas | 14 | — | — | ||||||||||
Total increase in Expenses: Natural Gas (1) | $ | 5 | $ | — | $ | — | ||||||||
Derivatives not designated as hedging instruments: | ||||||||||||||
Natural gas derivatives | Gains (Losses) in Revenues | $ | 211 | $ | (18 | ) | $ | 134 | ||||||
Natural gas derivatives | Gains (Losses) in Expenses: Natural Gas | (72 | ) | 70 | (105 | ) | ||||||||
Indexed debt securities derivative | Gains (Losses) in Other Income (Expense) | 49 | (413 | ) | 74 | |||||||||
Total - derivatives not designated as hedging instruments | $ | 188 | $ | (361 | ) | $ | 103 | |||||||
(1) | Hedge ineffectiveness results from the basis ineffectiveness discussed above, and excludes the impact to natural gas expense from timing ineffectiveness. Timing ineffectiveness arises due to changes in the difference between the spot price and the futures price, as well as the difference between the timing of the settlement of the futures and the valuation of the underlying physical commodity. As the commodity contract nears the settlement date, spot-to-forward price differences should converge, which should reduce or eliminate the impact of this ineffectiveness on natural gas expense. |
(c) Credit Risk Contingent Features
CenterPoint Energy enters into financial derivative contracts containing material adverse change provisions. These provisions could require CenterPoint Energy to post additional collateral if the S&P or Moody’s credit ratings of CenterPoint Energy, Inc. or its subsidiaries are downgraded. The total fair value of the derivative instruments that contain credit risk contingent features that are in a net liability position as of December 31, 2017 and 2016 was $2 million and $1 million, respectively. CenterPoint Energy posted no assets as collateral towards derivative instruments that contain credit risk contingent features as of either December 31, 2017 or 2016. If all derivative contracts (in a net liability position) containing credit risk contingent features were triggered at December 31, 2017 and 2016, $2 million and $-0-, respectively, of additional assets would be required to be posted as collateral.
(d) Credit Quality of Counterparties
In addition to the risk associated with price movements, credit risk is also inherent in CenterPoint Energy’s non-trading derivative activities. Credit risk relates to the risk of loss resulting from non-performance of contractual obligations by a counterparty. The following table shows the composition of counterparties to the non-trading derivative assets of CenterPoint Energy as of December 31, 2017 and 2016:
December 31, 2017 | December 31, 2016 | |||||||||||||||
Investment Grade (1) | Total | Investment Grade (1) | Total | |||||||||||||
(in millions) | ||||||||||||||||
Energy marketers | $ | 6 | $ | 45 | $ | 1 | $ | 4 | ||||||||
Financial institutions | — | — | 33 | 33 | ||||||||||||
End users (2) | 17 | 109 | 2 | 47 | ||||||||||||
Total | $ | 23 | $ | 154 | (3) | $ | 36 | $ | 84 | (3) | ||||||
(1) | “Investment grade” is primarily determined using publicly available credit ratings and considers credit support (including parent company guarantees) and collateral (including cash and standby letters of credit). For unrated counterparties, CenterPoint Energy determines a synthetic credit rating by performing financial statement analysis and considers contractual rights and restrictions and collateral. |
(2) | End users are comprised primarily of customers who have contracted to fix the price of a portion of their physical gas requirements for future periods. |
105
(3) | The net of total non-trading natural gas derivative assets was $154 million and $70 million as of December 31, 2017 and 2016, respectively, as shown on CenterPoint Energy’s Consolidated Balance Sheets, and was comprised of the natural gas contracts derivatives assets separately shown above, impacted by collateral netting of $-0- and $14 million as of December 31, 2017 and 2016, respectively. |
(9) Fair Value Measurements
Assets and liabilities that are recorded at fair value in the Consolidated Balance Sheets are categorized based upon the level of judgment associated with the inputs used to measure their value. Hierarchical levels, as defined below and directly related to the amount of subjectivity associated with the inputs to fair valuations of these assets and liabilities, are as follows:
Level 1: Inputs are unadjusted quoted prices in active markets for identical assets or liabilities at the measurement date. The types of assets carried at Level 1 fair value generally are exchange-traded derivatives and equity securities, as well as natural gas inventory that has been designated as the hedged item in a fair value hedge.
Level 2: Inputs, other than quoted prices included in Level 1, are observable for the asset or liability, either directly or indirectly. Level 2 inputs include quoted prices for similar instruments in active markets, and inputs other than quoted prices that are observable for the asset or liability. Fair value assets and liabilities that are generally included in this category are derivatives with fair values based on inputs from actively quoted markets. A market approach is utilized to value CenterPoint Energy’s Level 2 assets or liabilities.
Level 3: Inputs are unobservable for the asset or liability, and include situations where there is little, if any, market activity for the asset or liability. Unobservable inputs reflect CenterPoint Energy’s judgments about the assumptions market participants would use in pricing the asset or liability since limited market data exists. CenterPoint Energy develops these inputs based on the best information available, including CenterPoint Energy’s own data. A market approach is utilized to value CenterPoint Energy’s Level 3 assets or liabilities. As of December 31, 2017, CenterPoint Energy’s Level 3 assets and liabilities are comprised of physical natural gas forward contracts and options and its indexed debt securities. Level 3 physical natural gas forward contracts are valued using a discounted cash flow model which includes illiquid forward price curve locations (ranging from $1.73 to $9.02 per MMBtu) as an unobservable input. Level 3 options are valued through Black-Scholes (including forward start) option models which include option volatilities (ranging from 0% to 83%) as an unobservable input. CenterPoint Energy’s Level 3 physical natural gas forward contracts and options derivative assets and liabilities consist of both long and short positions (forwards and options) and their fair value is sensitive to forward prices and volatilities. If forward prices decrease, CenterPoint Energy’s long forwards lose value whereas its short forwards gain in value. If volatility decreases, CenterPoint Energy’s long options lose value whereas its short options gain in value. CenterPoint Energy’s Level 3 indexed debt securities are valued using a Black-Scholes option model and a discounted cash flow model, which use option volatility (17%) and a projected dividend growth rate (7%) as unobservable inputs. An increase in either volatilities or projected dividends will increase the value of the indexed debt securities, and a decrease in either the volatilities or projected dividends will decrease the value of the indexed debt securities.
CenterPoint Energy determines the appropriate level for each financial asset and liability on a quarterly basis and recognizes transfers between levels at the end of the reporting period. For the year ended December 31, 2017, there were no transfers between Level 1 and 2. CenterPoint Energy also recognizes purchases of Level 3 financial assets and liabilities at their fair market value at the end of the reporting period.
106
The following tables present information about CenterPoint Energy’s assets and liabilities (including derivatives that are presented net) measured at fair value on a recurring basis as of December 31, 2017 and December 31, 2016, and indicate the fair value hierarchy of the valuation techniques utilized by CenterPoint Energy to determine such fair value.
December 31, 2017 | |||||||||||||||||||
Quoted Prices in Active Markets for Identical Assets (Level 1) | Significant Other Observable Inputs (Level 2) | Significant Unobservable Inputs (Level 3) | Netting Adjustments (1) | Balance | |||||||||||||||
(in millions) | |||||||||||||||||||
Assets | |||||||||||||||||||
Corporate equities | $ | 963 | $ | — | $ | — | $ | — | $ | 963 | |||||||||
Investments, including money market funds (2) | 68 | — | — | — | 68 | ||||||||||||||
Natural gas derivatives (3) | — | 161 | 57 | (64 | ) | 154 | |||||||||||||
Hedged portion of natural gas inventory | 14 | — | — | — | 14 | ||||||||||||||
Total assets | $ | 1,045 | $ | 161 | $ | 57 | $ | (64 | ) | $ | 1,199 | ||||||||
Liabilities | |||||||||||||||||||
Indexed debt securities derivative | $ | — | $ | — | $ | 668 | $ | — | $ | 668 | |||||||||
Natural gas derivatives (3) | — | 96 | 11 | (83 | ) | 24 | |||||||||||||
Total liabilities | $ | — | $ | 96 | $ | 679 | $ | (83 | ) | $ | 692 | ||||||||
(1) | Amounts represent the impact of legally enforceable master netting arrangements that allow CenterPoint Energy to settle positive and negative positions and also include cash collateral of $19 million posted with the same counterparties. |
(2) | Amounts are included in Prepaid and Other Current Assets and Other Assets in the Consolidated Balance Sheets. |
(3) | Natural gas derivatives include no material amounts related to physical forward transactions with Enable. |
December 31, 2016 | |||||||||||||||||||
Quoted Prices in Active Markets for Identical Assets (Level 1) | Significant Other Observable Inputs (Level 2) | Significant Unobservable Inputs (Level 3) | Netting Adjustments (1) | Balance | |||||||||||||||
(in millions) | |||||||||||||||||||
Assets | |||||||||||||||||||
Corporate equities | $ | 956 | $ | — | $ | — | $ | — | $ | 956 | |||||||||
Investments, including money market funds (2) | 77 | — | — | — | 77 | ||||||||||||||
Natural gas derivatives (3) | 11 | 74 | 20 | (35 | ) | 70 | |||||||||||||
Total assets | $ | 1,044 | $ | 74 | $ | 20 | $ | (35 | ) | $ | 1,103 | ||||||||
Liabilities | |||||||||||||||||||
Indexed debt securities derivative | $ | — | $ | — | $ | 717 | $ | — | $ | 717 | |||||||||
Natural gas derivatives (3) | 4 | 56 | 7 | (21 | ) | 46 | |||||||||||||
Total liabilities | $ | 4 | $ | 56 | $ | 724 | $ | (21 | ) | $ | 763 | ||||||||
(1) | Amounts represent the impact of legally enforceable master netting arrangements that allow CenterPoint Energy to settle positive and negative positions and also include cash collateral of $14 million held by CES from the same counterparties. |
(2) | Amounts are included in Prepaid and Other Current Assets and Other Assets in the Consolidated Balance Sheets. |
(3) | Natural gas derivatives include no material amounts related to physical forward transactions with Enable. |
107
The following table presents additional information about assets or liabilities, including derivatives that are measured at fair value on a recurring basis for which CenterPoint Energy has utilized Level 3 inputs to determine fair value:
Fair Value Measurements Using Significant Unobservable Inputs (Level 3) | |||||||||||
Derivative assets and liabilities, net | |||||||||||
Year Ended December 31, | |||||||||||
2017 | 2016 | 2015 | |||||||||
(in millions) | |||||||||||
Beginning balance | $ | (704 | ) | $ | 12 | $ | 17 | ||||
Purchases (1) | — | 12 | — | ||||||||
Total gains | 96 | 12 | 7 | ||||||||
Total settlements | (11 | ) | (27 | ) | (12 | ) | |||||
Transfers out of Level 3 | (17 | ) | (1 | ) | (1 | ) | |||||
Transfers into Level 3 | 14 | (712 | ) | 1 | |||||||
Ending balance (2) | $ | (622 | ) | $ | (704 | ) | $ | 12 | |||
The amount of total gains (losses) for the period included in earnings attributable to the change in unrealized gains or losses relating to assets still held at the reporting date (3) | $ | 87 | $ | (402 | ) | $ | 6 | ||||
(1) | Mark-to-market value of Level 3 derivative assets acquired through the purchase of AEM was less than $1 million at the acquisition date. |
(2) | CenterPoint Energy did not have significant Level 3 sales during any of the years ended December 31, 2017, 2016 or 2015. |
(3) | During 2016, CenterPoint Energy transferred its indexed debt securities from Level 2 to Level 3 to reflect changes in the significance of the unobservable inputs used in the valuation. As of December 31, 2017, the indexed debt securities liability was $668 million. During the year ended December 31, 2017, there was a gain of $49 million on the indexed debt securities. |
Items Measured at Fair Value on a Nonrecurring Basis
In 2015, CenterPoint Energy determined that an other than temporary decrease in the value of its investment in Enable had occurred and, using multiple valuation methodologies under both the market and income approaches, recorded an impairment on its investment in Enable of $1,225 million. Key assumptions in the market approach included recent market transactions of comparable companies and EBITDA to total enterprise multiples for comparable companies. Due to volatility of the quoted price of Enable’s units at the valuation date, a volume weighted average price was used under the market approach to best approximate fair value at the measurement date. Key assumptions in the income approach included Enable’s forecasted cash distributions, projected cash flows of incentive distribution rights, forecasted growth rate of Enable’s cash distributions beyond 2020, and the discount rate used to determine the present value of the estimated future cash flows. A weighing of the different approaches was utilized to determine the estimated fair value of our investment in Enable. Based on the significant unobservable estimates and assumptions required, CenterPoint Energy concluded that the fair value estimate should be classified as a Level 3 measurement within the fair value hierarchy. See Note 10 for further discussion of the impairments. As of December 31, 2017 and 2016, there were no significant assets or liabilities measured at fair value on a nonrecurring basis.
108
Estimated Fair Value of Financial Instruments
The fair values of cash and cash equivalents, investments in debt and equity securities classified as “trading” and short-term borrowings are estimated to be approximately equivalent to carrying amounts and have been excluded from the table below. The carrying amounts of non-trading derivative assets and liabilities and CenterPoint Energy’s ZENS indexed debt securities derivative are stated at fair value and are excluded from the table below. The fair value of each debt instrument is determined by multiplying the principal amount of each debt instrument by a combination of historical trading prices and comparable issue data. These liabilities, which are not measured at fair value in the Consolidated Balance Sheets, but for which the fair value is disclosed, would be classified as Level 2 in the fair value hierarchy.
December 31, 2017 | December 31, 2016 | ||||||||||||||
Carrying Amount | Fair Value | Carrying Amount | Fair Value | ||||||||||||
(in millions) | |||||||||||||||
Financial liabilities: | |||||||||||||||
Long-term debt | $ | 8,679 | $ | 9,220 | $ | 8,443 | $ | 8,846 | |||||||
(10) Unconsolidated Affiliates
CenterPoint Energy has the ability to significantly influence the operating and financial policies of Enable, a publicly traded MLP, and, accordingly, accounts for its investment in Enable’s common units using the equity method of accounting for in-substance real estate. See Note 2 for information on the formation of Enable.
CenterPoint Energy’s maximum exposure to loss related to Enable, a VIE in which CenterPoint Energy is not the primary beneficiary, is limited to its equity investment and Series A Preferred Unit investment as presented in the Consolidated Balance Sheet as of December 31, 2017 and outstanding current accounts receivable from Enable.
Limited Partner Interest in Enable (1):
As of December 31, | |||||||||
2017 | 2016 (2) | 2015 | |||||||
CenterPoint Energy | 54.1 | % | 54.1 | % | 55.4 | % | |||
OGE | 25.7 | % | 25.7 | % | 26.3 | % | |||
(1) | Excluding the Series A Preferred Units owned by CenterPoint Energy. |
(2) | In November 2016, Enable completed a public offering of 11,500,000 common units of which 1,424,281 were sold by ArcLight Capital Partners, LLC. The common units issued and sold by Enable resulted in dilution of both CenterPoint Energy’s and OGE’s limited partner interest in Enable. |
Enable Common Units and Series A Preferred Units Held:
December 31, 2017 | ||||||
Common | Series A Preferred | |||||
CenterPoint Energy | 233,856,623 | (1) | 14,520,000 | (2) | ||
OGE | 110,982,805 | — | ||||
(1) | The 139,704,916 subordinated units previously owned by CERC Corp. converted into common units of Enable on a one-for-one basis, on August 30, 2017, at the end of the subordination period, as set forth in Enable’s Fourth Amended and Restated Agreement of Limited Partnership. Upon conversion, holders of common units resulting from the conversion of subordinated units have all the rights and obligations of unitholders holding all other common units, including the right to receive distributions pro rata made with respect to common units. |
(2) | On February 18, 2016, CenterPoint Energy purchased an aggregate of 14,520,000 Series A Preferred Units from Enable for a total purchase price of $363 million, which is accounted for as a cost method investment. |
109
Generally, sales of more than 5% of the aggregate of the common units CenterPoint Energy owns in Enable or sales by OGE of more than 5% of the aggregate of the common units it owns in Enable are subject to mutual rights of first offer and first refusal.
Enable is controlled jointly by CERC Corp. and OGE, and each own 50% of the management rights in the general partner of Enable. Sale of CenterPoint Energy’s or OGE’s ownership interests in Enable’s general partner to a third party is subject to mutual rights of first offer and first refusal, and CenterPoint Energy is not permitted to dispose of less than all of its interest in Enable’s general partner.
Distributions Received from Enable:
Year Ended December 31, | ||||||||||||
2017 | 2016 | 2015 | ||||||||||
(in millions) | ||||||||||||
Investment in Enable’s common units | $ | 297 | $ | 297 | $ | 294 | ||||||
Investment in Enable’s Series A Preferred Units | 36 | 22 | (1) | — | ||||||||
Total | $ | 333 | $ | 319 | $ | 294 | ||||||
(1) | Represents the period from February 18, 2016 to December 31, 2016. |
As of December 31, 2017, CERC Corp. and OGE also owned 40% and 60%, respectively, of the incentive distribution rights held by the general partner of Enable. Enable is expected to pay a minimum quarterly distribution of $0.2875 per common unit on its outstanding common units to the extent it has sufficient cash from operations after establishment of cash reserves and payment of fees and expenses, including payments to its general partner and its affiliates, within 60 days after the end of each quarter. If cash distributions to Enable’s unitholders exceed $0.330625 per common unit in any quarter, the general partner will receive increasing percentages or incentive distributions rights, up to 50%, of the cash Enable distributes in excess of that amount. In certain circumstances the general partner of Enable will have the right to reset the minimum quarterly distribution and the target distribution levels at which the incentive distributions receive increasing percentages to higher levels based on Enable’s cash distributions at the time of the exercise of this reset election. To date, no incentive distributions have been made.
Effective on the formation date, CenterPoint Energy and Enable entered into the Transition Agreements. Under the Services Agreement, CenterPoint Energy agreed to provide certain support services to Enable such as accounting, legal, risk management and treasury functions for an initial term, which ended on April 30, 2016. CenterPoint Energy is providing certain services to Enable on a year-to-year basis. Enable may terminate (i) the entire Services Agreement with at least 90 days’ notice prior to the end of any extension term, or (ii) either any service provided under the Services Agreement, or the entire Services Agreement, at any time upon approval by its board of directors and with at least 180 days’ notice.
Transactions with Enable:
Year Ended December 31, | ||||||||||||
2017 | 2016 | 2015 | ||||||||||
(in millions) | ||||||||||||
Reimbursement of transition services (1) | $ | 4 | $ | 7 | $ | 16 | ||||||
Natural gas expenses, including transportation and storage costs | 115 | 110 | 117 | |||||||||
Interest income related to notes receivable from Enable (2) | — | 1 | 8 | |||||||||
(1) | Represents amounts billed under the Transition Agreements, including the costs of seconded employees. Substantially all of the seconded employees became employees of Enable effective January 1, 2015. Actual transition services costs are recorded net of reimbursement. |
(2) | In connection with CenterPoint Energy’s purchase of Series A Preferred Units, Enable redeemed $363 million of notes owed to a wholly-owned subsidiary of CERC Corp., which bore interest at an annual rate of 2.10% to 2.45%. |
110
Year Ended December 31, | ||||||||
2017 | 2016 | |||||||
(in millions) | ||||||||
Accounts receivable for amounts billed for transition services | $ | 1 | $ | 1 | ||||
Accounts payable for natural gas purchases from Enable | 13 | 10 | ||||||
CenterPoint Energy evaluates its equity method investments for impairment when factors indicate that a decrease in the value of its investment has occurred and the carrying amount of its investment may not be recoverable. An impairment loss, based on the excess of the carrying value over estimated fair value of the investment, is recognized in earnings when an impairment is deemed to be other than temporary. Considerable judgment is used in determining if an impairment loss is other than temporary and the amount of any impairment. Based on the sustained low Enable common unit price and further declines in such price during the year ended December 31, 2015, as well as the market outlook for continued depressed crude oil and natural gas prices impacting the midstream oil and gas industry, CenterPoint Energy determined that an other than temporary decrease in the value of its equity method investment in Enable had occurred. CenterPoint Energy wrote down the value of its equity method investment in Enable to its estimated fair value which resulted in impairment charges of $1,225 million for the year ended December 31, 2015. Both the income approach and market approach were utilized to estimate the fair value of CenterPoint Energy’s total investment in Enable, which includes the limited partner common and subordinated units, general partner interest and incentive distribution rights held by CenterPoint Energy. The determination of fair value considered a number of relevant factors including Enable’s common unit price and forecasted results, recent comparable transactions and the limited float of Enable’s publicly traded common units. See Note 9 for further discussion of the determination of fair value of CenterPoint Energy’s equity method investment in Enable in 2015.
As of December 31, 2017 and 2016, the carrying value of CenterPoint Energy’s equity method investment in Enable was $10.57 and $10.71 per unit, respectively, which includes limited partner common units, a general partner interest and incentive distribution rights. On December 31, 2017 and 2016, Enable’s common unit price closed at $14.22 and $15.73, respectively. There was no impairment indicated in 2017 or 2016.
As there were no identified events or changes in circumstances that may have a significant adverse effect on the fair value of CenterPoint Energy’s cost method investment in Enable’s Series A Preferred Units as of December 31, 2017 and 2016, and the investment’s fair value is not readily determinable, an estimate of the fair value of the cost method investment was not performed.
Summarized consolidated income (loss) information for Enable is as follows:
Year Ended December 31, | ||||||||||||
2017 | 2016 | 2015 | ||||||||||
(in millions) | ||||||||||||
Operating revenues | $ | 2,803 | $ | 2,272 | $ | 2,418 | ||||||
Cost of sales, excluding depreciation and amortization | 1,381 | 1,017 | 1,097 | |||||||||
Impairment of goodwill and other long-lived assets | — | 9 | 1,134 | |||||||||
Operating income (loss) | 528 | 385 | (712 | ) | ||||||||
Net income (loss) attributable to Enable | 400 | 290 | (752 | ) | ||||||||
Reconciliation of Equity in Earnings (Losses), net: | ||||||||||||
CenterPoint Energy’s interest | $ | 216 | $ | 160 | $ | (416 | ) | |||||
Basis difference amortization (1) | 49 | 48 | 8 | |||||||||
Impairment of CenterPoint Energy’s equity method investment in Enable | — | — | (1,225 | ) | ||||||||
CenterPoint Energy’s equity in earnings (losses), net (2) | $ | 265 | $ | 208 | $ | (1,633 | ) | |||||
(1) | Equity in earnings of unconsolidated affiliates includes CenterPoint Energy’s share of Enable earnings adjusted for the amortization of the basis difference of CenterPoint Energy’s original investment in Enable and its underlying equity in net assets of Enable. The basis difference is being amortized over approximately 31 years, the average life of the assets to which the basis difference is attributed. |
111
(2) | These amounts include impairment charges totaling $1,846 million composed of CenterPoint Energy’s impairment of its equity method investment in Enable of $1,225 million and CenterPoint Energy’s share, $621 million, of impairment charges Enable recorded for goodwill and long-lived assets for the year ended December 31, 2015. This impairment is offset by $213 million of earnings for the year ended December 31, 2015. |
Summarized consolidated balance sheet information for Enable is as follows:
December 31, | ||||||||
2017 | 2016 | |||||||
(in millions) | ||||||||
Current assets | $ | 416 | $ | 396 | ||||
Non-current assets | 11,177 | 10,816 | ||||||
Current liabilities | 1,279 | 362 | ||||||
Non-current liabilities | 2,660 | 3,056 | ||||||
Non-controlling interest | 12 | 12 | ||||||
Preferred equity | 362 | 362 | ||||||
Enable partners’ capital | 7,280 | 7,420 | ||||||
Reconciliation of Investment in Enable: | ||||||||
CenterPoint Energy’s ownership interest in Enable partners’ capital | $ | 3,935 | $ | 4,067 | ||||
CenterPoint Energy’s basis difference | (1,463 | ) | (1,562 | ) | ||||
CenterPoint Energy’s investment in Enable | $ | 2,472 | $ | 2,505 | ||||
(11) Indexed Debt Securities (ZENS) and Securities Related to ZENS
(a) Investment in Securities Related to ZENS
In 1995, CenterPoint Energy sold a cable television subsidiary to TW and received TW securities as partial consideration. A subsidiary of CenterPoint Energy now holds 7.1 million shares of TW Common, 0.9 million shares of Time Common and 0.9 million shares of Charter Common, which are classified as trading securities and are expected to be held to facilitate CenterPoint Energy’s ability to meet its obligation under the ZENS. Unrealized gains and losses resulting from changes in the market value of the TW Securities are recorded in CenterPoint Energy’s Statements of Consolidated Income.
(b) ZENS
In September 1999, CenterPoint Energy issued ZENS having an original principal amount of $1 billion of which $828 million remain outstanding at December 31, 2017. Each ZENS was originally exchangeable at the holder’s option at any time for an amount of cash equal to 95% of the market value of the reference shares of TW Common attributable to such note. The number and identity of the reference shares attributable to each ZENS are adjusted for certain corporate events. Prior to the closing of the transactions discussed below, the reference shares for each ZENS consisted of 0.5 share of TW Common, 0.125505 share of TWC Common and 0.0625 share of Time Common.
On May 26, 2015, Charter announced that it had entered into a definitive merger agreement with TWC. On September 21, 2015, Charter shareholders approved the announced transaction with TWC. Pursuant to the merger agreement, upon closing of the merger, TWC Common would be exchanged for cash and Charter Common and as a result, reference shares for the ZENS would consist of Charter Common, TW Common and Time Common. The merger closed on May 18, 2016. CenterPoint Energy received $100 and 0.4891 shares of Charter Common for each share of TWC Common held, resulting in cash proceeds of $178 million and 872,531 shares of Charter Common. In accordance with the terms of the ZENS, CenterPoint Energy remitted $178 million to ZENS holders in June 2016, which reduced contingent principal.
112
As a result, CenterPoint Energy recorded the following during the year ended December 31, 2016:
(in millions) | |||
Cash payment to ZENS holders | $ | 178 | |
Indexed debt – reduction | (40 | ) | |
Indexed debt securities derivative – reduction | (21 | ) | |
Loss on indexed debt securities | $ | 117 | |
As of December 31, 2017, the reference shares for each ZENS consisted of 0.5 share of TW Common, 0.0625 share of Time Common and 0.061382 share of Charter Common.
On October 22, 2016, AT&T announced that it had entered into a definitive agreement to acquire TW in a stock and cash transaction. On February 15, 2017, TW shareholders approved the announced transaction with AT&T. Pursuant to the merger agreement, upon closing of the merger, TW shareholders would receive for each of their shares of TW Common an estimated implied value of $107.50, comprised of $53.75 per share in cash and $53.75 per share in AT&T Common. The stock portion will be subject to a collar such that TW shareholders will receive 1.437 shares of AT&T Common if AT&T Common’s average stock price is below $37.411 at closing and 1.3 shares of AT&T Common if AT&T Common’s average stock price is above $41.349 at closing. Cash received for the TW Common reference shares would subsequently be distributed to ZENS holders, which is expected to reduce the contingent principal balance, and reference shares would consist of Charter Common, Time Common and AT&T Common. In November 2017, the U.S. Department of Justice filed a civil antitrust lawsuit to block AT&T’s acquisition of TW. AT&T has announced it does not expect the outcome of this matter to prohibit the acquisition. Legal proceedings are expected to begin in the first or second quarter of 2018.
On November 26, 2017, Meredith announced that it had entered into a definitive merger agreement with Time. Pursuant to the merger agreement, a subsidiary of Meredith offered to purchase for cash all outstanding Time Common shares for $18.50 per share. The transaction was consummated on January 31, 2018. CenterPoint Energy elected to make a reference share offer adjustment and distribute additional interest, if any, in accordance with the terms of its ZENS rather than electing to increase the early exchange ratio to 100% during the pendency of Meredith’s tender offer for all outstanding shares of Time Common. Distributions of additional interest on the ZENS will be made by CenterPoint Energy in connection with the consummation of Meredith’s tender offer and the subsequent merger of Time with a subsidiary of Meredith. CenterPoint Energy's distribution of additional interest in connection with the reference share offer is expected to be proportionate to the percentage of eligible shares that are validly tendered by Time stockholders in Meredith’s tender offer. In accordance with the terms of the ZENS, CenterPoint Energy will remit additional interest of approximately $16 million to ZENS holders on March 6, 2018, which will reduce the contingent principal amount.
CenterPoint Energy pays interest on the ZENS at an annual rate of 2% plus the amount of any quarterly cash dividends paid in respect of the reference shares attributable to the ZENS. The principal amount of ZENS is subject to being increased or decreased to the extent that the annual yield from interest and cash dividends on the reference shares is less than or more than 2.309%. The adjusted principal amount is defined in the ZENS instrument as “contingent principal.” At December 31, 2017, ZENS having an original principal amount of $828 million and a contingent principal amount of $505 million were outstanding and were exchangeable, at the option of the holders, for cash equal to 95% of the market value of reference shares deemed to be attributable to the ZENS. As of December 31, 2017, the market value of such shares was approximately $960 million, which would provide an exchange amount of $1,101 for each $1,000 original principal amount of ZENS. At maturity of the ZENS in 2029, CenterPoint Energy will be obligated to pay in cash the higher of the contingent principal amount of the ZENS or an amount based on the then-current market value of the reference shares, which will include any additional publicly-traded securities distributed with respect to the current reference shares prior to maturity.
The ZENS obligation is bifurcated into a debt component and a derivative component (the holder’s option to receive the appreciated value of the reference shares at maturity). The bifurcated debt component accretes through interest charges at 19.5% annually up to the contingent principal amount of the ZENS in 2029. Such accretion will be reduced by annual cash interest payments, as described above. The derivative component is recorded at fair value and changes in the fair value of the derivative component are recorded in CenterPoint Energy’s Statements of Consolidated Income. Changes in the fair value of the TW Securities held by CenterPoint Energy are expected to substantially offset changes in the fair value of the derivative component of the ZENS.
113
The following table sets forth summarized financial information regarding CenterPoint Energy’s investment in TW Securities and each component of CenterPoint Energy’s ZENS obligation.
TW Securities | Debt Component of ZENS (1) | Derivative Component of ZENS | |||||||||
(in millions) | |||||||||||
Balance as of December 31, 2014 | $ | 930 | $ | 142 | $ | 541 | |||||
Accretion of debt component of ZENS | — | 27 | — | ||||||||
2% interest paid | — | (17 | ) | — | |||||||
Sale of TW Securities | (32 | ) | — | — | |||||||
Distribution to ZENS holders | — | (7 | ) | (18 | ) | ||||||
Gain on indexed debt securities | — | — | (81 | ) | |||||||
Loss on TW Securities | (93 | ) | — | — | |||||||
Balance as of December 31, 2015 | 805 | 145 | 442 | ||||||||
Accretion of debt component of ZENS | — | 26 | — | ||||||||
2% interest paid | — | (17 | ) | — | |||||||
Sale of TW Securities | (178 | ) | — | — | |||||||
Distribution to ZENS holders | — | (40 | ) | (21 | ) | ||||||
Loss on indexed debt securities | — | — | 296 | ||||||||
Gain on TW Securities | 326 | — | — | ||||||||
Balance as of December 31, 2016 | 953 | 114 | 717 | ||||||||
Accretion of debt component of ZENS | — | 27 | — | ||||||||
2% interest paid | — | (17 | ) | — | |||||||
Distribution to ZENS holders | — | (2 | ) | — | |||||||
Gain on indexed debt securities | — | — | (49 | ) | |||||||
Gain on TW Securities | 7 | — | — | ||||||||
Balance as of December 31, 2017 | $ | 960 | $ | 122 | $ | 668 | |||||
(1) | To reflect adoption of ASU 2015-03, balances have been restated to include unamortized debt issuance costs of $9 million and $10 million as of December 31, 2015 and 2014, respectively. |
(12) Equity
Dividends Declared
CenterPoint Energy declared and paid dividends per share of $1.07, $1.03 and $0.99, respectively, during the years ended December 31, 2017, 2016 and 2015.
On December 13, 2017, our Board of Directors declared a regular quarterly cash dividend of $0.2775 per share, payable on March 8, 2018 to shareholders of record at the close of business on February 15, 2018.
Undistributed Retained Earnings
As of both December 31, 2017 and 2016, CenterPoint Energy’s consolidated retained earnings balance includes undistributed earnings from Enable of $-0-.
114
(13) Short-term Borrowings and Long-term Debt
December 31, 2017 | December 31, 2016 | ||||||||||||||
Long-Term | Current (1) | Long-Term | Current (1) | ||||||||||||
(in millions) | |||||||||||||||
Short-term borrowings: | |||||||||||||||
Inventory financing (2) | $ | — | $ | 39 | $ | — | $ | 35 | |||||||
Total short-term borrowings | — | 39 | — | 35 | |||||||||||
Long-term debt: | |||||||||||||||
CenterPoint Energy: | |||||||||||||||
ZENS due 2029 (3) | — | 122 | — | 114 | |||||||||||
Senior notes 2.50% due 2022 | 500 | — | — | 250 | |||||||||||
Pollution control bonds 5.05% to 5.125% due 2018 to 2028 (4) | 68 | 50 | 118 | — | |||||||||||
Commercial paper (5) | 855 | — | 835 | — | |||||||||||
Houston Electric: | |||||||||||||||
First mortgage bonds 9.15% due 2021 | 102 | — | 102 | — | |||||||||||
General mortgage bonds 1.85% to 6.95% due 2021 to 2044 | 2,812 | — | 2,512 | — | |||||||||||
System restoration bonds 3.46% to 4.243% due 2018 to 2022 | 256 | 56 | 312 | 53 | |||||||||||
Transition bonds 2.161% to 5.302% due 2019 to 2024 | 1,181 | 378 | 1,560 | 358 | |||||||||||
CERC Corp.: | |||||||||||||||
Senior notes 4.10% to 6.625% due 2021 to 2047 | 1,593 | — | 1,593 | 250 | |||||||||||
Commercial paper (5) | 898 | — | 569 | — | |||||||||||
Unamortized debt issuance costs | (38 | ) | — | (33 | ) | — | |||||||||
Unamortized discount and premium, net | (32 | ) | — | (36 | ) | — | |||||||||
Total long-term debt | 8,195 | 606 | 7,532 | 1,025 | |||||||||||
Total debt | $ | 8,195 | $ | 645 | $ | 7,532 | $ | 1,060 | |||||||
(1) | Includes amounts due or exchangeable within one year of the date noted. |
(2) | NGD has AMAs associated with its utility distribution service in Arkansas, Louisiana, Mississippi, Oklahoma and Texas. The AMAs have varying terms, the longest of which expires in 2020. Pursuant to the provisions of the agreements, NGD sells natural gas and agrees to repurchase an equivalent amount of natural gas during the winter heating seasons at the same cost, plus a financing charge. These transactions are accounted for as an inventory financing. |
(3) | CenterPoint Energy’s ZENS obligation is bifurcated into a debt component and an embedded derivative component. For additional information regarding ZENS, see Note 11(b). As ZENS are exchangeable for cash at any time at the option of the holders, these notes are classified as a current portion of long-term debt. |
(4) | $118 million of these series of debt were secured by general mortgage bonds of Houston Electric as of both December 31, 2017 and 2016. |
(5) | Classified as long-term debt because the termination date of the facility that backstops the commercial paper is more than one year from the date noted. |
Long-term Debt
Debt Retirements. In February 2017, CenterPoint Energy retired $250 million aggregate principal amount of its 5.95% senior notes at their maturity. The retirement of senior notes was financed by the issuance of commercial paper.
115
In November 2017, CERC Corp. retired $250 million aggregate principal amount of its 6.125% senior notes at their maturity. The retirement of senior notes was financed by the issuance of commercial paper.
In December 2017, CERC Corp. redeemed $300 million aggregate principal amount of its 6.00% senior notes due 2018 at a redemption price equal to 100% of the principal amount thereof, plus accrued and unpaid interest thereon to but excluding the redemption date, plus the make-whole premium. The make-whole premium associated with the redemption was approximately $5 million and was included in Other Income, net on the Statements of Consolidated Income.
Debt Issuances. During the year ended December 31, 2017, CenterPoint Energy, Houston Electric and CERC Corp. issued the following debt instruments:
Issuance Date | Debt Instrument | Aggregate Principal Amount | Interest Rate | Maturity Date | ||||||||
(in millions) | ||||||||||||
Houston Electric | January 2017 | General mortgage bonds | $ | 300 | 3.00% | 2027 | ||||||
CenterPoint Energy | August 2017 | Unsecured senior notes | 500 | 2.50% | 2022 | |||||||
CERC Corp. | August 2017 | Unsecured senior notes | 300 | 4.10% | 2047 | |||||||
The proceeds from these issuances were used for general limited liability company and corporate purposes, as applicable, including to repay portions of outstanding commercial paper.
Securitization Bonds. As of December 31, 2017, Houston Electric had special purpose subsidiaries consisting of the Bond Companies, which it consolidates. The consolidated special purpose subsidiaries are wholly-owned, bankruptcy remote entities that were formed solely for the purpose of purchasing and owning transition or system restoration property through the issuance of transition bonds or system restoration bonds and activities incidental thereto. These Securitization Bonds are payable only through the imposition and collection of “transition” or “system restoration” charges, as defined in the Texas Public Utility Regulatory Act, which are irrevocable, non-bypassable charges to provide recovery of authorized qualified costs. Houston Electric has no payment obligations in respect of the Securitization Bonds other than to remit the applicable transition or system restoration charges it collects. Each special purpose entity is the sole owner of the right to impose, collect and receive the applicable transition or system restoration charges securing the bonds issued by that entity. Creditors of CenterPoint Energy or Houston Electric have no recourse to any assets or revenues of the Bond Companies (including the transition and system restoration charges), and the holders of Securitization Bonds have no recourse to the assets or revenues of CenterPoint Energy or Houston Electric.
Credit Facilities. In June 2017, CenterPoint Energy, Houston Electric and CERC Corp. each entered into amendments to their respective revolving credit facilities to extend the termination date thereof from March 3, 2021 to March 3, 2022 and to terminate the swingline loan subfacility thereunder. The amendments to the CenterPoint Energy and CERC Corp. revolving credit facilities also increased the aggregate commitments by $100 million and $300 million, respectively, to $1.7 billion and $900 million under their respective revolving credit facilities. No changes were made to the aggregate commitments under the Houston Electric revolving credit facility. In connection with the amendments to increase the aggregate commitments under their respective revolving credit facilities, CenterPoint Energy and CERC Corp. each increased the size of their respective commercial paper programs to permit the issuance of commercial paper notes in an aggregate principal amount not to exceed $1.7 billion and $900 million, respectively, at any time outstanding.
As of December 31, 2017 and 2016, CenterPoint Energy, Houston Electric and CERC Corp. had the following revolving credit facilities and utilization of such facilities:
December 31, 2017 | December 31, 2016 | |||||||||||||||||||||||||||||||
Size of Facility | Loans | Letters of Credit | Commercial Paper | Size of Facility | Loans | Letters of Credit | Commercial Paper | |||||||||||||||||||||||||
(in millions) | ||||||||||||||||||||||||||||||||
CenterPoint Energy | $ | 1,700 | $ | — | $ | 6 | $ | 855 | (1) | $ | 1,600 | $ | — | $ | 6 | $ | 835 | (1) | ||||||||||||||
Houston Electric | 300 | — | 4 | — | 300 | — | 4 | — | ||||||||||||||||||||||||
CERC Corp. | 900 | — | 1 | 898 | (2) | 600 | — | 4 | 569 | (2) | ||||||||||||||||||||||
Total | $ | 2,900 | $ | — | $ | 11 | $ | 1,753 | $ | 2,500 | $ | — | $ | 14 | $ | 1,404 | ||||||||||||||||
(1) | Weighted average interest rate was 1.88% and 1.04% as of December 31, 2017 and December 31, 2016, respectively. |
116
(2) | Weighted average interest rate was 1.72% and 1.03% as of December 31, 2017 and December 31, 2016, respectively. |
Execution Date | Company | Size of Facility | Draw Rate of LIBOR plus (2) | Financial Covenant Limit on Debt for Borrowed Money to Capital Ratio | Debt for Borrowed Money to Capital Ratio as of December 31, 2017 (3) | Termination Date (5) | ||||||||
(in millions) | ||||||||||||||
March 3, 2016 | CenterPoint Energy | $ | 1,700 | (1) | 1.250% | 65% | (4) | 52.9% | March 3, 2022 | |||||
March 3, 2016 | Houston Electric | 300 | 1.125% | 65% | (4) | 48.6% | March 3, 2022 | |||||||
March 3, 2016 | CERC Corp. | 900 | (1) | 1.250% | 65% | 40.4% | March 3, 2022 | |||||||
(1) | Amended on June 16, 2017 to increase the aggregate commitment size as noted above. |
(2) | Based on current credit ratings. |
(3) | As defined in the revolving credit facility agreement, excluding Securitization Bonds. |
(4) | The financial covenant limit will temporarily increase from 65% to 70% if Houston Electric experiences damage from a natural disaster in its service territory and CenterPoint Energy certifies to the administrative agent that Houston Electric has incurred system restoration costs reasonably likely to exceed $100 million in a consecutive 12-month period, all or part of which Houston Electric intends to seek to recover through securitization financing. Such temporary increase in the financial covenant would be in effect from the date CenterPoint Energy delivers its certification until the earliest to occur of (i) the completion of the securitization financing, (ii) the first anniversary of CenterPoint Energy’s certification or (iii) the revocation of such certification. |
(5) | Amended on June 16, 2017 to extend the termination date as noted above. |
CenterPoint Energy, Houston Electric and CERC Corp. were in compliance with all financial debt covenants as of December 31, 2017.
Maturities. Maturities of long-term debt, capital leases and sinking fund requirements, excluding the ZENS obligation, are as follows:
CenterPoint Energy (1) | Securitization Bonds | ||||||
(in millions) | |||||||
2018 | $ | 484 | $ | 434 | |||
2019 | 458 | 458 | |||||
2020 | 231 | 231 | |||||
2021 | 1,206 | 211 | |||||
2022 | 2,773 | 219 | |||||
(1) | These maturities include Securitization Bonds principal repayments on scheduled payment dates. |
Liens. As of December 31, 2017, Houston Electric’s assets were subject to liens securing approximately $102 million of first mortgage bonds. Sinking or improvement fund and replacement fund requirements on the first mortgage bonds may be satisfied by certification of property additions. Sinking fund and replacement fund requirements for 2017, 2016 and 2015 have been satisfied by certification of property additions. The replacement fund requirement to be satisfied in 2018 is approximately $266 million, and the sinking fund requirement to be satisfied in 2018 is approximately $1.6 million. CenterPoint Energy expects Houston Electric to meet these 2018 obligations by certification of property additions. As of December 31, 2017, Houston Electric’s assets were also subject to liens securing approximately $2.9 billion of general mortgage bonds, which are junior to the liens of the first mortgage bonds.
117
(14) Income Taxes
The components of CenterPoint Energy’s income tax expense (benefit) were as follows:
Year Ended December 31, | |||||||||||
2017 | 2016 | 2015 | |||||||||
(in millions) | |||||||||||
Current income tax expense (benefit): | |||||||||||
Federal | $ | 32 | $ | 23 | $ | (37 | ) | ||||
State | 9 | 18 | 12 | ||||||||
Total current expense (benefit) | 41 | 41 | (25 | ) | |||||||
Deferred income tax expense (benefit): | |||||||||||
Federal | (806 | ) | 185 | (359 | ) | ||||||
State | 36 | 28 | (54 | ) | |||||||
Total deferred expense (benefit) | (770 | ) | 213 | (413 | ) | ||||||
Total income tax expense (benefit) | $ | (729 | ) | $ | 254 | $ | (438 | ) | |||
A reconciliation of income tax expense (benefit) using the federal statutory income tax rate to the actual income tax expense and resulting effective income tax rate is as follows:
Year Ended December 31, | |||||||||||
2017 | 2016 | 2015 | |||||||||
(in millions) | |||||||||||
Income (loss) before income taxes | $ | 1,063 | $ | 686 | $ | (1,130 | ) | ||||
Federal statutory income tax rate | 35 | % | 35 | % | 35 | % | |||||
Expected federal income tax expense (benefit) | 372 | 240 | (396 | ) | |||||||
Increase (decrease) in tax expense resulting from: | |||||||||||
State income tax expense, net of federal income tax | 26 | 27 | (27 | ) | |||||||
State valuation allowance, net of federal income tax | 3 | 3 | — | ||||||||
Federal income tax rate reduction | (1,113 | ) | — | — | |||||||
Other, net | (17 | ) | (16 | ) | (15 | ) | |||||
Total | (1,101 | ) | 14 | (42 | ) | ||||||
Total income tax expense (benefit) | $ | (729 | ) | $ | 254 | $ | (438 | ) | |||
Effective tax rate | (69 | )% | 37 | % | 39 | % | |||||
In 2017, CenterPoint Energy recognized a $1.1 billion deferred tax benefit from the remeasurement of CenterPoint Energy’s ADFIT liability as a result of the enactment of the TCJA on December 22, 2017 which reduced the U.S. corporate income tax rate from 35% to 21%. For additional information on the 2017 impacts of the TCJA, please see the discussion following the deferred tax assets and liabilities table below.
In 2016, CenterPoint Energy recognized a $6 million deferred tax expense due to Louisiana state law change and recorded an additional $3 million valuation allowance on certain state carryforwards.
In 2015, CenterPoint Energy’s effective tax rate was higher than the statutory rate primarily due to lower earnings from the impairment of CenterPoint Energy’s equity method investment in Enable. The impairment loss reduced the deferred tax liability on CenterPoint Energy’s equity method investment in Enable.
118
The tax effects of temporary differences that give rise to significant portions of deferred tax assets and liabilities were as follows:
December 31, | |||||||
2017 | 2016 | ||||||
(in millions) | |||||||
Deferred tax assets: | |||||||
Benefits and compensation | $ | 162 | $ | 316 | |||
Regulatory liabilities | 347 | 57 | |||||
Loss and credit carryforwards | 90 | 79 | |||||
Asset retirement obligations | 68 | 77 | |||||
Other | 16 | 21 | |||||
Valuation allowance | (7 | ) | (5 | ) | |||
Total deferred tax assets | 676 | 545 | |||||
Deferred tax liabilities: | |||||||
Property, plant, and equipment | 1,808 | 2,603 | |||||
Investment in unconsolidated affiliates | 927 | 1,383 | |||||
Regulatory assets | 473 | 940 | |||||
Investment in marketable securities and indexed debt | 502 | 772 | |||||
Indexed debt securities derivative | 13 | 4 | |||||
Other | 127 | 106 | |||||
Total deferred tax liabilities | 3,850 | 5,808 | |||||
Net deferred tax liabilities | $ | 3,174 | $ | 5,263 | |||
Federal Tax Reform. On December 22, 2017, President Trump signed into law comprehensive tax reform legislation informally called the Tax Cuts and Jobs Acts, or TCJA, which resulted in significant changes to federal tax laws effective January 1, 2018. The new legislation contains several key tax provisions that will impact CenterPoint Energy, including the reduction of the corporate income tax rate from 35% to 21% effective January 1, 2018. The new legislation also includes a variety of other changes, such as, a limitation on the tax deductibility of interest expense, acceleration of business asset expensing and reduction in the amount of executive pay that may qualify for a tax deduction, among others. Several other provisions of the TCJA are not generally applicable to the public utility industry, including the limitation on the tax deductibility of interest expense and the acceleration of business asset expensing.
While the effective date of the rate change in the legislation is January 1, 2018, ASC 740 requires that deferred tax balances be adjusted in the period of enactment to the rate in which those deferred taxes will reverse. The EDIT from the rate change resulted in an adjustment to income tax expense of approximately $1.1 billion and creation of a net regulatory liability of $1.3 billion (includes $0.3 billion gross-up) for the amount that is likely to be returned to ratepayers. The major components of the $1.1 billion benefit to income tax expense are for the remeasurement of CenterPoint Energy's deferred taxes associated with its investment in Enable, investment in marketable securities (ZENS) and stranded costs related to the Securitization Bonds. The amount and expected amortization of the net regulatory tax liability may differ from the $1.3 billion estimate, possibly materially, due to, among other things, regulatory actions, interpretations and assumptions CenterPoint Energy has made, and any guidance that may be issued in the future. CenterPoint Energy will continue to assess the amount and expected amortization of the net regulatory tax liability as it has proceedings with regulators in future periods. For the discussion of risks associated with the amount and expected flow through of EDIT by Houston Electric and NGD, see “Management’s Discussion and Analysis of Financial Condition and Results of Operations — Liquidity and Capital Resources — Regulatory Matters —Tax Reform” in Item 7 of Part II of this report.
Tax Attribute Carryforwards and Valuation Allowance. CenterPoint Energy has no remaining federal net operating loss carryforward or federal tax credits as of December 31, 2017. As of December 31, 2017, CenterPoint Energy had $870 million of state net operating loss carryforwards that expire between 2018 and 2037 and $12 million of state tax credits that do not expire. A state capital loss carryforward of $244 million expired unutilized at the end of 2017. CenterPoint Energy reported a valuation allowance of $7 million because it is more likely than not that the benefit from certain state net operating loss carryforwards will not be realized.
119
Uncertain Income Tax Positions. CenterPoint Energy reported no uncertain tax liability as of December 31, 2017, 2016 and 2015. CenterPoint Energy expects no significant change to the uncertain tax liability over the next 12 months ending December 31, 2018.
Tax Audits and Settlements. Tax years through 2015 have been audited and settled with the IRS. For the 2016 through 2018 tax years, CenterPoint Energy is a participant in the IRS’s Compliance Assurance Process.
(15) Commitments and Contingencies
(a) Natural Gas Supply and Other Commitments
Natural gas supply commitments include natural gas contracts related to CenterPoint Energy’s Natural Gas Distribution and Energy Services business segments, which have various quantity requirements and durations, that are not classified as non-trading derivative assets and liabilities in CenterPoint Energy’s Consolidated Balance Sheets as of December 31, 2017 and 2016 as these contracts meet an exception as “normal purchases contracts” or do not meet the definition of a derivative. Natural gas supply commitments also include natural gas transportation contracts that do not meet the definition of a derivative. As of December 31, 2017, minimum payment obligations for natural gas supply and other commitments are approximately:
Natural Gas Supply | Other (1) | ||||||
(in millions) | |||||||
2018 | $ | 463 | $ | 37 | |||
2019 | 353 | 17 | |||||
2020 | 169 | 11 | |||||
2021 | 79 | — | |||||
2022 | 49 | — | |||||
2023 and beyond | 108 | — | |||||
(1)Primarily relates to technology hardware and software
(b) AMAs
NGD currently has AMAs associated with its utility distribution service in Arkansas, Louisiana, Mississippi, Oklahoma and Texas. The AMAs have varying terms, the longest of which expires in 2020. Generally, AMAs are contracts between NGD and an asset manager that are intended to transfer the working capital obligation and maximize the utilization of the assets. In these AMAs, NGD agrees to release transportation and storage capacity to other parties to manage natural gas storage, supply and delivery arrangements for NGD and to use the released capacity for other purposes when it is not needed for NGD. NGD is compensated by the asset manager through payments made over the life of the AMAs based in part on the results of the asset optimization. NGD has an obligation to purchase its winter storage requirements that have been released to the asset manager under these AMAs. NGD has received approval from the state regulatory commissions in Arkansas, Louisiana, Mississippi and Oklahoma to retain a share of the AMA proceeds.
(c) Lease Commitments
The following table sets forth information concerning CenterPoint Energy’s obligations under non-cancelable long-term operating leases as of December 31, 2017, which primarily consist of rental agreements for building space, data processing equipment, compression equipment and rights-of-way:
(in millions) | |||
2018 | $ | 5 | |
2019 | 5 | ||
2020 | 4 | ||
2021 | 4 | ||
2022 | 3 | ||
2023 and beyond | 5 | ||
Total | $ | 26 | |
120
Total lease expense for all operating leases was $10 million, $10 million and $9 million during 2017, 2016 and 2015, respectively.
(d) Legal, Environmental and Other Matters
Legal Matters
Gas Market Manipulation Cases. CenterPoint Energy, Houston Electric or their predecessor, Reliant Energy, and certain of their former subsidiaries have been named as defendants in certain lawsuits described below. Under a master separation agreement between CenterPoint Energy and a former subsidiary, RRI, CenterPoint Energy and its subsidiaries are entitled to be indemnified by RRI and its successors for any losses, including certain attorneys’ fees and other costs, arising out of these lawsuits. In May 2009, RRI sold its Texas retail business to a subsidiary of NRG and RRI changed its name to RRI Energy, Inc. In December 2010, Mirant Corporation merged with and became a wholly-owned subsidiary of RRI, and RRI changed its name to GenOn. In December 2012, NRG acquired GenOn through a merger in which GenOn became a wholly-owned subsidiary of NRG. None of the sale of the retail business, the merger with Mirant Corporation, or the acquisition of GenOn by NRG alters RRI’s (now GenOn’s) contractual obligations to indemnify CenterPoint Energy and its subsidiaries, including Houston Electric, for certain liabilities, including their indemnification obligations regarding the gas market manipulation litigation.
A large number of lawsuits were filed against numerous gas market participants in a number of federal and western state courts in connection with the operation of the natural gas markets in 2000–2002. CenterPoint Energy and its affiliates have since been released or dismissed from all such cases. CES, a subsidiary of CERC Corp., was a defendant in a case now pending in federal court in Nevada alleging a conspiracy to inflate Wisconsin natural gas prices in 2000–2002. On May 24, 2016, the district court granted CES’s motion for summary judgment, dismissing CES from the case. The plaintiffs have appealed that ruling. CenterPoint Energy and CES intend to continue vigorously defending against the plaintiffs’ claims. In June 2017, GenOn and various affiliates filed for protection under Chapter 11 of the U.S. Bankruptcy Code. In December 2017, GenOn received court approval of a restructuring plan and is expected to emerge from Chapter 11 in mid-2018. CenterPoint Energy, CERC, and CES submitted proofs of claim in the bankruptcy proceedings to protect their indemnity rights. If GenOn were unable to meet its indemnity obligations or satisfy a liability that has been assumed in the gas market manipulation litigation, then CenterPoint Energy, Houston Electric or CERC could incur liability and be responsible for satisfying the liability. CenterPoint Energy does not expect the ultimate outcome of the case against CES to have a material adverse effect on its financial condition, results of operations or cash flows.
Minnehaha Academy. On August 2, 2017, a natural gas explosion occurred at the Minnehaha Academy in Minneapolis, Minnesota, resulting in the deaths of two school employees, serious injuries to others and significant property damage to the school. CenterPoint Energy, certain of its subsidiaries, and the contractor company working in the school have been named in litigation arising out of this incident. Additionally, CenterPoint Energy is cooperating with the ongoing investigation conducted by the National Transportation Safety Board. Further, CenterPoint Energy is contesting approximately $200,000 in fines imposed by the Minnesota Office of Pipeline Safety. In early 2018, the Minnesota Occupational Safety and Health Administration concluded its investigation without any adverse findings against CenterPoint Energy. CenterPoint Energy’s general and excess liability insurance policies provide coverage for third party bodily injury and property damage claims.
Environmental Matters
MGP Sites. CERC and its predecessors operated MGPs in the past. With respect to certain Minnesota MGP sites, CERC has completed state-ordered remediation and continues state-ordered monitoring and water treatment. As of December 31, 2017, CERC had a recorded liability of $7 million for continued monitoring and any future remediation required by regulators in Minnesota. The estimated range of possible remediation costs for the sites for which CERC believes it may have responsibility was $5 million to $30 million based on remediation continuing for 30 to 50 years. The cost estimates are based on studies of a site or industry average costs for remediation of sites of similar size. The actual remediation costs will depend on the number of sites to be remediated, the participation of other PRPs, if any, and the remediation methods used.
In addition to the Minnesota sites, the EPA and other regulators have investigated MGP sites that were owned or operated by CERC or may have been owned by one of its former affiliates. CenterPoint Energy does not expect the ultimate outcome of these matters to have a material adverse effect on the financial condition, results of operations or cash flows of either CenterPoint Energy or CERC.
Asbestos. Some facilities owned by CenterPoint Energy or its predecessors in interest contain or have contained asbestos insulation and other asbestos-containing materials. CenterPoint Energy and its subsidiaries are from time to time named, along
121
with numerous others, as defendants in lawsuits filed by a number of individuals who claim injury due to exposure to asbestos, and CenterPoint Energy anticipates that additional claims may be asserted in the future. Although their ultimate outcome cannot be predicted at this time, CenterPoint Energy does not expect these matters, either individually or in the aggregate, to have a material adverse effect on CenterPoint Energy’s financial condition, results of operations or cash flows.
Other Environmental. From time to time, CenterPoint Energy identifies the presence of environmental contaminants during its operations or on property where its predecessor companies have conducted operations. Other such sites involving contaminants may be identified in the future. CenterPoint Energy has and expects to continue to remediate any identified sites consistent with its state and federal legal obligations. From time to time CenterPoint Energy has received notices, and may receive notices in the future, from regulatory authorities or others regarding its status as a PRP in connection with sites found to require remediation due to the presence of environmental contaminants. In addition, CenterPoint Energy has been, or may be, named from time to time as a defendant in litigation related to such sites. Although the ultimate outcome of such matters cannot be predicted at this time, CenterPoint Energy does not expect these matters, either individually or in the aggregate, to have a material adverse effect on CenterPoint Energy’s financial condition, results of operations or cash flows.
Other Proceedings
CenterPoint Energy is involved in other legal, environmental, tax and regulatory proceedings before various courts, regulatory commissions and governmental agencies regarding matters arising in the ordinary course of business. From time to time, CenterPoint Energy is also a defendant in legal proceedings with respect to claims brought by various plaintiffs against broad groups of participants in the energy industry. Some of these proceedings involve substantial amounts. CenterPoint Energy regularly analyzes current information and, as necessary, provides accruals for probable and reasonably estimable liabilities on the eventual disposition of these matters. CenterPoint Energy does not expect the disposition of these matters to have a material adverse effect on CenterPoint Energy’s financial condition, results of operations or cash flows.
(16) Earnings Per Share
The following table reconciles numerators and denominators of CenterPoint Energy’s basic and diluted earnings (loss) per share calculations:
For the Year Ended December 31, | |||||||||||
2017 | 2016 | 2015 | |||||||||
(in millions, except per share and share amounts) | |||||||||||
Net income (loss) (1) | $ | 1,792 | $ | 432 | $ | (692 | ) | ||||
Basic weighted average shares outstanding | 430,964,000 | 430,606,000 | 430,180,000 | ||||||||
Plus: Incremental shares from assumed conversions: | |||||||||||
Restricted stock (2) | 3,344,000 | 2,997,000 | — | ||||||||
Diluted weighted average shares | 434,308,000 | 433,603,000 | 430,180,000 | ||||||||
Basic earnings (loss) per share | $ | 4.16 | $ | 1.00 | $ | (1.61 | ) | ||||
Diluted earnings (loss) per share | $ | 4.13 | $ | 1.00 | $ | (1.61 | ) | ||||
(1) | Net income for the year ended December 31, 2017 includes a reduction in income taxes of $1,113 million due to tax reform. See Note 14 for further discussion of the impacts of tax reform implementation. |
(2) | 2,349,000 incremental shares from assumed conversions of restricted stock have not been included in the computation of diluted earnings (loss) per share for the year ended December 31, 2015, as their inclusion would be anti-dilutive. |
122
(17) Unaudited Quarterly Information
Summarized quarterly financial data is as follows:
Year Ended December 31, 2017 | |||||||||||||||
First Quarter | Second Quarter | Third Quarter | Fourth Quarter | ||||||||||||
(in millions, except per share amounts) | |||||||||||||||
Revenues | $ | 2,735 | $ | 2,143 | $ | 2,098 | $ | 2,638 | |||||||
Operating income | 274 | 223 | 279 | 296 | |||||||||||
Net income (1) | 192 | 135 | 169 | 1,296 | |||||||||||
Basic earnings per share (2) | $ | 0.45 | $ | 0.31 | $ | 0.39 | $ | 3.01 | |||||||
Diluted earnings per share (2) | $ | 0.44 | $ | 0.31 | $ | 0.39 | $ | 2.99 | |||||||
Year Ended December 31, 2016 | |||||||||||||||
First Quarter | Second Quarter | Third Quarter | Fourth Quarter | ||||||||||||
(in millions, except per share amounts) | |||||||||||||||
Revenues | $ | 1,984 | $ | 1,574 | $ | 1,889 | $ | 2,081 | |||||||
Operating income | 250 | 182 | 284 | 243 | |||||||||||
Net income (loss) | 154 | (2 | ) | 179 | 101 | ||||||||||
Basic earnings (loss) per share (2) | $ | 0.36 | $ | (0.01 | ) | $ | 0.42 | $ | 0.23 | ||||||
Diluted earnings (loss) per share (2) | $ | 0.36 | $ | (0.01 | ) | $ | 0.41 | $ | 0.23 | ||||||
(1) | Net income for the fourth quarter 2017 includes a reduction in income taxes of $1,113 million due to tax reform. See Note 14 for further discussion of the impacts of tax reform implementation. |
(2) | Quarterly earnings (loss) per common share are based on the weighted average number of shares outstanding during the quarter, and the sum of the quarters may not equal annual earnings (loss) per common share. |
(18) Reportable Business Segments
CenterPoint Energy’s determination of reportable business segments considers the strategic operating units under which CenterPoint Energy manages sales, allocates resources and assesses performance of various products and services to wholesale or retail customers in differing regulatory environments. CenterPoint Energy uses operating income as the measure of profit or loss for its business segments other than Midstream Investments, where it uses equity in earnings.
CenterPoint Energy’s reportable business segments include the following: Electric Transmission & Distribution, Natural Gas Distribution, Energy Services, Midstream Investments and Other Operations. The electric transmission and distribution function (Houston Electric) is reported in the Electric Transmission & Distribution business segment. Natural Gas Distribution consists of intrastate natural gas sales to, and natural gas transportation and distribution for, residential, commercial, industrial and institutional customers. Energy Services represents CenterPoint Energy’s non-rate regulated gas sales and services operations. Midstream Investments consists of CenterPoint Energy’s equity investment in Enable. Other Operations consists primarily of other corporate operations which support all of CenterPoint Energy’s business operations.
Long-lived assets include net property, plant and equipment, goodwill and other intangibles and equity investments in unconsolidated subsidiaries. Intersegment sales are eliminated in consolidation.
123
Financial data for business segments and products and services are as follows:
Revenues from External Customers | Intersegment Revenues | Depreciation and Amortization | Operating Income | Total Assets (1) | Expenditures for Long-Lived Assets | ||||||||||||||||||
(in millions) | |||||||||||||||||||||||
As of and for the year ended December 31, 2017: | |||||||||||||||||||||||
Electric Transmission & Distribution | $ | 2,997 | (2) | $ | — | $ | 724 | $ | 610 | $ | 10,292 | $ | 924 | ||||||||||
Natural Gas Distribution | 2,606 | 33 | 260 | 328 | 6,608 | 523 | |||||||||||||||||
Energy Services | 3,997 | 52 | 19 | 125 | 1,521 | 11 | |||||||||||||||||
Midstream Investments (3) | — | — | — | — | 2,472 | — | |||||||||||||||||
Other | 14 | — | 33 | 9 | 2,497 | (4) | 36 | ||||||||||||||||
Eliminations | — | (85 | ) | — | — | (654 | ) | — | |||||||||||||||
Consolidated | $ | 9,614 | $ | — | $ | 1,036 | $ | 1,072 | $ | 22,736 | 1,494 | ||||||||||||
Reconciling items | (68 | ) | |||||||||||||||||||||
Capital expenditures per Statements of Consolidated Cash Flows | $ | 1,426 | |||||||||||||||||||||
As of and for the year ended December 31, 2016: | |||||||||||||||||||||||
Electric Transmission & Distribution | $ | 3,060 | (2) | $ | — | $ | 838 | $ | 628 | $ | 10,211 | $ | 858 | ||||||||||
Natural Gas Distribution | 2,380 | 29 | 242 | 303 | 6,099 | 510 | |||||||||||||||||
Energy Services | 2,073 | 26 | 7 | 20 | 1,102 | 5 | |||||||||||||||||
Midstream Investments (3) | — | — | — | — | 2,505 | — | |||||||||||||||||
Other | 15 | — | 39 | 8 | 2,681 | (4) | 33 | ||||||||||||||||
Eliminations | — | (55 | ) | — | — | (769 | ) | — | |||||||||||||||
Consolidated | $ | 7,528 | $ | — | $ | 1,126 | $ | 959 | $ | 21,829 | 1,406 | ||||||||||||
Reconciling items | 8 | ||||||||||||||||||||||
Capital expenditures per Statements of Consolidated Cash Flows | $ | 1,414 | |||||||||||||||||||||
As of and for the year ended December 31, 2015: | |||||||||||||||||||||||
Electric Transmission & Distribution | $ | 2,845 | (2) | $ | — | $ | 705 | $ | 607 | $ | 10,028 | $ | 934 | ||||||||||
Natural Gas Distribution | 2,603 | 29 | 222 | 273 | 5,657 | 601 | |||||||||||||||||
Energy Services | 1,924 | 33 | 5 | 42 | 857 | 5 | |||||||||||||||||
Midstream Investments (3) | — | — | — | — | 2,594 | — | |||||||||||||||||
Other | 14 | — | 38 | 11 | 2,879 | (4) | 35 | ||||||||||||||||
Eliminations | — | (62 | ) | — | — | (725 | ) | — | |||||||||||||||
Consolidated | $ | 7,386 | $ | — | $ | 970 | $ | 933 | $ | 21,290 | 1,575 | ||||||||||||
Reconciling items | 9 | ||||||||||||||||||||||
Capital expenditures per Statements of Consolidated Cash Flows | $ | 1,584 | |||||||||||||||||||||
(1) | Amounts for 2015 have been restated to reflect the adoption of ASU 2015-03. |
(2) | Houston Electric’s transmission and distribution revenues from major customers are as follows: |
Year Ended December 31, 2017 | ||||||||||||
2017 | 2016 | 2015 | ||||||||||
(in millions) | ||||||||||||
Affiliates of NRG | $ | 713 | $ | 698 | $ | 741 | ||||||
Affiliates of Vistra Energy Corp. | 229 | 220 | 220 | |||||||||
124
(3) | Midstream Investments’ equity earnings (losses) are as follows: |
Year Ended December 31, 2017 | ||||||||||||
2017 | 2016 | 2015 (a) | ||||||||||
(in millions) | ||||||||||||
Enable | $ | 265 | $ | 208 | $ | (1,633 | ) | |||||
(a) | Includes impairment charges totaling $1,846 million composed of CenterPoint Energy’s impairment of its equity method investment in Enable of $1,225 million and CenterPoint Energy’s share, $621 million, of impairment charges Enable recorded for goodwill and long-lived assets for the year ended December 31, 2015. This impairment is offset by $213 million of earnings for the year ended December 31, 2015. |
(4) | Included in total assets of Other Operations as of December 31, 2017, 2016 and 2015, are pension and other postemployment related regulatory assets of $600 million, $759 million and $814 million, respectively. |
Year Ended December 31, | ||||||||||||
Revenues by Products and Services: | 2017 | 2016 | 2015 | |||||||||
(in millions) | ||||||||||||
Electric delivery | $ | 2,997 | $ | 3,060 | $ | 2,845 | ||||||
Retail gas sales | 3,634 | 3,329 | 3,725 | |||||||||
Wholesale gas sales | 2,811 | 977 | 657 | |||||||||
Gas transportation and processing | 29 | 23 | 26 | |||||||||
Energy products and services | 143 | 139 | 133 | |||||||||
Total | $ | 9,614 | $ | 7,528 | $ | 7,386 | ||||||
(19) Subsequent Events
On February 9, 2018, Enable declared a quarterly cash distribution of $0.318 per unit on all of its outstanding common units for the quarter ended December 31, 2017. Accordingly, CERC Corp. expects to receive a cash distribution of approximately $74 million from Enable in the first quarter of 2018 to be made with respect to CERC Corp.’s limited partner interest in Enable for the fourth quarter of 2017.
On February 9, 2018, Enable declared a quarterly cash distribution of $0.625 per Series A Preferred Unit for the quarter ended December 31, 2017. Accordingly, CenterPoint Energy expects to receive a cash distribution of approximately $9 million from Enable in the first quarter of 2018 to be made with respect to CenterPoint Energy’s investment in Series A Preferred Units of Enable for the fourth quarter of 2017.
Item 9. | Changes in and Disagreements with Accountants on Accounting and Financial Disclosure |
None.
Item 9A. | Controls and Procedures |
Disclosure Controls And Procedures
In accordance with Exchange Act Rules 13a-15 and 15d-15, we carried out an evaluation, under the supervision and with the participation of management, including our principal executive officer and principal financial officer, of the effectiveness of our disclosure controls and procedures as of the end of the period covered by this report. Based on that evaluation, our principal executive officer and principal financial officer concluded that our disclosure controls and procedures were effective as of December 31, 2017 to provide assurance that information required to be disclosed in our reports filed or submitted under the Exchange Act is recorded, processed, summarized and reported within the time periods specified in the Securities and Exchange Commission’s rules and forms and such information is accumulated and communicated to our management, including our principal executive officer and principal financial officer, as appropriate to allow timely decisions regarding disclosure.
There has been no change in our internal controls over financial reporting that occurred during the three months ended December 31, 2017 that has materially affected, or is reasonably likely to materially affect, our internal controls over financial reporting.
125
Management’s Annual Report on Internal Control over Financial Reporting
Our management is responsible for establishing and maintaining adequate internal control over financial reporting. Internal control over financial reporting is defined in Rule 13a-15(f) or 15d-15(f) promulgated under the Securities Exchange Act of 1934 as a process designed by, or under the supervision of, the company’s principal executive and principal financial officers and effected by the company’s board of directors, management and other personnel, to provide reasonable assurance regarding the reliability of financial reporting and the preparation of financial statements for external purposes in accordance with generally accepted accounting principles and includes those policies and procedures that:
• | Pertain to the maintenance of records that in reasonable detail accurately and fairly reflect the transactions and dispositions of the assets of the company; |
• | Provide reasonable assurance that transactions are recorded as necessary to permit preparation of financial statements in accordance with generally accepted accounting principles, and that receipts and expenditures of the company are being made only in accordance with authorizations of management and directors of the company; and |
• | Provide reasonable assurance regarding prevention or timely detection of unauthorized acquisition, use or disposition of the company’s assets that could have a material effect on the financial statements. |
Management has designed its internal control over financial reporting to provide reasonable assurance regarding the reliability of financial reporting and the preparation of financial statements in accordance with accounting principles generally accepted in the United States of America. Management’s assessment included review and testing of both the design effectiveness and operating effectiveness of controls over all relevant assertions related to all significant accounts and disclosures in the financial statements.
All internal control systems, no matter how well designed, have inherent limitations. Therefore, even those systems determined to be effective can provide only reasonable assurance with respect to financial statement preparation and presentation. Projections of any evaluation of effectiveness to future periods are subject to the risk that controls may become inadequate because of changes in conditions, or that the degree of compliance with the policies or procedures may deteriorate.
Under the supervision and with the participation of our management, including our principal executive officer and principal financial officer, we conducted an evaluation of the effectiveness of our internal control over financial reporting based on the framework in Internal Control — Integrated Framework (2013) issued by the Committee of Sponsoring Organizations of the Treadway Commission. Based on our evaluation under the framework in Internal Control — Integrated Framework (2013), our management has concluded that our internal control over financial reporting was effective as of December 31, 2017.
Deloitte & Touche LLP, the Company’s independent registered public accounting firm, has issued an attestation report on the effectiveness of our internal control over financial reporting as of December 31, 2017 which is set forth below.
126
REPORT OF INDEPENDENT REGISTERED PUBLIC ACCOUNTING FIRM
To the Board of Directors and Shareholders of
CenterPoint Energy, Inc.
Houston, Texas
Opinion on Internal Control over Financial Reporting
We have audited the internal control over financial reporting of CenterPoint Energy, Inc. and subsidiaries (the “Company”) as of December 31, 2017, based on criteria established in Internal Control - Integrated Framework (2013) issued by the Committee of Sponsoring Organizations of the Treadway Commission (COSO). In our opinion, the Company maintained, in all material respects, effective internal control over financial reporting as of December 31, 2017, based on criteria established in Internal Control - Integrated Framework (2013) issued by COSO.
We have also audited, in accordance with the standards of the Public Company Accounting Oversight Board (United States) (PCAOB), the consolidated financial statements as of and for the year ended December 31, 2017, of the Company and our report dated February 22, 2018, expressed an unqualified opinion on those financial statements.
Basis for Opinion
The Company’s management is responsible for maintaining effective internal control over financial reporting and for its assessment of the effectiveness of internal control over financial reporting, included in the accompanying Management’s Annual Report on Internal Control over Financial Reporting. Our responsibility is to express an opinion on the Company’s internal control over financial reporting based on our audit. We are a public accounting firm registered with the PCAOB and are required to be independent with respect to the Company in accordance with the U.S. federal securities laws and the applicable rules and regulations of the Securities and Exchange Commission and the PCAOB.
We conducted our audit in accordance with the standards of the PCAOB. Those standards require that we plan and perform the audit to obtain reasonable assurance about whether effective internal control over financial reporting was maintained in all material respects. Our audit included obtaining an understanding of internal control over financial reporting, assessing the risk that a material weakness exists, testing and evaluating the design and operating effectiveness of internal control based on the assessed risk, and performing such other procedures as we considered necessary in the circumstances. We believe that our audit provides a reasonable basis for our opinion.
Definition and Limitations of Internal Control over Financial Reporting
A company’s internal control over financial reporting is a process designed to provide reasonable assurance regarding the reliability of financial reporting and the preparation of financial statements for external purposes in accordance with generally accepted accounting principles. A company’s internal control over financial reporting includes those policies and procedures that (1) pertain to the maintenance of records that, in reasonable detail, accurately and fairly reflect the transactions and dispositions of the assets of the company; (2) provide reasonable assurance that transactions are recorded as necessary to permit preparation of financial statements in accordance with generally accepted accounting principles, and that receipts and expenditures of the company are being made only in accordance with authorizations of management and directors of the company; and (3) provide reasonable assurance regarding prevention or timely detection of unauthorized acquisition, use, or disposition of the company’s assets that could have a material effect on the financial statements.
Because of its inherent limitations, internal control over financial reporting may not prevent or detect misstatements. Also, projections of any evaluation of effectiveness to future periods are subject to the risk that controls may become inadequate because of changes in conditions, or that the degree of compliance with the policies or procedures may deteriorate.
/s/ DELOITTE & TOUCHE LLP
Houston, Texas
February 22, 2018
127
Item 9B. | Other Information |
Compensatory Arrangements of Certain Officers
Amendments to Forms of Award Agreements under Long-Term Incentive Plan
On February 21, 2018, the Compensation Committee of the Board of Directors of CenterPoint Energy approved new forms of award agreements under CenterPoint Energy’s LTIP for performance share awards and restricted stock unit awards.
Among other things, the newly approved forms of award agreements for officers and director employees provide that a “retirement eligible” (age 55 or greater with at least five years of service) participant, who meets the requirements for enhanced retirement as specified under the agreement will fully vest in the award, subject, in the case of performance share awards, to the achievement of the relevant performance metrics. The requirements for enhanced retirement include having a sum of age and years of employment equal to 65 or greater, providing at least six months’ written notice of retirement, providing a transition plan and retiring on or after the January 1 immediately following the grant (for restricted stock units) or the first anniversary of the beginning of the designated performance cycle (for performance share awards). In addition, for officers subject to Section 16 of the Exchange Act, eligibility for enhanced retirement is subject to approval by the Compensation Committee.
In connection with a change in control of CenterPoint Energy (as defined in the LTIP), the newly approved forms of award agreements provide for full vesting if (a) such awards are not assumed or continued, or substituted with a substantially equivalent award, by the surviving or successor entity, or (b) the award holder is terminated (other than due to death, disability, voluntary resignation or for cause) within two years after the date upon which such change in control occurred.
In addition, the newly approved forms of award agreements provide for vesting upon death or termination due to disability. The newly approved forms of award agreements also include restrictive covenants (confidentiality, non-solicitation and non-competition provisions) that provide for forfeiture of unpaid awards and return of paid awards upon violation.
The description of the forms of award agreements, as amended, is qualified in its entirety by reference to the full text of the forms of performance share award and restricted stock unit award agreements, which are included as Exhibits 10(q)(2), 10(q)(3), 10(q)(5) and 10(q)(7) hereto and incorporated by reference herein.
With respect to the newly approved form of award agreement for restricted stock unit awards (retention) only, such agreement has been updated solely for purposes of the change in control and restrictive covenant provisions described above. The description of the form of award agreement for restricted stock unit awards (retention), as amended, is qualified in its entirety by reference to the full text of the form of restricted stock unit award agreement (retention), which is included as Exhibit 10(q)(6) hereto and incorporated by reference herein.
PART III
Item 10. | Directors, Executive Officers and Corporate Governance |
The information called for by Item 10, to the extent not set forth in “Executive Officers” in Item 1, will be set forth in the definitive proxy statement relating to CenterPoint Energy’s 2018 annual meeting of shareholders pursuant to SEC Regulation 14A. Such definitive proxy statement relates to a meeting of shareholders involving the election of directors and the portions thereof called for by Item 10 are incorporated herein by reference pursuant to Instruction G to Form 10-K.
Item 11. | Executive Compensation |
The information called for by Item 11 will be set forth in the definitive proxy statement relating to CenterPoint Energy’s 2018 annual meeting of shareholders pursuant to SEC Regulation 14A. Such definitive proxy statement relates to a meeting of shareholders involving the election of directors and the portions thereof called for by Item 11 are incorporated herein by reference pursuant to Instruction G to Form 10-K.
128
Item 12. | Security Ownership of Certain Beneficial Owners and Management and Related Stockholder Matters |
The information called for by Item 12 will be set forth in the definitive proxy statement relating to CenterPoint Energy’s 2018 annual meeting of shareholders pursuant to SEC Regulation 14A. Such definitive proxy statement relates to a meeting of shareholders involving the election of directors and the portions thereof called for by Item 12 are incorporated herein by reference pursuant to Instruction G to Form 10-K.
Item 13. | Certain Relationships and Related Transactions, and Director Independence |
The information called for by Item 13 will be set forth in the definitive proxy statement relating to CenterPoint Energy’s 2018 annual meeting of shareholders pursuant to SEC Regulation 14A. Such definitive proxy statement relates to a meeting of shareholders involving the election of directors and the portions thereof called for by Item 13 are incorporated herein by reference pursuant to Instruction G to Form 10-K.
Item 14. | Principal Accounting Fees and Services |
The information called for by Item 14 will be set forth in the definitive proxy statement relating to CenterPoint Energy’s 2018 annual meeting of shareholders pursuant to SEC Regulation 14A. Such definitive proxy statement relates to a meeting of shareholders involving the election of directors and the portions thereof called for by Item 14 are incorporated herein by reference pursuant to Instruction G to Form 10-K.
PART IV
Item 15. | Exhibits and Financial Statement Schedules |
(a)(1) Financial Statements.
Report of Independent Registered Public Accounting Firm | |
Statements of Consolidated Income for the Three Years Ended December 31, 2017 | |
Statements of Consolidated Comprehensive Income for the Three Years Ended December 31, 2017 | |
Consolidated Balance Sheets as of December 31, 2017 and 2016 | |
Statements of Consolidated Cash Flows for the Three Years Ended December 31, 2017 | |
Statements of Consolidated Shareholders’ Equity for the Three Years Ended December 31, 2017 | |
Notes to Consolidated Financial Statements | |
The financial statements of Enable Midstream Partners, LP required pursuant to Rule 3-09 of Regulation S-X are included in this filing as Exhibit 99.1.
(a)(2) Financial Statement Schedules for the Three Years Ended December 31, 2017.
The following schedules are omitted because of the absence of the conditions under which they are required or because the required information is included in the financial statements:
I, II, III, IV and V.
(a)(3) Exhibits.
See Index of Exhibits beginning on page 130, which index also includes the management contracts or compensatory plans or arrangements required to be filed as exhibits to this Form 10-K by Item 601(b)(10)(iii) of Regulation S-K.
Item 16. Form 10-K Summary
None.
129
CENTERPOINT ENERGY, INC.
EXHIBITS TO THE ANNUAL REPORT ON FORM 10-K
For Fiscal Year Ended December 31, 2017
INDEX OF EXHIBITS
Exhibits included with this report are designated by a cross (†); all exhibits not so designated are incorporated herein by reference to a prior filing as indicated. Exhibits designated by an asterisk (*) are management contracts or compensatory plans or arrangements required to be filed as exhibits to this Form 10-K by Item 601(b)(10)(iii) of Regulation S-K. CenterPoint Energy has not filed the exhibits and schedules to Exhibit 2. CenterPoint Energy hereby agrees to furnish supplementally a copy of any schedule omitted from Exhibit 2 to the SEC upon request.
The agreements included as exhibits are included only to provide information to investors regarding their terms. The agreements listed below may contain representations, warranties and other provisions that were made, among other things, to provide the parties thereto with specified rights and obligations and to allocate risk among them, and such agreements should not be relied upon as constituting or providing any factual disclosures about us, any other persons, any state of affairs or other matters.
Exhibit Number | Description | Report or Registration Statement | SEC File or Registration Number | Exhibit Reference | ||||
2 | — | CenterPoint Energy’s Form 8-K dated July 21, 2004 | 1-31447 | 10.1 | ||||
3(a) | — | CenterPoint Energy’s Form 8-K dated July 24, 2008 | 1-31447 | 3.2 | ||||
3(b) | — | CenterPoint Energy’s Form 8-K dated February 21, 2017 | 1-31447 | 3.1 | ||||
3(c) | — | CenterPoint Energy’s Form 10-K for the year ended December 31, 2011 | 1-31447 | 3(c) | ||||
4(a) | — | CenterPoint Energy’s Registration Statement on Form S-4 | 333-69502 | 4.1 | ||||
4(b) | — | CenterPoint Energy’s Form 10-K for the year ended December 31, 2001 | 1-31447 | 4.3 | ||||
4(c)(1) | — | Mortgage and Deed of Trust, dated November 1, 1944 between Houston Lighting and Power Company (HL&P) and Chase Bank of Texas, National Association (formerly, South Texas Commercial National Bank of Houston), as Trustee, as amended and supplemented by 20 Supplemental Indentures thereto | HL&P’s Form S-7 filed on August 25, 1977 | 2-59748 | 2(b) | |||
4(c)(2) | — | Twenty-First through Fiftieth Supplemental Indentures to Exhibit 4(c)(1) | HL&P’s Form 10-K for the year ended December 31, 1989 | 1-3187 | 4(a)(2) | |||
4(c)(3) | — | Fifty-First Supplemental Indenture to Exhibit 4(c)(1) dated as of March 25, 1991 | HL&P’s Form 10-Q for the quarter ended June 30, 1991 | 1-3187 | 4(a) | |||
4(c)(4) | — | Fifty-Second through Fifty-Fifth Supplemental Indentures to Exhibit 4(c)(1) each dated as of March 1, 1992 | HL&P’s Form 10-Q for the quarter ended March 31, 1992 | 1-3187 | 4 | |||
4(c)(5) | — | Fifty-Sixth and Fifty-Seventh Supplemental Indentures to Exhibit 4(c)(1) each dated as of October 1, 1992 | HL&P’s Form 10-Q for the quarter ended September 30, 1992 | 1-3187 | 4 | |||
130
4(c)(6) | — | Fifty-Eighth and Fifty-Ninth Supplemental Indentures to Exhibit 4(c)(1) each dated as of March 1, 1993 | HL&P’s Form 10-Q for the quarter ended March 31, 1993 | 1-3187 | 4 | |||
4(c)(7) | — | Sixtieth Supplemental Indenture to Exhibit 4(c)(1) dated as of July 1, 1993 | HL&P’s Form 10-Q for the quarter ended June 30, 1993 | 1-3187 | 4 | |||
4(c)(8) | — | Sixty-First through Sixty-Third Supplemental Indentures to Exhibit 4(c)(1) each dated as of December 1, 1993 | HL&P’s Form 10-K for the year ended December 31, 1993 | 1-3187 | 4(a)(8) | |||
4(c)(9) | — | Sixty-Fourth and Sixty-Fifth Supplemental Indentures to Exhibit 4(c)(1) each dated as of July 1, 1995 | HL&P’s Form 10-K for the year ended December 31, 1995 | 1-3187 | 4(a)(9) | |||
4(d)(1) | — | Houston Electric’s Form 10-Q for the quarter ended September 30, 2002 | 1-3187 | 4(j)(1) | ||||
4(d)(2) | — | Houston Electric’s Form 10- Q for the quarter ended September 30, 2002 | 1-3187 | 4(j)(3) | ||||
4(d)(3) | — | Houston Electric’s Form 10-Q for the quarter ended September 30, 2002 | 1-3187 | 4(j)(4) | ||||
4(d)(4) | — | CenterPoint Energy’s Form 10-K for the year ended December 31, 2003 | 1-31447 | 4(e)(10) | ||||
4(d)(5) | — | CenterPoint Energy’s Form 10-K for the year ended December 31, 2002 | 1-31447 | 4(e)(10) | ||||
4(d)(6) | — | CenterPoint Energy’s Form 8-K dated March 13, 2003 | 1-31447 | 4.1 | ||||
4(d)(7) | — | CenterPoint Energy’s Form 8-K dated March 13, 2003 | 1-31447 | 4.2 | ||||
4(d)(8) | — | CenterPoint Energy’s Form 8-K dated May 16, 2003 | 1-31447 | 4.2 | ||||
4(d)(9) | — | CenterPoint Energy’s Form 8-K dated May 16, 2003 | 1-31447 | 4.1 | ||||
4(d)(10) | — | Houston Electric’s Form 8-K dated January 6, 2009 | 1-3187 | 4.2 | ||||
4(d)(11) | — | CenterPoint Energy’s Form 10-K for the year ended December 31, 2012 | 1-31447 | 4(e)(33) | ||||
4(d)(12) | — | CenterPoint Energy’s Form 10-K for the year ended December 31, 2012 | 1-31447 | 4(e)(34) | ||||
4(d)(13) | — | CenterPoint Energy’s Form 10-Q for the quarter ended March 31, 2014 | 1-31447 | 4.10 | ||||
4(d)(14) | — | CenterPoint Energy’s Form 10-Q for the quarter ended March 31, 2014 | 1-31447 | 4.11 | ||||
4(d)(15) | — | CenterPoint Energy’s Form 10-Q for the quarter ended June 30, 2016 | 1-31447 | 4.5 | ||||
131
4(d)(16) | — | CenterPoint Energy’s Form 10-Q for the quarter ended June 30, 2016 | 1-31447 | 4.6 | ||||
4(d)(17) | — | CenterPoint Energy’s Form 10-Q for the quarter ended September 30, 2016 | 1-31447 | 4.5 | ||||
4(d)(18) | — | CenterPoint Energy’s Form 10-Q for the quarter ended September 30, 2016 | 1-31447 | 4.6 | ||||
4(d)(19) | — | CenterPoint Energy’s Form 10-K for the year ended December 31, 2016 | 1-31447 | 4(e)(41) | ||||
4(d)(20) | — | CenterPoint Energy’s Form 10-K for the year ended December 31, 2016 | 1-31447 | 4(e)(42) | ||||
4(e)(1) | — | Indenture, dated as of February 1, 1998, between Reliant Energy Resources Corp. (RERC Corp.) and Chase Bank of Texas, National Association, as Trustee | CERC Corp.’s Form 8-K dated February 5, 1998 | 1-13265 | 4.1 | |||
4(e)(2) | — | CenterPoint Energy’s Form 10-K for the year ended December 31, 2006 | 1-31447 | 4(f)(11) | ||||
4(e)(3) | — | CenterPoint Energy’s Form 10-Q for the quarter ended June 30, 2008 | 1-31447 | 4.9 | ||||
4(e)(4) | — | CenterPoint Energy’s Form 10-K for the year ended December 31, 2010 | 1-31447 | 4(f)(15) | ||||
4(e)(5) | — | CenterPoint Energy’s Form 10-K for the year ended December 31, 2010 | 1-31447 | 4(f)(16) | ||||
4(e)(6) | — | CenterPoint Energy’s Form 10-Q for the quarter ended September 30, 2017 | 1-31447 | 4.11 | ||||
4(f)(1) | — | CenterPoint Energy’s Form 8-K dated May 19, 2003 | 1-31447 | 4.1 | ||||
4(f)(2) | — | CenterPoint Energy’s Form 10-Q for the quarter ended September 30, 2017 | 1-31447 | 4.9 | ||||
4(g)(1) | — | Subordinated Indenture dated as of September 1, 1999 | Reliant Energy’s Form 8-K dated September 1, 1999 | 1-3187 | 4.1 | |||
4(g)(2) | — | Supplemental Indenture No. 1 dated as of September 1, 1999, between Reliant Energy and Chase Bank of Texas (supplementing Exhibit 4(g)(1) and providing for the issuance Reliant Energy’s 2% Zero-Premium Exchangeable Subordinated Notes Due 2029) | Reliant Energy’s Form 8-K dated September 15, 1999 | 1-3187 | 4.2 | |||
132
4(g)(3) | — | CenterPoint Energy’s Form 8-K12B dated August 31, 2002 | 1-31447 | 4(e) | ||||
4(g)(4) | — | CenterPoint Energy’s Form 10-K for the year ended December 31, 2005 | 1-31447 | 4(h)(4) | ||||
4(h)(1) | — | CenterPoint Energy’s Form 8-K dated March 3, 2016 | 1-31447 | 4.1 | ||||
4(h)(2) | — | CenterPoint Energy’s Form 8-K dated June 16, 2017 | 1-31447 | 4.1 | ||||
4(i)(1) | — | CenterPoint Energy’s Form 8-K dated March 3, 2016 | 1-31447 | 4.2 | ||||
4(i)(2) | — | CenterPoint Energy’s Form 8-K dated June 16, 2017 | 1-31447 | 4.2 | ||||
4(j)(1) | — | CenterPoint Energy’s Form 8-K dated March 3, 2016 | 1-31447 | 4.3 | ||||
4(j)(2) | — | CenterPoint Energy’s Form 8-K dated June 16, 2017 | 1-31447 | 4.3 | ||||
Pursuant to Item 601(b)(4)(iii)(A) of Regulation S-K, CenterPoint Energy has not filed as exhibits to this Form 10-K certain long-term debt instruments, including indentures, under which the total amount of securities authorized does not exceed 10% of the total assets of CenterPoint Energy and its subsidiaries on a consolidated basis. CenterPoint Energy hereby agrees to furnish a copy of any such instrument to the SEC upon request.
Exhibit Number | Description | Report or Registration Statement | SEC File or Registration Number | Exhibit Reference | ||||
*10(a) | — | CenterPoint Energy’s Form 10-Q for the quarter ended March 31, 2011 | 1-31447 | 10.3 | ||||
*10(b)(1) | — | CenterPoint Energy’s Form 8-K dated December 22, 2008 | 1-31447 | 10.1 | ||||
*10(b)(2) | — | CenterPoint Energy’s Quarterly Report on Form 10-Q for the quarter ended March 31, 2011 | 1-31447 | 10.4 | ||||
*10(c) | — | CenterPoint Energy’s Form 10-Q for the quarter ended September 30, 2003 | 1-31447 | 10.1 | ||||
*10(d)(1) | — | CenterPoint Energy’s Form 8-K dated December 22, 2008 | 1-31447 | 10.4 | ||||
*10(d)(2) | — | CenterPoint Energy’s Quarterly Report on Form 10-Q for the quarter ended March 31, 2011 | 1-31447 | 10.5 | ||||
*10(e)(1) | — | CenterPoint Energy’s Form 8-K dated December 22, 2008 | 1-31447 | 10.3 | ||||
133
*10(e)(2) | — | CenterPoint Energy’s Quarterly Report on Form 10-Q for the quarter ended March 31, 2011 | 1-31447 | 10.6 | ||||
*10(f) | — | CenterPoint Energy’s Form 10-Q for the quarter ended September 30, 2003 | 1-31447 | 10.5 | ||||
10(g)(1) | — | Stockholder’s Agreement dated as of July 6, 1995 between Houston Industries Incorporated and Time Warner Inc. | Schedule 13-D dated July 6, 1995 | 5-19351 | 2 | |||
10(g)(2) | — | Amendment to Exhibit 10(g)(1) dated November 18, 1996 | HI’s Form 10-K for the year ended December 31, 1996 | 1-7629 | 10(x)(4) | |||
†10(h) | — | |||||||
10(i)(1) | — | Reliant Energy’s Form 10-Q for the quarter ended March 31, 2001 | 1-3187 | 10.1 | ||||
10(i)(2) | — | CenterPoint Energy’s Form 10-K for the year ended December 31, 2002 | 1-31447 | 10(bb)(5) | ||||
10(i)(3) | — | Reliant Energy’s Form 10-Q for the quarter ended March 31, 2001 | 1-3187 | 10.5 | ||||
10(i)(4) | — | Reliant Energy’s Form 10-Q for the quarter ended March 31, 2001 | 1-3187 | 10.6 | ||||
10(i)(5) | — | Reliant Energy’s Form 10-Q for the quarter ended March 31, 2001 | 1-3187 | 10.8 | ||||
10(j)(1) | — | CenterPoint Energy’s Form 10-K for the year ended December 31, 2002 | 1-31447 | 10(cc)(1) | ||||
10(j)(2) | — | CenterPoint Energy’s Form 10-K for the year ended December 31, 2002 | 1-31447 | 10(cc)(2) | ||||
10(j)(3) | — | CenterPoint Energy’s Form 10-K for the year ended December 31, 2002 | 1-31447 | 10(cc)(3) | ||||
*10(k)(1) | — | CenterPoint Energy’s Form 10-Q for the quarter ended June 30, 2003 | 1-31447 | 10.2 | ||||
*10(k)(2) | — | CenterPoint Energy’s Form 8-K dated February 20, 2008 | 1-31447 | 10.4 | ||||
*10(l)(1) | — | CenterPoint Energy’s Form 8-K dated February 20, 2008 | 1-31447 | 10.3 | ||||
*10(l)(2) | — | CenterPoint Energy’s Form 10-Q for the quarter ended September 30, 2008 | 1-31447 | 10.1 | ||||
*10(m)(1) | — | CenterPoint Energy’s Form 10-Q for the quarter ended September 30, 2003 | 1-31447 | 10.3 | ||||
*10(m)(3) | — | CenterPoint Energy’s Form 8-K dated December 10, 2009 | 1-31447 | 10.1 | ||||
*10(n)(1) | — | CenterPoint Energy’s Form 10-K for the year ended December 31, 2003 | 1-31447 | 10(ll) | ||||
*10(n)(2) | — | CenterPoint Energy’s Form 10-Q for the quarter ended March 31, 2010 | 1-31447 | 10.2 | ||||
*10(n)(3) | — | CenterPoint Energy’s Registration Statement on Form S-8 | 333-173660 | 4.6 | ||||
134
*10(n)(4) | — | CenterPoint Energy’s Form 10-K for the year ended December 31, 2014 | 1-31447 | 10(dd)(4) | ||||
10(o) | — | CenterPoint Energy’s Form 10-Q for the quarter ended June 30, 2005 | 1-31447 | 10.1 | ||||
10(p)(1) | — | CenterPoint Energy’s Form 10-Q for the quarter ended September 30, 2008 | 1-31447 | 10.2 | ||||
10(p)(2) | — | CenterPoint Energy’s Form 10-Q for the quarter ended September 30, 2008 | 1-31447 | 10.3 | ||||
*10(q)(1) | — | CenterPoint Energy’s Schedule 14A dated March 13, 2009 | 1-31447 | A | ||||
†*10(q)(2) | — | |||||||
†*10(q)(3) | — | |||||||
*10(q)(4) | — | CenterPoint Energy’s Form 8-K dated February 28, 2012 | 1-31447 | 10.2 | ||||
†*10(q)(5) | — | |||||||
†*10(q)(6) | — | |||||||
†*10(q)(7) | — | |||||||
†10(r) | — | |||||||
†10(s) | — | |||||||
10(t) | — | CenterPoint Energy’s Form 8-K dated April 27, 2017 | 1-31447 | 10.1 | ||||
10(u) | — | CenterPoint Energy’s Form 10-K for the year ended December 31, 2013 | 1-31447 | 10(zz) | ||||
10(v) | — | CenterPoint Energy’s Form 8-K dated March 14, 2013 | 1-31447 | 2.1 | ||||
10(w) | — | CenterPoint Energy’s Form 8-K dated November 14, 2017 | 1-31447 | 10.1 | ||||
10(x) | — | CenterPoint Energy’s Form 8-K dated June 22, 2016 | 1-31447 | 10.2 | ||||
10(y) | — | CenterPoint Energy’s Form 8-K dated May 1, 2013 | 1-31447 | 10.3 | ||||
10(z) | — | CenterPoint Energy’s Form 8-K dated May 1, 2013 | 1-31447 | 10.4 | ||||
10(aa) | — | CenterPoint Energy’s Form 8-K dated January 28, 2016 | 1-31447 | 10.1 | ||||
10(bb) | — | CenterPoint Energy’s Form 8-K dated February 18, 2016 | 1-31447 | 10.2 | ||||
†12 | — | |||||||
†21 | — | |||||||
135
†23.1 | — | |||||||
†23.2 | — | |||||||
†31.1 | — | |||||||
†31.2 | — | |||||||
†32.1 | — | |||||||
†32.2 | — | |||||||
99.1 | — | Financial Statements of Enable Midstream Partners, LP as of December 31, 2017 and 2016 and for the years ended December 31, 2017, 2016 and 2015 | Part II, Item 8 of Enable Midstream Partners, LP’s Form 10-K for the year ended December 31, 2017 | 001-36413 | Item 8 | |||
†101.INS | — | XBRL Instance Document | ||||||
†101.SCH | — | XBRL Taxonomy Extension Schema Document | ||||||
†101.CAL | — | XBRL Taxonomy Extension Calculation Linkbase Document | ||||||
†101.DEF | — | XBRL Taxonomy Extension Definition Linkbase Document | ||||||
†101.LAB | — | XBRL Taxonomy Extension Labels Linkbase Document | ||||||
†101.PRE | — | XBRL Taxonomy Extension Presentation Linkbase Document | ||||||
136
SIGNATURES
Pursuant to the requirements of Section 13 or 15(d) of the Securities Exchange Act of 1934, the registrant has duly caused this report to be signed on its behalf by the undersigned, thereunto duly authorized, in the City of Houston, the State of Texas, on the 22nd day of February, 2018.
CENTERPOINT ENERGY, INC. | |
(Registrant) | |
By: /s/ Scott M. Prochazka | |
Scott M. Prochazka | |
President and Chief Executive Officer | |
Pursuant to the requirements of the Securities Exchange Act of 1934, this report has been signed below by the following persons on behalf of the registrant and in the capacities indicated on February 22, 2018.
Signature | Title | |
/s/ SCOTT M. PROCHAZKA | President, Chief Executive Officer and | |
Scott M. Prochazka | Director (Principal Executive Officer and Director) | |
/s/ WILLIAM D. ROGERS | Executive Vice President and Chief | |
William D. Rogers | Financial Officer (Principal Financial Officer) | |
/s/ KRISTIE L. COLVIN | Senior Vice President and Chief | |
Kristie L. Colvin | Accounting Officer (Principal Accounting Officer) | |
/s/ MILTON CARROLL | Executive Chairman of the Board of Directors | |
Milton Carroll | ||
/s/ MICHAEL P. JOHNSON | Director | |
Michael P. Johnson | ||
/s/ JANIECE M. LONGORIA | Director | |
Janiece M. Longoria | ||
/s/ SCOTT J. MCLEAN | Director | |
Scott J. McLean | ||
/s/ THEODORE F. POUND | Director | |
Theodore F. Pound | ||
/s/ SUSAN O. RHENEY | Director | |
Susan O. Rheney | ||
/s/ PHILLIP R. SMITH | Director | |
Phillip R. Smith | ||
/s/ JOHN W. SOMERHALDER II | Director | |
John W. Somerhalder II | ||
/s/ PETER S. WAREING | Director | |
Peter S. Wareing | ||
137