Attached files
| file | filename |
|---|---|
| EX-32 - EXHIBIT 32 - DONALDSON CO INC | exhibit32dci2017731.htm |
| EX-31.B - EXHIBIT 31.B - DONALDSON CO INC | exhibit31-bdci2017731.htm |
| EX-31.A - EXHIBIT 31.A - DONALDSON CO INC | exhibit31-adci2017731.htm |
| EX-24 - EXHIBIT 24 - DONALDSON CO INC | exhibit24dci2017731.htm |
| EX-23 - EXHIBIT 23 - DONALDSON CO INC | exhibit23dci2017731.htm |
| EX-21 - EXHIBIT 21 - DONALDSON CO INC | exhibit21dci2017731.htm |
UNITED STATES
SECURITIES AND EXCHANGE COMMISSION
Washington, D.C. 20549
Form 10-K
☒ | Annual Report Pursuant to Section 13 or 15(d) of the Securities Exchange Act of 1934 for the fiscal year ended July 31, 2017 or |
☐ | Transition Report Pursuant to Section 13 or 15(d) of the Securities Exchange Act of 1934 for the transition period from __________ to __________ |
Commission File Number: 1-7891

DONALDSON COMPANY, INC.
(Exact name of registrant as specified in its charter)
Delaware | 41-0222640 |
(State or other jurisdiction of incorporation or organization) | (I.R.S. Employer Identification No.) |
1400 West 94th Street, Minneapolis, Minnesota | 55431 |
(Address of principal executive offices) | (Zip Code) |
Registrant’s telephone number, including area code: (952) 887-3131
Securities registered pursuant to Section 12(b) of the Act:
Title of each class | Name of each exchange on which registered | |
Common Stock, $5 Par Value | New York Stock Exchange | |
Securities registered pursuant to Section 12(g) of the Act: NONE
Indicate by check mark if the registrant is a well-known seasoned issuer, as defined in Rule 405 of the Securities Act. ☒ Yes ☐ No
Indicate by check mark if the registrant is not required to file reports pursuant to Section 13 or Section 15(d) of the Act. ☐ Yes ☒ No
Indicate by check mark whether the registrant (1) has filed all reports required to be filed by Section 13 or 15(d) of the Securities Exchange Act of 1934 during the preceding 12 months (or for such shorter period that the registrant was required to file such reports), and (2) has been subject to such filing requirements for the past 90 days. ☒ Yes ☐ No
Indicate by check mark whether the registrant has submitted electronically and posted on its corporate Website, if any, every Interactive Data File required to be submitted and posted pursuant to Rule 405 of Regulation S-T during the preceding 12 months (or for such shorter period that the registrant was required to submit and post such files). ☒ Yes ☐ No
Indicate by check mark if disclosure of delinquent filers pursuant to Item 405 of Regulation S-K is not contained herein, and will not be contained, to the best of registrant’s knowledge, in definitive proxy or information statements incorporated by reference in Part III of this Form 10-K or any amendment to this Form 10-K. ☐
Indicate by check mark whether the registrant is a large accelerated filer, an accelerated filer, a non-accelerated filer, a smaller reporting company or an emerging growth company. See the definitions of “large accelerated filer,” “accelerated filer,” “smaller reporting company” and "emerging growth company" in Rule 12b-2 of the Exchange Act. (Check one):
Large accelerated filer x | Accelerated filer o | |
Non-accelerated filer o (Do not check if a smaller reporting company) | Smaller reporting company o | |
Emerging growth company o | ||
If an emerging growth company, indicate by check mark if the registrant has elected not to use the extended transition period for complying with any new or revised financial accounting standards provided pursuant to Section 13(a) of the Exchange Act.o
Indicate by check mark whether the registrant is a shell company (as defined in Rule 12b-2 of the Act).☐ Yes ☒ No
As of January 31, 2017, the last business day of the registrant’s most recently completed second fiscal quarter, the aggregate market value of voting and non-voting common stock held by non-affiliates of the registrant was $5,521,028,309 (based on the closing price of $41.91 as reported on the New York Stock Exchange as of that date).
As of September 20, 2017, there were approximately 129,904,887 shares of the registrant’s common stock outstanding.
Documents Incorporated by Reference
Portions of the registrant’s Proxy Statement for its 2017 annual meeting of stockholders (the “2017 Proxy Statement”) are incorporated by reference in Part III, as specifically set forth in Part III.
DONALDSON COMPANY, INC.
ANNUAL REPORT ON FORM 10-K
TABLE OF CONTENTS
Page | ||
PART I
Item 1. Business
General
Donaldson Company, Inc. (Donaldson or the Company) was founded in 1915 and organized in its present corporate form under the laws of the State of Delaware in 1936.
The Company is a worldwide manufacturer of filtration systems and replacement parts. The Company’s core strengths are leading filtration technology, strong customer relationships and its global presence. Products are manufactured at 44 plants around the world and through three joint ventures.
The Company has two reporting segments: Engine Products and Industrial Products. Products in the Engine Products segment consist of replacement filters for both air and liquid filtration applications, air filtration systems, liquid filtration systems for fuel, lube and hydraulic applications, and exhaust and emissions systems. The Engine Products segment sells to original equipment manufacturers (OEMs) in the construction, mining, agriculture, aerospace, defense and truck end markets and to independent distributors, OEM dealer networks, private label accounts and large equipment fleets. Products in the Industrial Products segment consist of dust, fume and mist collectors, compressed air purification systems, air filtration systems for gas turbines, polytetrafluoroethylene (PTFE) membrane-based products and specialized air and gas filtration systems for applications including hard disk drives and semi-conductor manufacturing. The Industrial Products segment sells to various dealers, distributors, OEMs of gas-fired turbines and OEMs and end users requiring clean filtration solutions and replacement filters.
The discussion below should be read in conjunction with the risk factors discussed in Part I, Item 1A, “Risk Factors” in this Annual Report on Form 10-K (Annual Report).
The table below shows the percentage of total net sales contributed by the principal classes of similar products for each of the years ended July 31, 2017, 2016 and 2015:
Year Ended July 31, | |||||||||
2017 | 2016 | 2015 | |||||||
Engine Products segment | |||||||||
Off-Road | 11 | % | 10 | % | 11 | % | |||
On-Road | 5 | % | 6 | % | 6 | % | |||
Aftermarket | 46 | % | 43 | % | 41 | % | |||
Aerospace and Defense | 4 | % | 4 | % | 5 | % | |||
Industrial Products segment | |||||||||
Industrial Filtration Solutions | 22 | % | 23 | % | 22 | % | |||
Gas Turbine Systems | 5 | % | 7 | % | 8 | % | |||
Special Applications | 7 | % | 7 | % | 7 | % | |||
Total net sales contributed by the principal classes of similar products and financial information about segment operations and geographic regions appear in Note 18 in the Notes to Consolidated Financial Statements included in Item 8 of this Annual Report.
The Company makes its annual reports on Form 10-K, quarterly reports on Form 10-Q, current reports on Form 8-K, proxy statements and other information (including amendments to those reports) available free of charge through its website at ir.donaldson.com, as soon as reasonably practicable after it electronically files such material with (or furnishes such material to) the Securities and Exchange Commission. Also available on the Company’s website are corporate governance documents, including the Company’s Code of Business Conduct and Ethics, Corporate Governance Guidelines, Audit Committee charter, Human Resources Committee charter and Corporate Governance Committee charter. These documents are also available in print, free of charge, to any person who requests them in writing to the attention of Investor Relations, MS 102, Donaldson Company, Inc., 1400 West 94th Street, Bloomington, Minnesota 55431. The information contained on the Company’s website is not incorporated by reference into this Annual Report and should not be considered to be part of this report.
Seasonality
A number of the Company’s end markets are dependent on the construction, agricultural and power generation industries, which are generally stronger in the second half of the Company’s fiscal year. The first two quarters of the fiscal year also contain the traditional summer and winter holiday periods, which are typically characterized by more customer plant closures.
1
Competition
Principal methods of competition in both the Engine and Industrial Products segments are technology, innovation, price, geographic coverage, service and product performance. The Company competes in a number of highly competitive filtration markets in both segments. The Company believes it is a market leader within many of its product lines, specifically within its Off-Road and On-Road product lines for OEMs, and has a significant business in the aftermarket for replacement filters. The Engine Products segment’s principal competitors include several large global competitors and many regional competitors, especially in the Aftermarket business. The Industrial Products segment’s principal competitors vary from country to country and include several large regional and global competitors and a significant number of smaller competitors who compete in a specific geographical region or in a limited number of product applications.
Raw Materials
The principal raw materials that the Company uses are steel, filter media and petrochemical based products including plastics, rubber and adhesives. Purchased raw materials represent approximately 60% to 65% of the Company’s cost of goods sold. Steel, including fabricated parts, and filter media each represent approximately 20%. The remainder is primarily made up of petroleum-based products and other raw material components.
The cost the Company paid for steel during fiscal 2017 varied by grade, but in aggregate, increased during the fiscal year. The steel cost increase was related to import restrictions placed on foreign-made steel and on a post-election run-up in steel in U.S. markets and on upward price pressure in other geographies around the world. The Company’s cost of filter media also varies by type and increased slightly year-over-year. The Company operates ongoing continuous improvement efforts, which partially offset increases in both steel and filter media. The cost of petroleum-based products was relatively flat year-over-year. The Company anticipates some continuing pressure on commodity prices in fiscal 2018, as compared with fiscal 2017, specifically for steel and filter media. On an ongoing basis, the Company enters into selective supply arrangements with certain of its suppliers that allow the Company to reduce volatility in its costs. The Company strives to recover or offset all material cost increases through selective price increases to its customers and the Company’s cost reduction initiatives, which include material substitution, process improvement and product redesigns.
Patents and Trademarks
The Company owns various patents and trademarks, which it considers in the aggregate to constitute a valuable asset, including patents and trademarks for products sold under the Ultra-Web®, PowerCore® and Donaldson® trademarks.
Major Customers
The Company had no customers that accounted for over 10% of net sales in the years ended July 31, 2017, 2016 or 2015. The Company had no customers that accounted for over 10% of gross accounts receivable at July 31, 2017 or July 31, 2016.
Backlog
At August 31, 2017, the backlog of orders expected to be delivered within 90 days was $395.5 million. The 90-day backlog at August 31, 2016, was $323.0 million. The increase is due to the continued strong demand across multiple product lines. Backlog is one of many indicators of business conditions in the Company’s markets. However, it is not always indicative of future results for a number of reasons, including short lead times in the Company’s replacement parts businesses and the timing of orders in many of the Company’s engine OEM and industrial markets.
Research and Development
During the years ended July 31, 2017, 2016 and 2015, the Company spent $54.7 million, $55.5 million and $60.2 million, respectively, on research and development activities, which was 2.3%, 2.5% and 2.5% of net sales, respectively. Research and development expenses include basic scientific research and the application of scientific advances to the development of new and improved products and their uses. Substantially all commercial research and development is performed in-house.
Environmental Matters
The Company does not anticipate any material effect on its capital expenditures, earnings or competitive position during fiscal 2018 due to compliance with government regulations regulating the discharge of materials into the environment or otherwise relating to the protection of the environment.
Employees
The Company employed approximately 13,200 people in its worldwide operations as of July 31, 2017.
2
Geographic Areas
Both of the Company's segments serve customers in all geographic regions worldwide. The United States represents the largest current individual market for the Company's products. Germany is the single largest market outside the United States. Financial information by geographic areas appears in Note 18 in the Notes to Consolidated Financial Statements included in Item 8 of this Annual Report.
Item 1A. Risk Factors
There are inherent risks and uncertainties associated with our global operations that involve the manufacturing and sale of products for highly demanding customer applications throughout the world. These risks and uncertainties could adversely affect our operating performance and financial condition. The following discussion, along with discussions elsewhere in this report, outlines the risks and uncertainties that we believe are the most material to our business at this time. We undertake no obligation to publicly update or revise any forward-looking statements, whether as a result of new information, future events, or otherwise, unless required by law.
Economic Environment - the demand for our products relies on economic and industrial conditions worldwide.
Changes in economic or industrial conditions could impact our results or financial condition in any particular period as our business can be sensitive to varying conditions in all major geographies and markets.
Products - maintaining a competitive advantage requires continuing investment with uncertain returns.
We operate in highly competitive markets and have numerous competitors that may already be well-established in those markets. We expect our competitors to continue improving the design and performance of their products and to introduce new products that could be competitive in both price and performance. We believe that we have certain technological advantages over our competitors, but maintaining these advantages requires us to continually invest in research and development, sales and marketing and customer service and support. There is no guarantee that we will be successful in maintaining these advantages. We make investments in new technologies that address increased performance and regulatory requirements around the globe. There is no guarantee that we will be successful in completing development or achieving sales of these products or that the margins on such products will be acceptable. Our financial performance may be negatively impacted if a competitor’s successful product innovation reaches the market before ours or gains broader market acceptance. In addition, we may be adversely impacted by changes in technology that could reduce or eliminate the demand for our products. These risks include wider adoption of technologies providing alternatives to diesel engines.
Competition - we participate in highly competitive markets with pricing pressure.
The businesses and product lines in which we participate are very competitive and we risk losing business based on a wide range of factors, including price, technology, geographic coverage, product performance and customer service. Our customers continue to seek productivity gains and lower prices from us and their other suppliers. If we are not able to compete effectively, our margins and results of operations could be adversely affected.
Intellectual Property - demand for our products may be affected by new entrants that copy our products and/or infringe on our intellectual property.
The ability to protect and enforce intellectual property rights varies across jurisdictions. An inability to preserve our intellectual property rights may adversely affect our financial performance.
Competitors and others may also initiate litigation to challenge the validity of our intellectual property or allege that we infringe their intellectual property. We may be required to pay substantial damages if it is determined our products infringe on their intellectual property. We may also be required to develop an alternative, non-infringing product that could be costly and time-consuming, or acquire a license on terms that are not favorable to us.
Protecting or defending against such claims could significantly increase our costs, divert management’s time and attention away from other business matters and otherwise adversely affect our results of operations and financial condition.
Global Operations - operating globally carries risks that could negatively affect our financial performance.
We have sales and manufacturing operations throughout the world. Our stability, growth and profitability are subject to a number of risks of doing business globally that could harm our business, including:
• | political and military events, |
• | legal and regulatory requirements, including import, export, defense regulations, anti-corruption laws and foreign exchange controls, |
• | tariffs, trade barriers and other trade restrictions, |
• | potential difficulties in staffing and managing local operations, |
3
• | credit risk of local customers and distributors, |
• | difficulties in protecting our intellectual property, |
• | natural disasters, terrorism, war or other catastrophic events and |
• | local economic, political and social conditions, including in the Middle East, Ukraine, China, Thailand, South Korea and other emerging markets where we do business. |
Due to the international scope of our operations, we are subject to a complex system of import- and export-related laws and regulations. Any alleged or actual violations may subject us to government scrutiny, investigation and civil and criminal penalties, and may limit our ability to import or export our products or to provide services outside the United States (U.S.).
The enforcement of bribery, corruption and trade laws and regulations is increasing in frequency and complexity on a global basis. The continued geographic expansion of our business increases our exposure to, and cost of complying with, these laws and regulations. If our compliance programs do not adequately prevent or deter our employees, agents, distributors, suppliers and other third parties with whom we do business from violating anti-corruption laws, we may incur defense costs, fines, penalties, reputational damage and business disruptions.
Customer Concentration - a number of our customers operate in similar cyclical industries. Economic conditions in these industries could have a negative impact on our financial performance.
No customer accounted for ten percent or more of our net sales in fiscal 2017, 2016 or 2015. However, a number of our customers are concentrated in similar cyclical industries (construction, agriculture and mining), resulting in additional risk based on industrial conditions in those sectors. A decline in the economic conditions of these industries could result in reduced demand for our products and difficulty in collecting amounts due from our customers.
Supply Chain - unavailable or higher cost materials could impact our financial performance.
We obtain raw materials, including steel, filter media, petroleum-based products and other components, from third-party suppliers and tend to carry limited raw material inventories. An unanticipated delay in delivery by our suppliers could result in the inability to deliver on-time and meet the expectations of our customers. An increase in commodity prices could also result in lower operating margins.
Technology Investments and Security Risks - difficulties with our information technology systems and security could adversely affect our results.
We have many information technology systems that are important to the operation of our business, some of which are managed by third parties. These systems are used to process, transmit and store electronic information and to manage or support a variety of business processes and activities. We could encounter difficulties in developing new systems, maintaining and upgrading our existing systems and preventing information security breaches. Such difficulties could lead to significant additional expenses and/or disruption in business operations that could adversely affect our results.
Additionally, information technology security threats are increasing in frequency and sophistication. These threats pose a risk to the security of our systems and networks and the confidentiality, availability and integrity of our data. Should such an attack succeed, it could lead to the compromising of confidential information, manipulation and destruction of data, defective products, production downtimes and operations disruptions. The occurrence of any of these events could adversely affect our reputation and could result in litigation, regulatory action, potential liability and increased costs and operational consequences of implementing further data protection matters.
Currency - an unfavorable fluctuation in foreign currency exchange rates could adversely impact our results of operations.
We have operations in many countries, with more than one-half of our annual revenue coming from countries outside of the U.S. Each of our subsidiaries reports its results of operations and financial position in its relevant functional currency, which is then translated into U.S. dollars. This translated financial information is included in our consolidated financial statements. Strengthening of the U.S. dollar in comparison to the foreign currencies of our subsidiaries has a negative impact on our results and financial position. In addition, decreased value of local currency may make it difficult for some of our customers, distributors and end users to purchase our products.
Legal and Regulatory - costs associated with lawsuits, investigations or complying with laws and regulations may have an adverse effect on our results of operations.
We are subject to many laws and regulations in the jurisdictions in which we operate. We routinely incur costs in order to comply with these laws and regulations. We may be adversely impacted by new or changing laws and regulations that affect both our operations and our ability to develop and sell products that meet our customers’ requirements. We are involved in various product liability, product warranty, intellectual property, environmental claims and other legal proceedings that arise in and outside of the ordinary course of our business. We are subject to increasingly stringent environmental laws and regulations in the countries
4
in which we operate, including those governing emissions to air; discharges to water; and the generation, handling, storage, transportation, treatment and disposal of waste materials. It is not possible to predict the outcome of investigations and lawsuits, and we could incur judgments, fines, or penalties or enter into settlements of lawsuits and claims that could have an adverse effect on our business, results of operations and financial condition in any particular period. In addition, we may not be able to maintain our insurance at a reasonable cost or in sufficient amounts to protect us against any losses.
Income Tax - changes in our effective tax rate could adversely impact our net income.
We are subject to income taxes in various jurisdictions in which we operate. Our tax liabilities are dependent upon the location of earnings among these different jurisdictions. Our provision for income taxes and cash tax liability could be adversely affected by numerous factors, including income before taxes being lower than anticipated in countries with lower statutory tax rates and higher than anticipated in countries with higher statutory tax rates, changes in the valuation of deferred tax assets and liabilities and changes in tax laws and regulations. We are also subject to the continuous examination of our income tax returns by tax authorities. The results of audits and examinations of previously filed tax returns and continuing assessments of our tax exposures may have an adverse effect on our provision for income taxes and cash tax liability.
Personnel - our success may be affected if we are not able to attract, develop and retain qualified personnel.
Our success depends in large part on our ability to identify, recruit, develop and retain qualified personnel worldwide. If we are unable to meet this challenge, it may be difficult for us to execute our strategic objectives and grow our business, which could adversely affect our results of operations and financial condition.
Liquidity - changes in the capital and credit markets may negatively affect our ability to access financing.
Disruption of the global financial and credit markets may have an effect on our long-term liquidity and financial condition. During fiscal 2017, credit in the global credit markets was accessible and market interest rates remained low. We believe that our current financial resources, together with cash generated by operations, are sufficient to continue financing our operations for the next twelve months. There can be no assurance, however, that the cost or availability of future borrowings will not be impacted by future capital market disruptions. Some of our existing borrowings contain covenants to maintain certain financial ratios that, under certain circumstances, could restrict our ability to incur additional indebtedness, make investments and other restricted payments, create liens and sell assets. As of July 31, 2017, the Company was in compliance with all such covenants.
The majority of our cash and cash equivalents are held by our foreign subsidiaries as over half of our earnings occur outside the U.S. Most of these funds are considered permanently reinvested outside the U.S., as the cash generated from U.S. operations plus our debt facilities are anticipated to be sufficient for our U.S. operation’s cash needs. If additional cash is required for our operations in the U.S., it may be subject to additional U.S. taxes if funds are repatriated from certain foreign subsidiaries.
Acquisitions - the execution of our acquisition strategy may not provide the desired return on investment.
We have made and continue to pursue acquisitions, including our acquisitions of Industrias Partmo S.A. (Partmo) and Hy-Pro Corporation (Hy-Pro) in fiscal 2017, Engineered Products Company (EPC) in fiscal 2016 and Northern Technical L.L.C. (Northern Technical) and IFIL USA L.L.C. (IFIL USA) in fiscal 2015. These acquisitions could negatively impact our profitability due to operating and integration inefficiencies, the incurrence of debt, contingent liabilities and amortization expenses related to intangible assets. There are also a number of other risks involved in acquisitions, including the potential loss of key customers, difficulties in assimilating the acquired operations, the loss of key employees and the diversion of management’s time and attention away from other business matters.
Impairment - if our operating units do not meet performance expectations, assets could be subject to impairment.
Our total assets include goodwill from acquisitions. We test annually whether goodwill has been impaired, or more frequently if events or changes in circumstances indicate the goodwill may be impaired. If future operating performance at one or more of our operating units were to fall significantly below forecast levels or if market conditions for one or more of our acquired businesses were to decline, we could be required to incur a non-cash charge to operating income for impairment. Any impairment in the value of our goodwill would have an adverse non-cash impact on our results of operations and reduce our net worth.
Restructuring - if we do not successfully execute our restructuring plans and realize the expected benefits, our financial performance may be adversely affected.
From time to time we have initiated restructuring programs related to our business strategy to, among other things, reduce operating expenses and align manufacturing capacity to demand. We may not be able to realize the expected benefits and cost savings if we do not successfully execute these plans. If difficulties are encountered or such cost savings are otherwise not realized, it could adversely impact our results of operations.
5
Internal Controls - if we fail to maintain an effective system of internal control over financial reporting, we may not be able to accurately report our financial results and prevent material fraud, which could adversely affect the value of our common stock. Failure to maintain an effective system of internal control over financial reporting resulted in a material weakness during fiscal 2015.
Effective internal control over financial reporting is necessary for us to provide reliable financial reports and effectively prevent and detect material fraud. If we cannot provide reliable financial reports or prevent or detect material fraud, our operating results could be misstated. Failure to maintain an effective system of internal control over financial reporting resulted in a material weakness during fiscal 2015. Although we completed our remedial actions in response to this matter, there can be no assurances that we will be able to prevent future control deficiencies from occurring, which could cause us to incur unforeseen costs, negatively impact our results of operations, cause the market price of our common stock to decline or have other potential adverse consequences.
Item 1B. Unresolved Staff Comments
None.
6
Item 2. Properties
The Company’s principal administrative office and research facilities are located in Bloomington, Minnesota. The Company’s principal European administrative and engineering offices are located in Leuven, Belgium. The Company also has extensive operations in the Asia Pacific and Latin America regions.
The Company’s principal manufacturing and distribution activities are located throughout the world. The following is a summary of the principal plants and physical properties owned or leased by the Company as of July 31, 2017.
Americas | Europe/Africa/Middle East | |
Auburn, Alabama (E) | Kadan, Czech Republic (I) | |
Stockton, California (I)* | Klasterec, Czech Republic (E) | |
Valencia, California (E)* | Domjean, France (E) | |
Dixon, Illinois (E) | Paris, France (E)* | |
Anderson, Indiana (E)* | Dulmen, Germany (E) | |
Frankfort, Indiana (E) | Haan, Germany (I) | |
Cresco, Iowa (E) | Ostiglia, Italy (E) | |
Waterloo, Iowa (E) | Skarbimierz, Poland (E) | |
Nicholasville, Kentucky (I) | Cape Town, South Africa (E) | |
Bloomington, Minnesota (I) | Johannesburg, South Africa (I)* | |
Chesterfield, Missouri (E)* | Abu Dhabi, United Arab Emirates (I) | |
Chillicothe, Missouri (E) | Hull, United Kingdom (E) | |
Harrisonville, Missouri (I) | Leicester, United Kingdom (I) | |
Philadelphia, Pennsylvania (I) | Asia/Pacific | |
Greeneville, Tennessee (E) | Wyong, Australia (E) | |
Baldwin, Wisconsin (I) | Wuxi, China | |
Stevens Point, Wisconsin (E) | New Delhi, India (E) | |
Sao Paulo, Brazil (E)* | Gunma, Japan (E) | |
Brockville, Canada (E)* | Rayong, Thailand (I) | |
Bucaramanga, Columbia (E) | Third-Party Logistics Providers | |
Aguascalientes, Mexico (E) | Santiago, Chile | |
Monterrey, Mexico (I) | Wuxi, China | |
Distribution Centers | Bogotá, Colombia | |
Wyong, Australia | Cartagena, Colombia | |
Brugge, Belgium | Chennai, India (E) | |
Sao Paulo, Brazil* | Mumbai, India | |
Rensselaer, Indiana | Gunma, Japan | |
Jakarta, Indonesia | Auckland, New Zealand | |
Aguascalientes, Mexico | Lima, Peru | |
Lozorno, Slovakia | Singapore | |
Johannesburg, South Africa | Greeneville, Tennessee (I) | |
Seoul, South Korea* | Laredo, Texas | |
Joint Venture Facilities | ||
Most, Czech Republic (E) | ||
Champaign, Illinois (E) | ||
Jakarta, Indonesia (E) | ||
Dammam, Saudi Arabia (I) | ||
The Company’s properties are utilized for both the Engine and Industrial Products segments except as indicated with an (E) for Engine or (I) for Industrial. The Company leases certain of its facilities, primarily under long-term leases. The facilities denoted with an asterisk (*) are leased facilities. In Wuxi, China, and Bloomington, Minnesota, a portion of the activities are conducted
7
in leased facilities. The Company uses third-party logistics providers for some of its product distribution and neither leases nor owns the related facilities. The Company considers its properties to be suitable for their present purposes, well-maintained and in good operating condition.
Item 3. Legal Proceedings
The Company believes the recorded estimated liability in its Consolidated Financial Statements for claims or litigation is adequate in light of the probable and estimable outcomes. Any recorded liabilities were not material to the Company’s financial position, results of operations or liquidity and the Company believes it is remote that the settlement of any of the currently identified claims or litigation will be materially in excess of what is accrued. The Company records provisions when it is probable that a liability has been incurred and the amount of the loss can be reasonably estimated. Claims and litigation are reviewed quarterly and provisions are taken or adjusted to reflect the status of a particular matter.
Item 4. Mine Safety Disclosures
Not applicable.
Executive Officers of the Registrant
Current information as of August 31, 2017, regarding executive officers is presented below. All officers hold office until their successors are elected and qualify, or their earlier death, resignation or removal. There are no arrangements or understandings between individual officers and any other person pursuant to which the officer was selected as an executive officer.
Name | Age | Positions and Offices Held | First Year Appointed as an Executive Officer | |||
Amy C. Becker | 52 | Vice President, General Counsel and Secretary | 2014 | |||
Tod E. Carpenter | 58 | President and Chief Executive Officer | 2008 | |||
Sheila G. Kramer | 58 | Vice President, Human Resources | 2015 | |||
Scott J. Robinson | 50 | Vice President and Chief Financial Officer | 2015 | |||
Thomas R. Scalf | 51 | Senior Vice President, Engine Products | 2014 | |||
Jeffrey E. Spethmann | 52 | Senior Vice President, Industrial Products | 2016 | |||
Wim Vermeersch | 51 | Vice President, Europe, Middle East and Africa | 2012 | |||
Ms. Becker joined the Company in 1998 as Senior Counsel and Assistant Corporate Secretary and was appointed to Vice President, General Counsel and Secretary in August 2014. Prior to joining the Company, Ms. Becker was an attorney for Dorsey and Whitney, LLP from 1991 to 1995 and was a Project Manager and Corporate Counsel for Harmon, Ltd. from 1995 to 1998.
Mr. Carpenter joined the Company in 1996 and has held various positions, including Gas Turbine Systems General Manager from 2002 to 2004; General Manager, Industrial Filtration Systems Sales from 2004 to 2006; General Manager, Industrial Filtration Systems Americas in 2006; Vice President, Global Industrial Filtration Systems from 2006 to 2008; Vice President, Europe and Middle East from 2008 to 2011; and Senior Vice President, Engine Products from 2011 to 2014. In April 2014, Mr. Carpenter was appointed Chief Operating Officer. On April 1, 2015, Mr. Carpenter was appointed President and Chief Executive Officer.
Ms. Kramer was appointed Vice President, Human Resources in October 2015. Prior to joining the Company, Ms. Kramer was Vice President, Human Resources for Taylor Corporation, a print and graphics media company, from 2013 until September 2015. From 1991 to 2013, Ms. Kramer was with Lifetouch, Inc., a photography company, where she held various human resources roles including Corporate Vice President, Human Resources from 2009 to 2013.
Mr. Robinson joined the Company and was appointed Vice President and Chief Financial Officer in December 2015. Prior to joining the Company, Mr. Robinson was the Chief Financial Officer for Imation Corp., a global scalable storage and data security company, a position he held since August 2014. During his 11 years with Imation, he also served as the Investor Relations Officer, Corporate Controller and Chief Accounting Officer. Prior to that, he held positions at Deluxe Corporation and PricewaterhouseCoopers LLP.
Mr. Scalf joined the Company in 1989 and has held various positions, including Director of Global Operations from 2003 to 2006; General Manager of Exhaust & Emissions from 2006 to 2008; General Manager of Industrial Filtration Solutions from 2008 to 2012; and Vice President of Global Industrial Air Filtration from 2012 to 2014. Mr. Scalf was appointed Senior Vice President, Engine Products in April 2014.
Mr. Spethmann joined the Company in 2013 and has held various positions, including Vice President of the Exhaust & Emissions business unit from 2013 to 2014 and Vice President, Global Industrial Air Filtration from 2014 to 2016. Mr. Spethmann was appointed Senior Vice President of Industrial Products in April 2016. Prior to joining the Company, from 1999 to 2012, Mr.
8
Spethmann held positions of General Manager and President of Blow Molded Specialties, Inc., a manufacturing company focused on the extrusion of blow molded parts and assemblies.
Mr. Vermeersch joined the Company in 1992 and has held various positions, including Director, Gas Turbine Systems, Asia Pacific from 2000 to 2005; Manager, Aftermarket and Service Industrial Filtration Solutions, Belgium from 2005 to 2006; Manager, Industrial Filtration Solutions, Belgium from 2006 to 2007; Director, Gas Turbine Systems, Europe, Middle East and North Africa from 2007 to 2010; and Director, Engine, Europe, Middle East and North Africa from 2010 to 2011. Mr. Vermeersch was appointed Vice President, Europe, Middle East and Africa in January 2012.
PART II
Item 5. Market for Registrant’s Common Equity, Related Stockholder Matters and Issuer Purchases of Equity Securities
The Company's common stock, par value $5.00 per share, is traded on the New York Stock Exchange under the symbol "DCI." To determine the appropriate level of dividend payouts, the Company considers recent and projected performance across key financial metrics, including earnings, cash flow from operations and total debt. As of September 20, 2017, there were 1,521 registered shareholders of common stock.
The high and low prices for the Company’s common stock for each quarterly period during the years ended July 31, 2017 and 2016 were as follows:
Year Ended July 31, | First Quarter | Second Quarter | Third Quarter | Fourth Quarter | ||||
2017 | $38.65 - 35.52 | $46.29 - 35.85 | $47.68 - 41.46 | $48.91 - 44.66 | ||||
2016 | $34.38 - 26.36 | $31.88 - 25.21 | $33.57 - 27.33 | $37.08 - 31.52 | ||||
The quarterly dividends declared for the years ended July 31, 2017 and 2016 were as follows:
Year Ended July 31, | First Quarter | Second Quarter | Third Quarter | Fourth Quarter | ||||||||||||
2017 | $ | 0.175 | $ | 0.175 | $ | 0.175 | $ | 0.180 | ||||||||
2016 | $ | 0.170 | $ | 0.170 | $ | 0.175 | $ | 0.175 | ||||||||
The following table summarizes information in connection with purchases made by, or on behalf of, the Company or any affiliated purchaser of the Company, of shares of the Company’s common stock during the three months ended July 31, 2017.
Period | Total Number of Shares Purchased (1) | Average Price Paid per Share | Total Number of Shares Purchased as Part of Publicly Announced Plans or Programs | Maximum Number of Shares that May Yet Be Purchased Under the Plans or Programs | |||||||||
May 1 - May 31, 2017 | — | $ | — | — | 7,823,842 | ||||||||
June 1 - June 30, 2017 | 653,738 | $ | 46.02 | 650,000 | 7,173,842 | ||||||||
July 1 - July 31, 2017 | — | $ | — | — | 7,173,842 | ||||||||
Total | 653,738 | $ | 46.02 | 650,000 | 7,173,842 | ||||||||
(1) | On May 29, 2015, the Board of Directors authorized the repurchase of up to 14.0 million shares of the Company's common stock. This repurchase authorization is effective until terminated by the Board of Directors. There were no repurchases of common stock made outside of the Company's current repurchase authorization during the three months ended July 31, 2017. However, the "Total Number of Shares Purchased" column of the table above includes 3,738 shares of previously owned shares tendered by option holders in payment of the exercise price of options during the quarter. While not considered repurchases of shares, the Company does at times withhold shares that would otherwise be issued under equity-based awards to cover the withholding of taxes due as a result of exercising stock options or payment of equity-based awards. |
The table set forth in Part III, Item 12, “Security Ownership of Certain Beneficial Owners and Management and Related Stockholder Matters” of this Annual Report is also incorporated herein by reference.
9
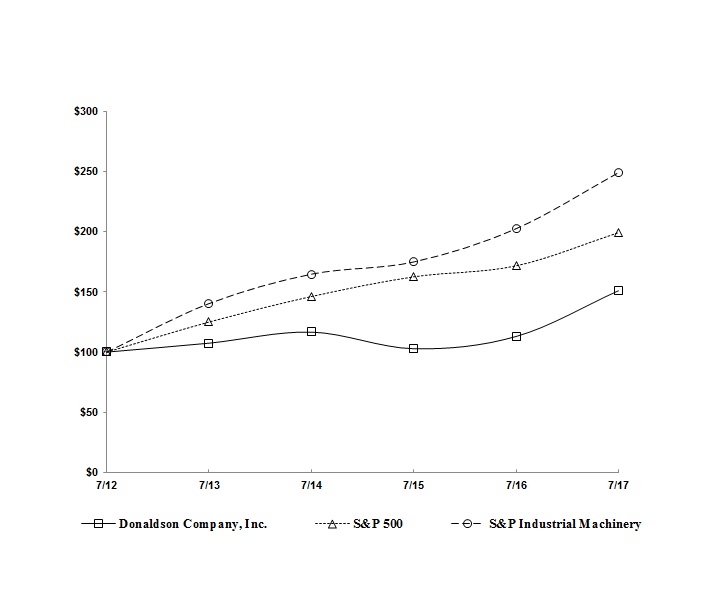
The graph below compares the cumulative total shareholder return on the Company’s common stock for the last five fiscal years with the cumulative total return of the Standard & Poor’s 500 Stock Index and the Standard & Poor’s Industrial Machinery Index. The graph and table assume the investment of $100 in each of the Company’s common stock and the specified indexes at the beginning of the applicable period and assume the reinvestment of all dividends.
COMPARISON OF 5 YEAR CUMULATIVE TOTAL RETURN
Among Donaldson Company, Inc., the S&P 500 Index and the S&P Industrial Machinery Index
Year Ended July 31, | ||||||||||||||||||||||||
2012 | 2013 | 2014 | 2015 | 2016 | 2017 | |||||||||||||||||||
Donaldson Company, Inc. | $ | 100.00 | $ | 107.44 | $ | 116.61 | $ | 102.80 | $ | 112.95 | $ | 150.97 | ||||||||||||
S&P 500 | 100.00 | 125.00 | 146.17 | 162.55 | 171.68 | 199.22 | ||||||||||||||||||
S&P Industrial Machinery | 100.00 | 140.30 | 164.71 | 174.88 | 202.52 | 249.04 | ||||||||||||||||||
10
Item 6. Selected Financial Data
The following table summarizes selected financial data for each of the fiscal years in the five-year period ended July 31, 2017 (in millions, except per share data):
Year Ended July 31, | ||||||||||||||||||||
2017 | 2016 | 2015 | 2014 | 2013 | ||||||||||||||||
Net sales | $ | 2,371.9 | $ | 2,220.3 | $ | 2,371.2 | $ | 2,473.5 | $ | 2,436.9 | ||||||||||
Net earnings | 232.8 | 190.8 | 208.1 | 260.2 | 247.4 | |||||||||||||||
Basic earnings per share | 1.76 | 1.43 | 1.51 | 1.79 | 1.67 | |||||||||||||||
Diluted earnings per share | 1.74 | 1.42 | 1.49 | 1.76 | 1.64 | |||||||||||||||
Total assets | 1,979.7 | 1,787.0 | 1,807.5 | 1,941.3 | 1,742.9 | |||||||||||||||
Long-term debt (1) | 537.3 | 350.2 | 387.2 | 242.6 | 102.1 | |||||||||||||||
Cash dividends declared per share | 0.705 | 0.690 | 0.670 | 0.610 | 0.450 | |||||||||||||||
Cash dividends paid per share | 0.700 | 0.685 | 0.665 | 0.575 | 0.410 | |||||||||||||||
(1) | Effective fiscal 2017 the Company adopted Accounting Standards Update (ASU) 2015-03, which changes the presentation of debt issuance costs. Prior periods have been adjusted for this new accounting standard. |
Item 7. Management’s Discussion and Analysis of Financial Condition and Results of Operations
The following Management’s Discussion and Analysis of Financial Condition and Results of Operations (MD&A) is intended to help the reader understand the Company's results of operations and financial condition for the three years ended July 31, 2017. The MD&A should be read in conjunction with the Company's Consolidated Financial Statements and Notes included in Item 8 of this Annual Report. This discussion contains forward-looking statements that involve risks and uncertainties. The Company’s actual results could differ materially from those anticipated in these forward-looking statements as a result of various factors, including those discussed elsewhere in this Annual Report, particularly Item 1A, "Risk Factors" and in the Safe Harbor Statement under the Securities Reform Act of 1995 below.
Throughout this MD&A, the Company refers to measures used by management to evaluate performance, including a number of financial measures that are not defined under accounting principles generally accepted in the United States of America (GAAP). Excluding foreign currency translation from net sales and net earnings are not measures of financial performance under GAAP; however, the Company believes they are useful in understanding its financial results and provide comparable measures for understanding the operating results of the Company between different fiscal periods. Reconciliations within this MD&A provide more details on the use and derivation of these measures.
Overview
Donaldson is a worldwide manufacturer of filtration systems and replacement parts. The Company’s core strengths are leading filtration technology, strong customer relationships and its global presence. The Company operates through two reporting segments, Engine Products and Industrial Products, and offers replacement parts and systems for a variety of product lines including air filtration and purification, liquid filtration for hydraulics, fuel and lube applications, and exhaust and emission. As a worldwide business, the Company’s results of operations are affected by conditions in the global economic environment. Under most economic conditions, the Company’s market diversification between its OEM and replacement parts customers, its diesel engine and industrial end markets and its global end markets has helped to limit the impact of weakness in any one product line, market or geography on the consolidated operating results of the Company.
Net sales for the year ended July 31, 2017 were $2,371.9 million, as compared with $2,220.3 million for the year ended July 31, 2016, an increase of $151.6 million, or 6.8%. Net sales were negatively impacted by foreign currency translation, which decreased sales by $8.2 million. On a constant currency basis, net sales for the year ended July 31, 2017 increased 7.2% from the prior fiscal year.
Net earnings for the year ended July 31, 2017 were $232.8 million, as compared with $190.8 million for the year ended July 31, 2016, an increase of $42.0 million, or 22.0%. Diluted earnings per share were $1.74 for the year ended July 31, 2017, as compared with $1.42 for the year ended July 31, 2016, an increase of 22.5%.
11
Consolidated Results of Operations
The following table summarizes consolidated results of operations for each of the three fiscal years ended July 31, 2017, 2016 and 2015 (in millions, except per share data):
Year Ended July 31, | Percent of Net Sales | ||||||||||||||||||||
2017 | 2016 | 2015 | 2017 | 2016 | 2015 | ||||||||||||||||
Net sales | $ | 2,371.9 | $ | 2,220.3 | $ | 2,371.2 | 100.0 | % | 100.0 | % | 100.0 | % | |||||||||
Cost of sales | 1,548.8 | 1,465.5 | 1,562.6 | 65.3 | % | 66.0 | % | 65.9 | % | ||||||||||||
Gross profit | 823.1 | 754.8 | 808.6 | 34.7 | % | 34.0 | % | 34.1 | % | ||||||||||||
Selling, general and administrative | 439.8 | 425.1 | 460.1 | 18.5 | % | 19.1 | % | 19.4 | % | ||||||||||||
Research and development | 54.7 | 55.5 | 60.2 | 2.3 | % | 2.5 | % | 2.5 | % | ||||||||||||
Operating income | 328.6 | 274.2 | 288.3 | 13.9 | % | 12.3 | % | 12.2 | % | ||||||||||||
Other income, net | (12.9 | ) | (3.9 | ) | (15.5 | ) | (0.5 | )% | (0.2 | )% | (0.7 | )% | |||||||||
Interest expense | 19.5 | 20.7 | 15.2 | 0.8 | % | 0.9 | % | 0.6 | % | ||||||||||||
Earnings before income taxes | 322.0 | 257.4 | 288.6 | 13.6 | % | 11.6 | % | 12.2 | % | ||||||||||||
Income taxes | 89.2 | 66.6 | 80.5 | 3.8 | % | 3.0 | % | 3.4 | % | ||||||||||||
Net earnings | $ | 232.8 | $ | 190.8 | $ | 208.1 | 9.8 | % | 8.6 | % | 8.8 | % | |||||||||
Net earnings per share – diluted | $ | 1.74 | $ | 1.42 | $ | 1.49 | |||||||||||||||
Net Sales
Consolidated net sales for the years ended July 31, 2017, 2016 and 2015 were $2,371.9 million, $2,220.3 million and $2,371.2 million, respectively. Net sales by operating segment are as follows (in millions):
Year Ended July 31, | Percent of Net Sales | ||||||||||||||||||||
2017 | 2016 | 2015 | 2017 | 2016 | 2015 | ||||||||||||||||
Engine Products | $ | 1,553.3 | $ | 1,391.3 | $ | 1,484.1 | 65.5 | % | 62.7 | % | 62.6 | % | |||||||||
Industrial Products | 818.6 | 829.0 | 887.1 | 34.5 | % | 37.3 | % | 37.4 | % | ||||||||||||
Net sales | $ | 2,371.9 | $ | 2,220.3 | $ | 2,371.2 | 100.0 | % | 100.0 | % | 100.0 | % | |||||||||
Consolidated net sales by geographic region for the years ended July 31, 2017, 2016 and 2015 are as follows (in millions):
Year Ended July 31, | Percent of Net Sales | ||||||||||||||||||||
2017 | 2016 | 2015 | 2017 | 2016 | 2015 | ||||||||||||||||
United States | $ | 990.1 | $ | 937.3 | $ | 1,007.3 | 41.7 | % | 42.2 | % | 42.5 | % | |||||||||
Europe | 638.1 | 632.7 | 671.3 | 26.9 | % | 28.5 | % | 28.3 | % | ||||||||||||
Asia Pacific | 500.5 | 449.9 | 470.7 | 21.1 | % | 20.3 | % | 19.9 | % | ||||||||||||
Other | 243.2 | 200.4 | 221.9 | 10.3 | % | 9.0 | % | 9.3 | % | ||||||||||||
Total | $ | 2,371.9 | $ | 2,220.3 | $ | 2,371.2 | 100.0 | % | 100.0 | % | 100.0 | % | |||||||||
12
Although net sales excluding foreign currency translation is not a measure of financial performance under GAAP, the Company believes that it is useful in understanding its financial results and provides comparable measures for understanding the operating results of the Company between different fiscal periods. The following is a reconciliation to the most comparable GAAP financial measure of this non-GAAP financial measure for the years ended July 31, 2017, 2016 and 2015 (in millions):
Year Ended July 31, | ||||||||||||
2017 | 2016 | 2015 | ||||||||||
Prior year net sales | $ | 2,220.3 | $ | 2,371.2 | $ | 2,473.5 | ||||||
Change in net sales excluding translation | 159.8 | (76.7 | ) | 32.5 | ||||||||
Impact of foreign currency translation (1) | (8.2 | ) | (74.2 | ) | (134.8 | ) | ||||||
Current year net sales | $ | 2,371.9 | $ | 2,220.3 | $ | 2,371.2 | ||||||
(1) | The impact of foreign currency translation is calculated by translating current period foreign currency revenue into U.S. dollars using the average foreign currency exchange rates for the prior fiscal year period rather than actual current period foreign currency exchange rates. |
The fiscal 2017 sales increase of $151.6 million from fiscal 2016 was primarily driven by increases in the Aftermarket and Off-Road business units within the Engine Products segment, partially offset by declining sales of Gas Turbine Systems products and On-Road. Fiscal 2017 sales increased $162.0 million in the Engine Products segment and decreased $10.4 million in the Industrial Products segment. Foreign currency exchange rate fluctuations increased sales of Engine Products by $0.6 million and decreased Industrial Products sales by $8.8 million. Fiscal 2017 sales cadence reflected typical seasonality, with a larger percent of full-year revenue realized during the second half of the fiscal year. The Company continues to face a mixed operating environment, with engine-related end markets, including global agriculture, mining and construction, exhibiting signs of stability and recovery, whereas Industrial markets remain somewhat uncertain.
Backlog
At August 31, 2017, the backlog of orders expected to be delivered within 90 days was $395.5 million. The 90-day backlog at August 31, 2016, was $323.0 million. The backlog of orders expected to be delivered within 90 days increased 25.7% for the Engine Products segment and increased 5.7% for the Industrial Products segment. The increase is due to the continued strong demand across multiple product lines. Backlog is one of many indicators of business conditions in the Company’s markets. However, it is not always indicative of future results for a number of reasons, including short lead times in the Company’s replacement parts businesses and the timing of the receipt of orders in many of the Company’s engine OEM and industrial markets.
Cost of Sales
The principal raw materials that the Company uses are steel, filter media and petrochemical based products including plastics, rubber and adhesives. Purchased raw materials represent approximately 60% to 65% of the Company’s cost of goods sold. Steel, including fabricated parts, and filter media each represent approximately 20%. The remainder is primarily made up of petroleum-based products and other raw material components.
The cost the Company paid for steel during fiscal 2017 varied by grade, but in aggregate, increased during the fiscal year. The steel cost increase was related to import restrictions placed on foreign-made steel and on a post-election run-up in steel in U.S. markets and on upward price pressure in other geographies around the world. The Company’s cost of filter media also varies by type and increased slightly year-over-year. The Company operates ongoing continuous improvement efforts, which partially offset increases in both steel and media. The cost of petroleum-based products was relatively flat year-over-year. The Company anticipates some continuing pressure on commodity prices in fiscal 2018, as compared with fiscal 2017, specifically for steel and filter media. On an ongoing basis, the Company enters into selective supply arrangements with certain of its suppliers that allow the Company to reduce volatility in its costs. The Company strives to recover or offset all material cost increases through selective price increases to its customers and the Company’s cost reduction initiatives, which include material substitution, process improvement and product redesigns.
Gross Margin
Gross margin for the year ended July 31, 2017 was 34.7%, or a 0.7 percentage point increase from 34.0% for the year ended July 31, 2016. The fiscal 2017 rate does not include restructuring charges, which negatively affected the prior year rate by approximately 0.3 percentage points. Additionally, the fiscal 2017 rate benefited from greater absorption of fixed costs on the year-over-year sales increase, partially offset by higher variable costs, including raw materials as well as freight charges, related to meeting higher-than-expected customer demand.
Gross margin for the year ended July 31, 2016 was 34.0%, or a 0.1 percentage point decrease from 34.1% for the year ended July 31, 2015. The fiscal 2016 and fiscal 2015 gross margin rates each included a negative impact from restructuring charges,
13
which reduced gross margin in those fiscal years by approximately 0.3 percentage points and 0.4 percentage points, respectively. Compared with fiscal 2015, the fiscal 2016 gross margin reflects benefits from the Company’s cost-savings initiatives, including restructuring, that were offset by lower fixed cost absorption due to a decrease in sales in fiscal 2016 compared to fiscal 2015.
Operating Expenses
Operating expenses for the year ended July 31, 2017 were $494.5 million, or 20.9% of net sales, as compared with $480.6 million, or 21.6% of net sales, for the year ended July 31, 2016. The decrease in operating expenses as a percentage of sales was primarily driven by the lack of restructuring charges in the current fiscal year combined with leverage gained on the year-over-year sales increase, partially offset by higher variable compensation expense than fiscal 2016.
Operating expenses for the year ended July 31, 2016 were $480.6 million, or 21.6% of net sales, as compared with $520.3 million, or 21.9% of net sales, for the year ended July 31, 2015. The year-over-year decrease in operating expenses as a percentage of sales was primarily driven by expense savings from previous restructuring actions combined with the Company's efforts to control expenses.
Non-Operating Items
Interest expense for the year ended July 31, 2017 was $19.5 million, as compared with $20.7 million for the year ended July 31, 2016, a decrease of $1.2 million. The decrease is due to the average level of debt outstanding during fiscal 2017 being lower than fiscal 2016. Other income, net for the year ended July 31, 2017 was $12.9 million, as compared with $3.9 million for the year ended July 31, 2016. The increase in other income, net for fiscal 2017 was primarily due to a $6.8 million favorable settlement of claims in an escrow account associated with general representations and warranties that had been established in connection with the Company’s acquisition of Northern Technical.
Interest expense for the year ended July 31, 2016 was $20.7 million, as compared with $15.2 million for the year ended July 31, 2015, an increase of $5.5 million. The increase was due to $150.0 million of debt issued in April 2015 that was outstanding for all of fiscal 2016. Other income, net for the year ended July 31, 2016 was $3.9 million, as compared with $15.5 million for the year ended July 31, 2015. The decrease in other income, net for fiscal 2016 was primarily driven by $6.8 million of higher losses on foreign exchange compared with fiscal 2015.
Income Taxes
The effective tax rate for the year ended July 31, 2017 was 27.7%, as compared with 25.9% for the year ended July 31, 2016. The year-over-year change was primarily driven by nonrecurring tax benefits recorded in fiscal 2016 from the favorable settlements of tax audits, which reduced the prior year effective tax rate by 1.7 percentage points.
The effective tax rate for the year ended July 31, 2016 was 25.9%, as compared with 27.9% for the year ended July 31, 2015. The year-over-year change was primarily driven by nonrecurring tax benefits recorded in fiscal 2016 from the favorable settlements of tax audits and the mix of earnings between tax jurisdictions.
Net Earnings
Net earnings for the year ended July 31, 2017 were $232.8 million, as compared with $190.8 million for the year ended July 31, 2016, an increase of $42.0 million, or 22.0%. Diluted earnings per share were $1.74 for the year ended July 31, 2017, as compared with $1.42 for the year ended July 31, 2016, an increase of 22.5%.
Net earnings for the year ended July 31, 2016 were $190.8 million, as compared with $208.1 million for the year ended July 31, 2015, a decrease of $17.3 million, or 8.3%. Diluted net earnings per share were $1.42 for the year ended July 31, 2016, as compared with $1.49 for the year ended July 31, 2015, a decrease of 4.7%.
14
Although net earnings excluding foreign currency translation is not a measure of financial performance under GAAP, the Company believes that it is useful in understanding its financial results and provides a comparable measure for understanding the operating results of the Company between different fiscal periods. The following is a reconciliation to the most comparable GAAP financial measure of this non-GAAP financial measure for the years ended July 31, 2017, 2016 and 2015 (in millions):
Year Ended July 31, | ||||||||||||
2017 | 2016 | 2015 | ||||||||||
Prior year net earnings | $ | 190.8 | $ | 208.1 | $ | 260.2 | ||||||
Change in net earnings excluding translation | 43.3 | (9.4 | ) | (37.8 | ) | |||||||
Impact of foreign currency translation (1) | (1.3 | ) | (7.9 | ) | (14.3 | ) | ||||||
Current year net earnings | $ | 232.8 | $ | 190.8 | $ | 208.1 | ||||||
(1) | The impact of foreign currency translation is calculated by translating current period foreign currency net earnings into U.S. dollars using the average foreign currency exchange rates for the prior fiscal year period rather than actual current period foreign currency exchange rates. |
Restructuring Activities
The Company did not incur any restructuring or impairment charges during fiscal 2017. The Company incurred $16.1 million of restructuring changes in fiscal 2016 with $10.4 million recorded in operating expenses and the remaining $5.7 million recorded in cost of sales. The Engine Products segment incurred $8.8 million and the Industrial Products segment incurred $7.3 million of the restructuring charges for fiscal 2016. The Company incurred $16.9 million of restructuring and impairment charges in fiscal 2015 with $8.5 million recorded in operating expenses and the remaining $8.4 million recorded in cost of sales. The Engine Products segment incurred $9.2 million and the Industrial Products segment incurred $3.8 million of the restructuring and impairment charges for fiscal 2015. The charges for fiscal 2016 and fiscal 2015 consisted of one-time termination benefits from restructuring salaried and production workforce in all geographic regions and closing a production facility in Grinnell, Iowa. In addition, in fiscal 2015 the Company recorded the abandonment and write-off of a partially completed facility in Xuzhou, China and a $3.9 million charge related to a lump-sum settlement of its U.S. pension plan. As the Company’s restructuring actions were mainly incurred and paid in the same period, there was no material liability balance as of either of the periods presented.
Segment Results of Operation
Net sales and earnings before income taxes by operating segment for each of the three years ended July 31, 2017, 2016 and 2015 are summarized as follows (in millions):
Year Ended July 31, | Increase (Decrease) | |||||||||||||||||||
2017 | 2016 | 2015 | 2017 vs 2016 | 2016 vs 2015 | ||||||||||||||||
Net sales | ||||||||||||||||||||
Engine Products segment | $ | 1,553.3 | $ | 1,391.3 | $ | 1,484.1 | $ | 162.0 | $ | (92.8 | ) | |||||||||
Industrial Products segment | 818.6 | 829.0 | 887.1 | (10.4 | ) | (58.1 | ) | |||||||||||||
Total | $ | 2,371.9 | $ | 2,220.3 | $ | 2,371.2 | $ | 151.6 | $ | (150.9 | ) | |||||||||
Earnings before income taxes | ||||||||||||||||||||
Engine Products segment | $ | 219.7 | $ | 163.5 | $ | 186.3 | $ | 56.2 | $ | (22.8 | ) | |||||||||
Industrial Products segment | 129.1 | 119.0 | 123.3 | 10.1 | (4.3 | ) | ||||||||||||||
Corporate and Unallocated (1) | (26.8 | ) | (25.1 | ) | (21.0 | ) | (1.7 | ) | (4.1 | ) | ||||||||||
Total | $ | 322.0 | $ | 257.4 | $ | 288.6 | $ | 64.6 | $ | (31.2 | ) | |||||||||
(1) | Corporate and Unallocated includes corporate expenses determined to be non-allocable to the segments, such as interest income and interest expense. The Corporate and Unallocated results were determined on a consistent basis for all periods presented. |
15
Engine Products Segment
The following is a summary of net sales by product group within the Company’s Engine Products segment for the years ended July 31, 2017, 2016 and 2015 (in millions):
Year Ended July 31, | Increase (Decrease) | |||||||||||||||||||
2017 | 2016 | 2015 | 2017 vs 2016 | 2016 vs 2015 | ||||||||||||||||
Engine Products segment | ||||||||||||||||||||
Off-Road | $ | 252.1 | $ | 216.6 | $ | 261.1 | $ | 35.5 | $ | (44.5 | ) | |||||||||
On-Road | 110.7 | 127.2 | 138.4 | (16.5 | ) | (11.2 | ) | |||||||||||||
Aftermarket | 1,086.2 | 951.5 | 980.7 | 134.7 | (29.2 | ) | ||||||||||||||
Aerospace and Defense | 104.3 | 96.0 | 103.9 | 8.3 | (7.9 | ) | ||||||||||||||
Total Engine Products segment | $ | 1,553.3 | $ | 1,391.3 | $ | 1,484.1 | $ | 162.0 | $ | (92.8 | ) | |||||||||
Engine Products segment earnings before income taxes | $ | 219.7 | $ | 163.5 | $ | 186.3 | $ | 56.2 | $ | (22.8 | ) | |||||||||
The Engine Products segment sells to OEMs in the construction, mining, agriculture, aerospace, defense and truck end markets, and to independent distributors, OEM dealer networks, private label accounts and large equipment fleets. Products include replacement filters for both air and liquid filtration applications, air filtration systems, liquid filtration systems for fuel, lube and hydraulic applications, and exhaust and emissions systems.
Fiscal 2017 compared with Fiscal 2016
Net sales for the Engine Products segment for the year ended July 31, 2017 were $1,553.3 million, as compared with $1,391.3 million for the year ended July 31, 2016, an increase of $162.0 million, or 11.6%. Sales in all product groups except On-Road increased from the prior year, with increased sales in Aftermarket and Off-Road driving nearly all of the segment-level improvement. The impact of foreign currency translation during fiscal 2017 increased Engine Products sales by $0.6 million. In constant currency, fiscal 2017 Engine Products sales increased $161.3 million, or 11.6%.
Worldwide sales of Off-Road were $252.1 million, an increase of 16.4% from fiscal 2016. In constant currency, sales increased $37.2 million, or 17.2%. Sales in fiscal 2017 benefited from the Company’s success in winning new programs for air and liquid filtration systems with innovative products, combined with improving market conditions in the global mining, agriculture and construction industries.
Worldwide sales of On-Road were $110.7 million, a decrease of 13.0% from fiscal 2016. In constant currency, sales decreased $17.2 million, or 13.5%. Decreasing production of heavy-duty trucks in all regions drove the year-over-year decline.
Worldwide sales of Aftermarket were $1,086.2 million, an increase of 14.2% from fiscal 2016. In constant currency, sales increased $132.3 million, or 13.9%. The increase was primarily driven by strength in the Company’s innovative air and liquid filtration products combined with benefits from further geographic expansion of distribution and production of aftermarket products. Aftermarket sales also included a combined benefit of approximately $21.7 million from the acquisitions of Hy-Pro and Industrias Partmo, which were both completed during fiscal 2017.
Worldwide sales of Aerospace and Defense were $104.3 million, an increase of 8.7% from fiscal 2016. In constant currency, sales increased $9.0 million, or 9.4%. The increase from fiscal 2016 was driven by sales growth of aerospace replacement parts and defense products for ground vehicles, partially offset by first-fit sales of aerospace products to rotary-wing aircraft that remained under pressure.
Earnings before income taxes for the Engine Products segment for the year ended July 31, 2017 were $219.7 million, or 14.1% of Engine Products' sales, an increase from 11.8% of sales for the year ended July 31, 2016. Improved cost absorption on higher sales than the prior year drove the improvement, which was partially offset by incremental costs, such as freight charges, related to meeting higher-than-expected demand.
Fiscal 2016 compared with Fiscal 2015
Net sales for the Engine Products segment for the year ended July 31, 2016 were $1,391.3 million, as compared with $1,484.1 million for the year ended July 31, 2015, a decrease of $92.8 million, or 6.3%. The decrease was driven by declines in all product groups and the impact of foreign currency translation. The impact of foreign currency translation during fiscal 2016 decreased Engine Products sales by $43.4 million, or 2.9%. In constant currency, fiscal 2016 Engine Products sales decreased $49.4 million, or 3.3%.
16
Worldwide sales of Off-Road were $216.6 million, a decrease of 17.0% from fiscal 2015. In constant currency, sales decreased $37.3 million, or 14.3%. These decreases were driven by a continued weakness in the global agricultural, mining and construction equipment markets with decreased build rates in all regions and the negative impacts of foreign currency translation.
Worldwide sales of On-Road were $127.2 million, a decrease of 8.1% from fiscal 2015. In constant currency, sales decreased $8.5 million, or 6.1%. Growth in Asia Pacific and continued strength of medium-duty production was not enough to offset the revenue decreases associated with the slowing production of Class 8 trucks in North America, resulting in a steep decline in this business.
Worldwide sales of Aftermarket were $951.5 million, a decrease of 3.0% from fiscal 2015. In constant currency, sales increased $2.7 million, or 0.3%. The primary driver of the sales decrease from fiscal 2015 was foreign currency translation with sales in local currency remaining relatively flat compared with prior year.
Worldwide sales of Aerospace and Defense were $96.0 million, a decrease of 7.6% from fiscal 2015. In constant currency, sales decreased $6.3 million, or 6.1%. These decreases were due to Aerospace commercial slow down while Defense ground vehicle remained relatively flat. The decline in commercial aerospace was primarily in rotary-wing aircraft reflecting a slowdown in oil exploration that resulted in fewer flight hours. Many Defense platforms were delayed due to funding.
Earnings before income taxes for the Engine Products segment for the year ended July 31, 2016 were $163.5 million, or 11.8% of Engine Products' sales, a decrease from 12.6% of sales for the year ended July 31, 2015. The percentage earnings decrease was driven by lower cost absorption due to a decrease in production volumes and the impact of foreign currency translation.
Industrial Products Segment
The following is a summary of net sales by product group within the Company’s Industrial Products segment for the years ended July 31, 2017, 2016 and 2015 (in millions):
Year Ended July 31, | Increase (Decrease) | |||||||||||||||||||
2017 | 2016 | 2015 | 2017 vs 2016 | 2016 vs 2015 | ||||||||||||||||
Industrial Products segment: | ||||||||||||||||||||
Industrial Filtration Solutions | $ | 533.2 | $ | 517.9 | $ | 529.0 | $ | 15.3 | $ | (11.1 | ) | |||||||||
Gas Turbine Systems | 122.9 | 149.6 | 186.9 | (26.7 | ) | (37.3 | ) | |||||||||||||
Special Applications | 162.5 | 161.5 | 171.2 | 1.0 | (9.7 | ) | ||||||||||||||
Total Industrial Products segment | $ | 818.6 | $ | 829.0 | $ | 887.1 | $ | (10.4 | ) | $ | (58.1 | ) | ||||||||
Industrial Products segment earnings before income taxes | $ | 129.1 | $ | 119.0 | $ | 123.3 | $ | 10.1 | $ | (4.3 | ) | |||||||||
The Industrial Products segment sells to various dealers, distributors, OEMs of gas-fired turbines and OEMs and end users requiring clean air filtration solutions and replacement filters. Products include dust, fume and mist collectors, compressed air purification systems, air filtration systems for gas turbines, PTFE membrane-based products and specialized air and gas filtration systems for applications including hard disk drives and semi-conductor manufacturing.
Fiscal 2017 compared with Fiscal 2016
Net sales for the Industrial Products segment for the year ended July 31, 2017 were $818.6 million, as compared with $829.0 million for the year ended July 31, 2016, a decrease of $10.4 million, or 1.2%. This decrease was driven by a 17.9% decrease in Gas Turbine Systems sales and the impact of foreign currency translation, partially offset by year-over-year sales increases for Industrial Filtration Solutions and Special Applications. The impact of foreign currency translation during fiscal 2017 decreased Industrial Products sales by $8.8 million, or 1.0%. In constant currency, fiscal 2017 Industrial Products sales decreased $1.5 million, or 0.2%.
Worldwide sales of Industrial Filtration Solutions were $533.2 million, a 3.0% increase from fiscal 2016. In constant currency, sales increased $20.7 million, or 4.0%. Sales of replacement parts drove the increase, partially offset by reduced sales of new equipment as the market pressures related to global capital expenditures and investments continued to pressure the business.
Worldwide sales of Gas Turbine Systems were $122.9 million, a 17.9% decrease from fiscal 2016. In constant currency, sales declined $25.6 million, or 17.1%. The sales decline was primarily driven by market-related pressures, including the Company’s decision to be more selective in bidding large turbine projects. Gas Turbine Systems sales are typically large systems and, as a result, the Company's shipments and revenues fluctuate from period to period.
17
Worldwide sales of Special Applications were $162.5 million, a 0.6% increase from fiscal 2016. In constant currency, sales increased $3.4 million, or 2.1%. The increase was driven primarily by sales of venting solutions and products for semiconductor applications. Although the hard disk drive market remains in secular decline, temporarily favorable market conditions during fiscal 2017 combined with the Company’s efforts to increase content per drive resulted in sales of disk drive filters that were slightly higher than the prior year.
Earnings before income taxes for the Industrial Products segment for the year ended July 31, 2017 were $129.1 million, or 15.8% of Industrial Products' sales, an increase from 14.4% of sales for the year ended July 31, 2016. The earnings before income taxes percentage increase was driven by the benefit from the escrow settlement of $6.8 million related to the Northern Technical acquisition combined with the lack of restructuring charges in fiscal 2017 versus the prior year, during which $7.3 million were recorded.
Fiscal 2016 compared with Fiscal 2015
Net sales for the Industrial Products segment for the year ended July 31, 2016 were $829.0 million, as compared with $887.1 million for the year ended July 31, 2015, a decrease of $58.1 million, or 6.5%. This decrease was driven by a 20.0% decrease in Gas Turbine Systems sales and the impact of foreign currency translation. The impact of foreign currency translation during fiscal 2016 decreased Industrial Products sales by $30.8 million, or 3.5%. In constant currency, fiscal 2016 Industrial Products sales decreased $27.3 million, or 3.1%.
Worldwide sales of Industrial Filtration Solutions were $517.9 million, a 2.1% decrease from fiscal 2015. In constant currency, fiscal 2016 sales increased $7.7 million, or 1.5%. Sales of both aftermarket and equipment were consistent with fiscal 2015.
Worldwide sales of Gas Turbine Systems were $149.6 million, a 20.0% decrease from fiscal 2015. In constant currency, fiscal 2016 sales decreased $33.9 million, or 18.1%. Gas Turbine Systems sales are typically large systems and, as a result, the Company's shipments and revenues fluctuate from period to period.
Worldwide sales of Special Applications were $161.5 million, a 5.7% decrease from fiscal 2015. In constant currency, fiscal 2016 sales decreased $1.1 million, or 0.6%. These decreases were driven by weakness in disk drive product sales as the business is in a secular decline as solid-state memory replaces traditional hard disk drives.
Earnings before income taxes for the Industrial Products segment for the year ended July 31, 2016 were $119.0 million, or 14.4% of Industrial Products' sales, an increase from 13.9% of sales for the year ended July 31, 2015. The fiscal 2016 earnings before income taxes percentage increase was driven by the benefits from previous restructuring actions and favorable product mix partially offset by a $3.5 million increase in restructuring charges.
Liquidity and Capital Resources
Capital Structure
The Company's long-term capital structure at July 31, 2017 and July 31, 2016 is summarized as follows (in millions):
July 31, | ||||||||
2017 | 2016 | |||||||
Long-term debt | $ | 537.3 | $ | 350.2 | ||||
Shareholders' equity | 854.5 | 771.4 | ||||||
Total long-term capital | $ | 1,391.8 | $ | 1,121.6 | ||||
Ratio of long-term debt to total long-term capital | 38.6 | % | 31.2 | % | ||||
As of July 31, 2017, long-term debt represented 38.6% of total long-term capital, defined as long-term debt plus total shareholders’ equity, compared with 31.2% at July 31, 2016.
Total long-term debt outstanding at July 31, 2017 was $537.3 million compared with $350.2 million at the prior year end, an increase of $187.1 million, primarily due to the refinancing of debt outstanding under the revolving credit facility into long-term debt in connection with the amendment and restatement of the related credit agreement.
The Company has a multi-currency revolving credit facility with a group of lenders. On July 21, 2017, the Company entered into an amended and restated credit agreement that increases the borrowing availability to $500.0 million and extends the maturity date of the credit facility to July 21, 2022. The credit facility also has an accordion feature that allows the Company to request an increase to the commitment under the facility by up to $250.0 million. At July 31, 2017 and 2016, $190.0 million and $130.0 million, respectively, was outstanding. At July 31, 2017 and 2016, $299.5 million and $262.7 million, respectively, was available for further borrowing under this facility. The amount available for further borrowing reflects the issued standby letters of credit,
18
as discussed in Note 16 in the Notes to Consolidated Financial Statements included in Item 8 of this Annual Report, as issued standby letters of credit reduce the amounts available for borrowing under this facility. The credit facility also includes a $50.0 million term loan due July 21, 2020. Borrowings under the Company's amended revolving credit facility are automatically rolled over until the credit facility maturity date unless the agreement is terminated early or the Company is found to be in default. Therefore, beginning on July 21, 2017 (at which time $270.0 million was outstanding) and subsequent to that date, all borrowings under this credit facility are classified as long-term debt on the Company’s Consolidated Balance Sheets.
On July 22, 2016, a Japanese subsidiary of the Company issued a ¥1.0 billion note that was guaranteed by the Company. The debt was issued at face value of ¥1.0 billion (approximately $9.0 million at July 31, 2017), is due July 15, 2021, and bears interest payable quarterly at a variable interest rate. The interest rate was 0.25% as of July 31, 2017 and 2016.
The Company has two uncommitted credit facilities in the U.S., which provide unsecured borrowings for general corporate purposes. There was $19.2 million outstanding at July 31, 2017 and $26.8 million outstanding at July 31, 2016, and all borrowings that were outstanding on those dates had maturities that were less than twelve months. The weighted average interest rate on the short-term borrowings outstanding at July 31, 2017 and 2016 was 2.00% and 1.25%, respectively. At July 31, 2017 and 2016, there was $45.7 million and $38.2 million, respectively, available under these two credit facilities.
The Company has a €100.0 million (approximately $117.3 million at July 31, 2017) program for issuing treasury notes for raising short-, medium- and long-term financing for its European operations. There were no amounts outstanding under this program at July 31, 2017 or 2016. Additionally, the Company’s European operations have lines of credit with an available limit of €43.5 million (approximately $51.0 million at July 31, 2017). There was no amount outstanding at July 31, 2017 or 2016.
Other international subsidiaries may borrow under various credit facilities. There was approximately $4.1 million outstanding under these credit facilities as of July 31, 2017 and $8.7 million as of July 31, 2016. All borrowings that were outstanding on those dates had maturities that were less than twelve months. At July 31, 2017 and 2016, there was approximately $39.8 million and $45.5 million available for use, respectively, under these facilities. The weighted average interest rate on these short-term borrowings outstanding at July 31, 2017 and 2016 was 0.32%.
At July 31, 2017 and 2016, the Company had a contingent liability for standby letters of credit totaling $10.5 million and $7.3 million, respectively, that have been issued and are outstanding. The letters of credit guarantee payment to third parties in the event the Company is in breach of insurance contract terms as detailed in each letter of credit. At July 31, 2017 and 2016, there were no amounts drawn upon these letters of credit.
Certain debt agreements, including the $500.0 million revolving credit facility, contain financial covenants related to interest coverage and leverage ratios, as well as other non-financial covenants. As of July 31, 2017, the Company was in compliance with all such covenants.
Cash Flow Summary
The Company assesses its liquidity in terms of its ability to generate cash to fund its operating, investing and financing activities. Significant factors affecting liquidity are: cash flows generated from operating activities, capital expenditures, acquisitions, dispositions, dividends, repurchase of outstanding shares, adequacy of available bank lines of credit and the ability to attract long-term capital with satisfactory terms. The Company generates substantial cash from the operation of its businesses and remains in a strong financial position, with sufficient liquidity available for reinvestment in existing businesses and strategic acquisitions.
Cash flows for the years ended July 31, 2017, 2016 and 2015 are summarized as follows (in millions):
July 31, | ||||||||||||
2017 | 2016 | 2015 | ||||||||||
Net cash provided by (used in): | ||||||||||||
Operating activities | $ | 310.3 | $ | 286.1 | $ | 212.8 | ||||||
Investing activities | (95.7 | ) | (55.6 | ) | (111.7 | ) | ||||||
Financing activities | (157.7 | ) | (175.0 | ) | (179.0 | ) | ||||||
Effect of exchange rate changes on cash | 8.3 | (2.2 | ) | (28.6 | ) | |||||||
Increase (decrease) in cash and cash equivalents | $ | 65.2 | $ | 53.3 | $ | (106.5 | ) | |||||
Operating Activities
Cash provided by operating activities for the year ended July 31, 2017 was $310.3 million, as compared with $286.1 million for the year ended July 31, 2016, an increase of $24.2 million. The increase in cash generated by operating activities resulted from higher net earnings of $42.0 million, partially offset by several changes in working capital items that resulted in a net cash reduction.
19
Accounts receivable at July 31, 2017 was $497.7 million, as compared with $452.4 million at July 31, 2016, an increase of $45.3 million. The increase is due to increased sales in the fourth quarter of fiscal 2017, slightly offset by an improvement in days sales outstanding. Days sales outstanding was 67.2 days as of July 31, 2017, compared with 67.5 days as of July 31, 2016. The Company’s days sales outstanding is impacted by the mix of foreign sales, particularly in countries where longer payment terms are customary. Days sales outstanding is calculated using the count back method, which calculates the number of days of most recent revenue that is reflected in the net accounts receivable balance.
Inventories at July 31, 2017 was $293.5 million, as compared with $234.1 million at July 31, 2016, an increase of $59.4 million. The increase is primarily driven by increases across the regions to meet customer demand given the current sales momentum. Inventory turns were 4.5 times per year as of both July 31, 2017 and July 31, 2016. Inventory turns are calculated by taking the inventoriable portion of cost of goods sold for the trailing twelve month period divided by the average gross inventory value over the prior thirteen month period.
Cash provided by operating activities for the year ended July 31, 2016 was $286.1 million, as compared with $212.8 million for the year ended July 31, 2015, an increase of $73.3 million. The increase in cash generated from operating activities resulted from a $99.6 million higher cash inflow from working capital relative to fiscal 2015, partially offset by lower net earnings of $17.3 million. The higher cash outflow from working capital was primarily attributable to improvements in inventories and accounts receivable of $55.3 million and $29.2 million, respectively, compared to fiscal 2015 driven by active working capital management.
Investing Activities
Cash used in investing activities for the year ended July 31, 2017 was $95.7 million, as compared with $55.6 million for the year ended July 31, 2016, an increase of $40.1 million. The increase in cash used in investing activities between the periods resulted from a decrease in proceeds from sales of short-term investments of $28.0 million and an increase in cash outflows for acquisitions of $19.3 million as the Company acquired Partmo, a leading manufacturer of replacement air, lube and fuel filters in Colombia for medium and heavy duty engines, and Hy-Pro, a domestic manufacturer of filtration systems and replacement filters for stationary hydraulic and industrial lubrication applications. The increase in cash utilized was partially offset by a decrease in capital expenditures of $7.0 million.
Cash used in investing activities for the year ended July 31, 2016 was $55.6 million, as compared with $111.7 million for the year ended July 31, 2015, a decrease of $56.1 million. The decrease in cash used in investing activities between the periods resulted from a decrease in cash outflows for acquisitions and capital expenditures of $92.7 million and $20.9 million, respectively, partially offset by a decrease in net proceeds from sales of short-term investments of $59.5 million.
Financing Activities
Cash flows used in financing activities generally relate to the use of cash for repurchases of the Company's common stock and payment of dividends, net borrowing activity and proceeds from the exercise of stock options. The Company's Board of Directors authorized the repurchase of up to 14.0 million shares of common stock under the Company’s stock repurchase plan dated May 29, 2015. This repurchase authorization is effective until terminated by the Board of Directors. As of July 31, 2017, the Company had remaining authorization to repurchase 7.2 million shares under this plan. To determine the appropriate level of dividend payouts, the Company considers recent and projected performance across key financial metrics, including earnings, cash flow from operations and total debt. Dividends paid for years ended July 31, 2017, 2016 and 2015 were $92.4 million, $91.2 million and $91.2 million, respectively.
Cash used in financing activities for the year ended July 31, 2017 was $157.7 million, as compared with $175.0 million for the year ended July 31, 2016, a decrease of $17.3 million. The decrease was driven by increased short-term borrowings and long-term debt, including current maturities for the year ended July 31, 2017 compared with the prior year of $62.9 million, partially offset by higher share repurchases for the year ended July 31, 2017 compared with the prior year of $56.1 million.
Cash used in financing activities for the year ended July 31, 2016 was $175.0 million, as compared with $179.0 million for the year ended July 31, 2015, a decrease of $4.0 million. The decrease resulted from lower share repurchases for the year ended July 31, 2016 compared with the prior year of $172.0 million, partially offset by lower net proceeds from short-term borrowings and long-term debt for the year ended July 31, 2016 compared with the prior year of $164.0 million.
Cash and Cash Equivalents
At July 31, 2017 and 2016, cash and cash equivalents were $308.4 million and $243.2 million, respectively. The majority of the Company’s cash and cash equivalents are held by its foreign subsidiaries as over half of the Company’s earnings occur outside the U.S. Most of these funds are considered permanently reinvested outside the U.S., as the cash generated from U.S. operations plus the Company’s debt facilities are anticipated to be sufficient for the Company's U.S. operation’s cash needs. If additional cash was required for the Company’s operations in the U.S., it may be subject to additional U.S. taxes if funds were repatriated from certain foreign subsidiaries.
20
At July 31, 2017, the Company had $553.3 million available under existing credit facilities. The Company believes that the combination of existing cash, available credit under existing credit facilities and the expected cash generated by operating activities will be adequate to meet cash requirements for fiscal 2018, including debt repayments, payment of anticipated dividends, possible share repurchase activity, potential acquisitions and capital expenditures.
Off-Balance Sheet Arrangements
The Company does not have any off-balance sheet arrangements, with the exception of the guarantee of 50% of certain debt of its joint venture with Caterpillar Inc., Advanced Filtration Systems Inc. (AFSI). As of July 31, 2017, the joint venture had $27.8 million of outstanding debt, of which the Company guarantees half. The Company does not believe that this guarantee will have a current or future effect on its financial condition, results of operations, liquidity or capital resources.
Contractual Obligations
The following table summarizes the Company’s contractual obligations as of July 31, 2017, for the years indicated (in millions):
Payments Due by Period | ||||||||||||||||||||
Total | Less than 1 year | 1 - 3 years | 3 - 5 years | More than 5 years | ||||||||||||||||
Long-term debt obligations | $ | 586.8 | $ | 50.1 | $ | 64.0 | $ | 198.1 | $ | 274.6 | ||||||||||
Capital lease obligations | 1.1 | 0.5 | 0.6 | — | — | |||||||||||||||
Interest on long-term debt obligations | 116.5 | 16.2 | 29.6 | 27.2 | 43.5 | |||||||||||||||
Operating lease obligations | 22.8 | 9.7 | 9.3 | 2.1 | 1.7 | |||||||||||||||
Purchase obligations (1) | 130.1 | 126.1 | 0.9 | 2.0 | 1.1 | |||||||||||||||
Pension and deferred compensation (2) | 54.4 | 7.7 | 7.7 | 7.4 | 31.6 | |||||||||||||||
Total (3) | $ | 911.7 | $ | 210.3 | $ | 112.1 | $ | 236.8 | $ | 352.5 | ||||||||||
(1) | Purchase obligations consist primarily of inventory, tooling and capital expenditures. The Company’s purchase orders for inventory are based on expected customer demand and, as a result, quantities and dollar volumes are subject to change. |
(2) | Pension and deferred compensation consists of long-term pension liabilities and salary and bonus deferrals elected by certain executives under the Company’s deferred compensation plan. Deferred compensation balances earn interest based on a treasury bond rate as defined by the plan (10-year treasury bond STRIP rate plus two percent for deferrals prior to January 1, 2011 and 10-year treasury bond rates for deferrals after December 31, 2010), are approved by the Human Resources Committee of the Board of Directors and are payable at the election of the participants. |
(3) | In addition to the above contractual obligations, the Company may be obligated for additional cash outflows of $21.1 million for potential tax obligations, including accrued interest and penalties. The payment and timing of any such payments is affected by the ultimate resolution of the tax years that are under audit or remain subject to examination by the relevant taxing authorities. Therefore, quantification of an estimated range and timing of future payments cannot be made at this time. |
Critical Accounting Policies
The Company’s Consolidated Financial Statements are prepared in conformity with GAAP. The preparation of these financial statements requires the use of estimates and judgments that affect the reported amounts of assets and liabilities at the date of the financial statements and the reported amounts of revenue and expenses during the periods presented. Management bases estimates on historical experience and various other assumptions that are believed to be reasonable under the circumstances, the results of which form the basis for making judgments about recorded amounts. The Company believes its use of estimates and underlying accounting assumptions adheres to GAAP and are reasonable and consistently applied. The Company’s Critical Accounting Policies are those that require more significant estimates and judgments used in the preparation of its Consolidated Financial Statements and that are the most important to aid in fully understanding its financial results. The Company's Critical Accounting Policies are the following:
Revenue recognition The Company sells a wide range of filtration solutions into many industries around the globe. Revenue is recognized when both product ownership and the risk of loss have transferred to the customer, the Company has no remaining obligations, the selling price is fixed and determinable and collectability is reasonably assured. The vast majority of the Company’s sales contracts are for standard products with product ownership and risk of loss transferring to the customer when the product has shipped, at which point revenue is recognized. Although less common, the Company does have sales contracts with customers requiring product ownership and risk of loss to transfer at the customer’s location. For these non-standard terms, the Company defers revenue on these product sales until the product has been delivered.
For the Company’s Gas Turbine Systems sales, which typically consist of multiple shipments of components that will comprise the entire Gas Turbine Systems project, the Company must carefully monitor the transfer of title related to each portion of a system sale. The Company defers revenue recognition until product ownership and risk of loss has transferred to the customer for all
21
components and when all terms specified in the contract are met, which may include requirements such as the Company delivering technical documentation to the customer or a quality inspection approved by the customer.
In limited circumstances, the Company enters into sales contracts that involve multiple elements (such as equipment, replacement filter elements and installation services). In these instances, the Company determines if the multiple elements in the arrangement represent separate units of accounting. If separate units of accounting exist, the price of the entire arrangement is allocated to the separate units of account using the Company’s best estimate of relative selling price if the unit of account was sold separately. Revenue is then recognized separately for each unit of account when the criteria for revenue recognition have been met.
Additionally, the Company records estimated discounts and rebates offered to customers as a reduction of sales in the same period revenue is recognized.
Goodwill Goodwill is assessed for impairment annually or more frequently if an event occurs or circumstances change that would indicate the asset may be impaired. The impairment assessment for goodwill is done at a reporting unit level, which is one level below the operating segment level. An impairment loss would be recognized when the carrying amount of the reporting unit’s net assets exceeds the estimated fair value of the reporting unit. The fair values are determined using an income approach, a market approach or a weighting of the two. Significant estimates and assumptions are utilized in the valuations, including prices investors paid for the stocks of comparable, publicly traded companies and discounted, projected cash flows.
The Company performed its annual impairment assessment during the third quarter of fiscal 2017. The results of this assessment were that the estimated fair values of the reporting units to which goodwill is assigned continued to exceed the corresponding carrying values of the reporting units, resulting in no goodwill impairment. Of the Company's five reporting units that contain goodwill, the estimated fair values exceeded the respective carrying values by at least 60% for all but the Gas Turbine Systems reporting unit, for which the estimated fair value exceeded the carrying amount by approximately 15%.
Goodwill associated with the Gas Turbine Systems reporting unit was $60.4 million as of the annual impairment assessment and is included in the Industrial Products segment. The Company completed its Gas Turbine Systems goodwill impairment assessment using a weighting of the fair values as determined under a market approach and an income approach to determine the estimated fair value of the reporting unit. The public company method of the market approach estimated fair value based on prices investors paid for the stocks of comparable, publicly traded companies. The income approach estimated fair value based on discounted, projected cash flows from the reporting unit's financial forecast. A terminal growth rate of 3.0% was used, as well as a discount rate of 11.5% reflecting the relative risk of achieving cash flows and any other specific risks or factors related to the Gas Turbine Systems reporting unit. The Company believes the assumptions used in its discounted cash flow analysis are appropriate and result in a reasonable estimate of the reporting unit's fair value. The Company performed a sensitivity analysis to determine how the assumptions impact the results of the impairment assessment under this valuation approach. Holding all other assumptions constant, zero revenue growth or below for fiscal years 2019-2026 would result in impairment. Additionally, a decrease in the terminal growth rate of 3.0% to zero or below, or an increase in the discount rate by 1.5% or more, would result in impairment. While these projections supported no impairment of goodwill of this reporting unit, given the sensitivities to the assumptions used in the calculations of the projected cash flows, it is possible that impairment could be incurred in the future. The Company will continue to monitor results and projected cash flows to assess whether goodwill impairment in the Gas Turbine Systems reporting unit may be necessary.
Income taxes Management is required to estimate income taxes in each of the jurisdictions in which the Company operates. This process involves estimating actual current tax exposure and assessing future tax consequences attributable to temporary differences between the financial statement carrying amount of existing assets and liabilities and their respective tax basis. These deferred tax assets and liabilities are measured using the enacted tax rates expected to apply to taxable income in the years in which those temporary differences are anticipated to reverse based on future taxable income projections and the impact of tax planning strategies. The Company intends to indefinitely reinvest undistributed earnings of its non-U.S. subsidiaries and thus has not provided for U.S. income taxes on these earnings.
Additionally, benefits of tax return positions are recognized in the financial statements when the position is “more-likely-than-not” to be sustained by the taxing authorities based solely on the technical merits of the position. If the recognition threshold is met, the tax benefit is measured and recognized as the largest amount of tax benefit that in the Company's judgment is greater than 50% likely to be realized. The Company maintains a reserve for uncertain tax benefits that are currently unresolved and routinely monitors the potential impact of such situations. The liability for unrecognized tax benefits, accrued interest and penalties was $21.1 million and $17.5 million as of July 31, 2017 and 2016, respectively.
Defined benefit pension plans The Company incurs expenses for employee benefits provided through defined benefit pension plans. In accounting for these defined benefit pension plans, management must make a variety of estimates and assumptions including mortality rates, discount rates, overall Company compensation increases and expected return on plan assets. The Company considers historical data as well as current facts and circumstances and uses a third-party specialist to assist management in determining these estimates.
22
To develop the assumption for the expected long-term rate of return on assets for its U.S. pension plans, the Company considered historical returns and future expected returns for each asset class, as well as the target asset allocation of the pension portfolio. The expected return on plan assets assumption for the plans outside the U.S. reflects the investment allocation and expected total portfolio returns specific to each plan and country. The Company utilized a 6.58% and 6.90% asset-based weighted average expected return on plan assets for its U.S. plans for the years ended July 31, 2017 and 2016, respectively. The Company utilized a 4.19% and 3.93% asset-based weighted average expected return on plan assets for its non-U.S. plans for the years ended July 31, 2017 and 2016, respectively. The expected returns on plan assets are used to develop the following years' expense for the plans.
The Company’s objective in selecting a discount rate for its pension plans is to select the best estimate of the rate at which the benefit obligations could be effectively settled on the measurement date, taking into account the nature and duration of the benefit obligations of the plan. In making this best estimate, the Company looks at the rates of return on high-quality, fixed-income investments currently available, and expected to be available, during the period to maturity of the benefits. This process includes assessing the universe of bonds available on the measurement date with a quality rating of Aa or better. Similar appropriate benchmarks are used to determine the discount rate for the non-U.S. plans. The Company utilized a 3.94% and 3.65% weighted average discount rate for its U.S. plans for the years ended July 31, 2017 and 2016, respectively. The Company utilized a 2.40% and 2.08% weighted average discount rate for its non-U.S. plans for the years ended July 31, 2017 and 2016, respectively.
Beginning with its July 31, 2016 measurement date, the Company changed the method used to estimate the service and interest costs for pension benefits. The new method utilizes a full yield curve approach to estimate service and interest costs by applying specific spot rates along the yield curve used to determine the benefit obligation of relevant projected cash outflows. Historically, the Company had utilized a single weighted average discount rate applied to projected cash outflows. The Company made the change to provide a more precise measurement of service and interest costs by aligning the timing of the plans' liability cash flows to the corresponding spot rate on the yield curve. The change does not impact the measurement of the plans' obligations and did not have a material impact on the Company's pension expense beginning in fiscal 2017. The Company has accounted for this change as a change in accounting estimate.
The Company’s net periodic benefit cost recognized in the Consolidated Statements of Earnings was $3.3 million, $17.8 million and $21.6 million for the years ended July 31, 2017, 2016 and 2015, respectively. While changes to the Company’s pension plan assumptions would not be expected to impact its net periodic benefit cost by a material amount, such changes could significantly impact the Company’s projected benefit obligation.
New Accounting Standards Not Yet Adopted
For new accounting standards not yet adopted, refer to Note 1 in the Notes to Consolidated Financial Statements included in Item 8 of this Annual Report.
Safe Harbor Statement under the Securities Reform Act of 1995
The Company, through its management, may make forward-looking statements reflecting the Company’s current views with respect to future events and financial performance. These forward-looking statements, which may be included in reports filed under the Securities Exchange Act of 1934, as amended (the Exchange Act), in press releases and in other documents and materials as well as in written or oral statements made by or on behalf of the Company, are subject to certain risks and uncertainties, including those discussed in Part I, Item 1A, "Risk Factors" of this Annual Report, which could cause actual results to differ materially from historical results or those anticipated. The words or phrases “will likely result,” “are expected to,” “will continue,” “will allow,” “estimate,” “project,” “believe,” “expect,” “anticipate,” “forecast” and similar expressions are intended to identify forward-looking statements within the meaning of Section 21e of the Exchange Act and Section 27A of the Securities Act of 1933, as amended, as enacted by the Private Securities Litigation Reform Act of 1995 (PSLRA). In particular, the Company desires to take advantage of the protections of the PSLRA in connection with the forward-looking statements made in this Annual Report. All statements other than statements of historical fact are forward-looking statements. These statements do not guarantee future performance.
Readers are cautioned not to place undue reliance on these forward-looking statements, which speak only as of the date such statements are made. In addition, the Company wishes to advise readers that the factors listed in Part I, Item 1A, "Risk Factors" of this Annual Report, as well as other factors, could affect the Company’s performance and could cause the Company’s actual results for future periods to differ materially from any opinions or statements expressed. These factors include, but are not limited to, world economic and industrial market conditions; the Company's ability to maintain certain competitive advantages over competitors; pricing pressures; the Company's ability to protect and enforce its intellectual property rights; the Company's dependence on global operations; customer concentration in certain cyclical industries; commodity availability and pricing; the Company's ability to develop new information technology systems and maintain and upgrade existing systems; information security and data breaches; foreign currency fluctuations; governmental laws and regulations; changes in tax laws, regulations and results of examinations; the Company's ability to attract and retain key personnel; changes in capital and credit markets; execution of the Company's acquisition strategy; the possibility of asset impairment; execution of restructuring plans; the Company's ability to maintain an effective system of internal control over financial reporting and other factors included in Part I, Item 1A, "Risk Factors"
23
of this Annual Report. The Company undertakes no obligation to publicly update or revise any forward-looking statements, whether as a result of new information, future events or otherwise, unless required by law.
Item 7A. Quantitative and Qualitative Disclosures about Market Risk
The Company’s market risk includes the potential loss arising from adverse changes in foreign currency exchange rates, interest rates, pension assumptions and commodity prices. See further discussion of these market risks below.
Foreign currency The Company manages foreign currency market risk from time to time through the use of a variety of financial and derivative instruments. The Company does not enter into any of these instruments for speculative trading purposes. Rather, the Company’s objective in managing these risks is to reduce fluctuations in earnings and cash flows associated with changes in foreign currency exchange rates. The Company uses forward exchange contracts and other hedging activities to hedge the U.S. dollar value resulting from existing recognized foreign currency denominated asset and liability balances and also for anticipated foreign currency transactions. The Company also naturally hedges foreign currency through its production in the countries in which it sells its products.
During fiscal 2017, the U.S. dollar was generally stronger than in fiscal 2016 compared with many of the currencies of the foreign countries in which the Company operates. The overall strength of the dollar had a negative impact on the Company’s international net sales results because the foreign denominated revenues translated into fewer U.S. dollars.
It is not possible to determine the exact impact of foreign currency translation changes. However, the direct effect on reported net sales and net earnings can be estimated. For the year ended July 31, 2017, the estimated impact of foreign currency translation resulted in an overall decrease in reported net sales of $8.2 million and a decrease in reported net earnings of approximately $1.3 million. Foreign currency translation had a negative impact in many regions around the world.
The Company maintains significant assets and operations in Europe, Asia Pacific, Latin America and South Africa, resulting in exposure to foreign currency gains and losses. A portion of the Company’s foreign currency exposure is naturally hedged by incurring liabilities, including bank debt, denominated in the local currency in which the Company’s foreign subsidiaries are located.
The foreign subsidiaries of the Company generally purchase the majority of their input costs and then sell to many of their customers in the same local currency. However, the Company still may be exposed to cost increases relative to local currencies in the markets to which it sells. To mitigate such adverse trends, the Company, from time to time, enters into forward exchange contracts and other hedging activities. Additionally, foreign currency positions are partially offsetting and are netted against one another to reduce exposure.
Some products made by the Company in the U.S. are sold internationally. As a result, sales of such products are affected by the value of the U.S. dollar relative to other currencies. Any long-term strengthening of the U.S. dollar could depress these sales. Also, competitive conditions in the Company’s markets may limit its ability to increase product pricing in the face of adverse currency movements.
Interest The Company’s exposure to market risk for changes in interest rates relates primarily to debt obligations that are at variables rates, as well as the potential increase in fair value of long-term debt resulting from a potential decrease in interest rates. As of July 31, 2017, the Company’s financial liabilities with exposure to changes in interest rates consisted mainly of $240.0 million outstanding on the Company's revolving credit facility and term loan, ¥2.65 billion, or $24.0 million, of variable rate long-term debt and $23.3 million of short-term debt outstanding. Assuming a hypothetical increase of one-half percent in short-term interest rates, with all other variables remaining constant, interest expense would have increased $1.1 million and interest income would have increased $1.5 million in fiscal 2017. Interest rate changes would also affect the fair market value of the debt. As of July 31, 2017, the estimated fair value of long-term debt with fixed interest rates was $330.6 million compared to its carrying value of $325.0 million. The fair value is estimated by discounting the projected cash flows using the rate that similar amounts of debt could currently be borrowed.
Pensions The Company is exposed to market return fluctuations on its qualified defined benefit pension plans. In fiscal 2017, the Company reduced its long-term rate of return from 6.90% to 6.58% on its U.S. plans and increased its rate from 3.93% to 4.19% on its non-U.S. plans, to reflect its future expectation for returns. Consistent with published bond indices, the Company increased its discount rate from 3.65% to 3.94% on its U.S. plans and increased its rates from 2.08% to 2.40% for its non-U.S. plans. The plans were underfunded by $50.0 million at July 31, 2017, since the projected benefit obligation exceeded the fair value of the plan assets.
Commodities The Company is exposed to market risk from fluctuating market prices of certain purchased commodity raw materials, including steel, filter media and petrochemical based products including plastics, rubber and adhesives. On an ongoing basis, the Company enters into selective supply arrangements with certain of its suppliers that allow the Company to reduce volatility in its costs. The Company strives to recover or offset all material cost increases through selective price increases to its
24
customers and the Company’s cost reduction initiatives, which include material substitution, process improvement and product redesigns. However, an increase in commodity prices could result in lower operating margins.
25
Item 8. Financial Statements and Supplementary Data
Management’s Report on Internal Control over Financial Reporting
Management is responsible for establishing and maintaining adequate internal control over financial reporting, as such term is defined in Exchange Act Rule 13a-15(f). Management of the Company has assessed the effectiveness of the Company’s internal control over financial reporting as of July 31, 2017. In making its assessment of internal control financial reporting, management used the criteria described in Internal Control - Integrated Framework - version 2013 issued by the Committee of Sponsoring Organizations of the Treadway Commission (COSO). Based on this evaluation, management concluded that the Company’s internal control over financial reporting was effective as of July 31, 2017 based on criteria in Internal Control-Integrated Framework issued by the COSO. The Company’s independent registered public accounting firm, PricewaterhouseCoopers LLP, has audited the effectiveness of the Company’s internal control over financial reporting as of July 31, 2017, as stated in its report, which appears herein.
/s/ Tod E. Carpenter | /s/ Scott J. Robinson | |
Tod E. Carpenter | Scott J. Robinson | |
President and Chief Executive Officer | Chief Financial Officer | |
September 22, 2017 | September 22, 2017 | |
26
Report of Independent Registered Public Accounting Firm
To the Shareholders and Board of Directors of Donaldson Company, Inc.
In our opinion, the accompanying consolidated balance sheets and the related consolidated statements of earnings, comprehensive income, changes in shareholders’ equity and cash flows present fairly, in all material respects, the financial position of Donaldson Company, Inc. and its subsidiaries as of July 31, 2017 and 2016, and the results of their operations and their cash flows for each of the three years in the period ended July 31, 2017 in conformity with accounting principles generally accepted in the United States of America. Also in our opinion, the Company maintained, in all material respects, effective internal control over financial reporting as of July 31, 2017, based on criteria established in Internal Control - Integrated Framework (2013) issued by the Committee of Sponsoring Organizations of the Treadway Commission (COSO). The Company's management is responsible for these financial statements, for maintaining effective internal control over financial reporting and for its assessment of the effectiveness of internal control over financial reporting included in Management’s Report on Internal Control over Financial Reporting appearing under Item 8. Our responsibility is to express opinions on these financial statements and on the Company's internal control over financial reporting based on our integrated audits. We conducted our audits in accordance with the standards of the Public Company Accounting Oversight Board (United States). Those standards require that we plan and perform the audits to obtain reasonable assurance about whether the financial statements are free of material misstatement and whether effective internal control over financial reporting was maintained in all material respects. Our audits of the financial statements included examining, on a test basis, evidence supporting the amounts and disclosures in the financial statements, assessing the accounting principles used and significant estimates made by management, and evaluating the overall financial statement presentation. Our audit of internal control over financial reporting included obtaining an understanding of internal control over financial reporting, assessing the risk that a material weakness exists, and testing and evaluating the design and operating effectiveness of internal control based on the assessed risk. Our audits also included performing such other procedures as we considered necessary in the circumstances. We believe that our audits provide a reasonable basis for our opinions.
As discussed in Note 1 to the consolidated financial statements, the Company changed the manner in which it classifies deferred income taxes on its consolidated balance sheet in 2017.
A company’s internal control over financial reporting is a process designed to provide reasonable assurance regarding the reliability of financial reporting and the preparation of financial statements for external purposes in accordance with generally accepted accounting principles. A company’s internal control over financial reporting includes those policies and procedures that (i) pertain to the maintenance of records that, in reasonable detail, accurately and fairly reflect the transactions and dispositions of the assets of the company; (ii) provide reasonable assurance that transactions are recorded as necessary to permit preparation of financial statements in accordance with generally accepted accounting principles, and that receipts and expenditures of the company are being made only in accordance with authorizations of management and directors of the company; and (iii) provide reasonable assurance regarding prevention or timely detection of unauthorized acquisition, use, or disposition of the company’s assets that could have a material effect on the financial statements.
Because of its inherent limitations, internal control over financial reporting may not prevent or detect misstatements. Also, projections of any evaluation of effectiveness to future periods are subject to the risk that controls may become inadequate because of changes in conditions, or that the degree of compliance with the policies or procedures may deteriorate.
/s/ PricewaterhouseCoopers LLP
Minneapolis, Minnesota
September 22, 2017
27
Donaldson Company, Inc. and Subsidiaries
Consolidated Statements of Earnings
(In millions, except per share amounts)
Year ended July 31, | ||||||||||||
2017 | 2016 | 2015 | ||||||||||
Net sales | $ | 2,371.9 | $ | 2,220.3 | $ | 2,371.2 | ||||||
Cost of sales | 1,548.8 | 1,465.5 | 1,562.6 | |||||||||
Gross profit | 823.1 | 754.8 | 808.6 | |||||||||
Selling, general and administrative | 439.8 | 425.1 | 460.1 | |||||||||
Research and development | 54.7 | 55.5 | 60.2 | |||||||||
Operating income | 328.6 | 274.2 | 288.3 | |||||||||
Other income, net | (12.9 | ) | (3.9 | ) | (15.5 | ) | ||||||
Interest expense | 19.5 | 20.7 | 15.2 | |||||||||
Earnings before income taxes | 322.0 | 257.4 | 288.6 | |||||||||
Income taxes | 89.2 | 66.6 | 80.5 | |||||||||
Net earnings | $ | 232.8 | $ | 190.8 | $ | 208.1 | ||||||
Weighted average shares – basic | 132.6 | 133.8 | 137.8 | |||||||||
Weighted average shares – diluted | 134.1 | 134.8 | 139.4 | |||||||||
Net earnings per share – basic | $ | 1.76 | $ | 1.43 | $ | 1.51 | ||||||
Net earnings per share – diluted | $ | 1.74 | $ | 1.42 | $ | 1.49 | ||||||
Cash dividends paid per share | $ | 0.700 | $ | 0.685 | $ | 0.665 | ||||||
See Notes to Consolidated Financial Statements.
28
Donaldson Company, Inc. and Subsidiaries
Consolidated Statements of Comprehensive Income
(In millions)
Year ended July 31, | ||||||||||||
2017 | 2016 | 2015 | ||||||||||
Net earnings | $ | 232.8 | $ | 190.8 | $ | 208.1 | ||||||
Other comprehensive income (loss) | ||||||||||||
Foreign currency translation income (loss) | 30.5 | (18.5 | ) | (119.1 | ) | |||||||
Pension liability adjustment, net of deferred taxes of $(11.2), $14.4 and $(0.2), respectively | 20.7 | (25.2 | ) | 3.4 | ||||||||
(Loss) gain on hedging derivatives, net of deferred taxes of $1.2, $(0.1) and $0.4, respectively | (2.6 | ) | 0.1 | (0.5 | ) | |||||||
Net other comprehensive income (loss) | 48.6 | (43.6 | ) | (116.2 | ) | |||||||
Comprehensive income | $ | 281.4 | $ | 147.2 | $ | 91.9 | ||||||
See Notes to Consolidated Financial Statements.
29
Donaldson Company, Inc. and Subsidiaries
Consolidated Balance Sheets
(In millions, except share amounts)
As of July 31, | |||||||
2017 | 2016 | ||||||
ASSETS | |||||||
Current assets: | |||||||
Cash and cash equivalents | $ | 308.4 | $ | 243.2 | |||
Accounts receivable, less allowance of $8.7 and $8.6, respectively | 497.7 | 452.4 | |||||
Inventories, net | 293.5 | 234.1 | |||||
Deferred income taxes | — | 29.0 | |||||
Prepaids and other current assets | 51.4 | 51.0 | |||||
Total current assets | 1,151.0 | 1,009.7 | |||||
Property, plant and equipment, net | 484.6 | 469.8 | |||||
Goodwill | 238.1 | 229.3 | |||||
Intangible assets, net | 40.6 | 38.5 | |||||
Deferred income taxes | 30.3 | 7.8 | |||||
Other long-term assets | 35.1 | 31.9 | |||||
Total assets | $ | 1,979.7 | $ | 1,787.0 | |||
LIABILITIES AND SHAREHOLDERS' EQUITY | |||||||
Current liabilities: | |||||||
Short-term borrowings | $ | 23.3 | $ | 165.5 | |||
Current maturities of long-term debt | 50.6 | 51.2 | |||||
Trade accounts payable | 194.0 | 143.3 | |||||
Accrued employee compensation and related taxes | 100.0 | 61.0 | |||||
Accrued liabilities | 31.1 | 37.5 | |||||
Other current liabilities | 85.1 | 85.3 | |||||
Total current liabilities | 484.1 | 543.8 | |||||
Long-term debt | 537.3 | 350.2 | |||||
Deferred income taxes | 3.6 | 3.1 | |||||
Other long-term liabilities | 100.2 | 118.5 | |||||
Total liabilities | 1,125.2 | 1,015.6 | |||||
Commitments and contingencies (Note 17) | |||||||
Shareholders’ equity: | |||||||
Preferred stock, $1.00 par value, 1,000,000 shares authorized, none issued | — | — | |||||
Common stock, $5.00 par value, 240,000,000 shares authorized, 151,643,194 shares issued | 758.2 | 758.2 | |||||
Retained earnings | 1,041.2 | 905.1 | |||||
Non-controlling interest | 4.4 | 4.0 | |||||
Stock compensation plans | 15.7 | 16.7 | |||||
Accumulated other comprehensive loss | (157.0 | ) | (205.6 | ) | |||
Treasury stock, 21,037,353 and 18,750,503 shares, respectively, at cost | (808.0 | ) | (707.0 | ) | |||
Total shareholders’ equity | 854.5 | 771.4 | |||||
Total liabilities and shareholders’ equity | $ | 1,979.7 | $ | 1,787.0 | |||
See Notes to Consolidated Financial Statements.
30
Donaldson Company, Inc. and Subsidiaries
Consolidated Statements of Cash Flows
(In millions)
Year ended July 31, | ||||||||||||
2017 | 2016 | 2015 | ||||||||||
Operating Activities | ||||||||||||
Net earnings | $ | 232.8 | $ | 190.8 | $ | 208.1 | ||||||
Adjustments to reconcile net earnings to net cash provided by operating activities | ||||||||||||
Depreciation and amortization | 75.2 | 74.9 | 74.3 | |||||||||
Equity in earnings of affiliates, net of distributions | (0.5 | ) | (0.3 | ) | (1.1 | ) | ||||||
Deferred income taxes | (10.6 | ) | (3.3 | ) | (5.6 | ) | ||||||
Tax benefit of equity plans | (4.9 | ) | (2.7 | ) | (6.8 | ) | ||||||
Stock compensation plan expense | 9.1 | 7.3 | 10.7 | |||||||||
Other, net | 5.1 | 11.7 | 25.1 | |||||||||
Changes in operating assets and liabilities, excluding effect of acquired businesses | ||||||||||||
Accounts receivable | (31.8 | ) | 8.5 | (20.7 | ) | |||||||
Inventories | (42.4 | ) | 29.1 | (26.2 | ) | |||||||
Prepaids and other current assets | 12.8 | 0.8 | (27.8 | ) | ||||||||
Trade accounts payable and other accrued expenses | 65.5 | (30.7 | ) | (17.2 | ) | |||||||
Net cash provided by operating activities | 310.3 | 286.1 | 212.8 | |||||||||
Investing Activities | ||||||||||||
Purchases of property, plant and equipment | (65.9 | ) | (72.9 | ) | (93.8 | ) | ||||||
Proceeds from sale of property, plant and equipment | 2.4 | 2.2 | 0.2 | |||||||||
Purchases of short-term investments | — | — | (27.0 | ) | ||||||||
Proceeds from sale of short-term investments | — | 28.0 | 114.5 | |||||||||
Acquisitions, net of cash acquired | (32.2 | ) | (12.9 | ) | (105.6 | ) | ||||||
Net cash used in investing activities | (95.7 | ) | (55.6 | ) | (111.7 | ) | ||||||
Financing Activities | ||||||||||||
Proceeds from long-term debt | — | 9.6 | 150.0 | |||||||||
Repayments of long-term debt | (81.7 | ) | (1.4 | ) | (4.2 | ) | ||||||
Change in short-term borrowings | 129.2 | (23.6 | ) | 2.8 | ||||||||
Purchase of treasury stock | (140.4 | ) | (84.3 | ) | (256.3 | ) | ||||||
Dividends paid | (92.4 | ) | (91.2 | ) | (91.2 | ) | ||||||
Tax benefit of equity plans | 4.9 | 2.7 | 6.8 | |||||||||
Exercise of stock options | 22.7 | 13.2 | 13.1 | |||||||||
Net cash used in financing activities | (157.7 | ) | (175.0 | ) | (179.0 | ) | ||||||
Effect of exchange rate changes on cash | 8.3 | (2.2 | ) | (28.6 | ) | |||||||
Increase (decrease) in cash and cash equivalents | 65.2 | 53.3 | (106.5 | ) | ||||||||
Cash and cash equivalents, beginning of year | 243.2 | 189.9 | 296.4 | |||||||||
Cash and cash equivalents, end of year | $ | 308.4 | $ | 243.2 | $ | 189.9 | ||||||
Supplemental Cash Flow Information | ||||||||||||
Cash paid during the year for: | ||||||||||||
Income taxes | $ | 88.0 | $ | 67.8 | $ | 85.6 | ||||||
Interest | $ | 19.9 | $ | 19.7 | $ | 14.7 | ||||||
See Notes to Consolidated Financial Statements.
31
Donaldson Company, Inc. and Subsidiaries
Consolidated Statements of Changes in Shareholders’ Equity
(In millions, except per share amounts)
Common Stock | Additional Paid-in Capital | Retained Earnings | Non- Controlling Interest | Stock Compensation Plans | Accumulated Other Comprehensive Loss | Treasury Stock | Total | ||||||||||||||||||||||||
Balance July 31, 2014 | $ | 758.2 | $ | — | $ | 702.4 | $ | — | $ | 19.6 | $ | (45.8 | ) | $ | (432.0 | ) | $ | 1,002.4 | |||||||||||||
Comprehensive income | |||||||||||||||||||||||||||||||
Net earnings | 208.1 | 208.1 | |||||||||||||||||||||||||||||
Foreign currency translation | (119.1 | ) | (119.1 | ) | |||||||||||||||||||||||||||
Pension liability adjustment, net of deferred taxes | 3.4 | 3.4 | |||||||||||||||||||||||||||||
Loss on hedging derivatives, net of deferred taxes | (0.5 | ) | (0.5 | ) | |||||||||||||||||||||||||||
Comprehensive income | 91.9 | ||||||||||||||||||||||||||||||
Purchase of IFIL | 3.9 | 3.9 | |||||||||||||||||||||||||||||
Treasury stock acquired | (256.3 | ) | (256.3 | ) | |||||||||||||||||||||||||||
Stock options exercised | (5.7 | ) | (13.1 | ) | 30.2 | 11.4 | |||||||||||||||||||||||||
Deferred stock and other activity | (1.9 | ) | (0.7 | ) | (1.1 | ) | 3.0 | (0.7 | ) | ||||||||||||||||||||||
Performance awards | (0.1 | ) | (0.1 | ) | (0.6 | ) | 0.6 | (0.2 | ) | ||||||||||||||||||||||
Stock option expense | 9.5 | 9.5 | |||||||||||||||||||||||||||||
Tax reduction - employee plans | 7.7 | 7.7 | |||||||||||||||||||||||||||||
Dividends ($0.67 per share) | (90.9 | ) | (90.9 | ) | |||||||||||||||||||||||||||
Balance July 31, 2015 | 758.2 | — | 815.2 | 3.9 | 17.9 | (162.0 | ) | (654.5 | ) | 778.7 | |||||||||||||||||||||
Comprehensive income | |||||||||||||||||||||||||||||||
Net earnings | 190.8 | 190.8 | |||||||||||||||||||||||||||||
Foreign currency translation | (18.5 | ) | (18.5 | ) | |||||||||||||||||||||||||||
Pension liability adjustment, net of deferred taxes | (25.2 | ) | (25.2 | ) | |||||||||||||||||||||||||||
Gain on hedging derivatives, net of deferred taxes | 0.1 | 0.1 | |||||||||||||||||||||||||||||
Comprehensive income | 147.2 | ||||||||||||||||||||||||||||||
Treasury stock acquired | (84.3 | ) | (84.3 | ) | |||||||||||||||||||||||||||
Stock options exercised | (1.4 | ) | (14.7 | ) | 29.0 | 12.9 | |||||||||||||||||||||||||
Deferred stock and other activity | (1.3 | ) | (1.4 | ) | 0.1 | (0.7 | ) | 2.5 | (0.8 | ) | |||||||||||||||||||||
Performance awards | (0.5 | ) | 0.3 | (0.2 | ) | ||||||||||||||||||||||||||
Stock option expense | 6.7 | 6.7 | |||||||||||||||||||||||||||||
Tax reduction - employee plans | 2.7 | 2.7 | |||||||||||||||||||||||||||||
Dividends ($0.69 per share) | (91.5 | ) | (91.5 | ) | |||||||||||||||||||||||||||
Balance July 31, 2016 | 758.2 | — | 905.1 | 4.0 | 16.7 | (205.6 | ) | (707.0 | ) | 771.4 | |||||||||||||||||||||
Comprehensive income | |||||||||||||||||||||||||||||||
Net earnings | 232.8 | 232.8 | |||||||||||||||||||||||||||||
Foreign currency translation | 30.5 | 30.5 | |||||||||||||||||||||||||||||
Pension liability adjustment, net of deferred taxes | 20.7 | 20.7 | |||||||||||||||||||||||||||||
Loss on hedging derivatives, net of deferred taxes | (2.6 | ) | (2.6 | ) | |||||||||||||||||||||||||||
Comprehensive income | 281.4 | ||||||||||||||||||||||||||||||
Treasury stock acquired | (140.4 | ) | (140.4 | ) | |||||||||||||||||||||||||||
Stock options exercised | (3.4 | ) | (10.2 | ) | 35.8 | 22.2 | |||||||||||||||||||||||||
Deferred stock and other activity | (1.9 | ) | (1.4 | ) | 0.4 | (0.8 | ) | 3.5 | (0.2 | ) | |||||||||||||||||||||
Performance awards | (0.2 | ) | 0.1 | (0.1 | ) | ||||||||||||||||||||||||||
Stock option expense | 7.5 | 7.5 | |||||||||||||||||||||||||||||
Tax reduction - employee plans | 5.3 | 5.3 | |||||||||||||||||||||||||||||
Dividends ($0.71 per share) | (92.6 | ) | (92.6 | ) | |||||||||||||||||||||||||||
Balance July 31, 2017 | $ | 758.2 | $ | — | $ | 1,041.2 | $ | 4.4 | $ | 15.7 | $ | (157.0 | ) | $ | (808.0 | ) | $ | 854.5 | |||||||||||||
See Notes to Consolidated Financial Statements.
32
Donaldson Company, Inc. and Subsidiaries
Notes to Consolidated Financial Statements
NOTE 1. Summary of Significant Accounting Policies
Description of Business Donaldson is a worldwide manufacturer of filtration systems and replacement parts. The Company’s core strengths are leading filtration technology, strong customer relationships and its global presence. Products are manufactured at 44 plants around the world and through three joint ventures. Products are sold to OEMs, distributors, dealers and directly to end users.
Principles of Consolidation The Consolidated Financial Statements include the accounts of Donaldson Company, Inc. and all of its majority-owned subsidiaries. All intercompany accounts and transactions have been eliminated. The Company’s three joint ventures are not majority-owned and are accounted for under the equity method. Certain reclassifications to previously reported financial information have been made to conform to the current period presentation.
Use of Estimates The preparation of the Consolidated Financial Statements in conformity with GAAP requires management to make estimates and assumptions that affect the amounts reported in the financial statements and accompanying notes. Actual results could differ from those estimates.
Foreign Currency Translation For most foreign operations, local currencies are considered the functional currency. Assets and liabilities of non-U.S. dollar functional currency entities are translated to U.S. dollars at year-end exchange rates and the resulting gains and losses arising from the translation of net assets located outside the U.S. are recorded as a cumulative translation adjustment, a component of accumulated other comprehensive loss in the Consolidated Balance Sheets. Elements of the Consolidated Statements of Earnings are translated at average exchange rates in effect during the year. Foreign currency transaction gains (losses) are included in other income, net in the Consolidated Statements of Earnings and were $(4.0) million, $(4.7) million and $2.1 million in the years ended July 31, 2017, 2016 and 2015, respectively.
Cash Equivalents The Company considers all highly liquid temporary investments with an original maturity of three months or less to be cash equivalents. Cash equivalents are carried at cost that approximates market value.
Accounts Receivable and Allowance for Doubtful Accounts Trade accounts receivables are recorded at the invoiced amount and do not bear interest. The allowance for doubtful accounts is the Company’s best estimate of the amount of credit losses in its existing accounts receivable. The Company determines the allowance based on historical write-off experience in the industry, regional economic data and evaluation of specific customer accounts for risk of loss. The Company reviews its allowance for doubtful accounts monthly. Past due balances over 90 days and over a specified amount are reviewed individually for collectability. All other balances are reviewed on a pooled basis by reporting unit and geographic region. Account balances are reserved when the Company determines it is probable the receivable will not be recovered. The Company does not have any off-balance sheet credit exposure related to its customers.
Inventories Inventories are stated at the lower of cost or market. U.S. inventories are valued using the last-in, first-out (LIFO) method while the non-U.S. inventories are valued using the first-in, first-out (FIFO) method. Inventories valued at LIFO were approximately 27.2% and 29.0% of total inventories at July 31, 2017 and 2016, respectively. For inventories valued under the LIFO method, the FIFO cost exceeded the LIFO carrying values by $37.1 million and $39.8 million at July 31, 2017 and 2016, respectively. Results of operations for all periods presented were not materially affected by the liquidation of LIFO inventory.
Property, Plant and Equipment Property, plant and equipment are stated at cost. Additions, improvements or major renewals are capitalized while expenditures that do not enhance or extend the asset’s useful life are charged to expense as incurred. Depreciation is computed using the straight-line method. Depreciation expense was $68.8 million, $68.8 million and $66.9 million in the years ended July 31, 2017, 2016 and 2015, respectively. The estimated useful lives of property, plant and equipment are ten to forty years for buildings, including building improvements, and three to ten years for machinery and equipment.
Internal-Use Software The Company capitalizes direct costs of materials and services used in the development and purchase of internal-use software. Amounts capitalized are amortized on a straight-line basis over a period of five to seven years and are reported as a component of machinery and equipment within property, plant and equipment.
Goodwill and Other Intangible Assets Goodwill represents the excess of the purchase price over the fair value of net assets acquired in business combinations under the purchase method of accounting. Other intangible assets, comprised of customer relationships and lists, patents, trademarks and technology, are amortized on a straight-line basis over their estimated useful lives of three to twenty years. Goodwill is assessed for impairment annually or if an event occurs or circumstances change that would indicate the carrying amount may be impaired. The impairment assessment for goodwill is done at a reporting unit level. Reporting units are one level below the operating segment level but can be combined when reporting units within the same operating segment have similar economic characteristics. An impairment loss would be recognized when the carrying amount of the reporting unit’s net assets exceeds the estimated fair value of the reporting unit.
33
Recoverability of Long-Lived Assets The Company reviews its long-lived assets, including identifiable intangibles, for impairment when events or changes in circumstances indicate that the carrying amount of an asset may not be recoverable. If impairment indicators are present and the estimated future undiscounted cash flows are less than the carrying value of the assets, the carrying value is reduced to the fair market value. The Company recorded an impairment charge of $2.9 million in fiscal 2016 for a partially completed facility in Xuzhou, China. There were no impairment charges recorded in fiscal 2017 or fiscal 2015.
Income Taxes The provision for income taxes is computed based on the pretax income reported for financial statement purposes. Deferred tax assets and liabilities are recognized for the expected future tax consequences attributed to temporary differences between the financial statement carrying amounts of existing assets and liabilities and their respective tax basis. Deferred tax assets and liabilities are measured using the enacted tax rates expected to apply to taxable income in the years in which those temporary differences are anticipated to reverse. Valuation allowances are recorded to reduce deferred tax assets when it is more-likely-than-not that a tax benefit will not be realized.
The Company maintains a reserve for uncertain tax benefits. Benefits of tax return positions are recognized in the financial statements when the position is “more-likely-than-not” to be sustained by the taxing authorities based solely on the technical merits of the position. If the recognition threshold is met, the tax benefit is measured and recognized as the largest amount of tax benefit that in the Company’s judgment is greater than 50% likely to be realized.
Treasury Stock Repurchased common stock is stated at cost (determined on an average cost basis) and is presented as a reduction of shareholders’ equity.
Research and Development Expense Research and development expenses include basic scientific research and the application of scientific advances to the development of new and improved products and their uses and are charged against earnings in the year incurred.
Shipping and Handling Shipping and handling costs of $61.4 million, $56.3 million and $63.2 million are classified as a component of selling, general and administrative expenses for the years ended July 31, 2017, 2016 and 2015, respectively.
Equity Based Compensation The Company offers stock-based employee compensation plans, which are more fully described in Note 10. Stock-based employee compensation expense is recognized using the fair-value method for all awards.
Revenue Recognition The Company sells a wide range of filtration solutions into many industries around the globe. Revenue is recognized when both product ownership and the risk of loss have transferred to the customer, the Company has no remaining obligations, the selling price is fixed and determinable and collectability is reasonably assured. The vast majority of the Company’s sales contracts are for standard products with product ownership and risk of loss transferring to the customer when the product has shipped, at which point revenue is recognized. Although less common, the Company does have sales contracts with customers requiring product ownership and risk of loss to transfer at the customer’s location. For these non-standard terms, the Company defers revenue on these product sales until the product has been delivered.
For the Company’s Gas Turbine Systems sales, which typically consist of multiple shipments of components that will comprise the entire Gas Turbine Systems project, the Company must carefully monitor the transfer of title related to each portion of a system sale. The Company defers revenue recognition until product ownership and risk of loss has transferred to the customer for all components and when all terms specified in the contract are met, which may include requirements such as the Company delivering technical documentation to the customer or a quality inspection approved by the customer.
In limited circumstances, the Company enters into sales contracts that involve multiple elements (such as equipment, replacement filter elements and installation services). In these instances, the Company determines if the multiple elements in the arrangement represent separate units of accounting. If separate units of accounting exist, the price of the entire arrangement is allocated to the separate units of account using the Company’s best estimate of relative selling price if the unit of account was sold separately. Revenue is then recognized separately for each unit of account when the criteria for revenue recognition have been met.
Additionally, the Company records estimated discounts and rebates offered to customers as a reduction of sales in the same period revenue is recognized.
Product Warranties The Company provides for estimated warranty expense at the time of sale and accrues for specific items at the time their existence is known and the amounts are determinable. The Company estimates warranty expense using quantitative measures based on historical warranty claim experience and evaluation of specific customer warranty issues. For a reconciliation of warranty reserves, see Note 8.
Derivative Instruments and Hedging Activities The Company recognizes all derivatives on the balance sheet at fair value. Derivatives that are not designated as hedges are adjusted to fair value through income. If the derivative is designated as a hedge, depending on the nature of the hedge, changes in the fair value of derivatives are either offset against the change in fair value of the hedged assets, liabilities or firm commitments through earnings or recognized in shareholders’ equity through other
34
comprehensive loss until the hedged item is recognized. Gains or losses related to the ineffective portion of any hedge are recognized through earnings in the current period.
New Accounting Standards Recently Adopted In August 2014, the Financial Accounting Standards Board (FASB) issued Accounting Standards Update (ASU) 2014-15, Presentation of Financial Statements - Going Concern (Subtopic 205-40): Disclosure of Uncertainties about an Entity's Ability to Continue as a Going Concern. The guidance requires an entity to evaluate whether there are conditions or events, in the aggregate, that raise substantial doubt about the entity's ability to continue as a going concern within one year after the date that the financial statements are issued (or within one year after the financial statements are available to be issued when applicable) and to provide related footnote disclosures in certain circumstances. This accounting guidance was effective for the Company beginning in the second quarter of fiscal 2017 and did not have an impact on its Consolidated Financial Statements.
In April 2015, the FASB issued ASU 2015-03, Interest - Imputation of Interest (Subtopic 835-30): Simplifying the Presentation of Debt Issuance Costs (ASU 2015-03), which amended guidance requiring the issuance of debt costs related to a recognized debt liability be presented on the balance sheet as a direct deduction from the amount of the debt liability, consistent with debt discounts and premiums. This accounting guidance was effective for the Company beginning in the first quarter of fiscal 2017. The adoption of ASU 2015-03 was applied retrospectively and resulted in a reclassification of $1.6 million of debt issuance costs from other long-term assets to long-term debt on the July 31, 2016 Consolidated Balance Sheet. The Consolidated Balance Sheet as of July 31, 2017 is also presented in accordance with the guidance of this new standard.
In May 2015, the FASB issued ASU 2015-07, Fair Value Measurement (Topic 820): Disclosures for Investments in Certain Entities That Calculate Net Asset Value per Share (ASU 2015-07), which amended guidance requiring a company to categorize investments for which fair values are measured using the net asset value (NAV) per share practical expedient. ASU 2015-07 also limits the disclosures to investments for which the entity has elected to measure the fair value using the practical expedient. This accounting guidance was effective for the Company beginning in the first quarter of fiscal 2017 and did not have an impact on its Consolidated Financial Statements but did result in additional disclosures in Note 11.
In September 2015, the FASB issued ASU 2015-16, Simplifying the Accounting for Measurement-Period Adjustments, which amends (Topic 805) Business Combinations. This ASU requires that acquiring entities recognize measurement period adjustments in the reporting period the amounts are determined, including earnings adjustments that would have been recorded in previous periods if the adjustments were known at the acquisition date. Acquiring entities are no longer required to retrospectively adjust amounts in comparative periods. The adjustment amounts and reasons are still disclosed. This accounting guidance was effective for the Company beginning in the first quarter of fiscal 2017 and did not have an impact on its Consolidated Financial Statements.
In November 2015, the FASB issued ASU 2015-17, Income Taxes (Topic 740): Balance Sheet Classification of Deferred Taxes, which amended the guidance requiring companies to separate deferred income tax liabilities and assets into current and non-current amounts in a classified balance sheet. This accounting guidance simplifies the presentation of deferred income taxes, such that deferred tax liabilities and assets be classified as non-current in a classified balance sheet. This accounting guidance is effective for the Company beginning in the first quarter of fiscal 2018. Early adoption is permitted. The Company adopted this accounting guidance prospectively beginning in the first quarter of fiscal 2017, which affected the Company's classification of deferred tax assets and liabilities on the Consolidated Balance Sheets presented. Consistent with the prospective method of adopting this new standard, the Company did not reclassify deferred tax assets and liabilities on its July 31, 2016 Consolidated Balance Sheet.
In January 2017, the FASB issued ASU 2017-04, Simplifying the Test for Goodwill Impairment (ASU 2017-04). ASU 2017-04 eliminates Step 2 from the goodwill impairment test. Under the amendments in this update, an entity should recognize an impairment charge for the amount by which the carrying amount exceeds the reporting unit's fair value; however, the loss recognized should not exceed the total amount of goodwill allocated to that reporting unit. ASU 2017-04 also eliminates the requirement for any reporting unit with a zero or negative carrying amount to perform a qualitative assessment and, if it fails that qualitative test, to perform Step 2 of the goodwill impairment test. ASU 2017-04 is effective for the Company beginning in the first quarter of fiscal 2021. Early adoption is permitted for interim or annual goodwill impairment tests performed on testing dates after January 1, 2017. The Company adopted ASU 2017-04 in the third quarter of fiscal 2017 with its annual goodwill impairment tests. The adoption of ASU 2017-04 did not have an impact on the Company's Consolidated Financial Statements.
New Accounting Standards Not Yet Adopted In May 2014, the FASB issued ASU 2014-09, Revenue from Contracts with Customers (Topic 606) (ASU 2014-09), which amended revenue recognition guidance to clarify the principles for recognizing revenue from contracts with customers. The guidance requires an entity to recognize revenue to depict the transfer of goods or services to customers in an amount that reflects the consideration to which an entity expects to be entitled in exchange for those goods or services. The guidance also requires expanded disclosures relating to the nature, amount, timing and uncertainty of revenue and cash flows arising from contracts with customers. Additionally, qualitative and quantitative disclosures are required about customer contracts, significant judgments and changes in judgments and assets recognized from the costs to obtain or fulfill a contract. In 2016, the FASB issued ASU 2016-08, ASU 2016-10, ASU 2016-11, ASU 2016-12 and ASU 2016-20 to clarify, among other things, the implementation guidance related to principal versus agent considerations, identifying performance
35
obligations and accounting for licenses of intellectual property. This accounting guidance is effective for the Company beginning in the first quarter of fiscal 2019. Early adoption is permitted. The amendments in this update are to be applied on a retrospective basis, either to each prior reporting period presented or by presenting the cumulative effect of applying the update recognized at the date of initial application. The Company has begun an evaluation of the impact of the adoption of the standard on its Consolidated Financial Statements. A project team has been established and will be conducting surveys of the reporting units and performing revenue contract analyses to gather information and identify where potential differences could result in applying the requirements of the new standard. Based on the results of the surveys and contract analyses, the Company will assess the financial impact of the new standard on its Consolidated Financial Statements and determine the method of adoption.
In July 2015, the FASB issued ASU 2015-11, Inventory (Topic 330): Simplifying the Measurement of Inventory (ASU 2015-11), which amended the guidance requiring companies not using the last-in, first-out (LIFO) method to measure inventory at the lower of cost and net realizable value rather than the lower of cost or market. This accounting guidance is effective for the Company beginning in the first quarter of fiscal 2018. The Company does not expect the adoption of ASU 2015-11 will have a material impact on its Consolidated Financial Statements.
In February 2016, the FASB issued ASU 2016-02, Leases (Topic 842) (ASU 2016-02), which amends the guidance requiring companies to recognize assets and liabilities for leases with lease terms of more than twelve months. The new guidance will require companies to record both capital and operating leases on the balance sheet. This accounting guidance is effective for the Company beginning in the first quarter of fiscal 2020 on a modified retrospective basis and early adoption is permitted. The Company is evaluating the impact of the adoption of ASU 2016-02 on its Consolidated Financial Statements.
In March 2016, the FASB issued ASU 2016-09, Compensation - Stock Compensation (Topic 718): Improvements to Employee Share-Based Payment Accounting (ASU 2016-09). This update simplifies several aspects of the accounting for share-based payment transactions, including the income tax consequences, classification of awards as either equity or liabilities and classification on the statement of cash flows. ASU 2016-09 is effective for the Company beginning in the first quarter of fiscal 2018. The Company is evaluating the impact of the adoption of ASU 2016-09 on its Consolidated Financial Statements.
In August 2016, the FASB issued ASU 2016-15, Statement of Cash Flows (Topic 230) (ASU 2016-15). The new guidance is intended to reduce diversity in practice in how certain transactions are classified in the statement of cash flows. ASU 2016-15 is effective for the Company beginning in the first quarter of fiscal 2019. Early adoption is permitted, provided that all of the amendments are adopted in the same period. The guidance requires application using a retrospective transition method. The Company does not expect the application of ASU 2016-15 will have a material impact on its Consolidated Statements of Cash Flows.
In January 2017, the FASB issued ASU 2017-01, Business Combinations: Clarifying the Definition of a Business (ASU 2017-01). The new guidance provides a more robust framework to use in determining when a set of assets and activities is a business. The amendments provide more consistency in applying the guidance, reduce the costs of application and make the definition of a business more operable. ASU 2017-01 is effective for the Company beginning in the first quarter of fiscal 2019. The Company does not expect the application of ASU 2017-01 will have a material impact on its Consolidated Financial Statements.
In March 2017, the FASB issued ASU 2017-07, Compensation - Retirement Benefits (Topic 715) (ASU 2017-07). The new guidance requires employers to disaggregate and present separately the current service cost component from the other components of net benefit cost within the consolidated statement of earnings. ASU 2017-07 is effective for the Company beginning in the first quarter of fiscal 2019. Early adoption is permitted. The Company is evaluating the impact of the adoption of ASU 2017-07 on its Consolidated Statements of Earnings.
In May 2017, the FASB issued ASU 2017-09, Compensation - Stock Compensation (Topic 718) (ASU 2017-09). The amendments in ASU 2017-09 provide guidance about which changes to the terms or conditions of a share-based payment award require an entity to apply modification accounting in Topic 718. ASU 2017-09 is effective for the Company beginning in the first quarter of fiscal 2019. Early adoption is permitted. The Company is evaluating the impact of the adoption of ASU 2017-09 on its Consolidated Financial Statements.
NOTE 2. Acquisitions
On May 1, 2017, the Company acquired 100% of the shares of Hy-Pro Corporation (Hy-Pro). Hy-Pro designs and manufactures filtration systems and replacement filters for stationary hydraulic and industrial lubrication applications. Hy-Pro has manufacturing locations in Anderson, Indiana and Vancouver, Washington. Total consideration for the transaction was $22.7 million. The purchase price allocation is preliminary pending the outcome of the final valuation of the net assets acquired.
On August 31, 2016, the Company acquired the net assets of Industrias Partmo S.A. (Partmo) in Colombia. Partmo is a leading manufacturer of replacement air, lube and fuel filters in Colombia for medium and heavy duty engines. The total consideration for the transaction was $12.1 million.
36
For the two acquisitions that occurred in fiscal 2017, the Company acquired $19.5 million of net tangible assets, $8.6 million of intangible assets that had estimated useful lives ranging from seven to twenty years at the time of acquisition and $6.7 million of goodwill.
On August 31, 2015, the Company acquired 100% of the shares of Engineered Products Company (EPC), a leading designer and manufacturer of indicators, gauges, switches and sensors for engine air and liquid filtration systems. On June 30, 2015, the Company acquired a majority stake in IFIL USA, a manufacturer of pleated bag filters for industrial dust collection. On September 30, 2014, the Company acquired 100% of the voting interest of Northern Technical, L.L.C. (Northern Technical), a manufacturer of gas turbine inlet air filtration systems and replacement filters.
During fiscal 2017, the Company reached a $6.8 million favorable settlement of claims associated with amounts held in an escrow account that had been established in connection with the Company’s acquisition of Northern Technical. Because this settlement was related to claims associated with general representations and warranties and occurred subsequent to one year after the closing of the acquisition, the Company recorded the impact of the $6.8 million settlement as a component of other income, net in its Consolidated Statements of Operations.
Pro forma financial information for these acquisitions have not been presented because they are not material to the Company's consolidated results of operations.
NOTE 3. Supplemental Balance Sheet Information
The components of inventory are as follows (in millions):
July 31, | ||||||||
2017 | 2016 | |||||||
Raw materials | $ | 96.3 | $ | 92.5 | ||||
Work in process | 19.7 | 18.4 | ||||||
Finished products | 177.5 | 123.2 | ||||||
Net inventories | $ | 293.5 | $ | 234.1 | ||||
The components of property, plant and equipment are as follows (in millions):
July 31, | ||||||||
2017 | 2016 | |||||||
Land | $ | 20.6 | $ | 20.0 | ||||
Buildings | 292.5 | 280.4 | ||||||
Machinery and equipment | 866.8 | 810.9 | ||||||
Construction in progress | 48.9 | 39.3 | ||||||
Less: accumulated depreciation | (744.2 | ) | (680.8 | ) | ||||
Net property, plant and equipment | $ | 484.6 | $ | 469.8 | ||||
NOTE 4. Earnings Per Share
The Company’s basic net earnings per share is computed by dividing net earnings by the weighted average number of outstanding common shares. The Company’s diluted net earnings per share is computed by dividing net earnings by the weighted average number of outstanding common shares and common share equivalents related to stock options and stock incentive plans. Certain outstanding options are excluded from the diluted net earnings per share calculations because their exercise prices are greater than the average market price of the Company’s common stock during those periods. Options excluded from the diluted net earnings per share calculation were 1,030,050, 3,164,159 and 977,824 for the years ended July 31, 2017, 2016 and 2015, respectively.
37
The following table presents the information necessary to calculate basic and diluted earnings per share (in millions, except per share amounts):
Year Ended July 31, | ||||||||||||
2017 | 2016 | 2015 | ||||||||||
Net earnings for basic and diluted earnings per share computation | $ | 232.8 | $ | 190.8 | $ | 208.1 | ||||||
Weighted average common shares – basic | 132.6 | 133.8 | 137.8 | |||||||||
Dilutive impact of stock-based awards | 1.5 | 1.0 | 1.6 | |||||||||
Weighted average common shares – diluted | 134.1 | 134.8 | 139.4 | |||||||||
Net earnings per share: | ||||||||||||
Basic | $ | 1.76 | $ | 1.43 | $ | 1.51 | ||||||
Diluted | $ | 1.74 | $ | 1.42 | $ | 1.49 | ||||||
NOTE 5. Goodwill and Other Intangible Assets
The Company has allocated goodwill to reporting units within its Engine Products and Industrial Products segments. During the years ended July 31, 2017 and 2016, the Company acquired Hy-Pro on May 1, 2017, Partmo on August 31, 2016 and EPC on August 31, 2015 and recorded goodwill for these transactions. See Note 2 for additional discussion of acquisitions. There was no disposition activity during the years ended July 31, 2017 and 2016.
The Company performed its annual impairment assessment during the third quarter of fiscal 2017. The results of this assessment were that the estimated fair values of the reporting units to which goodwill is assigned continued to exceed the corresponding carrying values of the reporting units, resulting in no goodwill impairment. Of the Company's five reporting units that contain goodwill, the estimated fair values exceeded the respective carrying values by at least 60% for all but the Gas Turbine Systems reporting unit, for which the estimated fair value exceeded the carrying amount by approximately 15%.
Goodwill associated with the Gas Turbine Systems reporting unit was $60.4 million as of the annual impairment assessment and is included in the Industrial Products segment. The Company completed its Gas Turbine Systems goodwill impairment assessment using a weighting of the fair values as determined under a market approach and an income approach to determine the estimated fair value of the reporting unit. The public company method of the market approach estimated fair value based on prices investors paid for the stocks of comparable, publicly traded companies. The income approach estimated fair value based on discounted, projected cash flows from the reporting unit's financial forecast. A terminal growth rate of 3.0% was used, as well as a discount rate of 11.5% reflecting the relative risk of achieving cash flows and any other specific risks or factors related to the Gas Turbine Systems reporting unit. The Company believes the assumptions used in its discounted cash flow analysis are appropriate and result in a reasonable estimate of the reporting unit's fair value. The Company performed a sensitivity analysis to determine how the assumptions impact the results of the impairment assessment under this valuation approach. Holding all other assumptions constant, zero revenue growth or below for fiscal years 2019-2026 would result in impairment. Additionally, a decrease in the terminal growth rate of 3.0% to zero or below, or an increase in the discount rate by 1.5% or more, would result in impairment. While these projections supported no impairment of goodwill of this reporting unit, given the sensitivities to the assumptions used in the calculations of the projected cash flows, it is possible that impairment could be incurred in the future. The Company will continue to monitor results and projected cash flows to assess whether goodwill impairment in the Gas Turbine Systems reporting unit may be necessary.
The following is a reconciliation of goodwill for the years ended July 31, 2017 and 2016 (in millions):
Engine Products | Industrial Products | Total Goodwill | ||||||||||
Balance as of July 31, 2015 | $ | 71.0 | $ | 152.7 | $ | 223.7 | ||||||
Goodwill acquired | 6.3 | — | 6.3 | |||||||||
Foreign exchange translation | — | (0.7 | ) | (0.7 | ) | |||||||
Balance as of July 31, 2016 | 77.3 | 152.0 | 229.3 | |||||||||
Goodwill acquired | 6.7 | — | 6.7 | |||||||||
Foreign exchange translation | 0.3 | 1.8 | 2.1 | |||||||||
Balance as of July 31, 2017 | $ | 84.3 | $ | 153.8 | $ | 238.1 | ||||||
No goodwill impairment was recorded during the years ended July 31, 2017 and 2016.
38
The following is a reconciliation of intangible assets for the years ended July 31, 2017 and 2016 (in millions):
Gross Carrying Amount | Accumulated Amortization | Net Intangible Assets | ||||||||||
Balance as of July 31, 2015 | $ | 87.1 | $ | (49.2 | ) | $ | 37.9 | |||||
Intangibles acquired | 6.6 | — | 6.6 | |||||||||
Amortization expense | — | (6.1 | ) | (6.1 | ) | |||||||
Foreign exchange translation | 3.1 | (3.0 | ) | 0.1 | ||||||||
Balance as of July 31, 2016 | 96.8 | (58.3 | ) | 38.5 | ||||||||
Intangibles acquired | 8.6 | — | 8.6 | |||||||||
Amortization expense | — | (6.4 | ) | (6.4 | ) | |||||||
Foreign exchange translation | 1.2 | (1.3 | ) | (0.1 | ) | |||||||
Balance as of July 31, 2017 | $ | 106.6 | $ | (66.0 | ) | $ | 40.6 | |||||
Net intangible assets consist of customer relationships and lists of $30.8 million and $30.7 million and patents, trademarks and technology of $9.8 million and $7.8 million, as of July 31, 2017 and 2016, respectively. As of July 31, 2017, customer relationships and lists had a weighted average remaining life of 11.9 years, and patents, trademarks and technology had a weighted average remaining life of 8.1 years. Expected amortization expense relating to existing intangible assets is as follows (in millions):
Year Ending July 31, | Amount | |||
2018 | $ | 5.4 | ||
2019 | 5.2 | |||
2020 | 4.9 | |||
2021 | 4.7 | |||
2022 | 3.6 | |||
Thereafter | 16.8 | |||
Total expected amortization expense | $ | 40.6 | ||
NOTE 6. Short-Term Borrowings
The Company has two uncommitted credit facilities in the U.S., which provide unsecured borrowings for general corporate purposes. There was $19.2 million outstanding at July 31, 2017 and $26.8 million outstanding at July 31, 2016, and all borrowings that were outstanding on those dates had maturities that were less than twelve months. The weighted average interest rate on the short-term borrowings outstanding at July 31, 2017 and 2016 was 2.00% and 1.25%, respectively. At July 31, 2017 and 2016, there was $45.7 million and $38.2 million, respectively, available under these two credit facilities.
The Company has a €100.0 million (approximately $117.3 million at July 31, 2017) program for issuing treasury notes for raising short-, medium- and long-term financing for its European operations. There were no amounts outstanding under this program at July 31, 2017 or 2016. Additionally, the Company’s European operations have lines of credit with an available limit of €43.5 million (approximately $51.0 million at July 31, 2017). There were no amounts outstanding at July 31, 2017 or 2016.
Other international subsidiaries may borrow under various credit facilities. There was approximately $4.1 million outstanding under these credit facilities as of July 31, 2017 and $8.7 million as of July 31, 2016. All borrowings that were outstanding on those dates had maturities that were less than twelve months. At July 31, 2017 and 2016, there was approximately $39.8 million and $45.5 million available for use, respectively, under these facilities. The weighted average interest rate on these short-term borrowings outstanding at July 31, 2017 and 2016 was 0.32%.
As of July 31, 2016, the Company had $130.0 outstanding on a revolving credit facility, described further in Note 7, that was classified as short-term borrowings.
39
NOTE 7. Long-Term Debt
Long-term debt consists of the following (in millions):
July 31, | ||||||||
2017 | 2016 | |||||||
5.48% Unsecured senior notes, interest payable semi-annually, principal payment of $50.0 million due June 1, 2017 | $ | — | $ | 50.0 | ||||
5.48% Unsecured senior notes, interest payable semi-annually, principal payment of $25.0 million due September 28, 2017 | 25.0 | 25.0 | ||||||
5.48% Unsecured senior notes, interest payable semi-annually, principal payment of $25.0 million due November 30, 2017 | 25.0 | 25.0 | ||||||
3.72% Unsecured senior notes, interest payable semi-annually, principal payment of $125.0 million due March 27, 2024 | 125.0 | 125.0 | ||||||
2.93% Unsecured senior notes, interest payable semi-annually, principal payment of $25.0 million due April 16, 2025 | 25.0 | 25.0 | ||||||
3.18% Unsecured senior notes, interest payable semi-annually, principal payment of $125.0 million due June 17, 2030 | 125.0 | 125.0 | ||||||
Variable rate committed, unsecured $500.0 million revolving credit facility due July 21, 2022 and an interest rate of 2.24% as of July 31, 2017 | 190.0 | — | ||||||
Variable rate committed, unsecured $50.0 million term loan due July 21, 2020 and an interest rate of 2.24% as of July 31, 2017 | 50.0 | — | ||||||
Variable rate guaranteed senior note, interest payable quarterly, principal payment of ¥1.65 billion due May 19, 2019 and an interest rate of 0.40% as of July 31, 2017 | 15.0 | 16.0 | ||||||
Variable rate guaranteed senior note, interest payable quarterly, principal payment of ¥1.00 billion due July 15, 2021 and an interest rate of 0.25% as of July 31, 2017 | 9.0 | 9.7 | ||||||
Capitalized lease obligations and other, with various maturity dates and interest rates | 1.1 | 1.9 | ||||||
Terminated interest rate swap contracts | — | 0.4 | ||||||
Debt issuance costs | (2.2 | ) | (1.6 | ) | ||||
Subtotal | 587.9 | 401.4 | ||||||
Less: current maturities | 50.6 | 51.2 | ||||||
Total long-term debt | $ | 537.3 | $ | 350.2 | ||||
The estimated future maturities of the Company's long-term debt as of July 31, 2017, are as follows (in millions):
Year Ended July 31, | Amount | |||
2018 | $ | 50.6 | ||
2019 | 14.9 | |||
2020 | 49.7 | |||
2021 | 8.6 | |||
2022 | 189.5 | |||
Thereafter | 274.6 | |||
Total estimated future maturities | $ | 587.9 | ||
The Company has a multi-currency revolving credit facility with a group of lenders. On July 21, 2017, the Company entered into an amended and restated credit agreement that increases the borrowing availability to $500.0 million and extends the maturity date of the credit facility to July 21, 2022. The credit facility also has an accordion feature that allows the Company to request an increase to the commitment under the facility by up to $250.0 million. At July 31, 2017 and 2016, $299.5 million and $262.7 million, respectively, was available for further borrowing under this facility. The amount available for further borrowing reflects the issued standby letters of credit, as discussed in Note 16, as issued standby letters of credit reduce the amounts available for borrowing under this facility. The credit facility also includes a $50.0 million term loan due July 21, 2020. Borrowings under the Company's amended revolving credit facility are automatically rolled over until the credit facility maturity date unless the agreement is terminated early or the Company is found to be in default. Therefore, beginning on July 21, 2017 (at which time $270.0 million was outstanding) and subsequent to that date, all borrowings under this credit facility are classified as long-term debt on the Company’s Consolidated Balance Sheets.
40
On July 22, 2016, a Japanese subsidiary of the Company issued a ¥1.0 billion note that was guaranteed by the Company. The debt was issued at face value of ¥1.0 billion (approximately $9.0 million at July 31, 2017), is due July 15, 2021, and bears interest payable quarterly at a variable interest rate. The interest rate was 0.25% as of July 31, 2017 and 2016.
Certain debt agreements, including the $500.0 million revolving credit facility, contain financial covenants related to interest coverage and leverage ratios. As of July 31, 2017, the Company was in compliance with all such covenants.
NOTE 8. Warranty
The Company estimates warranty expense on certain products at the time of sale. The following is a reconciliation of warranty reserves for the years ended July 31, 2017 and 2016 (in millions):
Year Ended July 31, | ||||||||
2017 | 2016 | |||||||
Balance at beginning of period | $ | 11.9 | $ | 8.6 | ||||
Accruals for warranties issued during the reporting period | 4.7 | 4.6 | ||||||
Accruals related to pre-existing warranties (including changes in estimates) | 3.6 | 2.9 | ||||||
Less settlements made during the period | (5.6 | ) | (4.2 | ) | ||||
Balance at end of period | $ | 14.6 | $ | 11.9 | ||||
There were no material specific warranty matters accrued for or significant settlements made during the years ended July 31, 2017 and 2016. The Company's warranty matters are not expected to have a material impact on the Company’s results of operations, liquidity or financial position.
NOTE 9. Restructuring Charges
The Company did not incur any restructuring or impairment charges during fiscal 2017. The Company incurred $16.1 million of restructuring changes in fiscal 2016 with $10.4 million recorded in operating expenses and the remaining $5.7 million recorded in cost of sales. The Engine Products segment incurred $8.8 million and the Industrial Products segment incurred $7.3 million of the restructuring charges for fiscal 2016. The Company incurred $16.9 million of restructuring and impairment charges in fiscal 2015 with $8.5 million recorded in operating expenses and the remaining $8.4 million recorded in cost of sales. The Engine Products segment incurred $9.2 million and the Industrial Products segment incurred $3.8 million of the restructuring and impairment charges for fiscal 2015. The charges for fiscal 2016 and fiscal 2015 consisted of one-time termination benefits from restructuring salaried and production workforce in all geographic regions and closing a production facility in Grinnell, Iowa. In addition, in fiscal 2015 the Company recorded the abandonment and write-off of a partially completed facility in Xuzhou, China and a $3.9 million charge related to a lump-sum settlement of its U.S. pension plan. As the Company’s restructuring actions were mainly incurred and paid in the same period, there was no material liability balance as of either of the periods presented.
NOTE 10. Equity Based Compensation
In November 2010, the shareholders approved the 2010 Master Stock Incentive Plan (the Plan). The Plan extends through September 2020 and allows for the granting of nonqualified stock options, incentive stock options, restricted stock, restricted stock units, stock appreciation rights, dividend equivalents and other stock-based awards. Options under the Plan are granted to key employees whereby the option exercise price is equivalent to the market price of the Company's common stock at the date of grant. Options are generally exercisable for up to 10 years from the date of grant. The Plan also allows for the granting of performance awards to a limited number of key executives. As administered by the Human Resources Committee of the Company’s Board of Directors to date, these performance awards are payable in common stock and are based on a formula that measures performance of the Company over a three-year period. Performance award expense under these plans totaled $0.9 million, $0.3 million and $0.1 million in the years ended July 31, 2017, 2016 and 2015, respectively.
Stock options are exercisable in equal increments over three years. For the years ended July 31, 2017, 2016 and 2015, the Company recorded pretax stock-based compensation expense associated with stock options of $7.5 million, $6.7 million and $9.5 million, respectively. The Company also recorded tax benefits associated with this compensation expense of $2.2 million, $2.1 million and $3.1 million for the years ended July 31, 2017, 2016 and 2015, respectively.
41
Stock-based employee compensation expense is recognized using the fair-value method for all awards. The Company determined the fair value of these awards using the Black-Scholes option pricing model with the following assumptions:
Year Ended July 31, | |||||||||
2017 | 2016 | 2015 | |||||||
Risk-free interest rate | 2.5 - 2.6% | 1.6 - 2.3% | 0.05 - 2.3% | ||||||
Expected volatility | 20.8 - 24.1% | 21.8 - 25.9% | 18.6 - 26.7% | ||||||
Expected dividend yield | 1.7 | % | 1.7 | % | 1.6 | % | |||
Expected life: | |||||||||
Director and officer grants | 8 years | 8 years | 8 years | ||||||
Non-officer original grants | 7 years | 7 years | 7 years | ||||||
Reload grants (1) | N/A | N/A | ≤4 years | ||||||
(1) | Grants made to officers or directors who exercised a reloadable option during the fiscal year and made payment of the purchase price using shares of previously owned Company stock. The reload grant is for the number of shares equal to the shares used in payment of the purchase price and/or withheld for minimum tax withholding. Options with a reload provision were no longer issued to officers with more than five years of service, and all directors beginning in fiscal 2006. The Company continued to issue options with a reload provision to officers with less than five years of service until fiscal 2011 when this provision was discontinued. |
The weighted average fair value for options granted during the years ended July 31, 2017, 2016 and 2015 was $10.09, $7.10 and $9.94 per share, respectively, using the Black-Scholes pricing model.
The following table summarizes stock option activity for the years ended July 31, 2017, 2016 and 2015:
Options Outstanding | Weighted Average Exercise Price | ||||||
Outstanding at July 31, 2014 | 7,197,882 | $ | 26.84 | ||||
Granted | 1,023,836 | 38.58 | |||||
Exercised | (916,566 | ) | 18.54 | ||||
Canceled | (113,710 | ) | 38.67 | ||||
Outstanding at July 31, 2015 | 7,191,442 | 29.38 | |||||
Granted | 969,450 | 28.19 | |||||
Exercised | (916,789 | ) | 19.39 | ||||
Canceled | (421,713 | ) | 36.95 | ||||
Outstanding at July 31, 2016 | 6,822,390 | 30.09 | |||||
Granted | 888,500 | 42.65 | |||||
Exercised | (978,193 | ) | 24.04 | ||||
Canceled | (47,146 | ) | 36.51 | ||||
Outstanding at July 31, 2017 | 6,685,551 | 32.60 | |||||
The total intrinsic value of options exercised during the years ended July 31, 2017, 2016 and 2015 was $18.3 million, $11.6 million and $18.8 million, respectively.
The number of shares reserved at July 31, 2017 for outstanding options and future grants was 9,683,708. Shares reserved consist of shares available for grant plus all outstanding options.
42
The following table summarizes information concerning outstanding and exercisable options as of July 31, 2017:
Range of Exercise Prices | Number Outstanding | Weighted Average Remaining Contractual Life (Years) | Weighted Average Exercise Price | Number Exercisable | Weighted Average Exercise Price | |||||||||||
$0.00 to $22.69 | 1,209,231 | 1.92 | $ | 19.63 | 1,209,231 | $ | 19.63 | |||||||||
$22.70 to $28.69 | 981,995 | 7.57 | 27.54 | 387,755 | 26.72 | |||||||||||
$28.70 to $34.69 | 1,457,982 | 4.40 | 31.61 | 1,440,251 | 31.61 | |||||||||||
$34.70 to $40.69 | 1,447,048 | 6.14 | 37.03 | 1,161,545 | 36.66 | |||||||||||
$40.70 and above | 1,589,295 | 8.02 | 42.47 | 706,244 | 42.24 | |||||||||||
6,685,551 | 5.65 | 32.60 | 4,905,026 | 31.00 | ||||||||||||
At July 31, 2017, the aggregate intrinsic value of shares outstanding and exercisable was $99.6 million and $80.9 million, respectively.
The following table summarizes the status of options that contain vesting provisions:
Options | Weighted Average Grant Date Fair Value | ||||||
Non-vested at July 31, 2016 | 1,762,856 | $ | 8.70 | ||||
Granted | 888,500 | 10.09 | |||||
Vested | (834,806 | ) | 9.41 | ||||
Canceled | (36,025 | ) | 8.61 | ||||
Non-vested at July 31, 2017 | 1,780,525 | 9.06 | |||||
The total fair value of options vested during years ended July 31, 2017, 2016 and 2015, was $39.6 million, $30.0 million and $29.3 million, respectively.
As of July 31, 2017, there was $7.4 million of total unrecognized compensation expense related to non-vested stock options granted under the Plan. This unvested expense is expected to be recognized during fiscal years 2018, 2019 and 2020.
NOTE 11. Employee Benefit Plans
Defined Benefit Pension Plans
The Company and certain of its international subsidiaries have defined benefit pension plans for many of their hourly and salaried employees. There are two types of U.S. plans. The first type of U.S. plan (Hourly Pension Plan) is a traditional defined benefit pension plan for union production employees. The second plan (Salaried Pension Plan) is for some salaried and non-union production employees that provides defined benefits pursuant to a cash balance feature whereby a participant accumulates a benefit comprised of a percentage of current salary that varies with years of service, interest credits and transition credits. The Company no longer allows entrants into the U.S. Salaried Pension Plan. Effective August 1, 2016, employees in this plan no longer continue to accrue Company contribution credits under the plan. The freeze of the plan resulted in the participants no longer being active. As a result, actuarial losses will be amortized over the estimated average remaining life expectancy of the inactive participants, rather than the estimated average remaining service period of the active participants. Employees are instead eligible for a 3.0% annual Company retirement contribution to their 401(k) in addition to the Company's normal 401(k) match. The non-U.S. plans generally provide pension benefits based on years of service and compensation level.
43
Net periodic pension costs and amounts recognized in other comprehensive income for the Company’s pension plans include the following components (in millions):
Year Ended July 31, | ||||||||||||
2017 | 2016 | 2015 | ||||||||||
Service cost | $ | 8.3 | $ | 18.4 | $ | 20.4 | ||||||
Interest cost | 13.5 | 18.9 | 19.1 | |||||||||
Expected return on assets | (26.4 | ) | (28.8 | ) | (29.5 | ) | ||||||
Prior service cost and transition amortization | 0.6 | 0.8 | 0.6 | |||||||||
Actuarial loss amortization | 7.3 | 8.5 | 7.1 | |||||||||
Settlement loss | — | — | 3.9 | |||||||||
Net periodic benefit costs | 3.3 | 17.8 | 21.6 | |||||||||
Other changes recognized in other comprehensive income: | ||||||||||||
Net actuarial (gain) loss | (21.7 | ) | 53.6 | 3.5 | ||||||||
Amortization of asset obligations | (0.2 | ) | (0.4 | ) | (0.2 | ) | ||||||
Amortization of prior service cost | (0.4 | ) | (0.4 | ) | (0.4 | ) | ||||||
Amortization of net actuarial loss | (7.3 | ) | (8.5 | ) | (11.0 | ) | ||||||
Total recognized in other comprehensive income | (29.6 | ) | 44.3 | (8.1 | ) | |||||||
Total recognized in net periodic benefit costs and other comprehensive income | $ | (26.3 | ) | $ | 62.1 | $ | 13.5 | |||||
The changes in projected benefit obligations, fair value of plan assets and funded status of the Company’s pension plans for the years ended July 31, 2017 and 2016 are summarized as follows (in millions):
Year Ended July 31, | ||||||||
2017 | 2016 | |||||||
Change in projected benefit obligation: | ||||||||
Projected benefit obligation, beginning of year | $ | 537.3 | $ | 498.7 | ||||
Service cost | 8.3 | 18.4 | ||||||
Interest cost | 13.5 | 18.9 | ||||||
Participant contributions | 0.8 | 1.0 | ||||||
Actuarial (gain) loss | (22.3 | ) | 50.0 | |||||
Currency exchange rates | 2.7 | (17.2 | ) | |||||
Benefits paid | (25.2 | ) | (32.5 | ) | ||||
Projected benefit obligation, end of year | $ | 515.1 | $ | 537.3 | ||||
Change in fair value of plan assets: | ||||||||
Fair value of plan assets, beginning of year | $ | 455.5 | $ | 478.5 | ||||
Actual return on plan assets | 28.4 | 22.2 | ||||||
Company contributions | 3.1 | 4.2 | ||||||
Participant contributions | 0.8 | 1.0 | ||||||
Currency exchange rates | 2.5 | (17.9 | ) | |||||
Benefits paid | (25.2 | ) | (32.5 | ) | ||||
Fair value of plan assets, end of year | $ | 465.1 | $ | 455.5 | ||||
Funded status: | ||||||||
Projected benefit obligation in excess of plan assets at end of fiscal year | $ | (50.0 | ) | $ | (81.8 | ) | ||
Amounts recognized on the Consolidated Balance Sheets consist of: | ||||||||
Other long-term assets | $ | 5.7 | $ | 1.4 | ||||
Other current liabilities | (1.6 | ) | (1.5 | ) | ||||
Other long-term liabilities | (54.1 | ) | (81.7 | ) | ||||
Net recognized liability | $ | (50.0 | ) | $ | (81.8 | ) | ||
44
The net underfunded status of $50.0 million and $81.8 million at July 31, 2017 and 2016, respectively, is recognized in the accompanying Consolidated Balance Sheets. The pension-related accumulated other comprehensive loss at July 31, 2017 and 2016 (prior to the consideration of income taxes) was $147.7 million and $179.6 million, respectively, and consisted primarily of unrecognized actuarial losses. The loss expected to be recognized in net periodic pension expense during the year ending July 31, 2018 is $4.6 million. The accumulated benefit obligation for all defined benefit pension plans was $495.3 million and $519.0 million at July 31, 2017 and 2016, respectively.
The projected benefit obligation and fair value of plan assets for pension plans with projected benefit obligations in excess of plan assets were $416.8 million and $361.1 million, respectively, as of July 31, 2017, and $433.1 million and $350.0 million, respectively, as of July 31, 2016.
The projected benefit obligation, accumulated benefit obligation and fair value of plan assets for pension plans with accumulated benefit obligations in excess of plan assets were $360.4 million, $360.1 million and $311.0 million, respectively, as of July 31, 2017 and $375.5 million, $377.4 million and $304.4 million, respectively, as of July 31, 2016.
Assumptions
The weighted-average discount rate and rates of increase in future compensation levels used in determining the actuarial present value of the projected benefit obligation are as follows:
Projected Benefit Obligation | Year Ended July 31, | |||||
Weighted average actuarial assumptions | 2017 | 2016 | ||||
All U.S. plans: | ||||||
Discount rate | 3.94 | % | 3.65 | % | ||
Rate of compensation increase (1) | N/A | 2.56 | % | |||
Non-U.S. plans: | ||||||
Discount rate | 2.40 | % | 2.08 | % | ||
Rate of compensation increase | 2.70 | % | 2.69 | % | ||
(1) Compensation increase is no longer applicable due to the freeze of the Salaried Pension Plan effective August 1, 2016.
The weighted-average discount rates, expected returns on plan assets and rates of increase in future compensation levels used to determine the net periodic benefit cost are as follows:
Net Periodic Benefit Cost | Year Ended July 31, | ||||||||
Weighted average actuarial assumptions | 2017 | 2016 | 2015 | ||||||
All U.S. plans: | |||||||||
Discount rate | 3.65 | % | 4.33 | % | 4.33 | % | |||
Expected return on plan assets | 6.90 | % | 6.99 | % | 7.14 | % | |||
Rate of compensation increase | 2.56 | % | 2.56 | % | 2.61 | % | |||
Non-U.S. plans: | |||||||||
Discount rate | 2.08 | % | 3.14 | % | 3.64 | % | |||
Expected return on plan assets | 3.93 | % | 4.83 | % | 5.41 | % | |||
Rate of compensation increase | 2.69 | % | 2.68 | % | 2.79 | % | |||
Discount Rates The Company’s objective in selecting a discount rate is to select the best estimate of the rate at which the benefit obligations could be effectively settled on the measurement date, taking into account the nature and duration of the benefit obligations of the plan. In making this best estimate, the Company looks at rates of return on high-quality, fixed-income investments currently available, and expected to be available, during the period to maturity of the benefits. This process includes looking at the universe of bonds available on the measurement date with a quality rating of Aa or better. Similar appropriate benchmarks are used to determine the discount rate for the non-U.S. plans.
Beginning with its July 31, 2016 measurement date, the Company changed the method used to estimate the service and interest costs for pension and postretirement benefits. The new method utilizes a full yield curve approach to estimate service and interest costs by applying specific spot rates along the yield curve used to determine the benefit obligation of relevant projected cash outflows. Historically, the Company utilized a single weighted average discount rate applied to projected cash outflows. The Company made the change to provide a more precise measurement of service and interest costs by aligning the timing of the plans' liability cash flows to the corresponding spot rate on the yield curve. The change does not impact the measurement of the plans'
45
obligations and did not have a material impact on the Company's pension expense beginning in fiscal 2017. The Company has accounted for this change as a change in accounting estimate.
Expected Long-Term Rate of Return To develop the expected long-term rate of return on assets assumption, the Company considers the historical returns and the future expectations for returns for each asset class, as well as the target asset allocation for each plan. Based on portfolio performance, as of the measurement date of July 31, 2017, the Company's long-term rate of return for the U.S. and non-U.S. pension plans is an asset-based weighted average of 6.58% and 4.19%, respectively. The expected long-term rate of return on assets shown in the pension benefit disclosure for U.S. and non-U.S. plans is an asset-based weighted average of all plans for each category.
Fair Value of Plan Assets
The estimated fair value of U.S. pension plan assets and their respective levels in the fair value hierarchy at July 31, 2017 and 2016 by asset category are as follows (in millions):
U.S Pension Plans | ||||||||||||||||||||
Asset Category | Quoted Prices in Active Markets for Identical Assets (Level 1) | Significant Observable Inputs (Level 2) | Significant Unobservable Inputs (Level 3) | Measured Using NAV Per Share as Practical Expedient | Total | |||||||||||||||
July 31, 2017 | ||||||||||||||||||||
Cash and Cash Equivalents | $ | 1.8 | $ | 3.7 | $ | — | $ | — | $ | 5.5 | ||||||||||
Global Equity Securities | 60.9 | — | — | 80.3 | 141.2 | |||||||||||||||
Fixed Income Securities | 34.9 | 82.5 | — | 34.6 | 152.0 | |||||||||||||||
Real Assets | — | — | — | 5.3 | 5.3 | |||||||||||||||
Total U.S. Assets | $ | 97.6 | $ | 86.2 | $ | — | $ | 120.2 | $ | 304.0 | ||||||||||
July 31, 2016 | ||||||||||||||||||||
Cash and Cash Equivalents | $ | 1.2 | $ | — | $ | — | $ | — | $ | 1.2 | ||||||||||
Global Equity Securities | 62.2 | — | — | 100.2 | 162.4 | |||||||||||||||
Fixed Income Securities | 72.2 | — | — | 47.3 | 119.5 | |||||||||||||||
Real Assets | 5.9 | — | — | 7.9 | 13.8 | |||||||||||||||
Total U.S. Assets | $ | 141.5 | $ | — | $ | — | $ | 155.4 | $ | 296.9 | ||||||||||
Global Equity Securities consists primarily of publicly traded U.S. and non-U.S. equities, Europe, Australasia, Far East (EAFE) index funds, equity private placement funds, private equity investments and some cash and cash equivalents. Publicly traded equities and index funds are valued at the closing price reported in the active market in which the individual securities are traded. Private equity consists of interests in partnerships that invest in U.S. and non-U.S. equity and debt securities. This may include a diversified mix of partnership interests including buyouts, restructured/distressed debt, growth equity, mezzanine/subordinated debt, real estate, special situation partnerships and venture capital investments. Partnership interests are valued at the net asset value (NAV) per share, which is a practical expedient for measuring fair value and thus not classified in the fair value hierarchy. The NAV is determined by the custodian of the fund based on the fair value of the underlying assets owned by the fund less its liabilities then divided by the number of units outstanding.
The target allocations for global equity securities investments were 45% and 40% in the Salaried and Hourly Pension Plans, respectively. The underlying global equity investment managers within the plan will invest primarily in equity securities spanning across market capitalization, geography, style (e.g. value, growth, etc.) and other diversifying characteristics. Managers may invest in common stocks or American Depository Receipts (ADRs), mutual funds, bank or trust company pooled funds, international stocks, stock options for hedging purposes, stock index futures, financial futures for purposes of replicating a major market index and private equity partnerships. The long/short equity managers within global equity may take long or short positions in equity securities and have the ability to shift exposure from net long to net short. Long/short equity managers made up about 5% of the global equity portfolio at year-end and are considered less liquid, as the funds can be partially liquidated on a quarterly basis. Long-only managers are considered liquid. The long-only investments are typically valued daily, while long/short equity is valued on a monthly basis. Private equity is considered illiquid and performance is typically valued on a quarterly basis. The underlying assets, however, may be valued less frequently, such as annually or if and when a potential buyer is identified and has submitted a bid to similar types of investments.
Fixed Income Securities consists primarily of investment and non-investment grade debt securities, debt securities issued by the U.S. Treasury and alternative fixed income-like investments. Government, corporate and other bonds and notes are valued at the closing price reported if traded on an active market or at yields currently available on comparable securities of issuers with
46
similar credit ratings. Alternative fixed income-like investments consist primarily of private partnership interests in hedge funds of funds. Partnership interests are valued using the NAV as determined by the administrator or custodian of the fund.
The target allocations for fixed income securities were 52% and 57% in the Salaried and Hourly Pension Plans, respectively. The Fixed Income class may invest in debt securities issued or guaranteed by the U.S., its agencies or instrumentalities (including U.S. Government Agency mortgage backed securities), or other investment grade rated debt issued by foreign governments; corporate bonds, debentures and other forms of corporate debt obligations, including equipment trust certificates; indexed notes, floaters and other variable rate obligations; bank collective funds; mutual funds; insurance company pooled funds and guaranteed investments; futures and options for the purpose of yield curve management; and private debt investments. Fixed income risk is driven by various factors including, but not limited to, interest rate levels and changes, credit risk and duration. Current fixed income securities are considered liquid, with daily pricing and liquidity. The fixed income class is also invested in a variety of alternative investments. Alternative investments cover a variety of traditional and non-traditional investments and investment strategies, spanning various levels of risk and return. These investments can be made in a broad array of non-traditional investment strategies (including, but not limited to, commodities and futures, distressed securities, short/long—or both—fixed income, international opportunities and relative value) with multiple hedge fund managers. Alternative investments are considered less liquid to illiquid. The liquidity ranges from quarterly to semi-annually and illiquid. Alternative investments are typically valued on a quarterly basis.
Real Assets consists of funds and interests in partnerships that invest in private real estate, commodities and timber investments. Interests in partnerships are valued using the NAV from the most recent partnership statement, updated for any subsequent partnership interests’ cash flows. Funds are valued at the closing price reported in the active market in which it is traded.
The target allocation for real assets was 2% for both the Salaried and Hourly Pension Plans. The fund invests in real assets to provide a hedge against unexpected inflation, to capture unique sources of returns and to provide diversification benefits. The fund pursues a real asset strategy through a fund of funds, private investments and/or a direct investment program that may invest long, short or both, in assets including, but not limited to, domestic and international properties, buildings and developments, timber and/or commodities. Real asset manager performance is typically reported quarterly, though underlying assets may be valued less frequently.
The target allocation for cash and cash equivalents was 1% for both the Salaried and Hourly Pension Plans. Cash and cash equivalents consist of deposit accounts and highly liquid temporary investments with an original maturity of three months or less.
The estimated fair values of non-U.S. pension plan assets and their respective levels in the fair value hierarchy at July 31, 2017 and 2016 by asset category are as follows (in millions):
Non-U.S. Pension Plans | ||||||||||||||||
Asset Category | Quoted Prices in Active Markets for Identical Assets (Level 1) | Significant Observable Inputs (Level 2) | Significant Unobservable Inputs (Level 3) | Total | ||||||||||||
July 31, 2017 | ||||||||||||||||
Cash and Cash Equivalents | $ | 0.9 | $ | — | $ | — | $ | 0.9 | ||||||||
Global Equity Securities | 79.7 | — | — | 79.7 | ||||||||||||
Fixed Income Securities | 11.9 | 34.3 | — | 46.2 | ||||||||||||
Insurance Contracts | — | — | 34.3 | 34.3 | ||||||||||||
Total Non-U.S. Assets | $ | 92.5 | $ | 34.3 | $ | 34.3 | $ | 161.1 | ||||||||
July 31, 2016 | ||||||||||||||||
Cash and Cash Equivalents | $ | 0.5 | $ | — | $ | — | $ | 0.5 | ||||||||
Global Equity Securities | 69.2 | — | — | 69.2 | ||||||||||||
Fixed Income Securities | 4.6 | 35.8 | — | 40.4 | ||||||||||||
Equity/Fixed Income | 16.7 | — | 31.8 | 48.5 | ||||||||||||
Total Non-U.S. Assets | $ | 91.0 | $ | 35.8 | $ | 31.8 | $ | 158.6 | ||||||||
Global Equity Securities consists of publicly traded diversified growth funds invested across a broad range of traditional and alternative asset classes that may include, but are not limited to: equities, investment grade and high yield bonds, property, private equity, infrastructure, commodities and currencies. They may invest directly or hold up to 100% of the fund in other collective investment vehicles and may use exchange traded and over-the-counter financial derivatives, such as currency forwards or futures, for both investment as well as hedging purposes.
47
Fixed Income Securities consists primarily of investment grade debt securities and bond funds. Corporate bonds and notes are valued at either the yields currently available on comparable securities of issuers with similar credit ratings or valued under a discounted cash flows approach that maximizes observable inputs, such as current yields of similar instruments, but can include adjustments for certain risks that may not be observable such as credit and liquidity risks. The bond funds are traded on an active market and are valued at the closing price reported. These holdings may also aim to provide liability hedging by offering interest rate and inflation protections that replicates the liability profile of a typical defined benefit pension scheme.
Insurance Contracts are individual contracts that the Company does not have any influence on the investment decisions as made by the insurer due to the specific minimum guaranteed return characteristics of this type of contract. European insurers, in general, broadly have a strategic asset allocation with 80% to 90% fixed income products and 10% to 20% equity type products (including real estate).
The following table summarizes the changes in the fair values of the non-U.S. pension plans’ Level 3 assets for the years ended July 31, 2017, 2016 and 2015 (in millions):
Non-U.S. Pension Plans | ||||
Ending balance at July 31, 2014 | $ | 30.5 | ||
Unrealized gains | 1.3 | |||
Foreign currency exchange | (5.5 | ) | ||
Purchases | 2.7 | |||
Sales | (0.8 | ) | ||
Ending balance at July 31, 2015 | $ | 28.2 | ||
Unrealized gains | 2.7 | |||
Foreign currency exchange | 0.3 | |||
Purchases | 2.7 | |||
Sales | (2.1 | ) | ||
Ending balance at July 31, 2016 | $ | 31.8 | ||
Unrealized gains | 1.2 | |||
Foreign currency exchange | 1.7 | |||
Purchases | 1.0 | |||
Sales | (1.4 | ) | ||
Ending balance at July 31, 2017 | $ | 34.3 | ||
Investment Policies and Strategies
For the Company’s U.S. pension plans, the Company uses a total return investment approach to achieve a long-term return on plan assets, with what the Company believes to be a prudent level of risk for the purpose of meeting its retirement income commitments to employees. The plans’ investments are diversified to assist in managing risk. During the year ended July 31, 2017, the Company’s asset allocation guidelines targeted an allocation of 45% global equity securities, 52% fixed income, 2% real assets (investments into funds containing commodities and real estate) and 1% cash and cash equivalents for the Salaried Pension Plan and 40% global equity securities, 57% fixed income, 2% real assets (investments in funds containing commodities and real estate) and 1% cash for the Hourly Pension Plan. These target allocation guidelines are determined in consultation with the Company’s investment consultant and through the use of modeling the risk/return trade-offs among asset classes utilizing assumptions about expected annual return, expected volatility/standard deviation of returns and expected correlations with other asset classes.
For the Company’s non-U.S. plans, the general investment objectives are to maintain a suitably diversified portfolio of secure assets of appropriate liquidity that will generate income and capital growth to meet, together with any new contributions from members and the Company, the cost of current and future benefits. Investment policy and performance is measured and monitored on an ongoing basis by the Company’s Investment Committee through its use of an investment consultant and through quarterly investment portfolio reviews.
Estimated Contributions and Future Payments
The Company’s general funding policy for its pension plans is to make at least the minimum contributions as required by applicable regulations. Additionally, the Company may elect to make additional contributions up to the maximum tax deductible contribution. The Company made contributions of $1.6 million to its U.S. pension plans during the year ended July 31, 2017. The estimated minimum funding requirement for the Company’s U.S. plans for the year ending July 31, 2018 is $3.7 million. In
48
accordance with the Pension Protection Act of 2006, this contribution obligation may be met with existing credit balances that resulted from payments above the minimum obligation in prior years. The Company plans to utilize existing credit balances to meet the minimum obligation for fiscal 2018 of its U.S. pension plans. The Company made contributions of $1.5 million to its non-U.S. pension plans during the year ended July 31, 2017 and estimates that it will contribute approximately $1.3 million in the year ended July 31, 2018 based upon the local government prescribed funding requirements. Future estimates of the Company’s pension plan contributions may change significantly depending on the actual rate of return on plan assets, discount rates and regulatory requirements.
The estimated future benefit payments for the Company’s U.S. and non-U.S. plans are as follows (in millions):
Year Ending July 31, | Estimated Future Benefit Payments | |||
2018 | $ | 28.9 | ||
2019 | 26.8 | |||
2020 | 28.4 | |||
2021 | 28.6 | |||
2022 | 27.5 | |||
2022-2026 | 144.4 | |||
Retirement Savings and Employee Stock Ownership Plan
The Company provides a contributory employee savings plan to U.S. employees that permits participants to make contributions by salary reduction pursuant to section 401(k) of the Internal Revenue Code. Employee contributions of up to 25% of compensation are matched at a rate equaling 100% of the first 3% contributed and 50% of the next 2% contributed. In addition, the Company contributes 3.0% of compensation annually. Total contribution expense for these plans was $20.1 million, $8.2 million and $8.6 million for the years ended July 31, 2017, 2016 and 2015, respectively. This plan also includes shares from an Employee Stock Ownership Plan (ESOP). As of July 31, 2017, all shares of the ESOP have been allocated to participants. Total ESOP shares are considered to be shares outstanding for diluted earnings per share calculations.
Deferred Compensation and Other Benefit Plans
The Company provides various deferred compensation and other benefit plans to certain executives. The deferred compensation plan allows these employees to defer the receipt of all of their bonus and other stock-related compensation and up to 75% of their salary to future periods. Other benefit plans are provided to supplement the benefits for a select group of highly compensated individuals that are reduced because of compensation limitations set by the Internal Revenue Code. The Company has recorded a liability of $6.5 million and $8.6 million as of July 31, 2017 and 2016, respectively, related primarily to its deferred compensation plans.
NOTE 12. Income Taxes
The components of earnings before income taxes are as follows (in millions):
Year Ended July 31, | ||||||||||||
2017 | 2016 | 2015 | ||||||||||
Earnings before income taxes: | ||||||||||||
United States | $ | 109.8 | $ | 90.7 | $ | 92.4 | ||||||
Foreign | 212.2 | 166.7 | 196.2 | |||||||||
Total | $ | 322.0 | $ | 257.4 | $ | 288.6 | ||||||
49
The components of the provision for income taxes are as follows (in millions):
Year Ended July 31, | ||||||||||||
2017 | 2016 | 2015 | ||||||||||
Income tax provision (benefit): | ||||||||||||
Current | ||||||||||||
Federal | $ | 38.9 | $ | 19.9 | $ | 28.5 | ||||||
State | 4.3 | 3.1 | 2.9 | |||||||||
Foreign | 56.6 | 46.9 | 54.7 | |||||||||
99.8 | 69.9 | 86.1 | ||||||||||
Deferred | ||||||||||||
Federal | (7.7 | ) | (0.3 | ) | (4.2 | ) | ||||||
State | (0.4 | ) | (0.2 | ) | 0.1 | |||||||
Foreign | (2.5 | ) | (2.8 | ) | (1.5 | ) | ||||||
(10.6 | ) | (3.3 | ) | (5.6 | ) | |||||||
Total | $ | 89.2 | $ | 66.6 | $ | 80.5 | ||||||
The following table reconciles the U.S. statutory income tax rate with the effective income tax rate:
Year Ended July 31, | |||||||||
2017 | 2016 | 2015 | |||||||
Statutory U.S. federal rate | 35.0 | % | 35.0 | % | 35.0 | % | |||
State income taxes | 0.9 | % | 0.8 | % | 0.9 | % | |||
Foreign operations | (8.3 | )% | (8.1 | )% | (7.9 | )% | |||
Export, manufacturing and research credits | (1.1 | )% | (1.6 | )% | (1.1 | )% | |||
Change in unrecognized tax benefits | 1.0 | % | (1.0 | )% | 1.3 | % | |||
Other | 0.2 | % | 0.8 | % | (0.3 | )% | |||
Effective income tax rate | 27.7 | % | 25.9 | % | 27.9 | % | |||
The tax effects of temporary differences that give rise to deferred tax assets and liabilities are as follows (in millions):
July 31, | ||||||||
2017 | 2016 | |||||||
Deferred tax assets: | ||||||||
Accrued expenses | $ | 16.5 | $ | 12.1 | ||||
Compensation and retirement plans | 56.2 | 59.5 | ||||||
NOL and tax credit carryforwards | 8.5 | 6.5 | ||||||
LIFO and inventory reserves | 3.0 | 5.4 | ||||||
Other | 6.9 | 4.0 | ||||||
Gross deferred tax assets | 91.1 | 87.5 | ||||||
Valuation allowance | (5.2 | ) | (3.3 | ) | ||||
Net deferred tax assets | 85.9 | 84.2 | ||||||
Deferred tax liabilities: | ||||||||
Depreciation and amortization | (58.8 | ) | (57.5 | ) | ||||
Other | (0.4 | ) | (1.2 | ) | ||||
Deferred tax liabilities | (59.2 | ) | (58.7 | ) | ||||
Net tax asset | $ | 26.7 | $ | 25.5 | ||||
50
The Company has not provided for U.S. income taxes on undistributed earnings of its non-U.S. subsidiaries of approximately $1.1 billion. The Company currently intends to indefinitely reinvest these undistributed earnings as there are significant investment opportunities outside the U.S. If any portion were to be distributed, the related U.S. tax liability may be reduced by foreign income taxes paid on those earnings plus any available foreign tax credit carryovers. Determination of the unrecognized deferred tax liability related to these undistributed earnings is not practicable. In fiscal 2017, the Company repatriated $67.1 million of cash held by its foreign subsidiaries in the form of a cash dividend, which represented total planned dividends for the current year and which consisted entirely of current year earnings.
A reconciliation of the beginning and ending amount of gross unrecognized tax benefits is as follows (in millions):
Year Ended July 31, | ||||||||||||
2017 | 2016 | 2015 | ||||||||||
Gross unrecognized tax benefits at beginning of fiscal year | $ | 15.7 | $ | 18.2 | $ | 15.0 | ||||||
Additions for tax positions of the current year | 3.9 | 3.4 | 4.7 | |||||||||
Additions for tax positions of prior years | 0.1 | 0.1 | 0.1 | |||||||||
Reductions for tax positions of prior years | (0.1 | ) | (4.9 | ) | (0.6 | ) | ||||||
Settlements | 0.3 | (0.1 | ) | — | ||||||||
Reductions due to lapse of applicable statute of limitations | (1.1 | ) | (1.0 | ) | (1.0 | ) | ||||||
Gross unrecognized tax benefits at end of fiscal year | $ | 18.8 | $ | 15.7 | $ | 18.2 | ||||||
The Company recognizes interest and penalties accrued related to unrecognized tax benefits in income tax expense. During the year ended July 31, 2017, the Company recognized interest expense, net of tax benefit, of approximately $0.4 million. At July 31, 2017 and 2016, accrued interest and penalties on a gross basis were $2.3 million and $1.8 million, respectively.
The Company files income tax returns in the U.S. federal jurisdiction and various state and foreign jurisdictions. With few exceptions, the Company is no longer subject to state and foreign income tax examinations by tax authorities for years before 2008. The IRS has completed examinations of the Company’s U.S. federal income tax returns through 2013. Currently, the Company is under examination by the IRS for fiscal years 2015 and 2016, and while there are not any significant adjustments proposed, the overall examination is still ongoing. At this time, the Company has not received direct information on any matters for which the Company does not believe it is already adequately reserved or for which it believes its tax positions are not supportable.
If the Company were to prevail on all unrecognized tax benefits recorded, substantially all of the unrecognized tax benefits would benefit the effective tax rate. With an average statute of limitations of approximately 5 years, up to $2.6 million of the unrecognized tax benefits could potentially expire in the next 12-month period, unless extended by audit. It is possible that quicker-than-expected settlement of either current or future audits and disputes would cause additional reversals of previously recorded reserves in the next 12-month period. Quantification of an estimated range and timing of future audit settlements cannot be made at this time.
NOTE 13. Fair Value Measurements
Fair value measurements of financial instruments are reported in one of three levels based on the lowest level of significant input used as follows:
Level 1 | Inputs to the fair value measurement are quoted prices in active markets for identical assets or liabilities. |
Level 2 | Inputs to the fair value measurement include quoted prices in active markets for similar assets or liabilities, quoted prices for identical or similar assets or liabilities in markets that are not active and inputs other than quoted prices that are observable for the asset or liability, either directly or indirectly. |
Level 3 | Inputs to the fair value measurement are unobservable inputs or valuation techniques. |
At July 31, 2017 and 2016, the carrying values of cash and cash equivalents, accounts receivables, short-term borrowings and trade accounts payable approximate fair value because of the short-term nature of these instruments. As of July 31, 2017, the estimated fair value of long-term debt with fixed interest rates was $330.6 million compared to its carrying value of $325.0 million. As of July 31, 2016, the estimated fair value of long-term debt with fixed interest rates was $394.4 million compared to its carrying value of $375.0 million. The fair value is estimated by discounting the projected cash flows using the rate that similar amounts of debt could currently be borrowed. Long-term debt would be classified as Level 2 in the fair value hierarchy. The carrying values of long-term debt with variable interest rates approximate fair value.
51
Derivative contracts are reported at their fair values based on third-party quotes. The fair values of the Company’s financial assets and liabilities listed below reflect the amounts that would be received to sell the assets or paid to transfer the liabilities in an orderly transaction between market participants at the measurement date (exit price). The fair values are based on inputs other than quoted prices that are observable for the asset or liability. These inputs include foreign currency exchange rates and interest rates. The financial assets and liabilities are primarily valued using standard calculations and models that use as their basis readily observable market parameters. Industry standard data providers are the primary source for forward and spot rate information for both interest rates and currency rates.
The following summarizes the Company’s fair value of outstanding derivative contracts at July 31, 2017 and 2016, included in the accompanying Consolidated Balance Sheets (in millions):
Significant Other Observable Inputs (Level 2) | ||||||||
July 31, | ||||||||
2017 | 2016 | |||||||
Assets | ||||||||
Prepaids and other current assets | ||||||||
Foreign exchange contracts | $ | 2.1 | $ | 1.1 | ||||
Liabilities | ||||||||
Other current liabilities | ||||||||
Foreign exchange contracts | (5.5 | ) | (2.4 | ) | ||||
Forward exchange contracts - net liability position | $ | (3.4 | ) | $ | (1.3 | ) | ||
The Company holds equity method investments, which are classified in other long-term assets in the accompanying Consolidated Balance Sheets. The aggregate carrying amount of these investments was $19.0 million and $18.7 million as of July 31, 2017 and 2016, respectively. These equity method investments are measured at fair value on a nonrecurring basis. The fair value of the Company’s equity method investments has not been estimated as there have been no identified events or changes in circumstance that would have had an adverse impact on the value of these investments. In the event that these investments were required to be measured, these investments would fall within Level 3 of the fair value hierarchy, due to the use of significant unobservable inputs to determine fair value, as the investments are in privately-held entities or divisions of public companies without quoted market prices.
Goodwill is assessed for impairment annually or more frequently if an event occurs or circumstances change that would indicate the asset may be impaired. Definite-lived intangible assets are subject to impairment assessments as triggering events occur that could indicate that the asset may be impaired. The Company’s goodwill and intangible assets are not recorded at fair value as there have been no events or circumstances that would have an adverse impact on the value of these assets. In the event that an impairment was recognized, the fair value would be classified within Level 3 of the fair value hierarchy. Refer to Note 5 for further discussion of the annual goodwill impairment analysis and carrying values of goodwill and other intangible assets.
The Company assesses the impairment of property, plant and equipment whenever events or changes in circumstances indicate that the carrying amount of property, plant and equipment assets may not be recoverable. There were no material impairment charges recorded during the years ended July 31, 2017, 2016 and 2015.
NOTE 14. Shareholders’ Equity
Stock Compensation Plans The Stock Compensation Plans in the Consolidated Statements of Changes in Shareholders’ Equity consist of amounts payable to eligible participants for stock compensation that was deferred to a Rabbi Trust pursuant to the provisions of the 2010 Master Stock Incentive Plan, as well as performance awards payable in common stock discussed further in Note 10.
52
Treasury Stock The Company's Board of Directors authorized the repurchase of up to 14.0 million shares of common stock under the Company’s stock repurchase plan dated May 29, 2015. This repurchase authorization is effective until terminated by the Board of Directors. As of July 31, 2017, the Company had remaining authorization to repurchase 7.2 million shares under this plan. Treasury stock share activity for the years ended July 31, 2017 and 2016 is summarized as follows:
Year Ended July 31, | ||||||
2017 | 2016 | |||||
Beginning balance | 18,750,503 | 17,044,950 | ||||
Stock repurchases | 3,330,357 | 2,540,000 | ||||
Net issuance upon exercise of stock options | (944,556 | ) | (764,756 | ) | ||
Issuance under compensation plans | (91,817 | ) | (59,787 | ) | ||
Other activity | (7,134 | ) | (9,904 | ) | ||
Ending balance | 21,037,353 | 18,750,503 | ||||
NOTE 15. Accumulated Other Comprehensive Loss
Changes in accumulated other comprehensive loss by component for the years ended July 31, 2017 and 2016 are as follows (in millions):
Foreign currency translation adjustment (1) | Pension benefits | Derivative financial instruments | Total | ||||||||||||||
Balance as of July 31, 2016, net of tax | $ | (89.3 | ) | $ | (115.8 | ) | $ | (0.5 | ) | $ | (205.6 | ) | |||||
Other comprehensive income (loss) before reclassifications and tax | 30.5 | 24.8 | (2.4 | ) | 52.9 | ||||||||||||
Tax (expense) benefit | — | (8.7 | ) | 0.8 | (7.9 | ) | |||||||||||
Other comprehensive income (loss) before reclassifications, net of tax | 30.5 | 16.1 | (1.6 | ) | 45.0 | ||||||||||||
Reclassifications, before tax | — | 7.1 | (1.4 | ) | 5.7 | ||||||||||||
Tax (expense) benefit | — | (2.5 | ) | 0.4 | (2.1 | ) | |||||||||||
Reclassifications, net of tax | — | 4.6 | (3) | (1.0 | ) | (2) | 3.6 | ||||||||||
Other comprehensive income (loss), net of tax | 30.5 | 20.7 | (2.6 | ) | 48.6 | ||||||||||||
Balance as of July 31, 2017, net of tax | $ | (58.8 | ) | $ | (95.1 | ) | $ | (3.1 | ) | $ | (157.0 | ) | |||||
Balance as of July 31, 2015, net of tax | $ | (70.8 | ) | $ | (90.6 | ) | $ | (0.6 | ) | $ | (162.0 | ) | |||||
Other comprehensive loss before reclassifications and tax | (18.5 | ) | (55.4 | ) | (0.4 | ) | (74.3 | ) | |||||||||
Tax benefit | — | 19.4 | 0.1 | 19.5 | |||||||||||||
Other comprehensive loss before reclassifications, net of tax | (18.5 | ) | (36.0 | ) | (0.3 | ) | (54.8 | ) | |||||||||
Reclassifications, before tax | — | 15.8 | 0.6 | 16.4 | |||||||||||||
Tax expense | — | (5.0 | ) | (0.2 | ) | (5.2 | ) | ||||||||||
Reclassifications, net of tax | — | 10.8 | (3) | 0.4 | (2) | 11.2 | |||||||||||
Other comprehensive (loss) income, net of tax | (18.5 | ) | (25.2 | ) | 0.1 | (43.6 | ) | ||||||||||
Balance as of July 31, 2016, net of tax | $ | (89.3 | ) | $ | (115.8 | ) | $ | (0.5 | ) | $ | (205.6 | ) | |||||
(1) | Taxes are not provided on cumulative translation adjustments as substantially all translation adjustments relate to earnings that are intended to be indefinitely reinvested outside the U.S. |
(2) | Relates to foreign currency cash flow hedges that were reclassified from accumulated other comprehensive loss to other income, net (see Note 1). |
(3) | Primarily includes net amortization of prior service costs and actuarial losses included in net periodic benefit cost (see Note 11) that were reclassified from accumulated other comprehensive loss to operating expenses or cost of sales. |
53
NOTE 16. Guarantees
The Company and Caterpillar Inc. equally own the shares of Advanced Filtration Systems Inc. (AFSI), an unconsolidated joint venture and guarantee certain debt of the joint venture. As of July 31, 2017 and 2016, AFSI had $27.8 million and $24.8 million, respectively, of outstanding debt, of which the Company guarantees half. In addition, during the years ended July 31, 2017, 2016 and 2015, the Company recorded earnings (losses) from this equity method investment of $2.1 million, $(0.7) million and $2.3 million and royalty income of $5.9 million, $5.1 million and $5.8 million, respectively.
At July 31, 2017 and 2016, the Company had a contingent liability for standby letters of credit totaling $10.5 million and $7.3 million, respectively, that have been issued and are outstanding. The letters of credit guarantee payment to third parties in the event the Company is in breach of contract terms as detailed in each letter of credit. At July 31, 2017 and 2016, there were no amounts drawn upon these letters of credit.
NOTE 17. Commitments and Contingencies
Operating Leases The Company enters into operating leases primarily for office and warehouse facilities, production and non-production equipment, automobiles and computer equipment. Total expense recorded under operating leases for years ended July 31, 2017, 2016 and 2015, was $28.7 million, $25.4 million and $28.1 million, respectively.
As of July 31, 2017, the estimated future minimum lease payments under operating leases are as follows (in millions):
Year Ending July 31, | Operating Leases | |||
2018 | $ | 9.7 | ||
2019 | 6.2 | |||
2020 | 3.1 | |||
2021 | 1.4 | |||
2022 | 0.7 | |||
Thereafter | 1.7 | |||
Total future minimum lease payments | $ | 22.8 | ||
Litigation The Company records provisions with respect to identified claims or lawsuits when it is probable that a liability has been incurred and the amount of the loss can be reasonably estimated. Claims and lawsuits are reviewed quarterly and provisions are taken or adjusted to reflect the status of a particular matter. The Company believes the recorded estimated liability in its Consolidated Financial Statements is adequate in light of the probable and estimable outcomes. The recorded liabilities were not material to the Company’s results of operations, liquidity or financial position and the Company believes it is remote that the settlement of any of the currently identified claims or litigation will be materially in excess of what is accrued.
NOTE 18. Segment Reporting
The Company has identified two reportable segments: Engine Products and Industrial Products. Segment determination is based on the internal organization structure, management of operations and performance evaluation by management and the Company’s Board of Directors.
The Engine Products segment sells to OEMs in the construction, mining, agriculture, aerospace, defense and truck end markets and to independent distributors, OEM dealer networks, private label accounts and large equipment fleets. Products include replacement filters for both air and liquid filtration applications, air filtration systems, liquid filtration systems for fuel, lube and hydraulic applications, and exhaust and emissions systems.
The Industrial Products segment sells to various dealers, distributors, OEMs of gas-fired turbines and OEMs and end users requiring clean air filtration solutions and replacement filters. Products include dust, fume and mist collectors, compressed air purification systems, air filtration systems for gas turbines, PTFE membrane-based products and specialized air and gas filtration systems for applications including hard disk drives and semi-conductor manufacturing.
Corporate and Unallocated includes corporate expenses determined to be non-allocable to the segments, such as interest income and interest expense. Assets included in Corporate and Unallocated are principally cash and cash equivalents, inventory reserves, certain prepaids, certain investments, other assets and assets allocated to general corporate purposes.
The Company has an internal measurement system to evaluate performance and allocate resources based on earnings before income taxes. The Company’s manufacturing facilities serve both reporting segments. Therefore, the Company uses an allocation methodology to assign costs and assets to the segments. A certain amount of costs and assets relate to general corporate purposes and are not assigned to either segment. The accounting policy applied to inventory for the reportable segments differs from that
54
described in the summary of significant accounting policies. The reportable segments account for inventory on a standard cost basis, which is consistent with the Company's internal reporting.
Segment allocated assets are primarily accounts receivable, inventories, property, plant and equipment and goodwill. Reconciling items included in Corporate and Unallocated are created based on accounting differences between segment reporting and the consolidated external reporting as well as internal allocation methodologies.
The Company is an integrated enterprise, characterized by substantial intersegment cooperation, cost allocations and sharing of assets. Therefore, the Company does not represent that these segments, if operated independently, would report the earnings before income taxes and other financial information shown below.
Segment detail is summarized as follows (in millions):
Engine Products | Industrial Products | Corporate and Unallocated | Total Company | |||||||||||||
Fiscal 2017 | ||||||||||||||||
Net sales | $ | 1,553.3 | $ | 818.6 | $ | — | $ | 2,371.9 | ||||||||
Depreciation and amortization | 33.9 | 26.7 | 14.6 | 75.2 | ||||||||||||
Equity earnings in unconsolidated affiliates | 4.4 | 0.6 | — | 5.0 | ||||||||||||
Earnings (loss) before income taxes | 219.7 | 129.1 | (26.8 | ) | 322.0 | |||||||||||
Assets | 849.6 | 638.3 | 491.8 | 1,979.7 | ||||||||||||
Equity investments in unconsolidated affiliates | 14.8 | 4.2 | — | 19.0 | ||||||||||||
Capital expenditures | 29.7 | 23.4 | 12.8 | 65.9 | ||||||||||||
Fiscal 2016 | ||||||||||||||||
Net sales | $ | 1,391.3 | $ | 829.0 | $ | — | $ | 2,220.3 | ||||||||
Depreciation and amortization | 38.5 | 28.1 | 8.3 | 74.9 | ||||||||||||
Equity earnings in unconsolidated affiliates | 1.0 | 1.2 | — | 2.2 | ||||||||||||
Earnings (loss) before income taxes | 163.5 | 119.0 | (25.1 | ) | 257.4 | |||||||||||
Assets | 841.4 | 646.9 | 298.7 | 1,787.0 | ||||||||||||
Equity investments in unconsolidated affiliates | 14.3 | 4.4 | — | 18.7 | ||||||||||||
Capital expenditures | 37.5 | 27.3 | 8.1 | 72.9 | ||||||||||||
Fiscal 2015 | ||||||||||||||||
Net sales | $ | 1,484.1 | $ | 887.1 | $ | — | $ | 2,371.2 | ||||||||
Depreciation and amortization | 43.3 | 26.4 | 4.6 | 74.3 | ||||||||||||
Equity earnings in unconsolidated affiliates | 4.1 | 1.0 | — | 5.1 | ||||||||||||
Earnings (loss) before income taxes | 186.3 | 123.3 | (21.0 | ) | 288.6 | |||||||||||
Assets | 887.7 | 634.0 | 285.8 | 1,807.5 | ||||||||||||
Equity investments in unconsolidated affiliates | 15.1 | 3.2 | — | 18.3 | ||||||||||||
Capital expenditures | 54.6 | 33.4 | 5.8 | 93.8 | ||||||||||||
55
Net sales by product group within the Engine Products segment and Industrial Products segment is summarized as follows (in millions):
Year Ended July 31, | ||||||||||||
2017 | 2016 | 2015 | ||||||||||
Engine Products segment: | ||||||||||||
Off-Road | $ | 252.1 | $ | 216.6 | $ | 261.1 | ||||||
On-Road | 110.7 | 127.2 | 138.4 | |||||||||
Aftermarket | 1,086.2 | 951.5 | 980.7 | |||||||||
Aerospace and Defense | 104.3 | 96.0 | 103.9 | |||||||||
Total Engine Products segment | 1,553.3 | 1,391.3 | 1,484.1 | |||||||||
Industrial Products segment: | ||||||||||||
Industrial Filtration Solutions | 533.2 | 517.9 | 529.0 | |||||||||
Gas Turbine Systems | 122.9 | 149.6 | 186.9 | |||||||||
Special Applications | 162.5 | 161.5 | 171.2 | |||||||||
Total Industrial Products segment | 818.6 | 829.0 | 887.1 | |||||||||
Total Company | $ | 2,371.9 | $ | 2,220.3 | $ | 2,371.2 | ||||||
Net sales by origination and property, plant and equipment by geographic region are summarized as follows (in millions):
Net Sales (1) | Property, Plant and Equipment, Net | |||||||
Fiscal 2017 | ||||||||
United States | $ | 990.1 | $ | 192.7 | ||||
Europe | 638.1 | 163.3 | ||||||
Asia Pacific | 500.5 | 55.3 | ||||||
Other | 243.2 | 73.3 | ||||||
Total | $ | 2,371.9 | $ | 484.6 | ||||
Fiscal 2016 | ||||||||
United States | $ | 937.3 | $ | 192.9 | ||||
Europe | 632.7 | 148.1 | ||||||
Asia Pacific | 449.9 | 60.1 | ||||||
Other | 200.4 | 68.7 | ||||||
Total | $ | 2,220.3 | $ | 469.8 | ||||
Fiscal 2015 | ||||||||
United States | $ | 1,007.3 | $ | 209.0 | ||||
Europe | 671.3 | 141.7 | ||||||
Asia Pacific | 470.7 | 63.8 | ||||||
Other | 221.9 | 56.1 | ||||||
Total | $ | 2,371.2 | $ | 470.6 | ||||
(1) | Net sales by origination is based on the country of the Company's legal entity where the customer's order was placed. |
Concentrations There were no customers that accounted for over 10% of net sales during the years ended July 31, 2017, 2016 or 2015. There were no customers that accounted for over 10% of gross accounts receivable at July 31, 2017 or July 31, 2016.
56
NOTE 19. Quarterly Financial Information (Unaudited)
Unaudited consolidated quarterly financial information for the years ended July 31, 2017 and 2016 is as follows (in millions, except per share amounts):
First Quarter | Second Quarter | Third Quarter | Fourth Quarter | |||||||||||||
Fiscal 2017 | ||||||||||||||||
Net sales | $ | 553.0 | $ | 550.6 | $ | 608.2 | $ | 660.1 | ||||||||
Gross profit | 194.2 | 187.9 | 211.5 | 229.5 | ||||||||||||
Net earnings | 58.0 | 46.5 | 60.1 | 68.2 | ||||||||||||
Net earnings per share – basic | 0.43 | 0.35 | 0.45 | 0.52 | ||||||||||||
Net earnings per share – diluted | 0.43 | 0.35 | 0.45 | 0.51 | ||||||||||||
Dividends declared per share | 0.175 | 0.175 | 0.175 | 0.180 | ||||||||||||
Dividends paid per share | 0.175 | 0.175 | 0.175 | 0.175 | ||||||||||||
Fiscal 2016 | ||||||||||||||||
Net sales | $ | 538.0 | $ | 517.2 | $ | 571.3 | $ | 593.8 | ||||||||
Gross profit | 178.1 | 170.8 | 196.6 | 209.3 | ||||||||||||
Net earnings | 38.5 | 38.0 | 54.8 | 59.5 | ||||||||||||
Net earnings per share – basic | 0.29 | 0.28 | 0.41 | 0.44 | ||||||||||||
Net earnings per share – diluted | 0.29 | 0.28 | 0.41 | 0.44 | ||||||||||||
Dividends declared per share | 0.170 | 0.170 | 0.175 | 0.175 | ||||||||||||
Dividends paid per share | 0.170 | 0.170 | 0.170 | 0.175 | ||||||||||||
Item 9. Changes in and Disagreements with Accountants on Accounting and Financial Disclosure
None.
Item 9A. Controls and Procedures
Evaluation of Disclosure Controls and Procedures
Management of the Company, with the participation of its Chief Executive Officer and the Chief Financial Officer, evaluated the effectiveness of the Company’s disclosure controls and procedures as of the end of the period. Based on their evaluation, as of the end of the period covered, the Company’s Chief Executive Officer and Chief Financial Officer concluded that the Company’s disclosure controls and procedures (as defined in Rules 13a-15(e) and 15d-15(e) under the Exchange Act) were effective. The Company’s disclosure controls and procedures are designed so that information required to be disclosed by the issuer in the reports that it files or submits under the Exchange Act is recorded, processed, summarized and reported within the time periods specified in the Securities and Exchange Commission’s rules and forms, and that such information is accumulated and communicated to management of the Company, with the participation of its Chief Executive Officer and Chief Financial Officer, as appropriate to allow timely decisions regarding required disclosure.
Changes in Internal Control over Financial Reporting
No change in the Company's internal control over financial reporting (as defined by Rules 13a-15(f) under the Exchange Act) occurred during the fiscal quarter ended July 31, 2017, that has materially affected, or is reasonably likely to materially affect, the Company's internal control over financial reporting.
Management’s Report on Internal Control over Financial Reporting
See Management’s Report on Internal Control over Financial Reporting under Item 8 of this Annual Report.
Report of Independent Registered Public Accounting Firm
See Report of Independent Registered Public Accounting Firm under Item 8 of this Annual Report.
Item 9B. Other Information
None.
57
PART III
Item 10. Directors, Executive Officers and Corporate Governance
The information under the captions “Item 1: Election of Directors”; “Director Selection Process,” “Audit Committee,” “Audit Committee Expertise; Complaint-Handling Procedures,” and “Section 16(a) Beneficial Ownership Reporting Compliance” of the 2017 Proxy Statement is incorporated herein by reference. Information on the Executive Officers of the Company is found under the caption “Executive Officers of the Registrant” in Part I of this Annual Report.
The Company has adopted a code of business conduct and ethics in compliance with applicable rules of the Securities and Exchange Commission that applies to its Principal Executive Officer, its Principal Financial Officer and its Principal Accounting Officer or Controller or persons performing similar functions. A copy of the code of business conduct and ethics is posted on the Company’s website at ir.donaldson.com. The code of business conduct and ethics is available in print, free of charge, to any shareholder who requests it. The Company will disclose any amendments to or waivers of the code of business conduct and ethics for the Company’s Principal Executive Officer, Principal Financial Officer and Principal Accounting Officer on the Company’s website.
Item 11. Executive Compensation
The information under the captions “Executive Compensation” and “Director Compensation” of the 2017 Proxy Statement is incorporated herein by reference.
Item 12. Security Ownership of Certain Beneficial Owners and Management and Related Stockholder Matters
The following table sets forth information as of July 31, 2017, regarding the Company’s equity compensation plans:
Plan Category | Number of securities to be issued upon exercise of outstanding options, warrants and rights | Weighted – average exercise price of outstanding options, warrants and rights | Number of securities remaining available for future issuance under equity compensation plans (excluding securities reflected in column (a)) | |||||||
(a) | (b) | (c) | ||||||||
Equity compensation plans approved by security holders: | ||||||||||
1980 Master Stock Compensation Plan: | ||||||||||
Deferred Stock Gain Plan | 20,853 | $ | 9.63 | — | ||||||
1991 Master Stock Compensation Plan: | ||||||||||
Deferred Stock Option Gain Plan | 437,585 | $ | 21.41 | — | ||||||
Deferred LTC/Restricted Stock | 167,105 | $ | 14.18 | — | ||||||
2001 Master Stock Incentive Plan: | ||||||||||
Stock Options | 1,065,623 | $ | 20.20 | — | ||||||
Deferred LTC/Restricted Stock | 100,690 | $ | 20.50 | — | ||||||
2010 Master Stock Incentive Plan: | ||||||||||
Stock Options | 4,421,302 | $ | 35.79 | (1) | ||||||
Deferred LTC/Restricted Stock | 1,888 | $ | 37.47 | — | ||||||
Stock Options for Non-Employee Directors | 934,300 | $ | 35.23 | — | ||||||
Long-Term Compensation | 40,862 | $ | 36.80 | — | ||||||
Subtotal for plans approved by security holders | 7,190,208 | $ | 31.75 | |||||||
Equity compensation plans not approved by security holders: | ||||||||||
Non-qualified Stock Option Program for Non-Employee Directors | 264,326 | $ | 19.98 | — | ||||||
ESOP Restoration | 12,380 | $ | 9.15 | (2) | ||||||
Subtotal for plans not approved by security holders | 276,706 | $ | 19.50 | |||||||
Total | 7,466,914 | $ | 31.29 | |||||||
58
(1) | The 2010 Master Stock Incentive Plan limits the number of shares authorized for issuance to 9,200,000 during the 10-year term of the plan in addition to any shares forfeited under the 2001 plan. The plan allows for the granting of nonqualified stock options, incentive stock options, restricted stock, restricted stock units, stock appreciation rights, dividend equivalents and other stock-based awards. There are currently 2,998,157 shares of the authorization remaining. |
(2) | The Company has a non-qualified ESOP Restoration Plan established on August 1, 1990, to supplement the benefits for executive employees under the Company’s Employee Stock Ownership Plan that would otherwise be reduced because of the compensation limitations under the Internal Revenue Code. The ESOP’s 10-year term was completed on July 31, 1997, and the only ongoing benefits under the ESOP Restoration Plan are the accrual of dividend equivalent rights to the participants in the plan. |
Item 13. Certain Relationships and Related Transactions, and Director Independence
The information under the captions “Policy and Procedures Regarding Transactions with Related Persons” and “Board Oversight and Director Independence” of the 2017 Proxy Statement is incorporated herein by reference.
Item 14. Principal Accounting Fees and Services
The information under the captions “Independent Registered Public Accounting Firm Fees” and “Audit Committee Pre-Approval Policies and Procedures” of the 2017 Proxy Statement is incorporated herein by reference.
PART IV
Item 15. Exhibits, Financial Statement Schedules
Documents filed with this report:
(1) | Financial Statements |
Report of Independent Registered Public Accounting Firm | |
Consolidated Statements of Earnings — years ended July 31, 2017, 2016 and 2015 | |
Consolidated Statements of Comprehensive Income — years ended July 31, 2017, 2016 and 2015 | |
Consolidated Balance Sheets — July 31, 2017 and 2016 | |
Consolidated Statements of Cash Flows — years ended July 31, 2017, 2016 and 2015 | |
Consolidated Statements of Changes in Shareholders’ Equity — years ended July 31, 2017, 2016 and 2015 | |
Notes to Consolidated Financial Statements | |
(2) | Financial Statement Schedules |
All other schedules (Schedules I, II, III, IV and V) for which provision is made in the applicable accounting regulations of the Securities and Exchange Commission are not required under the related instruction, or are inapplicable, and therefore have been omitted. | |
(3) | Exhibits |
The exhibits listed in the accompanying index are filed as part of this report or incorporated by reference as indicated therein. | |
59
SIGNATURES
Pursuant to the requirements of Section 13 or 15(d) of the Securities Exchange Act of 1934, the registrant has duly caused this report to be signed on its behalf by the undersigned, thereunto duly authorized.
DONALDSON COMPANY, INC. | ||||
Date: | September 22, 2017 | By: | /s/ Tod E. Carpenter | |
Tod E. Carpenter Chief Executive Officer | ||||
Pursuant to the requirements of the Securities Exchange Act of 1934, this report has been signed below by the following persons on behalf of the registrant and in the capacities indicated on September 22, 2017.
/s/ Tod E. Carpenter | President, Chief Executive Officer | ||
Tod E. Carpenter | (Principal Executive Officer) | ||
/s/ Scott J. Robinson | Vice President and Chief Financial Officer | ||
Scott J. Robinson | (Principal Financial Officer) | ||
/s/ Melissa A. Osland | Controller | ||
Melissa A. Osland | (Principal Accounting Officer) | ||
* | Chairman of the Board | ||
Jeffrey Noddle | |||
* | Director | ||
Andrew Cecere | |||
* | Director | ||
Michael J. Hoffman | |||
* | Director | ||
Douglas A. Milroy | |||
* | Director | ||
Willard D. Oberton | |||
* | Director | ||
James J. Owens | |||
* | Director | ||
Ajita G. Rajendra | |||
* | Director | ||
Trudy A. Rautio | |||
* | Director | ||
John P. Wiehoff | |||
*By: | /s/ Amy C. Becker | ||
Amy C. Becker | |||
As attorney-in-fact | |||
60
EXHIBIT INDEX
ANNUAL REPORT ON FORM 10-K
*3-A | — | |
*3-B | — | |
*4 | — | ** |
*10-A | — | |
*10-B | — | |
*10-C | — | |
*10-D | — | |
*10-E | — | |
*10-F | — | |
*10-G | — | |
*10-H | — | |
*10-I | — | |
*10-J | — | |
*10-K | — | |
*10-L | — | |
*10-M | — | |
*10-N | — | |
*10-O | — | |
*10-P | — | |
*10-Q | — | |
*10-R | — | |
*10-S | — | |
*10-T | — | |
*10-U | — | |
*10-V | — | |
*10-W | — | |
*10-X | — | |
*10-Y | — | |
*10-Z | — | |
61
*10-AA | — | |
*10-BB | — | |
*10-CC | — | |
*10-DD | — | |
*10-EE | — | |
*10-FF | — | |
*10-GG | — | |
*10-HH | — | |
*10-II | — | |
*10-JJ | — | |
21 | — | |
23 | — | |
24 | — | |
31-A | — | |
31-B | — | |
32 | — | |
101 | — | The following financial information from the Donaldson Company, Inc. Annual Report on Form 10-K for the fiscal year ended July 31, 2017 as filed with the Securities and Exchange Commission, formatted in Extensible Business Reporting Language (XBRL): (i) the Consolidated Statements of Earnings, (ii) the Consolidated Balance Sheets, (iii) the Consolidated Statements of Cash Flows, (iv) the Consolidated Statement of Changes in Shareholders’ Equity and (v) the Notes to Consolidated Financial Statements. |
__________________
* | Exhibit has previously been filed with the Securities and Exchange Commission and is incorporated herein by reference as an exhibit. | |
** | Pursuant to the provisions of Regulation S-K Item 601(b)(4)(iii)(A), copies of instruments defining the rights of holders of certain long-term debts of the Registrant and its subsidiaries are not filed and in lieu thereof the Registrant agrees to furnish a copy thereof to the Securities and Exchange Commission upon request. | |
*** | Denotes compensatory plan or management contract. | |
62