Attached files
| file | filename |
|---|---|
| 8-K - 8-K - SmartStop Self Storage REIT, Inc. | d301997d8k.htm |
Exhibit 99.1
Strategic Storage Trust II, Inc.
Second Quarter Update
H. Michael Schwartz – Founder,) Chairman) &) CEO
SMARTSTOP ASSET MANAGEMENT STUDENT ● SENIOR ● STORAGE is the sponsor of Strategic Storage Trust II, Inc.
Investor Presentation
Disclaimer & Risk Factors
Strategic Storage Trust II, Inc.
This investor presentation may contain certain
forward-looking statements within the meaning of Section 27A of the Securities Act of 1933, as amended, and Section 21E of the Securities Exchange Act of 1934, as amended. Such forward-looking statements can generally be identified by our
use of forward-looking terminology such as “may,” “will,” “expect,” “intend,” “anticipate,” “estimate,” “believe,” “continue,” or other similar words. Because such
statements include risks, uncertainties and contingencies, actual results may differ materially from the expectations, intentions, beliefs, plans or predictions of the future expressed or implied by such forward-looking statements. These risks,
uncertainties and contingencies include, but are not limited to: uncertainties relating to changes in general economic and real estate conditions; uncertainties relating to the implementation of our real estate investment strategy; uncertainties
relating to financing availability and capital proceeds; uncertainties relating to the closing of property acquisitions; uncertainties related to the timing and availability of distributions; and other risk factors as outlined in the Company’s
public filings with the Securities and Exchange Commission. This is neither an offer nor a solicitation to purchase securities.
• See our Form 10-K and recent Form 10-Q for specific risks associated with an investment in Strategic Storage Trust II, Inc.
• As of June 30, 2017, our accumulated deficit was approximately $52 million.
• We have paid distributions from sources other than our cash flows from operations, including from the net proceeds of our public offering. We are not
prohibited from undertaking such activities by our charter, bylaws or investment policies, and we may use an unlimited amount from any source to pay our distributions. For the years ended December 31, 2014, 2015 and 2016, we funded 100% of our
distributions using proceeds from our offering. For the six months ended June 30, 2017, we funded 44% of our distributions using cash flow from operations and 56% using proceeds from our offering and DRP offering. If we continue to pay
distributions from sources other than cash flows from operations, we will have fewer funds available for acquiring properties, which may reduce our stockholders’ overall returns. Additionally, to the extent distributions exceed cash flows from
operations, a stockholder’s basis in our stock may be reduced and, to the extent distributions exceed a stockholder’s basis, the stockholder may recognize a capital gain.
• No public market currently exists for shares of our common stock and we may not list our shares on a national securities exchange before three to five years after completion
of our public offering, if at all; therefore, it may be difficult to sell your shares. If you sell your shares, it will likely be at a substantial discount. Our charter does not require us to pursue a liquidity transaction at any time.
• We may only calculate the value per share for our shares annually and, therefore, you may not be able to determine the net asset value of your shares on an ongoing basis.
• We have limited prior operating history, and the prior performance of real estate programs sponsored by affiliates of our sponsor may not be indicative of
our future results.
• We have no employees and are dependent on our advisor to select investments and conduct our operations, and there is no guarantee that
our advisor will devote adequate time or resources to us.
• There are substantial conflicts of interest among us and our sponsor, advisor, property manager
and dealer manager.
• Our advisor will face conflicts of interest relating to the purchase of properties, including conflicts with Strategic Storage Growth
Trust, Inc. and Strategic Storage Trust IV, Inc., and such conflicts may not be resolved in our favor, which could adversely affect our investment opportunities.
• We will pay substantial fees and expenses to our advisor, its affiliates and participating broker-dealers for the services they provide to us, which will
reduce cash available for investment and distribution. We may be required to pay our advisor a significant distribution if our advisory agreement is involuntarily terminated.
• We may incur substantial debt, which could hinder our ability to pay distributions to our stockholders or could decrease the value of your investment.
• We may fail to qualify as a REIT, which could adversely affect our operations and our ability to make distributions.
• Our board of directors may change any of our investment objectives without your consent.
SMARTSTOP ASSET MANAGEMENT STUDENT . SENIOR . STORAGE is the sponsor of Strategic Storage Trust II, Inc.
Investor Presentation 2
Additional Information Regarding NOI, FFO & MFFO
Strategic Storage Trust II, Inc.
Funds from Operations (“FFO”) and Modified Funds
from Operations (“MFFO”)
Due to certain unique operating characteristics of real estate companies, the National Association of Real Estate Investment
Trusts, or NAREIT, an industry trade group, has promulgated a measure known as funds from operations, or FFO, which SST II believes to be an appropriate supplemental measure to reflect the operating performance of a REIT. The use of FFO is
recommended by the REIT industry as a supplemental performance measure. FFO is not equivalent to SST II’s net income (loss) as determined under GAAP.
SST II
defines FFO, a non-GAAP measure, consistent with the standards established by the White Paper on FFO approved by the Board of Governors of NAREIT, as revised in February 2004, or the White Paper. The White
Paper defines FFO as net income (loss) computed in accordance with GAAP, excluding gains or losses from sales of property and asset impairment write downs, plus depreciation and amortization, and after adjustments for unconsolidated partnerships and
joint ventures. Adjustments for unconsolidated partnerships and joint ventures are calculated to reflect FFO on the same basis. SST II’s FFO calculation complies with NAREIT’s policy described above.
The historical accounting convention used for real estate assets requires straight-line depreciation of buildings and improvements, which implies that the value of real estate
assets diminishes predictably over time. Diminution in value may occur if such assets are not adequately maintained or repaired and renovated as required by relevant circumstances or other measures necessary to maintain the assets are not
undertaken. However, SST II believes that, since real estate values historically rise and fall with market conditions, including inflation, interest rates, the business cycle, unemployment and consumer spending, presentations of operating results
for a REIT using historical accounting for depreciation may be less informative. In addition, in the determination of FFO, SST II believes it is appropriate to disregard impairment charges, as this is a fair value adjustment that is largely based on
market fluctuations and assessments regarding general market conditions which can change over time. An asset will only be evaluated for impairment if certain impairment indications exist and if the carrying value, or book value, exceeds the total
estimated undiscounted future cash flows (including net rental revenues, net proceeds on the sale of the property, and any other ancillary cash flows at a property or group level under GAAP) from such asset. Testing for impairment is a continuous
process and is analyzed on a quarterly basis. Investors should note, however, that determinations of whether impairment charges have been incurred are based partly on anticipated operating performance, because estimated undiscounted future cash
flows from a property, including estimated future net rental revenues, net proceeds on the sale of the property, and certain other ancillary cash flows, are taken into account in determining whether an impairment charge has been incurred. While
impairment charges are excluded from the calculation of FFO as described above, investors are cautioned that due to the fact that impairments are based on estimated future undiscounted cash flows and that SST II intends to have a relatively limited
term of its operations; it could be difficult to recover any impairment charges through the eventual sale of the property. To date, SST II has not recognized any impairments.
Historical accounting for real estate involves the use of GAAP. Any other method of accounting for real estate such as the fair value method cannot be construed to be any more
accurate or relevant than the comparable methodologies of real estate valuation found in GAAP. Nevertheless, SST II believes that the use of FFO, which excludes the impact of real estate related depreciation and amortization and impairments, assists
in providing a more complete understanding of its performance to investors and to its management, and when compared year over year, reflects the impact on SST II’s operations from trends in occupancy rates, rental rates, operating costs,
general and administrative expenses, and interest costs, which may not be immediately apparent from net income (loss).
However, FFO or modified funds from
operations (“MFFO”), discussed below, should not be construed to be more relevant or accurate than the current GAAP methodology in calculating net income (loss) or in its applicability in evaluating SST II’s operating performance. The
method utilized to evaluate the value and performance of real estate under GAAP should be considered a more relevant measure of operational performance and is, therefore, given more prominence than the
non-GAAP FFO and MFFO measures and the adjustments to GAAP in calculating FFO and MFFO.
Changes in the accounting and
reporting rules under GAAP that were put into effect and other changes to GAAP accounting for real estate subsequent to the establishment of NAREIT’s definition of FFO have prompted an increase in cash-settled expenses, specifically acquisition
fees and expenses, that are expensed as operating expenses under GAAP. SST II believes these fees and expenses do not affect its overall long-term operating performance. Publicly registered, non-traded REITs
typically have a significant amount of acquisition activity and are substantially more dynamic during their initial years of investment and operation.
SMARTSTOP
ASSET MANAGEMENT STUDENT . SENIOR . STORAGE is the sponsor of Strategic Storage Trust II, Inc.
Investor Presentation 3
Additional Information Regarding NOI, FFO & MFFO
Strategic Storage Trust II, Inc.
The purchase of properties, and the corresponding expenses
associated with that process, is a key feature of SST II’s business plan in order to generate operational income and cash flow in order to make distributions to investors. While other start-up entities
may also experience significant acquisition activity during their initial years, SST II believes that publicly registered, non-traded REITs are unique in that they typically have a limited life with targeted
exit strategies within a relatively limited time frame after the acquisition activity ceases. As disclosed in the prospectus for SST II’s offering, SST II will use the proceeds raised in its offering to acquire properties and SST II expects to
begin the process of achieving a liquidity event (i.e., listing of its shares of common stock on a national securities exchange, a merger or sale, the sale of all or substantially all of its assets, or another similar transaction) within three to
five years after the completion of its offering, which is generally comparable to other publicly registered, non-traded REITs. Thus, SST II does not intend to continuously purchase assets and intends to have a
limited life. The decision whether to engage in any liquidity event is in the sole discretion of the board of directors of SST II. Due to the above factors and other unique features of publicly registered,
non-traded REITs, the Investment Program Association, or the IPA, an industry trade group, has standardized a measure known as MFFO, which the IPA has recommended as a supplemental measure for publicly
registered, non-traded REITs and which SST II believes to be another appropriate supplemental measure to reflect the operating performance of a publicly registered,
non-traded REIT having the characteristics described above. MFFO is not equivalent to SST II’s net income (loss) as determined under GAAP, and MFFO may not be a useful measure of the impact of long-term
operating performance on value if SST II does not ultimately engage in a liquidity event. SST II believes that, because MFFO excludes acquisition fees and expenses that affect its operations only in periods in which properties are acquired and that
SST II considers more reflective of investing activities, as well as other non-operating items included in FFO, MFFO can provide, on a going-forward basis, an indication of the sustainability (that is, the
capacity to continue to be maintained) of SST II’s operating performance after the period in which it is acquiring properties and once its portfolio is in place. By providing MFFO, SST II believes it is presenting useful information that
assists investors and analysts to better assess the sustainability of its operating performance after its offering has been completed and its properties have been acquired. SST II also believes that MFFO is a recognized measure of sustainable
operating performance by the publicly registered, non-traded REIT industry. Further, SST II believes MFFO is useful in comparing the sustainability of its operating performance after its offering and
acquisitions are completed with the sustainability of the operating performance of other real estate companies that are not as involved in acquisition activities. Investors are cautioned that MFFO should only be used to assess the sustainability of
SST II’s operating performance after its offering has been completed and properties have been acquired, as it excludes acquisition fees and expenses that have a negative effect on SST II’s operating performance during the periods in which
properties are acquired.
SST II defines MFFO, a non-GAAP measure, consistent with the IPA’s Guideline 2010-01, Supplemental Performance Measure for Publicly Registered, Non-Listed REITs: Modified Funds From Operations (the “Practice Guideline”) issued by the IPA in
November 2010. The Practice Guideline defines MFFO as FFO further adjusted for the following items included in the determination of GAAP net income (loss): acquisition fees and expenses; amounts relating to straight line rents and amortization of
above or below intangible lease assets and liabilities; accretion of discounts and amortization of premiums on debt investments; non-recurring impairments of real estate related investments; mark-to-market adjustments included in net income; non-recurring gains or losses included in net income from the extinguishment or sale
of debt, hedges, foreign exchange, derivatives or securities holdings where trading of such holdings is not a fundamental attribute of the business plan, unrealized gains or losses resulting from consolidation from, or deconsolidation to, equity
accounting, adjustments relating to contingent purchase price obligations included in net income, and after adjustments for consolidated and unconsolidated partnerships and joint ventures, with such adjustments calculated to reflect MFFO on the same
basis. The accretion of discounts and amortization of premiums on debt investments, unrealized gains and losses on hedges, foreign exchange, derivatives or securities holdings, unrealized gains and losses resulting from consolidations, as well as
other listed cash flow adjustments are adjustments made to net income (loss) in calculating cash flows from operations and, in some cases, reflect gains or losses which are unrealized and may not ultimately be realized.
SST II’s MFFO calculation complies with the IPA’s Practice Guideline described above. In calculating MFFO, SST II excludes acquisition related expenses, the amortization
of fair value adjustments related to debt, realized and unrealized gains and losses on foreign exchange holdings and the adjustments of such items related to non-controlling interests. The other adjustments
included in the IPA’s Practice Guideline are not applicable to SST II for the periods presented.
Acquisition fees and expenses are paid in cash by SST II, and
it has not set aside or put into escrow any specific amount of proceeds from its offering to be used to fund acquisition fees and expenses. SST II does not intend to fund acquisition fees and expenses in the future from operating revenues and cash
flows, nor from the sale of properties and subsequent re-deployment of capital and concurrent incurring of acquisition fees and expenses.
SMARTSTOP ASSET MANAGEMENT STUDENT . SENIOR . STORAGE is the sponsor of Strategic Storage Trust II, Inc.
Investor Presentation 4
Additional Information Regarding NOI, FFO & MFFO
Strategic Storage Trust II, Inc.
Acquisition fees and expenses include payments to SST
II’s advisor and third parties. Acquisition related expenses under GAAP are considered operating expenses and as expenses included in the determination of net income (loss) and income (loss) from continuing operations, both of which are
performance measures under GAAP. All paid and accrued acquisition fees and expenses will have negative effects on returns to investors, the potential for future distributions, and cash flows generated by SST II, unless earnings from operations or
net sales proceeds from the disposition of other properties are generated to cover the purchase price of the property, these fees and expenses and other costs related to such property. In the future, if SST II is not able to raise additional
proceeds from future offerings, this could result in SST II paying acquisition fees or reimbursing acquisition expenses due to its advisor, or a portion thereof, with net proceeds from borrowed funds, operational earnings or cash flows, net proceeds
from the sale of properties, or ancillary cash flows. As a result, the amount of proceeds available for investment and operations would be reduced, or SST II may incur additional interest expense as a result of borrowed funds.
Further, under GAAP, certain contemplated non-cash fair value and other non-cash adjustments are
considered operating non-cash adjustments to net income (loss) in determining cash flows from operations. In addition, SST II views fair value adjustments of derivatives and the amortization of fair value
adjustments related to debt as items which are unrealized and may not ultimately be realized or as items which are not reflective of on-going operations and are therefore typically adjusted for when assessing
operating performance.
SST II uses MFFO and the adjustments used to calculate it in order to evaluate its performance against other publicly registered, non-traded REITs which intend to have limited lives with short and defined acquisition periods and targeted exit strategies shortly thereafter. As noted above, MFFO may not be a useful measure of the impact of
long-term operating performance if SST II does not continue to operate in this manner. SST II believes that its use of MFFO and the adjustments used to calculate it allow it to present its performance in a manner that reflects certain
characteristics that are unique to publicly registered, non-traded REITs, such as their limited life, limited and defined acquisition period and targeted exit strategy, and hence that the use of such measures
may be useful to investors. For example, acquisition fees and expenses are intended to be funded from the proceeds of SST II’s offering and other financing sources and not from operations. By excluding expensed acquisition fees and expenses,
the use of MFFO provides information consistent with management’s analysis of the operating performance of the properties. Additionally, fair value adjustments, which are based on the impact of current market fluctuations and underlying
assessments of general market conditions, but can also result from operational factors such as rental and occupancy rates, may not be directly related or attributable to SST II’s current operating performance. By excluding such charges that may
reflect anticipated and unrealized gains or losses, SST II believes MFFO provides useful supplemental information.
Presentation of this information is intended to
provide useful information to investors as they compare the operating performance of different REITs, although it should be noted that not all REITs calculate FFO and MFFO the same way, so comparisons with other REITs may not be meaningful.
Furthermore, FFO and MFFO are not necessarily indicative of cash flow available to fund cash needs and should not be considered as an alternative to net income (loss) or income (loss) from continuing operations as an indication of SST II’s
performance, as an alternative to cash flows from operations, which is an indication of SST II’s liquidity, or indicative of funds available to fund SST II’s cash needs including its ability to make distributions to its stockholders. FFO
and MFFO should be reviewed in conjunction with other measurements as an indication of SST II’s performance. MFFO may be useful in assisting management and investors in assessing the sustainability of operating performance in future operating
periods, and in particular, after the offering and acquisition stages are complete.
Neither the SEC, NAREIT, nor any other regulatory body has passed judgment on
the acceptability of the adjustments that SST II uses to calculate FFO or MFFO. In the future, the SEC, NAREIT or another regulatory body may decide to standardize the allowable adjustments across the publicly registered, non-traded REIT industry and SST II would have to adjust its calculation and characterization of FFO or MFFO.
Net Operating
Income (“NOI”)
NOI is a non-GAAP measure that we define as net income (loss), computed in accordance with GAAP,
generated from properties before corporate general and administrative expenses, asset management fees, interest expense, depreciation, amortization, acquisition expenses and other non-property related
expenses. We believe that NOI is useful for investors as it provides a measure of the operating performance of our operating assets because NOI excludes certain items that are not associated with the operation of the properties. Additionally, we
believe that NOI is a widely accepted measure of comparative operating performance in the real estate community. However, our use of the term NOI may not be comparable to that of other real estate companies as they may have different methodologies
for computing this amount.
SMARTSTOP ASSET MANAGEMENT STUDENT . SENIOR . STORAGE is the sponsor of Strategic Storage Trust II, Inc.
Investor Presentation 5
Strategic Storage Trust II, Inc.
Strategic Storage Trust II, Inc.
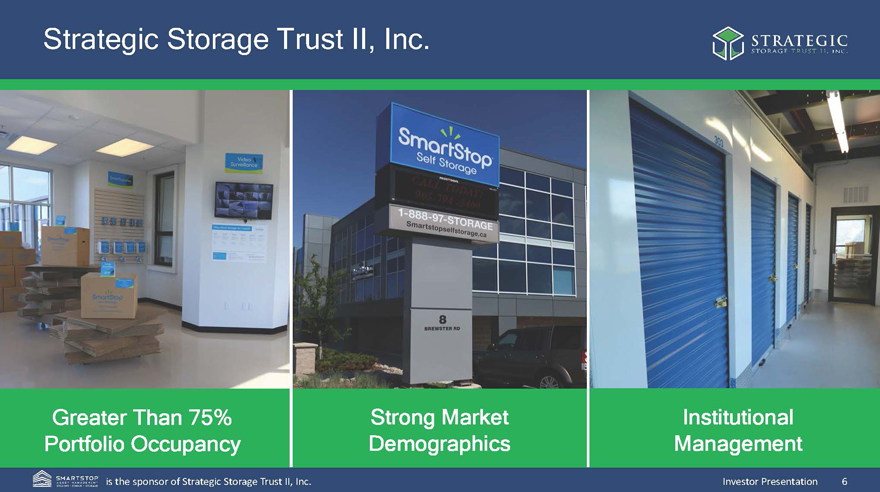
Greater Than 75% Portfolio Occupancy
SmartStop
CALL TODAY:
905-794-3400
1-888-97-STORAGE
SmartStop® self storage.ca
8 BREWSTER RD
Strong Market Demographics
Institutional Management
SMARTSTOP ASSET MANAGEMENT STUDENT . SENIOR . STORAGE is the sponsor
of Strategic Storage Trust II, Inc.
Investor Presentation 6
Strategic Storage Trust II, Inc.
Strategic Storage Trust II, Inc.
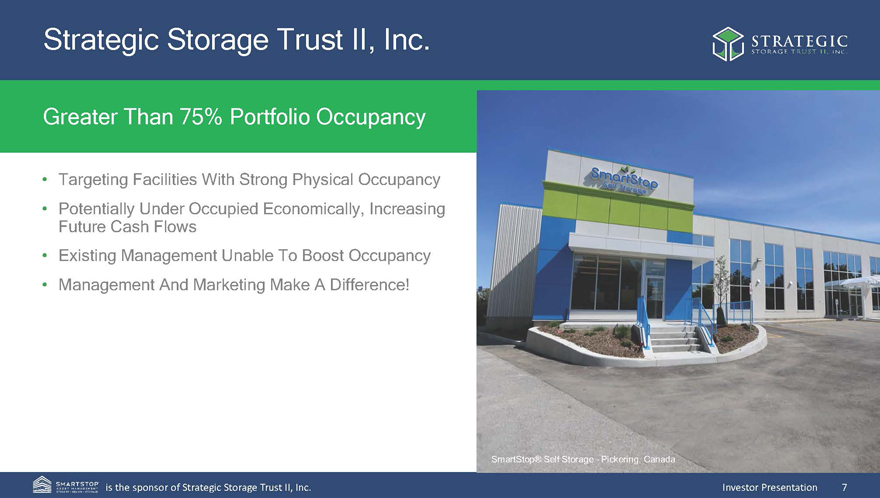
Greater Than 75% Portfolio Occupancy
Targeting Facilities With Strong Physical Occupancy
Potentially Under Occupied Economically,
Increasing Future Cash Flows
Existing Management Unable To Boost Occupancy
Management And Marketing Make A Difference!
SmartStop® Self Storage
– Pickering, Canada
SMARTSTOP ASSET MANAGEMENT STUDENT SENIOR STORAGE is the sponsor of Strategic Storage Trust II, Inc.
Investor Presentation 7
Strategic Storage Trust II, Inc.
Strategic Storage Trust II, Inc.
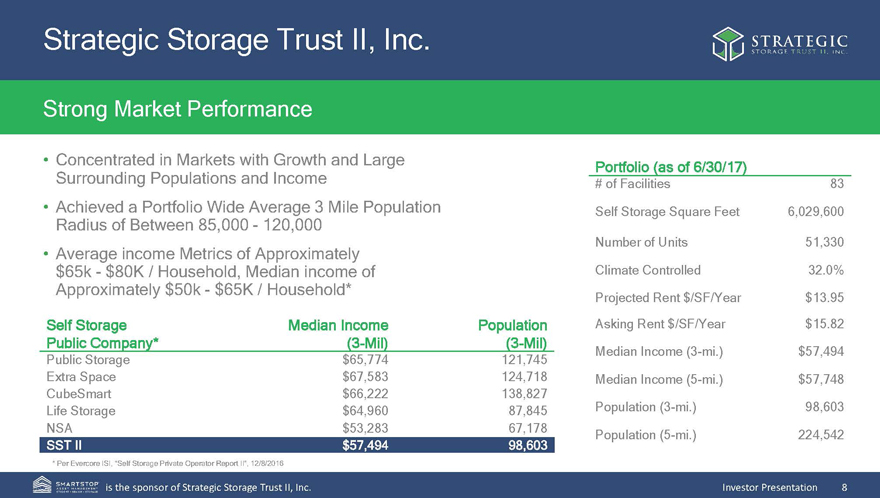
Strong Market Performance
Concentrated in Markets with Growth and Large Surrounding Populations and Income
Achieved a
Portfolio Wide Average 3 Mile Population Radius of Between 85,000 - 120,000
Average income Metrics of Approximately $65k - $80K / Household, Median income of
Approximately $50k - $65K / Household*
Self Storage Median Income Population
Public Company* (3-Mil) (3-Mil)
Public Storage $65,774 121,745
Extra
Space $67,583 124,718
CubeSmart $66,222 138,827
Life Storage $64,960 87,845
NSA $53,283 67,178
SST II $57,494 98,603
* Per Evercore ISI, “Self
Storage Private Operator Report II”, 12/8/2016
Portfolio (as of 6/30/17)
of Facilities 83
Self Storage Square
Feet 6,029,600
Number of Units 51,330
Climate Controlled 32.0%
Projected Rent
$/SF/Year $13.95
Asking Rent $/SF/Year $15.82
Median Income (3-mi.) $57,494
Median Income (5-mi.) $57,748
Population (3-mi.) 98,603
Population (5-mi.) 224,542
SMARTSTOP ASSET MANAGEMENT STUDENT . SENIOR . STORAGE is the sponsor of Strategic Storage Trust II, Inc.
Investor Presentation 8

Strategic Storage Trust II, Inc.
Strategic Storage Trust II, Inc.
Institutional Management
Economies Of Scale
Institutional Marketing Platform
Expense Efficiencies
Institutional Hiring, Training And Management
SmartStop® Self Storage – Pickering, Canada
SMARTSTOP ASSET MANAGEMENT STUDENT .
SENIOR . STORAGE is the sponsor of Strategic Storage Trust II, Inc.
Investor Presentation 9
Current Portfolio As Of 6/30/2017
Strategic Storage Trust II, Inc.
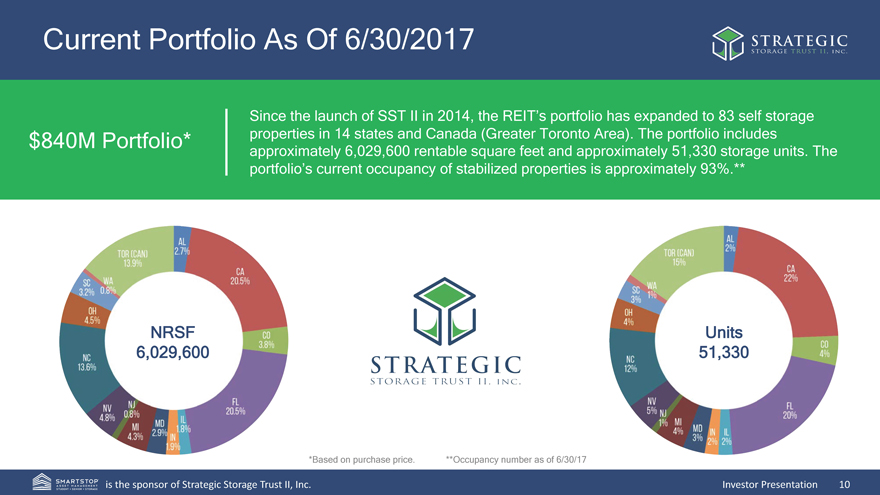
$840M Portfolio*
Since the launch of SST II in 2014, the REIT’s portfolio has expanded to 83 self storage properties in 14 states and Canada (Greater Toronto Area). The portfolio includes
approximately 6,029,600 rentable square feet and approximately 51,330 storage units. The portfolio’s current occupancy of stabilized properties is approximately 93%.**
SC 3.2% oh 4.5% NC 13.6% NV4.8% NJ 0.8% MI 4.3% MD 2.9% IN 1.9% IL 1.8% FL 20.5% CO 3.8% CA 20.5% AL 2.7% TOR (CAN) 13.9% WA 0.8%
Strategic Storage Trust II, Inc.
NRSF 6,029,600
TOR (CAN) 15% AL 2% CA 22% CO 4% FL 20% IL 2% IN 2% MD 3% MI 4% NJ 1% NV 5% NC 12% OH 4% SC 3% WA 1%
Units 51,330
*Based on purchase price. **Occupancy number as of 6/30/17
SMARTSTOP ASSET MANAGEMENT STUDENT . SENIOR . STORAGE is the sponsor of Strategic Storage Trust II, Inc.
Investor Presentation 10
Balance Sheet
Loan-To-Value
• June 30, 2017 = 47%*
*Based on acquisition cost
Distributions(1)
• SST II Pays A Distribution Rate Of
Approximately $0.001644 Per Day Per Share
(Equivalent To $0.60 Per Share Annually) To Both Class A And Class T Stockholders Of Record. The T Share Distribution Is Reduced By An Ongoing Stockholder Servicing Fee Equal To An Annual Rate Of 1% Of The T Share Purchase Price.
(1) We have paid and may continue to pay, distributions from sources other than cash flow from operations therefore, we will have fewer funds available for
acquisitions of properties and our stockholders overall return may be reduced. Future distributions are at the sole discretion of our board of directors and are not guaranteed.
Royal Palm Beach, Florida
SMARTSTOP ASSET MANAGEMENT STUDENT . SENIOR . STORAGE is the sponsor
of Strategic Storage Trust II, Inc.
Investor Presentation 11
Financial Update
Strategic Storage Trust II, Inc.
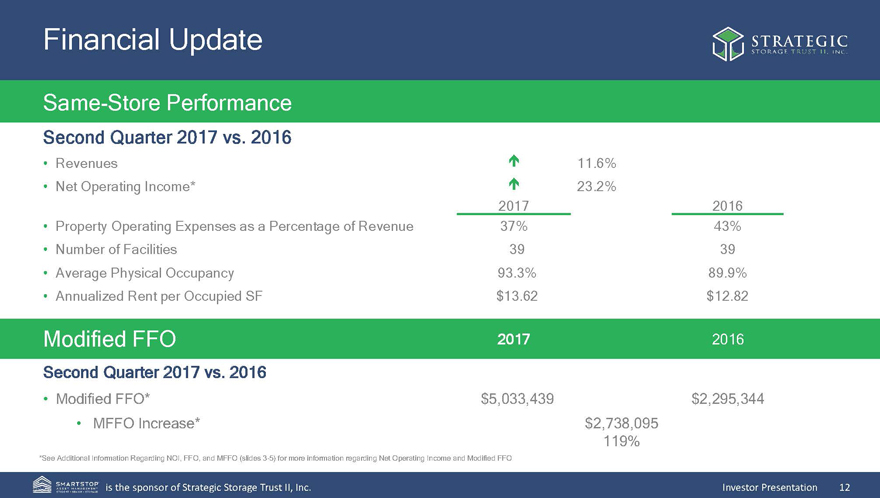
Same-Store
Performance
Second Quarter 2017 vs. 2016
Revenuesé11.6%
Net Operating Income*é23.2%
2017 2016
Property Operating Expenses as a Percentage of Revenue37%43%
Number of Facilities3939
Average Physical Occupancy93.3%89.9%
Annualized Rent per Occupied SF$13.62$12.82
Modified FFO 2017 2016
Second Quarter 2017 vs. 2016
Modified
FFO*$5,033,439$2,295,344
• MFFO Increase* $2,738,095
119%
*See Additional Information Regarding NOI, FFO, and MFFO (slides 3-5) for more information regarding Net Operating Income and Modified FFO
SMARTSTOP ASSET MANAGEMENT
STUDENT . SENIOR . STORAGE is the sponsor of Strategic Storage Trust II, Inc.
Investor Presentation 12
Financial Update
Strategic Storage Trust II, Inc.
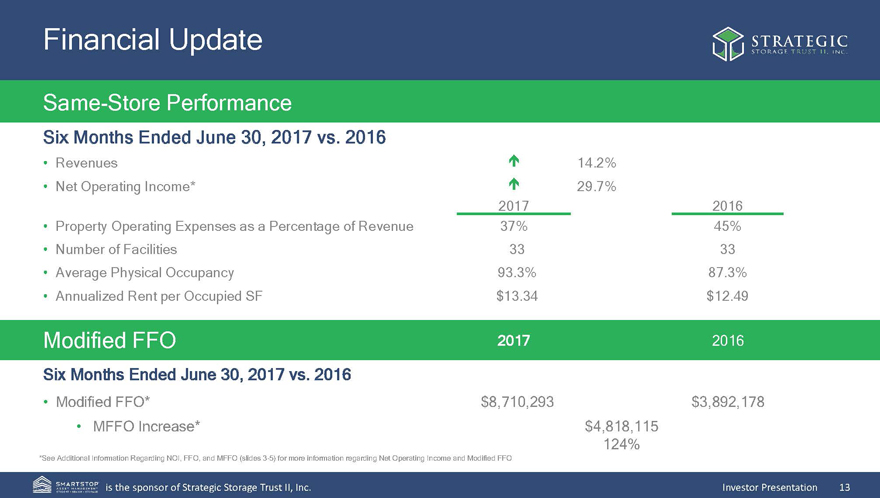
Same-Store Performance
Six Months Ended June 30, 2017 vs. 2016
Revenues é 14.2%
Net Operating Income* é 29.7%
2017 2016
Property Operating Expenses as a Percentage of Revenue 37% 45%
Number of Facilities 33 33
Average Physical Occupancy 93.3% 87.3%
Annualized Rent per Occupied SF $13.34
$12.49
Modified FFO 2017 2016
Six Months Ended
June 30, 2017 vs. 2016
Modified FFO* $8,710,293 $3,892,178
• MFFO Increase* $4,818,115
124%
*See Additional Information Regarding NOI, FFO, and MFFO (slides 3-5) for more information regarding Net Operating Income and Modified
FFO
SMARTSTOP ASSET MANAGEMENT STUDENT . SENIOR . STORAGE is the sponsor of Strategic Storage Trust II, Inc.
Investor Presentation 13
Financial Update
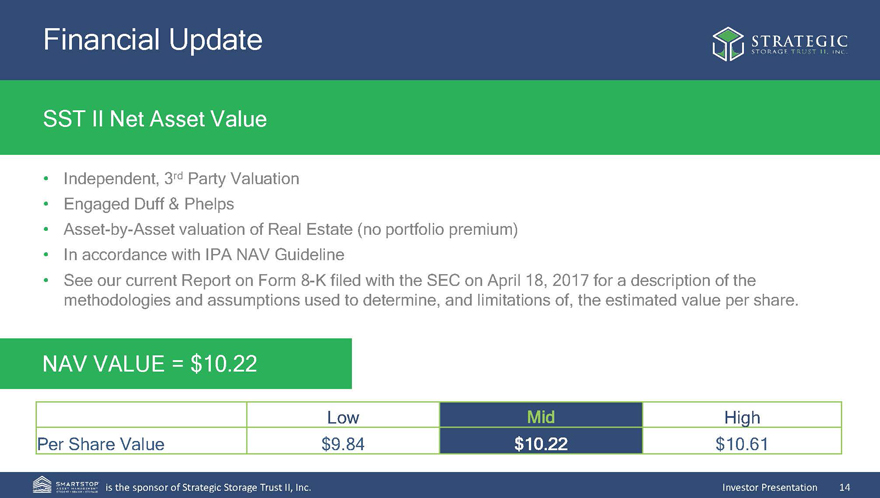
SST II
Net Asset Value
Strategic Storage Trust II, Inc.
Independent, 3rd Party
Valuation
Engaged Duff & Phelps
Asset-by-Asset valuation of Real Estate (no portfolio premium)
In accordance with IPA NAV Guideline
See our current Report on Form 8-K filed with the SEC on April 18, 2017 for a description of the methodologies and assumptions used to
determine, and limitations of, the estimated value per share.
NAV VALUE = $10.22
LowMid High
Per Share Value$9.84$10.22$10.61
SMARTSTOP ASSET MANAGEMENT STUDENT . SENIOR . STORAGE is the sponsor of Strategic Storage Trust II, Inc.
Investor Presentation 14
Toronto Portfolio
Strategic Storage Trust II, Inc.
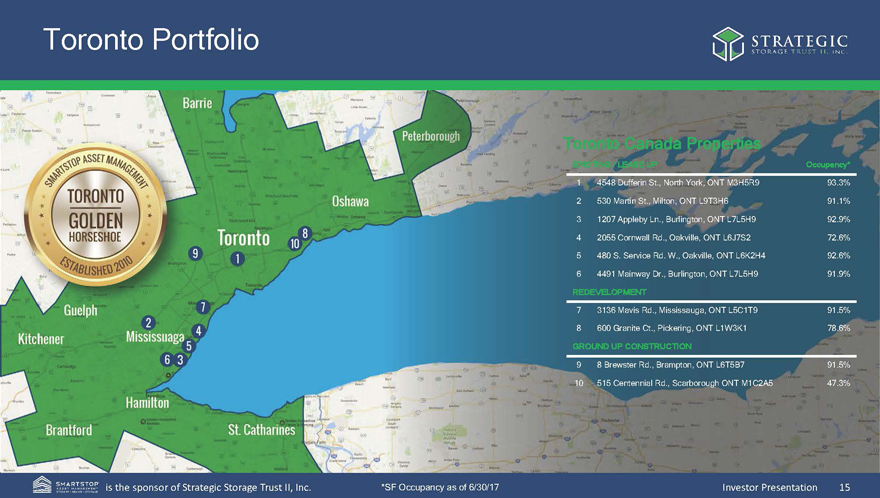
Toronto Canada
Properties
EXISTING / LEASE UP Occupancy*
1 4548 Dufferin St., North York, ONT M3H5R9 93.3%
2 530 Martin St., Milton, ONT L9T3H6 91.1%
3 1207 Appleby Ln., Burlington, ONT L7L5H9 92.9%
4 2055 Cornwall Rd., Oakville, ONT L6J7S2 72.6%
5 480 S. Service Rd. W., Oakville, ONT L6K2H4 92.6%
6 4491 Mainway Dr., Burlington, ONT L7L5H9 91.9%
REDEVELOPMENT
7 3136 Mavis
Rd., Mississauga, ONT L5C1T9 91.5%
8 600 Granite Ct., Pickering, ONT L1W3K1 78.6%
GROUND UP CONSTRUCTION
9 8 Brewster Rd.,
Brampton, ONT L6T5B7 91.5%
10 515 Centennial Rd., Scarborough ONT M1C2A5 47.3%
Barrie Peterborough Oshawa Toronto Guelph Kitchener Mississuaga Hamilton Brantford St. Catharines
*SF Occupancy as of 6/30/17
SMARTSTOP ASSET MANAGEMENT STUDENT . SENIOR . STORAGE is the
sponsor of Strategic Storage Trust II, Inc.
Investor Presentation 15
Hurricane Property Update
Strategic Storage Trust II, Inc.
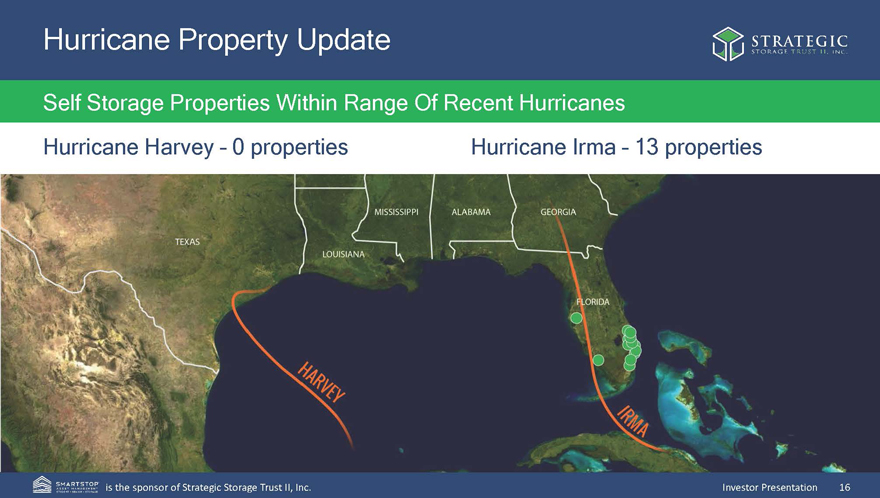
Self Storage Properties Within Range Of
Recent Hurricanes
Hurricane Harvey – 0 properties Hurricane Irma – 13 properties
TEXAS LOUISIANA MISSISSIPPI ALABAMA GEORGIA FLORIDA IRMA HARVEY
SMARTSTOP ASSET MANAGEMENT
STUDENT . SENIOR . STORAGE is the sponsor of Strategic Storage Trust II, Inc.
Investor Presentation 16

Self Storage Companies
Strategic Storage Trust II, Inc.
Publicly Traded Self Storage Companies
NYSE: PSA NYSE: LSI NYSE: UHALNYSE: EXRNYSE: CUBENYSE: JCAPNYSE: NSA
Public Non-Traded Self Storage REITs
- OFFERING CLOSED
— OFFERING CLOSED — OFFERING OPEN -
SMARTSTOP ASSET MANAGEMENT STUDENT . SENIOR . STORAGE is the sponsor of Strategic Storage Trust II, Inc.
Investor Presentation 17

Strategic Storage Trust II, Inc.
Questions?
SMARTSTOP ASSET MANAGEMENT STUDENT . SENIOR . STORAGE is the sponsor of Strategic
Storage Trust II, Inc.
Investor Presentation 18