Attached files
| file | filename |
|---|---|
| 8-K - 8-K - ASHFORD HOSPITALITY TRUST INC | ahtinvestorpresentation8-k.htm |

Company Presentation – September 2017

Safe Harbor
2
In keeping with the SEC's "Safe Harbor" guidelines, certain statements made during this presentation could be
considered forward-looking and subject to certain risks and uncertainties that could cause results to differ
materially from those projected. When we use the words "will likely result," "may," "anticipate," "estimate,"
"should," "expect," "believe," "intend," or similar expressions, we intend to identify forward-looking statements.
Such forward-looking statements include, but are not limited to, our business and investment strategy, our
understanding of our competition, current market trends and opportunities, projected operating results, and
projected capital expenditures.
These forward-looking statements are subject to known and unknown risks and uncertainties, which could cause
actual results to differ materially from those anticipated including, without limitation: general volatility of the
capital markets and the market price of our common stock; changes in our business or investment strategy;
availability, terms and deployment of capital; availability of qualified personnel; changes in our industry and the
market in which we operate, interest rates or the general economy, and the degree and nature of our
competition. These and other risk factors are more fully discussed in the Company's filings with the Securities
and Exchange Commission.
EBITDA is defined as net income before interest, taxes, depreciation and amortization. EBITDA yield is defined as
trailing twelve month EBITDA divided by the purchase price. A capitalization rate is determined by dividing the
property's net operating income by the purchase price. Net operating income is the property's funds from
operations minus a capital expense reserve of either 4% or 5% of gross revenues. Hotel EBITDA flow-through is the
change in Hotel EBITDA divided by the change in total revenues. EBITDA, FFO, AFFO, CAD and other terms are
non-GAAP measures, reconciliations of which have been provided in prior earnings releases and filings with the
SEC.
This overview is for informational purposes only and is not an offer to sell, or a solicitation of an offer to buy or sell,
any securities of Ashford Hospitality Trust, Inc. or any of its respective affiliates, and may not be relied upon in
connection with the purchase or sale of any such security.

Strategic Overview
3
Opportunistic platform focused
on upper upscale, full-service
hotels
Superior long-term total
shareholder return performance
Targets moderate debt levels of
55-60% net debt/gross assets
Attractive dividend yield
Targets cash level of 25-35% of
total equity market cap
Highest insider ownership

Recent Developments
4
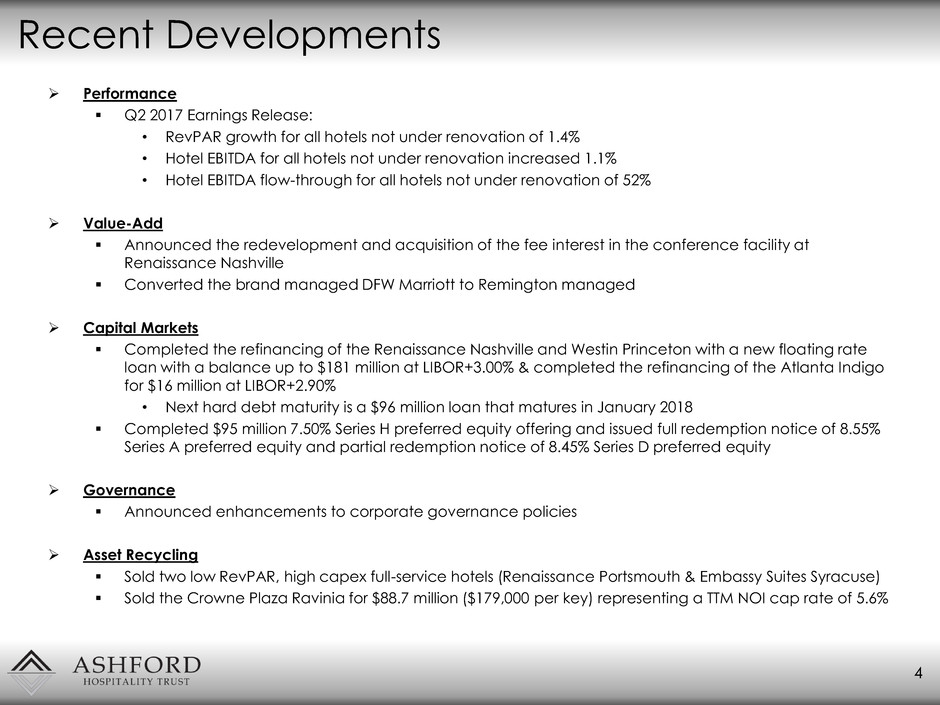
Performance
Q2 2017 Earnings Release:
• RevPAR growth for all hotels not under renovation of 1.4%
• Hotel EBITDA for all hotels not under renovation increased 1.1%
• Hotel EBITDA flow-through for all hotels not under renovation of 52%
Value-Add
Announced the redevelopment and acquisition of the fee interest in the conference facility at
Renaissance Nashville
Converted the brand managed DFW Marriott to Remington managed
Capital Markets
Completed the refinancing of the Renaissance Nashville and Westin Princeton with a new floating rate
loan with a balance up to $181 million at LIBOR+3.00% & completed the refinancing of the Atlanta Indigo
for $16 million at LIBOR+2.90%
• Next hard debt maturity is a $96 million loan that matures in January 2018
Completed $95 million 7.50% Series H preferred equity offering and issued full redemption notice of 8.55%
Series A preferred equity and partial redemption notice of 8.45% Series D preferred equity
Governance
Announced enhancements to corporate governance policies
Asset Recycling
Sold two low RevPAR, high capex full-service hotels (Renaissance Portsmouth & Embassy Suites Syracuse)
Sold the Crowne Plaza Ravinia for $88.7 million ($179,000 per key) representing a TTM NOI cap rate of 5.6%

117%
-13%
12%
234%
105%
44%
95%
59%
25%
-9%
21%
-3%
202%
82%
191%
1,497%
296%
90%
120%
59%
29%
-8%
33%
-16%
-100%
0%
100%
200%
300%
400%
500%
600%
700%
800%
900%
Inception 10-Yr 9-Yr 8-Yr 7-Yr 6-Yr 5-Yr 4-Yr 3-Yr 2-Yr 1-Yr YTD 2017
Peer Avg AHT
Demonstrated Long-Term Track Record
5
(1) Since IPO on August 26, 2003
(2) As of 12/30/2016
(3) From 12/30/16 through 9/8/17
(4) Includes: CHSP, CLDT, DRH, FCH, HST, HT, INN, LHO, RLJ, SHO
*Includes dividend reinvestment as reported and tracked by SNL
Total Shareholder Return*
Long-term
performance
significantly
outperforms peers
1, 2
2,000
2 2 2 2 2 2 2 2 2 2 3
4

Disciplined Capital Management
6
Capital Markets Activity
$218
$153
$305
$574
$75 $88
$147
$86 $111
$18
$97 $81
$45
$52
$0
$100
$200
$300
$400
$500
$600
$700
2003 2004 2005 2006 2007 2008 2009 2010 2011 2012 2013 2014 2015 2016
Common Raises Common Buybacks
Common Share Buybacks
During Global Financial Crisis
• 73.6 million shares
• Approximately 50% of shares outstanding
• Aggregate buyback approximately $3.26/share
Track record of increasing shareholder returns by capitalizing upon
cyclical changes and advantageous pricing situations

19.1%
7.6%
6.1%
3.6%
2.8% 2.5% 2.5% 2.3%
2.0% 1.7% 1.6%
1.1% 0.8%
0.5% 0.4%
0.0%
2.0%
4.0%
6.0%
8.0%
10.0%
12.0%
14.0%
16.0%
18.0%
20.0%
AHT HT APLE CLDT FCH REIT
Avg
CHSP RLJ PEB INN HST DRH SHO XHR LHO
Highest Insider Ownership
7
REIT average includes: APLE, HT, RLJ, CLDT, FCH, CHSP, INN, HST, PEB, DRH, SHO, LHO, XHR
REIT Source: Latest proxy and other company filings.
(1) As of 9/8/2017
(2) Includes direct interests, indirect interests, and interests of related parties
Insider Ownership
Most highly aligned management team among the lodging
REIT sector
1,2

7.6%
6.7%
6.5% 6.5% 6.5%
6.3% 6.3% 6.3% 6.2%
5.8%
5.5%
4.7%
4.5% 4.4% 4.4% 4.3%
0.0%
1.0%
2.0%
3.0%
4.0%
5.0%
6.0%
7.0%
8.0%
AHT AHP APLE CLDT PK RLJ LHO CHSP HT REIT
Avg
XHR DRH INN PEB HST SHO
Attractive Dividend Yield
8
Source: Company filings and market data
(1) As of 9/8/2017
(2) Annualized based on most recent dividend announcement
(3) Includes: APLE, HT, RLJ, CLDT, FCH, CHSP, INN, HST, PEB, DRH, SHO, LHO, XHR, PK
Dividend Yield1
Highest dividend yield in the industry
2 2 3

9 Current Hotels
High Quality, Geographically Diverse Portfolio
Le Pavillon Hotel
New Orleans, LA
Lakeway Resort & Spa
Austin, TX
Hilton Costa Mesa
Costa Mesa, CA
Marriott Fremont
Fremont, CA
Le Meridien Minneapolis
Minneapolis, MN Chicago Silversmith
Chicago, IL
Hilton Back Bay
Boston, MA
The Churchill
Washington, D.C.
W Atlanta Downtown
Atlanta, GA
Crowne Plaza Key West
Key West, FL
Marriott Sugar Land
Sugar Land, TX
Hilton Santa Fe
Santa Fe, NM
Renaissance Nashville
Nashville, TN
Westin Princeton
Princeton, NJ
Marriott Beverly Hills
Beverly Hills, CA
Embassy Suites Portland
Portland, OR
Marriott Gateway
Arlington, VA

Portfolio Overview
10
TTM Hotel EBITDA as of June 30, 2017 for the 120 owned hotels as of September 8, 2017
Hotel EBITDA in thousands
Hotel EBITDA by Brand Hotel EBITDA by Manager
Hotel EBITDA by MSA Hotel EBITDA by Chainscale
Top Ten Metro Areas
Marriott
57%
Hilton
28%
Hyatt
4%
IHG
5%
Indep.
6%
Marriott
31%
Hilton
6%
Hyatt
3%
Remington
59%
Interstate
<1%
Top 25
74%
Top 50
18%
Other
8%
Upscale
33%
Upper-
Upscale
55%
Luxury
5%
Upper-
Midscale
3%
Indep.
4%
TTM Hotel % of
EBITDA Total
Washington DC $46,353 9.9%
San Fran/Oakland, CA $34,705 7.4%
Los Angeles, CA $34,268 7.3%
New York/New Jersey $30,338 6.5%
Boston, MA $26,601 5.7%
Nashville, TN $26,578 5.7%
Atlanta, GA $26,525 5.7%
DFW, TX $25,455 5.4%
Minn./St. Paul, MN $16,687 3.6%
Tampa, FL $11,968 2.6%
Total Portfolio $468,407 100.0%

11
Value Creation Through Active Asset Management
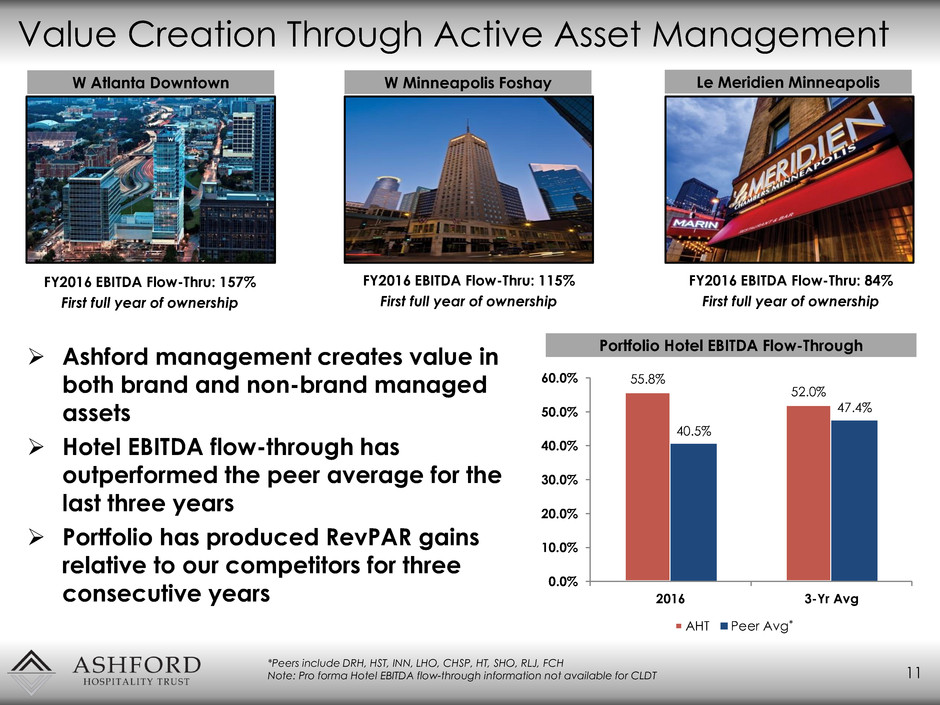
55.8%
52.0%
40.5%
47.4%
0.0%
10.0%
20.0%
30.0%
40.0%
50.0%
60.0%
2016 3-Yr Avg
AHT Peer Avg
Portfolio Hotel EBITDA Flow-Through
*Peers include DRH, HST, INN, LHO, CHSP, HT, SHO, RLJ, FCH
Note: Pro forma Hotel EBITDA flow-through information not available for CLDT
*
Ashford management creates value in
both brand and non-brand managed
assets
Hotel EBITDA flow-through has
outperformed the peer average for the
last three years
Portfolio has produced RevPAR gains
relative to our competitors for three
consecutive years
W Atlanta Downtown W Minneapolis Foshay Le Meridien Minneapolis
FY2016 EBITDA Flow-Thru: 157%
First full year of ownership
FY2016 EBITDA Flow-Thru: 115%
First full year of ownership
FY2016 EBITDA Flow-Thru: 84%
First full year of ownership

52%
58% 59%
42% 46%
47%
63%
44%
22%
53% 60%
59% 68% 70%
47% 56%
44%
73%
-200%
-175%
-150%
-125%
-100%
-75%
-50%
-25%
0%
25%
50%
75%
100%
2008 2009 2010 2011 2012 2013 2014 2015 2016 YTD Q2
2017
Non-Remington Remington
Competitive Advantage – Affiliated Manager
Affiliated property manager benefits - Remington outperformed in
EBITDA flow-through 8 out of the last 10 years including YTD Q2 2017
12 NOTE: Remington managed hotels as compared to Non-Remington managed hotels owned by Ashford Trust
Hotel EBITDA Flow-Through
Superior management of downside risk and cash flow loss
-8
-808%
334%
3

Case Study - Aggressive Asset Management
13
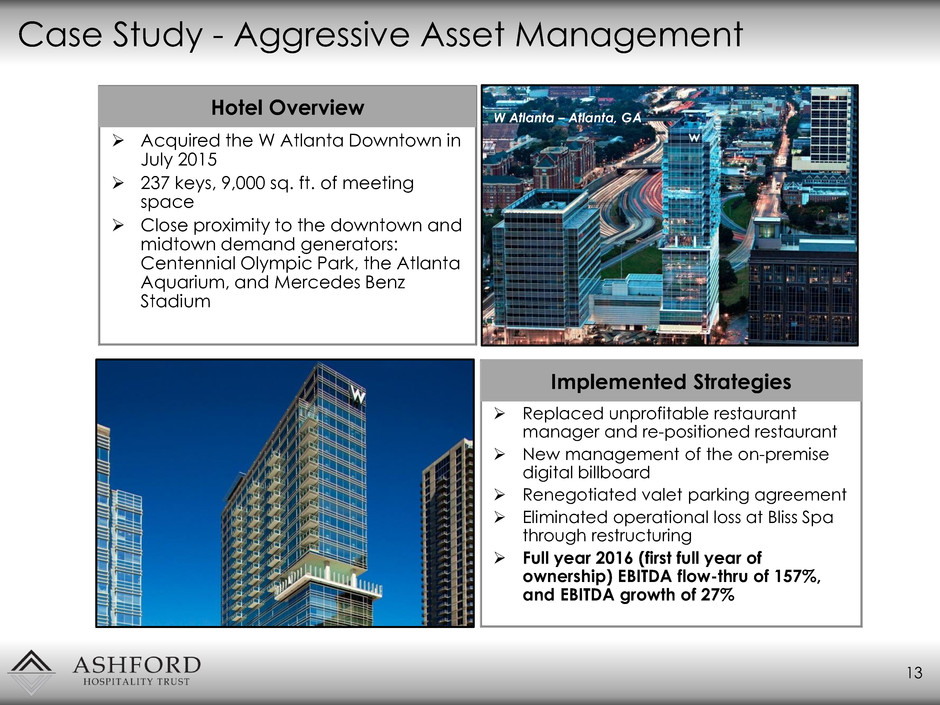
Acquired the W Atlanta Downtown in
July 2015
237 keys, 9,000 sq. ft. of meeting
space
Close proximity to the downtown and
midtown demand generators:
Centennial Olympic Park, the Atlanta
Aquarium, and Mercedes Benz
Stadium
Replaced unprofitable restaurant
manager and re-positioned restaurant
New management of the on-premise
digital billboard
Renegotiated valet parking agreement
Eliminated operational loss at Bliss Spa
through restructuring
Full year 2016 (first full year of
ownership) EBITDA flow-thru of 157%,
and EBITDA growth of 27%
W Atlanta – Atlanta, GA
Hotel Overview
Implemented Strategies

Case Study – Conversion to Remington Managed
14
Acquired the Marriott Fremont in August 2014
357 keys, 15,000 sq. ft. of meeting space
Ideally located off Interstate 880 at the
gateway to Silicon Valley. Home to over 1,200
technology companies.
Announced forward cap rate and EBITDA
multiple of 8.1% and 10.0x, respectively
Current cap rate and EBITDA multiple of 15.2%
and 5.9x, respectively (1)
Acquired for $50 million and Oct 2016 refi had
allocated loan amount of $61 million
Increased club room premium pricing
Increased corporate group room nights to
25% mid-week to ensure sell-outs and push
rate
Aggressively priced preferred rooms rates
25%-30% YOY
From TTM Pre-Takeover to TTM Post-
Takeover
Revenue increased 15.7%
RevPAR increased 21.8%
GOP margin increased 1,116 bps
EBITDA margin increased 916 bps
Marriott Fremont – Fremont, CA Hotel Overview
Implemented Strategies
(1) As of March 31, 2017

Case Study – Brand Conversion
15
The Marriott Beverly Hills officially
opened on July 1, 2015
Invested $21mm, net of key money
from Marriott*
Prior to the conversion, the hotel had
June 2015 TTM NOI of $5.6mm
FY2016 NOI of $10.3mm
Received an award from Marriott
International for renovation excellence
FY2016 performance (first full year since
conversion):
• Total revenue growth of 52%
• Room rate growth of 31%
• Hotel EBITDA flow-through of 53%
• A gain of 3,760 bps in market share
Marriott Beverly Hills – Beverly Hills, CA
Hotel Overview
Implemented Strategies
* Not all of this capital was incremental. Hotel was in need of a renovation. “Refresh” capital requirements per Crowne
standards were estimated to be $8mm.

16
Asset Management Initiatives – Recently Completed
Hyatt Regency Savannah: Completed guestroom renovation with shower conversions and increased
premium rooms inventory by 70 rooms. Also included F&B outlet repositioning, meeting space and lobby.
Marriott Bridgewater: Converted 30 king rooms to double/double rooms to capture more group business;
increase premium room type by 43.5% to capture higher ADR. Recently completed a lobby and restaurant
renovation.
W Hotel Atlanta Downtown: Terminated existing restaurant outlet management agreement and brought the
operation in-house with a projected annual positive GOP impact of almost $300,000. Negotiating lease with a
new tenant that would further enhance profit.
Marriott Dallas DFW: Converted from brand to franchise managed (Remington) on May 24th. Comprehensive
ballroom and meeting space renovation in summer 2017.
Residence Inn Orlando LBV: Completed restaurant, lobby, and meeting space renovation.
W Hotel Minneapolis: Leased underutilized lobby space to Manny’s Steakhouse for a private dining room
LeMeridien Minneapolis: Worked with existing restaurant tenant to restructure and extend the lease under
more favorable terms.
Hyatt Regency Coral Gables: Completed restaurant, lobby, meeting space and pantry renovation.
Embassy Suites Portland: Secured a new, high quality restaurant tenant.

17
Asset Management Initiatives – Upcoming
Renaissance Nashville: Partnering with developer on the adjacent $430 million Fifth & Broadway mixed
use development which will provide hotel with upgraded meeting space and eventual fee ownership.
Marriott Crystal Gateway: Major renovations: all guestrooms, lobby & restaurant, addition of M Club,
new and expanded fitness center, adding 6 keys and additional meeting space. ($30 million)
Ritz Carlton Atlanta: Extensive guestroom renovation scheduled for Q4 and expansion of Ritz Carlton
Club Lounge.($21 million)
Sheraton Anchorage: Guestroom and lobby renovation to commence in Q4 ($6.4 million)
Embassy Suites Santa Clara: Guestroom, lobby renovation and fitness area renovations. ($10.7 million)
Paid parking system installation nearly complete.
Residence Inn Orlando SeaWorld: Guestroom/corridor renovation ($10.1 million)
Residence Inn Tampa Downtown: Guestroom renovation ($3.5 million)
Hilton Tampa Westshore: Guestroom and meeting space renovation ($8.5 million)
Renaissance Palm Springs: Guestroom, restaurant, meeting space and public area renovation ($14
million)
Courtyard Crystal City: Guestroom renovations including bath to shower conversions in King rooms
($10.4 million)

Debt Maturities and Leverage
Target Net Debt/Gross Assets of 55-60%
Maintain mix of fixed and floating rate debt (Currently 88% floating & 12% fixed)
Ladder maturities
Exclusive use of property-level, non-recourse debt
All floating rate debt has interest rate caps
18
As of June 30, 2017
(1) Assumes extension options are exercised
Note: All debt yield statistics are based on EBITDA to principal.
Debt Maturity Schedule (mm)(1)
Debt Yield:
14.9%
Debt Yield:
12.6%
Debt Yield:
15.9%
Debt Yield:
11.5%
Debt Yield:
11.4%
$95.2
$5.4
$96.0
$255.0
$533.0
$710.7
$1,384.2
$630.8
$0.0
$200.0
$400.0
$600.0
$800.0
$1,000.0
$1,200.0
$1,400.0
$1,600.0
2017 2018 2019 2020 2021 Thereafter
Fixed-Rate Floating-Rate

Capital Structure and Net Working Capital
Appropriate use of leverage
Current net working capital of approximately $4.40 per share(1)
All debt is non-recourse, property level mortgage debt
Targeted cash balance of 25% to 30% of equity market capitalization
Provides flexibility for opportunistic investments & working capital needs and a
hedge against unfavorable economic shocks
19
(1) As of June 30, 2017; Figures in millions except per share values
(2) At market value as of September 8, 2017
Enterprise Value (1) Net Working Capital (1)
Stock Price (As of September 8, 2017) $6.31
Fully Diluted Shares Outstanding 117.6
Equity Value $742.0
Plus: Preferred Equity 553.1
Plus: Debt 3,708.1
Total Market Capitalization $5,003.3
Less: Net Working Capital (517.7)
Total Enterprise Value $4,485.6
Cash & Cash Equivalents $404.3
Restricted Cash 150.3
Investment in Securities 19.3
Accounts Receivable, net 56.7
Prepaid Expenses 24.1
Due From Affiliates, net (15.5)
Due from Third Party Hotel Managers 16.9
Market V lue of Ashford, Inc. Investment (2) 34.7
Total Current Assets $690.9
Accounts Payable, net & Accrued Expenses $147.0
Dividends Payable 26.2
Total Current Liabilities $173.1
Net Working Capital $517.7

Corporate Governance Enhancements
20
Modification of the Company’s Equity Incentive Plan:
Requires stock ownership by directors and officers
Requires minimum vesting periods
Modification of the Company’s By-Laws:
Reduced to 30% of outstanding shares to call a special meeting
Modification of the Company’s Stock Ownership Guidelines:
Increases the required share ownership for directors (3x to 4x)
Investor Feedback:
Shared with Board at quarterly board meetings
Separation of Chairman and CEO roles:
Effective February 2017

Board of Directors Diversity Matrix
Professional Experience Geography Independence Age Ethnicity Tenure
Real Estate /
Hospitality
C-Suite
Executive
Entrepreneurship Legal
South-
West
West
Coast
North-
East
South-
East
Independent 25-40 41-55 56-70
White /
Caucasian
Middle
Eastern/
South Asia
Years
Monty J.
Bennett 14
Benjamin
J. Ansell,
M.D.
8
Fred
Kleisner 1
Amish
Gupta
3
Kamal
Jafarnia 4
Philip S.
Payne 14
Alan L.
Tallis 4
21

Key Takeaways
22
Opportunistic platform focused on upper upscale, full-
service hotels
Aligned management team with a long track record
of creating shareholder value
Highest dividend yield in the industry

Company Presentation – September 2017
