Attached files
| file | filename |
|---|---|
| 8-K - 8-K - DOVER Corp | a201709128-k.htm |
| EX-99.2 - EXHIBIT 99.2 - DOVER Corp | a201709128-kexhibit992.htm |

Wellsite Separation
September 12, 2017
Exhibit 99.1

2
Forward Looking Statements
This slide presentation may contain "forward-looking" statements within the meaning of the Private Securities
Litigation Reform Act of 1995. These statements include, but are not limited to, statements related to the potential
separation of our upstream energy businesses (collectively, the Wellsite business), including any potential spin-off,
sale or other strategic transaction. All statements other than statements of historical fact are statements that are, or
could be deemed, “forward-looking” statements. Words such as “may,” “will,” "anticipates," "expects," "believes,"
"suggests," "plans," "should," "would," "could," and "forecast," or others of similar meaning generally identify forward-
looking statements. Forward-looking statements are subject to numerous important risks, uncertainties, assumptions
and other factors, some of which are beyond the company’s control. These factors include, but are not limited to,
uncertainties as to the structure and timing of any separation transaction and whether it will be completed, the
possibility that closing conditions for a separation transaction may not be satisfied or waived, the impact of the
strategic review and any separation transaction on Dover and the Wellsite business on a standalone basis if the
separation is completed, and whether the strategic benefits of separation can be achieved. Other factors include
those discussed in the documents Dover files from time to time with the Securities and Exchange Commission, such
as its reports on Form 10-K, Form 10-Q and Form 8-K. Dover refers you to those documents for a discussion of the
risks and uncertainties that could cause its actual results to differ materially from its current expectations and from the
forward-looking statements made during this presentation. Any forward-looking statements included in this slide
presentation are made only as of the date they are made and we undertake no obligation to update such statements
to reflect events or circumstances occurring after the date of this slide presentation except as required by law.
This slide presentation includes certain non-GAAP financial measures about Dover’s Energy segment, including
Adjusted Earnings and Adjusted EBITDA. These non-GAAP financial measures should be considered only as
supplemental to, and not as superior to, financial measures prepared in accordance with U.S. GAAP. Please refer to
the Appendix of this presentation for definitions of non-GAAP financial measures included in this presentation and a
reconciliation to the most directly comparable financial measures prepared in accordance with U.S. GAAP.
We would also direct your attention to our website, dovercorporation.com, where considerably more information can
be found.

3
Summary of Today’s Press Release
Completed a strategic review of our portfolio
Evaluating strategic alternatives for the separation of Dover’s upstream
energy businesses (together referred to as “Wellsite”)
- Wellsite includes Dover Artificial Lift, Dover Energy Automation and US
Synthetic
Range of strategic alternatives being evaluated, including a tax-free spin-
off, sale or other strategic combination
Focused on pursuing a separation of Wellsite that creates the best long-
term results for the businesses and the greatest value for shareholders
Expect to have assessment of separation alternatives completed by the
end of the year
Dover core platform businesses are well-positioned for long-term
sustainable growth and returns

4
Wellsite: Artificial Lift, Automation and Drill Bit Inserts
Overview and Key Brands Financial Highlights
Dover Artificial Lift
(62% of 2017E
Wellsite Revenue)
Dover Energy
Automation
(16% of 2017E
Wellsite Revenue)
US Synthetic
(22% of 2017E
Wellsite Revenue)
$753 $876
$1,016
2016A LTM 2017E
$140
$195
$250
2016A LTM 2017E
% Adjusted EBITDA Margin
19% 22%
% YoY Growth
(30%)
Note: See appendix for definitions and reconciliations of non-GAAP financial measures
R
e
v
e
n
u
e
A
dj
.
E
B
IT
D
A
Leading provider of artificial
lift and production
optimization solutions
The most trusted partner in
the industry for artificial lift
Leading provider of
productivity tools and
performance management
software
Industry leader in the
development and
production of polycrystalline
diamond for oil & gas and
mining applications
35%
25%
Expect mid-
to-high
teens year-
over-year
organic
growth in
2018
~75% of revenues from U.S.
Expect 2018
incremental
margin to
remain
strong
2%
Wellsite is a great set of businesses that are leaders in their markets,
differentiated by their technology, customer service and trusted brands

5
Our Evolution Over Past 10 Years
Executed value-creating portfolio strategy, including strategic M&A as well
as non-core divestitures
Made organic investments to improve value-proposition for our customers
through new product innovations
Implemented significant operational improvements and enhanced
margins
Established shared services and Dover business systems across the
enterprise
Continued track record of balanced capital allocation including a strong
and growing dividend
Focused portfolio on key platforms with sustainable growth runway and
margin improvement potential

6
Our Focus on Long-Term Value Creation
6
Build platforms in attractive
markets with consistent
growth
Drive margin and cash flow
utilizing Dover business
system processes
Provide larger set of products
and solutions to customers
on a global basis
Invest to grow through
organic and inorganic actions
Platforms create opportunities
while leveraging channel and
customer synergies
Customer-focused innovation
creates value for our
customers and builds loyalty
Clear margin improvement
runway across businesses
plus strong & stable cash flow
Track record of value-creating
capital allocation through
strategic M&A and organic
investments
Regularly review portfolio to ensure alignment with long-term strategy

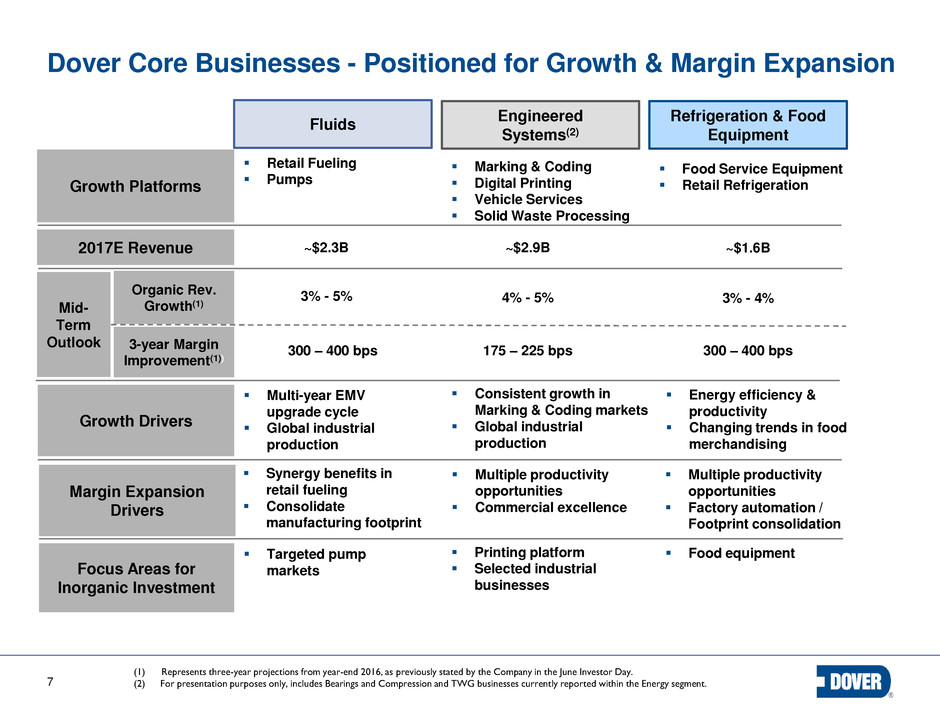
7
Marking & Coding
Digital Printing
Vehicle Services
Solid Waste Processing
Dover Core Businesses - Positioned for Growth & Margin Expansion
(1) Represents three-year projections from year-end 2016, as previously stated by the Company in the June Investor Day.
(2) For presentation purposes only, includes Bearings and Compression and TWG businesses currently reported within the Energy segment.
Fluids
Engineered
Systems(2)
Refrigeration & Food
Equipment
2017E Revenue
Mid-
Term
Outlook
Growth Drivers
Focus Areas for
Inorganic Investment
3% - 5%
~$2.3B ~$2.9B ~$1.6B
Organic Rev.
Growth(1)
3-year Margin
Improvement(1))
4% - 5% 3% - 4%
300 – 400 bps 175 – 225 bps 300 – 400 bps
Multi-year EMV
upgrade cycle
Global industrial
production
Consistent growth in
Marking & Coding markets
Global industrial
production
Energy efficiency &
productivity
Changing trends in food
merchandising
Targeted pump
markets
Printing platform
Selected industrial
businesses
Food equipment
Growth Platforms
Retail Fueling
Pumps
Food Service Equipment
Retail Refrigeration
Margin Expansion
Drivers
Synergy benefits in
retail fueling
Consolidate
manufacturing footprint
Multiple productivity
opportunities
Commercial excellence
Multiple productivity
opportunities
Factory automation /
Footprint consolidation

8
Core Growth Platforms Over Time
8
2010 – 2017E Annual Organic Revenue Growth
4.5% average
historical organic
growth
Without Wellsite,
Dover has same
strong organic
growth but with
lower volatility
Dover core
platforms serve
end markets with
attractive and
predictable growth
trends
Average Low High
Total
Dover
Dover ex.
Wellsite
4.4%
4.5%
Total
Dover
Dover ex.
Wellsite
Total
Dover
Dover ex.
Wellsite
20.6%
17.7%
(9.8%)
(1.9%)

9
Summary and Recap
Exploring a full range of alternatives including a tax-free spin-off, sale or
other strategic combination
Expect to complete assessment of separation alternatives for Wellsite by the
end of the year
Strong focus on separation transaction that drives the best long-term results
for the businesses and the highest value for shareholders
Dover has sustainable growth runway and margin improvement potential
plus value-creating organic and inorganic investment opportunities
Our strategy for continued growth and returns is clear; we are confident in
our business system and ability to deliver on our targets

10

11
Appendix:
Reconciliation of Wellsite Financials to Dover Energy Segment
(1) Includes Bearings and Compression and TWG businesses currently reported within the Energy segment
(2) Includes segment eliminations, segment overhead expenses and acquisition-related amortization expenses, as applicable
(3) Last twelve months as of June 30, 2017
(4) D&A for Wellsite includes depreciation of $13M, $13M, and an estimate of $15M in 2016, LTM and 2017E, respectively, for assets used in customer leasing programs
(5) Includes amortization of acquisition-related intangibles in Segment Eliminations
Wellsite Non-Wellsite(1) Total Dover Energy
Segment
Eliminations(2)
(3) (3) (3) (3)
2016 LTM 2017E 2016 LTM 2017E 2016 LTM 2017E 2016 LTM 2017E
Revenue $753 $876 $1,016 $357 $376 $393 ($2) ($3) ($4) $1,108 $1,249 $1,406
Earnings $73 $141 $196 $64 $79 $84 ($82) ($80) ($82) $55 $139 $198
Restructuring Expenses 15 5 0 3 1 3 (0) (0) 0 18 7 3
Adj. Earnings $88 $146 $197 $67 $80 $87 ($82) ($80) ($82) $73 $146 $201
% Margin 12% 17% 19% 19% 21% 22% NA NA NA 7% 12% 14%
Dep. & Amort. (4) (5) $52 $49 $53 $12 $12 $12 $67 $66 $65 $131 $127 $131
Adj. EBITDA $140 $195 $250 $79 $93 $99 ($14) ($15) ($17) $205 $273 $332
% Margin 19% 22% 25% 22% 25% 25% NA NA NA 18% 22% 24%
(as reported)
Note: Earnings represents earnings before interest and tax. Adjusted Earnings is calculated by adding back restructuring expenses to earnings. Adjusted EBITDA is calculated by
adding back depreciation and amortization expense and restructuring charges to earnings, which is the most directly comparable GAAP measure. We do not present segment
net income because corporate expenses are not allocated at a segment level. Totals may be impacted due to rounding.
