Attached files
| file | filename |
|---|---|
| 8-K - 8-K - Equity Commonwealth | a17-21546_18k.htm |
Forward-Looking Statements Some of the statements contained in this presentation constitute forward-looking statements within the meaning of the federal securities laws. Any forward-looking statements contained in this presentation are intended to be made pursuant to the safe harbor provisions of Section 21E of the Securities Exchange Act of 1934. Forward-looking statements relate to expectations, beliefs, projections, future plans and strategies, anticipated events or trends and similar expressions concerning matters that are not historical facts. In some cases, you can identify forward-looking statements by the use of forward-looking terminology such as “may,” “will,” “should,” “expects,” “intends,” “plans,” “anticipates,” “believes,” “estimates,” “predicts,” or “potential” or the negative of these words and phrases or similar words or phrases which are predictions of or indicate future events or trends and which do not relate solely to historical matters. You can also identify forward-looking statements by discussions of strategy, plans or intentions. The forward-looking statements contained in this presentation reflect our current views about future events and are subject to numerous known and unknown risks, uncertainties, assumptions and changes in circumstances that may cause our actual results to differ significantly from those expressed in any forward-looking statement. We do not guarantee that the transactions and events described will happen as described (or that they will happen at all). The following factors, among others, could cause actual results and future events to differ materially from those set forth or contemplated in the forward-looking statements: changes in the real estate industry, particularly in those markets in which our properties are located; our ability to raise equity or debt capital; the future amount of leasing activity and occupancy rates at our properties; the future rent rates we will be able to charge at our properties; the costs we may incur to lease space in our properties; our ability to declare or pay distributions to our shareholders and the amounts of such distributions; the credit quality of our tenants; the likelihood that our tenants will pay rent, renew leases, enter into new leases or be affected by cyclical economic conditions; our sales of properties; our ability to compete for tenancies effectively; our ability to pay interest on and principal of our debt; our ability to obtain credit facilities, and the availability of borrowings under those credit facilities; and our tax status as a REIT. While forward-looking statements reflect our good faith beliefs, they are not guarantees of future performance. We disclaim any obligation to publicly update or revise any forward-looking statement to reflect changes in underlying assumptions or factors, of new information, data or methods, future events or other changes. For a further discussion of these and other factors that could cause our future results to differ materially from any forward-looking statements, see the sections entitled “Risk Factors” in our Annual Report on Form 10-K for the year ended December 31, 2016. NOTE: DatainpresentationasoJfune302, 017unlessotherwisenoted. Seepage12fodr efinitionsocfertaintermsusedinthepresentation. Seepage13foareconciliationonf on-GAAPmeasures. 2 September 2017
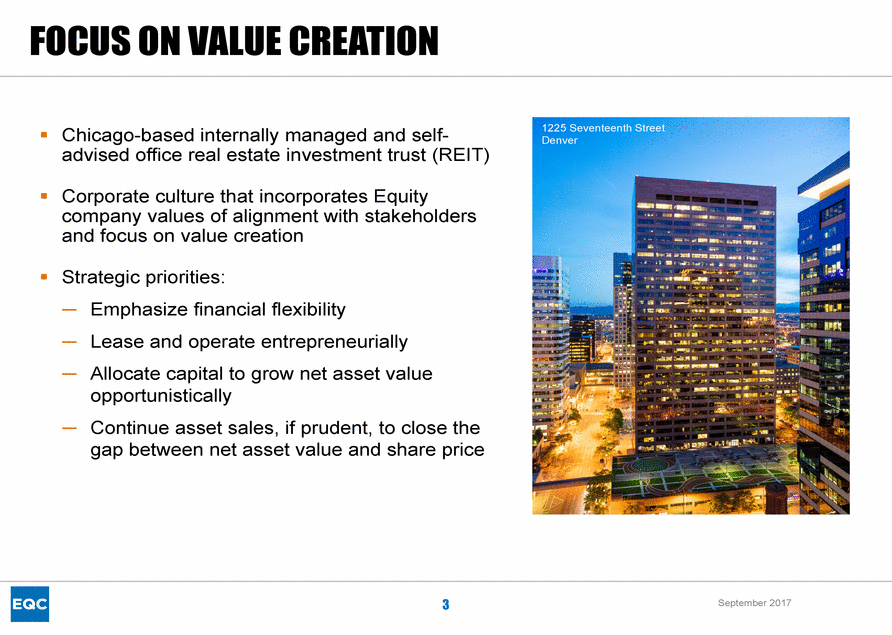
FOCUOSVNALUCEREATION 1225 Seventeenth Street Denver Chicago-based internally managed and self-advised office real estate investment trust (REIT) Corporate culture that incorporates Equity company values of alignment with stakeholders and focus on value creation Strategic priorities: — — — Emphasize financial flexibility Lease and operate entrepreneurially Allocate capital to grow net asset value opportunistically Continue asset sales, if prudent, to close the gap between net asset value and share price — 3 September 2017
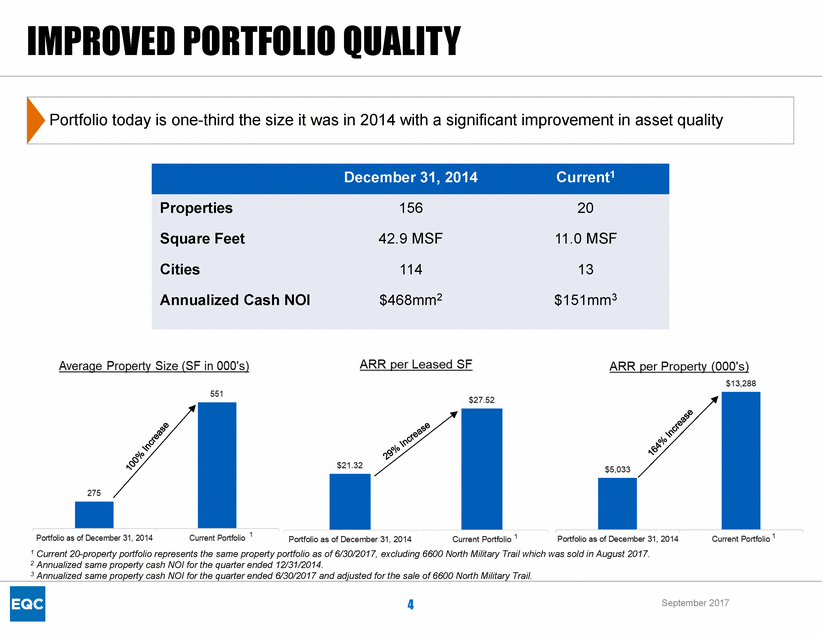
IMPROVEPDORTFOLIQOUALITY 1 1 1 1 Curren2t 0-propertyportfoliorepresentsthesamepropertyportfo 2 AnnualizedsamepropertycashNOfIotrhequarteer nded12/31/2014. lioaso6f /30/2017e, xcluding6600NorthMilitaryTrawil hich wasoldinAugus2t 017. 3 AnnualizedsamepropertycashNOfIotrhequarteer nded6/30/2017andadjustedfotrhesaleo6f 600NorthMilitaryTrail. 4 September 2017 December 31, 2014 Current1 Properties 156 20 Square Feet 42.9 MSF 11.0 MSF Cities 114 13 Annualized Cash NOI $468mm2 $151mm3 Portfolio today is one-third the size it was in 2014 with a significant improvement in asset quality
PORTFOLICOONCENTRATION NoteP: ercenlteasedstatisticshownaso8f /31/2017. 5 September 2017 80% of ARR is concentrated in these select EQC markets
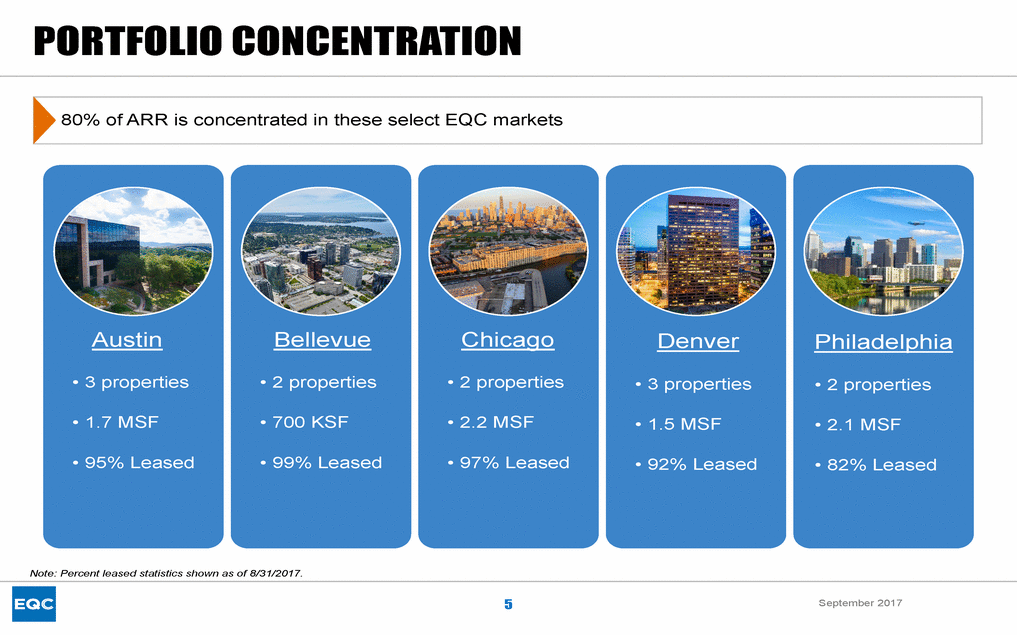
SIGNIFICANBTALANCSEHEECTAPACITY $2.5bn of cash1 | $20 per share 0.7% Secured Debt to Adjusted Total Assets $750mm Undrawn Unsecured Credit Facility 22.1% Debt to Adjusted Total Assets $135mm Annualized interest expense savings2 (4.5)x Net Debt to Adjusted EBITDA 3.1x Fixed Charge Coverage NoteA: sseSt alesandCashBalanceaso9f /8/2017a; oll thedr ataaso6f /30/2017unlessotherwisenoted. 1 SeeCashBalancedefinitiononpage12. 2 Annualizedintereset xpensesavingscalculatedonpreferreds Notesredeemedon7/15/2017. hareanddebrtepaymentsfrom12/31/2014to6/30/2017andalsoinc ludingthe$250mm6.65%SenioUr nsecured 6 September 2017 $4.7bn in asset sales and $2.4bn of deleveraging have created significant balance sheet capacity for future opportunities
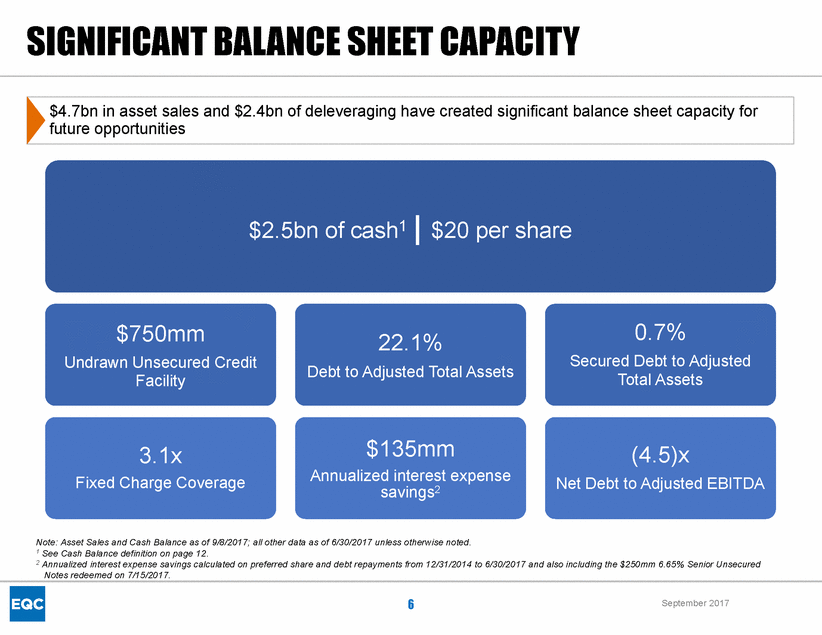
IMPLIECDARPATE Sold $4.9bn of lower quality assets in less favorable markets, at a weighted average cap rate in the low 7% range Common Equity (as of 9/08/2017) Debt Preferred Equity $ 3,868,646 859,667 122,880 EQC shares, backed by a 20-property portfolio of higher quality assets in stronger markets, trade at a 7% implied cap rate Total Market Capitalization $ $ 4,851,193 2,504,960 (69,273) 2 Less: Cash Balance Less: Other assets/liabilities, net — Implied cap rate utilizes 2Q17 Annualized Adjusted Cash NOI of $170mm with a commenced occupancy of 85.5% Implied RE Value 2Q17 SP Cash NOI - Annualized 2Q17 SP Free Rent - Annualized $ $ 2,415,507 151,264 18,800 — 70% of Annualized Rental Revenue is from Class A office assets Annualized Adjusted Cash NOI Implied Cap Rate $ 170,064 7.0% N/A3 low-7% high 6% mid-8% Austin CBD SUB CBD CBD CBD CBD SUB CBD CBD 2.4% 9.5% 11.0% 4.1% 25.0% 8.0% 6.3% 17.7% 6.1% 5.50% 6.50% 4.75% 5.25% 5.75% 5.50% 7.25% 6.75% 5.00% 6.25% 7.50% 5.50% 5.50% 6.75% 7.00% 8.25% 7.75% 5.50% 2014 2015 2016 2017 $ 920,700 1,999,413 1,259,895 755,675 Bellevue/Seattle Boston Chicago Denver Total $ 4,935,683 low-7% NoteD: ollarsinchartshowninthousands. 1 SeeImpliedCapRatedefinitiononpage12. 2 SeeCashBalancedefinitiononpage12. 3 Salesin2014includeproceedsfromthesaleoSf IRcommonsharesfo$r 704.8millionand asaresulact aprateisnoat pplicable. 4 Markectapratesaso6f /30/2017peCr BRE. Philadelphia Washington D.C. Total/ Weighted Avg 90.0% 5.91% 6.85% 7 September 2017 % of EQC Class A Market Class B Market Markets ARR Cap Rates4 Cap Rates4 Weighted Average Cap Total Sales Rate Range Implied Cap Rate Analysis1 With substantial progress repositioning the company to date, the portfolio continues to trade at a meaningful discount to NAV
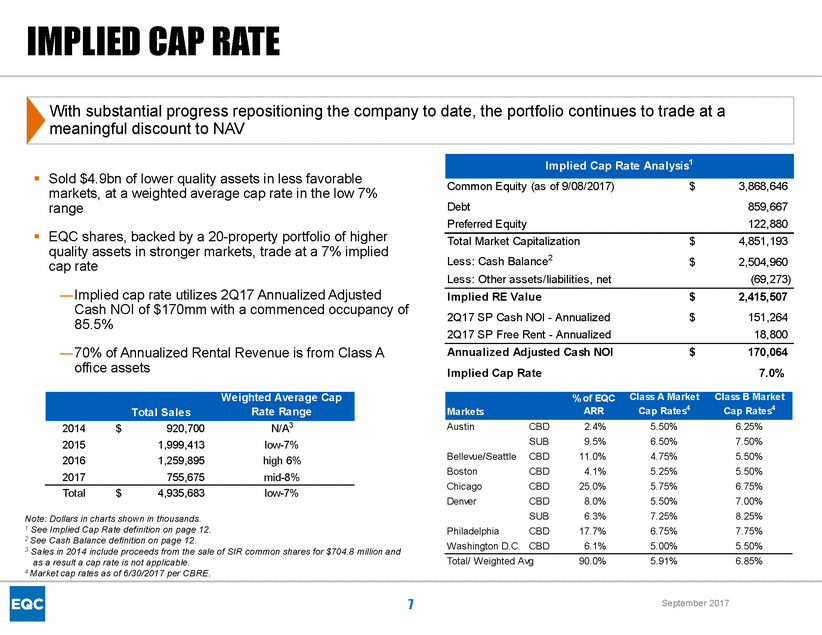
STRATEGIFCOCUS Keen focus on leasing opportunities — 1735 Market Philadelphia, PA – 116 KSF leased but not yet occupied; 247 KSF vacant; 80.8% leased1 — 1225 Seventeenth Street Denver, CO – 28 KSF leased but not yet occupied; 113 KSF vacant; 83.1% leased1 Get ahead of large upcoming vacancies — 333 108th Avenue Bellevue, WA – Focused on backfilling the Expedia space, ~427 KSF expected vacancy at the beginning of 2020, the largest block of space in a strong, large tenant market Evaluate organic growth opportunities — 1 MSF potential development opportunity at Bellevue Corporate Plaza (600 E 108th Ave NE) — Research Park sits on 177 acres of land in Austin, TX Continue to sell assets when prudent — Balancing leasing efforts with dispositions when able to achieve attractive pricing Preserve balance sheet capacity for future growth opportunities — — — Cash balance of $2.5bn, or $20 per share, including marketable securities Minimal near-term maturities with $860mm of debt outstanding2 Remain disciplined when evaluating capital allocation opportunities, including new investments, share repurchases, debt repayments and special distributions 1 Percenlteasedaso8f /31/2017. 2 Adjustedfotrheredemptionotfhe$250mm6.65%SenioUr nsecuredNoteson7/15/2017. 8 September 2017 Focus on closing the gap between our stock price and NAV by continuing to reposition the portfolio, while increasingly shifting focus to capital allocation
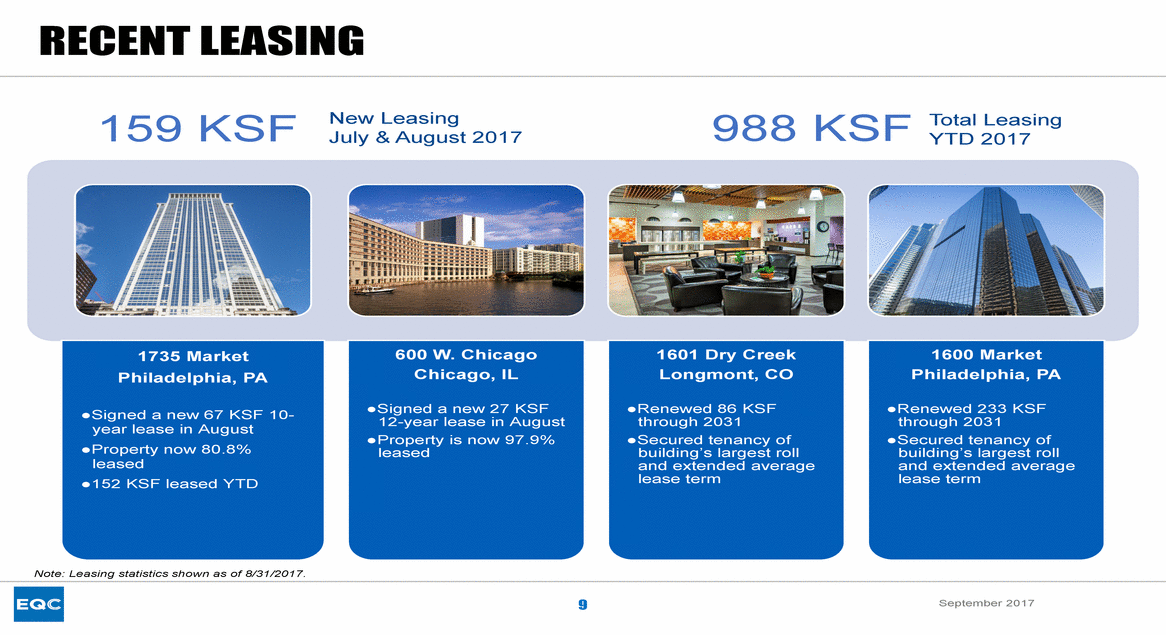
RECENLTEASING New Leasing July & August 2017 988 KSF 159 KSF Total Leasing YTD 2017 NoteL: easingstatisticshownaso8f /31/2017. 9 September 2017
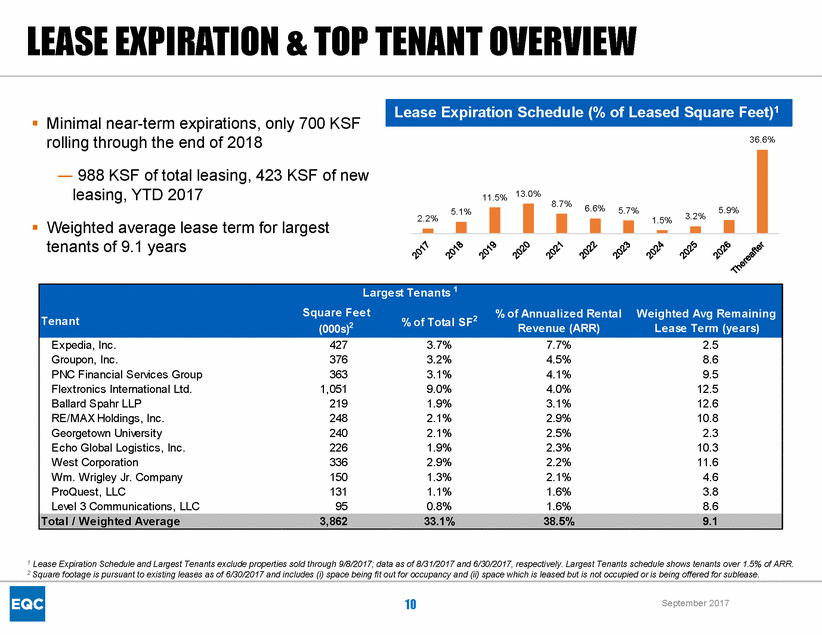
LEASEEXPIRATIOT&NOTPENANOTVERVIEW Minimal near-term expirations, only 700 KSF rolling through the end of 2018 36.6% — 988 KSF of total leasing, 423 KSF of new leasing, YTD 2017 8.7% 6.6% 5.9% 5.7% 3.2% 1.5% Weighted average lease term for largest tenants of 9.1 years % of Total SF2 Tenant 1 LeaseExpirationScheduleandLargesTt enantsexcludepropertiesoldthrough9/8/2017d; at aso8f /31/2017and6/30/2017r,es 2 Squarefootageispursuanttoexistingleasesaso6f /30/2017andincludes(is)pacebeingfiot uftoor ccupancyand(iis)pace pectivelyL. argesTt enantschedule showstenantsove1r .5%oAf RR. whichisleasedbuitsnot ccupiedoirsbeingofferedfosrublease. 10 September 2017 Largest Tenants 1 Square Feet % of Annualized Rental Weighted Avg Remaining (000s)2 Revenue (ARR) Lease Term (years) Expedia, Inc. 427 3.7% 7.7% 2.5 Groupon, Inc. 376 3.2% 4.5% 8.6 PNC Financial Services Group 363 3.1% 4.1% 9.5 Flextronics International Ltd. 1,051 9.0% 4.0% 12.5 Ballard Spahr LLP 219 1.9% 3.1% 12.6 RE/MAX Holdings, Inc. 248 2.1% 2.9% 10.8 Georgetown University 240 2.1% 2.5% 2.3 Echo Global Logistics, Inc. 226 1.9% 2.3% 10.3 West Corporation 336 2.9% 2.2% 11.6 Wm. Wrigley Jr. Company 150 1.3% 2.1% 4.6 ProQuest, LLC 131 1.1% 1.6% 3.8 Level 3 Communications, LLC 95 0.8% 1.6% 8.6 Total / Weighted Average 3,862 33.1% 38.5% 9.1 11.5% 13.0% 5.1% 2.2% Lease Expiration Schedule (% of Leased Square Feet)1
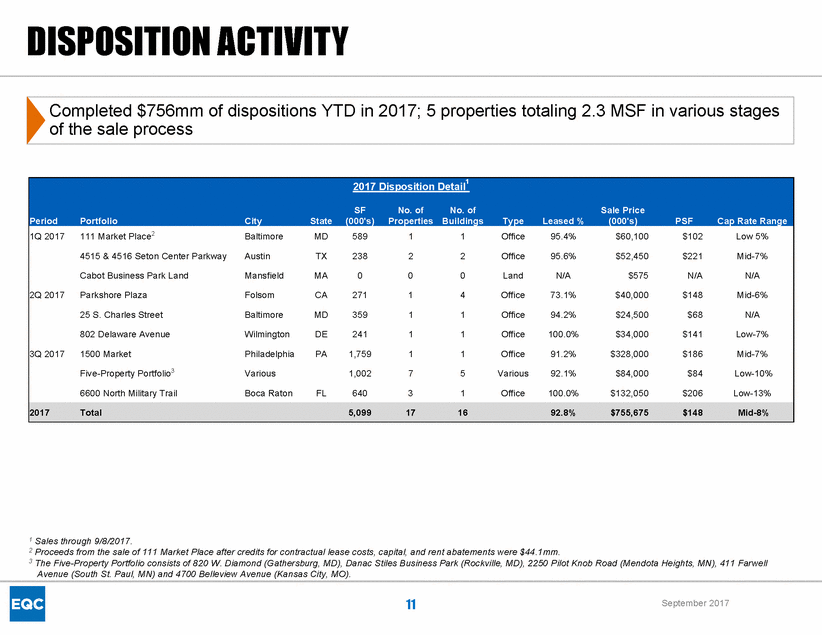
DISPOSITIOANCTIVITY 1 Salesthrough9/8/2017. 2 Proceedsfromthesaleo1f 11MarkePt laceaftecrreditsfocr 3 TheFive-PropertyPortfolioconsistso8f 20WD. iamond(Gathers Avenue(SouthStP. aulM, Na) nd4700BelleviewAvenue(KansasCityM, O). ontractualleasecostsc,apitala, ndrenat batementswere$44.1mm . burgM, D)D, anacStilesBusine ssPark(Rockville M, D)2, 250Pilo Kt nobRoad(MendotaHeightsM, N)4, 11Farwell 11 September 2017 2017 Disposition Detail1 SF No. of No. of Sale Price Period Portfolio City State (000's) Properties Buildings Type Leased % (000's) PSF Cap Rate Range 1Q 2017 111 Market Place2 Baltimore MD 589 1 1 Office 95.4% $60,100 $102 Low 5% 4515 & 4516 Seton Center Parkway Austin TX 238 2 2 Office 95.6% $52,450 $221 Mid-7% Cabot Business Park Land Mansfield MA 0 0 0 Land N/A $575 N/A N/A 2Q 2017 Parkshore Plaza Folsom CA 271 1 4 Office 73.1% $40,000 $148 Mid-6% 25 S. Charles Street Baltimore MD 359 1 1 Office 94.2% $24,500 $68 N/A 802 Delaware Avenue Wilmington DE 241 1 1 Office 100.0% $34,000 $141 Low-7% 3Q 2017 1500 Market Philadelphia PA 1,759 1 1 Office 91.2% $328,000 $186 Mid-7% Five-Property Portfolio3 Various 1,002 7 5 Various 92.1% $84,000 $84 Low-10% 6600 North Military Trail Boca Raton FL 640 3 1 Office 100.0% $132,050 $206 Low-13% 2017 Total 5,099 17 16 92.8% $755,675 $148 Mid-8% Completed $756mm of dispositions YTD in 2017; 5 properties totaling 2.3 MSF in various stages of the sale process
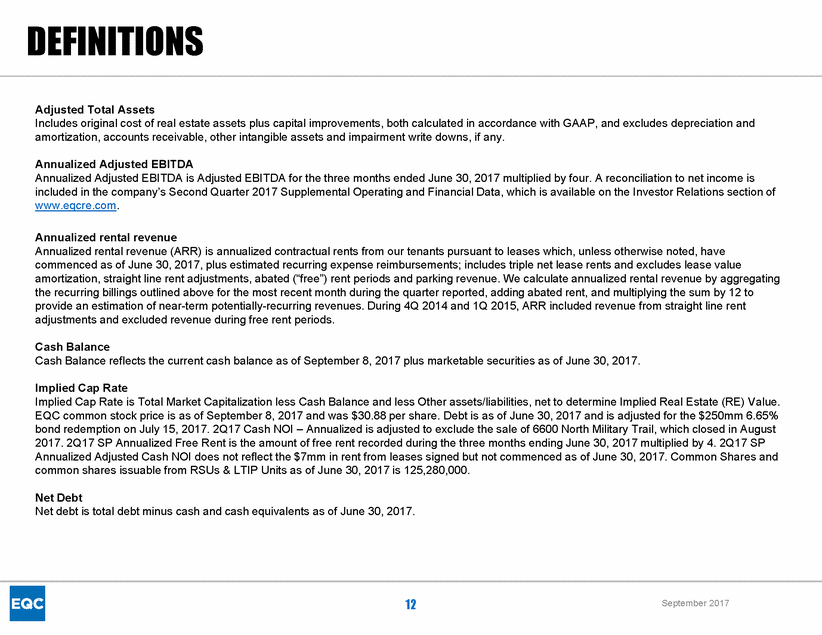
DEFINITIONS Adjusted Total Assets Includes original cost of real estate assets plus capital improvements, both calculated in accordance with GAAP, and excludes depreciation and amortization, accounts receivable, other intangible assets and impairment write downs, if any. Annualized Adjusted EBITDA Annualized Adjusted EBITDA is Adjusted EBITDA for the three months ended June 30, 2017 multiplied by four. A reconciliation to net income is included in the company’s Second Quarter 2017 Supplemental Operating and Financial Data, which is available on the Investor Relations section of www.eqcre.com. Annualized rental revenue Annualized rental revenue (ARR) is annualized contractual rents from our tenants pursuant to leases which, unless otherwise noted, have commenced as of June 30, 2017, plus estimated recurring expense reimbursements; includes triple net lease rents and excludes lease value amortization, straight line rent adjustments, abated (“free”) rent periods and parking revenue. We calculate annualized rental revenue by aggregating the recurring billings outlined above for the most recent month during the quarter reported, adding abated rent, and multiplying the sum by 12 to provide an estimation of near-term potentially-recurring revenues. During 4Q 2014 and 1Q 2015, ARR included revenue from straight line rent adjustments and excluded revenue during free rent periods. Cash Balance Cash Balance reflects the current cash balance as of September 8, 2017 plus marketable securities as of June 30, 2017. Implied Cap Rate Implied Cap Rate is Total Market Capitalization less Cash Balance and less Other assets/liabilities, net to determine Implied Real Estate (RE) Value. EQC common stock price is as of September 8, 2017 and was $30.88 per share. Debt is as of June 30, 2017 and is adjusted for the $250mm 6.65% bond redemption on July 15, 2017. 2Q17 Cash NOI – Annualized is adjusted to exclude the sale of 6600 North Military Trail, which closed in August 2017. 2Q17 SP Annualized Free Rent is the amount of free rent recorded during the three months ending June 30, 2017 multiplied by 4. 2Q17 SP Annualized Adjusted Cash NOI does not reflect the $7mm in rent from leases signed but not commenced as of June 30, 2017. Common Shares and common shares issuable from RSUs & LTIP Units as of June 30, 2017 is 125,280,000. Net Debt Net debt is total debt minus cash and cash equivalents as of June 30, 2017. 12 September 2017
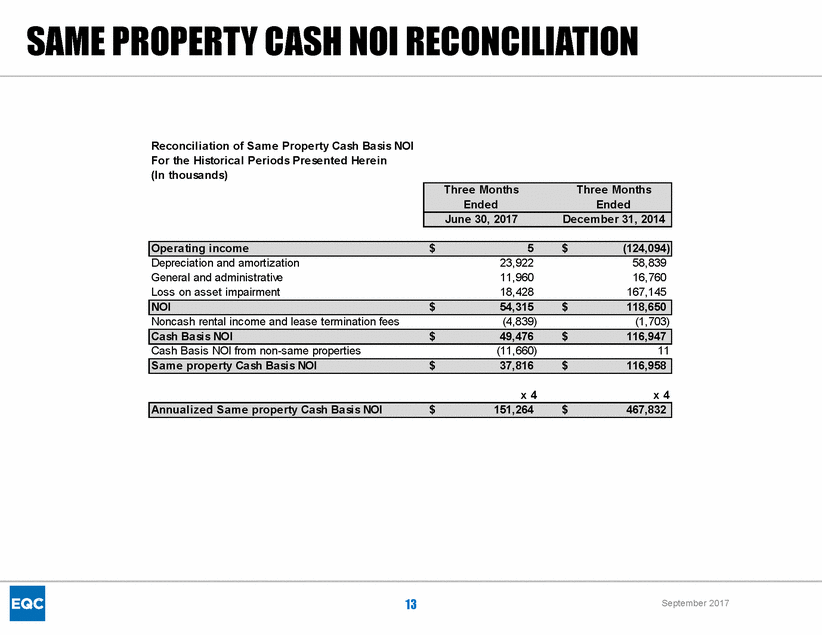
SAMPEROPERTCYASNHORIECONCILIATION Reconciliation of Same Property Cash Basis NOI For the Historical Periods Presented Herein (In thousands) Depreciation and amortization General and administrative Loss on asset impairment 23,922 11,960 18,428 58,839 16,760 167,145 Noncash rental income and lease termination fees (4,839) (1,703) Cash Basis NOI from non-same properties (11,660) 11 x 4 x 4 13 September 2017 Annualized Same property Cash Basis NOI $ 151,264 $ 467,832 Same property Cash Basis NOI $ 37,816 $ 116,958 Cash Basis NOI $ 49,476 $ 116,947 NOI $ 54,315 $ 118,650 Operating income $ 5 $ (124,094) Three Months Three Months Ended Ended June 30, 2017 December 31, 2014
