Attached files
| file | filename |
|---|---|
| EX-31.1 - EXHIBIT 31.1 - Equity Commonwealth | eqc123115exhibit311.htm |
| EX-12.2 - EXHIBIT 12.2 - Equity Commonwealth | eqc123115exhibit122.htm |
| EX-10.7 - EXHIBIT 10.7 - Equity Commonwealth | eqc123115exhibit107.htm |
| EX-10.5 - EXHIBIT 10.5 - Equity Commonwealth | eqc123115exhibit105.htm |
| EX-32.1 - EXHIBIT 32.1 - Equity Commonwealth | eqc123115exhibit321.htm |
| EX-21.1 - EXHIBIT 21.1 - Equity Commonwealth | eqc123115exhibit211.htm |
| EX-10.6 - EXHIBIT 10.6 - Equity Commonwealth | eqc123115exhibit106.htm |
| EX-12.1 - EXHIBIT 12.1 - Equity Commonwealth | eqc123115exhibit121.htm |
| EX-23.1 - EXHIBIT 23.1 - Equity Commonwealth | eqc123115exhibit231.htm |
| EX-10.4 - EXHIBIT 10.4 - Equity Commonwealth | eqc123115exhibit104.htm |
| EX-31.2 - EXHIBIT 31.2 - Equity Commonwealth | eqc123115exhibit312.htm |
| EX-10.18 - EXHIBIT 10.18 - Equity Commonwealth | eqc123115exhibit1018.htm |
| EX-10.8 - EXHIBIT 10.8 - Equity Commonwealth | eqc123115exhibit108.htm |
UNITED STATES
SECURITIES AND EXCHANGE COMMISSION
WASHINGTON, D.C. 20549
FORM 10-K
ý ANNUAL REPORT PURSUANT TO SECTION 13 OR 15(d) OF THE SECURITIES EXCHANGE ACT OF 1934
For the fiscal year ended December 31, 2015
OR
o TRANSITION REPORT PURSUANT TO SECTION 13 OR 15(d) OF THE SECURITIES EXCHANGE ACT OF 1934
Commission File Number 1-9317
EQUITY COMMONWEALTH
(Exact Name of Registrant as Specified in Its Charter)
Maryland | 04-6558834 | |
(State or Other Jurisdiction of Incorporation or Organization) | (IRS Employer Identification No.) | |
Two North Riverside Plaza, Suite 2100, Chicago, IL | 60606 | |
(Address of Principal Executive Offices) | (Zip Code) | |
(312) 646-2800 |
(Registrant’s Telephone Number, Including Area Code) |
Securities registered pursuant to Section 12(b) of the Act:
Title Of Each Class | Name of Each Exchange On Which Registered | |
Common Shares of Beneficial Interest | New York Stock Exchange | |
6 1/2% Series D Cumulative Convertible Preferred Shares of Beneficial Interest | New York Stock Exchange | |
7 1/4% Series E Cumulative Redeemable Preferred Shares of Beneficial Interest | New York Stock Exchange | |
5.75% Senior Notes due 2042 | New York Stock Exchange | |
Securities registered pursuant to Section 12(g) of the Act: None
Indicate by check mark if the registrant is a well-known seasoned issuer, as defined in Rule 405 of the Securities Act. Yes ý No o
Indicate by check mark if the registrant is not required to file reports pursuant to Section 13 or Section 15(d) of the Act. Yes o No ý
Indicate by check mark whether the registrant: (1) has filed all reports required to be filed by Section 13 or 15(d) of the Securities Exchange Act of 1934 during the preceding 12 months (or for such shorter period that the registrant was required to file such reports), and (2) has been subject to such filing requirements for the past 90 days. Yes ý No o
Indicate by check mark whether the registrant has submitted electronically and posted on its corporate Web site, if any, every Interactive Data File required to be submitted and posted pursuant to Rule 405 of Regulation S-T (§232.405 of this chapter) during the preceding 12 months (or for such shorter period that the registrant was required to submit and post such files). Yes ý No o
Indicate by check mark if disclosure of delinquent filers pursuant to Item 405 of Regulation S-K is not contained herein, and will not be contained, to the best of registrant's knowledge, in definitive proxy or information statements incorporated by reference in Part III of this Form 10-K or any amendment to this Form 10-K. ý
Indicate by check mark whether the registrant is a large accelerated filer, an accelerated filer, a non-accelerated filer, or a smaller reporting company. See the definitions of “large accelerated filer,” “accelerated filer” and “smaller reporting company” in Rule 12b-2 of the Exchange Act. (Check One):
Large accelerated filer x | Accelerated filer o | |
Non-accelerated filer o | Smaller reporting company o | |
(Do not check if a smaller reporting company) | ||
Indicate by check mark whether the registrant is a shell company (as defined in Rule 12b-2 of the Exchange Act). Yes o No ý
The aggregate market value of the voting common shares of beneficial ownership, $0.01 par value, or common shares, of the registrant held by non-affiliates was $3.3 billion based on the $25.67 closing price per common share on the New York Stock Exchange on June 30, 2015.
Number of registrant’s common shares of beneficial interest, $0.01 par value per share, outstanding as of February 16, 2016: 125,925,375.
DOCUMENTS INCORPORATED BY REFERENCE
Certain Information required by Items 10, 11, 12, 13 and 14 of Part III of this Annual Report on Form 10-K is incorporated herein by reference to the definitive Proxy Statement for the 2015 Annual Meeting of Shareholders, which Equity Commonwealth intends to file no later than 120 days after the end of its fiscal year ended December 31, 2015, or our definitive Proxy Statement.
FORWARD LOOKING STATEMENTS
Some of the statements contained in this Annual Report on Form 10-K constitute forward-looking statements within the meaning of the federal securities laws. Any forward-looking statements contained in this Annual Report on Form 10-K are intended to be made pursuant to the safe harbor provisions of Section 27A of the Securities Act of 1933, as amended, or the Securities Act, and Section 21E of the Securities Exchange Act of 1934, as amended, or the Exchange Act. Forward-looking statements relate to expectations, beliefs, projections, future plans and strategies, anticipated events or trends and similar expressions concerning matters that are not historical facts. In particular, statements pertaining to our capital resources, portfolio performance and results of operations contain forward-looking statements. Likewise, all of our statements regarding anticipated growth in our funds from operations and anticipated market conditions are forward-looking statements. In some cases, you can identify forward-looking statements by the use of forward-looking terminology such as “may,” “will,” “should,” “expects,” “intends,” “plans,” “anticipates,” “believes,” “estimates,” “predicts,” or “potential” or the negative of these words and phrases or similar words or phrases which are predictions of or indicate future events or trends and which do not relate solely to historical matters. You can also identify forward-looking statements by discussions of strategy, plans or intentions.
The forward-looking statements contained in this Annual Report on Form 10-K reflect our current views about future events and are subject to numerous known and unknown risks, uncertainties, assumptions and changes in circumstances that may cause our actual results to differ significantly from those expressed in any forward-looking statement. We do not guarantee that the transactions and events described will happen as described (or that they will happen at all). We disclaim any obligation to publicly update or revise any forward-looking statement to reflect changes in underlying assumptions or factors, of new information, data or methods, future events or other changes. For a further discussion of these and other factors that could cause our future results to differ materially from any forward-looking statements, see the section entitled “Risk Factors” in this Annual Report on Form 10-K.
EQUITY COMMONWEALTH
2015 FORM 10-K ANNUAL REPORT
Table of Contents
EXPLANATORY NOTE
References in this Annual Report on Form 10-K to the Company, EQC, we, us or our, refer to Equity Commonwealth and its consolidated subsidiaries as of December 31, 2015, unless the context indicates otherwise.
PART I
Item 1. Business.
The Company. We are an internally managed and self-advised real estate investment trust, or REIT, engaged in the ownership and operation primarily of office buildings throughout the United States. We were formed in 1986 under Maryland law and we have elected to be taxed as a REIT under the Internal Revenue Code of 1986, as amended (the Code).
At December 31, 2015, our portfolio included 65 properties (127 buildings) with a combined 24.0 million square feet for a total investment of $3.9 billion at cost and a depreciated book value of $3.0 billion. Following our transition from external management to internal management in 2014, we undertook a comprehensive review of our portfolio and our operations and developed a strategy that focuses on reshaping our portfolio to higher quality assets. We are in the process of executing this strategy and disposed of 91 properties (135 buildings) and one land parcel during 2015, with a combined 18.9 million square feet for an aggregate gross sales price of $2.0 billion, excluding closing costs. As a result of these dispositions, we have concentrated our portfolio, exiting 68 cities, seven states and one country.
We have generated significant proceeds from dispositions and have a cash balance of $1.8 billion as of December 31, 2015. We are seeking to reinvest capital in opportunities that offer a compelling risk-reward profile in order to create a foundation for long-term growth. We also remain focused on creating value through proactive asset management and improving operating results.
As of December 31, 2015, we had 66 full-time employees.
Our principal executive offices are located at Two North Riverside Plaza, Suite 2100, Chicago, Illinois 60606, and our telephone number is (312) 646-2800.
Policies with Respect to Certain Activities
The discussion below sets forth certain additional information regarding our investment, disposition and financing policies. These policies are established by our Board of Trustees and may be changed by our Board of Trustees at any time without shareholder approval.
Investment Policies. In evaluating potential investments and asset sales, we consider various factors, including but not limited to the following:
• | the historical and projected rents received and likely to be received from the property; |
• | the historical and expected operating expenses, including real estate taxes, incurred and expected to be incurred at the property; |
• | the growth, tax and regulatory environments of the market in which the property is located; |
• | the quality, experience and credit worthiness of the property's tenants; |
• | occupancy and demand for similar properties in the same or nearby markets; |
• | the construction quality, physical condition and design of the property, and expected capital expenditures that may be needed to be made to the property; |
• | the location and type of property; and |
• | the pricing of comparable properties as evidenced by recent market sales. |
We have no policies which specifically limit the percentage of our assets which may be invested in any individual property, in any one type of property, in properties in one geographic area, in properties leased to any one tenant or in properties leased to an affiliated group of tenants.
We generally prefer 100% owned investments in fee interests. However, circumstances may arise in which we may invest in leaseholds, joint ventures, mortgages and other real estate interests. We may invest in real estate joint ventures if we conclude
1
that by doing so we may benefit from the participation of co-venturers or that our opportunity to participate in the investment is contingent on the use of a joint venture structure. We may invest in participating, convertible or other types of mortgages if we conclude that by doing so we may benefit from the cash flow or appreciation in the value of a property which is not available for purchase. Further, we have in the past provided seller financing for properties we have sold and may do so again in the future.
In the past, we have considered the possibility of entering into mergers or strategic combinations with other companies. We may undertake such considerations in the future. A principal goal of any such transaction will be to increase our profits and diversify their sources.
Disposition Policies. We have completed a significant number of dispositions over the past two years and currently anticipate disposing of a significant number of our properties as part of our business strategy to reposition our portfolio.
Our Board of Trustees adopted a strategy to consider disposing of assets that have one or more of the following attributes:
• | assets that do not offer an opportunity to create a competitive advantage, |
• | assets that are less than 150,000 square feet, |
• | assets that are not office buildings, |
• | assets that are not located in the U.S., or |
• | assets that produce a low cash yield or require significant capital expenditures. |
Disposition decisions are made based on a number of factors including those set forth above and the following:
• | the proposed sale price; and |
• | the existence of alternative sources, uses or needs for capital. |
The ability of our management team to implement this business strategy depends substantially on identifying and completing dispositions at favorable prices and successfully redeploying the capital received from dispositions. We expect to reinvest capital received from dispositions we complete but cannot provide any assurances that we will be successful. In addition, it may take a long period of time before we are able to reposition our portfolio.
Financing Policies. Our revolving credit facility and term loan agreements and our debt indenture and its supplements contain financial covenants that, among other things, restrict our ability to incur indebtedness and require us to maintain certain financial ratios and a minimum net worth. Our Board of Trustees may determine to seek additional capital through equity offerings, debt financings, retention of cash flows in excess of distributions to shareholders or a combination of these methods. Some of our properties are encumbered by mortgages. To the extent that our Board of Trustees decides to obtain additional debt financing, we may do so on an unsecured basis or a secured basis, subject to limitations in existing financing or other contractual arrangements; we may seek to obtain other lines of credit or to issue securities senior to our common and/or preferred shares, including preferred shares or debt securities which may be convertible into common shares or be accompanied by warrants to purchase common shares; or we may engage in transactions which involve a sale or other conveyance of properties to affiliated or unaffiliated entities. We may finance acquisitions by an exchange of properties, by borrowing under our credit facility, by assuming outstanding mortgage debt on the acquired properties, by the issuance of additional equity or debt securities or by using retained cash flow from operations which may exceed our earnings. The proceeds from any of our financings may be used to pay distributions, to provide working capital, to refinance existing indebtedness or to finance acquisitions and expansions of existing or new properties. We may from time to time re-evaluate and modify our financing policies in light of then current market conditions, relative availability and costs of debt and equity capital, the changing values of properties, growth and acquisition opportunities and other factors, and we may increase or decrease our ratio of debt to total capitalization.
Competition. Investing in and operating office real estate is a highly competitive business. We compete against other REITs, numerous financial institutions, individuals and public and private companies who are actively engaged in this business. Also, we compete for tenants and investments based on a number of factors including pricing, underwriting criteria and reputation. Our ability to successfully compete is also impacted by economic and population trends, availability of acceptable investment opportunities, our ability to negotiate beneficial leasing and investment terms, availability and cost of capital and new and existing laws and regulations. Some of our competitors are dominant in selected geographic markets, including in markets in which we operate. Many of our competitors have greater financial and other resources than we have.
For additional information on competition and the risks associated with our business, please see "Risk Factors" in Part I, Item 1A of this Annual Report on Form 10-K.
2
Environmental and Climate Change Matters. Under various environmental, health and safety laws, owners and operators, including tenants of real estate may be subject to liabilities resulting from the presence of hazardous substances, waste or petroleum products at, on, under, or emanating from such property, including costs for investigating and remediating or removing hazardous substances present at or migrating from such properties, liabilities for property damage or personal injuries, natural resource damages, and costs and losses arising from property use restrictions or diminution in value. We, or our tenants, also may incur liability for failing to comply with environmental, health and safety laws. We do not believe that there are environmental conditions or issues at any of our properties that have had or will have a material adverse effect on us. However, no assurances can be given that conditions or issues are not present at our properties or that costs we may be required to incur in the future to remediate contamination or comply with environmental, health and safety laws will not have a material adverse effect on our business or financial condition.
We estimate the cost to remove hazardous substances or address environmental issues at some of our properties based in part on environmental surveys conducted on our properties.
Some of our properties have been or may be impacted by releases of hazardous substances or petroleum products. Such contamination may arise from a variety of sources, including historic uses of our properties for commercial or industrial purposes, spills of such materials at adjacent properties, or releases from tanks used on our properties to store petroleum or hazardous substances. In addition, certain of our properties are on sites upon which or are adjacent to or near other properties upon which others, including former owners or tenants, have engaged, or may in the future engage, in activities that may release petroleum products or other hazardous or toxic substances. Though we have reviewed these and our other properties for potential environmental liabilities, we cannot assure that we have identified all potential environmental liabilities.
Certain of our buildings contain asbestos. We believe any asbestos in our buildings is contained in accordance with current regulations. If we remove the asbestos or renovate or demolish these properties, certain environmental regulations govern the manner in which the asbestos must be handled and removed, which could result in increased costs.
For more information regarding environmental matters and their possible adverse impact on us, see "Risk Factors-Risks Related to Our Business-We could incur significant costs and liabilities with respect to environmental matters” in Part I, Item 1A.
The current political debate about climate change has resulted in various treaties, laws and regulations which are intended to limit carbon emissions. We believe these laws being enacted or proposed may cause energy costs at our properties to increase, but we do not expect the direct impact of these increases to be material to our results of operations because the increased costs either would be the responsibility of our tenants directly or in large part may be passed through by us to our tenants as additional lease payments. Although we do not believe it is likely in the foreseeable future, laws enacted to mitigate climate change may make some of our buildings obsolete or cause us to make material investments in our properties which could materially and adversely affect our financial condition. We continuously study ways to improve the energy efficiency at all of our properties. For more information regarding climate change matters and their possible adverse impact on us, see "Risk Factors—Risks Related to Our Business—We may be adversely affected by laws, regulations or other issues related to climate change" in Part I, Item 1A and "Management's Discussion and Analysis—Impact of Climate Change" in Part II, Item 7 of this Annual Report on Form 10-K.
Information About Geographic Areas
We owned assets in Australia prior to the sale of these assets in June 2015. As of December 31, 2014 and 2013, we had assets in Australia of $252.0 million and $285.1 million, respectively. For the years ended December 31, 2015, 2014 and 2013, we recognized revenues in Australia of $12.7 million, $30.1 million and $33.1 million, respectively.
Internet Website
Our internet website address is www.eqcre.com. Copies of our Corporate Governance Guidelines, Code of Business Conduct and Ethics, policy outlining procedures for handling concerns or complaints about accounting, internal accounting controls or auditing matters, and the charters of our Audit, Compensation and Nominating and Corporate Governance committees are posted on our website and may be obtained free of charge by writing to our Secretary, Equity Commonwealth, Two North Riverside Plaza, Suite 2100, Chicago, Illinois 60606. We make available, free of charge, on our website, our Annual Reports on Form 10-K, Quarterly Reports on Form 10-Q, Current Reports on Form 8-K and amendments to these reports filed or furnished pursuant to Section 13(a) or 15(d) of the Securities Exchange Act of 1934, as amended, or the Exchange Act, as soon as reasonably practicable after these forms are filed with, or furnished to, the SEC. Any shareholder or other interested party who desires to communicate with our Board of Trustees, or our non-management Trustees, individually or as a group, may do so by filling out a report on our website. Our website address is included several times in this Annual Report on
3
Form 10-K as a textual reference only and the information on the website is not incorporated by reference into this Annual Report on Form 10-K.
RISK FACTORS
Item 1A. Risk Factors.
Our business faces many risks. The risks described below may not be the only risks we face but are the risks we know of that we believe may be material at this time. Additional risks that we do not yet know of, or that we currently think are immaterial, may also impair our business operations or financial results. If any of the events or circumstances described in the following risks occurs, our business, financial condition or results of operations could suffer and the trading price of our securities could decline. Investors and prospective investors should consider the following risks and the information contained under the heading "Forward Looking Statements" before deciding whether to invest in our securities.
Risks Related to Our Business
We may not be successful in repositioning our portfolio, which may reduce the size of our business and negatively affect our financial condition or results of operations.
Subsequent to our transition from external management to internal management in 2014, we undertook a comprehensive review of our portfolio and our operations and developed a strategy that focuses on reshaping our portfolio. We are in the process of executing this strategy and have completed 91 property dispositions totaling $2.0 billion through December 31, 2015, significantly reducing the size of our business. As of December 31, 2014, our portfolio included 156 properties (262 buildings) with a combined 42.9 million square feet for a total investment of $5.7 billion at cost, whereas as of December 31, 2015, our portfolio included 65 properties (127 buildings) with a combined 24.0 million square feet for a total investment of $3.9 billion at cost. In addition, we are pursuing additional dispositions, which we anticipate will further reduce the size of our business. As of December 31, 2015, we had $1.8 billion of cash on hand. Although we expect to reinvest the capital we have received from dispositions, we cannot provide any assurances that we will be successful. During the time that we are looking for reinvestment opportunities, our financial condition and results of operations may be materially and adversely affected. While we are looking for reinvestment opportunities, our operating income is likely to be reduced, which may adversely affect our results of operations or decrease amounts available to be distributed to shareholders. Prior to any investment of proceeds from our completed dispositions, the market price of our common shares may fluctuate or decrease as a result of investors’ perceptions of our ability to successfully capitalize on strategic opportunities in order to reposition our portfolio.
If we are unable to identify attractive opportunities to redeploy the capital received from dispositions pursuant to our disposition strategy, we may sell all of our remaining assets and wind down, liquidate or dissolve our Company, which may be a lengthy process, yield unexpected results and diminish or delay any potential distributions to our shareholders.
We are seeking opportunities to reinvest capital received from dispositions, but we cannot provide any assurances that we will be successful in making such investments. We are actively evaluating various strategies and one possibility is to decide to sell all or substantially all of our remaining assets and liquidate or sell the Company. No such decision has been made as of the date of this filing and we cannot predict the timing of making any such decision. In the event of a wind down, liquidation or dissolution of the Company, holders of our common shares may not realize the return on investment expected at the time they purchased our common shares.
Our disposition strategy may be unsuccessful and may result in expenses and reputational harm.
A central element of our current business plan focuses on continuing to dispose of a significant number of our properties. We cannot be assured that we will be able to find attractive sale opportunities or that any sale will be completed in a timely manner, if at all. Our ability to continue to sell certain of our properties, and the prices we receive upon any such sales, may be negatively affected by many factors. In particular, these factors could arise from weakness in or the lack of an established market for a property, changes in the financial condition or prospects of prospective purchasers, a limited number of prospective purchasers in certain markets, increase in the cost of or lack of availability of debt, the number of competing properties on the market, a deterioration in current local, national or international economic conditions, and changes in laws, regulations or fiscal policies of jurisdictions in which the property is located. In addition, provisions of the Code relating to REITs may limit our ability to sell properties. See risk factor below “Risks Related to Our Taxation as a REIT - The tax on “prohibited transactions” may limit our ability to engage in transactions which would be treated as sales for U.S. federal income tax purposes.” For these reasons, we may be unable to sell certain of our properties for an extended period of time or at all, and our business plan to sell certain of our properties may not succeed and we may incur expenses and reputational harm.
4
We may encounter unanticipated difficulties relating to acquisitions, which could undermine our business plan to acquire additional properties.
An element of our business plan involves the acquisition of additional properties as we are presented with attractive opportunities. Due to a number of factors, such as high asking prices for properties on the market, we may be unable to identify attractive acquisition opportunities. Additionally, we are likely to face competition for acquisition opportunities from other investors and this competition may adversely affect our ability to carry out our business strategy. In light of these challenges, we cannot be assured that we will be able to consummate attractive acquisition opportunities or that acquisitions we make will be successful.
We might encounter unanticipated difficulties and expenditures relating to any acquired properties. Newly acquired properties might require significant management attention that would otherwise be devoted to our ongoing business. We might never realize the anticipated benefits of our acquisitions. Notwithstanding pre-acquisition due diligence, we do not believe that it is possible to fully understand a property before it is owned and operated for an extended period of time. For example, we could acquire a property that contains undisclosed defects in design or construction. In addition, after our acquisition of a property, the market in which the acquired property is located may experience unexpected changes that adversely affect the property's value. The occupancy of properties that we acquire may decline during our ownership, and rents that are in effect at the time a property is acquired may decline thereafter. Also, our property operating costs for acquisitions may be higher than we anticipate and acquisitions of properties may not yield the returns we expect and, if financed using debt or new equity issuances, may result in shareholder dilution. For these reasons, among others, our business plan to acquire additional properties may not succeed or may cause us losses.
Our reliance upon CBRE, Inc., or CBRE, for third party property management may have a negative effect on our financial condition and results of operations.
We have engaged CBRE to provide property management services for substantially all of our properties pursuant to a master property management agreement. The successful operation and management of our properties requires significant coordination between us and CBRE. Additionally, upon the expiration of the initial term of our agreement with CBRE in September 2016, CBRE is permitted to terminate the property management agreement, as a whole or as to any one or more of our properties, without cause upon providing three months’ notice, and we are permitted to terminate the property management agreement, as a whole or as to any one or more of our properties, without cause upon 60 days’ notice. If we are unable to successfully coordinate with CBRE with respect to property management or the property management agreement with CBRE is terminated, in whole or in part, our operations could be disrupted, which may have a negative effect on our financial condition and results of operations.
We are currently dependent upon economic conditions relating to the commercial office real estate market, and adverse economic or regulatory developments in this market could materially and adversely affect our results of operations.
Our business is dependent upon the economic and regulatory environment (such as business layoffs or downsizing, industry slowdowns, relocations of businesses, increases in real estate and other taxes, costs of complying with governmental regulations or increased regulation). Such adverse developments could materially reduce the value of our real estate portfolio and our rental revenues, and thus materially and adversely affect our ability to service current debt and to pay distributions to shareholders. If economic conditions in our market worsen or fail to grow at a sufficient pace, we may experience reduced demand from tenants for our properties. A significant economic downturn in our market could adversely affect our results of operations.
Future impairment charges could have a material adverse effect on our results of operations in the period for which the charge occurs.
We periodically evaluate the recoverability of the carrying values of each of the real estate assets that comprise our portfolio. In undertaking our portfolio reviews, we comprehensively review our portfolio to evaluate whether there are any indicators, including property operating performance and general market conditions, that the value of the real estate properties (including any related amortizable intangible assets or liabilities) may not be recoverable. In 2014, we determined that due to the shortening of the expected periods of ownership of a number of our assets, as a result of the disposition plan, it was necessary to reduce the net book value of a portion of the real estate assets in our portfolio to their estimated fair values. As a result, we recorded a loss on asset impairment for 34 properties of $167.1 million in 2014, to reflect the estimated fair values of those real estate assets in our portfolio that failed the recoverability test because their net book values exceeded their fair values. We reduced the aggregate carrying value of these properties from $581.7 million to their estimated fair value of $414.6 million. We recorded a total impairment charge of $17.2 million during the year ended December 31, 2015, based upon updated market
5
information in accordance with our impairment analysis procedures. There can be no assurance that we will not take additional charges in the future related to the impairment of our assets.
As part of the evaluation of our portfolio, we compare the current carrying value of the asset to the estimated undiscounted cash flows that are directly associated with the use and ultimate disposition of the asset. Our estimated cash flows are based on several key assumptions, including rental rates, costs of tenant improvements, leasing commissions, anticipated hold periods, and assumptions regarding the residual value upon disposition, including the exit capitalization rate. These key assumptions are subjective in nature and could differ materially from actual results. Additionally, changes in our disposition strategy or changes in the marketplace may alter the hold period of an asset or asset group, which may result in an impairment loss and such loss could be material to the Company's financial condition or operating performance. To the extent that the carrying value of the asset exceeds the estimated undiscounted cash flows, an impairment loss is recognized equal to the excess of carrying value over fair value. Any future impairment could have a material adverse effect on our results of operations in the period in which the charge is taken.
Additionally, the fair value of real estate assets is highly subjective and is determined through comparable sales information and other market data if available, or through use of an income approach such as the direct capitalization method or the discounted cash flow approach. Such cash flow projections consider factors, including expected future operating income, trends and prospects, as well as the effects of demand, competition and other factors, and therefore are subject to a significant degree of management judgment. In estimating the fair value of undeveloped land, we generally use market data and comparable sales information. These subjective assessments have a direct impact on our net income because recording an impairment charge results in an immediate negative adjustment to net income. Thus, our results of operations may be significantly affected by the subjective judgments of our management team as to the fair value of our properties.
If global market and economic conditions worsen or do not fully recover, our business, financial condition and results of operations could be adversely affected.
In the United States, market and economic conditions continue to be uncertain and challenging with modest growth. We are unable to predict with any certainty whether economic conditions will decline, remain stable or improve. If current economic conditions deteriorate, business layoffs, downsizing, industry slowdowns and other similar factors that affect our tenants could negatively impact commercial real estate fundamentals and result in lower occupancy, lower rental rates and declining values in our real estate portfolio. Additionally, the cost and availability of credit and the commercial real estate market generally may be adversely affected by persistent high levels of unemployment, insufficient consumer demand or confidence, the impacts of changes in the U.S. federal budgetary process, changes in regulatory environments and other macro-economic factors. Deteriorating economic conditions could also have an impact on our lenders or tenants, causing them to fail to meet their obligations to us. No assurances can be given that the current economic conditions will remain stable or improve, and if market and economic conditions weaken, our ability to lease our properties and increase or maintain rental rates may be affected, which would have a material adverse effect on our business, financial condition and results of operations.
Significant competition for tenants and acquisition opportunities may reduce rents and increase acquisition costs which could materially and adversely affect our company.
All of our properties face competition for tenants. Some competing properties may be newer, better located or more attractive to tenants. Competing owners may offer available space at lower rents than we offer at our properties. This competition may affect our ability to attract and retain tenants and may reduce the rents we are able to charge.
In addition, we face significant competition for acquisition opportunities from other investors, including publicly traded and private REITs, numerous financial institutions, individuals and public and private companies. Because of competition, we may be unable to, or may pay a significantly increased purchase price to, acquire a desired property. Some of our competitors may have greater financial and management resources than we do.
When we renew leases or lease to new tenants our rents may decline and our expenses may increase and changes in tenants' requirements for leased space may adversely affect us.
When we renew leases or lease to new tenants we may receive less rent than we currently receive. Market conditions may require us to lower our rents to retain tenants. When we lease to new tenants or renew leases we may have to spend substantial amounts for leasing commissions, tenant improvements or tenant inducements. Many of our leases are for properties that are specially suited to the particular business of our tenants. Because these properties have been designed or physically modified for a particular tenant, if the current lease is terminated or not renewed, we may be required to renovate the property at substantial costs, decrease the rent we charge or provide other concessions in order to lease the property to another tenant. In general, tenants have been seeking to increase their space utilization under their leases, including reducing the amount of square footage per employee at leased properties, which may reduce the demand for leased space. If a significant number of such
6
events occur, our income and cash flow may materially decline and our ability to make regular distributions to our shareholders may be jeopardized.
We have substantial debt obligations which could materially and adversely affect our cost of operations.
As of December 31, 2015, we had $1.7 billion in debt outstanding, which was 32.6% of our total book capitalization. As a result, we are and expect to be subject to the risks normally associated with debt financing including:
• | that interest rates may rise; |
• | that our cash flow will be insufficient to make required payments of principal and interest; |
• | that any refinancing will not be on terms as favorable as those of our existing debt; |
• | that required payments on mortgages and on our other debt are not reduced if the economic performance of any property declines; |
• | that debt service obligations will reduce funds available for distribution to our shareholders; |
• | that any default on our debt, due to noncompliance with financial covenants or otherwise, could result in acceleration of those obligations; |
• | that we may be unable to refinance or repay the debt as it becomes due, and |
• | that if our degree of leverage is viewed unfavorably by lenders or potential joint venture partners, it could affect our ability to obtain additional financing. |
If we default in paying any of our debts or honoring our debt covenants, it may create one or more cross defaults, our debts may be accelerated and we could be forced to liquidate our assets for less than the values we would receive in a more orderly process. Additionally, we may not be able to refinance or repay debt as it becomes due which may force us to refinance or to incur additional indebtedness at higher rates and additional cost or, in the extreme case, to sell assets or seek protection from our creditors under applicable law.
Our failure or inability to meet certain terms of our credit agreement, which includes our unsecured revolving credit facility and term loans, may prevent us from making distributions to our shareholders.
Our credit agreement includes various conditions to borrowings and various financial and other covenants, including covenants requiring us to maintain certain minimum debt service coverage and maximum leverage ratios, and events of default. We may not be able to satisfy all of these conditions or may default on some of these covenants for various reasons, including matters which are beyond our control. If we are unable to borrow under our revolving credit facility, we may be unable to meet our business obligations or to grow by buying additional properties, or we may be required to sell some of our properties. If we default under our credit agreement, the lenders may demand immediate payment or elect not to make further borrowings available. Additionally, during the continuance of any event of default under our credit agreement, we will be limited or in some cases prohibited from making distributions on our shares. Any default under our credit agreement would likely have serious and adverse consequences to us and would likely cause the market price of our shares to materially decline.
In the future, we may obtain additional debt financing, and the covenants and conditions which apply to any such additional indebtedness may be more restrictive than the covenants and conditions contained in our current credit agreement.
Changes in capital markets may adversely affect the value of an investment in our shares.
Although interest rates remain below historical long term averages, interest rates have recently risen. Increases in interest rates may adversely affect us and the value of an investment in our shares, including in the following ways:
• | Amounts outstanding under our credit agreement bear interest at variable interest rates. When interest rates increase, so will our interest costs, which could adversely affect our cash flow, ability to pay principal and interest on debt, cost of refinancing debt when it becomes due and ability to make or sustain distributions to our shareholders. Additionally, if we choose to hedge our interest rate risk, we cannot assure that the hedge will be effective or that our hedging counterparty will meet its obligations to us. |
• | An increase in interest rates could decrease the amount buyers may be willing to pay for our properties, thereby reducing the market value of our properties and limiting our ability to sell properties or to obtain mortgage financing secured by our properties. Increased interest rates may increase the cost of financing properties we acquire to the extent we utilize leverage for those acquisitions and may result in a reduction in our acquisitions to the extent we |
7
reduce the amount we offer to pay for properties, due to the effect of increased interest rates, to a price that sellers may not accept.
A lack of any limitation on our debt could result in our becoming more highly leveraged.
Our governing documents do not limit the amount of indebtedness we may incur. Furthermore, our note indenture and credit agreement permit us and our subsidiaries to incur additional debt, including secured debt. Accordingly, we may incur additional debt. We might become more highly leveraged as a result, and our financial condition, results of operations and cash available for distribution to shareholders might be negatively affected, and the risk of default on our indebtedness could increase.
We could become a party to legal proceedings, which could adversely affect our financial results and/or distract our Board of Trustees and management.
As noted below in Item 3 "Legal Proceedings," we recently settled a number of complaints against certain of our former officers and former Trustees who were named as defendants in a number of complaints seeking monetary damages and declaratory and injunctive relief. Additional claims may be filed against us in connection with any action we may or may not take, including any equity or debt financing we may undertake, any sales of our assets, past and future amendments to our bylaws, our former Trustees' response to actions by our shareholders or others and other actions by our former Trustees or by us. The results of litigation are difficult to predict and we can provide no assurance that our legal conclusions or positions will be upheld. Moreover, claims of this nature present a risk of protracted litigation, incurrence of significant attorneys' fees, costs and expenses, and diversion of management's attention from the operation of our business. In addition, we have agreed to indemnify our present or former Trustees or officers who are made or threatened to be made parties to a legal proceeding by reason of their service in that capacity, which may be costly. Adverse rulings in any such legal proceedings could have a material adverse effect on our financial results and condition and cause substantial reputational harm and/or a decline in the market price of our shares.
We could incur significant costs and liabilities with respect to environmental matters.
Under various federal, state and local laws and regulations, as the current or former owners or operators of real estate, we may be liable for costs and damages resulting from the presence or release of hazardous substances, including waste or petroleum products, at, on, in, under or from such property, including costs for investigation, removal or remediation of such contamination and for natural resource damages arising from such contamination. Such laws often impose liability without regard to whether the owner or operator knew of, or was responsible for, the presence of such contamination, and the liability may be joint and several. In addition, the presence of contamination or the failure to remediate contamination at our properties may expose us to third-party liability for costs of remediation and/or personal or property damage, adversely affect our ability to lease, sell or rent such property, or adversely affect our ability to borrow using such property as collateral. Environmental laws may create liens on contaminated sites in favor of the government for damages and costs it incurs to address such contamination. If contamination is discovered on our properties, environmental laws also may impose restrictions on the manner in which those properties may be used or businesses may be operated, and these restrictions may require significant expenditures. Additionally, we may remain responsible for costs and liabilities arising from environmental issues related to representations and warranties we make in sales agreements for properties of which we have disposed. We also may be liable for the costs of removal or remediation of hazardous substances or waste at disposal or treatment facilities if we arranged for disposal or treatment of hazardous substances at such facilities, whether or not we own or operate such facility.
Some of our properties have been or may be impacted by releases of hazardous substances or petroleum products. Such contamination may arise from a variety of sources, including historic uses of our properties for commercial or industrial purposes, spills of such materials at adjacent properties, or releases from tanks used on our properties to store petroleum or hazardous substances. In addition, certain of our properties are on sites upon which or are adjacent to or near other properties upon which others, including former owners or tenants, have engaged, or may in the future engage, in activities that may release petroleum products or other hazardous or toxic substances.
We, our tenants, and our properties are subject to various federal, state and local regulatory requirements related to environmental, health and safety matters, such as environmental laws, state and local fire and safety requirements, building codes and land use regulations. Failure to comply with these requirements could subject us or our tenants to governmental fines or private litigant damage awards. In addition, compliance with these requirements, including new requirements or stricter interpretation of existing requirements, may require us or our tenants to incur significant expenditures. We do not know whether existing requirements will change or whether future requirements, including any requirements that may emerge from pending or future climate change laws or regulations, will develop. Environmental noncompliance liability also could impact a tenant’s ability to make rental payments to us, and our reputation could be negatively affected if we or our tenant’s violate environmental laws or regulations.
8
Buildings and other structures on properties that we currently or formerly own or operate or those we acquire or operate in the future contain, may contain, or may have contained, asbestos-containing material (or ACM). Environmental, health and safety laws require that ACM be properly managed and maintained, and include requirements to undertake special precautions, such as removal or abatement, if ACM would be disturbed during maintenance, renovation, or demolition of a building, potentially resulting in substantial costs. Moreover, laws regarding ACM may impose fines and penalties on owners, employers and operators, and we may be subject to liability for releases of ACM into the air and third parties may seek recovery from owners or operators of real property for personal injury associated with ACM.
When excessive moisture accumulates in buildings or on building materials, mold growth may occur, particularly if the moisture problem remains undiscovered or is not addressed over a period of time. Some molds may produce airborne toxins or irritants. Indoor air quality issues also can stem from inadequate ventilation, chemical contamination from indoor or outdoor sources, and other biological contaminants such as pollen, viruses and bacteria. Indoor exposure to airborne toxins or irritants above certain levels can be alleged to cause a variety of adverse health effects and symptoms, including allergic or other reactions. The presence of mold or other airborne contaminants in our buildings could expose us to costs and liabilities to address these issues, including from third parties if property damage or personal injury occurs.
We may be adversely affected by laws, regulations or other issues related to climate change.
If we become subject to laws or regulations related to climate change, our business, results of operations and financial condition could be impacted adversely. The federal government has enacted, and some of the states and localities in which we operate may enact certain climate change laws and regulations or have begun regulating carbon footprints and greenhouse gas emissions. Although these laws and regulations have not had any known material adverse effects on our business to date, they could result in substantial costs, including compliance costs, increased energy costs, retrofit costs and construction costs, including monitoring and reporting costs, and capital expenditures for environmental control facilities and other new equipment. Furthermore, our reputation could be negatively affected if we violate climate change laws or regulations. We cannot predict how future laws and regulations, or future interpretations of current laws and regulations, related to climate change will affect our business, results of operations and financial condition. Lastly, the potential physical impacts of climate change on our operations are highly uncertain, and would be particular to the geographic circumstances in areas in which we operate. These may include changes in rainfall and storm patterns and intensities, water shortages, changing sea levels and changing temperatures. These impacts may adversely affect our business, financial condition and results of operations. For more information regarding climate change matters and their possible adverse impact on us, please see "Management's Discussion and Analysis—Impact of Climate Change" in Part II, Item 7 of this Annual Report on Form 10-K.
We rely on information technology in our operations, and any material failure, inadequacy, interruption or security failure of that technology could harm our business.
We rely on information technology networks and systems, including the Internet, to process, transmit and store electronic information and to manage or support a variety of our business processes, including financial transactions and maintenance of records, which may include personal identifying information of tenants and lease data. We rely on commercially available systems, software, tools and monitoring to provide security for processing, transmitting and storing confidential tenant information, such as individually identifiable information relating to financial accounts. As our reliance on technology has increased, so have the risks posed to our systems, both internal and those we have outsourced to third party service providers. In addition, information security risks have generally increased in recent years due to the rise in new technologies and the increased sophistication and activities of perpetrators of cyber attacks. Although we have taken steps to protect the security of the data maintained in our information systems, it is possible that our security measures will not be able to prevent the systems' improper functioning, or the improper disclosure of personally identifiable information such as in the event of cyber attacks. Security breaches, including physical or electronic break-ins, computer viruses, attacks by hackers and similar breaches, can create system disruptions, shutdowns or unauthorized disclosure of confidential information. Any failure to maintain proper function, security and availability of our information systems could interrupt our operations, damage our reputation, subject us to liability claims or regulatory penalties and could materially and adversely affect us.
9
Risks Related to the Real Estate Industry
Real estate ownership creates risks and liabilities that could have a material adverse effect on us, including our results of operations and financial condition.
Our economic performance and the value of our real estate assets, and consequently the value of our securities, are subject to risks inherently associated with real estate ownership, including:
• | changes in supply of or demand for our properties or customers for such properties in areas in which we own buildings; |
• | the illiquid nature of real estate markets, which limits our ability to sell our assets rapidly or to respond to changing market conditions; |
• | the subjectivity of real estate valuations and changes in such valuations over time; |
• | property and casualty losses; |
• | the ongoing need for property maintenance and repair, and the need to make expenditures due to changes in governmental regulations, including the Americans with Disabilities Act; |
• | the inability of tenants to pay rent; |
• | competition from the development of new properties in the markets in which we own property and the quality of such competition, such as the attractiveness of our properties as compared to our competitors' properties based on considerations such as convenience of location, rental rates, amenities and safety record; |
• | civil unrest, acts of war, acts of God, including earthquakes, hurricanes and other natural disasters (which may result in uninsured losses), and other factors beyond our control; |
• | legislative, tax and regulatory developments that may occur at the federal, state and local levels that have direct or indirect impact on the ownership, leasing and operation of our properties; and |
• | litigation incidental to our business. |
If any of the foregoing events occur, our properties may not generate revenues sufficient to meet our operating expenses, including debt service and capital expenditures, and our cash flow and ability to pay distributions to our shareholders will be adversely affected.
Potential losses may not be covered by insurance exposing us to potential risk of loss.
We do not carry insurance for generally uninsurable losses such as loss from riots, war or acts of God, and, in some cases, flooding. Some of our policies, such as those covering losses due to terrorism, hurricanes, earthquakes and floods, are insured subject to limitations involving large deductibles or co-payments and policy limits that may not be sufficient to cover all losses. If we experience a loss that is uninsured or that exceeds policy limits, we could lose the capital invested in the damaged properties as well as the anticipated future cash flows from those properties. Inflation, changes in building codes and ordinances, environmental considerations, and other factors also might make it impractical or undesirable to use insurance proceeds to replace a property after it has been damaged or destroyed. In addition, if the damaged properties are subject to recourse indebtedness, we would continue to be liable for the indebtedness, even if these properties were irreparably damaged.
Insurance coverage on our properties may be expensive or difficult to obtain, exposing us to potential risk of loss.
In the future, we may be unable to renew or duplicate our current insurance coverage at adequate levels or at reasonable prices. In addition, insurance companies may no longer offer coverage against certain types of losses, such as losses due to terrorist acts, environmental liabilities, or other catastrophic events including hurricanes and floods, or, if offered, the expense of obtaining these types of insurance may not be justified. We therefore may cease to have insurance coverage against certain types of losses and/or there may be decreases in the limits of insurance available. If an uninsured loss or a loss in excess of our insured limits occurs, we could lose all or a portion of the capital we have invested in a property, as well as the anticipated future revenue from the property after a covered period of time, but still remain obligated for any mortgage debt or other financial obligations related to the property. We cannot guarantee that material losses in excess of insurance proceeds will not occur in the future. If any of our properties were to experience a catastrophic loss, it could seriously disrupt our operations, delay revenue and result in large expenses to repair or rebuild the property. Events such as these could adversely affect our results of operations and our ability to meet our obligations.
10
Actual or threatened terrorist attacks may adversely affect our ability to generate revenues and the value of our properties.
We have significant investments in large metropolitan markets that have been or may be in the future the targets of actual or threatened terrorism attacks. As a result, some tenants in these markets may choose to relocate their businesses to other markets or to lower-profile office buildings within these markets that may be perceived to be less likely targets of future terrorist activity. This could result in an overall decrease in the demand for office space in these markets generally or in our properties in particular, which could increase vacancies in our properties or necessitate that we lease our properties on less favorable terms or both. In addition, future terrorist attacks in these markets could directly or indirectly damage our properties, both physically and financially, or cause losses that materially exceed our insurance coverage. As a result of the foregoing, our ability to generate revenues and the value of our properties could decline materially.
Changes in accounting pronouncements may materially and adversely affect our financial statements, our tenants’ credit quality and our ability to secure long-term leases and renewal options.
Accounting policies and methods are fundamental to how we record and report our financial condition and results of operations. Uncertainties posed by various initiatives of accounting standard-setting by the Financial Accounting Standards Board and the Securities and Exchange Commission, which create and interpret applicable accounting standards for U.S. companies, may change the financial accounting and reporting standards or their interpretation and application of these standards that govern the preparation of our financial statements. These changes could have a material impact on our reported financial condition and results of operations. In some cases, we could be required to apply a new or revised standard retroactively, resulting in potentially material restatements of prior period financial statements. Similarly, these changes could have a material impact on our tenants’ reported financial condition or results of operations or could affect our tenants’ preferences regarding leasing real estate.
The Financial Accounting Standards Board has proposed accounting rules that would require companies to capitalize all leases on their balance sheets by recognizing a lessee's rights and obligations. If such a proposal is adopted, many companies that account for certain leases on an "off balance sheet" basis would be required to account for such leases "on balance sheet." This change would remove many of the differences in the way companies account for owned property and leased property, and could have a material effect on various aspects of our tenants' businesses, including their credit quality and the factors they consider in deciding whether to own or lease properties. If the proposal is adopted, it could cause companies that lease properties to prefer shorter lease terms, in an effort to reduce the leasing liability required to be recorded on their balance sheets. The proposal could also make lease renewal options less attractive, as, under certain circumstances, the rule would require a tenant to assume that a renewal right will be exercised and accrue a liability relating to the longer lease term.
Risks Related to Our Securities
We cannot assure that we will make distributions to our shareholders, and distributions we may make may include a return of capital.
Any distributions will be made at the discretion of our Board of Trustees and will depend upon various factors that our Board of Trustees deems relevant, including, but not limited to, our results of operations, our financial condition, debt and equity capital available to us, our expectations of our future capital requirements and operating performance, including our funds from operations, or FFO, our normalized funds from operations, or Normalized FFO, and our cash available for distribution, restrictive covenants in our financial or other contractual arrangements (including those in our credit agreement and senior notes indenture), tax law requirements to maintain our status as a REIT, restrictions under Maryland law and our expected needs and availability of cash to pay our obligations or to fund our acquisitions strategy. Our making of distributions is subject to compliance with restrictions contained in our credit agreement and our debt indenture. Additionally, our ability to make distributions will be adversely affected if any of the risks described herein, or other significant adverse events, occur. For these reasons, among others, our distribution rate may decline or we may cease making distributions. Also, our distributions may include a return of capital. As a result of the taxable losses recognized on property sales in 2015 and the net operating loss carryforward from 2014, a distribution to common shareholders will not be required for 2015. There can be no assurance that we will pay distributions in the future.
Changes in market conditions could adversely affect the market price of our common shares.
As with other publicly traded equity securities, the value of our common shares depends on various market conditions that may change from time-to-time. Among the market conditions that may affect the value of our common shares are the following:
• | the extent of investor interest in our securities; |
11
• | the general reputation of REITs and the attractiveness of our equity securities in comparison to other equity securities, including securities issued by other real estate-based companies; |
• | our underlying asset value; |
• | national and global economic conditions; |
• | changes in tax laws; |
• | our financial performance; |
• | changes in our credit ratings; and |
• | general stock and bond market conditions. |
The market value of our common shares is based primarily upon the market’s perception of our growth potential and our current and potential future earnings and cash dividends. Consequently, our common shares may trade at prices that are greater or less than our net asset value per share of common shares. If our future earnings or cash dividends are less than expected, it is likely that the market price of our common shares will diminish.
Any notes we may issue will be effectively subordinated to the debts of our subsidiaries and our secured debt.
We conduct substantially all of our business through, and substantially all of our properties are owned by, our subsidiaries. Consequently, our ability to pay debt service on our outstanding notes and any notes we issue in the future will be dependent upon the cash flow of our subsidiaries and payments by those subsidiaries to us as dividends or otherwise. Our subsidiaries are separate legal entities and have their own liabilities. Payments due on our outstanding notes, and any notes we may issue, are, or will be, effectively subordinated to liabilities of our subsidiaries, including guaranty liabilities. As of December 31, 2015, our subsidiaries had $249.7 million of debt. Our outstanding notes are, and any notes we may issue will be, effectively subordinated to any secured debt with regard to our assets pledged to secure those debts.
Our notes may permit redemption before maturity, and our noteholders may be unable to reinvest proceeds at the same or a higher rate.
The terms of our notes may permit us to redeem all or a portion of our outstanding notes after a certain amount of time, or up to a certain percentage of the notes prior to certain dates. Generally, the redemption price will equal the principal amount being redeemed, plus accrued interest to the redemption date, plus any applicable premium. If a redemption occurs, our noteholders may be unable to reinvest the money they receive in the redemption at a rate that is equal to or higher than the rate of return on the applicable notes.
There may be no public market for notes we may issue and one may not develop.
Generally, any notes we may issue will be a new issue for which no trading market currently exists. We may not list our notes on any securities exchange or seek approval for price quotations to be made available through any automated quotation system. We cannot assure that an active trading market for any of our notes will exist in the future. Even if a market develops, the liquidity of the trading market for any of our notes and the market price quoted for any such notes may be adversely affected by changes in the overall market for fixed income securities, by changes in our financial performance or prospects, or by changes in the prospects for REITs or for the real estate industry generally.
The number of our common shares available for future issuance or sale could adversely affect the per share trading price of our common shares and may be dilutive to current shareholders.
Our declaration of trust authorizes our Board of Trustees to, among other things, issue additional shares of capital stock without stockholder approval. We cannot predict whether future issuances or sales of our common shares or the availability of shares for resale in the open market will decrease the per share trading price per share of our common shares. The issuance of substantial numbers of our common shares in the public market, or upon conversion of our Series D preferred shares, or the perception that such issuances might occur, could adversely affect the per share trading price of our common shares. In addition, we may issue our common shares or restricted share units under the Equity Commonwealth 2015 Omnibus Incentive Plan. Any such future issuances of our common shares may be dilutive to existing shareholders.
Rating agency downgrades or rising interest rates may increase our cost of capital.
Our senior notes and our preferred shares are rated by two rating agencies. These rating agencies may elect to downgrade their ratings on our senior notes and our preferred shares at any time. Such downgrades may negatively affect our access to the capital markets and increase our cost of capital, including the interest rate and fees payable under our credit agreement. In addition, rising interest rates may adversely impact our ability to access the capital markets.
12
Conversion of our series D preferred shares may dilute the ownership interests of existing shareholders.
The conversion of some or all of our series D preferred shares may dilute the ownership interests of existing shareholders.
Risks Related to Our Organization and Structure
Ownership limitations and certain provisions in our declaration of trust and bylaws, as well as certain provisions of Maryland law, may deter, delay or prevent a change in our control or unsolicited acquisition proposals.
Our declaration of trust and bylaws prohibit any shareholder other than certain persons who have been exempted by our Board of Trustees from owning (directly and by attribution) more than 9.8% of the number or value of shares of any class or series of our outstanding shares of beneficial interest, including our common shares. These provisions are intended to assist with our REIT compliance under the Code and otherwise promote our orderly governance. However, these provisions also inhibit acquisitions of a significant stake in us and may deter, delay or prevent a change in our control or unsolicited acquisition proposals that a shareholder may consider favorable.
Additionally, provisions contained in our declaration of trust and bylaws or under Maryland law may have a similar impact, including, for example, provisions relating to: the authority of our Board of Trustees, and not our shareholders, to adopt, amend and repeal our bylaws and to fill most vacancies on our Board of Trustees; the fact that only the Chairman of the Board of Trustees, our Chief Executive Officer, our President, a majority of our Trustees or the holders of 10% of our common shares may call a special meeting of shareholders; and advance notice requirements for shareholder proposals.
Furthermore, our Board of Trustees has the authority to create and issue new classes or series of shares (including shares with voting rights and other rights and privileges that may deter a change in control) and issue additional common shares. The authorization and issuance of a new class of capital stock or additional common shares could have the effect of delaying or preventing someone from taking control of us, even if a change in control were in our shareholders' best interests.
Certain provisions of Maryland law could inhibit changes in control.
Certain provisions of Maryland law may have the effect of inhibiting a third party from making a proposal to acquire us or of impeding a change of control under circumstances that otherwise could provide the holders of our common shares with the opportunity to realize a premium over the then-prevailing market price of such shares, including:
• | “business combination moratorium/fair price” provisions that, subject to limitations, prohibit certain business combinations between us and an “interested shareholder” (defined generally as any person who beneficially owns 10% or more of the voting power of our shares or an affiliate thereof) for five years after the most recent date on which the shareholder becomes an interested shareholder, and thereafter imposes stringent fair price and super-majority shareholder voting requirements on these combinations; and |
• | “control share” provisions that provide that “control shares” of our company (defined as shares which, when aggregated with other shares controlled by the shareholder, entitle the shareholder to exercise one of three increasing ranges of voting power in electing trustees) acquired in a “control share acquisition” (defined as the direct or indirect acquisition of ownership or control of “control shares” from a party other than the issuer) have no voting rights except to the extent approved by our shareholders by the affirmative vote of at least two thirds of all the votes entitled to be cast on the matter, excluding all interested shares, and are subject to redemption in certain circumstances. |
We have opted out of these provisions of Maryland law. However, our Board of Trustees may opt to make these provisions applicable to us at any time without obtaining shareholder approval.
Our recourse against Trustees and officers may be limited by the limited rights granted to our shareholders in our declaration of trust.
Our declaration of trust limits the liability of our Trustees and officers to us and our shareholders for money damages to the maximum extent permitted under Maryland law. Under current Maryland law, our Trustees and officers will not have any liability to us and our shareholders for money damages other than liability resulting from:
• | actual receipt of an improper benefit or profit in money, property or services; or |
• | active and deliberate dishonesty by the Trustee or officer that was established by a final judgment as being material to the cause of action adjudicated. |
Our declaration of trust and bylaws require us to indemnify any present or former Trustee or officer, to the maximum extent permitted by Maryland law, who is made or threatened to be made a party to a proceeding by reason of his or her service in that capacity. In addition, we may be obligated to pay or reimburse the expenses incurred by our present and former Trustees
13
and officers without requiring a preliminary determination of their ultimate entitlement to indemnification. As a result, we and our shareholders may have more limited rights against our present and former Trustees and officers than might otherwise exist absent the provisions in our declaration of trust and bylaws or that might exist with other companies, which could limit your recourse in the event of actions not in your best interest.
Shareholder litigation against us or our Trustees and officers may be referred to binding arbitration proceedings which may increase our risk of default.
Our bylaws provide that actions by our shareholders against us or against our Trustees and officers, including derivative and class actions, may be referred to binding arbitration proceedings. As a result, our shareholders would not be able to pursue litigation for these disputes in courts against us or our Trustees and officers if the disputes were referred to arbitration. In addition, the ability to collect attorneys' fees or other damages may be limited, which may discourage attorneys from agreeing to represent parties wishing to commence such a proceeding.
We may change our operational, financing and investment policies without shareholder approval and we may become more highly leveraged, which may increase our risk of default under our debt obligations.
Our Board of Trustees determines our operational, financing and investment policies and may amend or revise our policies, including our policies with respect to our intention to qualify for taxation as a REIT, acquisitions, dispositions, growth, operations, indebtedness, capitalization and distributions, or approve transactions that deviate from these policies, without a vote of, or notice to, our shareholders. Policy changes could adversely affect the market value of our common shares and our ability to make distributions to our shareholders. Further, our organizational documents do not limit the amount or percentage of indebtedness, funded or otherwise, that we may incur. Our Board of Trustees may alter or eliminate our current policy on borrowing at any time without shareholder approval. If this policy changed, we could become more highly leveraged, which could result in an increase in our debt service costs. Higher leverage also increases the risk of default on our obligations. In addition, a change in our investment policies, including the manner in which we allocate our resources across our portfolio or the types of assets in which we seek to invest, may increase our exposure to interest rate risk, real estate market fluctuations and liquidity risk.
Risks Related to Our Taxation as a REIT
Qualifying as a REIT involves highly technical and complex provisions of the Code.
Qualification as a REIT involves the application of highly technical and complex Code provisions for which only limited judicial and administrative authorities exist. Even a technical or inadvertent violation could jeopardize our REIT qualification. Our qualification as a REIT depends on our satisfaction of certain asset, income, organizational, distribution, stockholder ownership and other requirements on a continuing basis. We have owned direct or indirect interests in one or more REITs (each, a "Subsidiary REIT") that have elected to be taxed as REITs under the U.S. federal income tax laws. Each Subsidiary REIT is subject to the various REIT qualification requirements and other limitations described herein that are applicable to us. If a Subsidiary REIT were to fail to qualify as a REIT, then (i) that Subsidiary REIT would become subject to U.S. federal income tax, (ii) our ownership of shares in such Subsidiary REIT would cease to be a qualifying asset for purposes of the asset tests applicable to REITs, and (iii) it is possible that we would fail certain of the asset tests applicable to REITs, in which event we would fail to qualify as a REIT unless we could avail ourselves of certain relief provisions. While we believe that the Subsidiary REITs have qualified as REITs under the Code, we have joined each Subsidiary REIT in filing a protective taxable REIT subsidiary election under Section 856(l) of the Code for each taxable year in which we have owned an interest in the Subsidiary REIT. Pursuant to the protective taxable REIT subsidiary election, we believe that even if a Subsidiary REIT was not a REIT for some reason, then it would instead have been considered one of our taxable REIT subsidiaries. As one of our taxable REIT subsidiaries, we believe that a Subsidiary REIT’s failure to qualify as a REIT would not jeopardize our own qualification as a REIT, even if we owned more than 10% of the Subsidiary REIT.
New legislation, court decisions or administrative guidance, in each case possibly with retroactive effect, may make it more difficult or impossible for us to qualify as a REIT. Certain rules applicable to REITs are particularly difficult to interpret or to apply in the case of REITs investing in real estate mortgage loans that are acquired at a discount, subject to work-outs or modifications, or reasonably expected to be in default at the time of acquisition. In addition, our ability to satisfy the requirements to qualify as a REIT depends in part on the actions of third parties over which we have no control or only limited influence, including in cases where we own an equity interest in an entity that is classified as a partnership for U.S. federal income tax purposes.
14
If we do not qualify as a REIT or fail to remain qualified as a REIT, we will be subject to U.S. federal income tax and potentially to additional state and local taxes which would reduce the amount of cash available for distribution to our shareholders.
We believe that we have been organized and have operated, and will continue to be organized and to operate, in a manner to allow us to qualify us to be taxed under the Code as a REIT. However, we cannot be certain that, upon review or audit, the IRS will agree with this conclusion. Furthermore, Congress and the IRS might make changes to the tax laws and regulations, and the courts might issue new rulings, that make it more difficult, or impossible, for us to remain qualified as a REIT. We do not intend to request a ruling from the IRS as to our REIT qualification.
As a REIT, we generally do not pay U.S. federal income tax on our net income that we distribute currently to our shareholders. However, actual qualification as a REIT under the Code depends on satisfying complex statutory requirements, for which there are only limited judicial and administrative interpretations. Many of the REIT requirements, however, are highly technical and complex. The determination that we are a REIT requires an analysis of various factual matters and circumstances that may not be totally within our control. For example, to qualify as a REIT, at least 95% of our gross income must come from specific passive sources, such as rent, that are itemized in the REIT tax laws. In addition, to qualify as a REIT, we cannot own specified amounts of debt and equity securities of some issuers. We also are required to distribute to our shareholders with respect to each year at least 90% of our “REIT taxable income” (determined before the deduction for dividends paid and excluding net capital gains). Even a technical or inadvertent mistake could jeopardize our REIT status and, given the highly complex nature of the rules governing REITs and the ongoing importance of factual determinations, we cannot provide any assurance that we will continue to qualify as a REIT.
If we fail to qualify as a REIT for U.S. federal income tax purposes, and are unable to avail ourselves of certain savings provisions set forth in the IRC, we likely would be subject to U.S. federal income tax at regular corporate rates. As a taxable corporation, we would not be allowed to take a deduction for distributions to shareholders in computing our taxable income or pass through long term capital gains to individual shareholders at favorable rates. We also could be subject to the U.S. federal alternative minimum tax and possibly increased state and local taxes. We would not be able to elect to be taxed as a REIT for four years following the year we first failed to qualify unless the IRS were to grant us relief under certain statutory provisions. If we failed to qualify as a REIT, we likely would have to pay significant income taxes, which likely would reduce our net earnings available for investment or distribution to our shareholders. If we fail to qualify as a REIT, such failure would cause us to be in breach under our credit agreement, and may adversely affect our ability to raise capital and to service our debt. This likely would have a significant adverse effect on our earnings and the value of our securities. In addition, we would no longer be required to pay any distributions to shareholders. If we fail to qualify as a REIT for U.S. federal income tax purposes and are able to avail ourselves of one or more of the statutory savings provisions in order to maintain our REIT status, we would nevertheless be required to pay penalty taxes of $50,000 or more for each such failure.
Distributions to shareholders generally do not qualify for the preferential tax rates available for some dividends.
Dividends payable by U.S. corporations to noncorporate shareholders, such as individuals, trusts and estates, are generally eligible for reduced tax rates. Distributions paid by REITs, however, generally are not eligible for these reduced rates. Although this does not adversely affect the taxation of REITs or dividends payable by REITs, to the extent that the preferential rates continue to apply to regular corporate qualified dividends, the more favorable rates for corporate dividends may cause investors who are individuals, trusts and estates to perceive that an investment in a REIT is less attractive than an investment in a non-REIT entity that pays dividends, thereby reducing the demand and market price of our shares.
REIT distribution requirements could adversely affect our ability to execute our business plan.
We generally must distribute annually at least 90% of our “REIT taxable income” (determined before the deduction for dividends paid and excluding net capital gains) in order for U.S federal corporate income tax not to apply to earnings that we distribute. To the extent that we satisfy this distribution requirement, but distribute less than 100% of our taxable income, we will be subject to U.S. federal corporate income tax on our undistributed taxable income. We intend to make distributions to our shareholders to comply with the REIT requirements of the IRC. In addition, we will be subject to a 4% nondeductible excise tax if the actual amount that we pay out to our shareholders in a calendar year is less than a minimum amount specified under U.S. federal tax laws. We intend to make distributions to our shareholders to comply with the REIT requirements of the Code.
From time to time, we may generate taxable income greater than our income for financial reporting purposes prepared in accordance with U.S. generally accepted accounting principles, or GAAP, or differences in timing between the recognition of taxable income and the actual receipt of cash may occur. If we do not have other funds available in these situations we could be required to (i) borrow funds on unfavorable terms, (ii) sell investments at disadvantageous prices, (iii) distribute amounts that would otherwise be invested in future acquisitions, or (iv) make a taxable distribution of our common shares as part of a distribution in which shareholders may elect to receive our common shares or (subject to a limit measured as a percentage of
15
the total distribution) cash to make distributions sufficient to enable us to pay out enough of our taxable income to satisfy the REIT distribution requirement. These alternatives could increase our costs or reduce our shareholders' equity. Thus, compliance with the REIT requirements may hinder our ability to grow, which could adversely affect the value of our shares.
Even if we qualify and remain qualified as a REIT, we may face other tax liabilities that reduce our cash flow.
Even if we qualify and remain qualified for taxation as a REIT, we may be subject to certain U.S. federal, state and local taxes on our income and assets, including taxes on any undistributed income, excise taxes, state or local income, property and transfer taxes, such as mortgage recording taxes, and other taxes. We are subject to U.S. federal and state income tax (and any applicable non-U.S. taxes) on the net income earned by our taxable REIT subsidiaries. Moreover, if we have net income from “prohibited transactions,” that income will be subject to a 100% tax. Finally, some state and local jurisdictions may tax some of our income even though as a REIT we are not subject to U.S. federal income tax on that income because not all states and localities treat REITs the same way they are treated for federal U.S. income tax purposes. To the extent that we and our affiliates are required to pay federal, state and local taxes, we will have less cash available for distributions to our shareholders.
Complying with REIT requirements may force us to forgo and/or liquidate otherwise attractive investment opportunities.
To qualify as a REIT, we must ensure that we meet the REIT gross income tests annually and that at the end of each calendar quarter, at least 75% of the value of our assets consists of cash, cash items, government securities and qualified REIT real estate assets. The remainder of our investment in securities (other than government securities and qualified real estate assets) generally cannot include more than 10% of the outstanding voting securities of any one issuer or more than 10% of the total value of the outstanding securities of any one issuer. In addition, in general, no more than 5% of the value of our assets (other than government securities and qualified real estate assets) can consist of the securities of any one issuer, no more than 25% (20% for taxable years beginning after December 31, 2017) of the value of our total securities can be represented by securities of one or more TRSs and, effective for our taxable year that began on January 1, 2016 and all future taxable years, no more than 25% of the value of our assets can be represented by debt instruments issued by “publicly offered REITs.” If we fail to comply with these requirements at the end of any calendar quarter, we must correct the failure within 30 days after the end of the calendar quarter or qualify for certain statutory relief provisions to avoid losing our REIT qualification and suffering adverse tax consequences. As a result, we may be required to liquidate from our portfolio, or contribute to a TRS, otherwise attractive investments in order to maintain our qualification as a REIT. These actions could have the effect of reducing our income, increasing our income tax liability, and reducing amounts available for distribution to our stockholders. In addition, we may be required to make distributions to shareholders at disadvantageous times or when we do not have funds readily available for distribution, and may be unable to pursue investments (or, in some cases, forego the sale of such investments) that would be otherwise advantageous to us in order to satisfy the source-of-income or asset-diversification requirements for qualifying as a REIT. Thus, compliance with the REIT requirements may hinder our ability to make, and, in certain cases, maintain ownership of certain attractive investments.
The tax on “prohibited transactions” may limit our ability to engage in transactions which would be treated as sales for U.S. federal income tax purposes.
A REIT’s net income from prohibited transactions is subject to a 100% tax. In general, prohibited transactions are sales or other dispositions of property, other than foreclosure property, held primarily for sale to customers in the ordinary course of business. Our Trustees have approved a plan to reposition our portfolio to dispose of assets that have one or more of the following attributes: (i) we do not see an apportunity to create a competitive advantage, (ii) smaller assets, (iii) assets that are not office buildings (iv) assets that are not located in the United States, or (v) assets that produce a low cash yield or require significant capital expenditures. We believe that the dispositions related to the repositioning of our portfolio along with other dispositions that we have made or that we might make in the future will not be subject to the 100% penalty tax; however, because application of the prohibited transactions tax could be based on an analysis of all of the facts and circumstances, there can be no assurance that the gains on our prior real estate sales have not, or any future real estate sales will not, be subject to the 100% prohibited transaction tax.
Our ownership of TRSs has been and will continue to be limited and our transactions with our TRSs will cause us to be subject to a 100% penalty tax on certain income or deductions if those transactions are not conducted on arm’s length terms.
A REIT may own up to 100% of the stock of one or more TRSs. A TRS may hold assets and earn income that would not be qualifying assets or income if held or earned directly by a REIT. Both the subsidiary and the REIT must jointly elect to treat the subsidiary as a TRS. A corporation of which a TRS directly or indirectly owns more than 35% of the voting power or value
16
of the stock will automatically be treated as a TRS. Overall, no more than 25% (20% for taxable years beginning after December 31, 2017) of the value of a REIT’s assets may consist of stock or securities of one or more TRSs. In addition, the TRS rules limit the deductibility of interest paid or accrued by a TRS to its parent REIT to assure that the TRS is subject to an appropriate level of corporate taxation. The rules also impose a 100% excise tax on certain transactions between a TRS and its parent REIT that are not conducted on an arm’s length basis.
TRSs that we have formed have paid and will continue to pay U.S. federal, state and local income tax on their taxable income, and their after-tax net income is available for distribution to us but is not required to be distributed by such domestic TRSs to us. We believe that the aggregate value of the stock and securities of our TRSs has been and we anticipate that the aggregate value will continue to be less than 25% (20% for taxable years beginning after December 31, 2017) of the value of our total assets (including our TRS stock and securities). Furthermore, we have monitored and will continue to monitor the value of our respective investments in our TRSs for the purpose of ensuring compliance with TRS ownership limitations. In addition, we have scrutinized and will continue to scrutinize all of our transactions with TRSs to ensure that they are entered into on arm’s length terms to avoid incurring the 100% excise tax described above. There can be no assurance, however, that we will be able to comply with the TRS limitation discussed above or to avoid application of the 100% excise tax discussed above.
Complying with REIT requirements may limit our ability to hedge effectively and may cause us to incur tax liabilities.
The REIT provisions of the Code limit our ability to hedge our liabilities. Generally, income from a hedging transaction we enter into to manage risk of interest rate fluctuations with respect to borrowings, including gain from the disposition of such hedging transactions, to the extent the hedging transactions hedge indebtedness incurred, or to be incurred, by us to acquire or carry real estate assets does not constitute “gross income” for purposes of the 75% or 95% gross income tests, provided we properly identify the hedge pursuant to the applicable sections of the Code and Treasury regulations. To the extent that we enter into other types of hedging transactions, the income from those transactions is likely to be treated as non-qualifying income for purposes of both gross income tests. As a result of these rules, we may need to limit our use of advantageous hedging techniques or implement those hedges through a taxable REIT subsidiary. This could increase the cost of our hedging activities because our taxable REIT subsidiary would be subject to tax on income or gains resulting from hedges entered into by it or expose us to greater risks associated with changes in interest rates than we would otherwise want to bear. In addition, losses in our taxable REIT subsidiary will generally not provide any tax benefit, except for being carried forward for use against future taxable income in our taxable REIT subsidiary.
There is a risk of changes in the tax law applicable to REITs.
The IRS, the United States Treasury Department and Congress frequently review U.S. federal income tax legislation. We cannot predict whether, when or to what extent new federal tax laws, regulations, interpretations or rulings will be adopted. Any legislative action may prospectively or retroactively modify our tax treatment and, therefore, may adversely affect taxation of us and/or our shareholders.
Item 1B. Unresolved Staff Comments.
None.
17
Item 2. Properties.
General. At December 31, 2015, we had real estate investments totaling approximately $3.9 billion in 65 properties (127 buildings) that were leased to approximately 1,000 tenants. At December 31, 2015, we owned the following real estate (dollars in thousands):
Property | State | Number of Buildings | Undepreciated Carrying Value(1) | Depreciated Carrying Value(1) | Annualized Rental Revenue(2) | |||||||||||
785 Schilinger Road South | AL | 1 | $ | 11,269 | $ | 9,279 | $ | 987 | ||||||||
Parkshore Plaza | CA | 4 | 49,179 | 44,093 | 2,975 | |||||||||||
Leased Land/Vineyards | CA | 7 | 31,968 | 29,106 | 2,922 | |||||||||||
Sky Park Centre | CA | 2 | 9,786 | 6,478 | 1,392 | |||||||||||
9110 East Nichols Avenue | CO | 1 | 20,326 | 13,888 | 2,548 | |||||||||||
1225 Seventeenth Street | CO | 1 | 149,759 | 128,164 | 21,475 | |||||||||||
5073, 5075, & 5085 S. Syracuse Street | CO | 1 | 63,610 | 55,267 | 7,164 | |||||||||||
1601 Dry Creek Drive | CO | 1 | 33,646 | 24,481 | 8,214 | |||||||||||
97 Newberry Road | CT | 1 | 15,350 | 12,485 | 1,817 | |||||||||||
33 Stiles Lane | CT | 1 | 9,793 | 7,632 | 623 | |||||||||||
1250 H Street, NW | DC | 1 | 70,698 | 44,668 | 6,597 | |||||||||||
Georgetown-Green and Harris Buildings | DC | 2 | 60,023 | 54,323 | 6,325 | |||||||||||
802 Delaware Avenue | DE | 1 | 43,467 | 20,376 | 4,127 | |||||||||||
6600 North Military Trail | FL | 3 | 145,813 | 129,589 | 16,573 | |||||||||||
Executive Park | GA | 9 | 44,224 | 29,365 | 4,990 | |||||||||||
633 Ahua Street | HI | 1 | 16,401 | 12,636 | 1,831 | |||||||||||
625 Crane Street | IL | 1 | 1,611 | 1,524 | 444 | |||||||||||
1200 Lakeside Drive | IL | 1 | 61,572 | 48,971 | 3,130 | |||||||||||
600 West Chicago Avenue | IL | 2 | 362,681 | 327,002 | 40,301 | |||||||||||
8750 Bryn Mawr Avenue | IL | 2 | 91,594 | 79,889 | 15,610 | |||||||||||
101-115 W. Washington Street | IN | 1 | 91,170 | 67,194 | 12,364 | |||||||||||
111 Monument Circle | IN | 2 | 176,311 | 163,196 | 22,802 | |||||||||||
109 Brookline Avenue | MA | 1 | 46,249 | 27,531 | 10,911 | |||||||||||
Cabot Business Park Land | MA | — | 1,033 | 1,033 | — | |||||||||||
111 Market Place | MD | 1 | 77,125 | 52,372 | 12,098 | |||||||||||
25 S. Charles Street | MD | 1 | 38,504 | 26,025 | 7,254 | |||||||||||
820 W. Diamond | MD | 1 | 33,682 | 22,195 | 2,839 | |||||||||||
Danac Stiles Business Park | MD | 3 | 65,564 | 46,580 | 6,934 | |||||||||||
East Eisenhower Parkway | MI | 2 | 55,261 | 48,425 | 10,174 | |||||||||||
2250 Pilot Knob Road | MN | 1 | 6,530 | 3,887 | 833 | |||||||||||
411 Farwell Avenue | MN | 1 | 16,357 | 12,831 | 1,906 | |||||||||||
6200 Glenn Carlson Drive | MN | 1 | 15,753 | 13,597 | 2,189 | |||||||||||
4700 Belleview Avenue | MO | 1 | 7,157 | 6,128 | 1,204 | |||||||||||
111 River Street (3) | NJ | 1 | 136,070 | 114,440 | 23,197 | |||||||||||
North Point Office Complex | OH | 2 | 124,584 | 102,221 | 15,805 | |||||||||||
Raintree Industrial Park | OH | 12 | 12,311 | 11,453 | 2,176 | |||||||||||
401 Vine Street | PA | 1 | 7,117 | 5,987 | 549 | |||||||||||
Cherrington Corporate Center | PA | 7 | 74,174 | 52,694 | 7,637 | |||||||||||
1500 Market Street | PA | 1 | 290,399 | 211,848 | 35,706 | |||||||||||
1525 Locust Street | PA | 1 | 11,210 | 7,088 | 2,342 | |||||||||||
1600 Market Street | PA | 1 | 133,667 | 78,133 | 18,232 | |||||||||||
1735 Market Street | PA | 1 | 299,635 | 178,397 | 31,188 | |||||||||||
Foster Plaza | PA | 8 | 75,725 | 55,954 | 12,262 | |||||||||||
18
Property | State | Number of Buildings | Undepreciated Carrying Value(1) | Depreciated Carrying Value(1) | Annualized Rental Revenue(2) | |||||||||||
128 Crews Drive | SC | 1 | 3,747 | 3,258 | 636 | |||||||||||
111 Southchase Boulevard | SC | 1 | 6,164 | 4,633 | 838 | |||||||||||
1043 Global Avenue | SC | 1 | 16,875 | 13,338 | 1,484 | |||||||||||
633 Frazier Drive | TN | 1 | 18,980 | 16,269 | 2,081 | |||||||||||
1601 Rio Grande Street | TX | 1 | 8,396 | 5,290 | 1,511 | |||||||||||
206 East 9th Street | TX | 1 | 48,599 | 44,897 | 6,074 | |||||||||||
4515 Seton Center Parkway | TX | 1 | 23,107 | 13,997 | 2,933 | |||||||||||
4516 Seton Center Parkway | TX | 1 | 23,301 | 13,620 | 2,902 | |||||||||||
7800 Shoal Creek Boulevard | TX | 4 | 21,252 | 13,580 | 3,235 | |||||||||||
812 San Antonio Street | TX | 1 | 8,826 | 5,711 | 1,627 | |||||||||||
8701 N Mopac | TX | 1 | 18,419 | 11,668 | 1,782 | |||||||||||
Bridgepoint Parkway | TX | 5 | 88,427 | 50,868 | 10,879 | |||||||||||
Lakewood on the Park | TX | 2 | 37,111 | 22,557 | 4,216 | |||||||||||
Research Park | TX | 4 | 90,635 | 61,071 | 11,484 | |||||||||||
9840 Gateway Boulevard North | TX | 1 | 11,432 | 9,436 | 1,128 | |||||||||||
3003 South Expressway 281 | TX | 1 | 17,004 | 13,811 | 1,922 | |||||||||||
3330 N Washington Boulevard | VA | 1 | 8,823 | 5,519 | 273 | |||||||||||
333 108th Avenue NE | WA | 1 | 152,557 | 130,497 | 18,479 | |||||||||||
600 108th Avenue NE | WA | 1 | 48,051 | 36,147 | 5,914 | |||||||||||
1331 North Center Parkway | WA | 1 | 9,187 | 7,681 | 944 | |||||||||||
100 East Wisconsin Avenue | WI | 1 | 82,996 | 71,563 | 10,911 | |||||||||||
111 East Kilbourn Avenue | WI | 1 | 55,105 | 44,577 | 8,169 | |||||||||||
Total Properties | 127 | $ | 3,887,352 | $ | 2,988,413 | $ | 490,069 | |||||||||
(1) | Excludes purchase price allocations for acquired real estate leases. |
(2) | Annualized rental revenue is annualized contractual rents from our tenants pursuant to leases which have commenced as of December 31, 2015, plus estimated recurring expense reimbursements; includes triple net lease rents and excludes lease value amortization, straight line rent adjustments, free rent periods and parking revenue. |
(3) | Property is subject to a ground lease. |
At December 31, 2015, five properties (8 buildings) were encumbered by mortgage notes payable totaling $249.7 million (including net premiums and discounts).
Item 3. Legal Proceedings.
We are or may be a party to various legal proceedings that arise in the ordinary course of business. We are not currently involved in any litigation nor, to our knowledge, is any litigation threatened against us where the outcome would, in our judgment based on information currently available to us, have a material adverse effect on our consolidated financial position or consolidated results of operations.
Item 4. Mine Safety Disclosures.
Not applicable.
19
PART II
Item 5. Market for Registrant's Common Equity, Related Stockholder Matters and Issuer Purchases of Equity Securities.
Our common shares are traded on the NYSE (symbol: EQC). The following table sets forth for the periods indicated the high and low sale prices for our common shares, as reported by the NYSE:
High | Low | ||||||
2015 | |||||||
First Quarter | $ | 27.24 | $ | 24.97 | |||
Second Quarter | 27.64 | 24.91 | |||||
Third Quarter | 27.70 | 25.17 | |||||
Fourth Quarter | 29.75 | 26.34 | |||||
2014 | |||||||
First Quarter | $ | 28.10 | $ | 22.06 | |||
Second Quarter | 28.28 | 24.81 | |||||
Third Quarter | 27.95 | 25.11 | |||||
Fourth Quarter | 27.12 | 23.56 | |||||
As of February 8, 2016, there were 1,460 shareholders of record of our common shares. However, because many of our common shares are held by brokers and other institutions on behalf of shareholders, we believe that there are considerably more beneficial holders of our common shares than record holders.
Distributions
Under our governing documents and Maryland law, distributions to our shareholders are to be authorized and declared by our Board of Trustees.
The following table sets forth the cash distributions per share we paid to our common shareholders for the periods indicated:
Cash Distributions Per Common Share | |||||||
2015 | 2014 | ||||||
First Quarter | $ | — | $ | 0.25 | |||
Second Quarter | — | — | |||||
Third Quarter | — | — | |||||
Fourth Quarter | — | — | |||||
Total | $ | — | $ | 0.25 | |||
As a result of the taxable losses recognized on property sales in 2015 and the net operating loss carryforward from 2014, a distribution to common shareholders was not required for 2015. The timing and amount of future distributions is determined at the discretion of our Board of Trustees and will depend upon various factors that our Board of Trustees deems relevant, including, but not limited to, our results of operations, our financial condition, debt and equity capital available to us, our expectations of our future capital requirements and operating performance, including our FFO, our Normalized FFO, and our cash available for distribution, restrictive covenants in our financial or other contractual arrangements (including those in our revolving credit facility and term loan agreements and senior notes indenture), tax law requirements to qualify for taxation as and remain a REIT, restrictions under Maryland law and our expected needs and availability of cash to pay our obligations and fund acquisitions. Therefore, there can be no assurance that we will pay distributions in the future.
Issuer Repurchases; Unregistered Sales of Securities
We did not repurchase any of our common shares in the fourth quarter of 2015.
20
Performance Graph
Notwithstanding anything to the contrary set forth in any of our filings under the Securities Act or the Exchange Act that might incorporate SEC filings, in whole or in part, the following performance graph will not be incorporated by reference into any such filings.
The following graph compares the cumulative total shareholder return of our common shares for the period from December 31, 2010 to December 31, 2015, to the NAREIT All REITs, Standard & Poor’s 500 Index, or the S&P 500, and to the NAREIT Equity Office Index over the same period. The graph assumes an investment of $100.00 in our common shares and each index and the reinvestment of all distributions. The shareholder return shown on the graph below is not indicative of future performance.
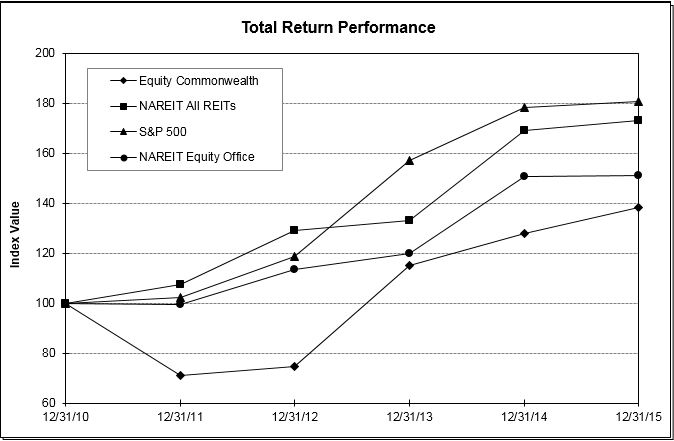
Period Ending | ||||||||||||||||||||||||
Index | 12/31/2010 | 12/31/2011 | 12/31/2012 | 12/31/2013 | 12/31/2014 | 12/31/2015 | ||||||||||||||||||
Equity Commonwealth | $ | 100.00 | $ | 70.97 | $ | 74.47 | $ | 114.92 | $ | 127.96 | $ | 138.23 | ||||||||||||
NAREIT All REITs | $ | 100.00 | $ | 107.28 | $ | 128.89 | $ | 133.02 | $ | 169.14 | $ | 173.01 | ||||||||||||
S&P 500 | $ | 100.00 | $ | 102.11 | $ | 118.45 | $ | 156.82 | $ | 178.28 | $ | 180.75 | ||||||||||||
NAREIT Equity Office Index | $ | 100.00 | $ | 99.24 | $ | 113.29 | $ | 119.60 | $ | 150.52 | $ | 150.96 | ||||||||||||
Source: SNL Financial LC
Item 6. Selected Financial Data.
The following table sets forth selected financial data for the periods and dates indicated. This data should be read in conjunction with, and is qualified in its entirety by reference to, "Management's Discussion and Analysis of Financial Condition and Results of Operations" in Part II, Item 7 and the consolidated financial statements and accompanying notes included in "Exhibits and Financial Statement Schedules" in Part IV, Item 15 of this Annual Report on Form 10-K. Reclassifications have been made to
21
the prior years' financial statements to conform to the current year's presentation. Amounts are in thousands, except per share data.
Year Ended December 31, | |||||||||||||||||||
Operating Data | 2015 | 2014 | 2013 | 2012 | 2011 | ||||||||||||||
Total revenues | $ | 714,891 | $ | 861,857 | $ | 953,029 | $ | 961,087 | $ | 819,450 | |||||||||
Expenses: | |||||||||||||||||||
Operating expenses | 324,948 | 387,982 | 410,045 | 397,673 | 340,101 | ||||||||||||||
Depreciation and amortization | 194,001 | 227,532 | 234,402 | 230,284 | 191,830 | ||||||||||||||
General and administrative | 57,457 | 113,155 | 80,504 | 49,312 | 41,402 | ||||||||||||||
Loss on asset impairment | 17,162 | 185,067 | 124,253 | — | 3,036 | ||||||||||||||
Acquisition related costs | — | 5 | 318 | 5,648 | 9,731 | ||||||||||||||
Total expenses | 593,568 | 913,741 | 849,522 | 682,917 | 586,100 | ||||||||||||||
Operating income (loss) | 121,323 | (51,884 | ) | 103,507 | 278,170 | 233,350 | |||||||||||||
Interest and other income | 5,989 | 1,561 | 1,229 | 1,410 | 1,663 | ||||||||||||||
Interest expense | (107,316 | ) | (143,230 | ) | (173,011 | ) | (202,055 | ) | (192,163 | ) | |||||||||
Gain (loss) on early extinguishment of debt | 6,661 | 4,909 | (60,052 | ) | (287 | ) | (35 | ) | |||||||||||
Gain on sale of equity investment | — | 171,561 | 66,293 | — | — | ||||||||||||||
Gain on issuance of shares by an equity investee | — | 17,020 | — | 7,246 | 11,177 | ||||||||||||||
Foreign currency exchange loss | (8,857 | ) | — | — | — | — | |||||||||||||
Gain on sale of properties | 84,421 | — | 1,596 | — | — | ||||||||||||||
Income (loss) from continuing operations before income tax expense and equity in earnings of investees | 102,221 | (63 | ) | (60,438 | ) | 84,484 | 53,992 | ||||||||||||
Income tax expense | (2,364 | ) | (3,191 | ) | (2,634 | ) | (3,207 | ) | (1,347 | ) | |||||||||
Equity in earnings of investees | — | 24,460 | 25,754 | 11,420 | 11,377 | ||||||||||||||
Income (loss) from continuing operations | 99,857 | 21,206 | (37,318 | ) | 92,697 | 64,022 | |||||||||||||
Discontinued operations | — | 2,806 | (119,649 | ) | (172,542 | ) | 45,962 | ||||||||||||
Net income (loss) | 99,857 | 24,012 | (156,967 | ) | (79,845 | ) | 109,984 | ||||||||||||
Net income attributable to noncontrolling interest in consolidated subsidiary | — | — | (20,093 | ) | (15,576 | ) | — | ||||||||||||
Net income (loss) attributable to Equity Commonwealth | 99,857 | 24,012 | (177,060 | ) | (95,421 | ) | 109,984 | ||||||||||||
Preferred distributions | (27,924 | ) | (32,095 | ) | (44,604 | ) | (51,552 | ) | (46,985 | ) | |||||||||
Excess fair value of consideration over carrying value of preferred shares | — | (16,205 | ) | — | (4,985 | ) | — | ||||||||||||
Net income (loss) attributable to common shareholders | 71,933 | (24,288 | ) | (221,664 | ) | (151,958 | ) | 62,999 | |||||||||||
Common distributions declared | — | 29,597 | 109,702 | 146,539 | 150,074 | ||||||||||||||
Weighted average common shares outstanding—basic | 128,621 | 125,163 | 112,378 | 83,750 | 77,428 | ||||||||||||||
Weighted average common shares outstanding—diluted | 129,437 | 125,163 | 112,378 | 83,750 | 77,428 | ||||||||||||||
Basic earnings per common share attributable to Equity Commonwealth common shareholders: | |||||||||||||||||||
Income (loss) from continuing operations | $ | 0.56 | $ | (0.21 | ) | $ | (0.91 | ) | $ | 0.25 | $ | 0.22 | |||||||
Net income (loss) | $ | 0.56 | $ | (0.19 | ) | $ | (1.97 | ) | $ | (1.81 | ) | $ | 0.81 | ||||||
Diluted earnings per common share attributable to Equity Commonwealth common shareholders: | |||||||||||||||||||
Income (loss) from continuing operations | $ | 0.56 | $ | (0.21 | ) | $ | (0.91 | ) | $ | 0.25 | $ | 0.22 | |||||||
Net income (loss) | $ | 0.56 | $ | (0.19 | ) | $ | (1.97 | ) | $ | (1.81 | ) | $ | 0.81 | ||||||
Common distributions declared | $ | — | $ | 0.25 | $ | 1.00 | $ | 1.75 | $ | 2.00 | |||||||||
22
December 31, | |||||||||||||||||||
Balance Sheet Data | 2015 | 2014 | 2013 | 2012 | 2011 | ||||||||||||||
Real estate properties(1) | $ | 3,887,352 | $ | 5,728,443 | $ | 5,537,165 | $ | 7,829,409 | $ | 7,244,232 | |||||||||
Equity investments | — | — | 517,991 | 184,711 | 177,477 | ||||||||||||||
Total assets | 5,244,372 | 5,761,639 | 6,646,434 | 8,189,634 | 7,447,026 | ||||||||||||||
Total indebtedness, net | 1,710,324 | 2,207,665 | 3,005,410 | 4,349,821 | 3,577,331 | ||||||||||||||
Total shareholders' equity attributable to Equity Commonwealth | 3,368,487 | 3,319,583 | 3,363,586 | 3,105,428 | 3,568,517 | ||||||||||||||
Noncontrolling interest in consolidated subsidiary | — | — | — | 396,040 | — | ||||||||||||||
Total shareholders' equity | 3,368,487 | 3,319,583 | 3,363,586 | 3,501,468 | 3,568,517 | ||||||||||||||
(1) | Excludes value of acquired real estate leases. |
Item 7. Management’s Discussion and Analysis of Financial Condition and Results of Operations.
The following discussion should be read in conjunction with our consolidated financial statements and accompanying notes included elsewhere in this Annual Report on Form 10-K.
OVERVIEW
We are an internally managed and self-advised REIT engaged in the ownership and operation primarily of office buildings throughout the United States. We were formed in 1986 under Maryland law.
At December 31, 2015, our portfolio included 65 properties (127 buildings) with a combined 24.0 million square feet for a total investment of $3.9 billion at cost and a depreciated book value of $3.0 billion.
As of December 31, 2015, our overall portfolio was 91.4% leased. During the year ended December 31, 2015, we entered into leases for 4.9 million square feet, including lease renewals for 2.8 million square feet and new leases for 2.1 million square feet. Leases entered into during the year ended December 31, 2015, including both lease renewals and new leases, had weighted average cash rental rates that were approximately 1.5% higher than prior rental rates for the same space and weighted average GAAP rental rates that were approximately 8.4% higher than prior rental rates for the same space. The change in GAAP rents is different than the change in cash rents due to differences in the amount of rent abatements, the magnitude and timing of contractual rent increases over the lease term, and the years of term for the newly executed leases compared to the prior leases.
Following our transition from external management to internal management in 2014, our new management team has focused on developing a plan to reshape our portfolio in order to create long-term value for shareholders. We undertook a comprehensive review of our portfolio and our operations and have developed a strategy that focuses on reshaping our portfolio over time. We anticipate that as part of this plan, we will dispose properties that do not meet our long-term goals. Specifically, our Board of Trustees adopted a strategy to consider disposing of assets that have one or more of the following attributes:
• | assets that do not offer an opportunity to create a competitive advantage; |
• | assets that are less than 150,000 square feet; |
• | assets that are not office buildings; |
• | assets that are not located in the U.S.; or |
• | assets that produce a low cash yield or require significant capital expenditures. |
We are in the process of executing this strategy and may sell approximately $3.0 billion of assets, depending on market conditions.
During the year ended December 31, 2015, we disposed of 91 properties (135 buildings) and one land parcel with a combined 18.9 million square feet for an aggregate gross sales price of $2.0 billion, excluding closing costs. As a result of these dispositions, we exited 68 cities, seven states and one country. For more information regarding the 2015 dispositions, see Note 4 to the notes to our consolidated financial statements included in Part II, Item 8 of this Annual Report on Form 10-K.
23
We have generated significant proceeds from the dispositions and have a cash balance of $1.8 billion as of December 31, 2015. We expect to reinvest the capital received from dispositions to purchase new properties, repay debt, redeem preferred shares, buy back common shares or make other investments or distributions that further our long-term strategic goals. However, we may not be able to make acquisitions or other investments with the proceeds from the dispositions. If our real estate investments decrease significantly, income from operations may also decline.
As part of the disposition plan noted above, and pursuant to our accounting policy, we evaluated the recoverability of the carrying values of each of the real estate assets that comprised our portfolio and determined that due to the shortening of the expected periods of ownership as a result of the disposition plan, it was necessary to reduce the net book value of a portion of the real estate assets in our portfolio to reduce the assets to their estimated fair values. During the year ended December 31, 2015, we recorded an impairment charge of $17.2 million in accordance with our impairment analysis procedures.
As a result of the taxable losses recognized on property sales in 2015 and the net operating loss carryforward from 2014, a distribution to common shareholders will not be required for 2015. The Board of Trustees has regularly reviewed our dividend policy and will continue to do so, at least annually.
Effective September 30, 2014, we terminated our business and property management relationships with RMR for our U.S. properties pursuant to a termination and cooperation agreement, which we refer to as the Cooperation Agreement. Pursuant to the Cooperation Agreement, through February 28, 2015, RMR and RMR Australia, which we refer to together as Manager, agreed to use best efforts to assist us in the transition of our management and operations. We paid Manager $1.2 million per month for transition services from October 1, 2014 to February 28, 2015, which included continued management and other services for the Australian assets pursuant to an existing management agreement, or the Australia Management Agreement. Beginning March 1, 2015, we agreed to pay Manager $0.1 million per month until we no longer required such services or until the Australia Management Agreement was terminated, which was terminated in the third quarter of 2015, effective October 31, 2015. The $2.7 million incurred pursuant to the Cooperation Agreement for the year ended December 31, 2015, is included in general and administrative expenses in our consolidated financial statements. There is no future obligation to pay any fees to Manager.
Effective October 1, 2014, we engaged CBRE to provide property management services for our U.S. properties. We pay CBRE a property-by-property management fee and may engage CBRE from time-to-time to perform project management services, such as coordinating and overseeing the completion of tenant improvements and other capital projects at the properties. We reimburse CBRE for certain expenses incurred in the performance of its duties, including certain personnel and equipment costs.
For the years ended December 31, 2015 and 2014, we incurred expenses of $42.7 million and $8.8 million, respectively, related to our property management agreement with CBRE, for property management fees, typically calculated as a portion of the properties revenues, and salary and benefits reimbursements for property personnel, such as property managers, engineers and maintenance staff. As of December 31, 2015 and December 31, 2014, we had amounts payable pursuant to these services of $3.5 million and $6.7 million, respectively.
Property Operations
Occupancy data for 2015 and 2014 are as follows (square feet in thousands):
All Properties | Comparable Properties(1) | ||||||||||
As of December 31, | As of December 31, | ||||||||||
2015 | 2014 | 2015 | 2014 | ||||||||
Total properties | 65 | 156 | 65 | 65 | |||||||
Total square feet | 23,952 | 42,891 | 23,952 | 23,952 | |||||||
Percent leased(2) | 91.4 | % | 85.8 | % | 91.4 | % | 90.0 | % | |||
(1) | Based on properties owned continuously from January 1, 2014 through December 31, 2015, and excludes properties sold during the period ended December 31, 2015 and properties classified as discontinued operations for the period ended December 31, 2014. |
(2) | Percent leased includes (i) space being fitted out for occupancy pursuant to existing leases and (ii) space which is leased but is not occupied or is being offered for sublease by tenants. |
24
The weighted average lease term based on square feet for leases entered into during the year ended December 31, 2015 was 6.3 years. Commitments made for leasing expenditures and concessions, such as tenant improvements and leasing commissions, for leases entered into during the year ended December 31, 2015 totaled $156.4 million, or $32.08 per square foot on average (approximately $5.06 per square foot per year of the lease term).
As of December 31, 2015, approximately 9.9% of our leased square feet and 10.0% of our annualized rental revenue, determined as set forth below, are included in leases scheduled to expire through December 31, 2016. Renewed and new leases and rental rates at which available space may be relet in the future will depend on prevailing market conditions at the times these leases are negotiated. We believe that the in-place cash rents for leases expiring in 2016 are slightly below market. Lease expirations by year, as of December 31, 2015, are as follows (square feet and dollars in thousands):
Year | Number of Tenants Expiring | Leased Square Feet Expiring(1) | % of Leased Square Feet Expiring(1) | Cumulative % of Leased Square Feet Expiring(1) | Annualized Rental Revenue Expiring(2) | % of Annualized Rental Revenue Expiring | Cumulative % of Annualized Rental Revenue Expiring | |||||||||||||||
2016(3) | 174 | 2,173 | 9.9 | % | 9.9 | % | $ | 49,142 | 10.0 | % | 10.0 | % | ||||||||||
2017 | 147 | 2,065 | 9.4 | % | 19.3 | % | 50,088 | 10.2 | % | 20.2 | % | |||||||||||
2018 | 152 | 2,515 | 11.5 | % | 30.8 | % | 64,614 | 13.2 | % | 33.4 | % | |||||||||||
2019 | 114 | 1,650 | 7.4 | % | 38.2 | % | 42,828 | 8.7 | % | 42.1 | % | |||||||||||
2020 | 127 | 3,846 | 17.6 | % | 55.8 | % | 56,072 | 11.5 | % | 53.6 | % | |||||||||||
2021 | 83 | 1,879 | 8.6 | % | 64.4 | % | 42,209 | 8.6 | % | 62.2 | % | |||||||||||
2022 | 43 | 854 | 3.9 | % | 68.3 | % | 23,199 | 4.7 | % | 66.9 | % | |||||||||||
2023 | 54 | 1,741 | 8.0 | % | 76.3 | % | 44,068 | 9.0 | % | 75.9 | % | |||||||||||
2024 | 19 | 607 | 2.8 | % | 79.1 | % | 14,134 | 2.9 | % | 78.8 | % | |||||||||||
2025 | 25 | 1,113 | 5.1 | % | 84.2 | % | 27,006 | 5.5 | % | 84.3 | % | |||||||||||
Thereafter | 47 | 3,454 | 15.8 | % | 100.0 | % | 76,709 | 15.7 | % | 100.0 | % | |||||||||||
985 | 21,897 | 100.0 | % | $ | 490,069 | 100.0 | % | |||||||||||||||
Weighted average remaining lease term (in years): | 5.6 | 5.7 | ||||||||||||||||||||
(1) | Square feet is pursuant to existing leases as of December 31, 2015, and includes (i) space being fitted out for occupancy and (ii) space which is leased but is not occupied or is being offered for sublease by tenants. |
(2) | Annualized rental revenue is annualized contractual rents from our tenants pursuant to leases which have commenced as of December 31, 2015, plus estimated recurring expense reimbursements; includes triple net lease rents and excludes lease value amortization, straight line rent adjustments, free rent periods, and parking revenue. |
(3) | Square footage expiring in 2016 includes 0.1 million square feet related to month-to-month and self storage tenants. Annualized rental revenue expiring in 2016 includes $3.3 million of month-to-month and self storage rent. |
25
A principal source of funds for our operations is rents from tenants at our properties. Rents are generally received from our tenants monthly in advance, except from our government tenants, who usually pay rents monthly in arrears. As of December 31, 2015, tenants representing 1% or more of our total annualized rental revenue were as follows (square feet in thousands):
Tenant | Square Feet(1) | % of Total Square Feet(1) | % of Annualized Rental Revenue(2) | Weighted Average Remaining Lease Term | ||||||||
1. | Expedia, Inc. | 398 | 1.8 | % | 3.6 | % | 2.8 | |||||
2. | Office Depot, Inc. | 640 | 2.9 | % | 3.3 | % | 7.8 | |||||
3. | John Wiley & Sons, Inc. | 414 | 1.9 | % | 3.2 | % | 16.2 | |||||
4. | PNC Financial Services Group | 587 | 2.7 | % | 3.0 | % | 5.1 | |||||
5. | Flextronics International Ltd. | 1,051 | 4.8 | % | 2.2 | % | 4.0 | |||||
6. | J.P. Morgan Chase & Co. | 356 | 1.6 | % | 2.1 | % | 9.0 | |||||
7. | Groupon, Inc.(3) | 378 | 1.7 | % | 1.9 | % | 10.0 | |||||
8. | Jones Day | 343 | 1.6 | % | 1.8 | % | 10.5 | |||||
9. | Towers Watson & Co | 369 | 1.7 | % | 1.7 | % | 3.9 | |||||
10. | Ballard Spahr LLP | 217 | 1.0 | % | 1.6 | % | 14.1 | |||||
11. | Carmike Cinemas, Inc.(4) | 552 | 2.5 | % | 1.5 | % | 0.7 | |||||
12. | RE/MAX Holdings, Inc. | 248 | 1.1 | % | 1.4 | % | 12.3 | |||||
13. | Exelon Corporation | 279 | 1.3 | % | 1.3 | % | 2.4 | |||||
14. | FMC Corporation | 207 | 0.9 | % | 1.3 | % | 0.4 | |||||
15. | Georgetown University | 240 | 1.1 | % | 1.3 | % | 3.7 | |||||
16. | University of Pennsylvania Health System | 267 | 1.2 | % | 1.2 | % | 9.8 | |||||
17. | Wm. Wrigley Jr. Company | 150 | 0.7 | % | 1.1 | % | 6.1 | |||||
18. | West Corporation | 336 | 1.5 | % | 1.1 | % | 13.2 | |||||
19. | The United States Government | 162 | 0.7 | % | 1.0 | % | 2.6 | |||||
20. | M&T Bank | 218 | 1.0 | % | 1.0 | % | 2.7 | |||||
Total | 7,412 | 33.7 | % | 36.6 | % | 6.6 | ||||||
(1) | Square footage is pursuant to existing leases as of December 31, 2015, and includes (i) space being fitted out for occupancy and (ii) space which is leased but is not occupied or is being offered for sublease by tenants. |
(2) | Annualized rental revenue is annualized contractual rents from our tenants pursuant to leases which have commenced as of December 31, 2015, plus estimated recurring expense reimbursements; includes triple net lease rents and excludes lease value amortization, straight line rent adjustments, free rent periods, and parking revenue. |
(3) | Groupon, Inc. statistics include 207,536 square feet that are sublet from Bankers Life and Casualty Company. |
(4) | Subsequent to December 31, 2015, Carmike Cinemas' lease was extended. The weighted average remaining lease term is 14.7 years. |
Financing Activities
On December 1, 2015, we repaid at par the $116.0 million of 5.24% mortgage debt at 111 Monument Circle and recognized a gain on early extinguishment of debt of $0.6 million for the year ended December 31, 2015 from the write-off of an unamortized premium, net of the write-off of unamortized deferred financing fees.
On August 3, 2015, we defeased the $141.4 million outstanding balance of the mortgage loan secured by 111 East Wacker Drive, one of the buildings included in Illinois Center. The defeasance costs and write off of the unamortized deferred financing costs, net of the write off of the unamortized premium, resulted in a net loss on early extinguishment of debt of $3.9 million for the year ended December 31, 2015.
26
On June 5, 2015, we prepaid $10.0 million of 7.36% mortgage debt at 2501 20th Place South and recognized a loss on early extinguishment of debt of $0.6 million for the year ended December 31, 2015, which consisted of a prepayment premium and the write off of unamortized deferred financing fees, net of the write off of an unamortized premium.
On June 3, 2015, we defeased the $38.7 million outstanding balance of the mortgage loan secured by 1320 Main Street. The defeasance costs and write off of the unamortized deferred financing costs, net of the write off of the unamortized premium, resulted in a net loss on early extinguishment of debt of $6.2 million for the year ended December 31, 2015.
On May 22, 2015, title to 225 Water Street was transferred to the lender pursuant to the consensual foreclosure in full satisfaction of the mortgage debt, with a principal balance of $40.1 million. The transaction resulted in a gain on early extinguishment of debt of $17.3 million for the year ended December 31, 2015.
On May 1, 2015, we redeemed at par $138.8 million of our 5.75% senior unsecured notes due 2015 and recognized a loss on early extinguishment of debt of $0.1 million for the year ended December 31, 2015.
On January 29, 2015, we entered into a new credit agreement, pursuant to which the lenders agreed to provide (i) a $750.0 million unsecured revolving credit facility, (ii) a $200.0 million 5-year term loan facility and (iii) a $200.0 million 7-year term loan facility. The new credit agreement, which replaced our prior credit agreement and our prior term loan agreement, reduces the interest rate and extends the term of our revolving credit facility and term loan borrowings. The revolving credit facility has a scheduled maturity date of January 28, 2019, with two six-month extension options subject to certain conditions and the payment of an extension fee. The 5-year term loan and the 7-year term loan have scheduled maturity dates of January 28, 2020 and January 28, 2022, respectively, and have been fully funded. We used the proceeds from the new term loans to repay all amounts outstanding and due under the previous term loan agreement. We do not currently have any amounts outstanding under the revolving credit facility.
For more information regarding our financing sources and activities, please see the section captioned “Liquidity and Capital Resources—Our Investment and Financing Liquidity and Resources” below.
27
RESULTS OF OPERATIONS
Year Ended December 31, 2015 Compared to Year Ended December 31, 2014
Comparable Properties Results(1) | Other Properties Results(2) | Consolidated Results | |||||||||||||||||||||||||||||||||||
Year Ended December 31, | |||||||||||||||||||||||||||||||||||||
2015 | 2014 | $ Change | % Change | 2015 | 2014 | 2015 | 2014 | $ Change | % Change | ||||||||||||||||||||||||||||
(in thousands) | |||||||||||||||||||||||||||||||||||||
Rental income(3) | $ | 432,921 | $ | 431,677 | 1,244 | 0.3 | % | $ | 137,461 | $ | 260,022 | $ | 570,382 | $ | 691,699 | $ | (121,317 | ) | (17.5 | )% | |||||||||||||||||
Tenant reimbursements and other income | 108,253 | 109,589 | (1,336 | ) | (1.2 | )% | 36,256 | 60,569 | 144,509 | 170,158 | (25,649 | ) | (15.1 | )% | |||||||||||||||||||||||
Operating expenses | (230,534 | ) | (229,777 | ) | (757 | ) | 0.3 | % | (94,414 | ) | (158,205 | ) | (324,948 | ) | (387,982 | ) | 63,034 | (16.2 | )% | ||||||||||||||||||
Net operating income(4) | $ | 310,640 | $ | 311,489 | $ | (849 | ) | (0.3 | )% | $ | 79,303 | $ | 162,386 | 389,943 | 473,875 | (83,932 | ) | (17.7 | )% | ||||||||||||||||||
Other expenses: | |||||||||||||||||||||||||||||||||||||
Depreciation and amortization | 194,001 | 227,532 | (33,531 | ) | (14.7 | )% | |||||||||||||||||||||||||||||||
General and administrative | 57,457 | 113,155 | (55,698 | ) | (49.2 | )% | |||||||||||||||||||||||||||||||
Loss on asset impairment | 17,162 | 185,067 | (167,905 | ) | (90.7 | )% | |||||||||||||||||||||||||||||||
Acquisition related costs | — | 5 | (5 | ) | (100.0 | )% | |||||||||||||||||||||||||||||||
Total other expenses | 268,620 | 525,759 | (257,139 | ) | (48.9 | )% | |||||||||||||||||||||||||||||||
Operating income (loss) | 121,323 | (51,884 | ) | 173,207 | (333.8 | )% | |||||||||||||||||||||||||||||||
Interest and other income | 5,989 | 1,561 | 4,428 | 283.7 | % | ||||||||||||||||||||||||||||||||
Interest expense | (107,316 | ) | (143,230 | ) | 35,914 | (25.1 | )% | ||||||||||||||||||||||||||||||
Gain on early extinguishment of debt | 6,661 | 4,909 | 1,752 | 35.7 | % | ||||||||||||||||||||||||||||||||
Gain on sale of equity investments | — | 171,561 | (171,561 | ) | (100.0 | )% | |||||||||||||||||||||||||||||||
Gain on issuance of shares by an equity investee | — | 17,020 | (17,020 | ) | (100.0 | )% | |||||||||||||||||||||||||||||||
Foreign currency exchange loss | (8,857 | ) | — | (8,857 | ) | (100.0 | )% | ||||||||||||||||||||||||||||||
Gain on sale of properties | 84,421 | — | 84,421 | 100.0 | % | ||||||||||||||||||||||||||||||||
Income (loss) from continuing operations before income taxes and equity in earnings of investees | 102,221 | (63 | ) | 102,284 | (162,355.6 | )% | |||||||||||||||||||||||||||||||
Income tax expense | (2,364 | ) | (3,191 | ) | 827 | (25.9 | )% | ||||||||||||||||||||||||||||||
Equity in earnings of investees | — | 24,460 | (24,460 | ) | (100.0 | )% | |||||||||||||||||||||||||||||||
Income from continuing operations | 99,857 | 21,206 | 78,651 | 370.9 | % | ||||||||||||||||||||||||||||||||
Discontinued operations: | |||||||||||||||||||||||||||||||||||||
Income from discontinued operations | — | 8,389 | (8,389 | ) | (100.0 | )% | |||||||||||||||||||||||||||||||
Loss on asset impairment from discontinued operations | — | (2,238 | ) | 2,238 | (100.0 | )% | |||||||||||||||||||||||||||||||
Loss on early extinguishment of debt from discontinued operations | — | (3,345 | ) | 3,345 | (100.0 | )% | |||||||||||||||||||||||||||||||
Net income | 99,857 | 24,012 | 75,845 | 315.9 | % | ||||||||||||||||||||||||||||||||
Preferred distributions | (27,924 | ) | (32,095 | ) | 4,171 | (13.0 | )% | ||||||||||||||||||||||||||||||
Excess fair value of consideration over carrying value of preferred shares | — | (16,205 | ) | 16,205 | (100.0 | )% | |||||||||||||||||||||||||||||||
Net income (loss) available for Equity Commonwealth common shareholders | $ | 71,933 | $ | (24,288 | ) | $ | 96,221 | (396.2 | )% | ||||||||||||||||||||||||||||
(1) | Comparable properties consist of 65 properties (127 buildings) owned continuously from January 1, 2014 to December 31, 2015. |
(2) | Other properties consist of properties sold. |
(3) | During the year ended December 31, 2015, we recognized non-recurring charges against revenues of $2.7 million related to a parking tax matter and a tenant lease termination at 600 West Chicago Avenue. |
(4) | We calculate net operating income, or NOI, as shown above. We define NOI as income from our real estate including lease termination fees received from tenants less our property operating expenses. NOI excludes amortization of capitalized tenant improvement costs and leasing commissions. We consider NOI to be an appropriate supplemental measure to net income because it may help both investors and management to understand the operations of our properties. We use NOI internally to evaluate property level performance, and we believe that NOI provides useful information to investors regarding our results of operations because it reflects only those income and expense items that are incurred at the property level and may facilitate comparisons of our operating performance between periods and with other REITs. NOI does not represent cash generated by operating activities in accordance with GAAP and should not be considered as an alternative to net income, net income attributable to Equity Commonwealth common shareholders, operating income or cash flow from operating activities, determined in accordance with GAAP, or as an indicator of our financial performance or liquidity, nor is this measure necessarily indicative of sufficient cash flow to fund all of our needs. This measure should be considered in conjunction with net income, net income attributable to Equity Commonwealth common shareholders, operating income and cash flow from operating activities as presented in our consolidated statements of operations, consolidated statements of comprehensive income and consolidated statements of cash flows. Other REITs and real estate companies may calculate NOI differently than we do. |
We refer to the 65 properties (127 buildings) we owned continuously from January 1, 2014 to December 31, 2015, as comparable properties. We refer to the sold properties as other properties. Our consolidated statements of operations for the
28
years ended December 31, 2015 and 2014 include the operating results of 65 properties for the entire periods, as we owned these properties as of January 1, 2014.
Rental income. Rental income decreased $121.3 million in the 2015 period, compared to the 2014 period, primarily due to the properties sold during the year ended December 31, 2015. Our comparable properties increased $1.2 million primarily due to an increase in the recognition of lease termination fees and increases due to the write offs in 2014 of an acquired real estate lease after a tenant vacated its space prior to the lease expiration and of a deferred rent receivable after a tenant contracted its lease space. These increases were partially offset by a decrease in rental income due to leasing activity in 2015 at a particular building where one tenant vacated its space and two tenants shortened their remaining lease terms. In connection with these leasing transactions, the corresponding deferred rent receivable balances were written off or amortized over the shorter term. The increase in rental income was also partially offset by non-recurring charges against revenues of $2.7 million related to a parking tax matter and a tenant lease termination at 600 West Chicago Avenue recognized during the year ended December 31, 2015.
Rental income includes increases for non-cash straight line rent adjustments totaling $5.3 million in the 2015 period and $12.5 million in the 2014 period, and net reductions for amortization of acquired real estate leases and assumed real estate lease obligations totaling $7.5 million in the 2015 period and $10.6 million in the 2014 period. Rental income also includes the recognition of lease termination fees totaling $8.2 million in the 2015 period and $4.7 million in the 2014 period.
Tenant reimbursements and other income. Tenant reimbursements and other income decreased $25.6 million in the 2015 period, compared to the 2014 period primarily due to the properties sold in 2015 and a $1.3 million decrease at our comparable properties primarily resulting from non-recurring prior year utility expense reimbursement.
Operating expenses. The $63.0 million decrease in operating expenses during the 2015 period as compared to the 2014 period is primarily due to the properties sold during the year ended December 31, 2015, partially offset by a $0.8 million increase at our comparable properties. The increase in operating expenses at the comparable properties primarily reflects increases in real estate tax expense related to increases in assessed values, bad debt expense primarily due to an evicted tenant, property related legal fees, maintenance and repairs, HVAC expenses and cleaning expenses, partially offset by decreases in management fees and increases in real estate tax refunds in 2015 related to prior year real estate taxes.
Depreciation and amortization. The decrease in depreciation and amortization expense in the 2015 period when compared to the 2014 period primarily relates to properties sold in 2015. This decrease was partially offset by an increase in depreciation and amortization expense resulting from the leasing transactions discussed above, where due to one tenant vacating its space and two other tenants shortening their remaining lease term, the corresponding tenant improvements were written off or depreciation was accelerated.
General and administrative. The decrease in general and administrative expenses primarily relates to $43.9 million of business management and incentive fees paid to our prior external manager in 2014, a $14.5 million decrease related to the shareholder approved reimbursement of expenses incurred by Related/Corvex in connection with their consent solicitation to remove our former Trustees, and a $9.4 million decrease in legal and litigation costs, partially offset by the internalization of our management, which includes a $9.5 million increase in share-based compensation expense.
Loss on asset impairment. During the year ended December 31, 2015, we recorded an impairment charge of $17.2 million related to 12655 Olive Boulevard, 1285 Fern Ridge Parkway and portfolios of properties located in Georgia and New York, based upon updated market information in accordance with our impairment analysis procedures. The impairment charge in 2014 includes $22.7 million related to 225 Water Street where we made the decision to cease making loan servicing payments and impairment losses recorded in the fourth quarter of 2014 as a result of the change in the anticipated holding period for certain properties.
Interest and other income. The increase in interest and other income primarily relates to a $3.1 million gain on the sale of securities in the first quarter of 2015 and an increase in bank interest income due to a higher average cash balance during the 2015 period as compared to the 2014 period.
Interest expense. The decrease in interest expense in the 2015 period primarily reflects the payment of the $235.0 million balance on our revolving credit facility in July 2014, the prepayment of $265.0 million of 5.68% mortgage debt in August 2014, the prepayment of $33.4 million of our 6.40% unsecured notes in September 2014, the prepayment of $125.0 million of our 7.50% unsecured notes in November 2014 the payment of $100.0 million of our term loan in December 2014, the prepayment of $138.8 million of our 5.75% senior unsecured notes due 2015 in May 2015, the foreclosure of 225 Water Street in May 2015 and the defeasance of the outstanding balance of the mortgage debt secured by 111 East Wacker Drive, one of the buildings included in Illinois Center, in August 2015.
Gain on early extinguishment of debt. The gain on early extinguishment of debt in the 2015 period reflects a $17.3 million gain related to the 225 Water Street foreclosure and a $0.6 million gain related to the repayment of mortgage debt at 111 Monument
29
Circle, partially offset by a $6.2 million loss related to the defeasance of the mortgage loan secured by 1320 Main Street, a $3.9 million loss related to the defeasance of the mortgage loan secured by 111 East Wacker Drive, a $0.6 million loss related to the prepayment of mortgage debt at 2501 20th Place South, a $0.1 million loss related to the redemption of $138.8 million of our 5.75% senior notes and a $0.4 million loss related to the new credit agreement entered into in January 2015, which resulted in the termination of our prior credit agreement. The gain on early extinguishment of debt in the 2014 period primarily reflects the write-off of unamortized premiums and deferred financing fees related to the prepayment of $265.0 million of 5.68% mortgage debt at 600 West Chicago Avenue in August 2014, partially offset by the write off of deferred financing fees related to the prepayment of $125.0 million of our 7.50% unsecured senior notes due 2019.
Gain on sale of equity investments. The gain on sale of equity investments in the 2014 period reflects the sale on July 9, 2014 of our entire stake of 22,000,000 common shares of SIR at a per share sales price in excess of our per share carrying value, partially offset by a loss on the sale of our investment in AIC in May 2014.
Gain on issuance of shares by an equity investee. The gain on issuance of shares by an equity investee primarily reflects the issuance of 10,000,000 common shares by SIR during the second quarter of 2014 at prices above our per share carrying value.
Foreign currency exchange loss. The foreign currency exchange loss for the year ended December 31, 2015 relates to the change in foreign currency rates resulting in losses on cash proceeds from the Australian portfolio disposition maintained in an Australian bank account prior to the transfer of cash from our Australian subsidiary to our U.S bank accounts.
Gain on sale of properties. In the first quarter of 2015, we sold two properties and recorded a $5.9 million gain on sale of properties. In the second quarter of 2015, we recorded gains of $41.6 million and $11.9 million related to the sales of an office portfolio in AL, LA, NC, SC and Sorrento Valley Business Park, respectively. In the third quarter of 2015, we recorded gains of $27.0 million, $17.6 million and $7.9 million related to the sales of Illinois Center, 185 Asylum Street and 16th and Race Street, respectively. In the fourth quarter of 2015, we recorded gains of $22.8 million, $9.5 million, $8.4 million and $4.3 million related to the sales of Arizona Center, One Park Square, 4 South 84th Avenue and One South Church Avenue, respectively.
These gains were partially offset by a loss in the second quarter on the sale of properties in Australia of $47.9 million, which is net of the write off of approximately $63.2 million of foreign currency translation adjustments previously recorded in accumulated other comprehensive loss. We also recognized losses in the second quarter of $8.2 million and $2.3 million related to sales of a portfolio of small office and industrial properties and two properties in St. Louis, respectively a loss in the third quarter of $12.5 million related to the sale of a portfolio in upstate New York and losses in the fourth quarter of $3.1 million and $0.4 million related to the sale of a portfolio in Georgia and the sale of 775 Ridge Lake Boulevard, respectively.
Income tax expense. The decrease in income tax expense relates to a decrease in foreign tax expense related to the Australian assets, which were sold in June 2015. The decrease in the foreign tax expense was partially offset by federal income tax expense in the second quarter of 2015 incurred as a result of a taxable built-in gain triggered by the sale of a property that was previously owned by a C corporation.
Equity in earnings of investees. Equity in earnings of investees represents our proportionate share of earnings from SIR during the 2014 period prior to the sale of our entire stake of 22,000,000 common shares of SIR on July 9, 2014 and our proportionate share of earnings from AIC during the 2014 period prior to the sale of our investment in AIC on May 9, 2014.
Income from discontinued operations. In 2015, we adopted ASU 2014-08 and did not classify the properties sold in 2015 as discontinued operations in accordance with this guidance. Income from discontinued operations in the 2014 period relates to 14 properties (43 buildings) sold in 2014.
Loss on asset impairment from discontinued operations. The 2014 loss on asset impairment reflects the write down to estimated fair value less costs to sell for 14 properties (43 buildings) sold during 2014.
Loss on early extinguishment of debt from discontinued operations. The 2014 loss on early extinguishment of debt reflects prepayment premiums and the write off of unamortized discounts and deferred financing fees associated with the repayment of $11.2 million of 6.14% mortgage debt and $8.5 million of 5.78% mortgage debt in June 2014.
Preferred distributions. The decrease in preferred distributions reflects the conversion of 10,264,503 of our series D preferred shares into 10,412,499 of our common shares during the year ended December 31, 2014.
Excess fair value of consideration over carrying value of preferred shares. As a result of the conversion of our series D preferred shares in May 2014, we recorded a preferred distribution of $16.2 million for the excess of the market value of the common shares issued above the carrying value of the series D preferred shares converted.
30
RESULTS OF OPERATIONS
Year Ended December 31, 2014, Compared to Year Ended December 31, 2013
Comparable Properties Results(1) | Other Properties Results(2) | Consolidated Results | |||||||||||||||||||||||||||||||||||
Year Ended December 31, | |||||||||||||||||||||||||||||||||||||
2014 | 2013 | $ Change | % Change | 2014 | 2013 | 2014 | 2013 | $ Change | % Change | ||||||||||||||||||||||||||||
(in thousands) | |||||||||||||||||||||||||||||||||||||
Rental income | $ | 691,713 | $ | 686,229 | $ | 5,484 | 0.8 | % | $ | (14 | ) | $ | 77,033 | $ | 691,699 | $ | 763,262 | $ | (71,563 | ) | (9.4 | )% | |||||||||||||||
Tenant reimbursements and other income | 170,085 | 176,177 | (6,092 | ) | (3.5 | )% | 73 | 13,590 | 170,158 | 189,767 | (19,609 | ) | (10.3 | )% | |||||||||||||||||||||||
Operating expenses | (388,190 | ) | (393,095 | ) | 4,905 | (1.2 | )% | 208 | (16,950 | ) | (387,982 | ) | (410,045 | ) | 22,063 | (5.4 | )% | ||||||||||||||||||||
Net operating income(3) | $ | 473,608 | $ | 469,311 | $ | 4,297 | 0.9 | % | $ | 267 | $ | 73,673 | 473,875 | 542,984 | (69,109 | ) | (12.7 | )% | |||||||||||||||||||
Other expenses: | |||||||||||||||||||||||||||||||||||||
Depreciation and amortization | 227,532 | 234,402 | (6,870 | ) | (2.9 | )% | |||||||||||||||||||||||||||||||
General and administrative | 113,155 | 80,504 | 32,651 | 40.6 | % | ||||||||||||||||||||||||||||||||
Loss on asset impairment | 185,067 | 124,253 | 60,814 | 48.9 | % | ||||||||||||||||||||||||||||||||
Acquisition related costs | 5 | 318 | (313 | ) | (98.4 | )% | |||||||||||||||||||||||||||||||
Total other expenses | 525,759 | 439,477 | 86,282 | 19.6 | % | ||||||||||||||||||||||||||||||||
Operating income | (51,884 | ) | 103,507 | (155,391 | ) | (150.1 | )% | ||||||||||||||||||||||||||||||
Interest and other income | 1,561 | 1,229 | 332 | 27.0 | % | ||||||||||||||||||||||||||||||||
Interest expense | (143,230 | ) | (173,011 | ) | 29,781 | (17.2 | )% | ||||||||||||||||||||||||||||||
Gain (loss) on early extinguishment of debt | 4,909 | (60,052 | ) | 64,961 | (108.2 | )% | |||||||||||||||||||||||||||||||
Gain on sale of equity investment | 171,561 | 66,293 | 105,268 | 158.8 | % | ||||||||||||||||||||||||||||||||
Gain on issuance of shares by an equity investee | 17,020 | — | 17,020 | 100.0 | % | ||||||||||||||||||||||||||||||||
Foreign currency exchange loss | — | — | — | (100.0 | )% | ||||||||||||||||||||||||||||||||
Gain on sale of properties | — | 1,596 | (1,596 | ) | 100.0 | % | |||||||||||||||||||||||||||||||
Loss from continuing operations before income taxes and equity in earnings of investees | (63 | ) | (60,438 | ) | 60,375 | (99.9 | )% | ||||||||||||||||||||||||||||||
Income tax expense | (3,191 | ) | (2,634 | ) | (557 | ) | 21.1 | % | |||||||||||||||||||||||||||||
Equity in earnings of investees | 24,460 | 25,754 | (1,294 | ) | (5.0 | )% | |||||||||||||||||||||||||||||||
Income (loss) from continuing operations | 21,206 | (37,318 | ) | 58,524 | (156.8 | )% | |||||||||||||||||||||||||||||||
Discontinued operations: | |||||||||||||||||||||||||||||||||||||
Income from discontinued operations | 8,389 | 6,393 | 1,996 | 31.2 | % | ||||||||||||||||||||||||||||||||
Loss on asset impairment from discontinued operations | (2,238 | ) | (102,869 | ) | 100,631 | (97.8 | )% | ||||||||||||||||||||||||||||||
Loss on early extinguishment of debt from discontinued operations | (3,345 | ) | (1,011 | ) | (2,334 | ) | 230.9 | % | |||||||||||||||||||||||||||||
Net loss on sale of properties from discontinued operations | — | (22,162 | ) | 22,162 | (100.0 | )% | |||||||||||||||||||||||||||||||
Net income (loss) | 24,012 | (156,967 | ) | 180,979 | (115.3 | )% | |||||||||||||||||||||||||||||||
Net income attributable to noncontrolling interest in consolidated subsidiary | — | (20,093 | ) | 20,093 | (100.0 | )% | |||||||||||||||||||||||||||||||
Net income (loss) attributable to Equity Commonwealth | 24,012 | (177,060 | ) | 201,072 | (113.6 | )% | |||||||||||||||||||||||||||||||
Preferred distributions | (32,095 | ) | (44,604 | ) | 12,509 | (28.0 | )% | ||||||||||||||||||||||||||||||
Excess fair value of consideration over carrying value of preferred shares | (16,205 | ) | — | (16,205 | ) | (100.0 | )% | ||||||||||||||||||||||||||||||
Net loss attributable to Equity Commonwealth common shareholders | $ | (24,288 | ) | $ | (221,664 | ) | $ | 197,376 | (89.0 | )% | |||||||||||||||||||||||||||
(1) | Comparable properties consist of 156 properties (262 buildings) owned continuously from January 1, 2013 to December 31, 2014. |
(2) | Other properties consist of properties owned by SIR and GOV. |
(3) | See Note 4 on page 28 for further information regarding NOI. |
We refer to the 156 properties (262 buildings) we owned continuously from January 1, 2013 to December 31, 2014, as comparable properties. We refer to the properties owned by SIR as other properties. Our consolidated statements of operations for the years ended December 31, 2014 and 2013 include the operating results of 156 properties for the entire periods, as we owned these properties as of January 1, 2013. Our consolidated statement of operations for the year ended December 31, 2013 also includes the operating results of properties owned by SIR when SIR was our consolidated subsidiary, which was until July 2, 2013.
Rental income. Rental income decreased $71.6 million in the 2014 period, compared to the 2013 period, due to a decrease of $77.0 million primarily related to the deconsolidation of SIR discussed above, partially offset by an increase at our comparable properties totaling $5.5 million. The increase in comparable property rental income primarily reflects approximately $8.5 million received
31
from the settlement of litigation with a former tenant at one of our properties. Rental income includes non-cash straight line rent adjustments totaling $12.5 million in the 2014 period and $31.8 million in the 2013 period, which includes $5.7 million related to SIR, and net reductions for amortization of acquired real estate leases and assumed real estate lease obligations totaling $10.7 million in the 2014 period and $10.3 million in the 2013 period. Rental income also includes the recognition of lease termination fees totaling $4.7 million in the 2014 period and $2.8 million in the 2013 period.
Tenant reimbursements and other income. Tenant reimbursements and other income decreased $19.6 million in the 2014 period, compared to the 2013 period, due to a decrease in tenant reimbursements and other income totaling $13.5 million primarily related to the deconsolidation of SIR discussed above, and a decrease in tenant reimbursements and other income at our comparable properties totaling $6.1 million. The decrease in comparable property tenant reimbursements and other income from our comparable properties primarily reflects decreases in real estate taxes and the related tenant reimbursements at some of our properties.
Operating expenses. The decrease in operating expenses during the 2014 period totaling $22.1 million reflects a decrease in operating expenses totaling $17.2 million primarily related to the deconsolidation of SIR discussed above, and a decrease in operating expenses at our comparable properties totaling $4.9 million. The decrease in operating expenses at our comparable properties primarily reflects decreases in real estate tax assessments and reduced rates in certain markets, partially offset by increases in utility expenses and snow removal costs related to the more severe winter season during the 2014 period, compared to the 2013 period.
General and administrative expense. The increase in general and administrative expenses primarily relates to $23.4 million for the shareholder approval of reimbursement of expenses incurred by Related/Corvex in connection with their consent solicitation to remove our former Trustees, $3.6 million of expenses related to the termination and cooperation agreement with RMR, the internalization of our management and an increase of $15.0 million related to business management incentive fees. These increases were partially offset by a $19.6 million decrease related to legal and litigation expenses.
Loss on asset impairment. The loss on asset impairment in the 2014 period primarily includes impairment losses recorded in the fourth quarter of 2014 as a result of the change in the anticipated holding period for certain properties and an impairment loss recorded in the second quarter of 2014 on a property for which we made the decision to cease making loan servicing payments. The loss on asset impairment in the 2013 period reflects the write down to estimated fair value, less costs to sell for properties that were being marketed for sale.
Interest and other income. The increase in interest and other income primarily reflects an increase in interest income due to higher cash balances in the current year.
Interest expense. The decrease in interest expense primarily reflects the repurchase of $670.3 million of our unsecured senior notes pursuant to the tender offer we completed in March 2013, the prepayment of $99.0 million of our 5.75% unsecured senior notes in October 2013, the prepayment of $265.0 million of 5.68% mortgage debt in August 2014, the prepayment of $33.4 million of our 6.40% unsecured notes in September 2014, the prepayment of $125.0 million of our 7.50% unsecured notes in November 2014 and the payment of $100.0 million of our term loan in December 2014.
Gain (loss) on early extinguishment of debt. The gain on early extinguishment of debt in the 2014 period primarily reflects the write-off of unamortized premiums net of deferred financing fees related to the prepayment of $265.0 million of 5.68% mortgage debt in August 2014, partially offset by the write off of deferred financing fees related to the prepayment of $125.0 million of our 7.50% unsecured senior notes due 2019. The loss on early extinguishment of debt in the 2013 period primarily reflects the difference between $726.2 million paid to repurchase $670.3 million of our unsecured senior notes pursuant to the tender offer we completed in March 2013, plus the write off of unamortized discounts and deferred financing fees and expenses.
Gain on sale of equity investment. The gain on sale of equity investment in the 2014 period primarily reflects the sale on July 9, 2014 of our entire stake of 22,000,000 common shares of SIR at a per share sales price in excess of our per share carrying value. The gain on sale of equity investments in the 2013 period reflects the sale in March 2013 of all 9,950,000 common shares of GOV that we owned at a per share sales price in excess of our per share carrying value.
Gain on issuance of shares by an equity investee. The gain on issuance of shares by an equity investee primarily reflects the issuance of 10,000,000 common shares by SIR during the year ended December 31, 2014 at prices above our per share carrying value.
Gain on sale of properties. Gain on sale of properties in the 2013 period reflects a gain of $1.6 million from an eminent domain land taking at one of our properties.
32
Income tax expense. The increase in income tax expense reflects higher Australian taxable income in the 2014 period as compared to the 2013 period.
Equity in earnings of investees. Equity in earnings of investees represents our proportionate share of earnings from SIR and AIC during the 2014 period, and from SIR, GOV and AIC during the 2013 period. The decrease in earnings of investees primarily reflects our proportionate share of earnings from SIR since we began accounting for our investment in SIR using the equity method in July 2013, partially offset by the sale of our entire stake of 22,000,000 common shares of SIR on July 9, 2014, the sale of our investment in AIC on May 9, 2014 and our sale in March 2013 of all 9,950,000 common shares that we owned of GOV.
Income from discontinued operations. The increase in income from discontinued operations primarily reflects the decline in depreciation expense from ceasing depreciation when assets are reclassified as held for sale, partially offset by the decline in NOI from 14 properties (43 buildings) that were sold in 2014 and 43 properties (134 buildings) and a land parcel sold during 2013.
Loss on asset impairment from discontinued operations. The 2014 loss on asset impairment reflects the write down to estimated fair value less costs to sell for 14 properties (43 buildings) sold during 2014. The 2013 loss on asset impairment reflects the write down to estimated fair value less costs to sell for 36 properties (76 buildings) sold during the year ended December 31, 2013.
Loss on early extinguishment of debt from discontinued operations. The 2014 loss on early extinguishment of debt reflects prepayment premiums and the write off of unamortized discounts and deferred financing fees associated with the repayment of $11.2 million of 6.14% mortgage debt and $8.5 million of 5.78% mortgage debt in June 2014. The 2013 loss on early extinguishment of debt reflects the write off of unamortized discount and a prepayment premium associated with the prepayment of $7.1 million of 5.76% mortgage debt in December 2013.
Net loss on sale of properties from discontinued operations. Net loss on sale of properties in the 2013 period reflects losses totaling $22.2 million from the sale of 43 properties (134 buildings) and a land parcel during the 2013 period.
Net income attributable to noncontrolling interest in consolidated subsidiary. The decrease in net income attributable to noncontrolling interest in consolidated subsidiary reflects the noncontrolling portion of income from SIR when SIR was our consolidated subsidiary, which was until July 2, 2013.
Preferred distributions. The decrease in preferred distributions in the 2014 period reflects the conversion of 10,264,503 of our series D preferred shares into 10,412,499 of our common shares during the year ended December 31, 2014.
Excess fair value of consideration over carrying value of preferred shares. As a result of the conversion of our series D preferred shares in May 2014, we recorded a preferred distribution of $16.2 million for the excess of the market value of the common shares issued above the carrying value of the series D preferred shares converted.
Inflation
Inflation in the past several years in the United States has been modest. Future inflation might have either positive or negative impacts on our business. Inflation might cause the value of our real estate to increase. Inflation might also cause our costs of equity and debt capital and operating costs to increase. An increase in our capital costs or in our operating costs may result in decreased earnings unless it is offset by increased revenues. Further inflation may permit us to increase rents upon renewal or enter new leases above the previous rent amounts for the leased space.
To mitigate the adverse impact of any increased cost of debt capital in the event of material inflation, we may enter into additional interest rate hedge arrangements in the future. The decision to enter into these agreements will be based on various factors, including the amount of our floating rate debt outstanding, our belief that material interest rate increases are likely to occur, the costs of and our expected benefit from these agreements and upon requirements of our borrowing arrangements.
In periods of rapid inflation, our tenants' operating costs may increase faster than revenues, which may have an adverse impact upon us if our tenants' operating income becomes insufficient to pay our rent. To mitigate the adverse impact of tenant financial distress upon us, we require many of our tenants to provide guarantees or security for our rent.
LIQUIDITY AND CAPITAL RESOURCES
Our Operating Liquidity and Resources
As of December 31, 2015, we had $1.8 billion of cash and cash equivalents. We expect to use our cash balances, cash flow from our operations and proceeds of future property sales to fund our operations, repay debt, redeem preferred shares,
33
make distributions, acquire assets, fund tenant improvements and leasing costs and for other general business purposes. We believe our cash balances and the cash flow from our operations will be sufficient to fund our ordinary course activities.
Our future cash flows from operating activities will depend primarily upon our:
• | ability to maintain or improve the occupancy of, and the rental rates at, our properties; |
• | ability to control operating and financing cost increases at our properties; and |
• | ability to purchase additional properties which produce rents, less property operating expenses, in excess of our costs of acquisition capital. |
Volatility in energy costs and real estate taxes may cause our future operating costs to fluctuate; however, the impact of these fluctuations is expected to be partially offset by the pass through of operating costs to our tenants pursuant to lease terms, although there can be no assurance that we will be able to successfully offset these costs or that doing so would not negatively impact our competitive position or business.
Cash flows provided by (used in) operating, investing and financing activities were $181.5 million, $1,648.9 million and $(382.7) million, respectively, for the year ended December 31, 2015, and $224.4 million, $771.2 million and $(847.0) million, respectively, for the year ended December 31, 2014. Changes in these three categories of our cash flows between 2015 and 2014 are primarily related to real estate improvements, our dispositions of properties, the sale of our SIR common shares during the 2014 period, our purchase of our common shares during the 2015 period, our repayments of debt, and our distributions to our common shareholders during the 2014 period.
Our Investment and Financing Liquidity and Resources
In order to maintain financial flexibility, to fund acquisitions and to meet cash needs that may result from timing differences between our receipt of rents and our desire or need to make distributions and investments or pay operating or capital expenses, we maintain an unsecured revolving credit facility with a group of institutional lenders. On January 29, 2015, we entered into a new credit agreement, pursuant to which the lenders agreed to provide (i) a $750.0 million unsecured revolving credit facility, (ii) a $200.0 million 5-year term loan facility and (iii) a $200.0 million 7-year term loan facility. The new agreement replaced our prior credit agreement, dated as of August 9, 2010, and our prior term loan agreement, dated as of December 16, 2010. The revolving credit facility has a scheduled maturity date of January 28, 2019, which maturity date may be extended for up to two additional periods of six months at our option subject to satisfaction of certain conditions and the payment of an extension fee of 0.075% of the aggregate amount available under the revolving credit facility. The 5-year term loan and the 7-year term loan have scheduled maturity dates of January 28, 2020 and January 28, 2022, respectively. We used the proceeds of borrowings under the credit agreement to repay all amounts outstanding and due under the previous term loan agreement.
Borrowings under our revolving credit facility currently bear interest at LIBOR plus a spread, which was 125 basis points as of December 31, 2015. We also pay a facility fee of 25 basis points per annum on the total amount of lending commitments under our revolving credit facility. Both the interest rate spread and the facility fee are subject to adjustment based upon changes to our credit ratings. We are allowed to borrow, repay and reborrow funds available under our revolving credit facility until maturity, and no principal repayment is due until maturity. As of December 31, 2015, the interest rate payable on borrowings under our revolving credit facility was 1.68%. As of December 31, 2015, we had no balance outstanding under our revolving credit facility.
Our term loans currently bear interest at a rate of LIBOR plus a spread, which was 140 and 180 basis points for the 5-year and 7-year term loan, respectively, as of December 31, 2015. The interest rate spread is subject to adjustment based upon changes to our credit ratings. As of December 31, 2015, the interest rate for the amounts outstanding under our term loan was 1.83% and 2.23% for the 5-year and 7-year term loan, respectively. As of December 31, 2015, our 5-year and 7-year term loans each had balances of $200.0 million.
On December 1, 2015, we repaid at par $116.0 million of 5.24% mortgage debt at 111 Monument Circle. On August 3, 2015, we defeased the outstanding $141.4 million balance of the mortgage loan secured by 111 East Wacker Drive, one of the buildings included in Illinois Center. On June 5, 2015, we prepaid $10.0 million of 7.36% mortgage debt at 2501 20th Place South. On June 3, 2015, we defeased the $38.7 million outstanding balance of the mortgage loan secured by 1320 Main Street. On May 22, 2015, title to 225 Water Street was transferred to the lender pursuant to the consensual foreclosure in full
34
satisfaction of the mortgage debt, with a principal balance of $40.1 million. On May 1, 2015, we redeemed at par $138.8 million of our 5.75% senior unsecured notes due 2015.
During the year ended December 31, 2015, we paid an aggregate of $27.9 million of distributions on our series D and series E preferred shares. On January 26, 2016, we announced that our Board of Trustees declared dividends of $0.40625 per series D preferred share and $0.453125 per series E preferred share, both of which were paid on February 16, 2016 to shareholders of record on February 5, 2016.
On August 24, 2015, our Board of Trustees approved a common share repurchase plan, which authorizes the repurchase of up to $100.0 million of our outstanding common shares over the twelve month period following the date of authorization. On September 14, 2015, our Board of Trustees authorized the repurchase of up to an additional $100.0 million of our outstanding common shares over the twelve month period following the date of authorization. During the year ended December 31, 2015, we purchased and retired 3,410,300 of our common shares at a weighted average price of $25.76 per share for a total investment of $87.8 million.
Our outstanding debt maturities and weighted average interest rates as of December 31, 2015, were as follows (dollars in thousands):
Scheduled Principal Payments During Period | ||||||||||||||||||
Year | Unsecured Floating Rate Debt | Unsecured Fixed Rate Debt | Secured Fixed Rate Debt | Total(1) | Weighted Average Interest Rate(2) | |||||||||||||
2016 | $ | — | $ | 139,104 | (3) | $ | 3,346 | $ | 142,450 | 6.2 | % | |||||||
2017 | — | 250,000 | 44,865 | 294,865 | 6.2 | % | ||||||||||||
2018 | — | 250,000 | 3,847 | 253,847 | 6.6 | % | ||||||||||||
2019 | — | — | 164,613 | (4) | 164,613 | 5.7 | % | |||||||||||
2020 | 200,000 | 250,000 | 1,674 | 451,674 | 4.1 | % | ||||||||||||
2021 | — | — | 25,982 | 25,982 | 5.7 | % | ||||||||||||
2022 | 200,000 | — | 799 | 200,799 | 2.2 | % | ||||||||||||
2023 | — | — | 702 | 702 | 5.7 | % | ||||||||||||
2024 | — | — | 743 | 743 | 5.7 | % | ||||||||||||
2025 | — | — | 787 | 787 | 5.7 | % | ||||||||||||
Thereafter | — | 175,000 | 204 | 175,204 | 5.7 | % | ||||||||||||
$ | 400,000 | $ | 1,064,104 | $ | 247,562 | $ | 1,711,666 | 5.1 | % | |||||||||
(1) | Total debt outstanding as of December 31, 2015, including net unamortized premiums and discounts, equals $1,710,324. |
(2) | Weighted based on current contractual interest rates. |
(3) | On February 16, 2016, we redeemed at par $139.1 million of our 6.25% senior unsecured notes due 2016. |
(4) | We have a mortgage loan with an aggregate outstanding principal balance as of December 31, 2015 of $169,612 secured by 1735 Market Street that matures in 2019. Interest on this loan is payable at a rate equal to LIBOR plus 2.625%, but the interest rate has been fixed by a cash flow hedge which sets the rate at approximately 5.66% per year until December 1, 2016. |
For a description of our financing activities since January 1, 2015, see “Financing Activities” above. Also, for further information about our indebtedness, see Note 9 to the Notes to Consolidated Financial Statements in Part IV, Item 15 of this Annual Report on Form 10-K, which is incorporated herein by reference.
When significant amounts are outstanding under our revolving credit facility, or as the maturity dates of our revolving credit facility and term debts approach, we explore alternatives for the repayment of amounts due. Such alternatives may include incurring additional debt and issuing new equity securities, extending the maturity of our revolving credit facility and entering into a new revolving credit facility. We have an effective shelf registration statement that allows us to issue public securities on an expedited basis, but it does not assure that there will be buyers for such securities.
We believe that we will have access to various types of financings, including debt or equity offerings, to fund our future acquisitions and to pay our debts and other obligations as they become due. The completion and the costs of our future debt transactions will depend primarily upon market conditions and our credit ratings. We have no control over market conditions. Our credit ratings depend upon evaluations by credit rating agencies of our business practices and plans and, in particular,
35
whether we appear to have the ability to maintain our earnings, to space our debt maturities and to balance our use of debt and equity capital so that our financial performance and leverage ratios afford us flexibility to withstand any reasonably foreseeable adverse changes. We intend to conduct our business activities in a manner which will continue to afford us reasonable access to capital for investment and financing activities. However, there can be no assurance regarding our credit ratings or our ability to complete any debt or equity offerings or that our cost of any future public or private financings will not increase.
During the year ended December 31, 2015, we disposed of 91 properties (135 buildings) and one land parcel with a combined 18.9 million square feet for an aggregate sales price of $2.0 billion, excluding closing costs. For more information regarding these transactions, see Note 4 to Notes to Consolidated Financial Statements in Part IV, Item 15 of this Annual Report on Form 10-K, which is incorporated herein by reference.
During the years ended December 31, 2015, 2014 and 2013 amounts capitalized at our properties, including properties sold and properties classified in discontinued operations, and properties owned by SIR when SIR was a consolidated subsidiary of ours, for tenant improvements, leasing costs, building improvements and development and redevelopment activities were as follows (amounts in thousands):
Years Ended December 31, | |||||||||||
2015 | 2014 | 2013 | |||||||||
Tenant improvements(1) | $ | 54,272 | $ | 58,238 | $ | 78,806 | |||||
Leasing costs(2) | 44,590 | 37,091 | 41,652 | ||||||||
Building improvements(3) | 21,403 | 33,370 | 44,121 | ||||||||
(1) | Tenant improvements include capital expenditures to improve tenants’ space. |
(2) | Leasing costs include leasing related costs such as brokerage commissions and legal expenses. |
(3) | Building improvements generally include expenditures to replace obsolete building components and expenditures that extend the useful life of existing assets. Tenant-funded capital expenditures are excluded. |
During the year ended December 31, 2015, commitments made for expenditures in connection with leasing space at our properties were as follows (dollar and square foot measures in thousands, except per square foot measures):
New Leases | Renewals | Total | |||||||||
Rentable square feet leased during the period | 2,060 | 2,816 | 4,876 | ||||||||
Tenant improvements and leasing commissions | $ | 99,925 | $ | 56,466 | $ | 156,391 | |||||
Tenant improvements and leasing commissions per rentable square foot | $ | 48.52 | $ | 20.05 | $ | 32.08 | |||||
Weighted average lease term by square foot (years) | 8.5 | 4.7 | 6.3 | ||||||||
Tenant improvements and leasing commissions per rentable square foot per year | $ | 5.54 | $ | 4.20 | $ | 5.06 | |||||
Debt Covenants
Our unsecured debt obligations at December 31, 2015 were our term loans and our publicly issued senior unsecured notes. Our public debt indenture and related supplements, our revolving credit facility and our term loan agreement contain a number of financial ratio covenants which generally restrict our ability to incur debts, in excess of calculated amounts, restrict our ability to make distributions under certain circumstances and require us to maintain other financial ratios. At December 31, 2015, we believe we were in compliance with all covenants under our indenture and related supplements, and we believe we were in compliance with all respective covenants under our revolving credit facility and our term loan agreement. In addition to our unsecured debt obligations, we had $249.7 million (including net unamortized premiums and discounts) of mortgage notes outstanding at December 31, 2015.
None of our indenture and related supplements, our revolving credit facility and term loan agreement, or our mortgage notes contain provisions for acceleration or require us to provide collateral security which could be triggered by our debt ratings. However, our senior debt rating is used to determine the interest rate and the fees payable under our revolving credit facility and our term loan agreement.
36
OFF BALANCE SHEET ARRANGEMENTS
As of December 31, 2015, we had no off balance sheet arrangements that have had or that we expect would be reasonably likely to have a future material effect on our financial condition, changes in financial condition, revenues or expenses, results of operations, liquidity, capital expenditures or capital resources. We had no swaps or hedges as of December 31, 2015, other than the cash flow hedge associated with our $169.6 million of mortgage debt described in Note 13 to the Notes to Consolidated Financial Statements and under “Quantitative and Qualitative Disclosures About Market Risk” in Part II, Item 7A of this Annual Report on Form 10-K.
CONTRACTUAL OBLIGATIONS
As of December 31, 2015, our contractual obligations were as follows (dollars in thousands):
Payment Due by Period | |||||||||||||||||||
Contractual Obligations | Total | Less than 1 year | 1-3 years | 3-5 years | More than 5 years | ||||||||||||||
Long term debt obligations | $ | 1,711,666 | $ | 142,450 | $ | 548,712 | $ | 616,287 | $ | 404,217 | |||||||||
Tenant related obligations(1) | 118,933 | 85,976 | 32,095 | — | 862 | ||||||||||||||
Projected interest expense(2) | 478,182 | 84,577 | 104,557 | 66,289 | 222,759 | ||||||||||||||
Operating lease obligations—ground lease and corporate office space(3) | 139,851 | 1,957 | 4,649 | 4,754 | 128,491 | ||||||||||||||
Total | $ | 2,448,632 | $ | 314,960 | $ | 690,013 | $ | 687,330 | $ | 756,329 | |||||||||
(1) | Committed tenant related obligations include leasing commissions and tenant improvements and are based on leases in effect as of December 31, 2015. |
(2) | Projected interest expense is attributable to only the long term debt obligations listed above at existing rates and is not intended to project future interest costs which may result from debt prepayments, new debt issuances or changes in interest rates. Projected interest expense does not include interest that may become payable related to future borrowings under our revolving credit facility. |
(3) | Ground lease obligation represents payments due from us pursuant to an operating ground lease at 111 River Street, where we are the lessee. |
FUNDS FROM OPERATIONS (FFO) AND NORMALIZED FFO
We compute FFO in accordance with standards established by the National Association of Real Estate Investment Trusts (NAREIT). NAREIT defines FFO as net income (loss), calculated in accordance with GAAP, excluding real estate depreciation and amortization, gains (or losses) from sales of depreciable property, impairment of depreciable real estate, and our portion of these items related to equity investees and noncontrolling interests. Our calculation of Normalized FFO differs from NAREIT’s definition of FFO because we exclude certain items that we view as nonrecurring or impacting comparability from period to period. We consider FFO and Normalized FFO to be appropriate measures of operating performance for a REIT, along with net income, net income attributable to Equity Commonwealth common shareholders, operating income and cash flow from operating activities.
We believe that FFO and Normalized FFO provide useful information to investors because by excluding the effects of certain historical amounts, such as depreciation expense, FFO and Normalized FFO may facilitate a comparison of our operating performance between periods and with other REITs. FFO and Normalized FFO do not represent cash generated by operating activities in accordance with GAAP and should not be considered as alternatives to net income, net income attributable to Equity Commonwealth common shareholders, operating income or cash flow from operating activities, determined in accordance with GAAP, or as indicators of our financial performance or liquidity, nor are these measures necessarily indicative of sufficient cash flow to fund all of our needs. These measures should be considered in conjunction with net income, net income attributable to Equity Commonwealth common shareholders, operating income and cash flow from operating activities as presented in our consolidated statements of operations, consolidated statements of comprehensive income and consolidated statements of cash flows. Other REITs and real estate companies may calculate FFO and Normalized FFO differently than we do.
37
The following table provides a reconciliation of net income (loss) attributable to Equity Commonwealth to FFO attributable to Equity Commonwealth common shareholders and a calculation to Normalized FFO attributable to Equity Commonwealth common shareholders (in thousands):
Years Ended December 31, | |||||||||||
2015 | 2014 | 2013 | |||||||||
Reconciliation to FFO: | |||||||||||
Net income (loss) attributable to Equity Commonwealth | $ | 99,857 | $ | 24,012 | $ | (177,060 | ) | ||||
Depreciation and amortization from continuing operations | 194,001 | 227,532 | 234,402 | ||||||||
Depreciation and amortization from discontinued operations | — | — | 12,550 | ||||||||
Loss on asset impairment from continuing operations | 17,162 | 185,067 | 124,253 | ||||||||
Loss on asset impairment from discontinued operations | — | 2,238 | 102,869 | ||||||||
FFO from equity investees | — | 33,007 | 33,564 | ||||||||
Net income attributable to noncontrolling interest | — | — | 20,093 | ||||||||
FFO attributable to noncontrolling interest | — | — | (26,270 | ) | |||||||
Gain on sale of properties | (84,421 | ) | — | (1,596 | ) | ||||||
Net loss on sale of properties from discontinued operations | — | — | 22,162 | ||||||||
Equity in earnings of investees | — | (24,460 | ) | (25,754 | ) | ||||||
FFO attributable to Equity Commonwealth | 226,599 | 447,396 | 319,213 | ||||||||
Preferred distributions | (27,924 | ) | (32,095 | ) | (44,604 | ) | |||||
FFO attributable to Equity Commonwealth common shareholders | $ | 198,675 | $ | 415,301 | $ | 274,609 | |||||
Reconciliation to Normalized FFO: | |||||||||||
FFO available for Equity Commonwealth common shareholders | $ | 198,675 | $ | 415,301 | $ | 274,609 | |||||
Recurring adjustments: | |||||||||||
Lease value amortization from continuing operations | 7,515 | 10,650 | 10,310 | ||||||||
Lease value amortization from discontinued operations | — | — | (775 | ) | |||||||
Straight line rent from continuing operations | (5,328 | ) | (12,531 | ) | (31,791 | ) | |||||
Straight line rent from discontinued operations | — | (226 | ) | 562 | |||||||
(Gain) loss on early extinguishment of debt from continuing operations | (6,661 | ) | (4,909 | ) | 60,052 | ||||||
Loss on early extinguishment of debt from discontinued operations | — | 3,345 | 1,011 | ||||||||
Minimum cash rent from direct financing lease | 7,451 | 8,128 | 8,125 | ||||||||
Gain on sale of equity investment | — | (171,561 | ) | (66,293 | ) | ||||||
Gain on issuance of shares by an equity investee | — | (17,020 | ) | — | |||||||
Interest earned from direct financing lease | (407 | ) | (787 | ) | (1,128 | ) | |||||
Normalized FFO from equity investees, net of FFO | — | (3,353 | ) | (2,530 | ) | ||||||
Normalized FFO from noncontrolling interest, net of FFO | — | — | 1,987 | ||||||||
Other items which affect comparability: | |||||||||||
Shareholder litigation costs and transition-related expenses | 10,869 | 37,681 | 29,874 | ||||||||
Transition services fee | 2,679 | 3,600 | — | ||||||||
Acquisition related costs | — | 5 | 318 | ||||||||
Gain on sale of securities | (3,080 | ) | — | — | |||||||
Foreign currency exchange loss | 8,857 | — | — | ||||||||
Normalized FFO attributable to Equity Commonwealth common shareholders | $ | 220,570 | $ | 268,323 | $ | 284,331 | |||||
38
PROPERTY NET OPERATING INCOME (NOI)
We use property net operating income, or NOI, to evaluate the performance of our properties. We define NOI as income from our real estate including lease termination fees received from tenants less our property operating expenses. NOI excludes amortization of capitalized tenant improvement costs and leasing commissions.
The following table includes the reconciliation of NOI to net income, the most directly comparable financial measure under GAAP reported in our consolidated financial statements. We consider NOI to be an appropriate supplemental measure to net income because it may help both investors and management to understand the operations of our properties. We use NOI internally to evaluate property level performance, and we believe that NOI provides useful information to investors regarding our results of operations because it reflects only those income and expense items that are incurred at the property level and may facilitate comparisons of our operating performance between periods and with other REITs. NOI does not represent cash generated by operating activities in accordance with GAAP and should not be considered as an alternative to net income, net income attributable to Equity Commonwealth common shareholders, operating income or cash flow from operating activities, determined in accordance with GAAP, or as an indicator of our financial performance or liquidity, nor is this measure necessarily indicative of sufficient cash flow to fund all of our needs. This measure should be considered in conjunction with net income, net income attributable to Equity Commonwealth common shareholders, operating income and cash flow from operating activities as presented in our consolidated statements of operations, consolidated statements of comprehensive income and consolidated statements of cash flows. Other REITs and real estate companies may calculate NOI differently than we do.
39
A reconciliation of NOI to net income (loss) for the years ended December 31, 2015, 2014 and 2013, is as follows (in thousands):
Year Ended December 31, | |||||||||||
2015 | 2014 | 2013 | |||||||||
Rental income | $ | 570,382 | $ | 691,699 | $ | 763,262 | |||||
Tenant reimbursements and other income | 144,509 | 170,158 | 189,767 | ||||||||
Operating expenses | (324,948 | ) | (387,982 | ) | (410,045 | ) | |||||
NOI | $ | 389,943 | $ | 473,875 | $ | 542,984 | |||||
NOI | $ | 389,943 | $ | 473,875 | $ | 542,984 | |||||
Depreciation and amortization | (194,001 | ) | (227,532 | ) | (234,402 | ) | |||||
General and administrative | (57,457 | ) | (113,155 | ) | (80,504 | ) | |||||
Loss on asset impairment | (17,162 | ) | (185,067 | ) | (124,253 | ) | |||||
Acquisition related costs | — | (5 | ) | (318 | ) | ||||||
Operating income (loss) | 121,323 | (51,884 | ) | 103,507 | |||||||
Interest and other income | 5,989 | 1,561 | 1,229 | ||||||||
Interest expense | (107,316 | ) | (143,230 | ) | (173,011 | ) | |||||
Gain (loss) on early extinguishment of debt | 6,661 | 4,909 | (60,052 | ) | |||||||
Gain on sale of equity investments | — | 171,561 | 66,293 | ||||||||
Gain on issuance of shares by an equity investee | — | 17,020 | — | ||||||||
Foreign currency exchange loss | (8,857 | ) | — | — | |||||||
Gain on sale of properties | 84,421 | — | 1,596 | ||||||||
Income (loss) from continuing operations before income taxes and equity in earnings of investees | 102,221 | (63 | ) | (60,438 | ) | ||||||
Income tax expense | (2,364 | ) | (3,191 | ) | (2,634 | ) | |||||
Equity in earnings of investees | — | 24,460 | 25,754 | ||||||||
Income (loss) from continuing operations | 99,857 | 21,206 | (37,318 | ) | |||||||
Income from discontinued operations | — | 8,389 | 6,393 | ||||||||
Loss on asset impairment from discontinued operations | — | (2,238 | ) | (102,869 | ) | ||||||
Loss on early extinguishment of debt from discontinued operations | — | (3,345 | ) | (1,011 | ) | ||||||
Net loss on sale of properties from discontinued operations | — | — | (22,162 | ) | |||||||
Net income (loss) | $ | 99,857 | $ | 24,012 | $ | (156,967 | ) | ||||
CRITICAL ACCOUNTING POLICIES
Our critical accounting policies are those that will have the most impact on the reporting of our financial condition and results of operations and those requiring significant judgments and estimates. We believe that our judgments and estimates are consistently applied and produce financial information that fairly presents our results of operations. Our most critical accounting policies involve our investments in real property. These policies affect our:
• | allocation of purchase price among various asset categories and the related impact on the recognition of rental income and depreciation and amortization expense; |
• | assessment of the carrying values and impairments of long lived assets; and |
• | classification of leases. |
We allocate the consideration paid for our properties among land, buildings and improvements and, for properties that qualify as acquired businesses under the Business Combinations Topic of The FASB Accounting Standards Codification™, identified intangible assets and liabilities, consisting of the value of above market and below market leases, the value of acquired in place leases and the value of tenant relationships. Purchase price allocations and the determination of useful lives are based on our estimates and, under some circumstances, studies from independent real estate appraisal firms to provide
40
market information and evaluations that are relevant to our purchase price allocations and determinations of useful lives; however, we are ultimately responsible for the purchase price allocations and determination of useful lives.
We allocate the consideration to land, buildings and improvements based on a determination of the fair values of these assets assuming the property is vacant. We determine the fair value of a property using methods that we believe are similar to those used by independent appraisers. Purchase price allocations to above market and below market leases are based on the estimated present value (using an interest rate which reflects our assessment of the risks associated with the leases acquired) of the difference between (1) the contractual amounts to be paid pursuant to the acquired in place leases and (2) our estimate of fair market lease rates for the corresponding leases, measured over a period equal to the remaining non-cancelable terms of the respective leases. Purchase price allocations to acquired in place leases and tenant relationships are determined as the excess of (1) the purchase price paid for a property after adjusting existing acquired in place leases to estimated market rental rates over (2) the estimated fair value of the property as if vacant. We aggregate this value between acquired in place lease values and tenant relationships based on our evaluation of the specific characteristics of each tenant's lease; however, the value of tenant relationships has not been separated from acquired in place lease value for our properties because we believe such value and related amortization expense is immaterial for acquisitions reflected in our historical financial statements. We consider certain factors in performing these analyses including estimates of carrying costs during the expected lease up periods, including real estate taxes, insurance and other operating income and expenses and costs to execute similar leases in current market conditions, such as leasing commissions, legal and other related costs. If we believe the value of tenant relationships is material in the future, those amounts will be separately allocated and amortized over the estimated lives of the relationships. We recognize the excess, if any, of the consideration paid over amounts allocated to land, buildings and improvements and identified intangible assets and liabilities as goodwill and we recognize gains if amounts allocated exceed the consideration paid.
We compute depreciation expense using the straight line method over estimated useful lives of up to 40 years for buildings and improvements and up to 12 years for personal property. We do not depreciate the allocated cost of land. We amortize capitalized above market lease values (presented in our consolidated balance sheets as acquired real estate leases) as a reduction to rental income over the remaining non-cancelable terms of the respective leases. We amortize capitalized below market lease values (presented in our consolidated balance sheets as assumed real estate lease obligations) as an increase to rental income over the remaining terms of the respective leases. We amortize the value of acquired in place leases exclusive of the value of above market and below market in place leases to expense over the remaining non-cancelable periods of the respective leases. If a lease is terminated prior to its stated expiration, all unamortized amounts relating to that lease are written off. Purchase price allocations require us to make certain assumptions and estimates. Incorrect assumptions and estimates may result in inaccurate depreciation and amortization charges over future periods.
We periodically evaluate our properties for possible impairments. Impairment indicators may include declining tenant occupancy, lack of progress releasing vacant space, tenant bankruptcies, low long term prospects for improvement in property performance, weak or declining tenant profitability, cash flow or liquidity, our decision to dispose of an asset before the end of its estimated useful life and legislative, market or industry changes that could permanently reduce the value of a property. If indicators of impairment are present, we evaluate the carrying value of the related property by comparing it to the expected future undiscounted cash flows to be generated from that property. If the sum of these expected future cash flows is less than the carrying value, we reduce the net carrying value of the property to its estimated fair value. This analysis requires us to judge whether indicators of impairment exist and to estimate likely future cash flows. Projections of expected future operating cash flows require that we estimate future market rental revenue amounts subsequent to the expiration of current lease agreements, future property operating expenses, the number of months it takes to re-lease the property, and the number of years the property is held for investment, among other factors. The subjectivity of assumptions used in the future cash flow analysis, including discount rates, could result in an incorrect assessment of the property's fair value and could result in the misstatement of the carrying value of our real estate assets and net income (loss).
Each time we enter a new lease or materially modify an existing lease we evaluate its classification as either a capital or operating lease. The classification of a lease as capital or operating affects the carrying value of a property, as well as our recognition of rental payments as revenue. These evaluations require us to make estimates of, among other things, the remaining useful life and fair market value of a leased property, appropriate discount rates and future cash flows. Incorrect assumptions or estimates may result in misclassification of our leases.
These policies involve significant judgments made based upon experience, including judgments about current valuations, ultimate realizable value, estimated useful lives, salvage or residual value, the ability and willingness of our tenants to perform their obligations to us, current and future economic conditions and competitive factors in the markets in which our properties are located. Competition, economic conditions and other factors may cause occupancy declines in the future. In the future, we may need to revise our carrying value assessments to incorporate information which is not now known, and such revisions
41
could increase or decrease our depreciation expense related to properties we own, result in the classification of our leases as other than operating leases or decrease the carrying values of our assets.
RELATED PERSON TRANSACTIONS
We have engaged in certain related person transactions during the years ended December 31, 2015 and December 31, 2014, both prior to and following our Special Meeting at which our new Board of Trustees was elected. Following the Special Meeting, we entered into transactions with certain of our existing Trustees and executive officers and shareholders owning 5% or more of our common shares, or with persons or entities associated with such persons.
We entered into a one-year license agreement for office space with an entity associated with Mr. Zell, our Chairman, and Mr. Helfand, our President and Chief Executive Officer for approximately $0.2 million for the year. On May 4, 2015 and November 2, 2015, the Audit Committee of the Board of Trustees approved an agreement to extend the term of the license agreement through November 30, 2015 and January 31, 2016, respectively. The license fee payment is approximately $0.1 million for the extended term. The extension of the license agreement was terminated as of December 30, 2015.
We entered into a one-year lease with one three-month renewal option for office space with an entity associated with Mr. Zell for approximately $0.2 million for the initial term, which lease was terminated, effective January 31, 2015. We also entered into a sublease agreement for office space, the landlord of which is an entity associated with Mr. Zell, for approximately $0.2 million for the initial term of approximately seven months. On May 4, 2015 and November 2, 2015, the Audit Committee of the Board of Trustees approved an agreement to extend the term of the sublease through November 30, 2015 and January 31, 2016, respectively. The sublease payment is approximately $0.2 million for the extended term. The extension of the sublease was terminated as of December 30, 2015.
In 2015, we entered into a lease for office space with an entity associated with Mr. Zell, for approximately $0.5 million for the initial year beginning in 2016, and $0.8 million annually thereafter. Effective February 1, 2016, we entered into a lease for storage space with an entity associated with Mr. Zell for a nominal amount.
We believe that the foregoing transactions with our existing Trustees and executive officers are on market terms.
At the Special Meeting our shareholders voted to approve the reimbursement of approximately $33.5 million of expenses incurred by Related Fund Management, LLC and Corvex Management LP, which we refer to together as Related/Corvex, in connection with their consent solicitations to remove our former Trustees and elect the new Board of Trustees and to engage in related litigation. At the time the reimbursement was approved, Related/Corvex, according to them, owned approximately 5.7% in the aggregate of our common shares. Approximately $16.7 million was paid and expensed during the year ended December 31, 2014. Approximately $8.4 million was to be reimbursed only if the average closing price of our common shares was at least $26.00 (as adjusted for any share splits or share dividends) during the one year period after the date on which the reimbursement was approved by shareholders, and the remaining approximately $8.4 million will be reimbursed only if the average closing price of our common shares is at least $26.00 (as adjusted for any share splits or share dividends) during the one year period between the first and second anniversaries of the date on which the reimbursement was approved by shareholders. The average closing price of our common shares was at least $26.00 during the first one year period after the date on which the reimbursement was approved by shareholders, and in August 2015 we paid $8.4 million to Related/Corvex. As these future potential payments represent a “derivative liability”, we expensed approximately $9.0 million during the year ended December 31, 2015. The fair value of this derivative liability on December 31, 2015 was $7.2 million. The total expense of $9.0 million incurred during the year ended December 31, 2015, is included in general and administrative expenses in our consolidated financial statements.
Prior to the election of our new Board of Trustees at the Special Meeting and the appointment of our current executive officers following the Special Meeting on July 31, 2014, we had historical transactions with certain of our former Trustees, former executive officers, RMR, SIR, AIC and other companies to which RMR provides management services and others affiliated with them. Certain of these transactions continued following the Special Meeting.
Effective September 30, 2014, we terminated our business and property management relationships with RMR for our U.S. properties pursuant to a termination and cooperation agreement, which we refer to as the Cooperation Agreement. Pursuant to the Cooperation Agreement, through February 28, 2015, RMR and RMR Australia, which we refer to together as Manager, agreed to use best efforts to assist us in the transition of our management and operations. We paid Manager $1.2 million per month for transition services from October 1, 2014 to February 28, 2015, which included continued management and other services for the Australian assets pursuant to an existing management agreement, or the Australia Management Agreement. Beginning March 1, 2015, we agreed to pay Manager $0.1 million per month until we no longer required such services or until
42
the Australia Management Agreement was terminated, which was terminated in the third quarter of 2015, effective October 31, 2015. The $2.7 million incurred pursuant to the Cooperation Agreement for the year ended December 31, 2015 is included in general and administrative expenses in our consolidated financial statements and is net of certain amounts due from RMR. There is no future obligation to pay any fees to Manager.
For further information about these and other such relationships and related person transactions, see Note 19 to the Notes to Consolidated Financial Statements included in Part IV, Item 15 of this Annual Report on Form 10-K, which is incorporated herein by reference, and the section captioned "Business" above in Part I, Item 1 of this Annual Report on Form 10-K. In addition, for more information about these transactions and relationships and about the risks that may arise as a result of these and other related person transactions and relationships, please see elsewhere in this Annual Report on Form 10-K, including "Forward Looking Statements" and Part I, Item 1A, "Risk Factors." Our filings with the SEC, including our Annual Report and our Information Statements, are available at the SEC’s website at www.sec.gov. Copies of certain of our agreements with these related parties, including our business management agreements and property management agreements with RMR and RMR Australia, various agreements we have entered into with GOV and SIR and the shareholders agreement with AIC and its shareholders, are publicly available as exhibits to our public filings with the SEC and accessible at the SEC’s website.
Item 7A. Quantitative and Qualitative Disclosures About Market Risk.
We are exposed to risks associated with market changes in interest rates.
Interest Rate Risk
We manage our exposure to interest rate risk by monitoring available financing alternatives. Other than as described below, we do not currently foresee any significant changes in our exposure to fluctuations in interest rates or in how we manage this exposure in the near future.
At December 31, 2015, our outstanding fixed rate debt consisted of the following senior unsecured notes and secured mortgage notes (dollars in thousands):
Senior Unsecured Notes:
Debt | Principal Balance(1) | Annual Interest Rate(1) | Annual Interest Expense(1) | Maturity | Interest Payment Due | ||||||||||
6.250% senior unsecured notes due 2016(2) | $ | 139,104 | 6.25 | % | $ | 8,694 | 8/15/2016 | Semi-Annually | |||||||
6.250% senior unsecured notes due 2017 | 250,000 | 6.25 | % | 15,625 | 6/15/2017 | Semi-Annually | |||||||||
6.650% senior unsecured notes due 2018 | 250,000 | 6.65 | % | 16,625 | 1/15/2018 | Semi-Annually | |||||||||
5.875% senior unsecured notes due 2020 | 250,000 | 5.88 | % | 14,688 | 9/15/2020 | Semi-Annually | |||||||||
5.750% senior unsecured notes due 2042 | 175,000 | 5.75 | % | 10,063 | 8/1/2042 | Quarterly | |||||||||
$ | 1,064,104 | $ | 65,695 | ||||||||||||
(1) | The principal balance, annual interest rate and annual interest expense are the amounts stated in the applicable contracts. In accordance with GAAP, our carrying values and recorded interest expense may differ from these amounts because of market conditions and issuance costs at the time we issued these debts. For more information, see Note 9 to the Notes to Consolidated Financial Statements in Part IV, Item 15 of this Annual Report on Form 10-K. |
(2) | On February 16, 2016, we redeemed at par $139.1 million of our 6.25% senior unsecured notes due 2016. |
No principal repayments are due under our senior unsecured notes until maturity.
43
Secured Mortgage Notes:
Debt | Principal Balance(1) | Annual Interest Rate(1) | Annual Interest Expense(1) | Maturity | Interest Payment Due | ||||||||||
Parkshore Plaza | $ | 41,275 | 5.67 | % | $ | 2,373 | 5/1/2017 | Monthly | |||||||
1735 Market Place | 169,612 | 5.66 | % | (2) | 9,650 | 12/2/2019 | Monthly | ||||||||
206 East 9th Street | 27,515 | 5.69 | % | 1,601 | 1/5/2021 | Monthly | |||||||||
33 Stiles Lane | 2,785 | 6.75 | % | 201 | 3/1/2022 | Monthly | |||||||||
97 Newberry Road | 6,375 | 5.71 | % | 378 | 3/1/2026 | Monthly | |||||||||
$ | 247,562 | $ | 14,203 | ||||||||||||
(1) | The principal balance, annual interest rate and annual interest expense are the amounts stated in the applicable contracts. In accordance with GAAP, our carrying values and recorded interest expense may differ from these amounts because of market conditions and issuance costs at the time we assumed or issued these debts. For more information, see Note Note 9 to the Notes to Consolidated Financial Statements in Part IV, Item 15 of this Annual Report on Form 10-K. |
(2) | Interest on this loan is payable at a rate equal to a spread over LIBOR, but the interest rate has been fixed by a cash flow hedge which sets the rate at approximately 5.66% until December 1, 2016. The floating interest rate at December 31, 2015 was 3.05%. |
Some of our secured notes require principal and interest payments through maturity pursuant to amortization schedules, and some of our secured notes require interest only payments through maturity.
Swap Agreements
We have interest rate swap agreements to manage our interest rate risk exposure on $169.6 million of mortgage notes due 2019, which require us to pay interest at a rate equal to a spread over LIBOR. The interest rate swap agreements utilized by us effectively modify our exposure to interest rate risk arising from this floating rate mortgage loan by converting this floating rate debt to a fixed rate through December 1, 2016, thus reducing the impact of interest rate changes on future interest expense. These agreements involve the receipt of floating rate amounts in exchange for fixed rate interest payments over the life of the agreements. Approximately 9.9% ($169.6 million) of our total outstanding debt had interest payments designated as hedged transactions to interest rate swap agreements at December 31, 2015. As of December 31, 2015, the fair value of our derivative instruments included in accounts payable and accrued expenses and cumulative other comprehensive loss in our consolidated balance sheet totaled $3.7 million.
Fixed Rate Debt
Because our fixed rate unsecured and secured notes bear interest at fixed rates, changes in market interest rates during the term of these debts will not affect our interest obligations. If all of these notes were refinanced at interest rates which are 100 basis points higher or lower than shown above, our per annum interest cost would increase or decrease, respectively, by approximately $13.1 million.
Each of our fixed rate unsecured debt arrangements and some of our secured debt arrangements allow us to make repayments earlier than the stated maturity date. In some cases, we are not allowed to make early repayment prior to a cutoff date, and we are generally allowed to make prepayments only at a premium equal to a make whole amount, as defined, which is generally designed to preserve a stated yield to the note holder. Also, we have repurchased and retired some of our outstanding debts and we may do so again in the future. These prepayment rights and our ability to repurchase and retire outstanding debt may afford us opportunities to mitigate the risk of refinancing our debts at maturity at higher rates by refinancing prior to maturity.
Floating Rate Debt
At December 31, 2015, our unhedged floating rate debt consisted of our term loans. Our $200.0 million 5-year term loan matures in January 2020 and our $200.0 million 7-year term loan matures in January 2022. Borrowings under our revolving credit facility and term loan are in U.S. dollars and bear interest at LIBOR plus spreads that are subject to adjustment based upon changes to our credit ratings. Accordingly, we are vulnerable to changes in U.S. dollar based short term rates, specifically
44
LIBOR. In addition, upon renewal or refinancing of our revolving credit facility or term loan, we are vulnerable to increases in interest rate premiums due to market conditions or our perceived credit risk. Generally, a change in market interest rates would not affect the value of these floating rate debts, but would affect our operating results. The following table presents the impact a 100 basis point increase in interest rates would have on our floating rate interest expense as of December 31, 2015 (dollars in thousands):
Impact of Changes in Interest Rates | ||||||||||
Interest Rate Per Year(1) | Outstanding Debt | Total Interest Expense Per Year | ||||||||
Term loans at December 31, 2015 | 1.83%/2.23% | $ | 400,000 | $ | 8,118 | |||||
100 basis point increase | 2.83%/3.23% | $ | 400,000 | $ | 12,118 | |||||
(1) | Based on the interest rates and outstanding borrowings of our floating rate debt as of December 31, 2015. |
Foreign Currency Risk
Prior to the sale of our Australian portfolio, there was a risk that our financial results were affected by changes in currency exchange rates. As a result of the sale of our Australian portfolio, our primary exposure to foreign currency exchange rates subsequent to the June 2015 disposition related to the translation of the cash and cash equivalent balance at our Australian subsidiary from Australian dollars into U.S. dollars.
Item 8. Financial Statements and Supplementary Data.
The information required by Item 8 is included in Item 15 of this Annual Report on Form 10-K.
Item 9. Changes in and Disagreements with Accountants on Accounting and Financial Disclosure.
None.
Item 9A. Controls and Procedures.
Evaluation of Disclosure Controls and Procedures
As of the end of the period covered by this report, our management carried out an evaluation, under the supervision and with the participation of our Chief Executive Officer and Chief Financial Officer, of the effectiveness of our disclosure controls and procedures pursuant to Rules 13a-15 and 15d-15 under the Exchange Act. Based upon that evaluation, our Chief Executive Officer and Chief Financial Officer concluded that our disclosure controls and procedures were effective as of December 31, 2015.
Changes in Internal Control Over Financial Reporting
There have been no changes in our internal control over financial reporting during the quarter ended December 31, 2015, that have materially affected, or are reasonably likely to materially affect, our internal control over financial reporting.
Management Report on Assessment of Internal Control Over Financial Reporting
We are responsible for establishing and maintaining adequate internal control over financial reporting. Our internal control system is designed to provide reasonable assurance to our management and Board of Trustees regarding the preparation and fair presentation of published financial statements. All internal control systems, no matter how well designed, have inherent limitations. Therefore, even those systems determined to be effective can provide only reasonable assurance with respect to financial statement preparation and presentation.
Our management assessed the effectiveness of our internal control over financial reporting as of December 31, 2015. In making this assessment, it used the criteria set forth by the Committee of Sponsoring Organizations of the Treadway Commission (2013 framework) in Internal Control—Integrated Framework. Based on our assessment, we believe that, as of December 31, 2015 our internal control over financial reporting is effective.
45
Ernst & Young LLP, the independent registered public accounting firm that audited our 2015 consolidated financial statements included in this Annual Report on Form 10-K, has issued an attestation report on our internal control over financial reporting. The report appears elsewhere herein.
Item 9B. Other Information.
None.
46
PART III
Item 10. Directors, Executive Officers and Corporate Governance.
Our Code of Business Conduct and Ethics applies to all our representatives, including our officers and Trustees. Our Code of Business Conduct and Ethics is posted on our website, www.eqcre.com. A printed copy of our Code of Business Conduct and Ethics is also available free of charge to any person who requests a copy by writing to our Secretary, Equity Commonwealth, Two North Riverside Plaza, Suite 2100, Chicago, IL 60606. We intend to disclose any amendments or waivers to our Code of Business Conduct and Ethics applicable to our principal executive officer, principal financial officer, principal accounting officer or controller (or any person performing similar functions) on our website.
The remainder of the information required by Item 10 is incorporated by reference to our definitive Proxy Statement.
Item 11. Executive Compensation.
The information required by Item 11 is incorporated by reference to our definitive Proxy Statement.
Item 12. Security Ownership of Certain Beneficial Owners and Management and Related Stockholder Matters.
The information required by Item 12 is incorporated by reference to our definitive Proxy Statement.
Item 13. Certain Relationships and Related Transactions, and Director Independence.
The information required by Item 13 is incorporated by reference to our definitive Proxy Statement.
Item 14. Principal Accountant Fees and Services.
The information required by Item 14 is incorporated by reference to our definitive Proxy Statement.
47
PART IV
Item 15. Exhibits and Financial Statement Schedules.
(a) | Index to Financial Statements and Financial Statement Schedules |
The following consolidated financial statements and financial statement schedules of Equity Commonwealth are included on the pages indicated:
Page | ||
All other schedules for which provision is made in the applicable accounting regulations of the SEC are not required under the related instructions, or are inapplicable, and therefore have been omitted.
(b) Exhibits
Exhibit Number | Description |
3.1 | Articles of Amendment and Restatement of Declaration of Trust of the Company, dated July 1, 1994, as amended to date. (Incorporated by reference to the Company’s Current Report on Form 8-K filed August 1, 2014.) |
3.2 | Articles Supplementary, dated October 10, 2006. (Incorporated by reference to the Company’s Current Report on Form 8-K filed October 11, 2006.) |
3.3 | Articles Supplementary, dated May 31, 2011. (Incorporated by reference to the Company’s Current Report on Form 8-K filed May 31, 2011.) |
3.4 | Second Amended and Restated Bylaws of the Company, adopted July 31, 2014. (Incorporated by reference to the Company’s Current Report on Form 8-K filed August 1, 2014.) |
4.1 | Form of Common Share Certificate. (Incorporated by reference to the Company's Quarterly Report on Form 10-Q for the quarter ended June 30, 2014.) |
4.2 | Form of 61/2% Series D Cumulative Convertible Preferred Share Certificate. (Incorporated by reference to the Company’s Annual Report on Form 10-K for the year ended December 31, 2012.) |
4.3 | Form of 71/4% Series E Cumulative Redeemable Preferred Share Certificate. (Incorporated by reference to the Company’s Annual Report on Form 10-K for the year ended December 31, 2012.) |
48
Exhibit Number | Description |
4.4 | Indenture, dated as of July 9, 1997, between the Company and State Street Bank and Trust Company, as Trustee. (Incorporated by reference to the Company’s Annual Report on Form 10-K for the year ended December 31, 1997, File Number 001-09317.) |
4.5 | Supplemental Indenture No. 14, dated as of August 5, 2004, between the Company and U.S. Bank, relating to the Company’s 6.25% Senior Notes due 2016, including form thereof. (Incorporated by reference to the Company’s Quarterly Report on Form 10-Q for the quarter ended June 30, 2004, File Number 001-09317.) |
4.6 | Supplemental Indenture No. 17, dated as of June 25, 2007, between the Company and U.S. Bank, relating to the Company’s 6.25% Senior Notes due 2017, including form thereof. (Incorporated by reference to the Company’s Quarterly Report on Form 10-Q for the quarter ended June 30, 2007, File Number 001-09317.) |
4.7 | Supplemental Indenture No. 18, dated as of September 18, 2007, between the Company and U.S. Bank, relating to the Company’s 6.65% Senior Notes due 2018, including form thereof. (Incorporated by reference to the Company’s Quarterly Report on Form 10-Q for the quarter ended September 30, 2007, File Number 001-09317.) |
4.8 | Supplemental Indenture No. 20, dated as of September 17, 2010, between the Company and U.S. Bank, relating to the Company’s 5.875% Senior Notes due 2020, including form thereof. (Incorporated by reference to the Company’s Quarterly Report on Form 10-Q for the quarter ended September 30, 2010.) |
4.9 | Supplemental Indenture No. 21, dated as of July 25, 2012, between the Company and U.S. Bank, relating to the Company’s 5.75% Senior Notes due 2042, including form thereof. (Incorporated by reference to the Company’s Registration Statement on Form 8-A dated July 25, 2012.) |
10.1 | Master Sub-Management Agreement, dated as of June 13, 2014, between Equity Commonwealth Management LLC, a wholly owned subsidiary of the Company, and CBRE, Inc. (+) (Incorporated by reference to the Company's Current Report on Form 8-K filed June 17, 2014.) |
10.2 | Termination and Cooperation Agreement, dated September 30, 2014, by and among Equity Commonwealth, Reit Management & Research LLC and RMR Australia Asset Management Pty Limited. (+) (Incorporated by reference to the Company’s Current Report on Form 8-K filed October 1, 2014.) |
10.3 | Equity Commonwealth 2015 Equity Incentive Plan. (Incorporated by reference to the Company's Current Report on Form 8-K filed June 18, 2015.) |
10.4 | Amendment No. 1 to the Equity Commonwealth 2015 Omnibus Incentive Plan. (+) (Filed herewith.) |
10.5 | Form of Restricted Stock Agreement for Employees under Equity Commonwealth 2015 Equity Incentive Plan. (+) (Filed herewith.) |
10.6 | Form of Restricted Stock Unit Agreement for Employees under Equity Commonwealth 2015 Equity Incentive Plan. (+) (Filed herewith.) |
10.7 | Form of Restricted Stock Agreement for Chairman of the Board under Equity Commonwealth 2015 Equity Incentive Plan. (+) (Filed herewith.) |
10.8 | Form of Restricted Stock Unit Agreement for Chairman of the Board under Equity Commonwealth 2015 Equity Incentive Plan. (+) (Filed herewith.) |
10.9 | CommonWealth REIT 2012 Equity Compensation Plan, renamed as the Equity Commonwealth 2012 Equity Compensation Plan. (+) (Incorporated by reference to the Company's Current Report on Form 8-K filed May 11, 2012.) |
10.10 | Amendment No. 1 to CommonWealth REIT 2012 Equity Compensation Plan, renamed as the Equity Commonwealth 2012 Equity Compensation Plan, dated October 28, 2014. (+) (Incorporated by reference to the Registration Statement on Form S-8 filed October 28, 2014.) |
49
Exhibit Number | Description |
10.11 | Form of Restricted Share Agreement. (+) (Incorporated by reference to the Company's Quarterly Report on Form 10-Q for the quarter ended September 30, 2013.) |
10.12 | Form of Restricted Share Agreement for Trustees under Equity Commonwealth 2012 Equity Compensation Plan. (+) (Incorporated by reference to the Company’s Current Report on Form 8-K filed October 31, 2014.) |
10.13 | Form of Restricted Share Agreement for Employees (Special Awards) under Equity Commonwealth 2012 Equity Compensation Plan. (+) (Incorporated by reference to the Company’s Current Report on Form 8-K filed October 31, 2014.) |
10.14 | Form of Restricted Share Unit Agreement for Employees (Special Awards) under Equity Commonwealth 2012 Equity Compensation Plan. (+) (Incorporated by reference to the Company’s Current Report on Form 8-K filed October 31, 2014.) |
10.15 | Zell Restricted Share Agreement under Equity Commonwealth 2012 Equity Compensation Plan. (+) (Incorporated by reference to the Company’s Current Report on Form 8-K filed October 31, 2014.) |
10.16 | Zell Restricted Share Unit Agreement under Equity Commonwealth 2012 Equity Compensation Plan. (+) (Incorporated by reference to the Company’s Current Report on Form 8-K filed October 31, 2014.) |
10.17 | Form of Indemnification Agreement. (+) (Incorporated by reference to the Company’s Annual Report on Form 10-K for the year ended December 31, 2013.) |
10.18 | Summary of Trustee Compensation. (+) (Filed herewith.) |
10.19 | Credit Agreement, dated as of January 29, 2015, among Equity Commonwealth, Wells Fargo Bank, National Association, as administrative agent, and the other financial institutions or entities from time to time party thereto. (Incorporated by reference to the Company’s Current Report on Form 8-K filed February 3, 2015.) |
10.20 | Forbearance Agreement Regarding Term Loan Agreement, by and among the Company, Wells Fargo Bank, National Association, as Administrative Agent, and each of the other financial institutions party thereto, effective as of April 11, 2014. (Incorporated by reference to the Company's Current Report on Form 8-K filed April 14, 2014.) |
10.21 | Fourth Amendment to Term Loan Agreement and Waiver, dated as of June 6, 2014, among the Company, Wells Fargo Bank, National Association, as Administrative Agent, and each of the other financial institutions party thereto. (Incorporated by reference to the Company's Current Report on Form 8-K filed June 12, 2014.) |
10.22 | Stock Purchase Agreement, dated as of July 8, 2014, by and among the Company, Government Properties Income Trust and Reit Management & Research LLC. (Incorporated by reference to the Company’s Current Report on Form 8-K filed July 9, 2014.) |
10.23 | Letter Agreement, dated as of July 23, 2014, by and between the Company and Government Properties Income Trust. (Incorporated by reference to the Company’s Current Report on Form 8-K filed July 23, 2014.) |
12.1 | Computation of Ratio of Earnings to Fixed Charges. (Filed herewith.) |
12.2 | Computation of Ratio of Earnings to Combined Fixed Charges and Preferred Distributions. (Filed herewith.) |
21.1 | Subsidiaries of the Company. (Filed herewith.) |
23.1 | Consent of Ernst & Young LLP. (Filed herewith.) |
31.1 | Rule 13a-14(a) Certification. (Filed herewith.) |
31.2 | Rule 13a-14(a) Certification. (Filed herewith.) |
50
Exhibit Number | Description |
32.1 | Section 1350 Certification. (Furnished herewith.) |
101.1 | The following materials from the Company’s Annual Report on Form 10-K for the year ended December 31, 2015, formatted in XBRL (eXtensible Business Reporting Language): (i) the Consolidated Balance Sheets, (ii) the Consolidated Statements of Operations, (iii) the Consolidated Statements of Comprehensive Income (Loss), (iv) the Consolidated Statements of Shareholders' Equity, (v) the Consolidated Statements of Cash Flows and (vi) related notes to these financial statements, tagged as blocks of text and in detail. (Filed herewith.) |
(+) | Management contract or compensatory plan or arrangement. |
51
Report of Independent Registered Public Accounting Firm
To the Trustees and Shareholders of Equity Commonwealth
We have audited the accompanying consolidated balance sheets of Equity Commonwealth (the "Company") as of December 31, 2015 and 2014, and the related consolidated statements of operations, comprehensive income (loss), shareholders' equity and cash flows for each of the three years in the period ended December 31, 2015. Our audits also included the financial statement schedules listed in the Index at Item 15(a). These financial statements and schedules are the responsibility of the Company's management. Our responsibility is to express an opinion on these financial statements and schedules based on our audits.
We conducted our audits in accordance with the standards of the Public Company Accounting Oversight Board (United States). Those standards require that we plan and perform the audit to obtain reasonable assurance about whether the financial statements are free of material misstatement. An audit includes examining, on a test basis, evidence supporting the amounts and disclosures in the financial statements. An audit also includes assessing the accounting principles used and significant estimates made by management, as well as evaluating the overall financial statement presentation. We believe that our audits provide a reasonable basis for our opinion.
In our opinion, the financial statements referred to above present fairly, in all material respects, the consolidated financial position of Equity Commonwealth at December 31, 2015 and 2014, and the consolidated results of its operations and its cash flows for each of the three years in the period ended December 31, 2015, in conformity with U.S. generally accepted accounting principles. Also, in our opinion, the related financial statement schedules, when considered in relation to the basic financial statements taken as a whole, present fairly in all material respects the information set forth therein.
We also have audited, in accordance with the standards of the Public Company Accounting Oversight Board (United States), Equity Commonwealth's internal control over financial reporting as of December 31, 2015, based on criteria established in Internal Control-Integrated Framework issued by the Committee of Sponsoring Organizations of the Treadway Commission (2013 framework) and our report dated February 18, 2016 expressed an unqualified opinion thereon.
/s/ Ernst & Young LLP | ||
Chicago, Illinois
February 18, 2016
F-1
Report of Independent Registered Public Accounting Firm
To the Trustees and Shareholders of Equity Commonwealth
We have audited Equity Commonwealth's (the "Company") internal control over financial reporting as of December 31, 2015, based on criteria established in Internal Control—Integrated Framework issued by the Committee of Sponsoring Organizations of the Treadway Commission (2013 framework) (the COSO criteria). Equity Commonwealth's management is responsible for maintaining effective internal control over financial reporting, and for its assessment of the effectiveness of internal control over financial reporting included in the accompanying Management Report on Assessment of Internal Control Over Financial Reporting. Our responsibility is to express an opinion on the company's internal control over financial reporting based on our audit.
We conducted our audit in accordance with the standards of the Public Company Accounting Oversight Board (United States). Those standards require that we plan and perform the audit to obtain reasonable assurance about whether effective internal control over financial reporting was maintained in all material respects. Our audit included obtaining an understanding of internal control over financial reporting, assessing the risk that a material weakness exists, testing and evaluating the design and operating effectiveness of internal control based on the assessed risk, and performing such other procedures as we considered necessary in the circumstances. We believe that our audit provides a reasonable basis for our opinion.
A company's internal control over financial reporting is a process designed to provide reasonable assurance regarding the reliability of financial reporting and the preparation of financial statements for external purposes in accordance with generally accepted accounting principles. A company's internal control over financial reporting includes those policies and procedures that (1) pertain to the maintenance of records that, in reasonable detail, accurately and fairly reflect the transactions and dispositions of the assets of the company; (2) provide reasonable assurance that transactions are recorded as necessary to permit preparation of financial statements in accordance with generally accepted accounting principles, and that receipts and expenditures of the company are being made only in accordance with authorizations of management and directors of the company; and (3) provide reasonable assurance regarding prevention or timely detection of unauthorized acquisition, use, or disposition of the company's assets that could have a material effect on the financial statements.
Because of its inherent limitations, internal control over financial reporting may not prevent or detect misstatements. Also, projections of any evaluation of effectiveness to future periods are subject to the risk that controls may become inadequate because of changes in conditions, or that the degree of compliance with the policies or procedures may deteriorate.
In our opinion, Equity Commonwealth maintained, in all material respects, effective internal control over financial reporting as of December 31, 2015, based on the COSO criteria.
We also have audited, in accordance with the standards of the Public Company Accounting Oversight Board (United States), the 2015 consolidated financial statements of Equity Commonwealth and our report dated February 18, 2016 expressed an unqualified opinion thereon.
/s/ Ernst & Young LLP | ||
Chicago, Illinois
February 18, 2016
F-2
EQUITY COMMONWEALTH
CONSOLIDATED BALANCE SHEETS
(amounts in thousands, except share data)
December 31, | |||||||
2015 | 2014 | ||||||
ASSETS | |||||||
Real estate properties: | |||||||
Land | $ | 389,410 | $ | 714,238 | |||
Buildings and improvements | 3,497,942 | 5,014,205 | |||||
3,887,352 | 5,728,443 | ||||||
Accumulated depreciation | (898,939 | ) | (1,030,445 | ) | |||
2,988,413 | 4,697,998 | ||||||
Acquired real estate leases, net | 88,760 | 198,287 | |||||
Cash and cash equivalents | 1,802,729 | 364,516 | |||||
Restricted cash | 32,245 | 32,257 | |||||
Rents receivable, net of allowance for doubtful accounts of $7,715 and $6,565, respectively | 174,676 | 248,101 | |||||
Other assets, net | 157,549 | 220,480 | |||||
Total assets | $ | 5,244,372 | $ | 5,761,639 | |||
LIABILITIES AND SHAREHOLDERS’ EQUITY | |||||||
Senior unsecured debt, net | $ | 1,460,592 | $ | 1,598,416 | |||
Mortgage notes payable, net | 249,732 | 609,249 | |||||
Accounts payable and accrued expenses | 123,587 | 162,204 | |||||
Assumed real estate lease obligations, net | 4,296 | 26,784 | |||||
Rent collected in advance | 27,340 | 31,359 | |||||
Security deposits | 10,338 | 14,044 | |||||
Total liabilities | 1,875,885 | 2,442,056 | |||||
Commitments and contingencies | |||||||
Shareholders’ equity: | |||||||
Preferred shares of beneficial interest, $0.01 par value: 50,000,000 shares authorized; | |||||||
Series D preferred shares; 6 1/2% cumulative convertible; 4,915,196 and 4,915,497 shares issued and outstanding, respectively, aggregate liquidation preference of $122,880 and $122,887, respectively | 119,263 | 119,266 | |||||
Series E preferred shares; 7 1/4% cumulative redeemable on or after May 15, 2016; 11,000,000 shares issued and outstanding, aggregate liquidation preference $275,000 | 265,391 | 265,391 | |||||
Common shares of beneficial interest, $0.01 par value: 350,000,000 shares authorized; 126,349,914 and 129,607,279 shares issued and outstanding, respectively | 1,263 | 1,296 | |||||
Additional paid in capital | 4,414,611 | 4,487,133 | |||||
Cumulative net income | 2,333,709 | 2,233,852 | |||||
Cumulative other comprehensive loss | (3,687 | ) | (53,216 | ) | |||
Cumulative common distributions | (3,111,868 | ) | (3,111,868 | ) | |||
Cumulative preferred distributions | (650,195 | ) | (622,271 | ) | |||
Total shareholders’ equity | 3,368,487 | 3,319,583 | |||||
Total liabilities and shareholders’ equity | $ | 5,244,372 | $ | 5,761,639 | |||
See accompanying notes.
F-3
EQUITY COMMONWEALTH
CONSOLIDATED STATEMENTS OF OPERATIONS
(amounts in thousands, except per share data)
December 31, | |||||||||||
2015 | 2014 | 2013 | |||||||||
Revenues: | |||||||||||
Rental income | $ | 570,382 | $ | 691,699 | $ | 763,262 | |||||
Tenant reimbursements and other income | 144,509 | 170,158 | 189,767 | ||||||||
Total revenues | 714,891 | 861,857 | 953,029 | ||||||||
Expenses: | |||||||||||
Operating expenses | 324,948 | 387,982 | 410,045 | ||||||||
Depreciation and amortization | 194,001 | 227,532 | 234,402 | ||||||||
General and administrative | 57,457 | 113,155 | 80,504 | ||||||||
Loss on asset impairment | 17,162 | 185,067 | 124,253 | ||||||||
Acquisition related costs | — | 5 | 318 | ||||||||
Total expenses | 593,568 | 913,741 | 849,522 | ||||||||
Operating income (loss) | 121,323 | (51,884 | ) | 103,507 | |||||||
Interest and other income | 5,989 | 1,561 | 1,229 | ||||||||
Interest expense (including net amortization of debt discounts, premiums and deferred financing fees of $1,028, $(549), and $9, respectively) | (107,316 | ) | (143,230 | ) | (173,011 | ) | |||||
Gain (loss) on early extinguishment of debt | 6,661 | 4,909 | (60,052 | ) | |||||||
Gain on sale of equity investment | — | 171,561 | 66,293 | ||||||||
Gain on issuance of shares by an equity investee | — | 17,020 | — | ||||||||
Foreign currency exchange loss | (8,857 | ) | — | — | |||||||
Gain on sale of properties | 84,421 | — | 1,596 | ||||||||
Income (loss) from continuing operations before income taxes and equity in earnings of investees | 102,221 | (63 | ) | (60,438 | ) | ||||||
Income tax expense | (2,364 | ) | (3,191 | ) | (2,634 | ) | |||||
Equity in earnings of investees | — | 24,460 | 25,754 | ||||||||
Income (loss) from continuing operations | 99,857 | 21,206 | (37,318 | ) | |||||||
Discontinued operations: | |||||||||||
Income from discontinued operations | — | 8,389 | 6,393 | ||||||||
Loss on asset impairment from discontinued operations | — | (2,238 | ) | (102,869 | ) | ||||||
Loss on early extinguishment of debt from discontinued operations | — | (3,345 | ) | (1,011 | ) | ||||||
Net loss on sale of properties from discontinued operations | — | — | (22,162 | ) | |||||||
Net income (loss) | 99,857 | 24,012 | (156,967 | ) | |||||||
Net income attributable to noncontrolling interest in consolidated subsidiary | — | — | (20,093 | ) | |||||||
Net income (loss) attributable to Equity Commonwealth | 99,857 | 24,012 | (177,060 | ) | |||||||
Preferred distributions | (27,924 | ) | (32,095 | ) | (44,604 | ) | |||||
Excess fair value of consideration over carrying value of preferred shares | — | (16,205 | ) | — | |||||||
Net income (loss) attributable to Equity Commonwealth common shareholders | $ | 71,933 | $ | (24,288 | ) | $ | (221,664 | ) | |||
Amounts attributable to Equity Commonwealth common shareholders: | |||||||||||
Income (loss) from continuing operations | $ | 71,933 | $ | (27,094 | ) | $ | (102,015 | ) | |||
Income from discontinued operations | — | 8,389 | 6,393 | ||||||||
Loss on asset impairment from discontinued operations | — | (2,238 | ) | (102,869 | ) | ||||||
Loss on early extinguishment of debt from discontinued operations | — | (3,345 | ) | (1,011 | ) | ||||||
Net loss on sale of properties from discontinued operations | — | — | (22,162 | ) | |||||||
Net income (loss) | $ | 71,933 | $ | (24,288 | ) | $ | (221,664 | ) | |||
Weighted average common shares outstanding — basic | 128,621 | 125,163 | 112,378 | ||||||||
Weighted average common shares outstanding — diluted | 129,437 | 125,163 | 112,378 | ||||||||
Basic earnings per common share attributable to Equity Commonwealth common shareholders: | |||||||||||
Income (loss) from continuing operations | $ | 0.56 | $ | (0.21 | ) | $ | (0.91 | ) | |||
Income (loss) from discontinued operations | $ | — | $ | 0.02 | $ | (1.06 | ) | ||||
Net income (loss) | $ | 0.56 | $ | (0.19 | ) | $ | (1.97 | ) | |||
Diluted earnings per common share attributable to Equity Commonwealth common shareholders: | |||||||||||
Income (loss) from continuing operations | $ | 0.56 | $ | (0.21 | ) | $ | (0.91 | ) | |||
Income (loss) from discontinued operations | $ | — | $ | 0.02 | $ | (1.06 | ) | ||||
Net income (loss) | $ | 0.56 | $ | (0.19 | ) | $ | (1.97 | ) | |||
F-4
EQUITY COMMONWEALTH
CONSOLIDATED STATEMENTS OF COMPREHENSIVE INCOME (LOSS)
(amounts in thousands)
Year Ended December 31, | |||||||||||
2015 | 2014 | 2013 | |||||||||
Net income (loss) | $ | 99,857 | $ | 24,012 | $ | (156,967 | ) | ||||
Other comprehensive income (loss), net of tax: | |||||||||||
Unrealized gain on derivative instruments and other assets | 612 | 7,407 | 4,918 | ||||||||
Foreign currency translation adjustments | 48,917 | (22,270 | ) | (43,718 | ) | ||||||
Equity in unrealized loss of an investee | — | (22 | ) | (132 | ) | ||||||
Total comprehensive income (loss) | 149,386 | 9,127 | (195,899 | ) | |||||||
Less: comprehensive income attributable to noncontrolling interest in consolidated subsidiary | — | — | (20,057 | ) | |||||||
Comprehensive income (loss) attributable to Equity Commonwealth | $ | 149,386 | $ | 9,127 | $ | (215,956 | ) | ||||
See accompanying notes.
F-5
EQUITY COMMONWEALTH
CONSOLIDATED STATEMENTS OF SHAREHOLDERS' EQUITY
(amounts in thousands, except share data)
Equity Commonwealth Shareholders | ||||||||||||||||||||||||||||||||||||||||||||||||
Preferred Shares | Common Shares | |||||||||||||||||||||||||||||||||||||||||||||||
Series D | Series E | |||||||||||||||||||||||||||||||||||||||||||||||
Number of Shares | Preferred Shares | Number of Shares | Preferred Shares | Cumulative Preferred Distributions | Number of Shares | Common Shares | Cumulative Common Distributions | Additional Paid in Capital | Cumulative Net Income | Cumulative Other Comprehensive Income (Loss) | Noncontrolling Interest in Consolidated Subsidiary | Total | ||||||||||||||||||||||||||||||||||||
Balance at December 31, 2012 | 15,180,000 | $ | 368,270 | 11,000,000 | $ | 265,391 | $ | (529,367 | ) | 83,804,068 | $ | 838 | $ | (2,972,569 | ) | $ | 3,585,400 | $ | 2,386,900 | $ | 565 | $ | 396,040 | $ | 3,501,468 | |||||||||||||||||||||||
Comprehensive income (loss): | ||||||||||||||||||||||||||||||||||||||||||||||||
Net (loss) income | — | — | — | — | — | — | — | — | — | (177,060 | ) | — | 20,093 | (156,967 | ) | |||||||||||||||||||||||||||||||||
Unrealized loss on derivative instrument | — | — | — | — | — | — | — | — | — | — | 4,918 | — | 4,918 | |||||||||||||||||||||||||||||||||||
Foreign currency translation adjustments | — | — | — | — | — | — | — | — | — | — | (43,718 | ) | — | (43,718 | ) | |||||||||||||||||||||||||||||||||
Equity in unrealized income of an investee | — | — | — | — | — | — | — | — | — | — | (96 | ) | (36 | ) | (132 | ) | ||||||||||||||||||||||||||||||||
Total comprehensive loss | (195,899 | ) | ||||||||||||||||||||||||||||||||||||||||||||||
Issuance of shares, net | — | — | — | — | — | 34,500,000 | 345 | — | 626,506 | — | — | (42 | ) | 626,809 | ||||||||||||||||||||||||||||||||||
Share grants | — | — | — | — | — | 82,850 | 1 | — | 1,536 | — | — | 284 | 1,821 | |||||||||||||||||||||||||||||||||||
Adjustments to noncontrolling interest resulting from changes in ownership of a subsidiary | — | — | — | — | — | — | — | — | 32 | — | — | (32 | ) | — | ||||||||||||||||||||||||||||||||||
Distributions | — | — | — | — | (44,604 | ) | — | — | (109,702 | ) | — | — | — | (14,863 | ) | (169,169 | ) | |||||||||||||||||||||||||||||||
Deconsolidation of a subsidiary | — | — | — | — | — | — | — | — | — | — | — | (401,444 | ) | (401,444 | ) | |||||||||||||||||||||||||||||||||
Balance at December 31, 2013 | 15,180,000 | 368,270 | 11,000,000 | 265,391 | (573,971 | ) | 118,386,918 | 1,184 | (3,082,271 | ) | 4,213,474 | 2,209,840 | (38,331 | ) | — | 3,363,586 | ||||||||||||||||||||||||||||||||
Comprehensive income (loss): | ||||||||||||||||||||||||||||||||||||||||||||||||
Net income | — | — | — | — | — | — | — | — | — | 24,012 | — | — | 24,012 | |||||||||||||||||||||||||||||||||||
Unrealized gain on derivative instruments | — | — | — | — | — | — | — | — | — | — | 7,407 | — | 7,407 | |||||||||||||||||||||||||||||||||||
Foreign currency translation adjustments | — | — | — | — | — | — | — | — | — | — | (22,270 | ) | — | (22,270 | ) | |||||||||||||||||||||||||||||||||
Equity in unrealized loss of an investee | — | — | — | — | — | — | — | — | — | — | (22 | ) | — | (22 | ) | |||||||||||||||||||||||||||||||||
Total comprehensive income | 9,127 | |||||||||||||||||||||||||||||||||||||||||||||||
Issuance of shares, net | — | — | — | — | — | 90,135 | — | — | 2,402 | — | — | — | 2,402 | |||||||||||||||||||||||||||||||||||
Redemption of shares | (10,264,503 | ) | (249,004 | ) | — | — | (16,205 | ) | 10,412,499 | 104 | — | 265,105 | — | — | — | — | ||||||||||||||||||||||||||||||||
Share grants | — | — | — | — | — | 717,727 | 8 | — | 6,152 | — | — | — | 6,160 | |||||||||||||||||||||||||||||||||||
Distributions | — | — | — | — | (32,095 | ) | — | — | (29,597 | ) | — | — | — | — | (61,692 | ) | ||||||||||||||||||||||||||||||||
Balance at December 31, 2014 | 4,915,497 | 119,266 | 11,000,000 | 265,391 | (622,271 | ) | 129,607,279 | 1,296 | (3,111,868 | ) | 4,487,133 | 2,233,852 | (53,216 | ) | $ | — | 3,319,583 | |||||||||||||||||||||||||||||||
See accompanying notes.
F-6
EQUITY COMMONWEALTH
CONSOLIDATED STATEMENTS OF SHAREHOLDERS' EQUITY (Continued)
(amounts in thousands, except share data)
Equity Commonwealth Shareholders | ||||||||||||||||||||||||||||||||||||||||||||||||
Preferred Shares | Common Shares | |||||||||||||||||||||||||||||||||||||||||||||||
Series D | Series E | |||||||||||||||||||||||||||||||||||||||||||||||
Number of Shares | Preferred Shares | Number of Shares | Preferred Shares | Cumulative Preferred Distributions | Number of Shares | Common Shares | Cumulative Common Distributions | Additional Paid in Capital | Cumulative Net Income | Cumulative Other Comprehensive Income (Loss) | Noncontrolling Interest in Consolidated Subsidiary | Total | ||||||||||||||||||||||||||||||||||||
Comprehensive income: | ||||||||||||||||||||||||||||||||||||||||||||||||
Net income | — | — | — | — | — | — | — | — | — | 99,857 | — | — | 99,857 | |||||||||||||||||||||||||||||||||||
Unrealized gain on derivative instruments | — | — | — | — | — | — | — | — | — | — | 612 | — | 612 | |||||||||||||||||||||||||||||||||||
Foreign currency translation adjustments | — | — | — | — | — | — | — | — | — | — | 48,917 | — | 48,917 | |||||||||||||||||||||||||||||||||||
Total comprehensive income | 149,386 | |||||||||||||||||||||||||||||||||||||||||||||||
Issuance of shares, net | — | — | — | — | — | — | — | — | — | — | — | — | — | |||||||||||||||||||||||||||||||||||
Purchase of shares | — | — | — | — | — | (3,410,300 | ) | (35 | ) | — | (87,948 | ) | — | — | — | (87,983 | ) | |||||||||||||||||||||||||||||||
Redemption of shares | (301 | ) | (3 | ) | — | — | — | 144 | — | — | 3 | — | — | — | — | |||||||||||||||||||||||||||||||||
Share grants | — | — | — | — | — | 152,791 | 2 | — | 15,423 | — | — | — | 15,425 | |||||||||||||||||||||||||||||||||||
Distributions | — | — | — | — | (27,924 | ) | — | — | — | — | — | — | — | (27,924 | ) | |||||||||||||||||||||||||||||||||
Balance at December 31, 2015 | 4,915,196 | $ | 119,263 | 11,000,000 | $ | 265,391 | $ | (650,195 | ) | 126,349,914 | $ | 1,263 | $ | (3,111,868 | ) | $ | 4,414,611 | $ | 2,333,709 | $ | (3,687 | ) | $ | — | $ | 3,368,487 | ||||||||||||||||||||||
See accompanying notes.
F-7
EQUITY COMMONWEALTH
CONSOLIDATED STATEMENTS OF CASH FLOWS
(amounts in thousands)
Year Ended December 31, | |||||||||||
2015 | 2014 | 2013 | |||||||||
CASH FLOWS FROM OPERATING ACTIVITIES: | |||||||||||
Net income (loss) | $ | 99,857 | $ | 24,012 | $ | (156,967 | ) | ||||
Adjustments to reconcile net income (loss) to cash provided by operating activities: | |||||||||||
Depreciation | 145,888 | 166,076 | 178,353 | ||||||||
Net amortization of debt discounts, premiums and deferred financing fees | 1,028 | (552 | ) | 81 | |||||||
Straight line rental income | (5,255 | ) | (12,759 | ) | (31,229 | ) | |||||
Amortization of acquired real estate leases | 34,277 | 51,140 | 59,274 | ||||||||
Other amortization | 21,309 | 20,931 | 18,850 | ||||||||
Share-based compensation | 15,425 | 5,733 | — | ||||||||
Loss on asset impairment | 17,162 | 187,305 | 227,122 | ||||||||
(Gain) loss on early extinguishment of debt | (6,661 | ) | (1,564 | ) | 61,063 | ||||||
Equity in earnings of investees | — | (24,460 | ) | (25,754 | ) | ||||||
Gain on sale of equity investments | — | (171,561 | ) | (66,293 | ) | ||||||
Gain on issuance of shares by an equity investee | — | (17,020 | ) | — | |||||||
Distributions of earnings from investees | — | 20,680 | 23,911 | ||||||||
Foreign currency exchange loss | 8,857 | — | — | ||||||||
Net (gain) loss on sale of properties | (84,421 | ) | — | 20,566 | |||||||
Other non-cash expenses | — | 2,402 | — | ||||||||
Change in assets and liabilities: | |||||||||||
Restricted cash | (6,570 | ) | 3,486 | (1,832 | ) | ||||||
Rents receivable and other assets | (47,472 | ) | (30,785 | ) | (57,039 | ) | |||||
Accounts payable and accrued expenses | (4,643 | ) | 10,389 | (14,333 | ) | ||||||
Rent collected in advance | (8,462 | ) | (229 | ) | 125 | ||||||
Security deposits | 1,225 | 433 | 611 | ||||||||
Due to related persons | — | (9,277 | ) | (1,858 | ) | ||||||
Cash provided by operating activities | 181,544 | 224,380 | 234,651 | ||||||||
CASH FLOWS FROM INVESTING ACTIVITIES: | |||||||||||
Real estate acquisitions | — | — | (154,370 | ) | |||||||
Real estate improvements | (70,633 | ) | (99,651 | ) | (114,451 | ) | |||||
Principal payments received from direct financing lease | 7,352 | 7,311 | 6,970 | ||||||||
Principal payments received from real estate mortgages receivable | — | — | 1,000 | ||||||||
Proceeds from sale of properties, net | 1,691,831 | 185,299 | 224,976 | ||||||||
Purchase of securities | — | (23,988 | ) | — | |||||||
Proceeds from sale of securities | 27,068 | — | — | ||||||||
Proceeds from sale of equity investments, net | — | 710,492 | 239,576 | ||||||||
Distributions in excess of earnings from investees | — | — | 168 | ||||||||
Increase in restricted cash | (6,725 | ) | (8,225 | ) | (9,102 | ) | |||||
Deconsolidation of a subsidiary | — | — | (12,286 | ) | |||||||
Cash provided by investing activities | 1,648,893 | 771,238 | 182,481 | ||||||||
CASH FLOWS FROM FINANCING ACTIVITIES: | |||||||||||
Proceeds from issuance of common shares, net | — | — | 626,809 | ||||||||
Purchase and retirement of common shares | (87,983 | ) | — | — | |||||||
Repurchase and retirement of outstanding debt securities | — | — | (728,021 | ) | |||||||
Proceeds from borrowings | — | — | 1,036,000 | ||||||||
Payments on borrowings | (259,672 | ) | (785,316 | ) | (1,065,432 | ) | |||||
Deferred financing fees | (7,143 | ) | — | (1,204 | ) | ||||||
Distributions to common shareholders | — | (29,597 | ) | (109,702 | ) | ||||||
Distributions to preferred shareholders | (27,924 | ) | (32,095 | ) | (44,604 | ) | |||||
Distributions to noncontrolling interest in consolidated subsidiary | — | — | (14,863 | ) | |||||||
Cash used in financing activities | (382,722 | ) | (847,008 | ) | (301,017 | ) | |||||
Effect of exchange rate changes on cash | (9,502 | ) | (1,126 | ) | (1,302 | ) | |||||
Increase in cash and cash equivalents | 1,438,213 | 147,484 | 114,813 | ||||||||
Cash and cash equivalents at beginning of period | 364,516 | 217,032 | 102,219 | ||||||||
Cash and cash equivalents at end of period | $ | 1,802,729 | $ | 364,516 | $ | 217,032 | |||||
See accompanying notes.
F-8
EQUITY COMMONWEALTH
CONSOLIDATED STATEMENTS OF CASH FLOWS (Continued)
(amounts in thousands)
Year Ended December 31, | |||||||||||
2015 | 2014 | 2013 | |||||||||
SUPPLEMENTAL CASH FLOW INFORMATION: | |||||||||||
Interest paid | $ | 111,324 | $ | 146,265 | $ | 192,010 | |||||
Taxes paid | 6,028 | 2,732 | 1,303 | ||||||||
NON-CASH INVESTING AND FINANCING ACTIVITIES: | |||||||||||
Investment in real estate mortgage receivable | $ | — | $ | — | $ | (7,688 | ) | ||||
Net assets transferred to Select Income REIT | — | — | 492,736 | ||||||||
(Decrease) increase in capital expenditures recorded as liabilities | (13,528 | ) | 7,690 | (8,475 | ) | ||||||
Mortgage note payable and interest payable transferred in consensual foreclosure | 43,255 | — | — | ||||||||
See accompanying notes.
F-9
Note 1. Organization
Equity Commonwealth is a real estate investment trust, or REIT, formed in 1986 under the laws of the State of Maryland. Our primary business is the ownership and operation of real estate, primarily office buildings, throughout the United States. All number of properties, number of buildings and square feet are unaudited.
At December 31, 2015, our portfolio included the following (square feet in thousands):
Number of Properties | Number of Buildings | Square Feet | ||||||
Total portfolio | 65 | 127 | 23,952 | |||||
From July 2, 2013 through July 9, 2014 we also owned 22,000,000 common shares of Select Income REIT and its consolidated subsidiaries (SIR), and accounted for our investment in SIR under the equity method. On July 9, 2014, we sold our entire stake of 22,000,000 common shares of SIR. SIR was a 100% owned subsidiary of ours until March 12, 2012, on which date SIR completed an initial public offering of 9,200,000 of its common shares (SIR IPO), and became a publicly owned company with shares listed on the New York Stock Exchange (NYSE). On July 2, 2013, SIR issued and sold to the public 10,500,000 of its common shares. Prior to the completion of this offering, our 22,000,000 common shares of SIR represented approximately 56.0% of SIR's outstanding common shares, and SIR was one of our consolidated subsidiaries. Following the completion of this offering, our 22,000,000 common shares of SIR represented approximately 44.2% of SIR's outstanding common shares, and SIR ceased to be our consolidated subsidiary. See Notes 7 and 19 for additional information regarding SIR.
Until March 15, 2013, we also owned 9,950,000, or approximately 18.2%, of the common shares of Government Properties Income Trust (GOV). GOV was our wholly owned subsidiary until its initial public offering in June 2009, when it became a publicly owned company with shares listed on the NYSE. On March 15, 2013, we sold all shares that we owned of GOV. See Notes 7 and 19 for additional information regarding GOV.
Note 2. Summary of Significant Accounting Policies
Basis of Presentation. The consolidated financial statements include our investments in 100% owned subsidiaries and majority owned subsidiaries that are controlled by us. References to we, us, our and the Company, refer to Equity Commonwealth and its consolidated subsidiaries as of December 31, 2015, unless the context indicates otherwise. The portion of a consolidated subsidiary that is not controlled by us, or the noncontrolling interest, is presented as a separate component of equity in our consolidated balance sheets. In addition, net income attributable to the noncontrolling interest is presented separately in our consolidated statements of operations. All intercompany transactions and balances have been eliminated.
We account for our investments in 50% or less owned companies, including our investments in SIR (beginning on July 2, 2013 when SIR ceased to be our consolidated subsidiary through the sale date on July 9, 2014), GOV (until March 15, 2013, when we sold all of our GOV common shares) and Affiliates Insurance Company, or AIC (until May 9, 2014, when we sold all of our AIC shares), over which we can exercise influence, but do not control, using the equity method of accounting. We used the income statement method to account for issuance of common shares of beneficial interest by SIR and GOV, and shares of common stock by AIC. Under this method, gains and losses reflecting changes in the value of our investments at the date of issuance of additional common shares by SIR and GOV, or common stock by AIC, are recognized in our income statement.
Real Estate Properties. We record real estate properties at cost. We depreciate real estate investments on a straight line basis over estimated useful lives of up to 40 years for buildings and improvements, and up to 12 years for personal property.
Each time we enter into a new lease, or materially modify an existing lease, we evaluate its classification as either a capital or operating lease. The classification of a lease as capital or operating affects the carrying value of a property, as well as our recognition of rental payments as revenue. These evaluations require us to make estimates of, among other things, the remaining useful life and fair market value of a leased property, appropriate discount rates and future cash flows.
We allocate the consideration paid for our properties among land, buildings and improvements and, for properties that qualify as acquired businesses under the Business Combinations Topic of the FASB Accounting Standards Codification™, or the Codification, to identified intangible assets and liabilities, consisting of the value of above market and below market leases, the value of acquired in place leases and the value of tenant relationships. Purchase price allocations and the determination of useful lives are based on our estimates and, under some circumstances, studies from independent real estate appraisal firms to
F-10
provide market information and evaluations that are relevant to our purchase price allocations and determinations of useful lives; however, we are ultimately responsible for the purchase price allocations and determination of useful lives.
We allocate the consideration to land, buildings and improvements based on a determination of the fair values of these assets assuming the property is vacant. We determine the fair value of a property using methods that we believe are similar to those used by independent appraisers. Purchase price allocations to above market and below market leases are based on the estimated present value (using an interest rate which reflects our assessment of the risks associated with the leases acquired) of the difference between (1) the contractual amounts to be paid pursuant to the acquired in place leases and (2) our estimate of fair market lease rates for the corresponding leases, measured over a period equal to the remaining non-cancelable terms of the respective leases. Purchase price allocations to acquired in place leases and tenant relationships are determined as the excess of (1) the purchase price paid for a property after adjusting existing in place leases to estimated market rental rates over (2) the estimated fair value of the property as if vacant. We aggregate this value between acquired in place lease values and tenant relationships based on our evaluation of the specific characteristics of each tenant's lease; however, the value of tenant relationships has not been separated from acquired in place lease value for our properties because we believe such value and related amortization expense is immaterial for acquisitions reflected in our historical financial statements. We consider certain factors in performing these analyses including estimates of carrying costs during the expected lease up periods, including real estate taxes, insurance and other operating income and expenses and costs to execute similar leases in current market conditions, such as leasing commissions, legal and other related costs. If we believe the value of tenant relationships is material in the future, those amounts will be separately allocated and amortized over the estimated lives of the relationships. We recognize the excess, if any, of the consideration paid over amounts allocated to land, buildings and improvements and identified intangible assets and liabilities as goodwill and we recognize gains if amounts allocated exceed the consideration paid.
We amortize capitalized above market lease values (presented in our consolidated balance sheets as acquired real estate leases) as a reduction to rental income over the remaining terms of the respective leases. We amortize capitalized below market lease values (presented in our consolidated balance sheets as assumed real estate lease obligations) as an increase to rental income over the remaining terms of the respective leases. We amortize the value of acquired in place leases exclusive of the value of above market and below market acquired in place leases to expense over the remaining terms of the respective leases. If a lease is terminated prior to its stated expiration, the unamortized lease intangibles relating to that lease is written off.
We review our properties for impairment quarterly, or whenever events or changes in circumstances indicate that their carrying amounts may not be recoverable. Impairment indicators may include declining tenant occupancy, lack of progress releasing vacant space, tenant bankruptcies, low long term prospects for improvement in property performance, weak or declining tenant profitability, cash flow or liquidity, our decision to dispose of an asset before the end of its estimated useful life. When indicators of potential impairment are present that suggest that the carrying amounts of real estate assets may not be recoverable, we assess the recoverability of these assets by determining whether the respective carrying values will be recovered through the estimated undiscounted future operating cash flows expected from the use of the assets and their eventual disposition. The determination of undiscounted cash flow includes consideration of many factors including income to be earned from the investment, holding costs (exclusive of interest), estimated selling prices, and prevailing economic and market conditions. In the event that such expected undiscounted future cash flows do not exceed the carrying values, we estimate the fair value of the assets and record an impairment charge equal to the amount by which the carrying value exceeds the estimated fair value. Estimated fair values are calculated based on the following information, (i) recently quoted market prices, (ii) market prices for comparable properties, or (iii) the present value of future cash flows. During the years ended December 31, 2015 and 2014, we recorded a loss on asset impairment in continuing operations totaling $17.2 million and $185.1 million, respectively, to reduce the carrying value of properties to their estimated fair values (see Note 16).
When we classify properties as held for sale, we discontinue the recording of depreciation expense and estimate their fair value less costs to sell. If we determine that the carrying value for these properties exceed their estimated fair value less costs to sell, we record a loss on asset impairment. During the year ended December 31, 2013, we recorded a loss on asset impairment of $79.8 million in discontinued operations and a loss on asset impairment of $124.3 million in continuing operations to reduce the carrying value of 39 properties (93 buildings) classified as held for sale to their estimated fair value less costs to sell. In addition, we recorded losses on asset impairment for properties sold during 2013 totaling $23.1 million.
Certain of our real estate assets contain hazardous substances, including asbestos. We believe any asbestos in our buildings is contained in accordance with current regulations, and we have no current plans to remove any such asbestos. If we remove the asbestos or renovate or demolish these properties, certain environmental regulations govern the manner in which the asbestos must be handled and removed. We do not believe that there are other environmental conditions at any of our properties
F-11
that have a material adverse effect on us. However, no assurances can be given that such conditions are not present in our properties or that other costs we incur to remediate contamination will not have a material adverse effect on our business or financial condition. As of December 31, 2015, we did not have any accrued environmental remediation costs. As of December 31, 2014, accrued environmental remediation costs by us totaling $0.5 million were included in accounts payable and accrued expenses in our consolidated balance sheets.
Cash and Cash Equivalents. Our cash and cash equivalents consists of cash maintained in time deposits, depository accounts and money market accounts. From time-to-time we may also invest in various U.S. government securities. We continually monitor the credit ratings of the financial institutions holding our deposits to minimize our exposure to credit risk. Throughout the year, we have cash balances in excess of federally insured limits deposited with various financial institutions. We do not believe we are exposed to any significant credit risk on cash and cash equivalents.
Restricted Cash. Restricted cash consists of amounts escrowed for future real estate taxes, insurance, leasing costs, capital expenditures and debt service, as required by some of our mortgage debts, as well as security deposits paid to us by some of our tenants.
Other Assets, Net. Other assets consist principally of deferred financing fees, deferred leasing costs, capitalized lease incentives and prepaid property operating expenses. Deferred financing fees include issuance costs related to borrowings and are capitalized and amortized over the terms of the respective loans. Deferred leasing costs include brokerage, legal and other fees associated with the successful negotiation of leases and are amortized on a straight line basis over the terms of the respective leases. Capitalized lease incentives are amortized on a straight line basis against rental income over the terms of the respective leases.
Accounting Policy for Derivative Instruments. The Derivatives and Hedging Topic of the Codification requires companies to recognize all their derivative instruments as either assets or liabilities in the statement of financial position at fair value. The accounting for changes in the fair value of a derivative instrument depends on whether such instrument has been designated and qualifies as part of a hedging relationship and, further, on the type of hedging relationship. For those derivative instruments that are designated and qualify as hedging instruments, we must designate the hedging instrument, based upon the exposure being hedged, as a fair value hedge, cash flow hedge or a hedge of a net investment in a foreign operation. In December 2009, we entered into interest rate swap agreements that qualify as cash flow hedges.
We are exposed to certain risks relating to our ongoing business operations. The primary risk managed by using derivative instruments is interest rate risk. Interest rate swaps are entered into to manage interest rate risk associated with our floating rate borrowings. We designate interest rate swaps as cash flow hedges of floating rate borrowings.
Revenue Recognition. Rental income from operating leases, which includes rent concessions (including free rent and other lease incentives) and scheduled increases in rental rates during the lease term, is recognized on a straight line basis over the life of the lease agreements. We defer the recognition of contingent rental income, such as percentage rents, until the specific targets that trigger the contingent rental income are achieved. Tenant reimbursements and other income includes property level operating expenses reimbursed by our tenants, as well as other incidental revenues, which are recorded as expenses are incurred.
Allowance for Doubtful Accounts. We maintain an allowance for doubtful accounts for estimated losses resulting from the inability or unwillingness of certain tenants to make payments required under their leases. The computation of the allowance is based on the tenants' payment histories and current credit profiles, as well as other considerations.
Share-Based Compensation. All share-based compensation is measured at fair value on the grant date or date of modification, as applicable, and recognized in earnings over the requisite service period. Depending upon the settlement terms of the awards, all or a portion of the fair value of share-based awards may be presented as a liability or as equity in the consolidated balance sheets.
Earnings Per Common Share. Earnings per common share, or EPS, is computed using the weighted average number of common shares outstanding during the period. Diluted EPS reflects the potential dilution that could occur if our series D convertible preferred shares or our restricted share units (RSUs) were converted into our common shares, which could result in a lower EPS amount. The effect of our series D convertible preferred shares on income from continuing operations and net income attributable to common shareholders is anti-dilutive for all periods presented.
Reclassifications. Reclassifications have been made to the prior years' financial statements and notes to conform to the current year's presentation.
F-12
Income Taxes. We are a REIT under the Internal Revenue Code of 1986, as amended, and are generally not subject to federal and state income taxes provided we distribute our taxable income to our shareholders and meet other requirements for qualifying as a real estate investment trust. However, we are subject to certain state and local taxes without regard to our REIT status.
The Income Taxes Topic of the Codification prescribes how we should recognize, measure and present in our financial statements uncertain tax positions that have been taken or are expected to be taken in a tax return. Deferred tax assets are recognized to the extent that it is "more likely than not" that a particular tax position will be sustained upon examination or audit. To the extent the "more likely than not" standard has been satisfied, the benefit associated with a tax position is measured as the largest amount that has a greater than 50% likelihood of being realized upon settlement. We classify interest and penalties related to uncertain tax positions, if any, in our financial statements as a component of general and administrative expense.
Use of Estimates. Preparation of these financial statements in conformity with U.S. generally accepted accounting principles, or GAAP, requires us to make estimates and assumptions that may affect the amounts reported in these financial statements and related notes. The actual results could differ from these estimates.
Foreign Operations. During the year ended December 31, 2015, we sold our Australian properties (Note 4) and as of December 31, 2015, we do not have any foreign operations. The U.S. dollar was the functional currency for our consolidated subsidiaries operating in the United States prior to the sale of the Australian portfolio. The functional currency for our consolidated subsidiaries in countries other than the United States was the principal currency in which the entity's assets, liabilities, income and expenses were denominated. The functional currency of our consolidated subsidiary that operated in Australia was the Australian dollar. We translated our Australian subsidiary's financial statements into U.S. dollars when we consolidated that subsidiary's financial statements on a quarterly basis. Generally, we translated assets and liabilities at the exchange rate in effect as of the balance sheet date. The resulting translation adjustments were included in cumulative other comprehensive loss in our consolidated balance sheets. We translated income statement accounts using the average exchange rate for the period and income statement accounts that include significant non-recurring transactions at the rate in effect as of the date of the transaction. We were subject to foreign currency risk due to potential fluctuations in exchange rates between Australian and U.S. currencies.
Subsequent to the disposition of the Australian properties, we recognized a foreign currency exchange loss of $8.9 million in our consolidated statement of operations for the year ended December 31, 2015. The foreign currency exchange loss for the year ended December 31, 2015 relates to the change in foreign currency rates resulting in losses on cash proceeds from the Australian portfolio disposition maintained in an Australian bank account prior to the transfer of cash from our Australian subsidiary to our U.S bank accounts. As of December 31, 2015, we did not have any cumulative foreign currency translation adjustments as the cumulative foreign currency translation adjustment of $63.2 million was reclassified from other comprehensive loss to earnings upon disposition of the Australian properties. As of December 31, 2014, cumulative foreign currency translation adjustments were $(48.9) million.
New Accounting Pronouncements. In April 2014, the Financial Accounting Standards Board (FASB) issued Accounting Standards Update (ASU) No. 2014-08, Presentation of Financial Statements (Topic 205) and Property, Plant, and Equipment (Topic 360): Reporting Discontinued Operations and Disclosures of Disposals of Components of an Entity, or ASU 2014-08. ASU 2014-08 changes the criteria for reporting a discontinued operation. Under the new pronouncement, a disposal of a part of an organization that has a major effect on its operations and financial results is a discontinued operation. We adopted ASU 2014-08 on January 1, 2015, and determined that our 2015 dispositions do not individually represent a strategic shift, as defined by the standard, that has or will have a major effect on our operations and financial results. As a result, the 2015 dispositions have not been presented as discontinued operations in the 2015 statements of operations.
In May 2014, the FASB issued ASU No. 2014-09, Revenue from Contracts with Customers, which provides guidance for revenue recognition. This update is effective for interim and annual reporting periods beginning after December 15, 2017. We are currently in the process of evaluating the impact, if any, the adoption of this ASU will have on our consolidated financial statements.
In April 2015, the FASB issued ASU No. 2015-03, Simplifying the Presentation of Debt Issuance Costs. This standard amends existing guidance to require the presentation of debt issuance costs in the balance sheet as a deduction from the carrying amount of the related debt liability instead of as a deferred charge. It is effective for annual reporting periods beginning after December 15, 2015, but early adoption is permitted. We do not expect that the adoption of this standard will have a material impact on our consolidated financial statements.
F-13
Note 3. Board of Trustees
On March 18, 2014, Related Fund Management, LLC (Related) and Corvex Management LP (Corvex) together, (Related/Corvex), delivered written consents which they represented were from a sufficient number of holders of our outstanding common shares to remove all of our then Trustees (former Trustees) and any other person or persons elected or appointed to our Board of Trustees prior to the effective time of the Related/Corvex removal proposal. After inspection, our then Board of Trustees determined that holders of more than two-thirds of our outstanding common shares as of the February 18, 2014, record date consented to the Related/Corvex proposal, reaching the threshold required to remove all of our then Trustees and any other person or persons appointed as a Trustee prior to the effective time of the Related/Corvex removal proposal. Accordingly, on March 25, 2014, all of our former Trustees certified their removal as Trustees of EQC.
On May 23, 2014, at a special meeting of our shareholders (Special Meeting), the following seven individuals were elected to serve on our Board of Trustees: Sam Zell, who serves as the Chairman of the new Board of Trustees, James S. Corl, Edward A. Glickman, David A. Helfand, Peter Linneman, James L. Lozier, Jr. and Kenneth Shea. Each of the foregoing individuals was nominated to serve on the new Board of Trustees by Related/Corvex. On July 31, 2014, our shareholders re-elected the seven individuals listed above and elected Martin L. Edelman, Mary Jane Robertson, Gerald A. Spector and James A. Star to serve on our Board of Trustees, bringing our total number of Trustees to eleven (new Board of Trustees). At the 2015 annual meeting of shareholders held on June 16, 2015, our shareholders re-elected each of our eleven Trustees to serve on our Board of Trustees for the 2015-2016 term.
Note 4. Real Estate Properties
The information presented in this Note 4 excludes information related to SIR and its consolidated subsidiaries, unless the context indicates otherwise.
We did not make any acquisitions during the years ended December 31, 2015, or 2014.
During the years ended December 31, 2015, 2014, and 2013, we made improvements, excluding tenant-funded improvements, to our properties totaling $75.7 million, $91.6 million and $122.9 million, respectively. Improvements made during the year ended December 31, 2013, include improvements made by SIR to its properties for the period that SIR was our consolidated subsidiary until July 2, 2013.
We committed $156.4 million for expenditures related to 4,900,000 square feet of leases executed during 2015. Committed but unspent tenant related obligations, including leasing commissions and tenant improvements, based on existing leases as of December 31, 2015, were $118.9 million.
Properties Held For Sale:
We classify all properties that meet the criteria outlined in the Property, Plant and Equipment Topic of the FASB Accounting Standards Codification (Codification) as held for sale on our consolidated balance sheets. During March 2014, the former management team ceased to actively market 31 properties (67 buildings) with a combined 5,641,450 square feet that we had previously classified as held for sale as of December 31, 2013. These properties were not under agreement for sale when our former Trustees were removed in March 2014. These properties were reclassified to properties held and used in operations because they no longer met the requirements under GAAP for classification as held for sale. Operating results for these properties were reclassified from discontinued operations to continuing operations for all periods presented herein. In connection with this reclassification, we reversed previously recorded impairment losses totaling $4.8 million, which included the elimination of estimated costs to sell. As of December 31, 2015, and 2014, we had no properties classified as held for sale.
F-14
Property Dispositions:
During the year ended December 31, 2015, we disposed of the following properties (dollars in thousands):
Asset | Date Disposed | Number of Properties | Number of Buildings | Square Footage | Gross Sales Price | Gain (Loss) on Sale | |||||||||||||
Properties | |||||||||||||||||||
11350 North Meridian Street | January 2015 | 1 | 1 | 72,264 | $ | 4,200 | $ | 766 | |||||||||||
333 Laurel Oak Drive(1) | March 2015 | — | 1 | 27,164 | 2,450 | 251 | |||||||||||||
1921 E. Alton Avenue | March 2015 | 1 | 1 | 67,846 | 14,533 | 4,851 | |||||||||||||
46 Inverness Center Parkway | April 2015 | — | — | — | 2,000 | 1,857 | |||||||||||||
225 Water Street(2) | May 2015 | 1 | 1 | 318,997 | — | — | |||||||||||||
Sorrento Valley Business Park | June 2015 | 1 | 4 | 105,003 | 23,500 | 11,896 | |||||||||||||
Illinois Center | August 2015 | 1 | 2 | 2,090,162 | 376,000 | 26,956 | |||||||||||||
16th and Race Street | August 2015 | 1 | 1 | 608,625 | 43,000 | 7,922 | |||||||||||||
185 Asylum Street | September 2015 | 1 | 1 | 868,395 | 113,250 | 17,619 | |||||||||||||
One South Church Avenue | October 2015 | 1 | 1 | 240,811 | 32,000 | 4,282 | |||||||||||||
775 Ridge Lake Boulevard | October 2015 | 1 | 1 | 120,678 | 16,300 | (360 | ) | ||||||||||||
One Park Square | October 2015 | 1 | 6 | 259,737 | 34,300 | 9,512 | |||||||||||||
Arizona Center | December 2015 | 1 | 4 | 1,070,724 | 126,000 | 22,838 | |||||||||||||
4 South 84th Avenue | December 2015 | 1 | 1 | 236,007 | 18,000 | 8,393 | |||||||||||||
Portfolio of properties | |||||||||||||||||||
7450 Campus Drive | May 2015 | 1 | 1 | 77,411 | |||||||||||||||
129 Worthington Ridge Road | May 2015 | 1 | 1 | 227,500 | |||||||||||||||
599 Research Parkway | May 2015 | 1 | 1 | 48,249 | |||||||||||||||
181 Marsh Hill Road | May 2015 | 1 | 1 | 162,036 | |||||||||||||||
101 Barnes Road | May 2015 | 1 | 1 | 45,755 | |||||||||||||||
15 Sterling Drive | May 2015 | 1 | 1 | 173,015 | |||||||||||||||
35 Thorpe Avenue | May 2015 | 1 | 1 | 79,862 | |||||||||||||||
50 Barnes Industrial Road North | May 2015 | 1 | 1 | 154,255 | |||||||||||||||
5-9 Barnes Industrial Road | May 2015 | 1 | 1 | 38,006 | |||||||||||||||
860 North Main Street | May 2015 | 1 | 1 | 31,165 | |||||||||||||||
One Barnes Industrial Road South | May 2015 | 1 | 1 | 30,170 | |||||||||||||||
Village Lane | May 2015 | 1 | 2 | 58,185 | |||||||||||||||
100 Northfield Drive | May 2015 | 1 | 1 | 116,986 | |||||||||||||||
905 Meridian Lake Drive | May 2015 | 1 | 1 | 74,652 | |||||||||||||||
1717 Deerfield Road | May 2015 | 1 | 1 | 141,186 | |||||||||||||||
1955 West Field Court | May 2015 | 1 | 1 | 59,130 | |||||||||||||||
5015 S. Water Circle | May 2015 | 1 | 1 | 113,524 | |||||||||||||||
Adams Place | May 2015 | 1 | 2 | 230,259 | |||||||||||||||
Cabot Business Park | May 2015 | 1 | 2 | 252,755 | |||||||||||||||
2300 Crown Colony Drive | May 2015 | 1 | 1 | 45,974 | |||||||||||||||
Myles Standish Industrial Park | May 2015 | 1 | 2 | 74,800 | |||||||||||||||
340 Thompson Road | May 2015 | 1 | 1 | 25,000 | |||||||||||||||
100 South Charles Street | May 2015 | 1 | 1 | 159,616 | |||||||||||||||
6710 Oxon Hill | May 2015 | 1 | 1 | 118,336 | |||||||||||||||
8800 Queen Avenue South | May 2015 | 1 | 1 | 280,822 | |||||||||||||||
F-15
Asset | Date Disposed | Number of Properties | Number of Buildings | Square Footage | Gross Sales Price | Gain (Loss) on Sale | |||||||||||||
9800 Sherlard Parkway | May 2015 | 1 | 1 | 46,765 | |||||||||||||||
Rosedale Corporate Plaza | May 2015 | 1 | 3 | 149,116 | |||||||||||||||
1000 Shelard Parkway | May 2015 | 1 | 1 | 62,499 | |||||||||||||||
525 Park Street | May 2015 | 1 | 1 | 75,636 | |||||||||||||||
1900 Meyer Drury Drive | May 2015 | 1 | 1 | 65,225 | |||||||||||||||
131-165 West Ninth Street | May 2015 | 1 | 1 | 75,517 | |||||||||||||||
7-9 Vreeland Road | May 2015 | 1 | 1 | 155,891 | |||||||||||||||
5 Paragon Drive | May 2015 | 1 | 1 | 119,089 | |||||||||||||||
1000 Voorhees Drive and 400 Laurel Oak Drive(1) | May 2015 | 1 | 2 | 125,415 | |||||||||||||||
1601 Veterans Highway | May 2015 | 1 | 1 | 63,608 | |||||||||||||||
Two Corporate Center Drive | May 2015 | 1 | 1 | 291,230 | |||||||||||||||
11311 Cornell Park Drive | May 2015 | 1 | 1 | 93,413 | |||||||||||||||
5300 Kings Island Drive | May 2015 | 1 | 1 | 159,421 | |||||||||||||||
3 Crown Point Court | May 2015 | 1 | 1 | 73,987 | |||||||||||||||
515 Pennsylvania Avenue | May 2015 | 1 | 1 | 82,000 | |||||||||||||||
443 Gulph Road | May 2015 | 1 | 1 | 21,000 | |||||||||||||||
4350 Northern Pike | May 2015 | 1 | 1 | 503,885 | |||||||||||||||
Thunderbolt Place | May 2015 | 1 | 2 | 100,505 | |||||||||||||||
6160 Kempsville Circle | May 2015 | 1 | 1 | 129,565 | |||||||||||||||
448 Viking Drive | May 2015 | 1 | 1 | 75,374 | |||||||||||||||
Portfolio of small office and industrial assets | 45 | 53 | 5,287,790 | $ | 376,000 | $ | (8,160 | ) | |||||||||||
2501 20th Place South | June 2015 | 1 | 1 | 125,722 | |||||||||||||||
420 20th Street North | June 2015 | 1 | 1 | 514,893 | |||||||||||||||
Inverness Center | June 2015 | 1 | 4 | 475,882 | |||||||||||||||
701 Poydras Street | June 2015 | 1 | 1 | 1,256,971 | |||||||||||||||
300 North Greene Street | June 2015 | 1 | 1 | 324,305 | |||||||||||||||
1320 Main Street | June 2015 | 1 | 1 | 334,075 | |||||||||||||||
AL, LA, NC, SC office portfolio | 6 | 9 | 3,031,848 | $ | 417,450 | $ | 41,596 | ||||||||||||
12655 Olive Boulevard | June 2015 | 1 | 1 | 98,588 | |||||||||||||||
1285 Fern Ridge Parkway | June 2015 | 1 | 1 | 66,510 | |||||||||||||||
St. Louis portfolio(3) | 2 | 2 | 165,098 | $ | 14,300 | $ | (2,349 | ) | |||||||||||
310-314 Invermay Road(4) | April 2015 | 1 | 1 | 47,480 | |||||||||||||||
253-293 George Town Road(4) | April 2015 | 1 | 1 | 143,914 | |||||||||||||||
7 Modal Crescent | June 2015 | 1 | 1 | 164,160 | |||||||||||||||
71-93 Whiteside Road | June 2015 | 1 | 1 | 303,488 | |||||||||||||||
9-13 Titanium Court | June 2015 | 1 | 1 | 69,664 | |||||||||||||||
16 Rodborough Road | June 2015 | 1 | 1 | 90,525 | |||||||||||||||
22 Rodborough Road | June 2015 | 1 | 1 | 43,427 | |||||||||||||||
127-161 Cherry Lane | June 2015 | 1 | 1 | 278,570 | |||||||||||||||
310-320 Pitt Street | June 2015 | 1 | 1 | 313,865 | |||||||||||||||
F-16
Asset | Date Disposed | Number of Properties | Number of Buildings | Square Footage | Gross Sales Price | Gain (Loss) on Sale | |||||||||||||
44-46 Mandarin Street | June 2015 | 1 | 1 | 226,718 | |||||||||||||||
19 Leadership Way | June 2015 | 1 | 1 | 76,714 | |||||||||||||||
Australia portfolio(5) | 11 | 11 | 1,758,525 | $ | 232,955 | $ | (47,872 | ) | |||||||||||
Widewaters Parkway | August 2015 | 1 | 8 | 514,241 | |||||||||||||||
5062 Brittonfield Parkway | August 2015 | 1 | 1 | 40,162 | |||||||||||||||
Woodcliff Drive | August 2015 | 1 | 6 | 516,760 | |||||||||||||||
Interstate Place | August 2015 | 1 | 2 | 61,399 | |||||||||||||||
1000 Pittsford - Victor Road | August 2015 | 1 | 1 | 73,358 | |||||||||||||||
1200 Pittsford - Victor Road | August 2015 | 1 | 1 | 18,900 | |||||||||||||||
Corporate Crossing | August 2015 | 1 | 5 | 216,126 | |||||||||||||||
Canal View Boulevard | August 2015 | 1 | 3 | 118,375 | |||||||||||||||
14 Classic Street | August 2015 | 1 | 1 | 37,084 | |||||||||||||||
110 W Fayette Street | August 2015 | 1 | 1 | 304,906 | |||||||||||||||
251 Salina Meadows Parkway | August 2015 | 1 | 1 | 65,617 | |||||||||||||||
Upstate New York portfolio(3) | 11 | 30 | 1,966,928 | $ | 104,625 | $ | (12,518 | ) | |||||||||||
9040 Roswell Road | October 2015 | 1 | 1 | 178,941 | |||||||||||||||
The Exchange | October 2015 | 1 | 2 | 187,632 | |||||||||||||||
3920 Arkwright Road | October 2015 | 1 | 1 | 196,156 | |||||||||||||||
1775 West Oak Commons Court | October 2015 | 1 | 1 | 79,854 | |||||||||||||||
Georgia portfolio(3) | 4 | 5 | 642,583 | $ | 48,550 | $ | (3,059 | ) | |||||||||||
91 | 135 | 18,939,185 | $ | 1,999,413 | $ | 84,421 | |||||||||||||
(1) | This property contains three buildings. We sold one building in March 2015 and two buildings in May 2015. |
(2) | Title to this property was transferred to the lender pursuant to a consensual foreclosure in full satisfaction of the mortgage debt with a principal balance of $40.1 million, resulting in a gain on early extinguishment of debt of $17.3 million for the year ended December 31, 2015. See Note 9 for additional information. |
(3) | Prior to the disposition of these properties, we recorded a total impairment charge of $17.2 million during the year ended December 31, 2015, based upon updated market information in accordance with our impairment analysis procedures. |
(4) | These properties were sold in a separate transaction to a different buyer than other Australian properties. |
(5) | The loss on sale includes a $63.2 million cumulative foreign currency translation adjustment reclassified from cumulative other comprehensive loss due to the disposition of the Australian portfolio. |
F-17
During the years ended December 31, 2014 and 2013, we sold the following properties (dollars in thousands):
Date Sold | Number of Properties | Number of Buildings | Square Footage | Sales Price | Gain (Loss) on Sale | ||||||||||||
Sales of properties resulting in gains and losses | |||||||||||||||||
December 2013 | 3 | 40 | 1,670,104 | $ | 89,000 | $ | (25,521 | ) | |||||||||
June 2013(6) | — | — | — | 2,551 | 1,765 | ||||||||||||
June 2013 | 1 | 1 | 30,105 | 1,600 | 317 | ||||||||||||
March 2013(6) | — | — | — | 1,806 | 1,596 | ||||||||||||
January 2013(7) | 3 | 18 | 1,060,026 | 10,250 | 1,277 | ||||||||||||
7 | 59 | 2,760,235 | $ | 105,207 | $ | (20,566 | ) | ||||||||||
Sales of properties with previously recorded asset impairment losses: | |||||||||||||||||
June 2014(8) | 14 | 43 | 2,784,098 | $ | 215,900 | ||||||||||||
December 2013 | 2 | 2 | 77,394 | $ | 2,020 | ||||||||||||
November 2013 | 18 | 21 | 2,125,278 | 50,500 | |||||||||||||
October 2013 | 1 | 2 | 199,418 | 4,000 | |||||||||||||
October 2013 | 1 | 1 | 665,545 | 13,900 | |||||||||||||
October 2013 | 9 | 41 | 1,211,536 | 43,000 | |||||||||||||
August 2013 | 1 | 3 | 129,452 | 4,100 | |||||||||||||
June 2013 | 1 | 1 | 143,802 | 5,250 | |||||||||||||
June 2013 | 1 | 2 | 356,045 | 16,300 | |||||||||||||
May 2013 | 1 | 1 | 57,250 | 4,025 | |||||||||||||
April 2013 | 1 | 1 | 618,000 | 830 | |||||||||||||
36 | 75 | 5,583,720 | $ | 143,925 | |||||||||||||
(6) We sold a land parcel.
(7) We provided mortgage financing to the buyer, an unrelated third party, totaling $7.7 million at 6.0% per annum (Note 8).
(8) In connection with this transaction, we recognized a loss on asset impairment of $2.2 million and a loss on early extinguishment of debt of $3.3 million for the year ended December 31, 2014. The sales price excludes mortgage debt repayments. These properties are included in income from discontinued operations for all years presented.
F-18
Results of operations for properties sold prior to December 31, 2014, are included in discontinued operations in our consolidated statements of operations. Summarized income statement information for properties included in discontinued operations is as follows (in thousands):
Year Ended December 31, | |||||||
2014 | 2013 | ||||||
Rental income | $ | 14,243 | $ | 55,073 | |||
Tenant reimbursements and other income | 1,900 | 6,842 | |||||
Total revenues | 16,143 | 61,915 | |||||
Operating expenses | 7,138 | 37,027 | |||||
Depreciation and amortization | — | 12,550 | |||||
General and administrative | 10 | 4,268 | |||||
Total expenses | 7,148 | 53,845 | |||||
Operating income | 8,995 | 8,070 | |||||
Interest and other income | 2 | 65 | |||||
Interest expense | (608 | ) | (1,742 | ) | |||
Income from discontinued operations | $ | 8,389 | $ | 6,393 | |||
Lease Payments
Our real estate properties are generally leased on gross lease, modified gross lease or triple net lease bases pursuant to non-cancelable, fixed term operating leases expiring between 2016 and 2033. Our triple net leases generally require the lessee to pay all property operating costs. Our gross leases and modified gross leases require us to pay all or some property operating expenses and to provide all or some property management services. A portion of these property operating expenses are reimbursed by the tenants.
The future minimum lease payments, excluding tenant reimbursement revenue, scheduled to be received by us during the current terms of our leases as of December 31, 2015 are as follows (in thousands):
2016 | $ | 400,987 | |
2017 | 380,501 | ||
2018 | 353,286 | ||
2019 | 313,563 | ||
2020 | 275,406 | ||
Thereafter | 1,175,661 | ||
$ | 2,899,404 | ||
One of our real estate properties, 111 River Street in Hoboken, New Jersey, is subject to a ground lease. The land on this property is leased pursuant to a non-cancelable, fixed term operating ground lease that expires in 2098.
The future minimum lease payments scheduled to be paid by us during the current terms of this ground lease under which we are the lessee, as of December 31, 2015, are as follows (in thousands):
2016 | $ | 1,477 | |
2017 | 1,477 | ||
2018 | 1,483 | ||
2019 | 1,503 | ||
2020 | 1,503 | ||
Thereafter | 128,491 | ||
$ | 135,934 | ||
The amount of ground lease expense included in operating expenses during the years ended December 31, 2015, 2014 and 2013, totaled $1.8 million, $1.8 million and $1.9 million, respectively. Ground lease expense includes percentage rent.
F-19
Note 5. Lease Intangibles
The following table summarizes the carrying amounts for our acquired real estate leases and assumed real estate lease obligations as of December 31, 2015, and 2014, and (in thousands):
December 31, | ||||||||
2015 | 2014 | |||||||
Acquired in-place leases | $ | 147,056 | $ | 272,077 | ||||
Acquired above market leases | 78,210 | 121,969 | ||||||
Acquired real estate leases | 225,266 | 394,046 | ||||||
Accumulated amortization, acquired in-place leases | (91,301 | ) | (136,089 | ) | ||||
Accumulated amortization, acquired above market leases | (45,205 | ) | (59,670 | ) | ||||
Acquired real estate leases, net | $ | 88,760 | $ | 198,287 | ||||
Acquired below market leases | 19,742 | 56,541 | ||||||
Accumulated amortization | (15,446 | ) | (29,757 | ) | ||||
Assumed real estate lease obligations, net | $ | 4,296 | $ | 26,784 | ||||
Amortization of the lease intangibles for the years ended December 31, 2015, 2014, and 2013, is as follows (in thousands):
December 31, | ||||||||||||||
Income Statement Location | 2015 | 2014 | 2013 | |||||||||||
Amortization of acquired in-place leases | Depreciation and amortization | $ | 26,787 | $ | 40,493 | $ | 48,023 | |||||||
Amortization of acquired in-place leases | Discontinued operations | — | — | 1,720 | ||||||||||
Amortization of above and below market leases | Increase (decrease) to rental income | (7,515 | ) | (10,650 | ) | (10,310 | ) | |||||||
Amortization of above and below market leases | Discontinued operations | — | — | 775 | ||||||||||
Future amortization of net intangible lease assets and liabilities to be recognized by us during the current terms of our leases as of December 31, 2015, are approximately (in thousands):
2016 | $ | 18,054 | ||
2017 | 15,213 | |||
2018 | 12,619 | |||
2019 | 8,778 | |||
2020 | 7,535 | |||
Thereafter | 22,265 | |||
$ | 84,464 | |||
Note 6. Investment in Direct Financing Lease
We had an investment in a direct financing lease that related to a lease with a term that exceeded 75% of the useful life of an office tower located within a mixed use property in Phoenix, AZ. In December 2015, we sold this property. Prior to the sale of the property, we recognized income using the effective interest method to produce a level yield on funds not yet recovered. The carrying amount of our net investment of $12.5 million as of December 31, 2014, is included in other assets in our consolidated balance sheets.
We monitored the payment history and credit profile of the tenant and have determined that no allowance for losses related to our direct financing lease was necessary at December 31, 2014.
F-20
Note 7. Equity Investments
At December 31, 2015, and 2014, we did not have any ownership interests in equity investments. For the years ended December 31, 2014, and 2013, equity in earnings is as follows (in thousands):
Year Ended December 31, | |||||||
2014 | 2013 | ||||||
SIR | $ | 24,516 | $ | 21,153 | |||
GOV | — | 4,111 | |||||
AIC | (56 | ) | 490 | ||||
$ | 24,460 | $ | 25,754 | ||||
Investment in SIR
SIR was one of our consolidated subsidiaries until July 2, 2013 and was an unconsolidated equity investment from July 2, 2013 until July 9, 2014. On July 9, 2014, we sold our entire stake of 22,000,000 common shares of SIR. We received $704.8 million in cash representing $32.04 per share and recognized a gain on sale of equity investment of $171.8 million in our consolidated statement of operations. Proceeds from this sale were used to repay our revolving credit facility and certain mortgage loans (Note 9). As a result of this sale, we no longer hold any interest in SIR.
During the second quarter of 2014, SIR issued 10,000,000 common shares in a public offering for $29.00 per common share, raising net proceeds (after deducting underwriters’ discounts and commissions and expenses) of approximately $277.4 million. We recognized a gain on this sale by an equity investee of $16.9 million as a result of the per share sales price of this transaction being above our per share carrying value. Our ownership percentage in SIR was reduced to 36.7% as a result of the transaction.
On July 2, 2013, SIR issued and sold to the public 10,500,000 of its common shares for $28.25 per common share. Prior to the completion of this offering, our 22,000,000 common shares of SIR represented approximately 56.0% of SIR's outstanding common shares, and SIR was one of our consolidated subsidiaries. Following the completion of this offering, our 22,000,000 common shares of SIR represented approximately 44.2% of SIR's outstanding common shares and SIR ceased to be our consolidated subsidiary.
Accordingly, after the completion of this offering on July 2, 2013, we no longer consolidated our investment in SIR, but instead accounted for this investment under the equity method. Under the equity method, we recorded our percentage share of net earnings of SIR in our consolidated statements of operations. Prior to July 2, 2013, the operating results and investments of SIR were included in our consolidated results of operations and financial position. On July 2, 2013, our share of the underlying equity of SIR exceeded our carrying value by $17.6 million. As required under GAAP, we amortized this difference to equity in earnings of investees over a 34 year period, which approximates the average remaining useful lives of the buildings owned by SIR as of July 2, 2013. See Notes 1 and 19 for additional information regarding SIR.
For the period from January 1, 2014, through July 9, 2014, we received cash distributions from SIR totaling $20.7 million.
For the period from July 2, 2013, through December 31, 2013, we received cash distributions from SIR totaling $19.8 million.
F-21
The following unaudited summarized income statement information of SIR for the period from January 1, 2014, through July 9, 2014, and for the year ended December 31, 2013, is as follows (in thousands, except per share data):
For the Period from January 1, 2014 through July 9, 2014 | Year Ended December 31, 2013 | ||||||
Rental income | 98,226 | $ | 159,011 | ||||
Tenant reimbursements and other income | 16,980 | 29,312 | |||||
Total revenues | 115,206 | 188,323 | |||||
Operating expenses | 20,982 | 36,382 | |||||
Depreciation and amortization | 20,832 | 31,091 | |||||
Acquisition related costs | 374 | 2,002 | |||||
General and administrative | 7,731 | 12,423 | |||||
Total expenses | 49,919 | 81,898 | |||||
Operating income | 65,287 | 106,425 | |||||
Interest expense | (7,287 | ) | (13,763 | ) | |||
Gain on early extinguishment of debt | 243 | — | |||||
Income before income tax expense and equity in earnings of an investee | 58,243 | 92,662 | |||||
Income tax expense | (90 | ) | 96 | ||||
Equity in earnings of an investee | 32 | 334 | |||||
Net income | $ | 58,185 | $ | 93,092 | |||
Weighted average common shares outstanding | 52,394 | 44,565 | |||||
Net income per common share | $ | 1.11 | $ | 2.09 | |||
Investment in GOV
On March 15, 2013, we sold all 9,950,000 common shares that we owned of GOV in a public offering for $25.20 per common share, raising gross proceeds of $250.7 million ($239.6 million after deducting underwriters' discounts and commissions and expenses). We recognized a gain on this sale of an equity investment of $66.3 million as a result of the per share sales price of this transaction being above our per share carrying value. GOV was our wholly owned subsidiary until its initial public offering in June 2009 when it became a separate public entity.
During the year ended December 31, 2013, we received cash distributions from GOV totaling $4.3 million. We no longer own any interest in GOV.
Investment in AIC
As of May 9, 2014, we had a net investment of $5.8 million in AIC, an insurance company that was owned in equal proportion by us, our former manager Reit Management & Research LLC (RMR), SIR and five other companies to which RMR provides management services. On May 9, 2014, as a result of the removal of the former Trustees and in accordance with the terms of the shareholder agreement between us and the other AIC shareholders, the other AIC shareholders exercised their right to purchase all of the 20,000 shares of AIC we then owned. We received $5.8 million in aggregate proceeds from this sale. We no longer own any interest in AIC.
Our participation in the AIC property insurance program expired in June 2014. See Note 19 for additional information about our investment in AIC.
F-22
Note 8. Other Assets
Real Estate Mortgages Receivable
As of December 31, 2015, and 2014, we had total real estate mortgages receivable with an aggregate carrying value of $8.1 million included in other assets in our consolidated balance sheets. We provided mortgage financing totaling $7.7 million at 6.0% per annum in connection with our sale of three properties (18 buildings) in January 2013 in Dearborn, MI; this real estate mortgage requires monthly interest payments and matures on January 24, 2023. We also provided mortgage financing totaling $0.4 million at 6.0% per annum in connection with our sale of a property in Salina, NY in April 2012. This real estate mortgage requires monthly interest payments and matures on April 30, 2019. In addition, in September 2013, another buyer of a property we sold prepaid to us in full a $1.0 million real estate mortgage that was scheduled to mature on July 1, 2017.
We monitor the payment history of the borrowers and have determined that no allowance for losses related to these real estate mortgages receivable were necessary at December 31, 2015, and 2014.
Deferred Financing Fees, Deferred Leasing Costs and Capitalized Lease Incentives
The following table summarizes our deferred financing fees, deferred leasing costs and capitalized lease incentives as of December 31, 2015, and 2014 (in thousands):
December 31, | |||||||
2015 | 2014 | ||||||
Deferred financing fees | $ | 43,346 | $ | 41,339 | |||
Accumulated amortization | (25,158 | ) | (24,478 | ) | |||
Deferred financing fees, net | $ | 18,188 | $ | 16,861 | |||
Deferred leasing costs | $ | 166,390 | $ | 184,600 | |||
Accumulated amortization | (56,162 | ) | (58,348 | ) | |||
Deferred leasing costs, net | $ | 110,228 | $ | 126,252 | |||
Capitalized lease incentives | $ | 11,623 | $ | 22,650 | |||
Accumulated amortization | (2,498 | ) | (7,459 | ) | |||
Capitalized lease incentives, net | $ | 9,125 | $ | 15,191 | |||
Future amortization of deferred leasing costs and capitalized lease incentives to be recognized by us during the current terms of our leases as of December 31, 2015 are approximately (in thousands):
Deferred Leasing Costs | Capitalized Lease Incentives | ||||||
2016 | $ | 15,933 | $ | 1,528 | |||
2017 | 14,870 | 1,477 | |||||
2018 | 13,369 | 779 | |||||
2019 | 12,246 | 704 | |||||
2020 | 10,324 | 608 | |||||
Thereafter | 43,486 | 4,029 | |||||
$ | 110,228 | $ | 9,125 | ||||
F-23
Note 9. Indebtedness
At December 31, 2015 and 2014, our outstanding indebtedness included the following (in thousands):
December 31, | |||||||||||||
Interest Rate at December 31, 2015 | Maturity Date | 2015 | 2014 | ||||||||||
Unsecured revolving credit facility, at LIBOR plus a premium | 1.68 | % | 1/28/2019 | $ | — | $ | — | ||||||
5-year unsecured term loan, at LIBOR plus a premium | 1.83 | % | 1/28/2020 | 200,000 | — | ||||||||
7-year unsecured term loan, at LIBOR plus a premium | 2.23 | % | 1/28/2022 | 200,000 | — | ||||||||
Unsecured term loan, at LIBOR plus a premium | — | % | — | — | 400,000 | ||||||||
Unsecured floating rate debt | 2.03 | % | (1) | $ | 400,000 | $ | 400,000 | ||||||
5.75% Senior Unsecured Notes due 2015 | — | % | — | $ | — | $ | 138,773 | ||||||
6.25% Senior Unsecured Notes due 2016 | 6.25 | % | 8/15/2016 | 139,104 | 139,104 | ||||||||
6.25% Senior Unsecured Notes due 2017 | 6.25 | % | 6/15/2017 | 250,000 | 250,000 | ||||||||
6.65% Senior Unsecured Notes due 2018 | 6.65 | % | 1/15/2018 | 250,000 | 250,000 | ||||||||
5.875% Senior Unsecured Notes due 2020 | 5.88 | % | 9/15/2020 | 250,000 | 250,000 | ||||||||
5.75% Senior Unsecured Notes due 2042 | 5.75 | % | 8/1/2042 | 175,000 | 175,000 | ||||||||
Unsecured fixed rate debt | 6.17 | % | (1) | $ | 1,064,104 | $ | 1,202,877 | ||||||
111 Monument Circle | — | % | — | $ | — | $ | 116,000 | ||||||
225 Water Street | — | % | — | — | 40,059 | ||||||||
111 East Wacker Drive | — | % | — | — | 142,666 | ||||||||
2501 20th Place South | — | % | — | — | 10,267 | ||||||||
Parkshore Plaza | 5.67 | % | 5/1/2017 | 41,275 | 41,275 | ||||||||
1735 Market Street(2) | 5.66 | % | 12/2/2019 | 169,612 | 171,498 | ||||||||
206 East 9th Street | 5.69 | % | 1/5/2021 | 27,515 | 27,965 | ||||||||
1320 Main Street | — | % | — | — | 38,979 | ||||||||
33 Stiles Lane | 6.75 | % | 3/1/2022 | 2,785 | 3,132 | ||||||||
97 Newberry Road | 5.71 | % | 3/1/2026 | 6,375 | 6,819 | ||||||||
Secured fixed rate debt | 5.68 | % | (1) | $ | 247,562 | $ | 598,660 | ||||||
$ | 1,711,666 | $ | 2,201,537 | ||||||||||
Unamortized net premiums and discounts | (1,342 | ) | 6,128 | ||||||||||
$ | 1,710,324 | $ | 2,207,665 | ||||||||||
(1) | Represents weighted average interest rate at December 31, 2015. |
(2) | Interest on this loan is payable at LIBOR plus 2.625% but has been fixed for the first seven years to December 1, 2016 by a cash flow hedge which sets the rate at approximately 5.66%. |
Unsecured Revolving Credit Facility and Term Loan:
Prior to January 29, 2015, we had a $750.0 million unsecured revolving credit facility. The unsecured revolving credit facility was set to mature on October 19, 2015, and had an interest rate of LIBOR plus a spread, which was 150 basis points as of December 31, 2014. We paid a facility fee of 35 basis points per annum on the total amount of lending commitments under our revolving credit facility. Prior to January 29, 2015, we also had a $500.0 million unsecured term loan that was set to mature on December 15, 2016. Our term loan had an interest rate of LIBOR plus a spread, which was 185 basis points as of December
F-24
31, 2014. On December 5, 2014, we paid $100.0 million of our unsecured term loan, reducing our term loan borrowings to $400.0 million.
On January 29, 2015, we entered into a new credit agreement, pursuant to which the lenders agreed to provide (i) a $750.0 million unsecured revolving credit facility, (ii) a $200.0 million 5-year term loan facility and (iii) a $200.0 million 7-year term loan facility. The new agreement replaced our prior credit agreement, dated as of August 9, 2010, and our prior term loan agreement, dated as of December 16, 2010. In connection with the new agreement, we recognized a loss on early extinguishment of debt of $0.4 million from the write-off of unamortized deferred financing fees for the year ended December 31, 2015. The revolving credit facility has a scheduled maturity date of January 28, 2019, which maturity date may be extended for up to two additional periods of six months at our option subject to satisfaction of certain conditions and the payment of an extension fee of 0.075% of the aggregate amount available under the revolving credit facility. The 5-year term loan and the 7-year term loan have scheduled maturity dates of January 28, 2020 and January 28, 2022, respectively. We used the proceeds of borrowings under the credit agreement to repay all amounts outstanding and due under the previous term loan agreement.
The credit agreement permits us to utilize up to $100.0 million of the revolving credit facility for the issuance of letters of credit. Amounts outstanding under the credit agreement generally may be prepaid at any time without premium or penalty, subject to certain exceptions. We have the right to request increases in the aggregate maximum amount of borrowings available under the revolving credit facility and term loans up to an additional $1.15 billion, subject to certain conditions.
Borrowings under the 5-year term loan and 7-year term loan will, subject to certain exceptions, bear interest at a LIBOR rate plus a margin of 90 to 180 basis points for the 5-year term loan and 140 to 235 basis points for the 7-year term loan, in each case depending on our credit rating. Borrowings under the revolving credit facility will, subject to certain exceptions, bear interest at a rate equal to, at our option, either a LIBOR rate or a base rate plus a margin of 87.5 to 155 basis points for LIBOR rate advances and 0 to 55 basis points for base rate advances, in each case depending on our credit rating. In addition, we are required to pay a facility fee of 12.5 to 30 basis points, depending on our credit rating, on the borrowings available under the revolving credit facility, whether or not utilized.
Borrowings under our revolving credit facility currently bear interest at LIBOR plus a spread, which was 125 basis points as of December 31, 2015. As of December 31, 2015, the interest rate payable on borrowings under our revolving credit facility was 1.68%. As of December 31, 2015, we had no balance outstanding and $750.0 million available under our revolving credit facility. Our term loans currently bear interest at a rate of LIBOR plus a spread, which was 140 and 180 basis points for the 5-year and 7-year term loan, respectively, as of December 31, 2015. As of December 31, 2015, the interest rates for the amounts outstanding under our 5-year term loan and 7-year term loan were 1.83% and 2.23%, respectively. As of December 31, 2015, we had $200.0 million outstanding under each of our 5-year and 7-year term loans.
Debt Covenants:
Our public debt indenture and related supplements, our revolving credit facility agreement and our term loan agreement contain a number of financial and other covenants, including covenants that restrict our ability to incur indebtedness or to make distributions under certain circumstances and require us to maintain financial ratios and a minimum net worth. At December 31, 2015, we believe we were in compliance with all of our respective covenants under our public debt indenture and related supplements, our revolving credit facility and our term loan agreements.
Senior Unsecured Notes:
On May 1, 2015, we redeemed at par $138.8 million of our 5.75% senior unsecured notes due 2015 and recognized a loss on early extinguishment of debt of $0.1 million from the write-off of an unamortized discount and unamortized deferred financing fees.
On November 17, 2014, we redeemed at par $125.0 million of our 7.50% unsecured senior notes due 2019 and recognized a loss on early extinguishment of debt of $1.8 million from the write-off of an unamortized discount and deferred financing fees.
On September 15, 2014, we redeemed at par $33.4 million of our 6.40% unsecured senior notes due 2015.
F-25
In March 2013, we purchased a total of $670.3 million of the outstanding principal amount of senior notes for $726.2 million, excluding transaction costs, pursuant to a tender offer. In connection with the purchase of these senior notes, we recognized a combined loss on early extinguishment of debt totaling $60.0 million, which includes the write-off of unamortized discounts and deferred financing fees and expenses.
Mortgage Notes Payable:
At December 31, 2015, five of our properties (8 buildings) with an aggregate net book value of $287.5 million had secured mortgage notes totaling $249.7 million (including net premiums and discounts) maturing from 2017 through 2026.
On December 1, 2015, we repaid at par $116.0 million of 5.24% mortgage debt at 111 Monument Circle and recognized a gain on early extinguishment of debt of $0.6 million for the year ended December 31, 2015 from the write-off of an unamortized premium, net of the write-off of unamortized deferred financing fees.
In accordance with the agreement to sell Illinois Center, we were required to deliver the property unencumbered. On August 3, 2015, prior to the sale, we defeased the outstanding $141.4 million balance of the mortgage loan secured by 111 East Wacker Drive, one of the buildings included in Illinois Center. The defeasance costs and write off of the unamortized deferred financing costs, net of the write off of the unamortized premium, resulted in a net loss on early extinguishment of debt of $3.9 million for the year ended December 31, 2015.
In accordance with the agreement to sell 2501 20th Place South, we were required to deliver the property unencumbered. On June 5, 2015, we prepaid $10.0 million of 7.36% mortgage debt at 2501 20th Place South and recognized a loss on early extinguishment of debt totaling $0.6 million for the year ended December 31, 2015, which consisted of a prepayment premium and the write off of unamortized deferred financing fees, net of the write off of an unamortized premium.
In accordance with the agreement to sell 1320 Main Street, we were required to deliver the property unencumbered. On June 3, 2015, prior to the sale, we defeased the $38.7 million outstanding balance of the mortgage loan secured by 1320 Main Street. The defeasance costs and write off of the unamortized deferred financing costs, net of the write off of the unamortized premium, resulted in a net loss on early extinguishment of debt of $6.2 million for the year ended December 31, 2015.
During the quarter ended June 30, 2014, we made the decision to cease making loan servicing payments on 225 Water Street in Jacksonville, Florida. The first payment we determined not to make for this property was due on June 11, 2014. The property was secured by a non-recourse mortgage loan. On October 10, 2014, we were notified by the lender that our decision to cease making loan servicing payments created an event of default effective July 11, 2014, and the lender exercised its option to accelerate the maturity of the unpaid balance of the loan. Beginning July 11, 2014, we accrued interest on this loan at 10.03%, to include the 4.0% of default interest. The lender filed a suit of foreclosure for this property and we cooperated with the lender to allow for a consensual foreclosure process. On May 22, 2015, title to 225 Water Street was transferred to the lender pursuant to the consensual foreclosure in full satisfaction of the mortgage debt, with a principal balance of $40.1 million. The transaction resulted in a gain on early extinguishment of debt of $17.3 million for the excess of the debt principal balance over the net book value of the property for the year ended December 31, 2015.
On October 31, 2014, we repaid at par the $7.8 million mortgage loan encumbering 6200 Glenn Carlson Drive.
On August 1, 2014, we prepaid at par the $265.0 million of 5.68% mortgage debt at 600 West Chicago Avenue and recognized a net gain on early extinguishment of debt of $6.7 million from the write-off of an unamortized premium, net of the write-off of unamortized deferred financing fees.
On June 27, 2014, we repaid $11.2 million of 6.14% mortgage debt and $8.5 million of 5.78% mortgage debt in connection with the sale of the related properties and recognized a loss on early extinguishment of debt of $3.3 million, included in loss on early extinguishment of debt from discontinued operations, from prepayment penalties and the write-off of unamortized discounts and deferred financing fees.
On March 11, 2014, we prepaid at par the $12.0 million of 4.95% mortgage debt at 3920 Arkwright Road.
F-26
Required Principal Payments:
The required principal payments due during the next five years and thereafter under all of our outstanding debt at December 31, 2015 are as follows (in thousands):
2016 | $ | 142,450 | |
2017 | 294,865 | ||
2018 | 253,847 | ||
2019 | 164,613 | ||
2020 | 451,674 | ||
Thereafter | 404,217 | ||
$ | 1,711,666 | ||
Note 10. Shareholders’ Equity
Common Share Issuances:
During the year ended December 31, 2015, we issued 144 common shares to holders of 301 of our series D cumulative convertible preferred shares (series D preferred shares) who elected to convert their series D preferred shares into our common shares.
During the year ended December 31, 2014, we issued 10,412,499 common shares to holders of 10,264,503 of our series D preferred shares who converted their series D preferred shares into our common shares.
During the year ended December 31, 2014, we issued 90,135 common shares to RMR pursuant to the amended and restated business management agreement. See Note 19 for further information regarding this agreement.
See Note 14 for information regarding equity issuances related to share-based compensation.
Common Share Repurchases:
On August 24, 2015, our Board of Trustees approved a common share repurchase plan, which authorizes the repurchase of up to $100.0 million of our outstanding common shares over the twelve month period following the date of authorization. On September 14, 2015, our Board of Trustees authorized the repurchase of up to an additional $100.0 million of our outstanding common shares over the twelve month period following the date of authorization. During the year ended December 31, 2015, we purchased and retired 3,410,300 of our common shares at a weighted average price of $25.76 per share.
Common Share Distributions:
In January 2014, we declared a distribution of $0.25 per common share, or $29.6 million, which we paid on February 21, 2014 to shareholders of record on January 13, 2014. Our revolving credit facility agreement and term loan agreement contain a number of financial and other covenants, including a covenant which restricts our ability to make distributions under certain circumstances. See Note 9 for additional information regarding our revolving credit facility agreement and term loan agreement.
F-27
The following characterizes distributions paid per common share for the years ended December 31, 2015, 2014, and 2013:
Year Ended December 31, | ||||||||
2015 | 2014 | 2013 | ||||||
Ordinary income | — | % | — | % | — | % | ||
Return of capital | — | % | — | % | 100.00 | % | ||
Capital gain | — | % | 100.00 | % | — | % | ||
Unrecaptured Section 1250 gain | — | % | — | % | — | % | ||
— | % | 100.00 | % | 100.00 | % | |||
Series D Preferred Shares:
Each of our 4,915,196 series D cumulative convertible preferred shares accrue dividends of $1.625, or 6.50% per annum of the liquidation amount, payable in equal quarterly payments. Our series D preferred shares are convertible, at the holder's option, into our common shares at an initial conversion rate of 0.480775 common shares per series D preferred share, which is equivalent to an initial conversion price of $52.00 per common share, or 2,363,103 additional common shares at December 31, 2015. On or after November 20, 2011, if our common shares trade at or above the then applicable conversion price, we may, at our option, convert some or all of the series D preferred shares into common shares at the then applicable conversion rate. If a fundamental change occurs, which generally will be deemed to occur upon a change in control of us or a termination of trading of our common shares (or other equity securities into which our series D preferred shares are then convertible), holders of our series D preferred shares will have a special right to convert their series D preferred shares into a number of our common shares per $25.00 liquidation preference, plus accrued and unpaid distributions, divided by 98% of the average closing market price of our common shares for a specified period before such event is effective, unless we exercise our right to repurchase these series D preferred shares for cash, at a purchase price equal to 100% of their liquidation preference, plus accrued and unpaid distributions. The issuance of a large number of common shares as a result of the exercise of this conversion right after a fundamental change may have a dilutive effect on income from continuing operations attributable to Equity Commonwealth common shareholders per share for future periods.
The removal of our former Trustees on March 25, 2014, triggered a Fundamental Change Conversion Right of the series D preferred shares, as defined in our Articles Supplementary dated October 10, 2006, setting forth the terms of the series D preferred shares. Pursuant to such right, the holders of series D preferred shares had the option to elect to convert all or any portion of their series D preferred shares at any time from April 9, 2014 until the close of business on May 14, 2014 into a number of common shares per $25.00 liquidation preference of the series D preferred shares equal to the sum of such $25.00 liquidation preference plus accrued and unpaid dividends to, but not including, May 14, 2014, divided by 98% of the average of the closing sale prices of the common shares for the five consecutive trading days ending on May 9, 2014, or the Fundamental Change Conversion Rate. Holders of 10,263,003 series D preferred shares elected to exercise their Fundamental Change Conversion Right and converted their series D preferred shares into 10,411,779 of our common shares. As a result of this transaction, we recognized a non-cash preferred distribution of $16.2 million, for the excess of the market value of the common shares issued above the carrying value of the series D preferred shares redeemed. As of December 31, 2015, we had 4,915,196 outstanding series D preferred shares that were convertible into 2,363,103 of our common shares.
Series E Preferred Shares:
Each of our 11,000,000 series E preferred shares has a liquidation preference of $25.00 and requires dividends of $1.8125, or 7.25% per annum of the liquidation amount, payable in equal quarterly payments. The series E preferred shares are redeemable at our option for $25.00 each plus accrued and unpaid distributions at any time on or after May 15, 2016 or if a change of control occurs which results in our common shares (or the common securities of an acquiring or surviving entity) not being listed or quoted on the NYSE or certain other exchanges or quotation systems. Also, upon the occurrence of such a change of control, holders of series E preferred shares that we do not elect to redeem may at their option convert those series E preferred shares into our common shares (or certain alternative consideration) at a conversion rate generally based on their $25.00 liquidation preference per share, plus accrued and unpaid distributions, and the market price of our common shares at the time of conversion, subject to a cap.
F-28
Preferred Share Distributions:
In 2015, our Board of Trustees declared distributions on our series D preferred shares and series E cumulative redeemable preferred shares to date as follows:
Declaration Date | Record Date | Payment Date | Series D Dividend Per Share | Series E Dividend Per Share | ||||||||
January 16, 2015 | February 2, 2015 | February 17, 2015 | $ | 0.40625 | $ | 0.453125 | ||||||
April 8, 2015 | May 1, 2015 | May 15, 2015 | $ | 0.40625 | $ | 0.453125 | ||||||
July 9, 2015 | July 31, 2015 | August 17, 2015 | $ | 0.40625 | $ | 0.453125 | ||||||
October 9, 2015 | November 2, 2015 | November 16, 2015 | $ | 0.40625 | $ | 0.453125 | ||||||
Under our governing documents and Maryland law, distributions to our shareholders are to be authorized and declared by our Board of Trustees. Additionally, the removal of our former Trustees, which occurred on March 25, 2014, constituted an event of default under our term loan and revolving credit facility agreements, under which we generally are prevented from making any distributions or paying any dividends during the pendency of an event of default. As a result of the foregoing, we were unable to declare and pay dividends between March 25, 2014, and June 6, 2014, the date on which we obtained waivers of the aforementioned events of default from our lenders.
Alternative Minimum Tax:
Alternative minimum tax adjustments are to be apportioned between a REIT and its shareholders under Internal Revenue Code Section 59(d). Although regulations have not yet been issued under that provision, based on regulations issued pursuant to a similar provision of prior law and the legislative history of the current provision, it appears that such alternative minimum tax adjustments are to be apportioned to a REIT’s shareholders to the extent that the REIT distributes its regular taxable income. It is our policy to distribute all of our regular taxable income and accordingly, all of our alternative minimum tax adjustments are being apportioned to our shareholders.
We have determined that 0%, 15.41% and 0% of each distribution to our shareholders for the tax years ended December 31, 2015, 2014, and 2013, respectively, consists of an alternative minimum tax adjustment.
Note 11. Cumulative Other Comprehensive Loss
The following tables present the amounts recognized in cumulative other comprehensive loss by component for the year ended December 31, 2015 (in thousands):
Year Ended December 31, 2015 | |||||||||||
Unrealized Loss on Derivative Instruments and Other Assets | Foreign Currency Translation Adjustments | Total | |||||||||
Balances as of January 1, 2015 | $ | (4,299 | ) | $ | (48,917 | ) | $ | (53,216 | ) | ||
Other comprehensive loss before reclassifications | (1,232 | ) | (14,290 | ) | (15,522 | ) | |||||
Amounts reclassified from cumulative other comprehensive loss to net income | 1,844 | 63,207 | 65,051 | ||||||||
Net current period other comprehensive income | 612 | 48,917 | 49,529 | ||||||||
Balances as of December 31, 2015 | $ | (3,687 | ) | $ | — | $ | (3,687 | ) | |||
F-29
The following tables present reclassifications out of cumulative other comprehensive loss for the year ended December 31, 2015 (in thousands):
Year Ended December 31, 2015 | |||||
Details about Cumulative Other Comprehensive Loss Components | Amounts Reclassified from Cumulative Other Comprehensive Loss to Net Income | Affected Line Items in the Statement of Operations | |||
Interest rate swap contracts | $ | 4,924 | Interest expense | ||
Foreign currency translation adjustment activity | 63,207 | Gain on sale of properties | |||
Realized gain on available for sale securities | (3,080 | ) | Interest and other income | ||
$ | 65,051 | ||||
Note 12. Income Taxes
Our provision for income taxes consists of the following (in thousands):
Year Ended December 31, | |||||||||||
2015 | 2014 | 2013 | |||||||||
Current: | |||||||||||
State | $ | 270 | $ | 350 | $ | 519 | |||||
Federal | 513 | — | — | ||||||||
Foreign | 2,336 | 2,772 | 2,572 | ||||||||
3,119 | 3,122 | 3,091 | |||||||||
Deferred: | |||||||||||
Foreign | (755 | ) | 69 | (457 | ) | ||||||
(755 | ) | 69 | (457 | ) | |||||||
Income tax expense | $ | 2,364 | $ | 3,191 | $ | 2,634 | |||||
Federal income tax expense for the year ended December 31, 2015 relates to taxes incurred as a result of a taxable built-in gain triggered by the sale of a property that was previously owned by a C corporation. As a result of the disposition of the Australian properties, we incurred net income tax expense of $1.6 million for the year ended December 31, 2015.
A reconciliation of our effective tax rate and the U.S. Federal statutory income tax rate is as follows:
Year Ended December 31, | ||||||||
2015 | 2014 | 2013 | ||||||
Taxes at statutory U.S. federal income tax rate | 35.00 | % | 35.00 | % | 35.00 | % | ||
Dividends paid deduction and net operating loss utilization | (35.00 | )% | (35.00 | )% | (35.00 | )% | ||
Federal taxes on built-in gain | 0.50 | % | — | % | — | % | ||
State, local, and foreign income taxes | 1.81 | % | 11.73 | % | (1.71 | )% | ||
Effective tax rate | 2.31 | % | 11.73 | % | (1.71 | )% | ||
Deferred income tax assets and liabilities, net of a valuation allowance, represent the tax effects of temporary differences between the carrying amounts of assets and liabilities for financial reporting purposes, and are determined using tax rates expected to be in effect when the deferred income tax assets and liabilities are anticipated to be paid or recovered. At December 31, 2014, we had deferred tax assets of $2.4 million, net of a valuation allowance of $0.6 million, and deferred tax liabilities of $3.1 million, which primarily relate to different carrying amounts for financial reporting and for Australian income tax purposes related to our properties and operations in Australia. The deferred tax assets primarily relate to depreciation differences and the deferred tax liabilities primarily relate to straight line rent adjustments. During the year ended December 31, 2015, we sold our Australian properties (Note 4) and as of December 31, 2015, we do not have any deferred tax assets or
F-30
liabilities related to our Australian properties. We generated significant net operating losses through the 2015 property sales and we have fully reserved the associated deferred tax assets due to the uncertainty of our ability to utilize the net operating losses in the future.
Note 13. Derivative Instruments
Risk Management Objective of Using Derivatives
We are exposed to certain risks relating to our ongoing business operations, including the effect of changes in interest rates. The only risk we currently manage by using derivative instruments is a part of our interest rate risk.
We may use derivative financial instruments, including interest rate swaps, caps, options, floors and other interest rate derivative contracts, to hedge all or a portion of the interest rate risk associated with our borrowings. The principal objective of such arrangements is to minimize the risks and/or costs associated with our operating and financial structure as well as to hedge specific anticipated transactions. We do not intend to utilize derivatives for speculative or other purposes other than interest rate risk management. The use of derivative financial instruments carries certain risks, including the risk that the counterparties to these contractual arrangements are not able to perform under the agreements. To mitigate this risk, we only enter into derivative financial instruments with counterparties with high credit ratings and with major financial institutions with which we and our affiliates may also have other financial relationships. We do not anticipate that any of the counterparties will fail to meet their obligations.
Cash Flow Hedges of Interest Rate Risk
Our objectives in using interest rate derivatives are to add stability to interest expense and to manage our exposure to interest rate movements. To accomplish this objective, we periodically use interest rate swaps, caps, or other similar instruments as part of our interest rate risk management strategy. Interest rate swaps designated as cash flow hedges involve the receipt of variable-rate amounts from a counterparty in exchange for us making fixed-rate payments over the life of the agreements without exchange of the underlying notional amount.
The effective portion of changes in the fair value of derivatives designated and that qualify as cash flow hedges is recorded in cumulative other comprehensive income (loss) and is subsequently reclassified into earnings in the period that the hedged forecasted transaction affects earnings. During 2015, such derivatives were used to hedge the variable cash flows associated with variable-rate debt. The ineffective portion of the change in fair value of the derivatives is recognized directly in earnings.
Amounts reported in cumulative other comprehensive loss related to derivatives will be reclassified to interest expense as interest payments are made on our variable-rate debt. During the next twelve months, we estimate that an additional $3.7 million will be reclassified from cumulative other comprehensive loss as an increase to interest expense.
We have interest rate swap agreements to manage our interest rate risk exposure on $169.6 million of mortgage debt due 2019, which require interest at a spread over LIBOR. The interest rate swap agreements utilized by us qualify as cash flow hedges and effectively modify our exposure to interest rate risk by converting our floating interest rate debt to a fixed interest rate basis for this loan through December 1, 2016, thus reducing the impact of interest rate changes on future interest expense. As of December 31, 2015, we had the following outstanding interest rate derivatives that were designated as cash flow hedges of interest rate risk:
Interest Rate Derivative | Number of Instruments | Notional Amount (in thousands) | |||
Interest rate swap | 2 | $169,612 | |||
The table below presents the fair value of our derivative financial instruments as well as their classification on the consolidated balance sheets as of December 31, 2015, and 2014 (amounts in thousands):
Fair Value as of December 31, | ||||||||||
Interest Rate Derivative Designated as Hedging Instrument | Balance Sheet Location | 2015 | 2014 | |||||||
Pay-fixed swaps | Accounts payable and accrued expenses | $ | 3,687 | $ | 7,462 | |||||
F-31
The table below details the location in the financial statements of the gain or loss recognized on interest rate derivatives designated as cash flow hedges for the years ended December 31, 2015, 2014, and 2013 (amounts in thousands):
Year Ended December 31, | |||||||||||
2015 | 2014 | 2013 | |||||||||
Balance at beginning of period | $ | (7,462 | ) | $ | (11,706 | ) | $ | (16,624 | ) | ||
Amount of loss recognized in cumulative other comprehensive loss | (1,149 | ) | (776 | ) | (103 | ) | |||||
Amount of loss reclassified from cumulative other comprehensive loss into interest expense | 4,924 | 5,020 | 5,021 | ||||||||
Unrealized gain on derivative instruments | 3,775 | 4,244 | 4,918 | ||||||||
Balance at end of period | $ | (3,687 | ) | $ | (7,462 | ) | $ | (11,706 | ) | ||
Credit-risk-related Contingent Features
We have agreements with each of our derivative counterparties that contain a provision where if we either default or are capable of being declared in default on any of our indebtedness, then we could also be declared in default on our derivative obligations.
As of December 31, 2015, the fair value of derivatives in a net liability position including accrued interest but excluding any adjustment for nonperformance risk related to these agreements was $4.1 million. As of December 31, 2015, we have not posted any collateral related to these agreements and were not in breach of any agreement provisions. If we had breached any of these provisions, we could have been required to settle our obligations under the agreements at their aggregate termination value of $4.1 million at December 31, 2015.
Note 14. Share-Based Compensation
Equity Commonwealth 2015 Omnibus Incentive Plan
On June 16, 2015, at our 2015 annual meeting of shareholders, our shareholders approved the Equity Commonwealth 2015 Omnibus Incentive Plan (the 2015 Incentive Plan). The 2015 Incentive Plan replaced the Equity Commonwealth 2012 Equity Compensation Plan (as amended, the 2012 Plan). The Board of Trustees approved the 2015 Incentive Plan, subject to shareholder approval, on March 18, 2015 (the Effective Date). On January 26, 2016, the Board of Trustees approved an amendment to the 2015 Incentive Plan to allow the Compensation Committee (Committee) to authorize in an award agreement a transfer of all or a part of certain equity awards not for value to a “family member” (as defined in the 2015 Incentive Plan). The following description of certain terms of the 2015 Incentive Plan is qualified in all respects by the terms of the 2015 Incentive Plan.
Eligibility. Awards may be granted under the 2015 Incentive Plan to employees, officers and non-employee directors of the Company, its subsidiaries or its affiliates, or consultants and advisors (who are natural persons) providing services to the Company, its subsidiaries or its affiliates, or any other person whose participation in the 2015 Incentive Plan is determined by the Committee to be in the best interests of the Company.
Term. The 2015 Incentive Plan terminates automatically ten years after the Effective Date, unless it is terminated earlier by the Board of Trustees.
Shares Available for Issuance. Subject to adjustment as provided in the 2015 Incentive Plan, the maximum number of common shares of the Company that are available for issuance under the 2015 Incentive Plan is 3,250,000 shares.
Awards. The following types of awards may be made under the 2015 Incentive Plan, subject to limitations set forth in the 2015 Incentive Plan:
· Stock options;
· Stock appreciation rights;
· Restricted stock;
· Restricted stock units;
F-32
· Unrestricted stock;
· Dividend equivalent rights;
· Performance shares and other performance-based awards;
· Limited partnership interests in any partnership entity through which the Company may conduct its business in the future;
· Other equity-based awards; and
· Cash bonus awards.
Recipients of the Company’s restricted shares have the same voting rights as any other common shareholder. During the period of restriction, the Company’s unvested restricted shareholders are eligible to receive dividend payments on their shares at the same rate and on the same date as any other common shareholder. Recipients of the Company’s restricted stock units (RSUs) are entitled to receive dividends with respect to the common shares underlying the RSUs if and when the RSUs are earned, at which time the recipient will be entitled to receive an amount in cash equal to the aggregate amount of ordinary cash dividends that would have been paid in respect of the common shares underlying the recipient’s earned RSUs had such common shares been issued to the recipient on the first day of the performance period.
Administration. The 2015 Incentive Plan will be administered by the Committee, which will determine all terms and recipients of awards under the 2015 Incentive Plan.
2015 Equity Award Activity
On June 16, 2015, in accordance with the Company’s compensation plan for independent Trustees, the Committee awarded each of the nine independent Trustees $0.1 million in restricted shares as part of their compensation for the 2015-2016 year of service on the Board of Trustees. These awards equated to 3,843 shares per Trustee, for a total of 34,587 shares, valued at $26.02 per share, the closing price of our common shares on the NYSE on that day. These shares vest one year after the date of the award.
On January 28, 2015, the Committee approved a grant of 126,319 restricted common shares and 639,250 RSUs at target to the Company’s officers, certain employees and to Mr. Zell, the Chairman of our Board of Trustees, as part of their compensation for fiscal year 2014.
The restricted shares are service based awards and vest over a four-year period. The restricted shares were granted on January 28, 2015 and were valued at $26.58 per share, the closing price of our common shares on the NYSE on that day.
The 776,456 unvested restricted shares as of December 31, 2015 are scheduled to vest as follows: 188,879 shares in 2016, 185,467 shares in 2017, 339,759 shares in 2018 and 62,351 shares in 2019. As of December 31, 2015, the estimated future compensation expense for all unvested restricted share grants was $14.6 million. Compensation expense for the restricted share awards is being recognized on a straight-line basis over the requisite service period for each separately vesting portion of the award. The weighted average period over which the future compensation expense will be recorded for the restricted shares is approximately 2.8 years.
The RSUs are market based awards with a service condition and grant recipients may earn the RSU grants based on the Company’s total shareholder return (TSR) relative to the TSR's for the constituent REITs that comprise the NAREIT Office Index for the performance period of January 28, 2015 - January 28, 2018. Following the end of the performance period on January 28, 2018, the number of earned awards will be determined. The earned awards vest in two tranches with 50% of the earned award vesting on January 28, 2018 and the remaining 50% of the earned award vesting on January 28, 2019, subject to the grant recipient’s continued employment. Recipients of the Company’s RSUs are entitled to receive dividends with respect to the common shares underlying the RSUs if and when the RSUs are earned. To the extent that an award does not vest, the dividends will be forfeited. Compensation expense for the RSU awards was determined using a Monte Carlo simulation model and is being recognized ratably from the grant date to the vesting date of each tranche.
2014 Equity Award Activity
On October 28, 2014, the Committee approved the one-time grant of restricted common shares and restricted share units under the 2012 Plan to certain of the Company’s officers and employees and to Mr. Zell, the Chairman of our Board of Trustees. The Committee also approved the one-time grant of restricted common shares under the 2012 Plan to our
F-33
independent Trustees, a grant of restricted common shares to each independent Trustee as annual compensation for his or her service as a Trustee, and a pro-rata grant of fully vested common shares for five of our independent Trustees for their service from May 23, 2014 through July 31, 2014.
Outstanding Equity Awards
The table below presents a summary of restricted share and RSU activity under the 2015 Incentive Plan and the 2012 Plan for the years ended December 31, 2015, and 2014, excluding restricted shares granted to our former Trustees, former officers and certain employees of RMR under the terms of our 2012 Plan (which grants are further described below):
Number of Restricted Shares | Weighted Average Grant Date Fair Value | Number of RSUs | Weighted Average Grant Date Fair Value | ||||||||||
Outstanding at December 31, 2013 | — | $ | — | — | $ | — | |||||||
Granted | 713,727 | 26.66 | 1,266,237 | 15.99 | |||||||||
Vested | (3,545 | ) | 26.66 | — | — | ||||||||
Outstanding at December 31, 2014 | 710,182 | 1,266,237 | |||||||||||
Granted | 160,906 | 26.46 | 639,250 | 15.47 | |||||||||
Vested | (86,517 | ) | 26.02 | — | — | ||||||||
Forfeited | (8,115 | ) | 26.64 | (21,377 | ) | 15.80 | |||||||
Outstanding at December 31, 2015 | 776,456 | 1,884,110 | |||||||||||
The RSUs are market based awards with a service condition and grant recipients may earn between 0% - 100% of the RSU grant based on the Company’s TSR relative to the TSR for the NAREIT Office Index for the period from October 28, 2014 - October 28, 2017. Following the end of the performance period on October 28, 2017, the number of earned awards will be determined. The earned awards vest in two tranches with 50% of the earned award vesting on October 28, 2017 and the remaining 50% of the earned award vesting on October 28, 2018 subject to the grant recipient’s continued employment.
As of December 31, 2015, the estimated future compensation expense for all unvested RSUs was $20.3 million. The weighted average period over which the future compensation expense will be recorded for the RSUs is approximately 2.4 years.
The assumptions and fair values for the RSUs granted for the years ended December 31, 2015, and 2014 are included in the following table on a per share basis.
2015 | 2014 | ||||||
Fair value of RSUs granted | $ | 15.47 | $ | 15.99 | |||
Expected term (years) | 4 | 4 | |||||
Expected volatility | — | — | |||||
Expected dividend yield | 1.88 | % | 1.88 | % | |||
Risk-free rate | 0.81 | % | 0.84 | % | |||
During the years ended December 31, 2015 and 2014, we recorded $15.4 million and $2.6 million, respectively, of compensation expense, net of forfeitures, in general and administrative expense for grants to our Board of Trustees and the Company's employees related to our Plan. At December 31, 2015, 3,215,413 common shares remain available for issuance under the Plan.
2012 Equity Compensation Plan
Prior to the adoption of the 2015 Incentive Plan, we had common shares available for issuance under the 2012 Plan. The 2012 Plan was adopted in May 2012 and replaced our 2003 Incentive Share Award Plan, or the 2003 Plan. We awarded common shares to our former officers and certain employees of RMR pursuant to both of these plans. On January 28, 2014, we granted 2,000 common shares of beneficial interest, par value $0.01 per share, valued at $23.46 per share, the closing price of
F-34
our common shares on the New York Stock Exchange, or NYSE, on that day, to two of our former Trustees as part of their then annual compensation. We also awarded each of our former Trustees 2,000 common shares in 2013 with an aggregate market value of $0.2 million on the date of grant, as part of their annual compensation. The common shares awarded to our former Trustees vested immediately. We include the value of awarded shares in general and administrative expenses at the time the awards vest. See Note 19 for further information regarding grants of restricted shares we made to our former officers and certain employees of RMR.
On October 28, 2014, the Board of Trustees approved an amendment to the 2012 Plan to permit the Company to issue RSUs. Additionally, on October 28, 2014, the Committee approved new forms of Restricted Share and Restricted Share Unit Agreements to be used for grants of restricted common shares to members of the Board of Trustees, as well as grants of restricted common shares and restricted share units to officers and employees of the Company.
The 2015 Incentive Plan replaced the 2012 Plan. No future grants will be made under the 2012 Plan, although the terms and conditions of the 2012 Plan will continue to govern any outstanding awards granted under the 2012 Plan. A summary of shares granted and vested to our former Trustees, former officers and certain employees of RMR under the terms of our 2012 Plan and our 2003 Plan for the years ended December 31, 2014, and 2013, is as follows:
Number of Shares | Weighted Average Grant Date Fair Value | ||||
Unvested shares at December 31, 2012 | 114,703 | 19.39 | |||
Granted | 83,450 | 23.29 | |||
Vested | (66,639 | ) | 23.06 | ||
Forfeited | (600 | ) | 22.49 | ||
Unvested shares at December 31, 2013 | 130,914 | 20.70 | |||
Granted | 4,000 | 23.46 | |||
Vested | (134,914 | ) | 25.79 | ||
Unvested shares at December 31, 2014 | — | — | |||
As a result of the removal of our former Trustees on March 25, 2014, the vesting of 130,914 common shares previously issued to our former officers and certain employees of RMR pursuant to our equity compensation plans accelerated in accordance with the terms of their governing share grants. During the year ended December 31, 2014, we recorded $3.4 million of general and administrative expense related to the vesting of these shares.
During the years ended December 31, 2014, and 2013, we recorded $3.4 million and $1.8 million, respectively, of compensation expense for former Trustees, former officers and certain employees of RMR under the terms of our 2012 Plan and our 2003 Plan. In addition, during the period that SIR was our consolidated subsidiary, we recorded compensation expense related to SIR's equity compensation plan of $0.4 million for the year ended December 31, 2013.
Note 15. Defined Contribution Plan
We have a defined contribution plan that covers employees meeting eligibility requirements. We match 100% of the first 3% of compensation that an employee elects to defer plus 50% of compensation that an employee elects to defer exceeding 3% but not exceeding 5%, subject to a maximum of $8,000. The Company’s matching contribution vests immediately. The Company's contributions were $0.3 million for the year ended December 31, 2015.
F-35
Note 16. Fair Value of Assets and Liabilities
The table below presents certain of our assets and liabilities measured at fair value during 2015 and 2014, categorized by the level of inputs used in the valuation of each asset and liability (dollars in thousands):
Fair Value at December 31, 2015 Using | ||||||||||||||||
Quoted Prices in Active Markets for Identical Assets | Significant Other Observable Inputs | Significant Unobservable Inputs | ||||||||||||||
Description | Total | (Level 1) | (Level 2) | (Level 3) | ||||||||||||
Recurring Fair Value Measurements: | ||||||||||||||||
Effective portion of interest rate swap contracts | $ | (3,687 | ) | $ | — | $ | (3,687 | ) | $ | — | ||||||
Derivative liability | (7,219 | ) | — | — | (7,219 | ) | ||||||||||
Fair Value at December 31, 2014 Using | ||||||||||||||||
Quoted Prices in Active Markets for Identical Assets | Significant Other Observable Inputs | Significant Unobservable Inputs | ||||||||||||||
Description | Total | (Level 1) | (Level 2) | (Level 3) | ||||||||||||
Recurring Fair Value Measurements: | ||||||||||||||||
Effective portion of interest rate swap contracts | $ | (7,462 | ) | $ | — | $ | (7,462 | ) | $ | — | ||||||
Derivative liability | (6,658 | ) | — | — | (6,658 | ) | ||||||||||
Effective Portion of Interest Rate Swap Contracts
The fair value of our interest rate swap contracts is determined using the net discounted cash flows of each derivative based on the market based interest rate curve (level 2 inputs) and adjusted for our credit spread and the actual and estimated credit spreads of the counterparties (level 3 inputs). Although we have determined that the majority of the inputs used to value our derivatives fall within level 2 of the fair value hierarchy, the credit valuation adjustments associated with our derivatives utilize level 3 inputs, such as estimates of current credit spreads, to evaluate the likelihood of default by us and the counterparties. As of December 31, 2015, we have assessed the significance of the impact of the credit valuation adjustments on the overall valuation of our derivative positions and have determined that the credit valuation adjustments are not significant to the overall valuation of our derivatives. As a result, we have determined that our derivative valuations in their entirety are classified as level 2 inputs in the fair value hierarchy.
Derivative Liability
On July 31, 2014, our shareholders voted to approve the reimbursement of expenses incurred by Related/Corvex (Note 17). Approximately $8.4 million was to be reimbursed only if the average closing price of our common shares was at least $26.00 (as adjusted for any share splits or share dividends) during the one year period after the date on which the reimbursement was approved by shareholders, and the remaining approximately $8.4 million will be reimbursed only if the average closing price of our common shares is at least $26.00 (as adjusted for any share splits or share dividends) during the one year period between the first and second anniversaries of the date on which the reimbursement was approved by shareholders. The average closing price of our common shares was at least $26.00 during the first one year period after the date on which the reimbursement was approved by shareholders, and in August 2015, we paid $8.4 million to Related/Corvex. The potential future reimbursement represents a derivative instrument as codified in ASC 815 Derivatives and Hedging which requires the potential future reimbursement to be recorded at fair value at each reporting date.
We recognized expense of $9.0 million for the year ended December 31, 2015, which was recorded in general and administrative expenses in our consolidated statement of operations for the year ended December 31, 2015. The valuation
F-36
techniques and significant unobservable inputs used for our level 3 fair value measurement at December 31, 2015, and 2014 were as follows:
Description | Fair Value at December 31, 2015 | Primary Valuation Technique | Unobservable Inputs | Rate | ||||||
Derivative liability | $ | 7,219 | Monte Carlo simulation | Risk-free rate | 0.52% | |||||
Volatility | 20.0% | |||||||||
Description | Fair Value at December 31, 2014 | Primary Valuation Technique | Unobservable Inputs | Rate | ||||||
Derivative liability | $ | 6,658 | Monte Carlo simulation | Risk-free rate | 0.50% | |||||
Volatility | 20.0% | |||||||||
Properties Held and Used
As part of our disposition plan, and pursuant to our accounting policy, in 2015, we evaluated the recoverability of the carrying values of each of the real estate assets that comprised our portfolio and determined that due to the shortening of the expected periods of ownership as a result of the disposition plan, it was necessary to reduce the net book value of a portion of the real estate assets in our portfolio to reduce the assets to their estimated fair values. During the year ended December 31, 2015, we recorded an impairment charge of $17.2 million in accordance with our impairment analysis procedures.
In 2014, we ceased to actively market 31 properties with a combined 5.6 million square feet which we had previously classified as held for sale as of December 31, 2013, which were not under agreement for sale when our former Trustees were removed. These properties were reclassified to properties held and used in operations because they no longer meet the requirements for classification as held for sale. Operating results for these properties were reclassified from discontinued operations to continuing operations for all periods presented herein. In connection with this reclassification, we reversed previously recorded impairment losses totaling $4.8 million in 2014, which includes the elimination of estimated costs to sell.
In connection with the internalization of management, we developed a disposition plan in the fourth quarter of 2014. Through this plan, we expect to dispose of many of our assets in the coming years. Pursuant to our accounting policy, we evaluated the recoverability of the carrying values of each of the real estate assets that comprised our portfolio and determined that due to the shortening of the expected periods of ownership, as a result of the disposition plan, that it was necessary to reduce the net book value of a portion of the real estate assets in our portfolio. As a result, we recorded a loss on asset impairment for 34 properties of $167.1 million in 2014, to reflect the estimated fair values of those real estate assets in our portfolio that failed the recoverability test because the net book values exceeded their fair values. We reduced the aggregate carrying value of these properties from $581.7 million to their estimated fair value of $414.6 million, reflected in the table below.
The fair value measurements used in the evaluation of our real estate assets are considered to be Level 3 valuations within the fair value hierarchy outlined above, as there are significant unobservable inputs. Examples of inputs that were utilized in the fair value calculations include estimated holding periods, discount rates, market capitalization rates, expected lease rental rates, and third party broker information. The valuation techniques and significant unobservable inputs used for our level 3 fair value measurements at December 31, 2014 were as follows:
Description | Fair Value at December 31, 2014 | Primary Valuation Techniques | Unobservable Inputs | Weighted Average(1) | ||||||
Properties held and used on which we recognized impairment losses | $ | 414,625 | Discounted cash flows | Discount rate | 10.2% | |||||
Exit capitalization rate | 9.1% | |||||||||
(1) Calculated as a weighted average based on the fair value at December 31, 2014.
F-37
In 2014, we made the decision to cease making loan servicing payments on 225 Water Steet in Jacksonville, Florida (Note 9). As a result of the decision to discontinue making loan servicing payments on this property, we recorded a loss on asset impairment totaling $22.7 million to reduce the aggregate carrying value of this property from $42.3 million to its estimated fair value of $19.6 million. We used discounted cash flow analysis and third party broker information (level 3 inputs) in determining the fair value of this property. The valuation techniques and significant unobservable inputs used for our level 3 fair value measurements at June 30, 2014 were as follows:
Description | Fair Value at June 30, 2014 | Primary Valuation Techniques | Unobservable Inputs | Rate | ||||||
225 Water Street | $ | 19,589 | Discounted cash flows | Discount rate | 8% | |||||
Exit capitalization rate | 8% | |||||||||
Financial Instruments
In addition to the assets and liabilities described in the above table, our financial instruments include our cash and cash equivalents, real estate mortgages receivable, restricted cash, senior unsecured debt and mortgage notes payable. At December 31, 2015 and 2014, the fair value of these additional financial instruments were not materially different from their carrying values, except as follows (in thousands):
December 31, 2015 | December 31, 2014 | ||||||||||||||
Carrying Amount | Fair Value | Carrying Amount | Fair Value | ||||||||||||
Senior unsecured debt and mortgage notes payable, net | $ | 1,710,324 | $ | 1,749,211 | $ | 2,207,665 | $ | 2,263,535 | |||||||
The fair values of our senior notes and mortgage notes payable are based on estimates using discounted cash flow analyses and currently prevailing interest rates adjusted by credit risk spreads (level 3 inputs).
Other financial instruments that potentially subject us to concentrations of credit risk consist principally of rents receivable; however, as of December 31, 2015, no single tenant of ours is responsible for more than 4% of our total annualized rents.
Our derivative financial instruments, including interest rate swaps, are entered with major financial institutions and we monitor the amount of credit exposure to any one counterparty.
F-38
Note 17. Earnings Per Common Share
The following table sets forth the computation of basic and diluted earnings per share (amounts in thousands except per share amounts):
Year Ended December 31, | |||||||||||
2015 | 2014 | 2013 | |||||||||
Numerator for earnings per common share - basic and diluted: | |||||||||||
Income (loss) from continuing operations | $ | 99,857 | $ | 21,206 | $ | (37,318 | ) | ||||
Net income attributable to noncontrolling interest in consolidated subsidiary | — | — | (20,093 | ) | |||||||
Preferred distributions | (27,924 | ) | (32,095 | ) | (44,604 | ) | |||||
Excess fair value of consideration over carrying vale of preferred shares | — | (16,205 | ) | — | |||||||
Income (loss) from continuing operations attributable to Equity Commonwealth common shareholders | 71,933 | (27,094 | ) | (102,015 | ) | ||||||
Discontinued operations | — | 2,806 | (119,649 | ) | |||||||
Numerator for net income (loss) per share - basic and diluted | $ | 71,933 | $ | (24,288 | ) | $ | (221,664 | ) | |||
Denominator for earnings per common share - basic and diluted: | |||||||||||
Weighted average number of common shares outstanding - basic | 128,621 | 125,163 | 112,378 | ||||||||
Weighted average number of common shares outstanding - diluted(1) | 129,437 | 125,163 | 112,378 | ||||||||
Earnings per share - basic: | |||||||||||
Income (loss) from continuing operations attributable to Equity Commonwealth common shareholders | $ | 0.56 | $ | (0.21 | ) | $ | (0.91 | ) | |||
Discontinued operations | — | 0.02 | (1.06 | ) | |||||||
Net income (loss) per share - basic | $ | 0.56 | $ | (0.19 | ) | $ | (1.97 | ) | |||
Earnings per share - diluted: | |||||||||||
Income (loss) from continuing operations attributable to Equity Commonwealth common shareholders | $ | 0.56 | $ | (0.21 | ) | $ | (0.91 | ) | |||
Discontinued operations | — | 0.02 | (1.06 | ) | |||||||
Net income (loss) per share - diluted | $ | 0.56 | $ | (0.19 | ) | $ | (1.97 | ) | |||
Anti-dilutive securities: | |||||||||||
Effect of Series D preferred shares; 6 1/2% cumulative convertible(2) | 2,363 | 4,175 | 7,298 | ||||||||
(1) | As of December 31, 2015, we had granted RSUs to certain employees, officers, and the chairman of the Board of Trustees. The RSUs contain both service and market-based vesting components. None of the RSUs have vested. If the market-based vesting component was measured as of December 31, 2015, 1,143 common shares would be issued to the RSU holders, and no shares would have been issued for the other periods presented. Using a weighted average basis, 816 common shares are reflected in diluted earnings per share for the year ended ended December 31, 2015. |
(2) | The Series D preferred shares are excluded from the diluted earnings per share calculation because including the Series D preferred shares would also require that the preferred distributions be added back to net income, resulting in anti-dilution during the periods presented. |
F-39
Note 18. Segment Information
Our primary business is the ownership and operation of office properties. Due to significant dispositions during 2015, during the fourth quarter of 2015 we changed the composition of our operating segments from two reportable segments (central business district properties and suburban properties) to one reportable segment. This change was made based on the financial information reviewed and used by the chief operating decision maker to make operating decisions, assess performance, develop strategy and allocate capital resources. More than 90% of our revenues are from office properties.
Note 19. Related Person Transactions
The following discussion includes a description of our related person transactions for the years ended December 31, 2015, 2014 and 2013. Certain of these related person transactions, and their approvals, occurred prior to the election of our new Board of Trustees at the Special Meeting and the appointment of our current executive officers following the Special Meeting. The disclosure below under “—Transactions with Prior Related Persons” describes our transactions and approvals with our prior related persons.
Related Person Transactions Following the Special Meeting:
Equity Group Investments and associated entities: Effective February 1, 2016, we entered into a lease with Two North Riverside Plaza Joint Venture Limited Partnership, an entity associated with Mr. Zell, our Chairman, for storage space in the basement of the building. The lease expires December 31, 2020, provided each party has the right to terminate on 30 days' prior written notice, and the payment is nominal. This lease was approved by the Audit Committee of the Board of Trustees.
Effective July 20, 2015, we entered into a lease with Two North Riverside Plaza Joint Venture Limited Partnership, an entity associated with Mr. Zell, our Chairman, to occupy office space on the twentieth and twenty-first floors of Two North Riverside Plaza in Chicago, Illinois. The initial term of the lease is approximately five years, with one 5-year renewal option. The lease payment is approximately $0.5 million for the initial year beginning in 2016, and $0.8 million annually thereafter. This lease was approved by the Audit Committee of the Board of Trustees on June 16, 2015.
Effective June 1, 2014, we entered into a one-year license agreement with Equity Group Investments, a private investment firm (Equity Group), to use office space on the sixth floor at Two North Riverside Plaza in Chicago, Illinois. The license fee was $0.2 million for the initial year. The license fee includes the non-exclusive use of additional areas on the sixth floor (such as conference rooms and common areas), certain administrative services (such as mail room services and reception desk staffing), office equipment, office furniture, supplies, licensee’s share of building operating expenses and real estate taxes and access to one parking space. Mr. Zell, our Chairman, is the Chairman and Chief Executive Officer of Equity Group, and Mr. Helfand, our President and Chief Executive Officer, is the Co-President of Equity Group. This license agreement was approved by the Audit Committee of the Board of Trustees and was scheduled to expire on May 31, 2015. On May 4, 2015, the Audit Committee of the Board of Trustees approved an agreement to extend the term of the license agreement through November 30, 2015. The license fee payment is approximately $0.1 million for the extended term. On November 2, 2015, the Audit Committee of the Board of Trustees approved an agreement to extend the term of the license agreement through January 31, 2016, for a maximum license fee payment of approximately $0.1 million. The extension of the license agreement was terminated as of December 30, 2015.
Effective June 1, 2014, we entered into a one-year lease with one 3-month renewal option with Two North Riverside Plaza Joint Venture Limited Partnership, an entity associated with Mr. Zell, our Chairman, to occupy office space on the fourteenth floor at Two North Riverside Plaza in Chicago, Illinois. The lease payment was $0.2 million for the initial term. This lease was terminated, effective January 31, 2015. This lease was approved by the Audit Committee of the Board of Trustees.
Effective July 31, 2014, we entered into a sublease with Equity Residential Management, L.L.C. to occupy office space on the tenth floor of Two North Riverside Plaza in Chicago, Illinois. Equity Residential Management, L.L.C. leases the space from Two North Riverside Plaza Joint Venture Limited Partnership, an entity associated with Mr. Zell, our Chairman. The initial term of the sublease was approximately seven months commencing on or about October 22, 2014, expiring on May 31, 2015, with one 3-month renewal option. The sublease payment was approximately $0.2 million for the initial term. This sublease was approved by the Audit Committee of the Board of Trustees. On May 4, 2015, the Audit Committee of the Board of Trustees approved an agreement to extend the term of the sublease through November 30, 2015. The sublease payment is
F-40
approximately $0.2 million for the extended term. On November 2, 2015, the Audit Committee of the Board of Trustees approved an agreement to extend the term of the sublease through January 31, 2016, for a maximum sublease payment of approximately $0.1 million. The extension of the sublease was terminated as of December 30, 2015.
Related/Corvex: On July 31, 2014, at the reconvened session of our 2014 annual meeting of shareholders, our shareholders voted to approve the reimbursement of approximately $33.5 million of expenses incurred by Related/Corvex in connection with their consent solicitations to remove our former Trustees and elect the new Board of Trustees and to engage in related litigation. Approximately $16.7 million was paid during the year ended December 31, 2014. Approximately $8.4 million was to be reimbursed only if the average closing price of our common shares is at least $26.00 (as adjusted for any share splits or share dividends) during the one year period after the date on which the reimbursement was approved by shareholders, and the remaining approximately $8.4 million will be reimbursed only if the average closing price of our common shares is at least $26.00 (as adjusted for any share splits or share dividends) during the one year period between the first and second anniversaries of the date on which the reimbursement was approved by shareholders. The average closing price of our common shares was at least $26.00 during the first one year period after the date on which the reimbursement was approved by shareholders, and in August 2015, we paid $8.4 million to Related/Corvex.
Transactions with Prior Related Persons:
RMR: Prior to entering into the Termination and Cooperation Agreement with RMR, as further described below, we had three primary agreements with RMR and its affiliates to provide management and administrative services to us: (i) a business management agreement, which relates to our business generally, (ii) a property management agreement, which relates to our property level operations, and (iii) an Australia business and property management agreement, which relates to our Australian properties.
During the time we were externally managed by RMR, one of our former Managing Trustees, Mr. Barry Portnoy, was Chairman, majority owner and an employee of RMR. Another former Managing Trustee and our former President, Mr. Adam Portnoy, is the son of Mr. Barry Portnoy, and was an owner, President, Chief Executive Officer and a director of RMR. Mr. John Popeo, our former Treasurer and Chief Financial Officer, and Mr. David Lepore, our former Chief Operating Officer, were also officers of RMR. Two of our former independent Trustees served as independent directors or independent trustees of other public companies to which RMR provided management services. Mr. Barry Portnoy served as a managing director or managing trustee of a majority of the public companies to which RMR or its affiliate provided management services and Mr. Adam Portnoy served as a managing trustee of a majority of those companies. In addition, officers of RMR served as officers of those companies. As a result of the removal, effective March 25, 2014, of Mr. Barry Portnoy and Mr. Adam Portnoy as Trustees of the Company and the resignation on May 23, 2014, of Mr. Adam D. Portnoy, Mr. John C. Popeo, Mr. David M. Lepore and other officers of RMR from their respective positions as officers of the Company, they, RMR, RMR Australia Asset Management Pty Limited, or RMR Australia, GOV, SIR and AIC have ceased to be related persons of the Company. Therefore, we only present related person transactions with these entities through June 30, 2014.
On December 19, 2013, we and RMR entered into an amended and restated business management agreement, effective with respect to services performed on and after January 1, 2014. Under the terms of this amended and restated business management agreement:
• | The annual amount of the base management fee which was to be paid to RMR by us for each applicable period was to be equal to the lesser of: |
• | the sum of (a) 0.7% of the average historical cost of our real estate investments during such period up to $250.0 million, plus (b) 1.0% of the average historical cost of our real estate investments located outside the United States, Puerto Rico and Canada during such period, plus (c) 0.5% of the average historical cost of our real estate investments during such period exceeding $250.0 million and the average historical cost of our real estate investments located outside the United States, Puerto Rico and Canada combined; and |
• | the sum of (a) 0.7% of the average closing price per share of our common shares on the NYSE, during such period, multiplied by the average number of our common shares outstanding during such period, plus the daily weighted average of the aggregate liquidation preference of each class of our preferred shares outstanding during such period, plus the daily weighted average of the aggregate principal amount of our consolidated |
F-41
indebtedness during such period, or, together, our Average Market Capitalization, up to $250.0 million, plus (b) 1.0% of the average historical cost of our real estate investments located outside the United States, Puerto Rico and Canada during such period, plus (c) 0.5% of our Average Market Capitalization exceeding $250.0 million and the average historical cost of our real estate investments located outside the United States, Puerto Rico and Canada during such period combined.
The average historical cost of our real estate investments will include our consolidated assets invested, directly or indirectly, in equity interests in or loans secured by real estate and personal property owned in connection with such real estate (including acquisition related costs and costs which may be allocated to intangibles or are unallocated), all before reserves for depreciation, amortization, impairment charges or bad debts or other similar noncash reserves. Our investment in SIR (or in any other company which has a management agreement with RMR) is not counted for purposes of calculating the fees payable by us to RMR.
• | Although the fee calculation is stated in annual percentages, the base management fee is paid monthly to RMR, ninety percent (90%) in cash and ten percent (10%) in our common shares, which shall be fully-vested when issued. The number of our common shares to be issued in payment of the base management fee for each month is equal to the value of 10.0% of the total base management fee for that month divided by the average daily closing price of our common shares during that month. |
• | The incentive management fee which may be earned by RMR for an annual period will be an amount, subject to a cap based on the value of our outstanding common shares, equal to 12.0% of the product of (a) our equity market capitalization on the last trading day on the year immediately prior to the relevant measurement period, and (b) the amount (expressed as a percentage) by which the total returns per share realized by the holders of our common shares (i.e., share price appreciation plus dividends) exceeds the total shareholder return of the SNL Office REIT Index (in each case subject to certain adjustments) for the relevant measurement period. The measurement periods are generally three-year periods ending with the year for which the incentive management fee is being calculated, with shorter periods applicable in the case of the calculation of the incentive management fee for 2014 (one year) and 2015 (two years). |
• | The incentive management fee is payable in our common shares, with one-third of our common shares issued in payment of an incentive management fee vested on the date of issuance, and the remaining two-thirds vesting thereafter in two equal annual installments. If the issuance of common shares in payment of a portion of the base management fee or incentive management fee would be limited by applicable law and regulations, such portion of the applicable fee will instead be paid in cash. |
• | RMR and certain eligible transferees of our common shares issued in payment of the base management fee or incentive management fee are entitled to demand registration rights, exercisable not more frequently than twice per year, and to "piggy-back" registration rights, with certain expenses to be paid by us. We and applicable selling shareholders also have agreed to indemnify each other (and their officers, trustees, directors and controlling persons) against certain liabilities, including liabilities under the Securities Act in connection with any such registration. |
Pursuant to our business management agreement with RMR as described above, we recognized business management fee expense of $31.7 million for the six months ended June 30, 2014. The fees for the six months ended June 30, 2014, include estimated 2014 incentive fees payable in common shares based on our common share total return. These amounts are included in general and administrative expenses, in our consolidated financial statements. In accordance with the terms of our business management agreement, as amended in December 2013, we issued 68,206 of our common shares to RMR for the six months ended June 30, 2014 as payment for 10% of the base business management fee we recognized for such period.
For 2013, our business management agreement provided for the base business management fee to be paid to RMR at an annual rate equal to (a) 0.7% of the historical cost of our real estate investments, as described in the business management agreement, located in the United States, Puerto Rico or Canada, for the first $250.0 million of such investments, and 0.5% thereafter, plus (b) 1.0% of the historical cost of our real estate investments located outside the United States, Puerto Rico and Canada. In addition, for 2013, our business management agreement provided for RMR to be paid an incentive fee equal to 15.0% of the product of (i) the weighted average of our common shares outstanding on a fully diluted basis during a fiscal year and (ii) the excess, if any, of the FFO Per Share, as defined in the business management agreement, for such fiscal year over the FFO Per Share for the preceding fiscal year. Our investments in GOV and SIR, which are described below, were not counted for purposes of determining the business management fees payable by us to RMR; however, we reported the business management fees payable to RMR by SIR in our consolidated 2013 results until we deconsolidated our investment in SIR on July 2, 2013.
F-42
The business management fees, we and SIR (while SIR was a consolidated subsidiary of ours) recognized on a consolidated basis were $43.3 million for 2013. This amount is included in general and administrative expenses and income from discontinued operations, as appropriate, in our consolidated financial statements. No incentive fees were paid by us to RMR for 2013.
Our property management agreement with RMR provided for management fees equal to 3.0% of gross collected rents and construction supervision fees for construction equal to 5.0% of construction costs. The aggregate property management and construction supervision fees we and SIR (while SIR was a consolidated subsidiary of ours) recognized on a consolidated basis were $13.8 million for the six months ended June 30, 2014, and $32.5 million for 2013. These amounts are included in operating expenses and income from discontinued operations or have been capitalized, as appropriate, in our consolidated financial statements.
MacarthurCook Fund Management Limited (MacarthurCook) previously provided us with business and property management services related to our Australian properties. Our contract with MacarthurCook terminated on January 31, 2013, and on that date we entered into a business and property management agreement (Australia Management Agreement) with RMR Australia for the benefit of CWH Australia Trust, a subsidiary of ours (CWHAT). RMR Australia is owned by two of our former Trustees and our former President and it has been granted an Australian financial services license by the Australian Securities & Investments Commission. The Australia Management Agreement provides for compensation to RMR Australia for business management and real estate investment services at an annual rate equal to 0.5% of the average historical cost of CWHAT's real estate investments, as described in the Australia Management Agreement. The Australia Management Agreement also provides for additional compensation to RMR Australia (i) for property management services at an annual rate equal to 50% of the difference between 3.0% of collected gross rents and the aggregate of all amounts paid or payable by or on behalf of CWHAT to third party property managers, and (ii) for construction supervision services at an annual rate equal to 50% of the difference between 5.0% of constructions costs and any amounts paid to third parties for construction management and/or supervision. Similar to our prior arrangement with respect to fees we paid to MacarthurCook, RMR has agreed to waive half of the fees payable by us under our property management agreement with RMR and half of the business management fees otherwise payable by us under our business management agreement with RMR related to real estate investments that are subject to the Australia Management Agreement for so long as the Australia Management Agreement is in effect and we or any of our subsidiaries are paying the fees under that agreement. The aggregate business and property management fees we recognized pursuant to the Australia Management Agreement were $0.9 million for the six months ended June 30, 2014, which amounts are equal to the fees waived by RMR and excluded from the amount that was payable to RMR during the six months ended June 30, 2014. Pursuant to the Australia Management Agreement, we recognized aggregate business and property management fees of $1.6 million for the year ended December 31, 2013, which amount is equal to the fees waived by RMR and excluded from the amounts that were payable to RMR during 2013.
For January 2013, with respect to our investments in Australia, RMR agreed to waive half of the fees payable by us under our property management agreement and half of the business management fees related to real estate investments located outside of the United States, Puerto Rico and Canada, so long as our business and property management agreement with MacarthurCook, with respect to those investments, was in effect and we or any of our subsidiaries were paying fees under that agreement. MacarthurCook earned $0.2 million in January 2013, with respect to our Australian properties, which amounts are equal to the fees waived by RMR and excluded from the amounts that were payable to RMR during those periods.
RMR also provided internal audit services to us in return for our share of the total internal audit costs incurred by RMR for us and other publicly owned companies managed by RMR and its affiliates, which amounts were subject to approval by our former Compensation Committee. Our former Audit Committee appointed our Director of Internal Audit. Our and SIR's (while SIR was a consolidated subsidiary of ours) share of RMR's costs of providing this internal audit function was, on a consolidated basis, approximately $0.3 million for 2013, which amounts are included in general and administrative expenses in our consolidated financial statements. These allocated costs are in addition to the business and property management fees we and SIR paid to RMR.
RMR also leased from us office space for eleven of its regional offices. We earned approximately $0.4 million for the six months ended June 30, 2014 and $0.8 million in rental income from RMR in 2013, with respect to approximately 36,500 square feet of office space, which we believe was commercially reasonable rent for this office space, not all of which was leased to RMR for the entire three-year period. These leases were terminated when our management agreements with RMR terminated.
Under our share award plans, we granted restricted shares to certain employees of RMR, some of whom are our former officers. We granted a total of 73,450 restricted shares with an aggregate value of $1.7 million to such persons in 2013, based
F-43
on upon the closing price of our common shares on the NYSE on the dates of grants. One fifth of those restricted shares vested on the grant dates and one fifth vests on each of the next four anniversaries of the grant dates. These share grants to RMR employees were in addition to the fees we pay to RMR. On occasion, we have entered into arrangements with former employees of RMR in connection with the termination of their employment with RMR, providing for the acceleration of vesting of restricted shares previously granted to them under our share award plan. Additionally, each of our former President, former Treasurer and former Chief Financial Officer and former Senior Vice President and former Chief Operating Officer received grants of restricted shares of other companies to which RMR provides management services in their capacities as officers of RMR. As a result of the removal of our former Trustees on March 25, 2014, the vesting of common shares previously issued to our former officers and certain employees of RMR pursuant to our equity compensation plans accelerated in accordance with the terms of their governing share grants (Note 14).
Termination and Cooperation Agreement: On September 30, 2014, we entered into a termination and cooperation agreement (Cooperation Agreement) with RMR and RMR Australia (together, Manager). Under the terms of the agreement, the existing business and property management agreements with RMR terminated effective September 30, 2014.
Pursuant to the Cooperation Agreement, through February 28, 2015, Manager agreed to use best efforts to assist us in the transition of our management and operations. We paid Manager $1.2 million per month for transition services from October 1, 2014 to February 28, 2015, which included continued management and other services for the Australian assets pursuant to the Australian Management Agreement. Beginning March 1, 2015, we agreed to pay Manager $0.1 million per month until we no longer required such services or until the Australia Management Agreement was terminated, which was terminated in the third quarter of 2015, effective October 31, 2015. There is no future obligation to pay any fees to Manager.
RMR is responsible for any severance payments to its employees. We paid accrued vacation benefits for any of Manager’s employees that were terminated as a result of the transition and we paid Manager the $15.3 million pro-rata portion of the current year’s incentive fee under the existing business management agreement for the period from January 1, 2014 to September 30, 2014. This incentive fee relates to the business management agreement entered into prior to the election of our new Board of Trustees on May 23, 2014. There is no future obligation to pay an incentive fee to RMR.
GOV: GOV was formerly our 100% owned subsidiary. In 2009, GOV completed an initial public offering pursuant to which GOV ceased to be a majority owned subsidiary of ours. To facilitate this offering, we and GOV entered into a transaction agreement that governs our separation from and relationship with GOV. Pursuant to this transaction agreement and subject to certain conditions, among other things, we granted GOV the right of first purchase to acquire any property owned by us that we determine to divest (including sale, mortgage or other financing), if the property is then, or is reasonably expected within twelve (12) months to be, majority leased to a government tenant, which right of first purchase will also apply in the event of an indirect sale of any such properties as a result of a change of control of us. On July 23, 2014, we and GOV entered into a letter agreement whereby GOV irrevocably waived and released us from the right of first purchase described above. Additionally, pursuant to the letter agreement we and GOV each agreed to waive certain consent rights over the other party’s investments in certain categories of properties.
During the time we were externally managed by RMR, RMR provided management services to both us and GOV, two of our former Trustees and our former President were managing trustees of GOV and GOV’s executive officers were officers of RMR. On March 15, 2013, we sold all of our 9,950,000 common shares of GOV in a public offering for net proceeds (after deducting underwriters' discounts and commissions and expenses) of $239.6 million and we realized a gain of $66.3 million. In connection with this public offering, on March 11, 2013, we entered into a registration agreement with GOV under which we agreed to pay all expenses incurred by GOV relating to the registration and sale of our GOV common shares. We incurred and paid $0.3 million of reimbursements to GOV pursuant to this agreement during 2013. In addition, under the registration agreement, GOV agreed to indemnify us and our officers, Trustees and controlling persons, and we agreed to indemnify GOV and its officers, trustees and controlling persons, against certain liabilities related to the public offering, including liabilities under the Securities Act of 1933, as amended, (Securities Act).
SIR: SIR was formerly our 100% owned subsidiary. In March 2012, SIR completed an initial public offering, or the SIR IPO. As of June 30, 2014, we owned 22,000,000 common shares of SIR, which represented approximately 36.7% of SIR’s outstanding common shares. Two of our former Trustees and our former President were managing trustees of SIR and our former Treasurer and Chief Financial Officer served as the treasurer and chief financial officer of SIR and SIR’s executive officers were officers of RMR. In addition, one of our former independent Trustees was an independent trustee of SIR.
F-44
In March 2012, SIR completed an initial public offering pursuant to which it issued 9,200,000 of its common shares for net proceeds (after deducting underwriters' discounts and commissions and expenses) of $180.8 million. SIR applied those net proceeds, along with proceeds from drawings under SIR's revolving credit facility, to repay in full a $400.0 million demand promissory note that we received from SIR on February 16, 2012, along with 22,000,000 SIR common shares (including SIR common shares that had been previously issued to us in connection with SIR's formation), in exchange for our transfer to SIR of 79 properties (251 separate buildings or land parcels with a combined approximately 21,400,000 rentable square feet). SIR also reimbursed us for costs that we incurred in connection with SIR's organization and preparation for the SIR IPO.
In March 2013, we entered into a registration agreement with SIR, pursuant to which SIR agreed to, among other things, file a registration statement with respect to an offering of up to all of the 22,000,000 common shares of SIR that we owned, and SIR filed a registration statement on Form S-3 to permit the resale by us of some or all of the common shares of SIR we owned. Under the registration agreement, we agreed to pay all expenses incurred by SIR relating to the registration and sale of the shares in an offering. We incurred and paid $0.6 million of reimbursements to SIR pursuant to this agreement. By letter dated March 31, 2014, SIR notified us that, effective that same day, SIR had elected to terminate the registration agreement with us as a result of the removal of all the former Trustees effective March 25, 2014, which constituted a change of control of us as provided in that agreement. The letter also noted that SIR would welcome the opportunity to meet with our new Board of Trustees to discuss mutually beneficial arrangements regarding the registration of the shares of SIR owned by EQC. On July 9, 2014, we sold our entire stake of 22,000,000 common shares of SIR, for $32.04 per share, raising aggregate gross proceeds of $704.8 million. As a result of this sale, we no longer hold any interest in SIR.
AIC: We previously owned 12.5% of AIC, an Indiana insurance company, and, as of May 9, 2014, had invested $5.2 million in AIC since we became an equity owner of AIC in 2009. RMR, GOV, SIR and four other companies to which RMR provides management services also own shares of AIC. During the time we were externally managed by RMR, RMR provided management and administrative services to AIC pursuant to a management and administrative services agreement with AIC and a majority of the former Trustees, our former President and most of the trustees and directors of the other AIC shareholders served on the board of directors of AIC. On March 25, 2014, as a result of the removal of the former Trustees, we underwent a change in control, as defined in the shareholders’ agreement among us, the other shareholders of AIC and AIC. As a result of that change in control and in accordance with the terms of the shareholders agreement, the other shareholders of AIC, on May 9, 2014, exercised their right to purchase the 20,000 shares of AIC we then owned. We received $5.8 million in aggregate proceeds from this sale and we no longer own any interest in AIC.
We previously purchased property insurance providing $500.0 million of coverage pursuant to an insurance program arranged by AIC and with respect to which AIC was a reinsurer of certain coverage amounts. This program expired in June 2014. We paid AIC a premium, including taxes and fees, of approximately $6.0 million in connection with that policy.
Indemnification: Pursuant to our declaration of trust and separate indemnification agreements, we have advanced amounts incurred for legal fees and costs on behalf of certain of the former Trustees and officers with respect to the legal proceedings described in Part I, Item 3, “Legal Proceedings” in this Annual Report on Form 10-K. Pursuant to indemnification provisions in our business and property management agreements with RMR, we have also incurred legal fees and costs on behalf of RMR for claims brought against RMR in its capacity as our business and property manager with respect to certain legal proceedings described in Part I, Item 3, “Legal Proceedings” in this Annual Report on Form 10-K. For the six months ended June 30, 2014, we incurred approximately $5.4 million in such legal fees and costs, and for the year ended December 31, 2013, we incurred approximately $30.4 million in such legal fees and costs, including our costs.
Settlement of Certain Tenant Litigation: On March 1, 2014, pursuant to mediation, we and an affiliate of RMR agreed to terms of a settlement of a long running litigation with an unrelated third party that was a tenant, or the Tenant, of two separate properties: one property owned by us and one property owned by the RMR affiliate. This litigation arose as a result of flooding in 1999 and 2001 at both of these properties. After the flooding, the Tenant filed a complaint seeking declaratory and injunctive relief providing that Tenant was no longer obligated to pay rent at the two properties in question and brought claims against EQC and the RMR affiliate, as landlords, for, among other things, breach of the covenants of quiet enjoyment and habitability. We and RMR counterclaimed, seeking damages based in part upon Tenant’s failure to pay rent and make repairs. The settlement agreement regarding this litigation provides for a payment by Tenant of $12.0 million to EQC and the RMR affiliate, payable in three installments ($6.0 million on June 30, 2014 and $3.0 million on each of September 30, 2014 and December 31, 2014), split pro-rata between EQC and the RMR affiliate based upon the balance of the rent due under each lease. The total rent due
F-45
under the EQC lease was approximately $9.2 million; the total rent due under the lease with the RMR affiliate was approximately $1.1 million. This settlement was approved by the court on May 6, 2014.
Note 20. Selected Quarterly Financial Data (Unaudited)
The following is a summary of our unaudited quarterly results of operations for 2015 and 2014 (dollars in thousands):
2015 | |||||||||||||||
First Quarter | Second Quarter | Third Quarter | Fourth Quarter | ||||||||||||
Total revenues | $ | 213,055 | $ | 203,694 | $ | 159,208 | $ | 138,934 | |||||||
Net income attributable to Equity Commonwealth common shareholders | 6,649 | 5,635 | 23,485 | 36,164 | |||||||||||
Net income attributable to Equity Commonwealth common shareholders per share—basic | 0.05 | 0.04 | 0.18 | 0.29 | |||||||||||
Net income attributable to Equity Commonwealth common shareholders per share—diluted | 0.05 | 0.04 | 0.18 | 0.28 | |||||||||||
The decrease in the third and fourth quarter 2015 total revenues and net income attributable to Equity Commonwealth common shareholders was primarily attributable to properties sold in the second, third and fourth quarters of 2015.
2014 | |||||||||||||||
First Quarter | Second Quarter | Third Quarter | Fourth Quarter | ||||||||||||
Total revenues | $ | 217,260 | $ | 215,194 | $ | 216,595 | $ | 212,808 | |||||||
Net income (loss) attributable to Equity Commonwealth common shareholders | 9,297 | (17,802 | ) | 149,759 | (165,542 | ) | |||||||||
Net income (loss) attributable to Equity Commonwealth common shareholders per share—basic | 0.08 | (0.14 | ) | 1.16 | (1.28 | ) | |||||||||
Net income (loss) attributable to Equity Commonwealth common shareholders per share—diluted | 0.08 | (0.14 | ) | 1.16 | (1.28 | ) | |||||||||
Common distributions declared | 0.25 | — | — | — | |||||||||||
The decrease in the second quarter 2014 net loss attributable to Equity Commonwealth common shareholders was primarily attributable to a loss on asset impairment of $22.7 million. The increase in third quarter 2014 net income attributable to Equity Commonwealth common shareholders was largely attributable to the gain on equity investment in SIR of $171.8 million. The decrease in the fourth quarter 2014 net loss attributable to Equity Commonwealth common shareholders was impacted by a loss on asset impairment of $167.1 million.
Note 21. Subsequent Events
On February 16, 2016, we redeemed at par $139.1 million of our 6.25% senior unsecured notes due 2016.
On February 16, 2016, we sold Executive Park (9 buildings), with 427,443 square feet for $50.9 million.
From January 1, 2016 through February 16, 2016, share buyback activity has totaled 861,162 common shares at a weighted average price of $25.94 per share.
F-46
EQUITY COMMONWEALTH
SCHEDULE II
VALUATION AND QUALIFYING ACCOUNTS
December 31, 2015
(dollars in thousands)
Description | Balance at Beginning of Period | Charged to Costs and Expenses | Deductions | Balance at End of Period | ||||||||||||
Year Ended December 31, 2013: | ||||||||||||||||
Allowance for doubtful accounts | $ | 9,962 | $ | 818 | $ | (2,895 | ) | $ | 7,885 | |||||||
Year Ended December 31, 2014: | ||||||||||||||||
Allowance for doubtful accounts | $ | 7,885 | $ | 2,196 | $ | (3,516 | ) | $ | 6,565 | |||||||
Year Ended December 31, 2015: | ||||||||||||||||
Allowance for doubtful accounts | $ | 6,565 | $ | 4,533 | $ | (3,383 | ) | $ | 7,715 | |||||||
S-1
EQUITY COMMONWEALTH
SCHEDULE III
REAL ESTATE AND ACCUMULATED DEPRECIATION
December 31, 2015
(dollars in thousands)
Initial Cost to Company | Cost Amount Carried at Close of Period | |||||||||||||||||||||||||||||||||||||||||||
Property | City | State | Encumbrances(1) | Land | Buildings and Improvements | Costs Capitalized Subsequent to Acquisition, Net | Impairment/Write Downs | Land | Buildings and Improvements | Total(2) | Accumulated Depreciation(3) | Date Acquired | Original Construction Date | |||||||||||||||||||||||||||||||
785 Schilinger Road South | Mobile | AL | — | 1,540 | 9,732 | (3 | ) | — | 1,540 | 9,729 | 11,269 | 1,990 | 10/22/2007 | 1998 | ||||||||||||||||||||||||||||||
Parkshore Plaza | Folsom | CA | 41,275 | 4,370 | 41,749 | 3,063 | (3 | ) | 4,370 | 44,809 | 49,179 | 5,086 | 6/16/2011 | 1999 | ||||||||||||||||||||||||||||||
Leased Land | Gonzalez | CA | — | 18,941 | 9,060 | 3,967 | — | 18,940 | 13,028 | 31,968 | 2,862 | 8/31/2010 | - | |||||||||||||||||||||||||||||||
Sky Park Centre | San Diego | CA | — | 936 | 8,094 | 756 | — | 936 | 8,850 | 9,786 | 3,308 | 6/24/2002 | 1986 | |||||||||||||||||||||||||||||||
9110 East Nichols Avenue | Centennial | CO | — | 1,708 | 14,616 | 4,002 | — | 1,708 | 18,618 | 20,326 | 6,438 | 11/2/2001 | 1984 | |||||||||||||||||||||||||||||||
1225 Seventeenth Street | Denver | CO | — | 22,400 | 110,090 | 17,269 | — | 22,400 | 127,359 | 149,759 | 21,595 | 6/24/2009 | 1982 | |||||||||||||||||||||||||||||||
5073, 5075, & 5085 S. Syracuse Street | Denver | CO | — | 4,720 | 58,890 | — | — | 4,720 | 58,890 | 63,610 | 8,343 | 4/16/2010 | 2007 | |||||||||||||||||||||||||||||||
1601 Dry Creek Drive | Longmont | CO | — | 3,714 | 24,397 | 5,535 | — | 3,715 | 29,931 | 33,646 | 9,165 | 10/26/2004 | 1982 | |||||||||||||||||||||||||||||||
97 Newberry Road | East Windsor | CT | 6,375 | 2,960 | 12,360 | 30 | — | 2,943 | 12,407 | 15,350 | 2,865 | 10/24/2006 | 1989 | |||||||||||||||||||||||||||||||
33 Stiles Lane | North Haven | CT | 2,785 | 2,090 | 9,141 | 216 | (1,654 | ) | 1,799 | 7,994 | 9,793 | 2,161 | 10/24/2006 | 1970 | ||||||||||||||||||||||||||||||
1250 H Street, NW | Washington | DC | — | 5,975 | 53,778 | 10,947 | (2 | ) | 5,975 | 64,723 | 70,698 | 26,030 | 6/23/1998 | 1992 | ||||||||||||||||||||||||||||||
Georgetown-Green and Harris Buildings | Washington | DC | — | 24,000 | 35,979 | 44 | — | 24,000 | 36,023 | 60,023 | 5,700 | 9/3/2009 | 1960;1975 | |||||||||||||||||||||||||||||||
802 Delaware Avenue | Wilmington | DE | — | 4,409 | 39,681 | 10,533 | (11,156 | ) | 3,390 | 40,077 | 43,467 | 23,091 | 7/23/1998 | 1986 | ||||||||||||||||||||||||||||||
6600 North Military Trail | Boca Raton | FL | — | 15,900 | 129,790 | 123 | — | 15,900 | 129,913 | 145,813 | 16,224 | 1/11/2011 | 2008 | |||||||||||||||||||||||||||||||
Executive Park | Atlanta | GA | — | 13,729 | 78,032 | 6,776 | (54,313 | ) | 10,954 | 33,270 | 44,224 | 14,859 | 7/16/2004; 7/26/2007 | 1972 | ||||||||||||||||||||||||||||||
633 Ahua Street | Honolulu | HI | — | 1,256 | 3 | 18,054 | (2,912 | ) | 1,100 | 15,301 | 16,401 | 3,765 | 12/5/2003 | 2006 | ||||||||||||||||||||||||||||||
625 Crane Street | Aurora | IL | — | 1,180 | 3,411 | (2 | ) | (2,978 | ) | 533 | 1,078 | 1,611 | 87 | 4/2/2007 | 1977 | |||||||||||||||||||||||||||||
1200 Lakeside Drive | Bannockburn | IL | — | 5,846 | 48,568 | 14,768 | (7,610 | ) | 5,858 | 55,714 | 61,572 | 12,601 | 12/29/2005 | 1999 | ||||||||||||||||||||||||||||||
600 West Chicago Avenue | Chicago | IL | — | 34,980 | 315,643 | 12,058 | — | 34,980 | 327,701 | 362,681 | 35,679 | 8/10/2011 | 1908 | |||||||||||||||||||||||||||||||
8750 Bryn Mawr Avenue | Chicago | IL | — | 6,600 | 77,764 | 7,400 | (170 | ) | 6,600 | 84,994 | 91,594 | 11,705 | 10/28/2010 | 1985 | ||||||||||||||||||||||||||||||
101-115 W. Washington Street | Indianapolis | IN | — | 7,495 | 60,465 | 23,210 | — | 7,496 | 83,674 | 91,170 | 23,976 | 5/10/2005 | 1977 | |||||||||||||||||||||||||||||||
111 Monument Circle | Indianapolis | IN | — | 9,670 | 158,085 | 8,556 | — | 9,670 | 166,641 | 176,311 | 13,115 | 10/22/2012 | 1959;1990 | |||||||||||||||||||||||||||||||
109 Brookline Avenue | Boston | MA | — | 3,168 | 30,397 | 12,684 | — | 3,168 | 43,081 | 46,249 | 18,718 | 9/28/1995 | 1915 | |||||||||||||||||||||||||||||||
Cabot Business Park Land | Mansfield | MA | — | 1,033 | — | — | — | 1,033 | — | 1,033 | — | 8/1/2003 | - | |||||||||||||||||||||||||||||||
111 Market Place | Baltimore | MD | — | 6,328 | 54,645 | 16,152 | — | 6,328 | 70,797 | 77,125 | 24,753 | 1/28/2003 | 1990 | |||||||||||||||||||||||||||||||
25 S. Charles Street | Baltimore | MD | — | 2,830 | 22,996 | 12,678 | — | 2,830 | 35,674 | 38,504 | 12,479 | 7/16/2004 | 1972 | |||||||||||||||||||||||||||||||
820 W. Diamond | Gaithersburg | MD | — | 4,381 | 18,798 | 10,538 | (35 | ) | 4,461 | 29,221 | 33,682 | 11,487 | 3/31/1997 | 1995 | ||||||||||||||||||||||||||||||
Danac Stiles Business Park | Rockville | MD | — | 7,638 | 62,572 | 6,329 | (10,975 | ) | 6,595 | 58,969 | 65,564 | 18,984 | 7/20/2004 | 2002 | ||||||||||||||||||||||||||||||
S-2
EQUITY COMMONWEALTH
SCHEDULE III
REAL ESTATE AND ACCUMULATED DEPRECIATION
December 31, 2015
(dollars in thousands)
Initial Cost to Company | Cost Amount Carried at Close of Period | |||||||||||||||||||||||||||||||||||||||||||
Property | City | State | Encumbrances(1) | Land | Buildings and Improvements | Costs Capitalized Subsequent to Acquisition, Net | Impairment/Write Downs | Land | Buildings and Improvements | Total(2) | Accumulated Depreciation(3) | Date Acquired | Original Construction Date | |||||||||||||||||||||||||||||||
East Eisenhower Parkway | Ann Arbor | MI | — | 6,760 | 46,988 | 1,513 | — | 6,760 | 48,501 | 55,261 | 6,836 | 6/15/2010 | 1975;2006 | |||||||||||||||||||||||||||||||
2250 Pilot Knob Road | Mendota Heights | MN | — | 533 | 4,795 | 1,202 | — | 533 | 5,997 | 6,530 | 2,643 | 3/19/1998 | 1995 | |||||||||||||||||||||||||||||||
411 Farwell Avenue | South St. Paul | MN | — | 1,303 | 10,451 | 4,603 | — | 1,304 | 15,053 | 16,357 | 3,526 | 6/2/2004 | 1970 | |||||||||||||||||||||||||||||||
6200 Glenn Carlson Drive | St. Cloud | MN | — | 1,950 | 13,803 | — | — | 1,950 | 13,803 | 15,753 | 2,156 | 10/15/2009 | 1999 | |||||||||||||||||||||||||||||||
4700 Belleview Avenue | Kansas City | MO | — | 1,165 | 3,097 | 2,895 | — | 1,165 | 5,992 | 7,157 | 1,029 | 7/17/2008 | 1986 | |||||||||||||||||||||||||||||||
111 River Street (4) | Hoboken | NJ | — | — | 134,199 | 1,871 | — | — | 136,070 | 136,070 | 21,630 | 8/11/2009 | 2002 | |||||||||||||||||||||||||||||||
North Point Office Complex | Cleveland | OH | — | 12,000 | 94,448 | 18,136 | — | 12,000 | 112,584 | 124,584 | 22,363 | 2/12/2008 | 1985;1989;1990 | |||||||||||||||||||||||||||||||
Raintree Industrial Park | Solon | OH | — | 1,808 | 16,620 | 2,270 | (8,387 | ) | 1,339 | 10,972 | 12,311 | 858 | 7/16/2004 | 1975 | ||||||||||||||||||||||||||||||
401 Vine Street | Delmont | PA | — | 1,575 | 5,542 | — | — | 1,575 | 5,542 | 7,117 | 1,130 | 10/22/2007 | 1999 | |||||||||||||||||||||||||||||||
Cherrington Corporate Center | Moon Township | PA | — | 11,369 | 39,892 | 28,367 | (5,454 | ) | 11,164 | 63,010 | 74,174 | 21,480 | 9/14/1998; 8/23/1999 | 1987;1988; 1989;1990; 1991;1992; 1994 | ||||||||||||||||||||||||||||||
1500 Market Street | Philadelphia | PA | — | 18,758 | 167,487 | 104,542 | (388 | ) | 18,758 | 271,641 | 290,399 | 78,551 | 10/10/2002 | 1974 | ||||||||||||||||||||||||||||||
1525 Locust Street | Philadelphia | PA | — | 931 | 8,377 | 1,902 | — | 930 | 10,280 | 11,210 | 4,122 | 6/11/1999 | 1987 | |||||||||||||||||||||||||||||||
1600 Market Street | Philadelphia | PA | — | 3,462 | 111,946 | 18,259 | — | 3,462 | 130,205 | 133,667 | 55,534 | 3/30/1998 | 1983 | |||||||||||||||||||||||||||||||
1735 Market Street | Philadelphia | PA | 169,612 | 24,753 | 222,775 | 52,107 | — | 24,747 | 274,888 | 299,635 | 121,238 | 6/30/1998 | 1990 | |||||||||||||||||||||||||||||||
Foster Plaza | Pittsburgh | PA | — | 6,168 | 51,588 | 17,969 | — | 6,171 | 69,554 | 75,725 | 19,771 | 9/16/2005 | 1987;1990; 1994; 1995; 1996 | |||||||||||||||||||||||||||||||
128 Crews Drive | Columbia | SC | — | 2,420 | 4,017 | 1,322 | (4,012 | ) | 1,024 | 2,723 | 3,747 | 489 | 4/2/2007 | 1968 | ||||||||||||||||||||||||||||||
111 Southchase Boulevard | Fountain Inn | SC | — | 520 | 6,822 | 1,734 | (2,912 | ) | 390 | 5,774 | 6,164 | 1,531 | 5/23/2007 | 1987 | ||||||||||||||||||||||||||||||
1043 Global Avenue | Graniteville | SC | — | 720 | 15,552 | 603 | — | 720 | 16,155 | 16,875 | 3,537 | 4/2/2007 | 1998 | |||||||||||||||||||||||||||||||
633 Frazier Drive | Franklin | TN | — | 5,800 | 13,190 | (10 | ) | — | 5,800 | 13,180 | 18,980 | 2,711 | 10/22/2007 | 1999 | ||||||||||||||||||||||||||||||
1601 Rio Grande Street | Austin | TX | — | 688 | 6,192 | 1,539 | (23 | ) | 697 | 7,699 | 8,396 | 3,106 | 6/3/1999 | 1985 | ||||||||||||||||||||||||||||||
206 East 9th Street | Austin | TX | 27,515 | 7,900 | 38,533 | 2,166 | — | 7,900 | 40,699 | 48,599 | 3,702 | 5/31/2012 | 1984 | |||||||||||||||||||||||||||||||
4515 Seton Center Parkway | Austin | TX | — | 2,038 | 18,338 | 2,731 | — | 2,037 | 21,070 | 23,107 | 9,110 | 10/8/1999 | 1997 | |||||||||||||||||||||||||||||||
4516 Seton Center Parkway | Austin | TX | — | 2,028 | 18,251 | 3,022 | — | 2,027 | 21,274 | 23,301 | 9,681 | 10/8/1999 | 1985 | |||||||||||||||||||||||||||||||
7800 Shoal Creek Boulevard | Austin | TX | — | 1,731 | 14,921 | 4,614 | (14 | ) | 1,731 | 19,521 | 21,252 | 7,672 | 6/30/1999 | 1974 | ||||||||||||||||||||||||||||||
812 San Antonio Street | Austin | TX | — | 626 | 5,636 | 2,564 | — | 621 | 8,205 | 8,826 | 3,115 | 8/18/1999 | 1987 | |||||||||||||||||||||||||||||||
8701 N Mopac | Austin | TX | — | 1,574 | 14,168 | 2,677 | — | 1,573 | 16,846 | 18,419 | 6,751 | 8/3/1999 | 1982 | |||||||||||||||||||||||||||||||
Bridgepoint Parkway | Austin | TX | — | 7,784 | 70,526 | 10,214 | (97 | ) | 7,785 | 80,642 | 88,427 | 37,559 | 12/5/1997 | 1986;1996;1997 | ||||||||||||||||||||||||||||||
S-3
EQUITY COMMONWEALTH
SCHEDULE III
REAL ESTATE AND ACCUMULATED DEPRECIATION
December 31, 2015
(dollars in thousands)
Initial Cost to Company | Cost Amount Carried at Close of Period | |||||||||||||||||||||||||||||||||||||||||||
Property | City | State | Encumbrances(1) | Land | Buildings and Improvements | Costs Capitalized Subsequent to Acquisition, Net | Impairment/Write Downs | Land | Buildings and Improvements | Total(2) | Accumulated Depreciation(3) | Date Acquired | Original Construction Date | |||||||||||||||||||||||||||||||
Lakewood on the Park | Austin | TX | — | 3,548 | 31,936 | 1,704 | (77 | ) | 3,548 | 33,563 | 37,111 | 14,554 | 10/20/1998 | 1998 | ||||||||||||||||||||||||||||||
Research Park | Austin | TX | — | 15,859 | 60,175 | 14,601 | — | 18,411 | 72,224 | 90,635 | 29,564 | 10/7/1998 | 1968;1998; 2001 | |||||||||||||||||||||||||||||||
9840 Gateway Boulevard North | El Paso | TX | — | 1,700 | 9,736 | (4 | ) | — | 1,700 | 9,732 | 11,432 | 1,996 | 10/22/2007 | 1999 | ||||||||||||||||||||||||||||||
3003 South Expressway 281 | Hidalgo | TX | — | 1,480 | 15,533 | (9 | ) | — | 1,480 | 15,524 | 17,004 | 3,193 | 10/22/2007 | 1999 | ||||||||||||||||||||||||||||||
3330 N Washington Boulevard | Arlington | VA | — | 810 | 7,289 | 724 | — | 811 | 8,012 | 8,823 | 3,304 | 8/26/1998 | 1987 | |||||||||||||||||||||||||||||||
333 108th Avenue NE | Bellevue | WA | — | 14,400 | 136,412 | 1,745 | — | 14,400 | 138,157 | 152,557 | 22,060 | 11/12/2009 | 2008 | |||||||||||||||||||||||||||||||
600 108th Avenue NE | Bellevue | WA | — | 3,555 | 30,244 | 14,252 | — | 3,555 | 44,496 | 48,051 | 11,904 | 7/16/2004 | 1980 | |||||||||||||||||||||||||||||||
1331 North Center Parkway | Kennewick | WA | — | 1,850 | 7,339 | (2 | ) | — | 1,850 | 7,337 | 9,187 | 1,506 | 10/22/2007 | 1999 | ||||||||||||||||||||||||||||||
100 East Wisconsin Avenue | Milwaukee | WI | — | 3,150 | 72,113 | 7,733 | — | 3,150 | 79,846 | 82,996 | 11,433 | 8/11/2010 | 1989 | |||||||||||||||||||||||||||||||
111 East Kilbourn Avenue | Milwaukee | WI | — | 2,400 | 47,562 | 5,143 | — | 2,400 | 52,705 | 55,105 | 10,528 | 6/12/2008 | 1988 | |||||||||||||||||||||||||||||||
$ | 247,562 | $ | 394,913 | $ | 3,065,229 | $ | 540,382 | $ | (113,172 | ) | $ | 389,410 | $ | 3,497,942 | $ | 3,887,352 | $ | 898,939 | ||||||||||||||||||||||||||
S-4
EQUITY COMMONWEALTH
SCHEDULE III
REAL ESTATE AND ACCUMULATED DEPRECIATION
December 31, 2015
(dollars in thousands)
Analysis of the carrying amount of real estate properties and accumulated depreciation:
Real Estate Properties | Accumulated Depreciation | ||||||
Balance at January 1, 2013 | $ | 7,829,409 | $ | 1,007,606 | |||
Additions(5) | 231,485 | 176,777 | |||||
Loss on asset impairment | (384,141 | ) | (185,795 | ) | |||
Deconsolidation of SIR | (1,446,781 | ) | (56,023 | ) | |||
Properties reclassified to discontinued operations | (552,024 | ) | (15,471 | ) | |||
Disposals | (140,783 | ) | (32,035 | ) | |||
Balance at December 31, 2013 | 5,537,165 | 895,059 | |||||
Additions(5) | 70,963 | 164,815 | |||||
Loss on asset impairment | (191,490 | ) | (6,423 | ) | |||
Properties reclassified to continuing operations | 341,024 | 5,724 | |||||
Disposals | (29,219 | ) | (28,730 | ) | |||
Balance at December 31, 2014 | 5,728,443 | 1,030,445 | |||||
Additions(5) | 68,118 | 144,844 | |||||
Loss on asset impairment | (17,162 | ) | — | ||||
Disposals | (1,892,047 | ) | (276,350 | ) | |||
Balance at December 31, 2015 | $ | 3,887,352 | $ | 898,939 | |||
(1) | Excludes net unamortized premiums and discounts. |
(2) | Excludes value of real estate intangibles. Aggregate cost for federal income tax purposes is approximately $4,160,805. |
(3) | Depreciation is calculated using the straight line method over estimated useful lives of up to 40 years for buildings and improvements and up to 12 years for personal property. |
(4) | Property is subject to a ground lease. |
(5) | Includes adjustments to real estate properties additions of $(13,217), $(20,445) and $(40,020), and adjustments to accumulated depreciation additions of $(887), $(1,279) and $(1,528), related to changes in foreign currency exchange rates during 2015, 2014 and 2013, respectively. |
S-5
EQUITY COMMONWEALTH
SCHEDULE IV
MORTGAGE LOANS ON REAL ESTATE
December 31, 2015
(dollars in thousands)
Location | Interest Rate | Final Maturity Date | Periodic Payment Terms | Face Amount of Mortgage(1) | Carrying Amount of Mortgage | Principal Amount of Loans Subject to Delinquent Principal or Interest | ||||||||||||
Salina, NY | 6.00% | 4/30/2019 | Interest payable monthly in arrears. $419 due at maturity. | $ | 419 | 399 | $ | — | ||||||||||
Dearborn, MI | 6.00% | 1/24/2023 | Interest payable monthly in arrears. $7,688 due at maturity. | 7,688 | 7,688 | — | ||||||||||||
$ | 8,107 | $ | 8,087 | $ | — | |||||||||||||
Reconciliation of the carrying amount of mortgage loans at the beginning of the period: | ||||||||||||||||||
Balance at January 1, 2013 | $ | 1,419 | ||||||||||||||||
New mortgage loans | 7,688 | |||||||||||||||||
Collections of principal | (1,000 | ) | ||||||||||||||||
Balance at December 31, 2013 | $ | 8,107 | ||||||||||||||||
Balance at December 31, 2014 | $ | 8,107 | ||||||||||||||||
Balance at December 31, 2015 | $ | 8,107 | ||||||||||||||||
(1) | Also represents cost for federal income tax purposes. |
S-6
SIGNATURES
Pursuant to the requirements of Section 13 and 15(d) of the Securities Exchange Act of 1934, the registrant has duly caused this report to be signed on its behalf by the undersigned, thereunto duly authorized.
EQUITY COMMONWEALTH | ||
By: | /s/ David A. Helfand | |
David A. Helfand | ||
President and Chief Executive Officer | ||
Dated: February 18, 2016 | ||
Pursuant to the requirements of the Securities Exchange Act of 1934, this report has been signed below by the following persons on behalf of the registrant, in the capacities and on the dates indicated.
Signature | Title | Date | |||
/s/ David A. Helfand | President and Chief Executive Officer (principal executive officer), Trustee | February 18, 2016 | |||
David A. Helfand | |||||
/s/ Adam S. Markman | Executive Vice President, Chief Financial Officer and Treasurer (principal financial officer) | February 18, 2016 | |||
Adam S. Markman | |||||
/s/ Sam Zell | Chairman of the Board of Trustees | February 18, 2016 | |||
Sam Zell | |||||
/s/ James S. Corl | Trustee | February 18, 2016 | |||
James S. Corl | |||||
/s/ Martin L. Edelman | Trustee | February 18, 2016 | |||
Martin L. Edelman | |||||
/s/ Edward A. Glickman | Trustee | February 18, 2016 | |||
Edward A. Glickman | |||||
/s/ Peter Linneman | Trustee | February 18, 2016 | |||
Peter Linneman | |||||
/s/ James L. Lozier, Jr. | Trustee | February 18, 2016 | |||
James L. Lozier, Jr. | |||||
/s/ Mary Jane Robertson | Trustee | February 18, 2016 | |||
Mary Jane Robertson | |||||
/s/ Kenneth Shea | Trustee | February 18, 2016 | |||
Kenneth Shea | |||||
/s/ Gerald A. Spector | Trustee | February 18, 2016 | |||
Gerald A. Spector | |||||
/s/ James A. Star | Trustee | February 18, 2016 | |||
James A. Star | |||||